
Submitted:
18 March 2025
Posted:
18 March 2025
You are already at the latest version
Preprints on COVID-19 and SARS-CoV-2
Abstract
Coronavirus disease 2019 (COVID-19) was first described in Wuhan, China, in late 2019 and declared a pandemic by the World Health Organization (WHO) in March 2020. The present study aimed to characterize the clinical and chest computed tomography (CT) findings in a sample of patients with COVID-19 and to correlate them with the outcome of death. The specific objectives were to characterize the sample epidemiologically and to describe the tomographic patterns found. This retrospective, observational, and cross-sectional study analyzed associations between chest CT findings and outcomes in COVID-19 patients from a university hospital in southeastern Brazil, from April 2020 to June 2021. The most frequent symptoms included cough, dyspnea, fever, myalgia, chest pain, anosmia, and odynophagia. Common CT findings, in descending order, were ground-glass opacities, consolidations, mosaic paving, parenchymal bands, peribronchovascular consolidations, bronchial ectasia, subpleural lines, nodules with ground-glass halos, architectural distortion, and ground-glass bands. Patients with age ≥60 years and comorbidities were significant risk factors for mortality. Patients with >50% parenchymal involvement and indeterminate/atypical CT patterns also had a higher risk of death. While serological tests remain critical for diagnosis, this study highlights the importance of imaging in guiding treatment protocols, especially given the delays in test results.
Keywords:
coronavirus
; post-acute COVID-19 syndrome
; tomography
1. Introduction
Coronavirus disease 2019 (COVID-19) is a highly contagious disease that became known in early December 2019, with the pandemic originating in China. The World Health Organization (WHO) initially named the virus 2019-nCoV, but later renamed it SARS-CoV-2 (Severe Acute Respiratory Syndrome Coronavirus) [1]. The coronavirus belongs to the order Nidovirales. This virus has a genetic code consisting of single-stranded RNA and a large genome. It is glycoprotein-enveloped and infects a wide variety of host species, including humans [2]. SARS-CoV-2 is a ribonucleic acid (RNA) virus, whose genetic material consists of a single positive-sense RNA molecule (RNA+). Its entire genome contains fewer than 30,000 nucleotides, each of which consists of a sugar molecule (ribose), a phosphoric acid, and a nitrogenous base. Nearly 29 different viral proteins have been identified, including the spike glycoprotein (S protein) and the nucleocapsid protein (N protein) [3]. The spike glycoprotein allows the virus to enter the host cell by binding to the cellular receptor and facilitating membrane fusion. The nucleocapsid protein, on the other hand, regulates the viral replication process.
In human cells, the angiotensin-converting enzyme 2 (ACE2) receptor functions as a receptor for SARS-CoV-2. Structural and functional analyses have shown that the SARS-CoV-2 spike protein binds to ACE2, which is abundant in lung, heart, ileum, kidney, and bladder tissues [2]. SARS-CoV-2 enters cells through these receptors and triggers an inflammatory response, characterized by macrophage proliferation and cytokine hypersecretion. The most common symptoms of COVID-19 are fever (80.4%), dry cough (63.1%), and fatigue (46%). Severe cases of the disease can progress to acute respiratory failure, requiring orotracheal intubation and mechanical ventilation (MV).
As a single-stranded positive-sense RNA virus, its structural proteins play a crucial role in the pathogenesis of COVID-19 [4]. The spike protein has been identified as the primary protein mediating the binding of SARS-CoV-2 to the ACE2 receptors of host cells and facilitating membrane fusion with the help of transmembrane serine protease 2 (TMPRSS2). This process allows the virus to enter the cells [5]. ACE2 is highly expressed in the epithelial cells of the oral mucosa and lungs, as well as in the heart, blood vessels, intestines, kidneys, bladder, and brain. With increasing age, higher levels of ACE2 are observed, which may explain the lower severity of COVID-19 in children [6]. The transmission of SARS-CoV-2 occurs primarily through close contact with respiratory droplets [7]. Less frequently, the virus is transmitted via aerosols over longer distances [8]. Unlike the severe acute respiratory syndrome coronavirus, whose contagiousness corresponds to the severity of the disease, the viral spread of SARS-CoV-2 begins before the onset of symptoms and peaks in the first week after infection [9].
It is hypothesized that SARS-CoV-2 infection has three stages: a) early infection, characterized by viral invasion and replication; b) pulmonary phase, corresponding to the host’s inflammatory response; and c) hyperinflammatory phase, marked by a dysregulated immune response [10]. The clinical characteristics, imaging features, and management differ according to each stage, highlighting the importance of an accurate diagnosis.
COVID-19 has had a significant global impact, becoming the most severe viral respiratory syndrome since the 1918 H1N1 influenza pandemic [11]. Many patients developed dyspnea and even acute respiratory distress syndrome (ARDS), which can lead to death [12]. In response, scientists worldwide began a race against time to research a potential vaccine to curb the pandemic. By mid-2020, the first vaccines emerged, contributing to saving many lives. According to WHO data, as of this year, ten types of vaccines have been approved and are available for immunization.
Following the development of vaccines and scientific confirmation of their efficacy, the pathological landscape changed. Morbidity and mortality rates declined, and COVID-19 ceased to be a pandemic, although severe cases that can lead to death still occur. According to data from the Brazilian Ministry of Health (MS), as of November 2023, 156,689 cases of COVID-19 were reported in Brazil, with 1,822 hospitalizations and 1,213 deaths. In 2024, the cumulative cases reached 38,815,115, with 712,258 cumulative deaths, resulting in a mortality rate of 1.72 per 100,000 inhabitants [13].
Transmission of the disease occurs through aerosols, oro-fecal secretions, and transplacental routes. The diagnosis of COVID-19 is confirmed through the reverse transcription-polymerase chain reaction (RT-PCR) test, which has a specificity of 100% and a sensitivity of 89%. In the context of highly contagious diseases with the potential for rapid spread, swift and accurate diagnosis is essential to guide and isolate infected individuals. For this purpose, detection tests must be effective, widely available, precise, and yield rapid results [14].
In this regard, imaging exams are relevant for recognizing SARS-CoV-2 infection [15]. A rapid and accurate analysis is crucial in managing cases of a highly infectious disease to reduce its spread as much as possible. For COVID-19 diagnosis, the gold standard is RT-PCR, as well as serology. However, both tests have limitations, primarily due to the timing of symptom onset [16]. According to the WHO, to confirm SARS-CoV-2 infection, one of the following two conditions must be met: first, the patient receives a positive result from a nucleic acid amplification test (NAAT), regardless of clinical or epidemiological criteria; and second, the patient meets clinical and/or epidemiological criteria with a positive SARS-CoV-2 antigen test [17]. NAAT is a viral diagnostic test that allows the detection of viral RNA with high sensitivity and specificity. However, this test requires a long response time, taking up to two days [17].
Chest computed tomography (CT) has the ability to prevent incorrect management of COVID-19 cases in the face of false-negative RT-PCR results. However, it is cautioned that, due to the non-specificity of tomographic patterns, findings should be analyzed in conjunction with other clinical elements. Additionally, any patterns of findings must necessarily consider the probability of representing pulmonary involvement by COVID-19 or not. To improve diagnosis, an RSNA Consensus was published in 2020 to guide the tomographic evaluation of COVID-19 [18].
The COVID-19 Reporting and Data System (CO-RADS) also provides a standardized assessment method with a five-point suspicion scale to describe non-contrast CTs of patients with COVID-19 [19]. CO-RADS stands out for its interobserver agreement (moderate to substantial) and its potential to define low and high probability of COVID-19. The use of CO-RADS and severity scales contributes to screening, diagnosis, and decision-making regarding the protocol to be adopted in emergency care for patients with possible COVID-19 [20].
Therefore, it is of utmost importance to understand the pathophysiology of the disease and its radiological findings to avoid undesirable clinical outcomes. The radiology evidenced in CT scans guides medical conduct, and it is necessary to absorb the concepts already established in the pre-vaccine era, as they remain relevant. CT, due to its diagnostic accuracy, is particularly useful for evaluation when COVID-19 is suspected, allowing observation of the extent of lesions, prognostic assessment of the disease, and monitoring of therapeutic effects [21].
According to Kim and colleagues [21], CT has a sensitivity of 94%, specificity of 37%, positive predictive value of 1.5–30.7%, and negative predictive value between 95.4–99.8%. In this context, the use of CT is essential for defining patterns consistent with a COVID-19 diagnosis, such as those established by the Radiological Society of North America (RSNA). Similarly, the method is useful for assessing the extent of parenchymal involvement, which can be done subjectively or through artificial intelligence (AI).
Previous studies, such as Mogami and colleagues [22], have shown that patients requiring mechanical ventilation (MV) had a higher frequency of the following changes: parenchymal bands, bronchial ectasia, and peribronchovascular consolidations. The extent of parenchymal involvement was statistically significant when associated with other factors such as consolidations, peribronchovascular consolidations, nodules with halo signs, and pleural effusion. In another study conducted in New York City, Richardson and colleagues [23] found that the use of MV was associated with mortality in 88% of cases, highlighting the severity of the disease in this clinical context.
Among the most common findings are ground-glass opacities and consolidation images, with bilateral, peripheral, and lower lobe distribution. Additionally, interlobular septal thickening may occur, resulting in a mosaic paving pattern. Less frequently, vascular thickening, air bronchograms, and halo signs may be identified [24,25,26]. However, a normal CT does not rule out a COVID-19 diagnosis in symptomatic patients.
Therefore, the present study aimed to characterize the clinical and chest CT findings in a sample of patients with COVID-19 and to correlate them with the outcome of death. The specific objectives were to characterize the sample epidemiologically and to describe the tomographic patterns found.
2. Methods
This is a retrospective, observational, and cross-sectional study conducted at the Pedro Ernesto University Hospital. The CT exams were collected consecutively from April 2020 to June 2021. The total sample size was determined by convenience. The inclusion criteria required that patients have acute respiratory syndrome, be of both sexes, aged ≥ 18 years, and have a COVID-19 diagnosis confirmed by PCR. Exclusion criteria included CT images with unacceptable technical quality and the absence of relevant clinical and epidemiological data for correlations.
Patient images and data were collected from the Radiology Information System/Picture Archiving and Communication Systems (RIS/PACS) and electronic medical records. Three radiologists, each with over 20 years of experience, analyzed the tomographic patterns and, by consensus, determined the probability of disease using a classification system adapted from the RSNA. The patterns were divided into:
- Typical: Ground-glass opacities (peripheral, bilateral, rounded, and/or multifocal) or reversed halo sign; with or without consolidation; with or without mosaic paving;
- Possible: Absence of typical signs; unilobar, perihilar, non-peripheral, non-rounded ground-glass opacities;
- Atypical: Absence of typical and possible signs, with findings such as segmental/lobar cavitation, consolidations, micronodules, smooth septal thickening, pleural effusion, or mass;
- Negative: Absence of pulmonary parenchymal changes.
The CT scans were also analyzed according to the classification criteria of Pan and colleagues [25], divided into four stages: stage 1 (0-4 days); stage 2 (5-8 days); stage 3 (9-13 days); and stage 4 (>14 days). Subjective evaluation of the parenchyma was performed in the three basic orthogonal planes: axial, sagittal, and coronal. The degree of involvement was classified as: < 25%, 25%-50%, and >50%, according to Mogami and colleagues [22].
All tomographic documentation of cases was stored on a server (Google Drive) accessible exclusively to members of the research group. The data were anonymized, and the images were used solely for research purposes.
Descriptive analysis presented the observed data in tables, expressed as frequency and percentage for categorical data and using appropriate measures of central tendency and dispersion for numerical data.
In inferential analysis, continuous variables were compared using the Student’s t-test for independent samples or the Mann-Whitney test, as appropriate, while categorical variables were analyzed using the chi-square test or Fisher’s exact test. The Shapiro-Wilk test was used to assess data distribution. A significance level of 5% was adopted.
It is worth noting that the study, still in the context of a research project, was submitted to the Research Ethics Committee of the Pedro Ernesto University Hospital, Rio de Janeiro, Brazil, and approved under number CAAE-30135329.0.0000.5259. The requirement for informed consent was waived as the study involved the consultation of medical record data.
3. Results
A total of 107 records of patients with a confirmed COVID-19 diagnosis by PCR test were analyzed (Figure 1). From this sample, 33 patients were excluded. Of the 74 remaining patients, 30 were male. The average age of the patients was 55 years. In the sample, 32 were hospitalized at HUPE, and 42 were treated at the outpatient clinics of Polyclinic Piquet Carneiro and HUPE. Comorbidities were present in 41 patients. Only five patients required ventilatory support (Figure 1).
The most frequent symptoms were cough (57%), dyspnea (50%), fever (42%), myalgia (24%), chest pain (5%), anosmia (7%), and odynophagia (5%). The duration of symptoms was 0-10 days in 57 patients, 11-20 days in 14 patients, and >20 days in 3 patients.
On CT scans, 41 patients presented with a typical pattern, 10 with an indeterminate pattern, 12 with an atypical pattern, and 11 with a normal pattern. The most common tomographic changes, in descending order of frequency, were: ground-glass opacities (63.5%) (Figure 2B and Figure 4B), consolidations (29.7%) (Figure 3 and Figure 4A), mosaic paving (25.7%) (Figure 4B), parenchymal bands (16.2%), peribronchovascular consolidations (12.2%) (Figure 2A), bronchial ectasia (10.8%) (Figure 3), subpleural lines (9.5%), nodules with ground-glass halo (5.4%), architectural distortion (2.7%), and ground-glass bands (1.4%). Regarding the extent of parenchymal involvement, 32 patients had 0-25% involvement, 19 patients had 25-50%, and 23 patients had more than 50%.
The follow-up of patients showed that 15 of them died, while 59 survived (24 asymptomatic and 35 symptomatic). In the symptomatic subgroup, dyspnea was observed in 18 patients (24.3%), neurological/psychiatric symptoms in 15 (20.3%), pain-related complaints in 14 (18.9%), fatigue in 11 (14.9%), and cough in four (5.4%).
Associations between epidemiological, tomographic, and clinical findings and the outcome of death were measured to analyze the importance of the studied parameters for disease prognosis.
The subgroup of patients who died was more strongly associated with the age group ≥ 60 years (p = 0.0001) and the presence of comorbidities (p = 0.0009) compared to the subgroup that survived (Table 1).
The subgroup that died had a mean age of 71.4 ± 13.4 years, significantly higher than the subgroup that survived, whose mean age was 50.5 ± 15.4 years (Table 2), corroborating the inference shown in Table 1.
The outcome of death was more strongly associated with the indeterminate/atypical pattern, while survivors were more associated with normal and typical patterns (p = 0.012). In turn, parenchymal involvement of 0-25% was more associated with the group that survived, while involvement > 50% was more associated with the outcome of death (Table 2). Table 5 shows the tomographic variables related to the sample and their outcomes.
Table 3 shows the distribution of symptoms in acute COVID-19, while Table 4 shows the distribution of symptoms in post-acute COVID-19.

Table 3.
Distribution of Symptoms Related to COVID-19.
| Symptom – COVID-19 | Total | |
|---|---|---|
| n | % | |
| S1: Cough | ||
| Yes | 57 | 77.0 |
| No | 17 | 23.0 |
| S2: Dyspnea | ||
| Yes | 50 | 67.6 |
| No | 24 | 32.4 |
| S3: Fever | ||
| Yes | 42 | 56.8 |
| No | 32 | 43.2 |
| S4: Myalgia/Fatigue | ||
| Yes | 24 | 32.4 |
| No | 50 | 67.6 |
| S5: Chest Pain | ||
| Yes | 5 | 6.8 |
| No | 69 | 93.2 |
| S6: Anosmia/Rhinorrhea | ||
| Yes | 7 | 9.5 |
| No | 67 | 90.5 |
| S7: Odynophagia | ||
| Yes | 5 | 6.8 |
| No | 69 | 93.2 |
| Symptom Onset (days) | ||
| 0-10 | 57 | 77.0 |
| 11-20 | 14 | 18.9 |
| > 20 | 3 | 4.1 |
| PCR Result | ||
| Positive | 56 | 75.7 |
| Negative | 18 | 24.3 |
Table 4.
Distribution of Symptoms in Post-Acute COVID-19.
| Post-COVID-19 Variable | Total | |
|---|---|---|
| n | % | |
| Outcome (1) | ||
| Asymptomatic | 24 | 32.4 |
| Symptomatic | 35 | 47.3 |
| Death | 15 | 20.3 |
| Outcome (2) | ||
| Death | 15 | 20.3 |
| Alive | 59 | 79.7 |
| Dyspnea | ||
| Yes | 18 | 24.3 |
| No | 56 | 75.7 |
| Cough | ||
| Yes | 4 | 5.4 |
| No | 70 | 94.6 |
| Fatigue | ||
| Yes | 11 | 14.9 |
| No | 63 | 85.1 |
| Pain-Related Complaints | ||
| Yes | 14 | 18.9 |
| No | 60 | 81.1 |
| Memory Loss | ||
| Yes | 7 | 9.5 |
| No | 67 | 90.5 |
| Neurological/Psychiatric Symptoms | ||
| Yes | 8 | 10.8 |
| No | 66 | 89.2 |
Table 5.
Tomographic Variables Related to the Sample and Outcomes.
| Variable | Total | Death | Alive | p value | |||
|---|---|---|---|---|---|---|---|
| N | % | n | % | n | % | ||
| CT Pattern | |||||||
| Typical | 41 | 55.4 | 6 | 40 | 35 | 59.3 | 0.012 |
| Indeterminate | 10 | 13.5 | 5 | 33.3 | 5 | 8.5 | |
| Atypical | 12 | 16.2 | 4 | 26.7 | 8 | 13.6 | |
| Normal | 11 | 14.9 | 0 | 0 | 11 | 18.6 | |
| CT Pattern | |||||||
| Typical/Indeterminate | 51 | 68.9 | 11 | 73.3 | 40 | 67.8 | 0.47 |
| Atypical/Normal | 23 | 31.1 | 4 | 26.7 | 19 | 32.2 | |
| Ground-Glass Opacity | |||||||
| Yes | 47 | 63.5 | 9 | 60 | 38 | 64.4 | 0.75 |
| No | 27 | 36.5 | 6 | 40 | 21 | 35.6 | |
| Ground-Glass Band | |||||||
| Yes | 1 | 1.4 | 0 | 0 | 1 | 1.7 | 0.80 |
| No | 73 | 98.6 | 15 | 100 | 58 | 98.3 | |
| Mosaic Pattern | |||||||
| Yes | 19 | 25.7 | 3 | 20 | 16 | 27.1 | 0.42 |
| No | 55 | 74.3 | 12 | 80 | 43 | 72.9 | |
| Parenchymal Bands | |||||||
| Yes | 12 | 16.2 | 1 | 6.7 | 11 | 18.6 | 0.24 |
| No | 62 | 83.8 | 14 | 93.3 | 53 | 89.8 | |
| Subpleural Lines | |||||||
| Yes | 7 | 9.5 | 1 | 6.7 | 6 | 10.2 | 0.57 |
| No | 67 | 90.5 | 14 | 93.3 | 53 | 89.8 | |
| Consolidations | |||||||
| Yes | 22 | 29.7 | 4 | 26.7 | 18 | 30.5 | 0.52 |
| No | 52 | 70.3 | 11 | 73.3 | 41 | 69.5 | |
| Bronchial Ectasia | |||||||
| Yes | 8 | 10.8 | 1 | 6.7 | 7 | 11.9 | 0.49 |
| No | 66 | 89.2 | 14 | 93.3 | 52 | 88.1 | |
| Architectural Distortion. | 0.63 | ||||||
| Yes | 2 | 2.7 | 0 | 0 | 2 | 3.44 | |
| No | 72 | 97.3 | 15 | 100 | 57 | 96.6 | |
| Peribronchovascular Consolidation | 0.11 | ||||||
| Yes | 9 | 12,2 | 0 | 0 | 9 | 15.3 | |
| No | 65 | 87,8 | 15 | 100 | 50 | 84.7 | |
| Nodule with Ground-Glass Halo | 0.40 | ||||||
| Yes | 4 | 5,4 | 0 | 0 | 4 | 6.8 | |
| No | 70 | 94,6 | 15 | 100 | 55 | 93.2 | |
| Reversed Halo Sign | NA | ||||||
| Yes | 0 | 0 | 0 | 0 | 0 | 0 | |
| No | 74 | 100 | 15 | 100 | 59 | 100 | |
| Percentage of Ground-Glass Opacity Involvement | |||||||
| 0-25% | 32 | 43,2 | 2 | 13.3 | 30 | 50.8 | 0.017 |
| 25-50% | 19 | 25,7 | 5 | 33.3 | 14 | 23.7 | |
| >50% | 23 | 31,1 | 8 | 53.3 | 15 | 25.4 | |
*Note: χ2 test or Fisher’s exact test. NA: not applicable.
4. Discussion
COVID-19 infection primarily leads to respiratory complications. It is a highly contagious disease, whose complexity and severity may require ventilatory support and, not infrequently, results in patient death [14]. Therefore, a significant portion of those infected had a favorable outcome, even after the occurrence of respiratory complications. However, the presence of comorbidities predisposes individuals to more pronounced complications, as well as acute respiratory distress syndrome (ARDS) [27]. Transmission of SARS-CoV-2 shows more noticeable signs with reactive test results. The infection caused by this virus leads to symptoms ranging in intensity from flu-like symptoms to severe pneumonia. A significant number of these patients presented with CT changes [28].
It is considered that the initial research on pulmonary CT findings related to SARS-CoV-2 infection revealed variable results in sensitivity and specificity compared to RT-PCR [29]. However, early analyses did not establish a structured methodology for interpreting chest CT results or provide a prognostic classification [30]. Subsequently, an American group affiliated with the RSNA developed a classification based on CT findings of COVID-19 [31]. Currently, diagnostic support programs for CT are available, which indicate the probability of COVID-19 through image evaluation using artificial intelligence (AI). Additionally, these programs automatically quantify the extent of the disease, aiding in decision-making regarding the medical protocol to be followed [32]. However, it is noted that there are few studies on the accuracy of these programs, especially in patients with negative RT-PCR results [33].
Initial chest radiography often shows areas of poorly defined, focal, or multifocal opacities, unilateral, involving the middle and lower peripheral lung zones, with progressive multifocal consolidation over 6 to 12 days affecting one or both lungs. However, CT is the recommended imaging exam when COVID-19 is suspected. According to Kim and colleagues [21], the sensitivity of the method is 94%, the specificity is 37%, the positive predictive value is 1.5–30.7%, and the negative predictive value is 95.4–99.8%. In this context, the use of CT during the pandemic was crucial for defining patterns compatible with a COVID-19 diagnosis, such as those established by the Radiological Society of North America (RSNA). Similarly, the method was useful for assessing the extent of parenchymal involvement, which can be done subjectively or through artificial intelligence (AI).
Previous studies, such as that by Mogami and colleagues (2020), showed that patients who required mechanical ventilation (MV) had a higher frequency of the following changes: parenchymal bands, bronchial ectasia, and peribronchovascular consolidations. The extent of parenchymal involvement was statistically significant when associated with other factors such as consolidations, peribronchovascular consolidations, nodules with halo signs, and pleural effusion. In another study conducted in New York City, Richardson and colleagues [23] found that the use of MV was associated with mortality in 88% of cases, demonstrating the severity of the disease in this clinical context.
The RSNA classification for describing COVID-19 pneumonia stratified chest CT findings into four patterns, as follows: a) typical – defined by peripheral, bilateral, rounded, and/or multifocal ground-glass opacities (or reversed halo sign); b) indeterminate – characterized by the absence of typical signs, unilobar, perihilar, and non-peripheral, with non-rounded ground-glass opacities; c) atypical – described by the absence of typical and indeterminate signs; and d) negative – in which there are no changes in the lung parenchyma [24]. Among the most common findings on chest CT are, above all, ground-glass opacities and consolidations that are distributed in the periphery of both lungs. Interlobular septal thickening is also common and can result in a mosaic paving pattern when associated with ground-glass opacities. Less frequently, vascular thickening, air bronchograms, and halo signs may be identified. However, a normal chest CT does not rule out a COVID-19 diagnosis in symptomatic patients.
Pan and colleagues [25] defined four stages of SARS-CoV-2 infection progression: a) early phase, occurring 0 to 4 days after symptom onset, characterized by subpleural ground-glass opacities, unilateral or bilateral, located in the lower lobes; b) progression phase, occurring 5 to 8 days after onset, characterized by more extensive ground-glass opacities, mosaic paving pattern, and consolidations; c) peak phase, manifested between days 9 and 13, characterized by intensification of ground-glass opacities and consolidations, mosaic paving pattern/sparse fibroatelectatic parenchymal bands, and another pattern similar to organizing pneumonia; and d) absorption phase, occurring from day 14 onward, characterized by a reduction in ground-glass opacities, consolidations, and fibroatelectatic changes, and the absence of the mosaic paving pattern [25,26].
The compatibility patterns of COVID-19 on CT were described by Constantine [34] as follows: a) typical, when ground-glass opacities (peripheral, bilateral, rounded, and/or multifocal) or reversed halo signs are observed, with or without consolidation, with or without mosaic paving; b) possible, in the absence of typical signs, unilobar, perihilar, non-peripheral, non-rounded ground-glass opacities; c) atypical, in the absence of typical and possible signs, with findings such as segmental/lobar cavitation, consolidations, micronodules, smooth septal thickening, pleural effusion, or mass. Additionally, in the early phase of COVID-19, certain characteristics of the tomographic exam suggest possible outcomes or prognoses. Yu and colleagues [35] suggested that interstitial thickening, irregularity of parenchymal interfaces, coarse reticular pattern, and parenchymal bands could be predictors of lesions similar to pulmonary fibrosis.
Han and colleagues [36] followed 114 patients with severe COVID-19 for six months. The authors concluded that a high lung involvement score on initial CT scans was a prognostic factor for the appearance or persistence of fibrosis-like lesions at the six-month follow-up. Studies such as those by Mogami and colleagues [22] showed associations between tomographic changes and worse clinical outcomes, such as the need for mechanical ventilation (MV) and eventual death. However, the number of patients with these outcomes was low (eight), requiring comparisons with larger samples, as done in the present study.
In the present study, the most frequent tomographic changes were consistent with those observed in the works of Mogami and colleagues [22], Wells and colleagues [37], and D’Cruz and colleagues [38]. The findings included ground-glass opacities, septal thickening, air trapping, parenchymal bands, bronchiectasis, peripheral vascular ectasia, subpleural lines, volume reduction, signs of bronchiolitis, and mosaic paving. Similarly, as described by Long-Quan and colleagues [39], the present study showed that age over 60 and the presence of comorbidities emerge as significant risk factors for death. In their meta-analysis, Long-Quan and colleagues [39] highlighted that 31.5% of patients who died from COVID-19 were over 60 years old and had some form of comorbidity. Furthermore, Galvão and colleagues [40] demonstrated a 9.44-fold increase in mortality risk associated with the presence of comorbidities. Therefore, these findings reinforce the importance of implementing preventive protocols and clinical management strategies tailored to specific patient groups when necessary. Fang and colleagues [41] reported that extensive pulmonary involvement in the acute phase could be associated with a high mortality rate and a greater sequela component in survivors, mainly due to fibrotic changes in the lung parenchyma. The epidemiological surveillance guide from the Brazilian Ministry of Health also states that larger areas of opacity and consolidations were observed in individuals with more severe forms of the disease [42]. Bernheim and colleagues [43] showed that patients with a respiratory rate >30 breaths/minute and oxygen saturation <93% presented a tomographic pattern called “white lung,” where ground-glass opacities were diffuse, which could lead to earlier death.
In our study, the CT data associated with a worse clinical prognosis were the indeterminate/atypical patterns and involvement of more than 50% of the lung parenchyma. However, there are few reports in the literature about indeterminate/atypical patterns for COVID-19 on CT as factors for a worse prognosis. According to Fang and colleagues [41], such cases occurred mainly in older patients who also had some type of comorbidity. In the present study, what can be inferred from this association is that the indeterminate and atypical patterns could represent other severe diseases associated with COVID-19 that led to an increased frequency of deaths. The association of the survivor group with the normal pattern is, obviously, consistent, and with the typical pattern, it can be explained by management directed solely at COVID-19, without other respiratory complications occurring in parallel with the disease, as might possibly occur in indeterminate and atypical patterns. However, the greater utility of this classification lies in its use during a pandemic for the rapid diagnosis of the probability of the disease.
This study also showed that no isolated tomographic finding, except for the quantitative assessment of the disease, was associated with a higher likelihood of death, contrary to what was observed by Mogami and colleagues [22]. Although this study demonstrated significant scientific value, it presented a small sample of the findings considered. This opens the door for new research to improve upon the data highlighted here. Another limitation of the study was the lack of contact with some patients after the hospitalization, which prevented the expansion of the study’s scope with other outcome perspectives.
5. Conclusions
Currently, the importance of serologic testing to confirm infection, especially two weeks after the onset of symptoms, is undeniable. However, during the pandemic, given the delay in obtaining test results, imaging studies played a crucial role in decision-making regarding the treatment protocol to be adopted. In this study, the parameters of age ≥60 years and comorbidities were identified as risk factors for death in COVID-19. Regarding tomographic parameters, no single finding showed prognostic significance; however, there was a higher risk of death in patients with a greater percentage of parenchymal involvement and indeterminate or atypical tomographic patterns.
Author Contributions
Conceptualization, H.S.B.C. and R.M.; methodology, H.S.B.C. and R.M.; software, C.G.C.C. and G.A.P.S.; validation, H.S.B.C., C.G.C.C., and G.A.P.S.; formal analysis, H.S.B.C. and S.M.M.; investigation, H.S.B.C., C.M.M., and C.M.B.Q.C.; resources, H.S.B.C. and S.L.G.N.; data curation, H.S.B.C. and C.G.C.C.; writing—original draft preparation, H.S.B.C.; writing—review and editing, H.S.B.C., A.J.L., and R.M.; visualization, H.S.B.C.; supervision, A.J.L. and R.M.; project administration, H.S.B.C. All authors have read and agreed to the published version of the manuscript.
Funding
This research received no external funding.
Informed Consent Statement
It is worth noting that the study, still in the context of a research project, was submit-ted to the HUPE Research Ethics Committee and approved under number CAAE-30135329.0.0000.5259. The requirement for informed consent was waived as the study involved the consultation of medical record data.
Conflicts of Interest
The authors declare no conflicts of interest.
Abbreviations
The following abbreviations are used in this manuscript:
| COVID-19 | Coronavirus Disease 2019 |
| CO-RADS | COVID-19 Reporting and Data System |
| ACE2 | Angiotensin-converting enzyme 2 |
| AI | Artificial intelligence |
| NAAT | Nucleic acid amplification test |
| NICE | National Institute for Health and Care Excellence |
| WHO | World Health Organization |
| PACS | Picture Archiving and Communication System |
| RIS | Radiology Information System |
| RSNA | Radiological Society of North America |
| RT-PCR | Reverse transcription-polymerase chain reaction |
| ARDS | Acute Respiratory Distress Syndrome |
| SARS-CoV-1 | Severe Acute Respiratory Syndrome Coronavirus-1 |
| SARS-CoV-2 | Severe Acute Respiratory Syndrome Coronavirus-2 |
| ARDS | Acute Respiratory Distress Syndrome |
| BTS | British Thoracic Society |
| STR | Society of Thoracic Radiology |
| CT | Computed tomography |
| ICU | Intensive Care Unit |
| GGO | Ground-glass opacity |
| MV | Mechanical ventilation |
References
- World Health Organization. Coronavirus disease (COVID-19) pandemic. 2020. Available online: https://www.who.int/emergencies/diseases/novel-coronavirus-2019 (accessed on 19 April 2024).
- Chen, Y.; Liu, Q.; Guo, D. Emerging coronaviruses: Genome structure, replication, and pathogenesis. J. Med. Virol. 2020, 92, 418–423. [Google Scholar] [CrossRef] [PubMed]
- Ceraolo, C.; Giorgi, F. M. Genomic variance of the 2019-nCoV coronavirus. J. Med Virol. 2020, 92, 522–528. [Google Scholar] [CrossRef] [PubMed]
- Weiss, S. R.; Leibowitz, J. L. Coronavirus pathogenesis. Adv. Virus Res. 2011, 81, 85–164. [Google Scholar] [PubMed]
- Lan, J.; Ge, J.; Yu, J.; Shan, S.; Zhou, H.; Fan, S.; et al. Structure of the SARS-CoV-2 spike receptor-binding domain bound to the ACE2 receptor. Nature 2020, 581, 215–220. [Google Scholar] [CrossRef]
- Saheb Sharif-Askari, N.; Sharif-Askari, F.S.; Alabed, M.; Temsah, M.H.; Al Heialy, S.; Hamid, Q.; et al. Airways Expression of SARS-CoV-2 Receptor, ACE2, and TMPRSS2 Is Lower in Children Than Adults and Increases with Smoking and COPD. Mol. Ther. Methods Clin. Dev. 2020, 18, 1–6. [Google Scholar] [CrossRef]
- Ward, I. L.; Bermingham, C.; Ayoubkhani, D.; Gethings, O.J.; Pouwels, K.B.; Yates, T.; et al. Risk of covid-19 related deaths for SARS-CoV-2 omicron (B.1.1.529) compared with delta (B.1.617.2): retrospective cohort study. BMJ 2022, 378, e070695. [Google Scholar] [CrossRef]
- Shen, Y.; Li, C.; Dong, H.; Wang, Z.; Martinez, L.; Sun, Z.; et al. Community outbreak investigation of SARS-CoV-2 transmission among bus riders in Eastern China. JAMA Intern. Med. 2020, 180, 1665–1671. [Google Scholar] [CrossRef]
- Hu, B.; Guo, H.; Zhou, P.; Shi, Z. L. Characteristics of SARS-CoV-2 and COVID-19. Nat. Rev. Microbiol. 2021, 9, 141–154. [Google Scholar] [CrossRef]
- Siddiqi, H. K.; Mehra, M. R. COVID-19 illness in native and immunosuppressed states: a clinical-therapeutic staging proposal. J. Heart Lung Transplant. 2020, 39, 405–407. [Google Scholar] [CrossRef]
- Ferguson, N.; Laydon, D.; Nedjati Gilani, G.; Imai, N.; Ainslie, K.; Baguelin, M.; Bhatia, S.; et al. Report 9 - Impact of non-pharmaceutical interventions (NPIs) to reduce COVID-19 mortality and healthcare demand. Imperial College, London, 2020.
- Brazil, M. S. Diagnóstico e Tratamento da COVID-19 Tratamento. Secretaria De Ciência, Tecnologia, Inovação e Insumos Estratégicos em Saúde, 1, 1–398, 2020.
- Brazil. Painel coronavirus. Coronavirus Brasil, 2022. Available online: https://covid.saude.gov.br/ (accessed on 27 September 2022).
- Fonseca, E.K.U.N.; Ferreira, L.C.; Loureiro, B.M.C.; Strabelli, D.G.; de Farias, L.P.G.; de Queiroz, G.A.; et al. Tomografia computadorizada de tórax no diagnóstico de COVID-19 em pacientes com resultado falso-negativo na RT-PCR. Einstein 2021, 19, AO6363. [Google Scholar] [CrossRef]
- Silva, F. Imaging findings of COVID-19 on computed tomography: a narrative review. Scientific Article Roentgen. 2023, 4. [Google Scholar]
- Udugama, B.; Kadhiresan, P.; Kozlowski, H.N.; Malekjahani, A.; Osborne, M.; Vanesa, Y.C.L.; et al. Diagnosing COVID-19: the disease and tools for detection. ACS Nano 2020, 14, 3822–3835. [Google Scholar] [CrossRef] [PubMed]
- World Health Organization. Diagnostic testing for SARS-CoV-2: interim guidance. 2022. Available online: https://www.who.int/publications/i/item/diagnostic-testing-for-sars-cov-2 (accessed on 19 April 2024).
- Bhalla, S.; Kay, F.U.; Abbara, S.; Bhalla, S.; Chung, J.H.; Chung, M.; et al. Radiological Society of North America Expert Consensus Statement on reporting chest CT findings related to COVID-19. Endorsed by the Society of Thoracic Radiology, the American College of Radiology, and RSNA - Secondary Publication. J. Thorac. Imaging 2020, 35, 219–227. [Google Scholar]
- Prokop, M.; Van Everdingen, W.; Van Rees Vellinga, T.; Quarles Van Ufford, H.; Stöger, L.; Beenen, L.; et al. CO-RADS: A categorical CT assessment scheme for patients suspected of having COVID-19-definition and evaluation. Radiology 2020, 296, 97–104. [Google Scholar] [CrossRef]
- Lieveld, A.W.E.; Azijli, K.; Teunissen, B.P.; Van Haaften, R.M.; Kootte, R.S.; Van Den Berk, I.A.H.; Van Der Horst, S.F.B.; et al. Chest CT in COVID-19 at the ED: validation of the COVID-19 Reporting and Data System (CO-RADS) and CT severity score: a prospective, multicenter, observational study. Chest 2021, 159, 1126–1135. [Google Scholar] [CrossRef]
- Kim, H.; Hong, H.; Yoon, S.H. Diagnostic performance of CT and reverse transcriptase polymerase chain reaction for coronavirus disease 2019: a meta-analysis. Radiology 2020, 296, E145–E155. [Google Scholar] [CrossRef]
- Mogami, R.; Lopes, A.J.; Araújo Filho, R.C.; Almeida, F.C.S.; Messeder, A.M.C.; Koifman, A.C.B.; et al. Chest computed tomography in COVID-19 pneumonia: a retrospective study of 155 patients at a university hospital in Rio de Janeiro, Brazil. Radiol Bras. 2021, 54, 1–8. [Google Scholar] [CrossRef]
- Richardson, S.; Hirsch, J.S.; Narasimhan, M.; Crawford, J.M.; McGinn, T.; Davidson, K.W.; et al. Presenting characteristics, comorbidities, and outcomes among 5700 patients hospitalized with COVID-19 in the New York City area. JAMA. 2020, 323, 2052–2059. [Google Scholar] [CrossRef]
- Ciccarese, F.; Coppola, F.; Spinelli, D.; Galletta, G. L.; Lucidi, V.; Paccapelo, A.; et al. Diagnostic accuracy of North America Expert Consensus Statement on reporting CT findings in patients suspected of having COVID-19 infection: an Italian single-center experience. Radiol. Cardiothorac. Imaging 2020, 2, e200312. [Google Scholar] [CrossRef]
- Pan, F.; Ye, T.; Sun, P.; Gui, S.; Liang, B.; Li, L.; et al. Time course of lung changes at chest CT during recovery from coronavirus disease 2019 (COVID-19). Radiology 2020, 295, 715–721. [Google Scholar] [CrossRef]
- Adams, H.J.A.; Kwee, T.C.; Yakar, D.; Hope, M.D.; Kwee, R.M. Systematic review and meta-analysis on the value of chest CT in the diagnosis of coronavirus disease (COVID-19): Sol Scientiae, Illustra Nos. Am. J. Roentgenol. 2020, 215, 1342–1350. [Google Scholar] [CrossRef] [PubMed]
- Campos, C. Imaging findings of COVID-19 on computed tomography: A Narrative Review. Scientific Article ROENTGEN. 2023, 4. [Google Scholar]
- Amorim, A. Imaging findings of COVID-19 on computed tomography: a narrative review. Scientific Article ROENTGEN. 2023, 4. [Google Scholar]
- Xie, X.; Zhong, Z.; Zhao, W.; Zheng, C.; Wang, F.; Liu, J. Chest CT for typical 2019-nCoV pneumonia: relationship to negative RT-PCR testing. Radiology 2020, 296, 41–45. [Google Scholar] [CrossRef] [PubMed]
- Raptis, C.A.; Hammer, M.M.; Short, R.G.; Shah, A.; Bhalla, S.; Bierhals, A.J.; et al. Chest CT and coronavirus disease (COVID-19): a critical review of the literature to date. Am. J. Roentgenol. 2020, 215, 839–842. [Google Scholar] [CrossRef]
- Simpson, S.; Kay, F. U.; Abbara, S.; Bhalla, S.; Chung, J.H.; Chung, M.; et al. Radiological Society of North America Expert Consensus Statement on reporting Chest CT findings related to COVID-19. Endorsed by the Society of Thoracic Radiology, the American College of Radiology, and RSNA - Secondary Publication. J Thorac Imaging. 2020, 35, 219–227. 35.
- Chaganti, S.; Grenier, P.; Balachandran, A.; Chabin, G.; Cohen, S.; Flohr, T.; et al. Automated quantification of CT patterns associated with COVID-19 from chest CT. Radiol Artif Intell. 2020, 2, e200048. [Google Scholar] [CrossRef]
- Zhang, H.T.; Zhang, J.S.; Zhang, H.H.; Nan, Y.D.; Zhao, Y.; Fu, E.Q.; et al. Automated detection and quantification of COVID-19 pneumonia: CT imaging analysis by a deep learning-based software. Eur. J. Nucl. Med. Mol. Imaging 2020, 47, 2525–2532. [Google Scholar] [CrossRef]
- Constantine, A. Imaging findings of COVID-19 on computed tomography: a narrative review. Scientific Article ROENTGEN. 2023, 4. [Google Scholar]
- Yu, M.; Liu, Y.; Xu, D.; Zhang, R.; Lan, L.; Xu, H. Prediction of the development of pulmonary fibrosis using serial thin-section CT and clinical features in patients discharged after treatment for COVID-19 Pneumonia. Korean J. Radiol. 2020, 21, 746–755. [Google Scholar] [CrossRef]
- Han, X.; Fan, Y.; Alwalid, O.; Li, N.; Jia, X.; Yuan, M.; et al. Six-month follow-up chest CT findings after severe COVID-19 pneumonia. Radiology. 2021, 299, 177–186. [Google Scholar] [CrossRef]
- Wells, A.U.; Sujal, A.D.; Desai, R.D. Interstitial lung disease after COVID-19 infection: a catalog of uncertainties. Radiology 2021, 299, 216–218. [Google Scholar] [CrossRef]
- D’Cruz, R.F.D.; Waller, M.D.; Perrin, F.; Periselneris, J.; Norton, S.; Smith, L.J.; et al. Chest radiography is a poor predictor of respiratory symptoms and functional impairment in survivors of severe COVID-19 pneumonia. ERJ Open Res. 2021, 7, 00655. [Google Scholar] [CrossRef]
- Li, L.Q.; Huang, T.; Wang, Y.Q.; Wang, Z.P.; Liang, Y.; Huang, T.B.; et al. COVID-19 patients’ clinical characteristics, discharge rate, and fatality rate of meta-analysis. J. Med. Virol. 2020, 92, 577–583. [Google Scholar] [CrossRef]
- Galvão, M.R.H.; Roncalli, A.G. Fatores associados a maior risco de ocorrência de óbito por COVID-19: análise de sobrevivência com base em casos confirmados. Rev. Bras. Epidemiol. 2020, 23. [Google Scholar] [CrossRef]
- Fang, X.; Ming, C.; Cen, Y.; Lin, H.; Zhan, K.; Yang, S.; et al. Post-sequelae one year after hospital discharge among older COVID-19 patients: A multi-center prospective cohort study. J. Infect. 2022, 84, 179–186. [Google Scholar] [CrossRef]
- COVID-19 Epidemiological Surveillance Guide. Ministério da Saúde, Brasil, 2022. Available online: https://www.gov.br/saude/pt-br (accessed on 19 April 2024).
- Bernheim, A.; Mei, X.; Huang, M.; Yang, Y.; Fayad, Z. A.; Zhang, N.; et al. Chest CT findings in coronavirus disease-19 (COVID-19): relationship to duration of infection. Radiology 2020, 295, 200463. [Google Scholar] [CrossRef]
Figure 1.
Flowchart of Results.
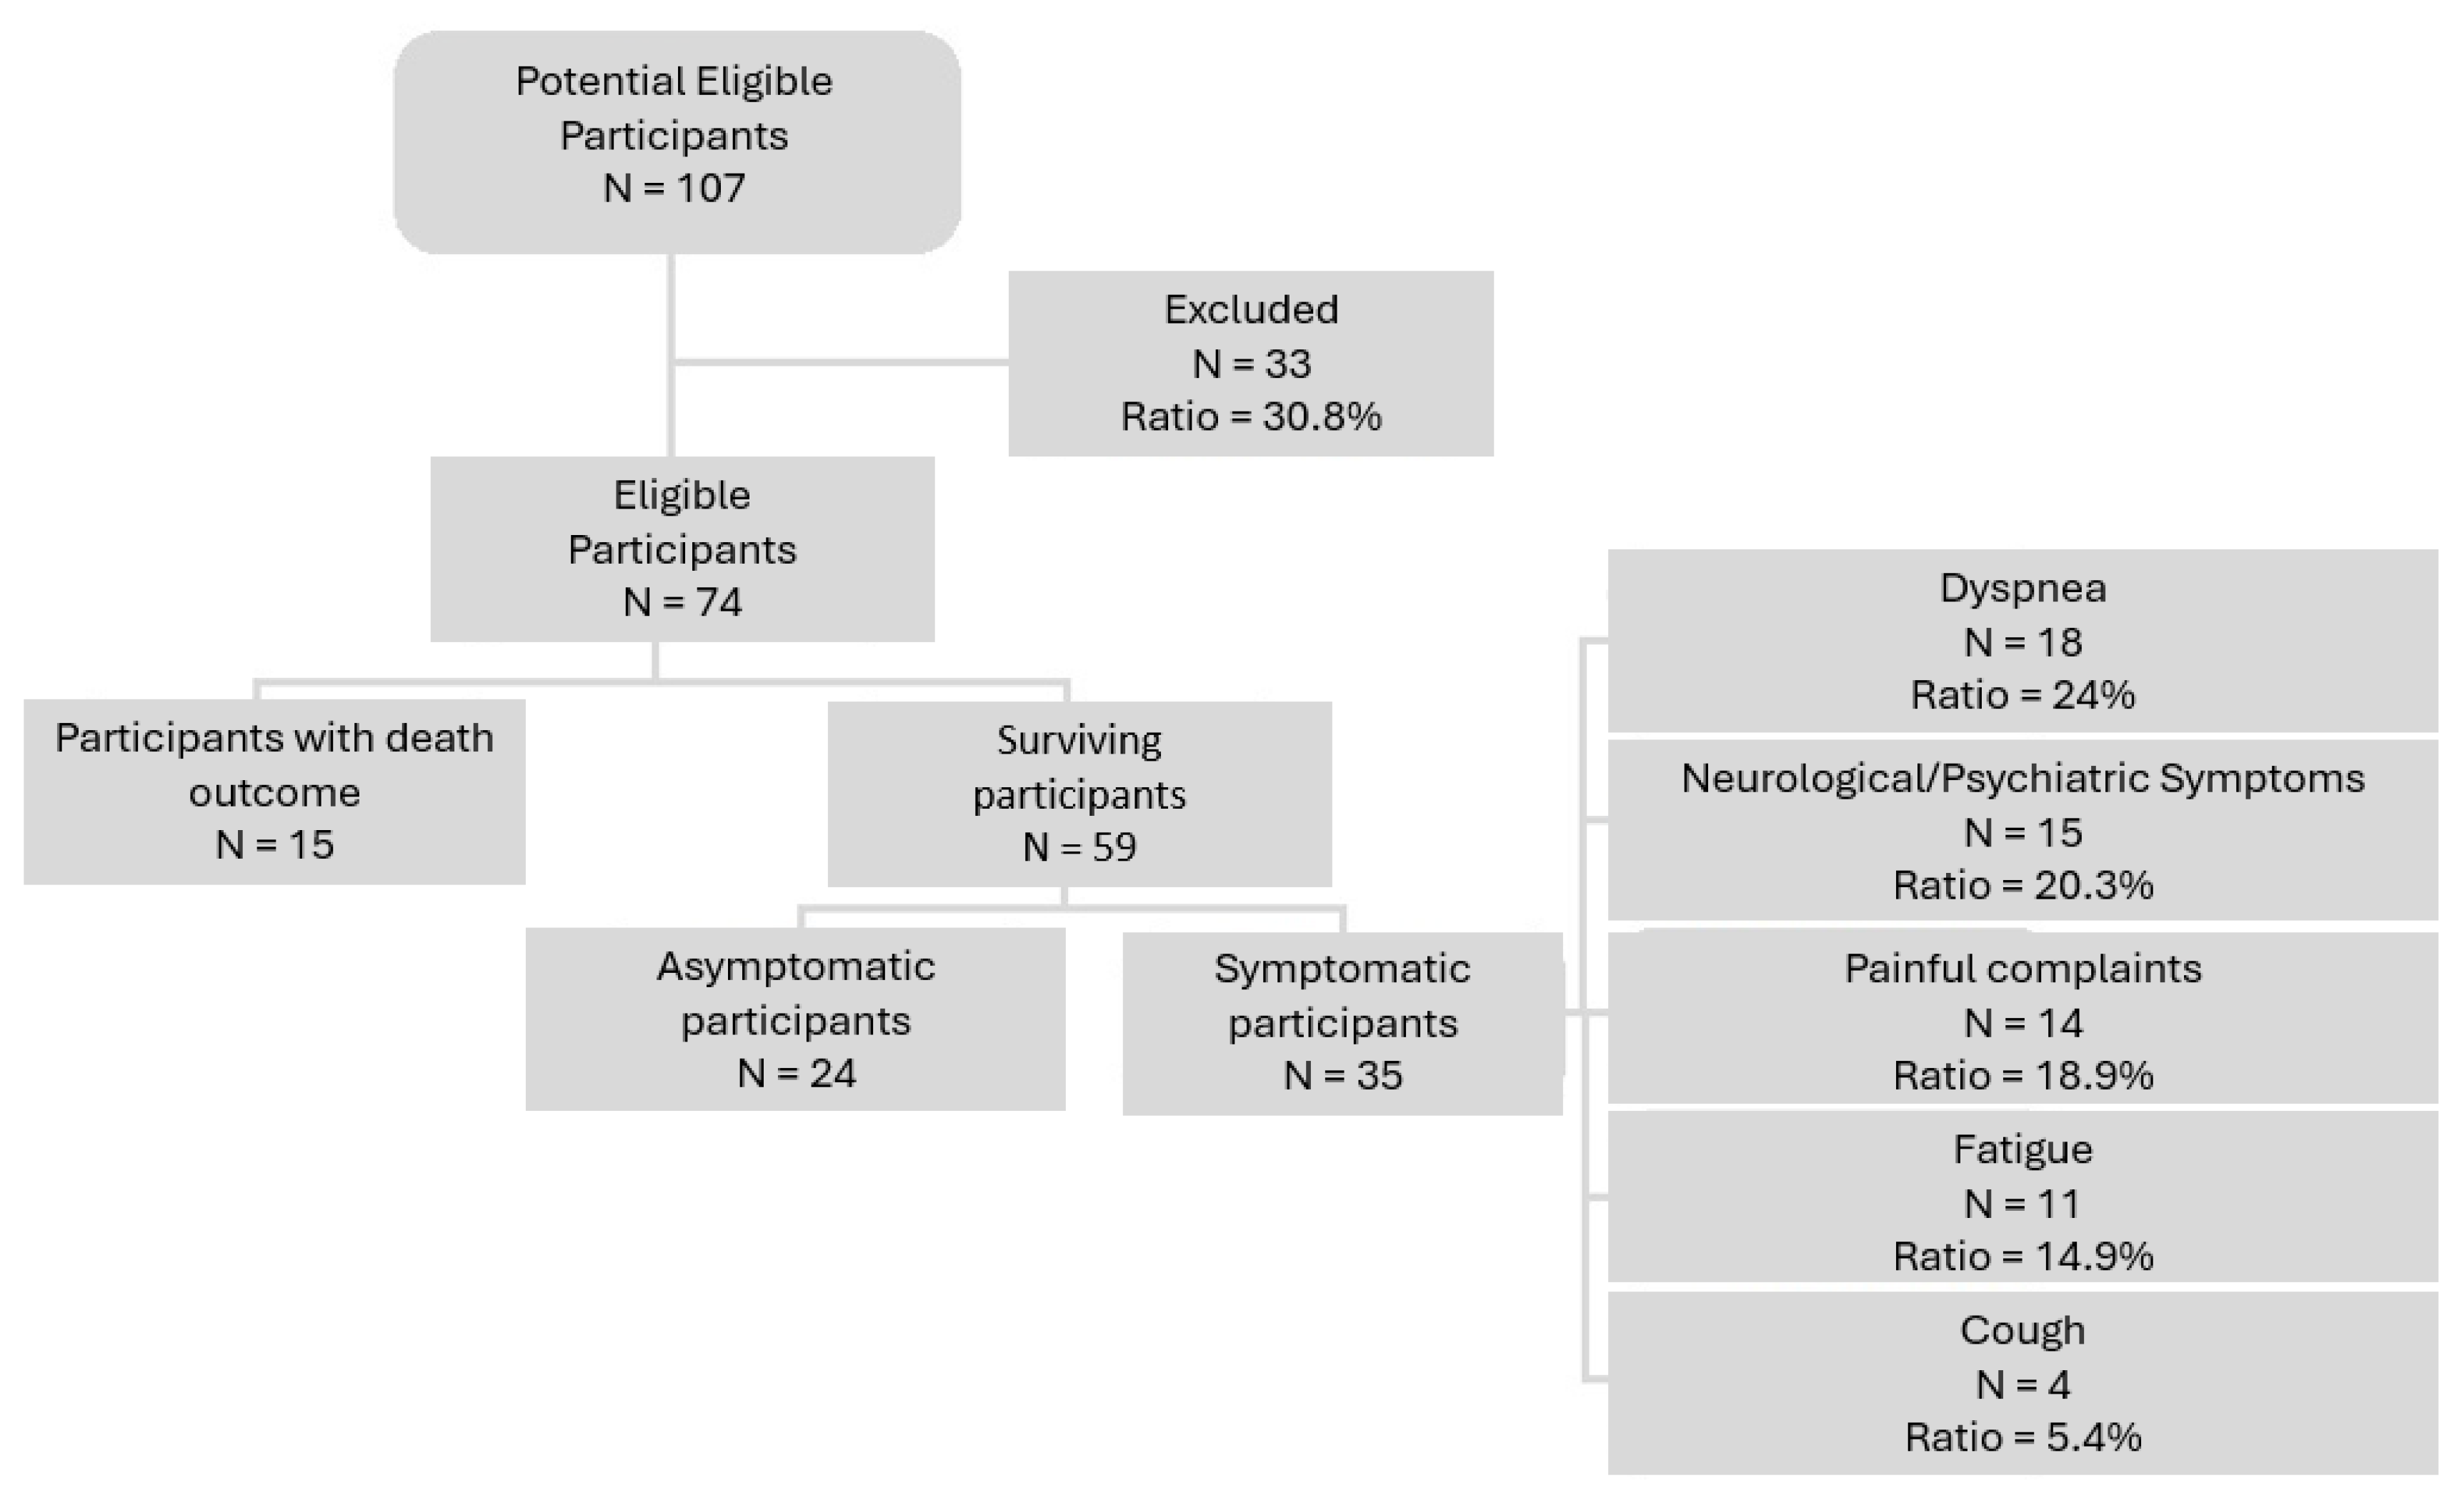
Figure 2.
Peribronchovascular Consolidations and Ground-Glass Opacities: (a) Male, 29 years old. CT performed on the 4th day after symptom onset shows peribronchovascular consolidations in the right lower lobe (arrows); (b) CT performed on the 14th day after symptom onset. The patient still had mild cough and dyspnea. There are residual subtle ground-glass opacities in the right lung (arrows).
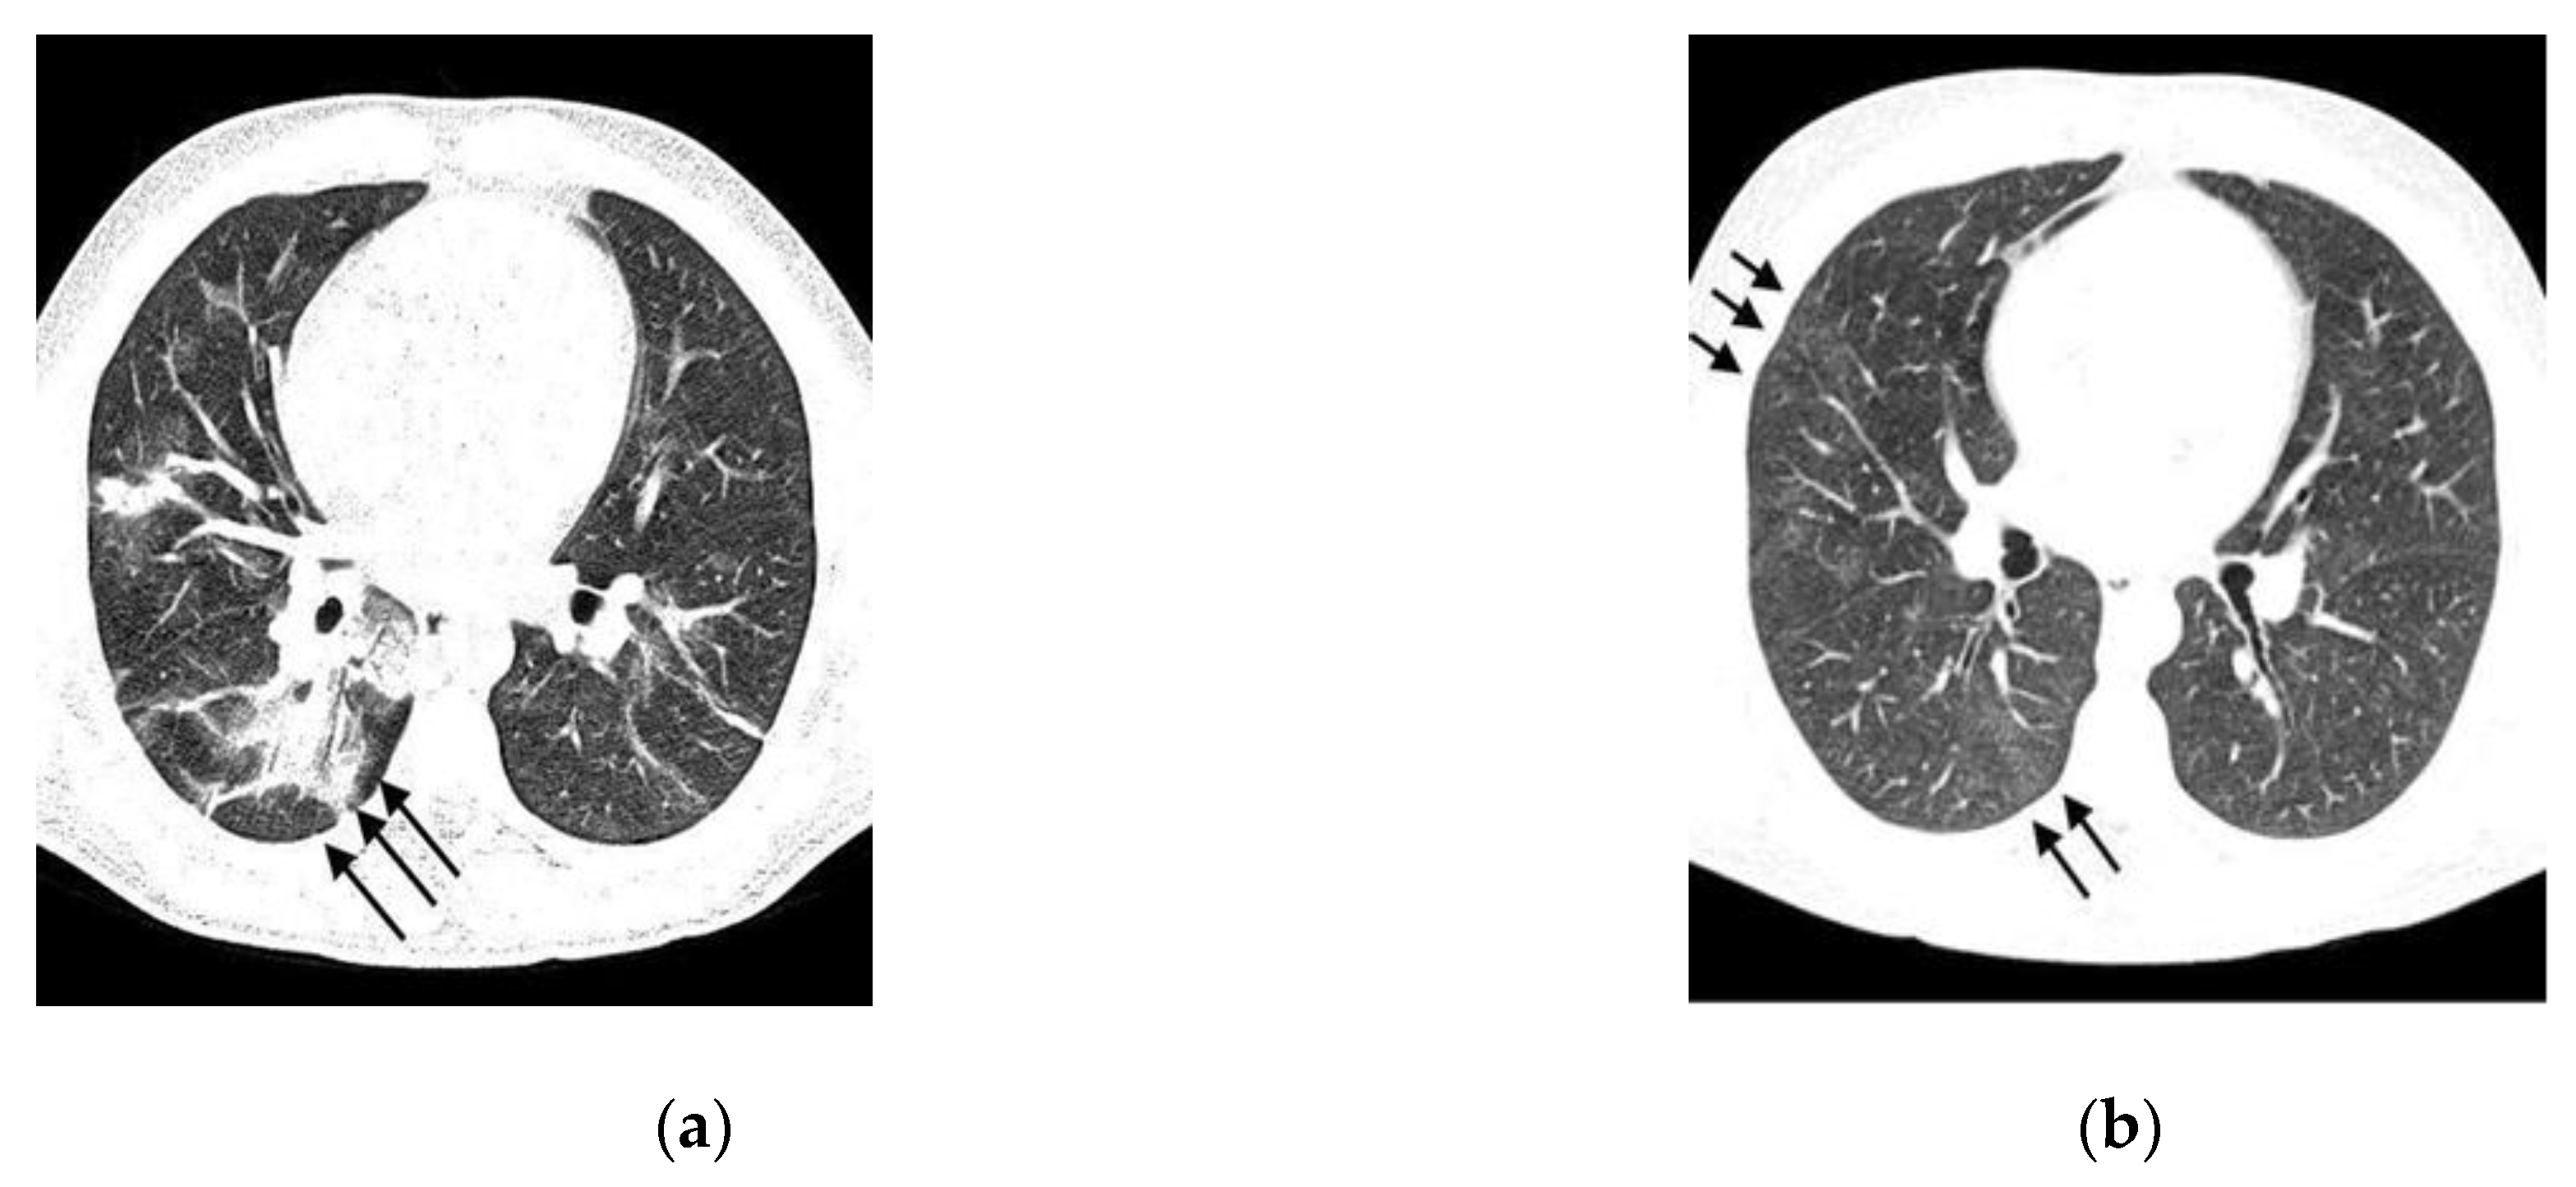
Figure 3.
Consolidations and Bronchial Ectasia. A 36-year-old male patient, 15 days after symptom onset. Chest CT image in the coronal plane shows areas of consolidation along with bronchial ectasia (arrows).
Figure 3.
Consolidations and Bronchial Ectasia. A 36-year-old male patient, 15 days after symptom onset. Chest CT image in the coronal plane shows areas of consolidation along with bronchial ectasia (arrows).
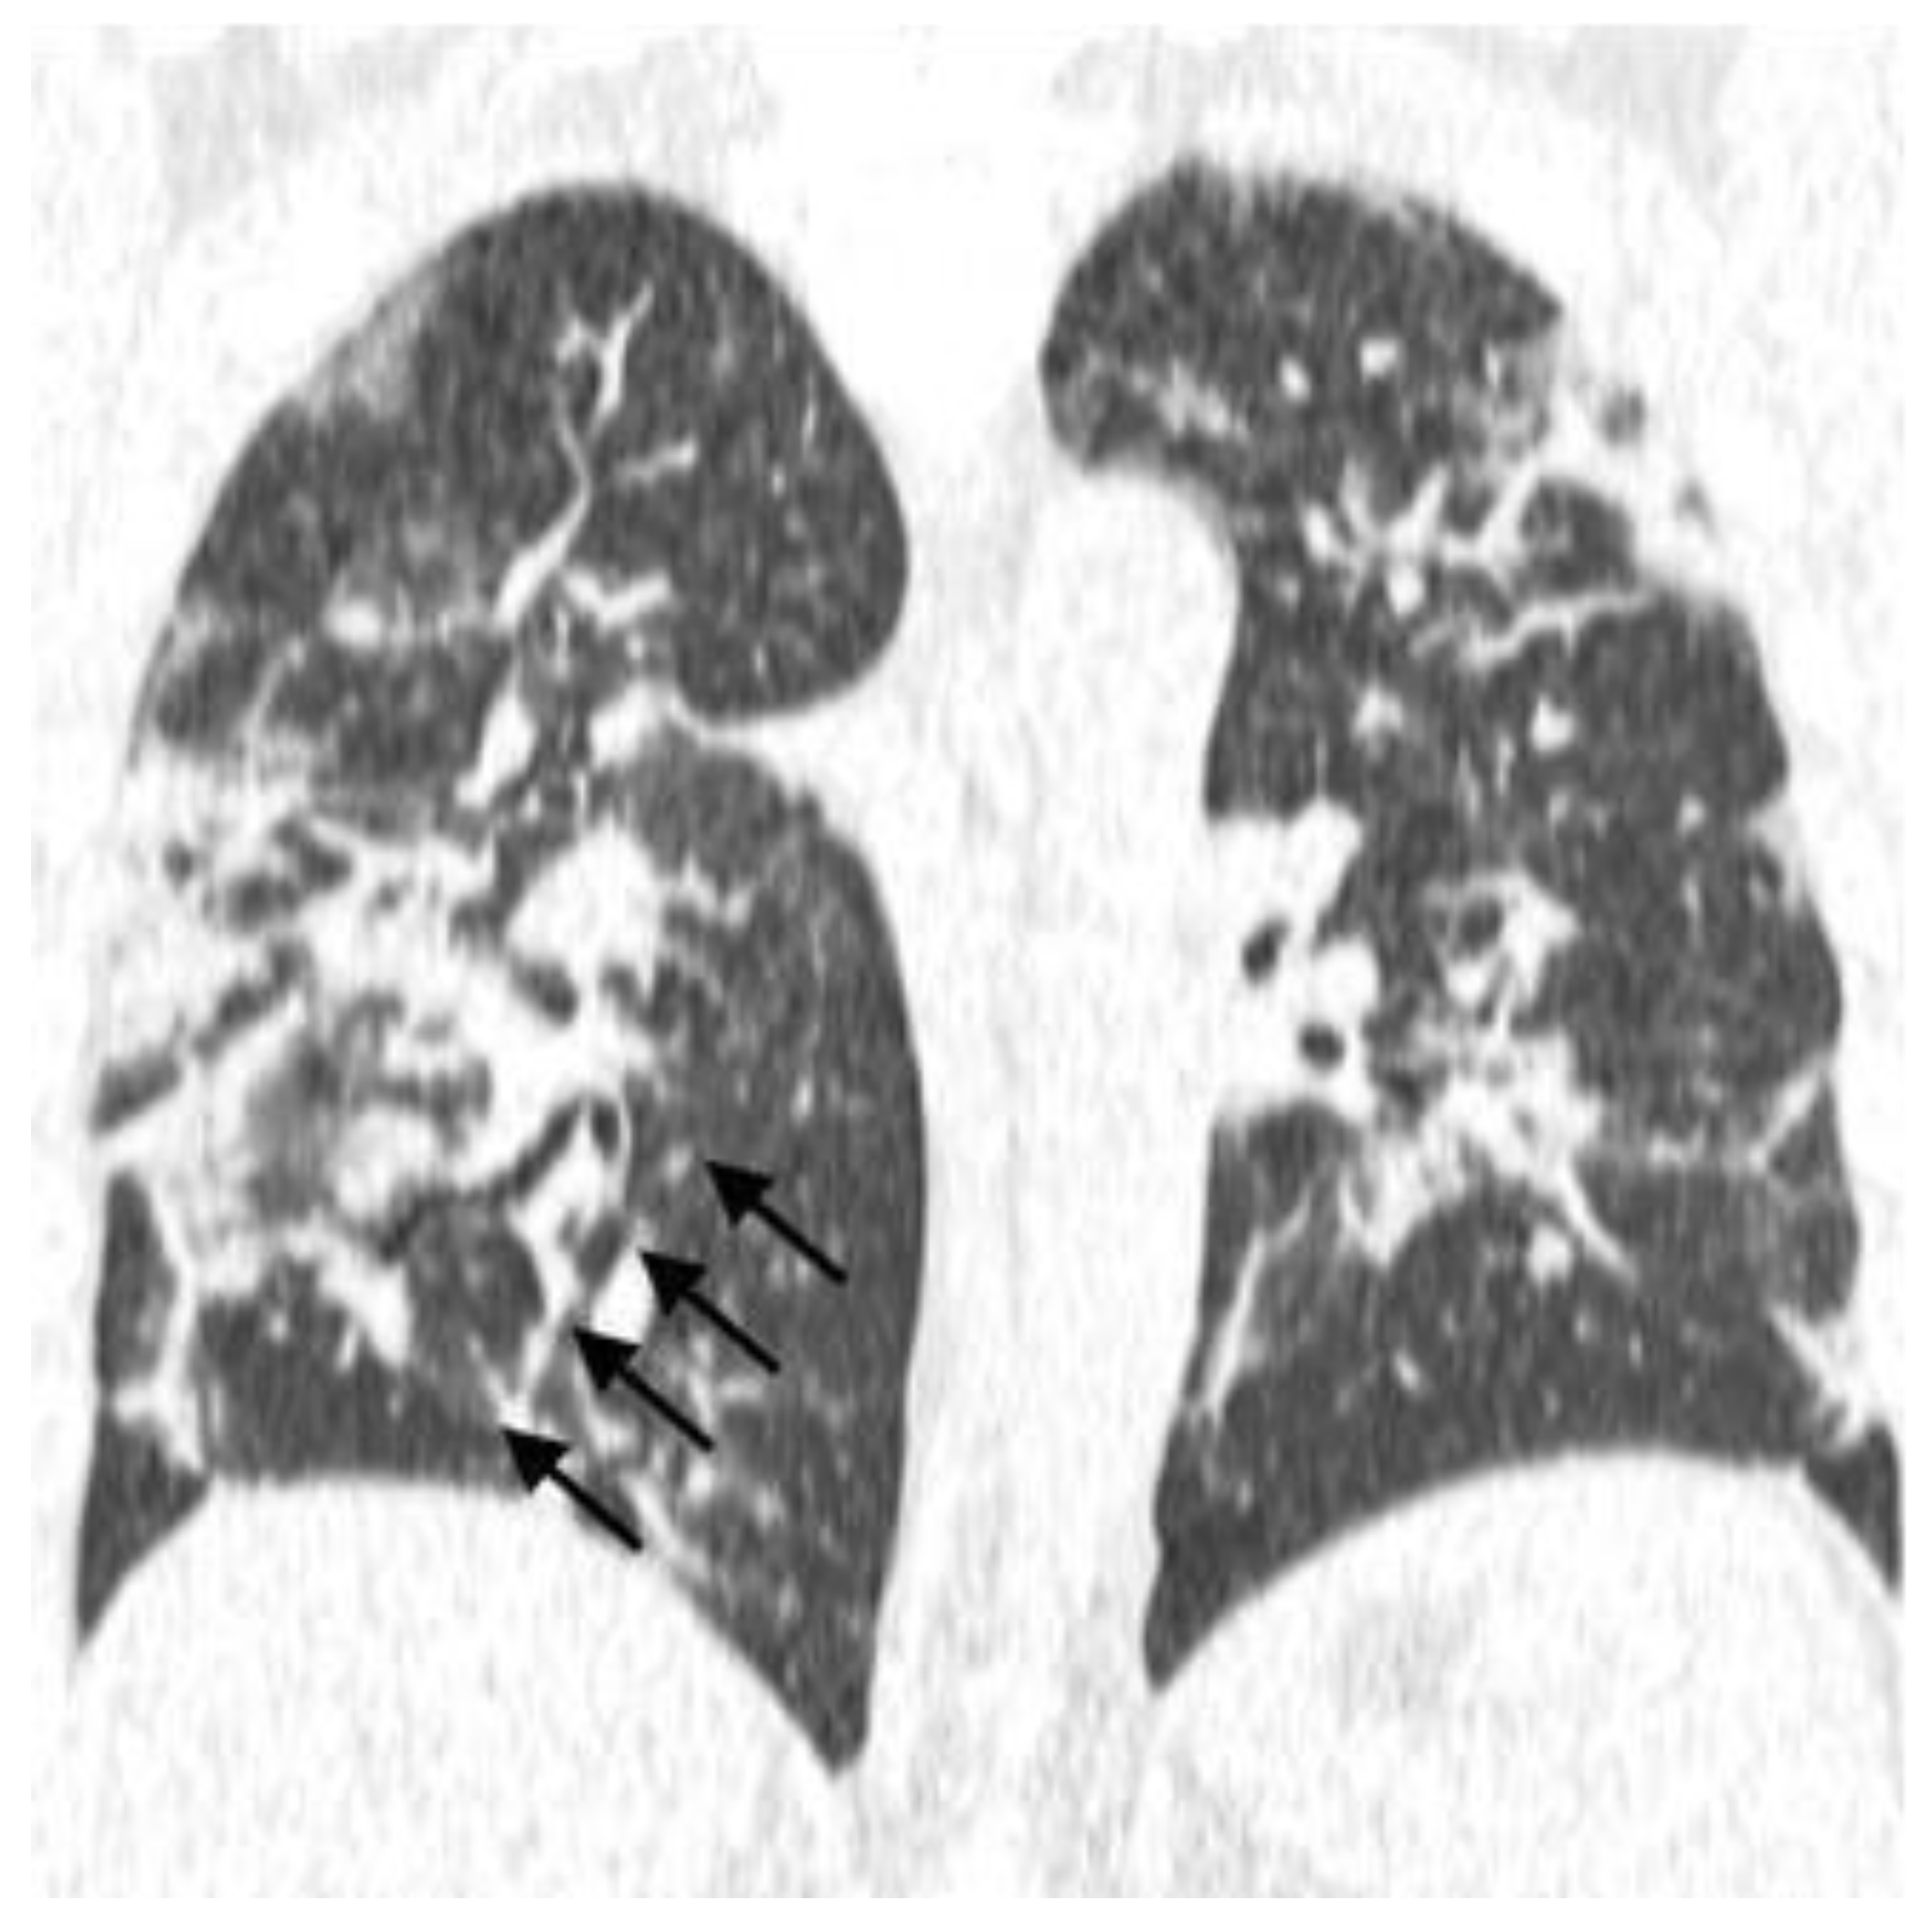
Figure 4.
Mosaic Paving and Consolidations, Male, 48 years old: (a) 10 days after symptom onset. Coronal plane tomographic reconstruction shows a diffuse mosaic paving pattern; (b) 21 days after symptom onset, this patient was admitted to the intensive care unit with a diffuse pattern of consolidations.
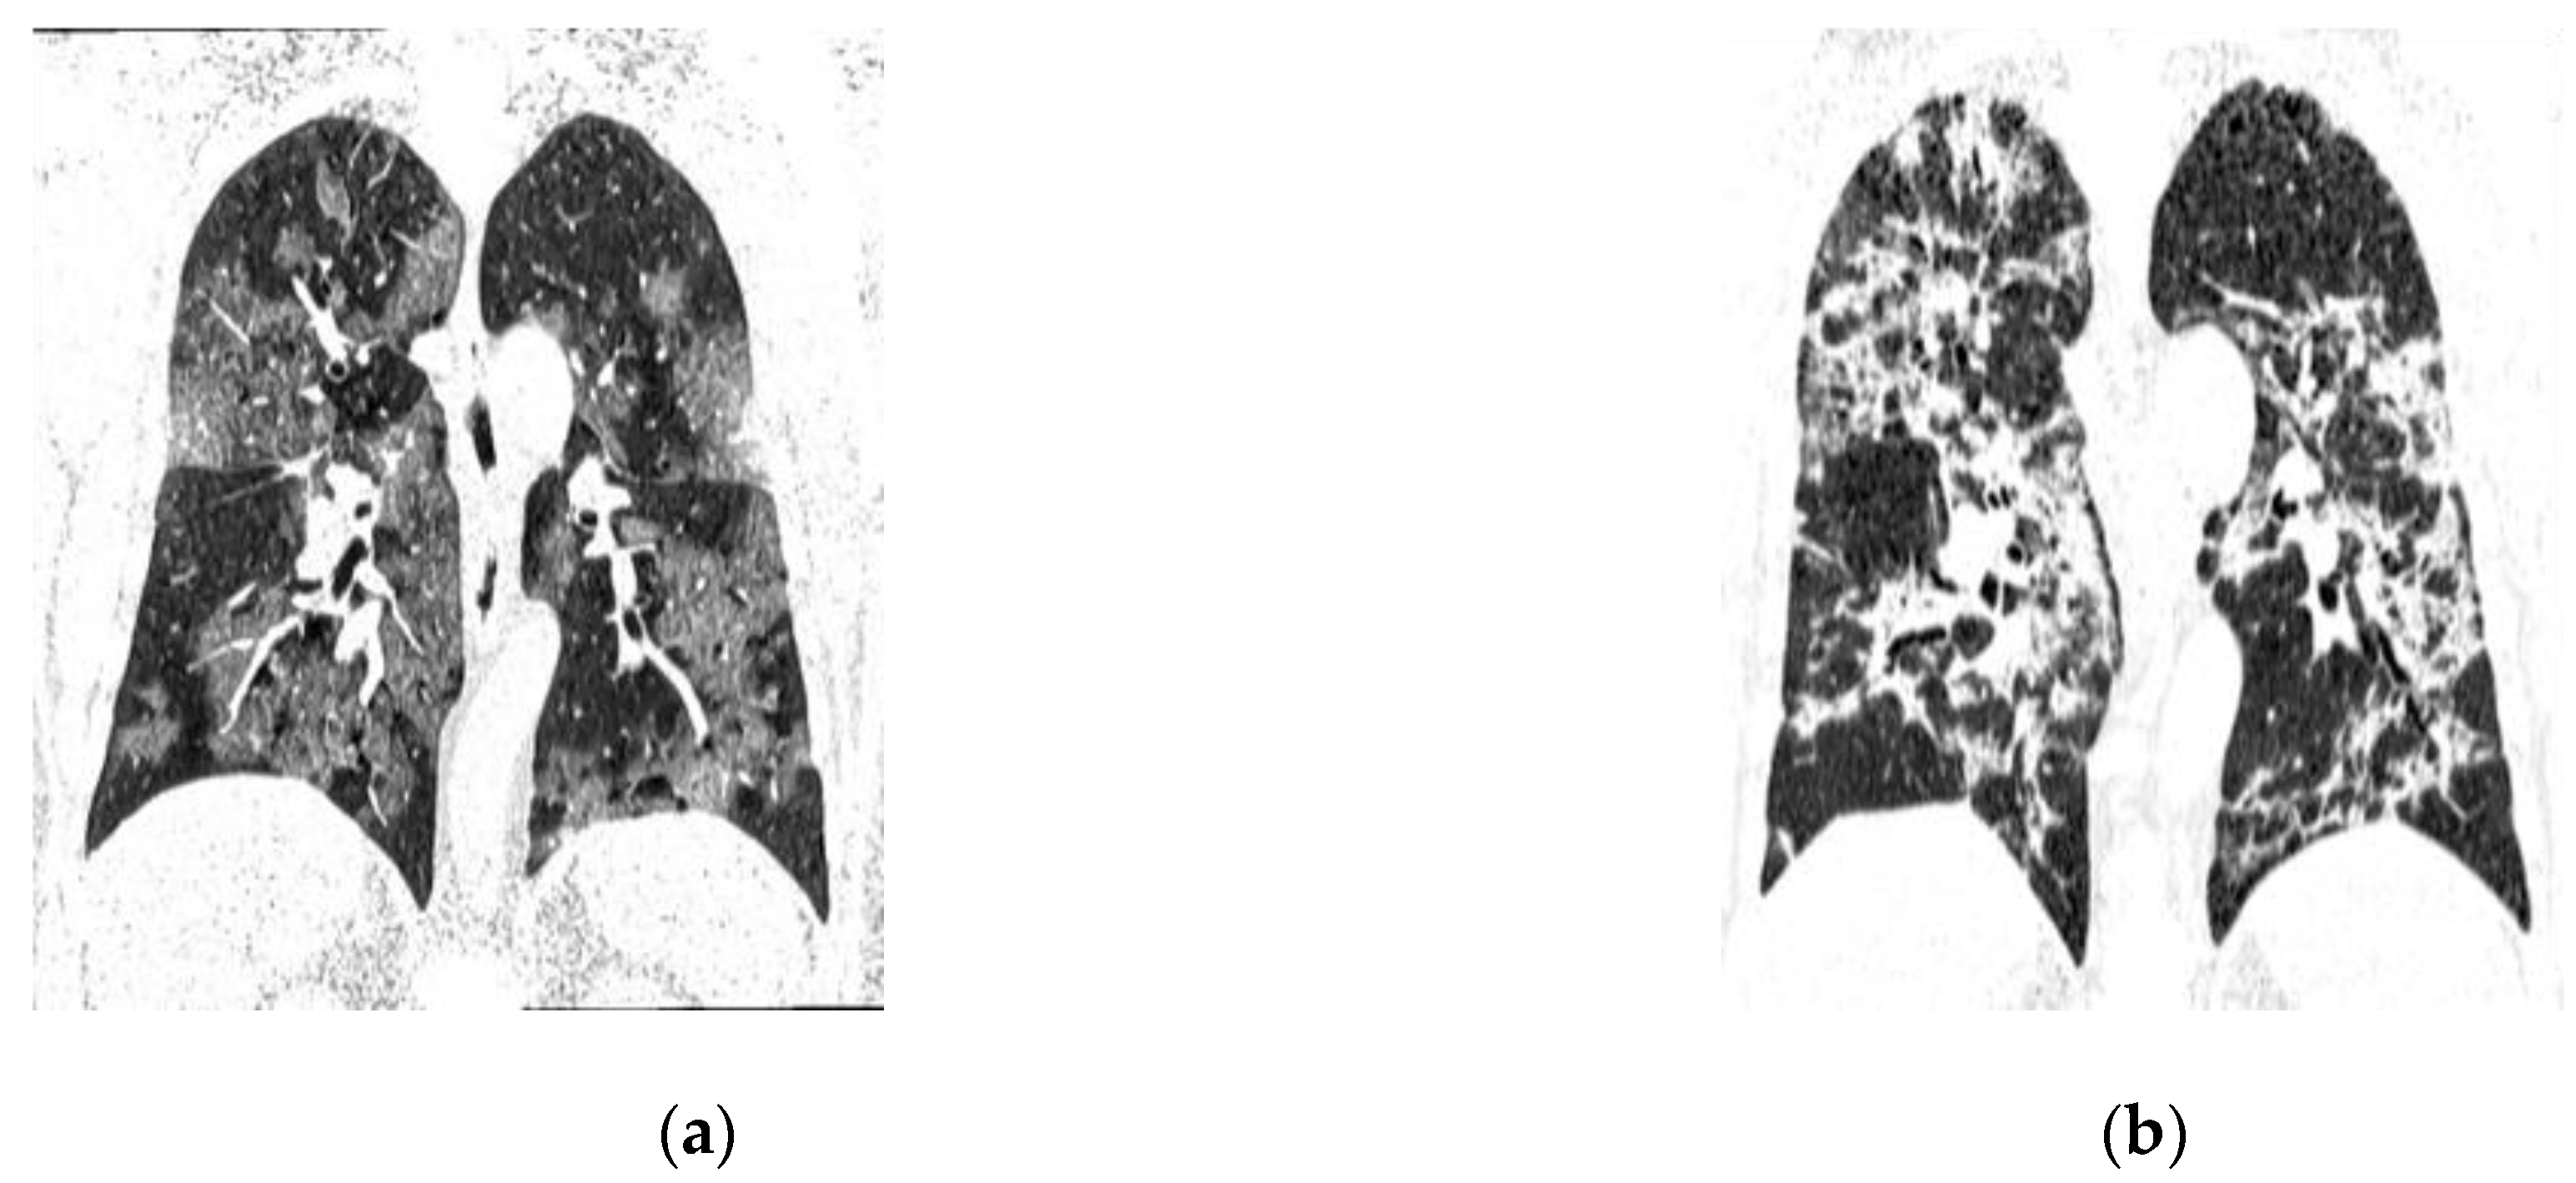
Table 1.
Clinical and COVID-19-Related Variables.
| Variable | Total | Death | Alive | p value | |||
|---|---|---|---|---|---|---|---|
| N | % | n | % | n | % | ||
| Gender | |||||||
| Male | 30 | 40.5 | 6 | 40 | 24 | 40.7 | 0.96 |
| Female | 44 | 59.5 | 9 | 60 | 35 | 59.3 | |
| Age Group | |||||||
| ≥ 60 years | 30 | 41.1 | 12 | 85.7 | 18 | 30.5 | 0.0001 |
| < 60 years | 43 | 58.9 | 2 | 14.3 | 41 | 69.5 | |
| Location | |||||||
| Inpatient | 32 | 43.2 | 6 | 40 | 26 | 44.1 | 0.78 |
| Outpatient | 42 | 56.8 | 9 | 60 | 33 | 55.9 | |
| Comorbidities | |||||||
| Yes | 41 | 55.4 | 14 | 93.3 | 27 | 45.8 | 0.0009 |
| No | 33 | 44.6 | 1 | 6.7 | 32 | 54.2 | |
| Diabetes mellitus | |||||||
| Yes | 12 | 16.2 | 2 | 13.3 | 10 | 16.9 | 0.54 |
| No | 62 | 83.8 | 13 | 86.7 | 49 | 83.1 | |
| Hypertension | |||||||
| Yes | 15 | 20.3 | 5 | 33.3 | 10 | 16.9 | 0.14 |
| No | 59 | 79.7 | 10 | 66.7 | 49 | 83.1 | |
| Obesity | |||||||
| Yes | 2 | 2.7 | 1 | 6.7 | 1 | 1.7 | 0.37 |
| No | 72 | 97.3 | 14 | 93.3 | 58 | 98.3 | |
| Smoking/ex-smoking | |||||||
| Yes | 0 | 0,0 | 0 | 0 | 0 | 0 | NA |
| No | 74 | 100,0 | 15 | 100 | 59 | 100 | |
| Mechanical ventilation | |||||||
| Yes | 5 | 6,8 | 2 | 13,3 | 3 | 5,1 | 0.27 |
| No | 69 | 93,2 | 13 | 86,7 | 56 | 94,9 | |
*Note: χ2 test or Fisher’s exact test. NA: not applicable.
Table 2.
Descriptive Analysis of Age in the Sample.
| Sample | n | mean | SD | Median | IQR | Minimum | Maximum |
|---|---|---|---|---|---|---|---|
| Total | 73 | 54.5 | 17.41 | 54 | 40-67 | 15 | 94 |
| Evolution | |||||||
| Death | 14 | 71.4 | 13.4 | 70 | 63-83 | 48 | 94 |
| Alive | 59 | 50.5 | 15.4 | 50 | 40-62 | 15 | 82 |
*SD: Standard Deviation; IQR: Interquartile Range (Q1-Q3). Student’s t-test for independent samples.
Disclaimer/Publisher’s Note: The statements, opinions and data contained in all publications are solely those of the individual author(s) and contributor(s) and not of MDPI and/or the editor(s). MDPI and/or the editor(s) disclaim responsibility for any injury to people or property resulting from any ideas, methods, instructions or products referred to in the content. |
© 2025 by the authors. Licensee MDPI, Basel, Switzerland. This article is an open access article distributed under the terms and conditions of the Creative Commons Attribution (CC BY) license (http://creativecommons.org/licenses/by/4.0/).
Copyright: This open access article is published under a Creative Commons CC BY 4.0 license, which permit the free download, distribution, and reuse, provided that the author and preprint are cited in any reuse.


