Submitted:
14 March 2025
Posted:
17 March 2025
You are already at the latest version
Abstract
Background: Ginsenoside-CK (G-CK), a bioactive molecule found in Korean Panax ginseng Meyer. According to recent studies, CK exhibits a broad range of pharmacological actions. In this study, we investigated the G-CK's anticancer efficacy using both in-silico and in-vitro approaches. Our investigation predicted that G-CK can suppress kidney and colon cancer by suppressing gene targets such as PHLDA1, PHLDA2, and PHLDA3. Materials & Methods: We performed in-silico investigation and G-CK exhibited a strong affinity for each of the three target proteins' binding sites. We used 150 ns of molecular dynamics (MD) simulations to evaluate G-CK's stability, followed by cytotoxicity assays, RT-PCR, and qRT-PCR validation. Results: Based on its stable and favorable energies, G-CK demonstrated strong binding to the targets, as demonstrated by free energy calculations and MD simulations. Similarly, G-CK reduced the PHLDA gene family's (PHLDA1, PHLDA2, and PHLDA3) mRNA expression in A498, HT-29 cells at 10 μg/mL, as well as normal cells HEK-293 and RAW 264.7, without substantial cytotoxicity. Lastly, G-CK treatments resulted in a significant decrease in PHLDA gene family expression, confirmed by RT-PCR and qRT-PCR results. Conclusion: Thus, we can conclude that G-CK suppresses the expression of PHLDA gene family gene targets, hence regulating kidney and colon cancer.
Keywords:
ginsenoside ck
; cancer
; PHLDA gene family
; cytotoxicity
; kidney cancer
; colon cancer
1. Introduction
Kidney cancer comprises up 5% of all cancer cases and is the sixth most prevalent cancer in men. Renal cell carcinoma (RCC) is the cause of over 90% of cases of kidney cancer, with clear cell RCC accounting for more than 70% of occurrences [1]. Furthermore, it is the tenth most common female cancer and accounts for 3% of all cancers [2]. Moreover, Colon cancer is the most frequent form of gastrointestinal cancer. The second most fatal cancer overall for both sexes and the third most common diagnosis is colorectal cancer (CRC). CRC has significant environmental connections (including diet), inflammatory diseases of the digestive tract, and genetic risk factors [3]. So, kidney and colon cancer are becoming more prevalent in the modern world.
To enhance cancer patient survival with minimal side effects, novel therapeutic techniques are urgently needed. Natural products are crucial in cancer prevention and therapy due to their efficacy, safety, and cost-effectiveness [4]. Ginseng from the Araliaceae family, specifically Panax ginseng, is a naturally occurring medicinal herb with promise for therapeutic use. Panax ginseng is a prominent natural medicinal herb in East Asian countries like China, Korea, and Japan [5]. Ginseng mostly consists of ginsenosides, which are aglycones with dammarane skeletons [6]. Ginseng's anti-inflammatory, anti-cancer, anti-apoptotic, cardiovascular disease, autoimmune disorders, and other effects are mostly attributed to its more than 150 known ginsenosides [7,8]. P. ginseng and its metabolites (CK, F1, G-Rh1, Rh2, and Rh3) have been studied for their potential to prevent cancer in several types of cancers, including those of the breast, colon, prostate, stomach, and lung [9,10,11].
Some rare ginsenosides that are either absent or present in low amounts in natural ginseng are CK, Rg3, F2, and Rh2. Although its metabolite, CK, is widely acknowledged to be more readily absorbed by the body than ginsenosides, CK has rapidly become recognized as a minor tetracyclic triterpenoid, often referred to as IH901, CK, and M1. Protopanaxadiol-20(S)-glucopyranosyl [12]. Compound K was extracted from saponins like Rc, Rb1, and Rb2 via a variety of biotransformation techniques because it is absent from natural ginseng [13].
Transformation studies have focused on G-CK, a key metabolite generated from PPD-type ginsenosides, to increase their biological activity and potency [14]. The numerous procedures (Figure 2) employed for G-CK production include enzymatic transformation, microbial transformation, heating, and metabolic engineering [15].
Figure 1.
The transformation method for major ginsenosides into minor ginsenosides.
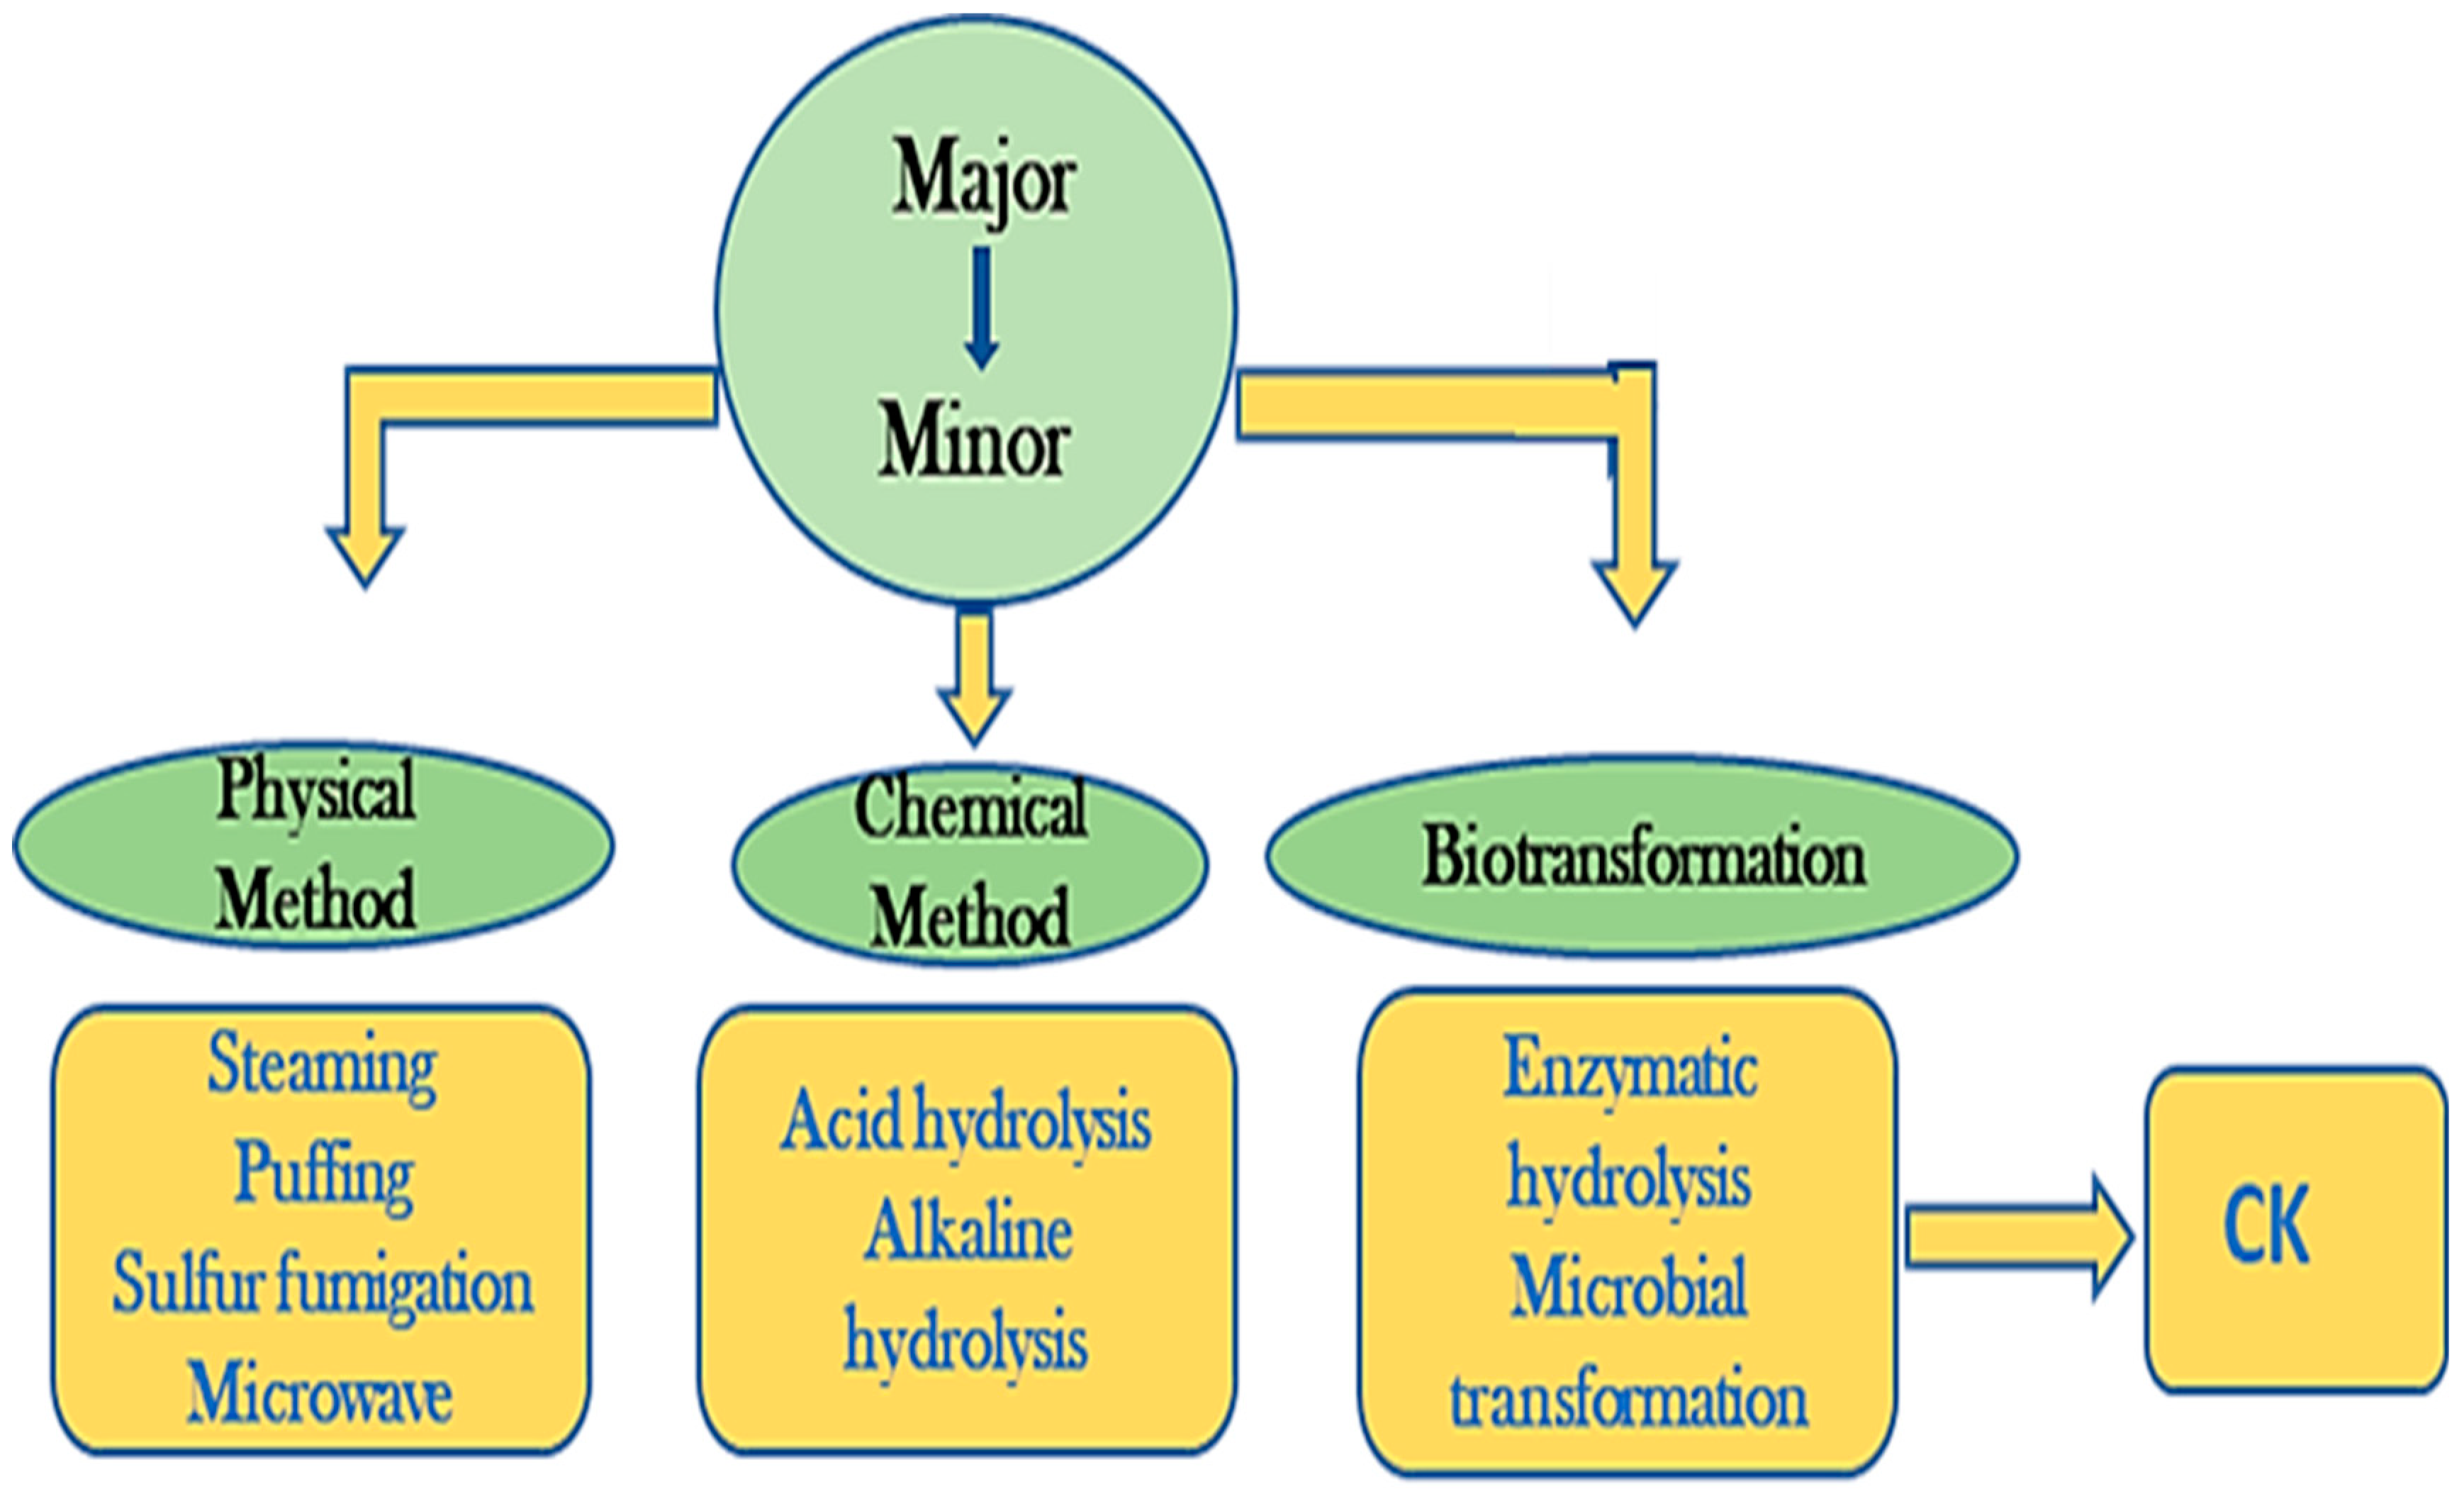
Figure 2.
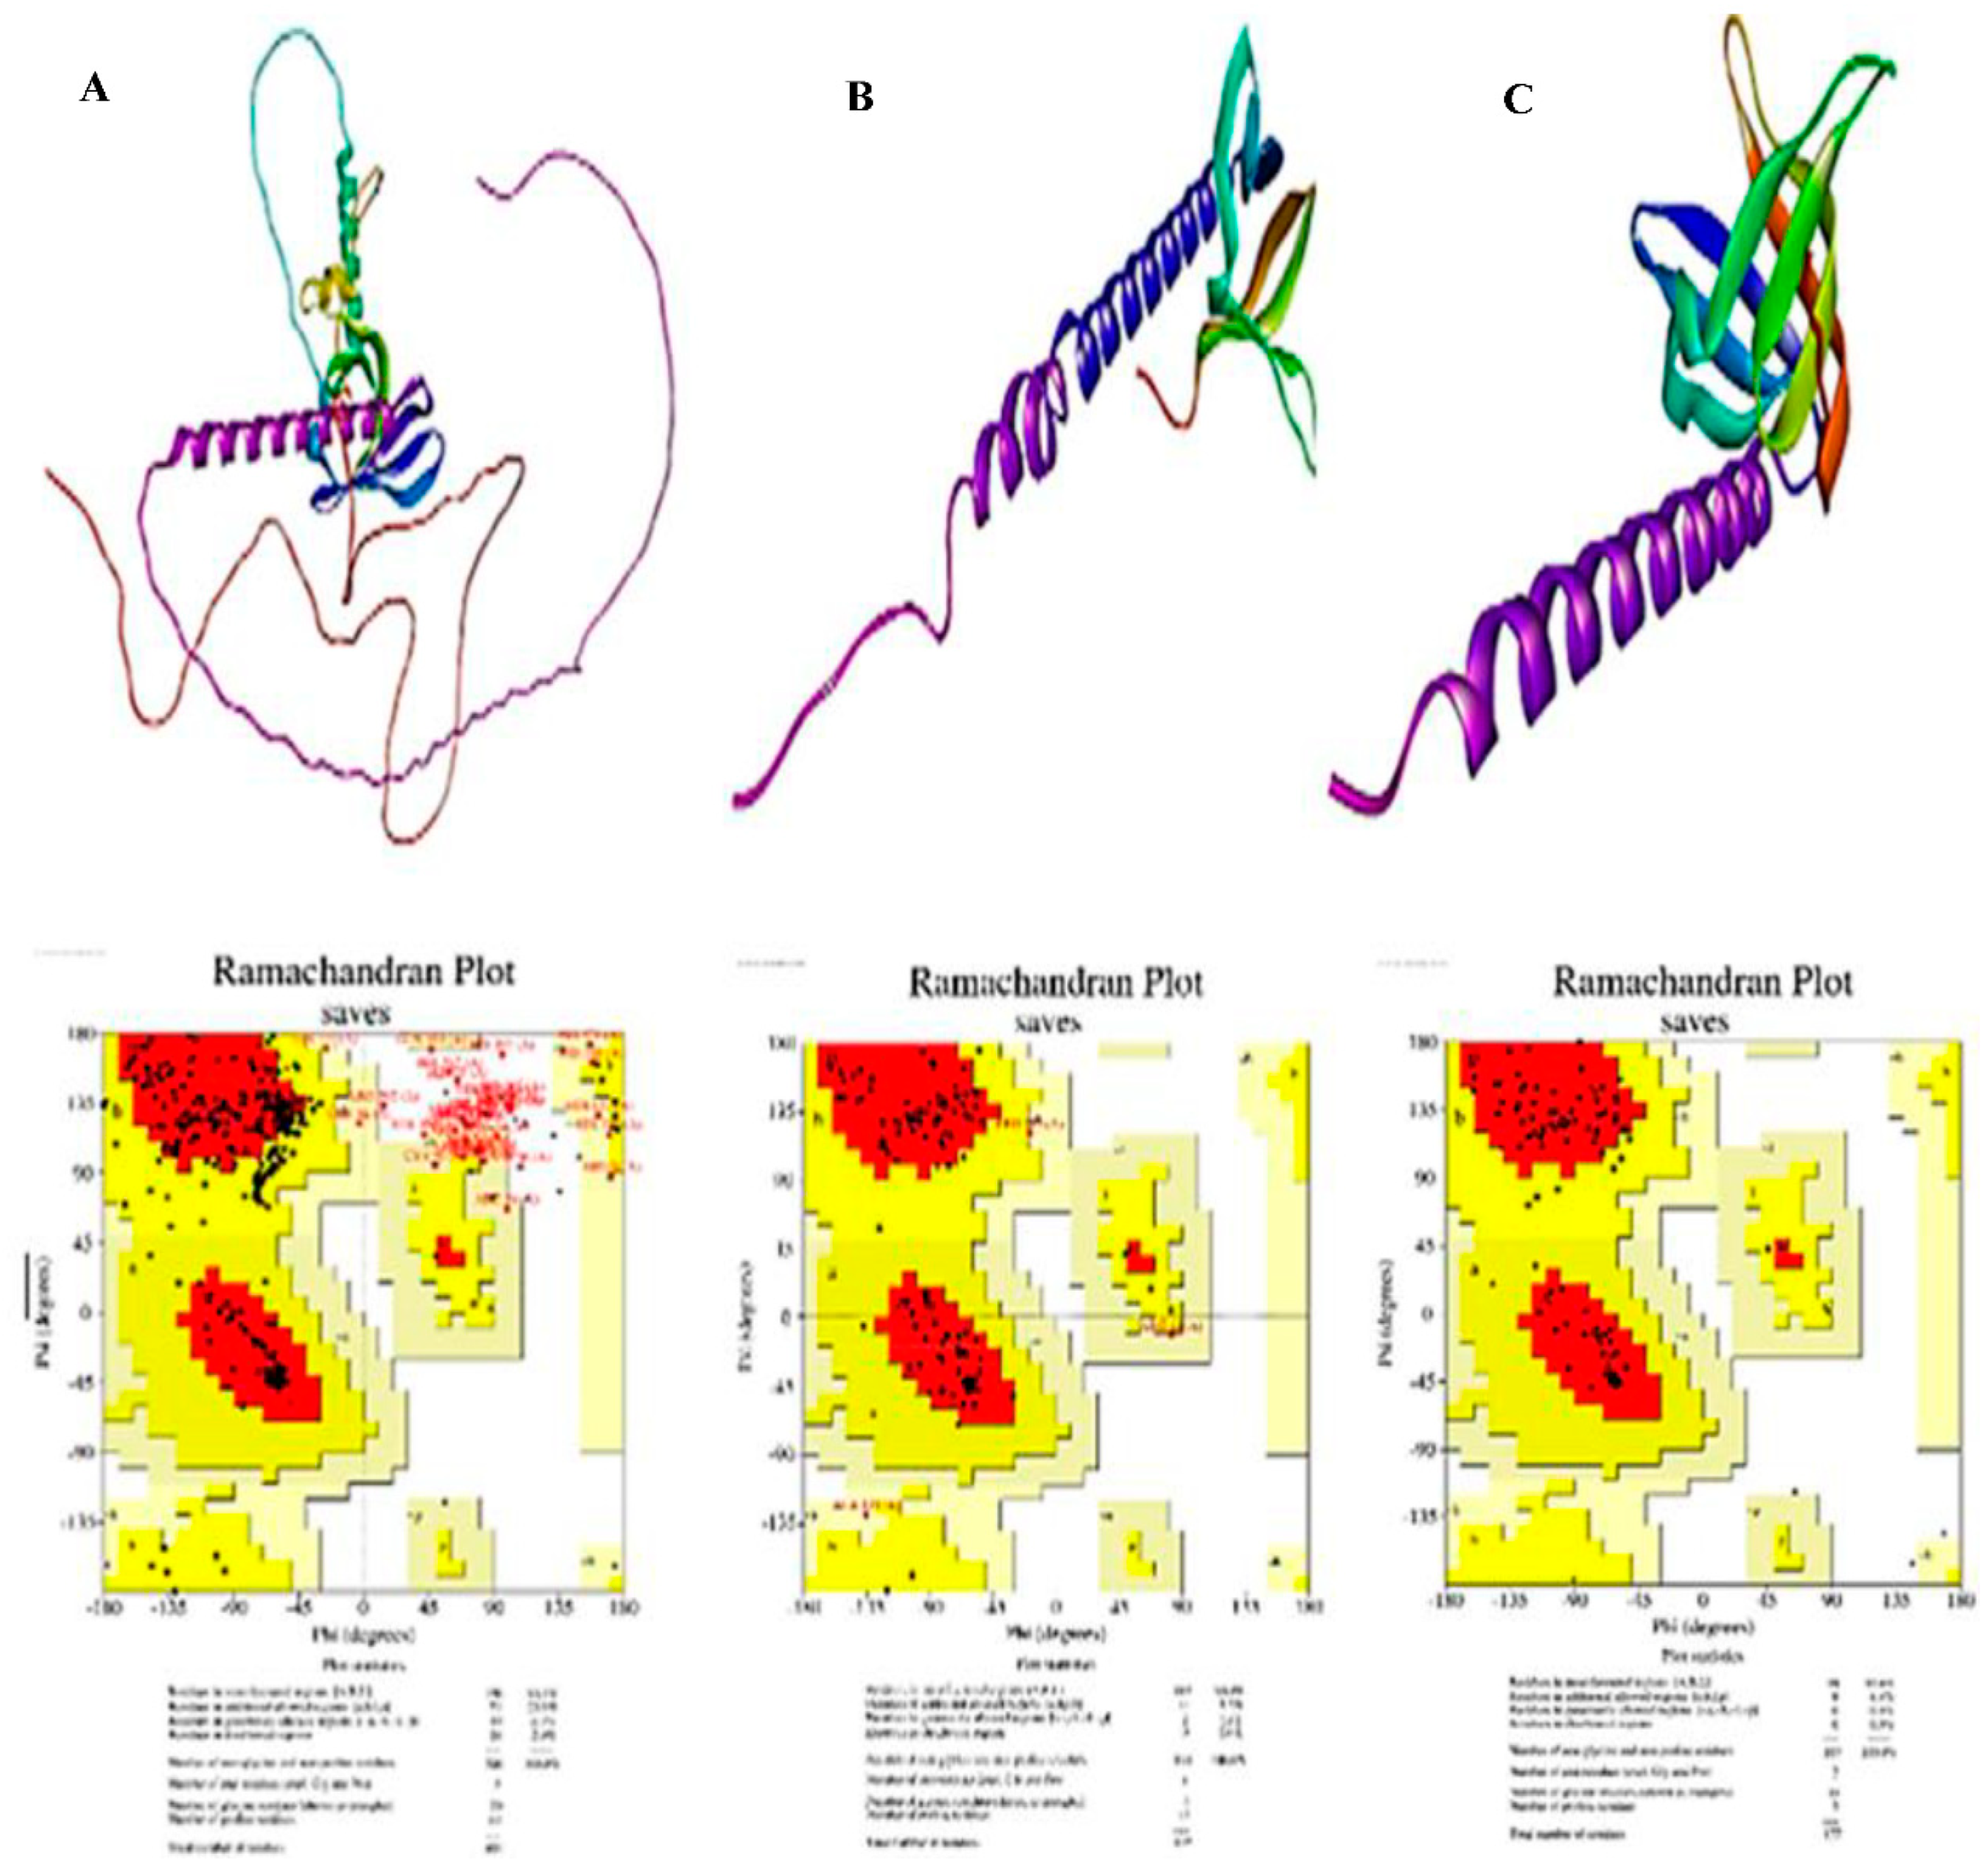
3D structure prediction and validation of PHLDA1, PHLDA2, PHLDA3 using Swiss model and Ramachandran plot. (A) 3D structure prediction of PHLDA1 by Swiss model and validation analysis using Ramachandran plot server. (B) 3D structure prediction of PHLDA2 by Swiss model and validation analysis using Ramachandran plot server. (C) 3D structure prediction of PHLDA3 by Swiss model and validation analysis using Ramachandran plot server.
Figure 2.
3D structure prediction and validation of PHLDA1, PHLDA2, PHLDA3 using Swiss model and Ramachandran plot. (A) 3D structure prediction of PHLDA1 by Swiss model and validation analysis using Ramachandran plot server. (B) 3D structure prediction of PHLDA2 by Swiss model and validation analysis using Ramachandran plot server. (C) 3D structure prediction of PHLDA3 by Swiss model and validation analysis using Ramachandran plot server.
The pleckstrin homology-like domain A (PHLDA) gene family is substantially expressed in both kidney and colon malignancies, according to our earlier in-silico investigation [11]. The PH domain is present in the multifunctional PHLDA protein. It exhibits strong in vitro selectivity when binding to the phosphorylated head group of phosphatidylinositol 4, 5-bisphosphate (PtdI (4,5) P2) lipids [16]. PHLDA1, PHLDA2, and PHLDA3 are the three members of the PHLDA gene family. PHLDA genes are implicated in a number of cellular processes that contribute to cancer, such as Akt activation suppression, growth factor signaling reduction, EGFR/ErbB2 signaling cell negative feedback inhibition, and mortality [11]. Sakthianandeswaren, however, found that PHLDA1 expression is linked to the high metastatic potential of osteosarcoma cells and plays a role in the formation of intestinal carcinomas [17]. During normal development, PHLDA2 is the first apoptosis-related gene that is expressed exclusively from the maternal allele through imprinting [18]. Breast cancer invasion and growth may be inhibited by PHLDA2 knockdown [19]. But Lei et al. also found that PHLDA3 may promote lung cancer cell invasion and multiplication by turning on the Wnt signaling pathway. When considered collectively, the data suggest that PHLDA family members might perform various roles in various tumor tissues and cell types, with the tumor cells and surrounding conditions dictating specific effects [16].
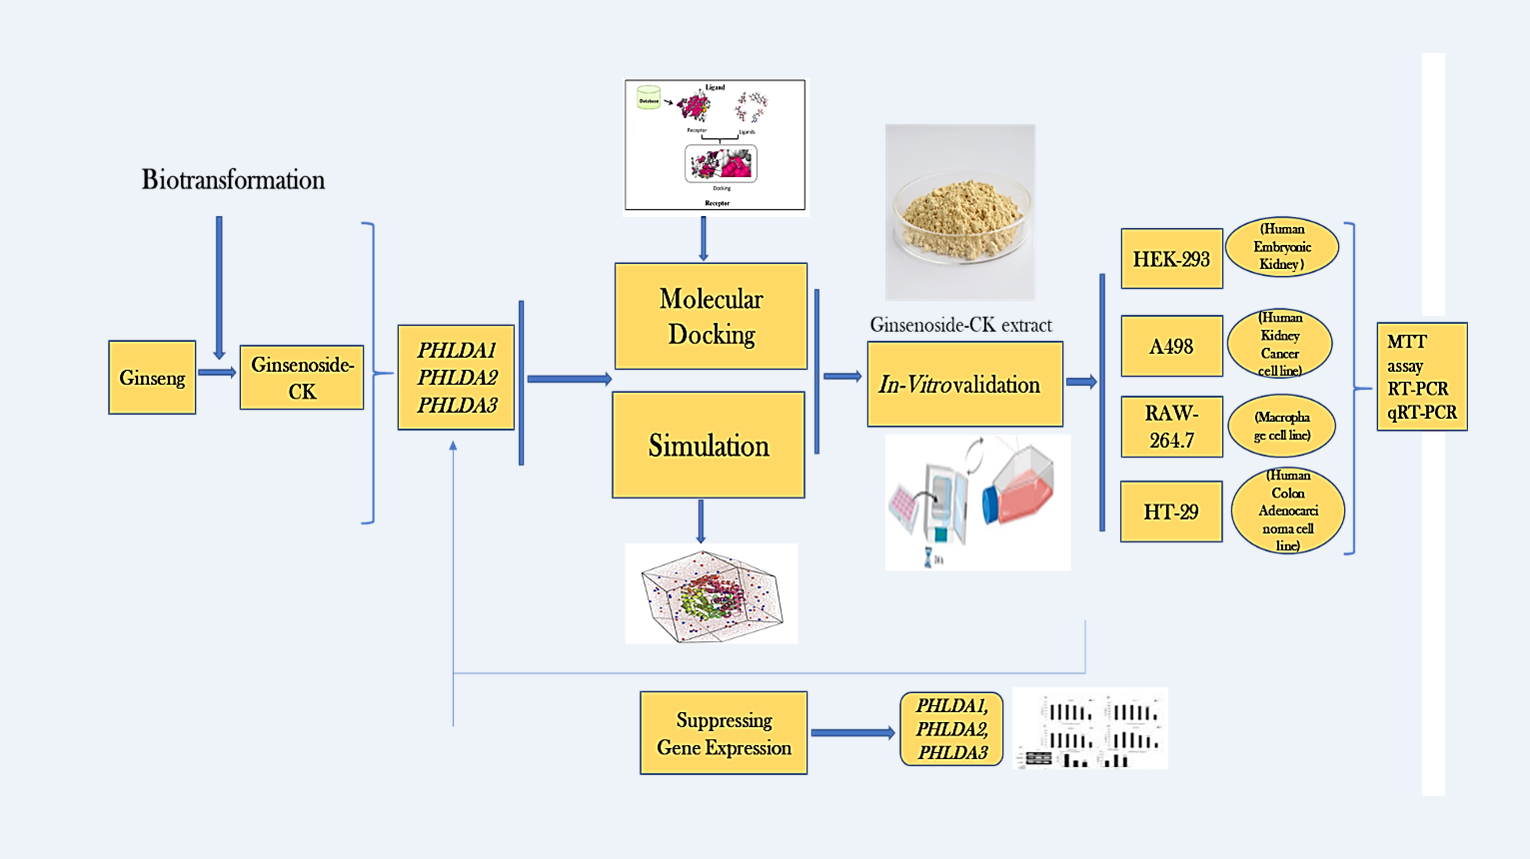
To produce natural products as drugs, it is essential to understand the molecular interactions between G-CK and bio-macromolecules. Through the use of in-silico techniques including molecular docking, pharmacophore modeling, chemoinformatics, molecular dynamics, and computer-aided drug design (CADD) improves and refines treatment possibilities derived from natural sources [20]. Our in-silico studies predict that the G-CK molecule may suppress cancer-causing gene targets, PHLDA1, PHLDA2, and PHLDA3, which regulate kidney and colon cancer. Although G-CK has numerous health benefits, the exact mechanism of action for kidney and colon cancer needs further research. The current study explored into G-CK's possible inhibitory effects on the PHLDA gene family. The study suggests that G-CK could be an effective treatment for kidney and colon cancers.
2. Materials and Methods
2.1. Ligand and Protein Preparation
We select P. ginseng's triterpenoid saponin, G-CK, for the current investigation. G-CK's three-dimensional chemical structure was obtained from the PubChem database. Using Autodock tools, the ligand molecules had further processing, and were transformed into the necessary pdb-qt format [21]. First, we retrieved the protein symbols of PHLDA1, PHLDA2, and PHLDA3 from the Genecards.org online database and then selected the protein sequence from the Universal Protein Resource (Uniport.org) database. Finally, predict the protein structure from the Swiss model [22] by using the protein sequence. And the structure was validated by (Table.1) Ramachandran Plot [23]. We retrieved each protein structure from the human database (Figure 2. A-C). We selected protein structures mostly using the X-ray diffraction experimental method and refinement resolutions ranging from 1.5 to 2.5. The complex structure was removed of cofactors, water molecules, and metal ions to produce the proteins. To create the proteins, the complex structure has been stripped of cofactors, water molecules, and metal ions. The PDBQT file format was utilized for additional screening of such results. Besides, the 3D structures of the active components were obtained using the database of PubChem (https://pubchem.ncbi.nlm.nih.gov/, retrieved on February 14–20, 2024) [24]. Eventually, the download format provided was SDF files.
2.2. Grid Box Adjust and Binding Site Identification
Binding sites were found by analyzing pockets of known protein-ligand interactions. Protein binding sites were investigated using BIOVIA Discovery Studio Visualizer v19.1 (BIOVIA), and protein structures were evaluated using PDB and CASTp (http://sts.bioe.uic.edu/castp/, available 14–20 February 2024) to extract known and unknown active sites of the protein structures [25,26]. Using the virtual screening tool PyRx—Python Prescription 0.8—binding sites were identified from the complex structure and the receptor grid was generated by molecular docking [27].
2.3. Molecular Docking Simulation
The PyRx v0.8 tool was utilized to perform a molecular docking simulation in order to identify the most compatible candidates with the target proteins [28]. AutoDock Vina and AutoDock v4 are available for comparison with a physiologically focused macromolecule on a large dataset using the open-source PyRx computational screening software. The AutoDock Vina Wizard v4 configuration comes with PyRx v0.8 [29], which simulates molecular docking. As compared to other compounds, the top compounds have the highest binding affinity (kcal/mol) to the target protein. In final stages, receptor grids with the default configuration were created.
2.4. Chemical Reagents for In-Vitro Investigations
The experiment included four distinct cell lines: the kidney cancer cell line (A498) cell line, the normal kidney cell line (HEK293) cell line, the human colorectal adenocarcinoma (HT-29) cell line, and the normal murine macrophage (RAW 264.7) cell line. The Korean Cell Line Bank (KCLB, South Korea) was the source of all the cell lines. Each of the other cell lines (Raw 264.7, HT-29) were cultivated in media containing dimethyl ether (DMEM), whereas the HEK293 and A498 cell lines were grown in minimal essential medium (MEM). Furthermore, vitamins and antibiotics in the form of penicillin-streptomycin and fetal bovine serum are added to the media. Gyeongsan-si, South Korea's Welgene Inc. provided the medium and serum. Suwon, Korea: MTT solution, also known as 3-(4, 5-dimethylthiazol-2-yl)-2, 5-diphenyltetrazolium bromide, is a product of Life Technologies. Each reagent is analytical grade, and used exactly as provided.
2.5. Preparation of Sample Extract
Ginsenoside Compound K (G-CK) is becoming more well-known due to its medicinal and biological qualities. Ginsenoside CK is a ginsenoside found in Panax species. G-CK obtained from Kyung Hee University's Hanbang Bio Laboratory in South Korea, bought from Chengdu Must Biotechnology Co., Ltd, and used in a powder form. The powder was dissolved in water. In the A498, HT-29 cell lines, the CK exhibits more cellular absorption. G-CK is one of the most significant among other ginsenosides due to its high uptake and absorption rate.
2.6. In-Vitro Cytotoxicity
In general, human kidney cancer cells (A498) were grown in 89% minimum essential medium (MEM) with 10% inactivated FBS and 1% penicillin-streptomycin, while normal kidney cells (HEK-293) were cultured in 89% MEM with 1% penicillin-streptomycin, and 10% FBS. Human colon cancer cells (HT-29) with murine macrophages (Raw 264.7) cells were cultured in Dulbecco's Modified Eagle's Medium (DMEM) supplemented with 10% inactivated FBS and 1% penicillin-streptomycin. All cell lines were allowed to adhere and grow for 24 hours in a 37 °C humidified incubator with 5% CO2 before being sampled.
The same amounts of penicillin-streptomycin and FBS were used to cultivate different cultures of human normal kidney (HEK-293) cell lines in round Petri dishes [1,30]. Additionally, in a 75-T flask containing the same volume of antibiotics and serum, murine macrophages (RAW 264.7), the human kidney cancer cell line (A498), and the colorectal adenocarcinoma (HT-29) cell lines were cultured. After trypsinization, each cell line was seeded at a density of 1 × 10⁴ cells/well into 96-well plates. The plates were then allowed to grow in a humidified incubator at 37 °C with 5% CO2. Upon reaching 80% confluence, distinct doses of G-CK were administered to each cell line (5, 10, 20, and 40) μg/mL and 10 μg/mL of cisplatin as a positive control. After a 24-hour incubation period, 20 μL of MTT solution (5 mg/mL in PBS; Life Technologies, Eugene, OR, USA) was added to both the treated cells and the control group. Within the living cells, the MTT reagent transformed into a purple-colored crystal formazan. After adding 100 µL of DMSO to the cells to dissolve the crystal formazan, an Enzyme-Linked Immunosorbent Assay (ELISA) reader (Bio-Tek, Instruments, Inc., Winooski, VT, USA) calibrated to operate at 570 nm was used to measure the vitality of the cells.
2.7. In-Vitro Validation by Reverse Transcription Polymerase Chain Reaction (RT-PCR)
After the G-CK treatment, lysis reagent (QIAzol, from QIAGEN, Hermantown, MD, USA) was used to extract the total RNA from A498 and HT-29 cells. We used primer, purified nuclease-free water, buffer mixture, and 20 µL of RT-PCR premix (amfiivert, GenDepot, Barker, TX, USA) for the RT-PCR technique. The primers indicated in Table 1 were utilized for RT-PCR. The RT-PCR was conducted for 38 cycles, with 30 s for primer annealing, 30 s for denature, and 50 s for elongation at 95 ◦C and 60 ◦C, respectively. Finally, we used 1% agarose gel electrophoresis to visualize the RT-PCR results, and a UV chamber was used to take an image.
2.8. Real-Time Quantitative Reverse Transcription PCR (qRT-PCR) Assay Validation
For qRT-PCR, SYBR TOPreal qPCR2X Premix (Enzynomics, Daejeon, Republic of Korea) was used. There were three duplicates and a 20 µL volume in the qRT-PCR assay. This contained 10 µL of TOPreal qPCR2X master Premix, 1 µL of each primer listed in the RT-PCR section, 1 µL of cDNA template, and the remaining nuclease-free water. The qRT-PCR was conducted under the following conditions: 95 °C for five minutes; 38 cycles of 95 °C for ten seconds and 55–60 °C for forty-five seconds; and finally, 15 seconds at 72 °C. By utilizing the comparative 2−∆∆Ct approach, we computed and normalized expression from the GAPDH gene expression. All qRT-PCR investigations were performed using the aCFX Connect Real-Time PCR (Bio-Rad, Hercules, CA, USA).
2.9. Statistical Analysis
The experiments were carried out three times independently, with three technical replicates of each sample examined. The experimental data is shown as mean ± SEM. The data were statistically analyzed using Student's t-test with equal variances. Statistical significance is indicated by more asterisks (* p < 0.05, ** p < 0.01, and *** p < 0.001) and hash markers (# p < 0.05, ## p < 0.01, and ### p < 0.001). The hash mark (#) denotes significant differences between the stimulated and normal controls, and the asterisk (*) denotes significant changes within the stimulation groups.
3. Results
3.1. Disease and Gene Targets from the Previous Study
The gene family of PHLDA (PHLDA1, PHLDA2, and PHLDA3) was shown to be overexpressed in patients with colon and kidney cancer in our earlier in-silico investigation [31]. Moreover, G-CK also has efficacy against kidney and colon cancer [32,33]. We thus want to investigate whether G-CK can inhibit the expression of genes corresponding to the PHLDA family. In this study, we carried out further in-silico (Figure 3. A-C) and in-vitro validation to assess G-CK's effectiveness in suppressing the expression of the PHLDA gene family in kidney and colon cancer.
3.2. Investigation of Free-Binding Energy of CK and PHLDA Gene Family
The binding energies were calculated using the VSGB solvation model with the Schrödinger software's (2023-3) Glide module. The free binding energies of docked protein-ligand complexes demonstrate their thermodynamic stability. It is a key characteristic that evaluates ligands' bioactivity. The vital active site residues were kept in a flexible state when levofloxacin was utilized as a control drug. The formation of hydrogen bonds and the binding energy to the required active residues and ligands validated the interaction's outcomes. The studies (Table 2) revealed that the average energy of the PHLDA1-G-CK complex was higher than that of the PHLDA1-Levofloxacin (-5.7 kcal/mol). Similarly, the average energy of the PHLDA2-G-CK complex (-7.3 kcal/mol) was found to be higher than that of the PHLDA2-Levofloxacin (-5.7 kcal/mol). This suggests that G-CK and the receptor are well bound. PHLDA3-G-CK has a lower binding energy (-6.8 kcal/mol) compared to PHLDA3-Levofloxacin (-6.0 kcal/mol). According to this finding, the PHLDA1-G-CK, PHLDA2-G-CK, and PHLDA3-G-CK exhibited greater thermodynamic stability in comparison to the Levofloxacin control.
3.3. In-Silico Molecular Dynamic (MD) Simulation of CK and PHLDA Gene Family
The molecular interactions between G-CK and the PHLDA gene family have been examined using molecular docking. To confirm the stability of the protein structure across the 150 ns simulation, we calculated the RMSDs (root-mean-square deviations) of C α atoms of complexes between G-CK and the three gene targets as, PHLDA1, PHLDA2, and PHLDA3 (Figure 4. A). For PHLDA1, make stable complex with CK after 75ns, and PHLDA2 and PHLDA3 genes make stable complex with CK after 25ns. For PHLDA1, after 75ns the complex (PHLDA1 and CK) is stable, and the RMSD value is 28.121 Å, following that, the average highest, and lowest RMSD were 29.18 Å, 30.932 Å, and 28.121 Å, respectively, as indicated by the results (Figure 4. A) the fluctuation rate is very low as showed 2.811 Å. After 25 ns, the complex for PHLDA2 and CK is stable; minimum, average and maximum RMSD values were ascertained to be 17.529 Å, 17.13 Å, and 18.656 Å, respectively. On average, the fluctuation rate was quite low (1.526 Å). The findings indicated that the mean, lowest, and maximum RMSDs for the complex of PHLDA3 and CK, 4.607 Å, 2.593 Å, and 5.918 Å, respectively. Here, there is also very little fluctuation rate (1.311Å).
The root mean square fluctuation, or RMSF, values are obtained by averaging the fluctuations of the positions of each residue. These values are then used to assess the flexibility and mobility of proteins during simulation (Figure 4.B). The RMSF value is used to quantify changes in amino acid (AA) residues within proteins. Their high RMSF value indicates the degree of stability and variation of amino acid residues in a compound-protein complex system. For PHLDA1, showed 400 residues, makes stable complex with CK, except only 5 amino acids residues (THR_69, LEU_163, GLY_206, SER_360, and GLY_390). For PHLDA2, showed around 150 residue that made stable complex with G-CK, except only 3 amino acids residues (LYS_63, GLY_80, THR_117) and PHLDA3 genes, showed around 150 residue that made stable complex with G-CK. Thus, we found that G-CK complexes with the gene targets (PHLDA gene family) were stable in this instance. In addition, rGyr, SASA [34], and protein-ligand contact from the MD simulation trajectory were analyzed for stable protein–ligand complexes. The radius of gyration (rGyr) and SASA exhibited good stability, and their results confirmed the stability of all three complexes (Figure 4. C-D). By using the rGyr, the total effect of the ligands on the protein is investigated. The rGyr is calculated for each complex, as Figure 4.C illustrates. It was found that the rGyr values for PHLDA1, PHLDA2 and PHLDA3 genes, after 70ns showed stable rGyr value, that indicated stable complex with G-CK. Following 150 ns, the calculated average SASA value for PHLDA1 and PHLDA3 revealed a consistent SASA value, indicating a stable complex with G-CK. PHLDA2 showed a consistent SASA value after 50 ns, indicating a stable complex with CK (Figure 4. D). Additionally, all protein-ligand complexes were investigated (Figure 5. A-D). There, we found water bridge bonds, hydrogen bonds, ionic bonds, and non-covalent bonds. So, G-CK can effectively interact with the PHLDA gene family, according to the MD simulation research.
3.4. In-Vitro Cytotoxic Effect of G-CK
Deregulation of cellular energetics has been included in a compilation of new cancer hallmarks. Natural bioactive compounds could be used to generate drugs for curing a variety of diseases. Specifically, it has been demonstrated that several ginsenosides have pharmacological effects, including anticancer characteristics [35,36]. One of these, Rh1, has been demonstrated to inhibit various cancers, including lung cancer [37], colorectal cancer [38], and bladder cancer [39]. From Rh1, we get compound K as a bioconversion product. In this work, we examined the cytotoxicity of G-CK at different concentrations (5, 10, 20, 40 µg/mL) during a 24-h period on human kidney (HEK-293) cells, murine macrophage (RAW 264.7) cells, A498 kidney cancer cells, and HT-29 human colorectal cells. The MTT solution was utilized in the cytotoxicity experiment to determine the cell's toxic level. G-CK was shown to be safe after its cytotoxicity in normal cells like HEK-293 and RAW 264.7 cells were assessed. After 24 h, it was noted that the G-CK at 10 µg/mL showed efficiently good results on the viability of HEK-293 and RAW 264.7 cells (Figure 7. A, C). However, compared to a positive reference such as commercial cisplatin, an anticancer agent, 10 µg/mL of G-CK significantly limits the A498, HT-29 cell viability (Figure 7. B, D). On the other hand, it was found that G-CK reduced the viability of A498 and HT-29 cells based on the dose. These results show that G-CK has anti-cancer effects against A498 kidney cancer cells and HT-29 colorectal cancer cells.
3.5. G-CK Controls the Gene Expression of the PHLDA Gene Family
By utilizing RT-PCR, we first assessed the RNA expression level in the human kidney cancer cell line A498 and the human colorectal cancer cell line HT-29 to observe and confirm potential G-CK inhibitory activity. We found that 10 µg/µL of G-CK significantly suppressed the expression of PHLDA1, PHLDA2, and PHLDA3 targets.This result also confirmed the simulation results (Figure 7. A-B). Here, we compared the G-CK treatment with cisplatin, which was used as a control drug.
Additionally, we used qRT-PCR to assess the expression of several target genes in a dose-dependent manner (Figure 7. C-D). Our research showed that there was a dose-dependent downregulation of the mRNA expression of genes. In the kidney cancer cell line PHLDA1 gene expression profile was found to be 3.3-fold expressed during negative control (no treatment), 1.6-fold downregulated after cisplatin treatment, and also downregulated after G-CK (10 µg/µL) treatment (1.5-fold). In comparison to both the control drug and without treatment, PHLDA2 expression was downregulated following G-CK treatment (3.4-fold in the absence of treatment, 1.8-fold in the presence of cisplatin, and 1.7-fold in the presence of G-CK 10 µg/mL). In comparison to the control drug and without treatment, PHLDA3 expression was inhibited (1.2-fold in the case of G-CK 10 µg/mL, 1.4-fold in the case of cisplatin, and 3.1-fold in the case of no treatment). Thus, the outcomes supported the hypothesis that kidney cancer can be prevented by treating with ginsenoside compound K, which also has the ability to inhibit PHLDA1, PHLDA2, and PHLDA3 expression. The expression of PHLDA1 was downregulated in colon cancer cell line treated with G-CK compared to control medication and therapy (2.8-fold: without treatment, 1.8-fold: cisplatin, 1.7-fold: G-CK 10 µg/mL). PHLDA2 gene expression was 3.9-fold higher in the negative control (no treatment), 1.5-fold lower after cisplatin treatment, and 1.4-fold lower after G-CK (10 µg/µL) treatment. PHLDA3 expression was lowered by 3.9-fold without treatment, 1.0-fold with G-CK at 10 µg/mL and 1.7-fold with cisplatin.
4. Discussion
Worldwide, cancer is a terrible illness that poses an extreme threat to life, causing around 20 million new cases and nearly 9.7 million deaths, according to Global Cancer Statistics 2022. Renal cell carcinoma has more than doubled in occurrence in the developed world, although making up 2% of all cancer diagnoses and deaths worldwide. The majority of kidney cancer cases are randomly found during imaging, and the 5-year survival rate for metastatic cancer is about 12% [40]. The stage at diagnosis has a significant impact on survival. In 2020, kidney cancer had an incidence of 431,288 cases and a death rate of 179,368 cases, according to the Global Cancer Statistics [1]. Approximately 10% of all cancer cases globally are colorectal cancer cases, making it the second most prevalent cancer worldwide and the biggest cause of death related to cancer. According to Global Cancer Statistics, the estimated number of new cases of colorectal cancer is 10.0 % with an estimated deaths followed by 9.4%. Controlling colon and kidney cancer has become increasingly important in recent times. Each of these genes has a potential risk of developing a certain type of cancer.
Hereditary renal cell cancer is primarily associated with the genes FH, BHD, HRPT2, MET, VHL, and FH. The most frequent mutation location responsible for hereditary renal cells is the VHL gene [41]. We also discovered in our earlier work that kidney cancer can induced by PHLDA1, PHLDA2, and PHLDA3 and that kidney cancer could be less severe if these genes were suppressed. A particular type of cancer is possible for each of these genes. For instance, it was discovered that PHLDA1 was expressed in a variety of cancer types, including brain, liver, lung, and bladder cancer [42]. PHLDA2 expression was increased in colorectal cancer [43], and breast cancer PHLDA2 increases pancreatic ductal adenocarcinoma tumor growth [44]. According to a study, kidney damage caused a significant increase in Phlda3 [45]. Overexpression of the PHLDA3 gene also found in pancreatic and lung neuroendocrine tumors (NETs) [46].
Due to its potent anticancer bioactivity, Compound K (CK), a rare protopanaxadiol ginsenoside, has emerged as the most frequently used ginsenoside for cancer treatment. In addition to its antitumor, anticancer, anti-inflammatory, and anti-aging effects, G-CK also strengthens human immunity and recovers cardiovascular diseases [47]. We also hypothesized that these three (PHLDA1, PHLDA2, and PHLDA3) gene targets might be triggered by G-CK. Additionally, this compound has a wide range of beneficial in-vivo and in-vitro effects. However, our prediction was entirely based on in-silico based. Therefore, we conducted more in-silico and in-vitro study for validating our target.
To confirm and identify the stable complex between G-CK and the gene targets (PHLDA1, PHLDA2, and PHLDA3), we performed an MD simulation for 150 ns. Additionally, the MD simulation confirmed that a protein remains intact during a ligand-protein interaction. According to MD simulation, the complexes between G-CK and the gene targets (PHLDA1, PHLDA2, and PHLDA3) revealed RMSF and RMSD values that were quite stable. Our understanding of the characteristics of protein folding is enhanced by the center of mass computed for ROG, which is obtained from the protein C and N terminal and evaluates the structural integrity of the protein [48]. Higher ROG scores indicate that the material is separated from the protein, whereas lower ROG values indicate better compactness [49]. Compound G-CK has a lower ROG value for three complexes, according to the data. The complex between G-CK with PHLDA1, PHLDA2, and PHLDA3 is more stable, according to our MD simulation research.
Also, we used RT-PCR and qRT-PCR assays to validate G-CK efficacy in vitro and confirmed that IQ may trigger the genes PHLDA1, PHLDA2, and PHLDA3 to regulate kidney and colon cancer. These genes exhibit a substantial decrease in expression with G-CK therapy.
5. Conclusion
In all countries of the world, cancer is the primary cause of mortality and a significant obstacle to raising life expectancy. The genes PHLDA1, PHLDA2, and PHLDA3 that regulate colon and kidney cancer can be activated by G-CK. In the future, we want to carry out more animal and clinical studies to confirm the screening targets derived from these in-silico and in-vitro analyses and to provide additional scientific data supporting the therapeutic application of G-CK in the treatment of kidney and colon cancer.
Author Contributions
Safia Iqbal: All data analysis and writing the original manuscript, Dong Uk Yang: data analysis and writing the original manuscript, Shahnawaz Mohammad, Md. Niaj Morshed, and Abdus Samad: review and editing, Deok Chun Yang: editing, Md. Sarowre Hossen: Review & Editing, Hyocheol Bae: grammar check, review and editing, Yeon Ju Kim: review, supervision, & editing, and Md. Rezaul Karim: review, supervision, & editing.
Funding
This research received no external funding.
Acknowledgments
No funding for this research. The authors declare that the research was conducted in the absence of any commercial or financial relationships that could be construed as a potential conflict of interest.
Data archiving statement
All data generated or analyzed during this study are included in this published article (and its supplementary information files).
Data availability
The data for this qualitative content analysis was derived from publicly available, third-party endorsement documents and can be reviewed online (for details please check the method section of this manuscript).
Competing Interest Declaration
The authors declare no competing of interest.
References
- Iqbal, S.; Karim, M.R.; Mohammad, S.; Ahn, J.C.; Kariyarath Valappil, A.; Mathiyalagan, R.; Yang, D.-C.; Jung, D.-H.; Bae, H.; Yang, D.U. In Silico and In Vitro Study of Isoquercitrin against Kidney Cancer and Inflammation by Triggering Potential Gene Targets. Current Issues in Molecular Biology 2024, 46, 3328–3341. [Google Scholar]
- Miller, K.D.; Goding Sauer, A.; Ortiz, A.P.; Fedewa, S.A.; Pinheiro, P.S.; Tortolero-Luna, G.; Martinez-Tyson, D.; Jemal, A.; Siegel, R.L. Cancer Statistics for Hispanics/Latinos, 2018. CA Cancer J Clin 2018, 68, 425–445. [Google Scholar] [CrossRef]
- Lotfollahzadeh, S.; Recio-Boiles, A.; Cagir, B. Colon Cancer. In StatPearls; StatPearls Publishing Copyright © 2024, StatPearls Publishing LLC.: Treasure Island (FL), 2024. [Google Scholar]
- Jung, D.H.; Nahar, J.; Mathiyalagan, R.; Rupa, E.J.; Ramadhania, Z.M.; Han, Y.; Yang, D.C.; Kang, S.C. A Focused Review on Molecular Signalling Mechanisms of Ginsenosides Anti-Lung Cancer and Anti-inflammatory Activities. Anticancer Agents Med Chem 2023, 23, 3–14. [Google Scholar] [CrossRef]
- Choi, K.T. Botanical characteristics, pharmacological effects and medicinal components of Korean Panax ginseng C A Meyer. Acta Pharmacol Sin 2008, 29, 1109–1118. [Google Scholar] [CrossRef]
- Piao, X.M.; Huo, Y.; Kang, J.P.; Mathiyalagan, R.; Zhang, H.; Yang, D.U.; Kim, M.; Yang, D.C.; Kang, S.C.; Wang, Y.P. Diversity of Ginsenoside Profiles Produced by Various Processing Technologies. Molecules 2020, 25. [Google Scholar] [CrossRef]
- Nag, S.A.; Qin, J.J.; Wang, W.; Wang, M.H.; Wang, H.; Zhang, R. Ginsenosides as Anticancer Agents: In vitro and in vivo Activities, Structure-Activity Relationships, and Molecular Mechanisms of Action. Front Pharmacol 2012, 3, 25. [Google Scholar] [CrossRef]
- de Oliveira Zanuso, B.; de Oliveira Dos Santos, A.R.; Miola, V.F.B.; Guissoni Campos, L.M.; Spilla, C.S.G.; Barbalho, S.M. Panax ginseng and aging related disorders: A systematic review. Exp Gerontol 2022, 161, 111731. [Google Scholar] [CrossRef]
- Chae, S.; Kang, K.A.; Chang, W.Y.; Kim, M.J.; Lee, S.J.; Lee, Y.S.; Kim, H.S.; Kim, D.H.; Hyun, J.W. Effect of compound K, a metabolite of ginseng saponin, combined with gamma-ray radiation in human lung cancer cells in vitro and in vivo. J Agric Food Chem 2009, 57, 5777–5782. [Google Scholar] [CrossRef]
- Kim, S.; Kim, N.; Jeong, J.; Lee, S.; Kim, W.; Ko, S.-G.; Kim, B. Anti-Cancer Effect of Panax Ginseng and Its Metabolites: From Traditional Medicine to Modern Drug Discovery. Processes 2021, 9, 1344. [Google Scholar] [CrossRef]
- Iqbal, S.; Karim, M.R.; Mohammad, S.; Mathiyalagan, R.; Morshed, M.N.; Yang, D.-C.; Bae, H.; Rupa, E.J.; Yang, D.U. Multiomics Analysis of the PHLDA Gene Family in Different Cancers and Their Clinical Prognostic Value. Current Issues in Molecular Biology 2024, 46, 5488–5510. [Google Scholar]
- Zhou, L.; Chen, L.; Zeng, X.; Liao, J.; Ouyang, D. Ginsenoside compound K alleviates sodium valproate-induced hepatotoxicity in rats via antioxidant effect, regulation of peroxisome pathway and iron homeostasis. Toxicol Appl Pharmacol 2020, 386, 114829. [Google Scholar] [CrossRef]
- Christensen, L.P. Ginsenosides chemistry, biosynthesis, analysis, and potential health effects. Adv Food Nutr Res 2009, 55, 1–99. [Google Scholar] [CrossRef]
- Boopathi, V.; Nahar, J.; Murugesan, M.; Subramaniyam, S.; Kong, B.M.; Choi, S.K.; Lee, C.S.; Ling, L.; Yang, D.U.; Yang, D.C.; et al. In silico and in vitro inhibition of host-based viral entry targets and cytokine storm in COVID-19 by ginsenoside compound K. Heliyon 2023, 9, e19341. [Google Scholar] [CrossRef]
- Murugesan, M.; Mathiyalagan, R.; Boopathi, V.; Kong, B.M.; Choi, S.-K.; Lee, C.-S.; Yang, D.C.; Kang, S.C.; Thambi, T. Production of Minor Ginsenoside CK from Major Ginsenosides by Biotransformation and Its Advances in Targeted Delivery to Tumor Tissues Using Nanoformulations. Nanomaterials 2022, 12, 3427. [Google Scholar] [CrossRef]
- Duan, Y.; Du, Y.; Gu, Z.; Zheng, X.; Wang, C. Prognostic Value, Immune Signature, and Molecular Mechanisms of the PHLDA Family in Pancreatic Adenocarcinoma. Int J Mol Sci 2022, 23. [Google Scholar] [CrossRef]
- Sakthianandeswaren, A.; Christie, M.; D'Andreti, C.; Tsui, C.; Jorissen, R.N.; Li, S.; Fleming, N.I.; Gibbs, P.; Lipton, L.; Malaterre, J.; et al. PHLDA1 expression marks the putative epithelial stem cells and contributes to intestinal tumorigenesis. Cancer Res 2011, 71, 3709–3719. [Google Scholar] [CrossRef]
- McMinn, J.; Wei, M.; Schupf, N.; Cusmai, J.; Johnson, E.B.; Smith, A.C.; Weksberg, R.; Thaker, H.M.; Tycko, B. Unbalanced placental expression of imprinted genes in human intrauterine growth restriction. Placenta 2006, 27, 540–549. [Google Scholar] [CrossRef]
- Moon, H.G.; Oh, K.; Lee, J.; Lee, M.; Kim, J.Y.; Yoo, T.K.; Seo, M.W.; Park, A.K.; Ryu, H.S.; Jung, E.J.; et al. Prognostic and functional importance of the engraftment-associated genes in the patient-derived xenograft models of triple-negative breast cancers. Breast Cancer Res Treat 2015, 154, 13–22. [Google Scholar] [CrossRef]
- Salmanli, M.; Tatar Yilmaz, G.; Tuzuner, T. Investigation of the antimicrobial activities of various antimicrobial agents on Streptococcus Mutans Sortase A through computer-aided drug design (CADD) approaches. Comput Methods Programs Biomed 2021, 212, 106454. [Google Scholar] [CrossRef]
- Morris, G.M.; Huey, R.; Lindstrom, W.; Sanner, M.F.; Belew, R.K.; Goodsell, D.S.; Olson, A.J. AutoDock4 and AutoDockTools4: Automated docking with selective receptor flexibility. J Comput Chem 2009, 30, 2785–2791. [Google Scholar] [CrossRef]
- Guex, N.; Peitsch, M.C.; Schwede, T. Automated comparative protein structure modeling with SWISS-MODEL and Swiss-PdbViewer: a historical perspective. Electrophoresis 2009, 30 Suppl 1, S162–173. [Google Scholar] [CrossRef]
- Ramachandran, G.N.; Ramakrishnan, C.; Sasisekharan, V. Stereochemistry of polypeptide chain configurations. J Mol Biol 1963, 7, 95–99. [Google Scholar] [CrossRef]
- Zhang, J.; Liu, X.; Zhou, W.; Cheng, G.; Wu, J.; Guo, S.; Jia, S.; Liu, Y.; Li, B.; Zhang, X.; et al. A bioinformatics investigation into molecular mechanism of Yinzhihuang granules for treating hepatitis B by network pharmacology and molecular docking verification. Sci Rep 2020, 10, 11448. [Google Scholar] [CrossRef]
- Tian, W.; Chen, C.; Lei, X.; Zhao, J.; Liang, J. CASTp 3.0: computed atlas of surface topography of proteins. Nucleic Acids Res 2018, 46, W363–w367. [Google Scholar] [CrossRef]
- Kemmish, H.; Fasnacht, M.; Yan, L. Fully automated antibody structure prediction using BIOVIA tools: Validation study. PLoS One 2017, 12, e0177923. [Google Scholar] [CrossRef]
- Dallakyan, S.; Olson, A.J. Small-molecule library screening by docking with PyRx. Methods Mol Biol 2015, 1263, 243–250. [Google Scholar] [CrossRef]
- Zhou, G.; Soufan, O.; Ewald, J.; Hancock, R.E.W.; Basu, N.; Xia, J. NetworkAnalyst 3.0: a visual analytics platform for comprehensive gene expression profiling and meta-analysis. Nucleic Acids Res 2019, 47, W234–w241. [Google Scholar] [CrossRef]
- Trott, O.; Olson, A.J. AutoDock Vina: improving the speed and accuracy of docking with a new scoring function, efficient optimization, and multithreading. J Comput Chem 2010, 31, 455–461. [Google Scholar] [CrossRef]
- Rupa, E.J.; Arunkumar, L.; Han, Y.; Kang, J.P.; Ahn, J.C.; Jung, S.K.; Kim, M.; Kim, J.Y.; Yang, D.C.; Lee, G.J. Dendropanax Morbifera Extract-Mediated ZnO Nanoparticles Loaded with Indole-3-Carbinol for Enhancement of Anticancer Efficacy in the A549 Human Lung Carcinoma Cell Line. Materials (Basel) 2020, 13. [Google Scholar] [CrossRef]
- Iqbal, S.; Karim, M.R.; Mohammad, S.; Mathiyalagan, R.; Morshed, M.N.; Yang, D.C.; Bae, H.; Rupa, E.J.; Yang, D.U. Multiomics Analysis of the PHLDA Gene Family in Different Cancers and Their Clinical Prognostic Value. Curr Issues Mol Biol 2024, 46, 5488–5510. [Google Scholar] [CrossRef]
- Guo, Y.-P.; Shao, L.; Wang, L.; Chen, M.-Y.; Zhang, W.; Huang, W.-H. Bioconversion variation of ginsenoside CK mediated by human gut microbiota from healthy volunteers and colorectal cancer patients. Chinese Medicine 2021, 16, 28. [Google Scholar] [CrossRef]
- Chen, S.; Ye, H.; Gong, F.; Mao, S.; Li, C.; Xu, B.; Ren, Y.; Yu, R. Ginsenoside compound K exerts antitumour effects in renal cell carcinoma via regulation of ROS and lncRNA THOR. Oncol Rep 2021, 45, 38. [Google Scholar] [CrossRef]
- Mahdavi, M.; Fattahi, A.; Tajkhorshid, E.; Nouranian, S. Molecular Insights into the Loading and Dynamics of Doxorubicin on PEGylated Graphene Oxide Nanocarriers. ACS Appl Bio Mater 2020, 3, 1354–1363. [Google Scholar] [CrossRef]
- Hou, Y.; Meng, X.; Sun, K.; Zhao, M.; Liu, X.; Yang, T.; Zhang, Z.; Su, R. Anti-cancer effects of ginsenoside CK on acute myeloid leukemia in vitro and in vivo. Heliyon 2022, 8, e12106. [Google Scholar] [CrossRef]
- Zhou, L.; Li, Z.K.; Li, C.Y.; Liang, Y.Q.; Yang, F. Anticancer properties and pharmaceutical applications of ginsenoside compound K: A review. Chem Biol Drug Des 2022, 99, 286–300. [Google Scholar] [CrossRef]
- Chen, H.F.; Wu, L.X.; Li, X.F.; Zhu, Y.C.; Wang, W.X.; Xu, C.W.; Huang, Z.Z.; Du, K.Q. Ginsenoside compound K inhibits growth of lung cancer cells via HIF-1α-mediated glucose metabolism. Cell Mol Biol (Noisy-le-grand) 2019, 65, 48–52. [Google Scholar] [CrossRef]
- Yao, H.; Wan, J.Y.; Zeng, J.; Huang, W.H.; Sava-Segal, C.; Li, L.; Niu, X.; Wang, Q.; Wang, C.Z.; Yuan, C.S. Effects of compound K, an enteric microbiome metabolite of ginseng, in the treatment of inflammation associated colon cancer. Oncol Lett 2018, 15, 8339–8348. [Google Scholar] [CrossRef]
- Wang, C.Z.; Anderson, S.; Du, W.; He, T.C.; Yuan, C.S. Red ginseng and cancer treatment. Chin J Nat Med 2016, 14, 7–16. [Google Scholar] [CrossRef]
- Padala, S.A.; Barsouk, A.; Thandra, K.C.; Saginala, K.; Mohammed, A.; Vakiti, A.; Rawla, P.; Barsouk, A. Epidemiology of Renal Cell Carcinoma. World J Oncol 2020, 11, 79–87. [Google Scholar] [CrossRef]
- Maher, E.R. Hereditary renal cell carcinoma syndromes: diagnosis, surveillance and management. World J Urol 2018, 36, 1891–1898. [Google Scholar] [CrossRef]
- Baral, K.C.; Bajracharya, R.; Lee, S.H.; Han, H.K. Advancements in the Pharmaceutical Applications of Probiotics: Dosage Forms and Formulation Technology. Int J Nanomedicine 2021, 16, 7535–7556. [Google Scholar] [CrossRef] [PubMed]
- Ma, Z.; Lou, S.; Jiang, Z. PHLDA2 regulates EMT and autophagy in colorectal cancer via the PI3K/AKT signaling pathway. Aging (Albany NY) 2020, 12, 7985–8000. [Google Scholar] [CrossRef] [PubMed]
- Idichi, T.; Seki, N.; Kurahara, H.; Fukuhisa, H.; Toda, H.; Shimonosono, M.; Okato, A.; Arai, T.; Kita, Y.; Mataki, Y.; et al. Molecular pathogenesis of pancreatic ductal adenocarcinoma: Impact of passenger strand of pre-miR-148a on gene regulation. Cancer Sci 2018, 109, 2013–2026. [Google Scholar] [CrossRef]
- Lee, C.G.; Kang, Y.J.; Kim, H.S.; Moon, A.; Kim, S.G. Phlda3, a urine-detectable protein, causes p53 accumulation in renal tubular cells injured by cisplatin. Cell Biol Toxicol 2015, 31, 121–130. [Google Scholar] [CrossRef]
- Chen, Y.; Ohki, R. p53-PHLDA3-Akt Network: The Key Regulators of Neuroendocrine Tumorigenesis. Int J Mol Sci 2020, 21. [Google Scholar] [CrossRef]
- Liu, J.; Wang, Y.; Yu, Z.; Lv, G.; Huang, X.; Lin, H.; Ma, C.; Lin, Z.; Qu, P. Functional Mechanism of Ginsenoside Compound K on Tumor Growth and Metastasis. Integr Cancer Ther 2022, 21, 15347354221101203. [Google Scholar] [CrossRef]
- Baildya, N.; Khan, A.A.; Ghosh, N.N.; Dutta, T.; Chattopadhyay, A.P. Screening of potential drug from Azadirachta Indica (Neem) extracts for SARS-CoV-2: An insight from molecular docking and MD-simulation studies. J Mol Struct 2021, 1227, 129390. [Google Scholar] [CrossRef]
- Mahmud, S.; Rahman, E.; Nain, Z.; Billah, M.; Karmakar, S.; Mohanto, S.C.; Paul, G.K.; Amin, A.; Acharjee, U.K.; Saleh, M.A. Computational discovery of plant-based inhibitors against human carbonic anhydrase IX and molecular dynamics simulation. J Biomol Struct Dyn 2021, 39, 2754–2770. [Google Scholar] [CrossRef]
Figure 3.
Molecular docking of PHLDA gene targets with ginsenoside compound-K (G-CK). (A) PHLDA1 complex with G-CK. (B) PHLDA2 complex with G-CK. (C) PHLDA3 complex with G-CK.
Figure 3.
Molecular docking of PHLDA gene targets with ginsenoside compound-K (G-CK). (A) PHLDA1 complex with G-CK. (B) PHLDA2 complex with G-CK. (C) PHLDA3 complex with G-CK.
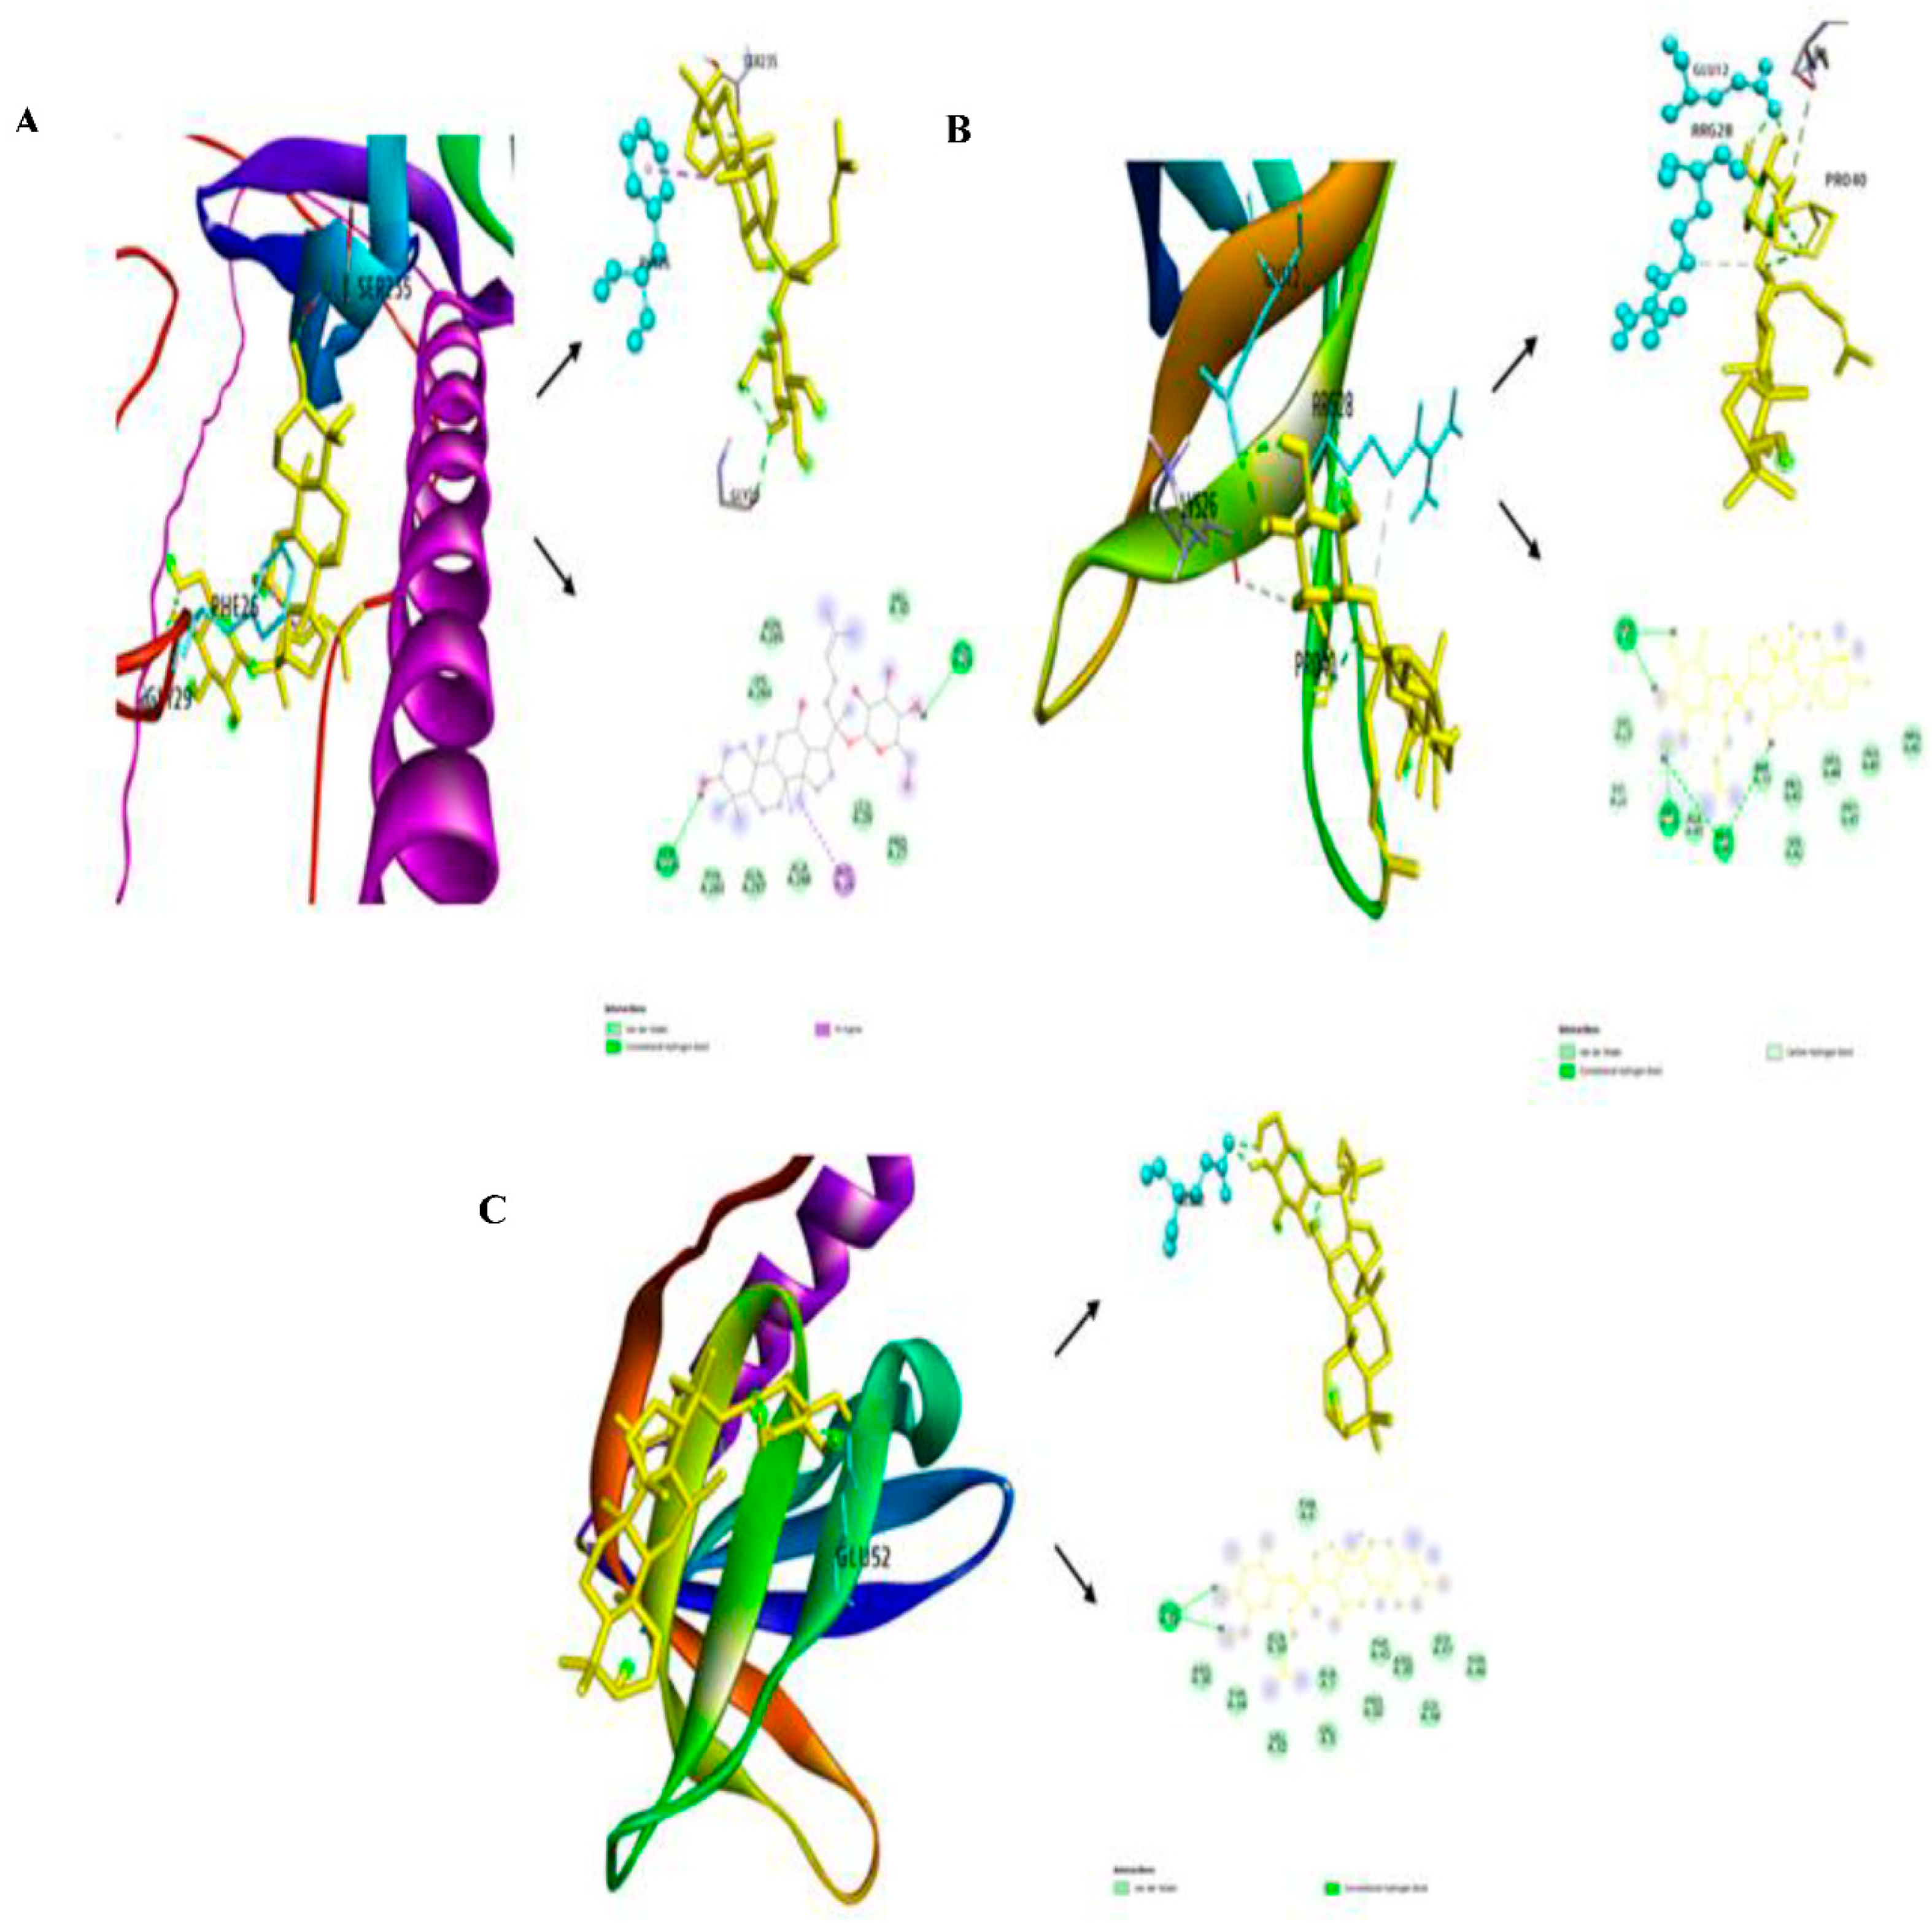
Figure 4.
Molecular dynamic simulation of PHLDA1, PHLDA2, and PHLDA3 with Ginsenoside CK. (A) RMSD analysis of simulation between Ginsenoside-CK and PHLDA gene family, (B) RMSF analysis of simulation between Ginsenoside-CK and PHLDA gene family, (C) rGyr analysis of simulation between Ginsenoside-CK and PHLDA gene family, (D) SASA value analysis of simulation between Ginsenoside-CK and PHLDA gene family. Simulation time (150 ns).
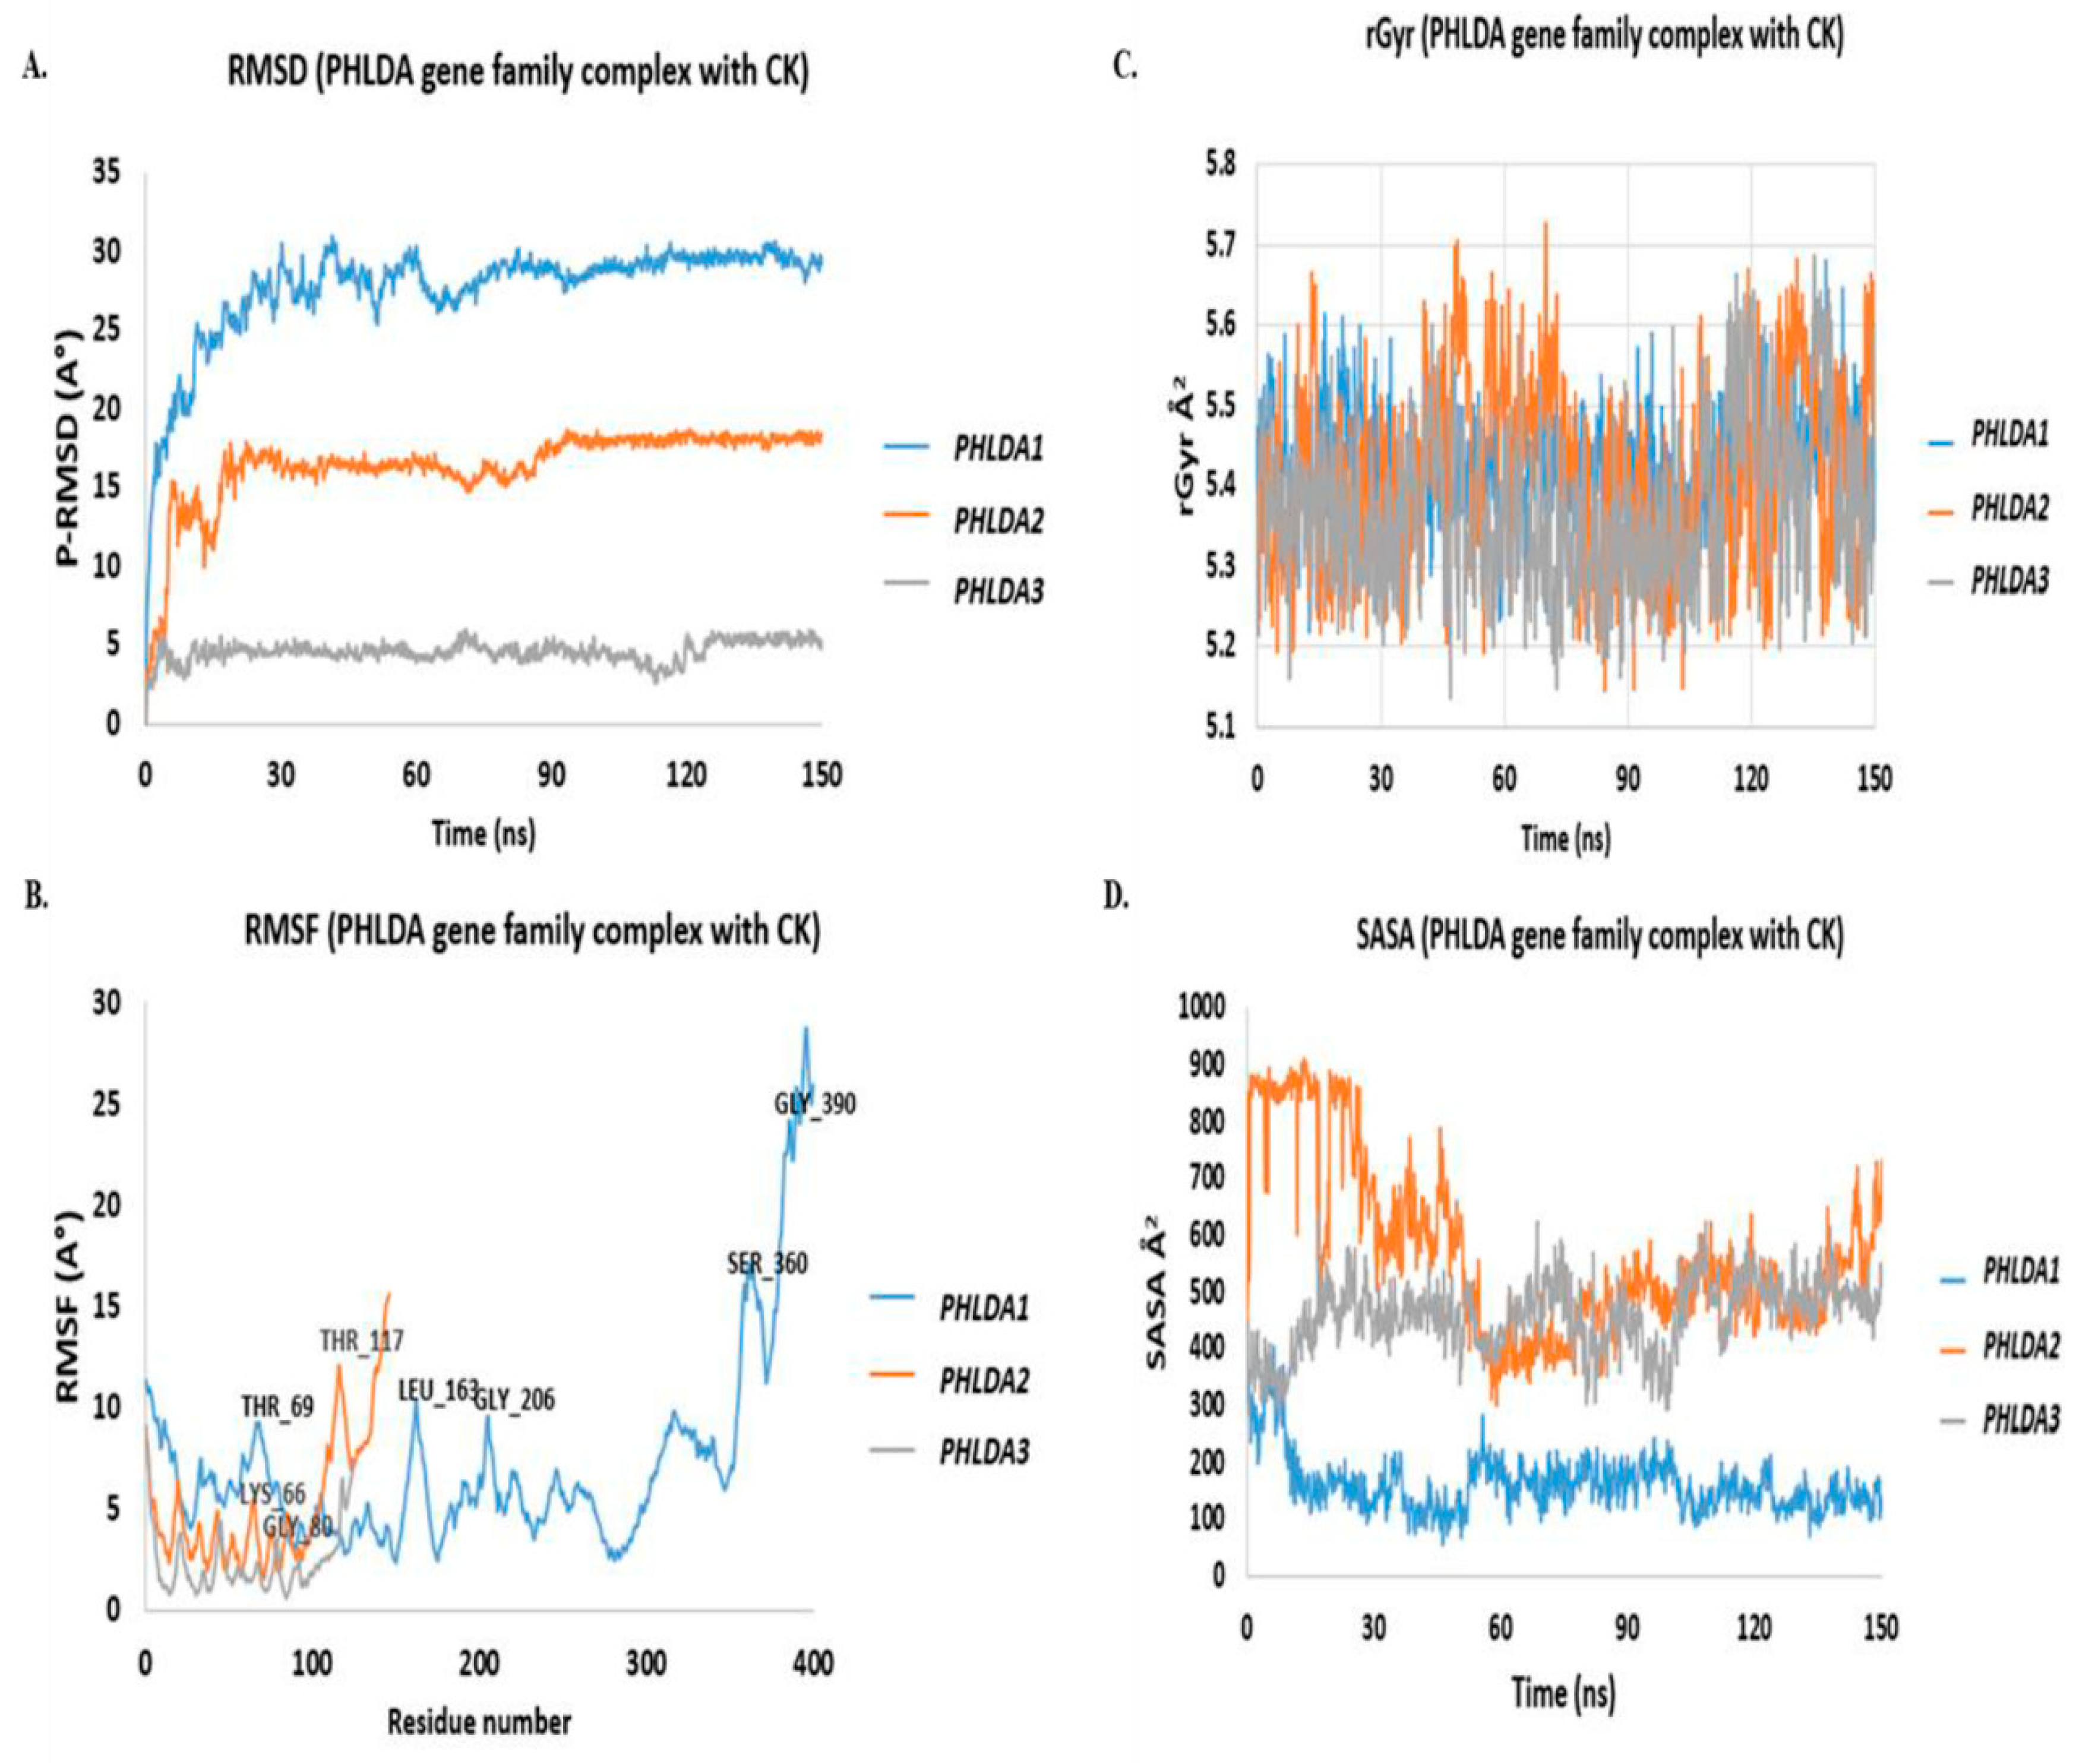
Figure 5.
Protein-ligand contact analysis of simulation between Ginsenoside-CK and PHLDA gene family. (A) protein–ligand contact from the MD simulation trajectory of PHLDA1 with ginsenoside CK. (B) protein–ligand contact from the MD simulation trajectory of PHLDA2 with ginsenoside CK. (C) protein–ligand interaction from PHLDA3's MD simulation trajectory with ginsenoside CK. (For this simulation, the Linux-based Desmond v6.3 Program in Schrödinger 2023-3 was utilized).
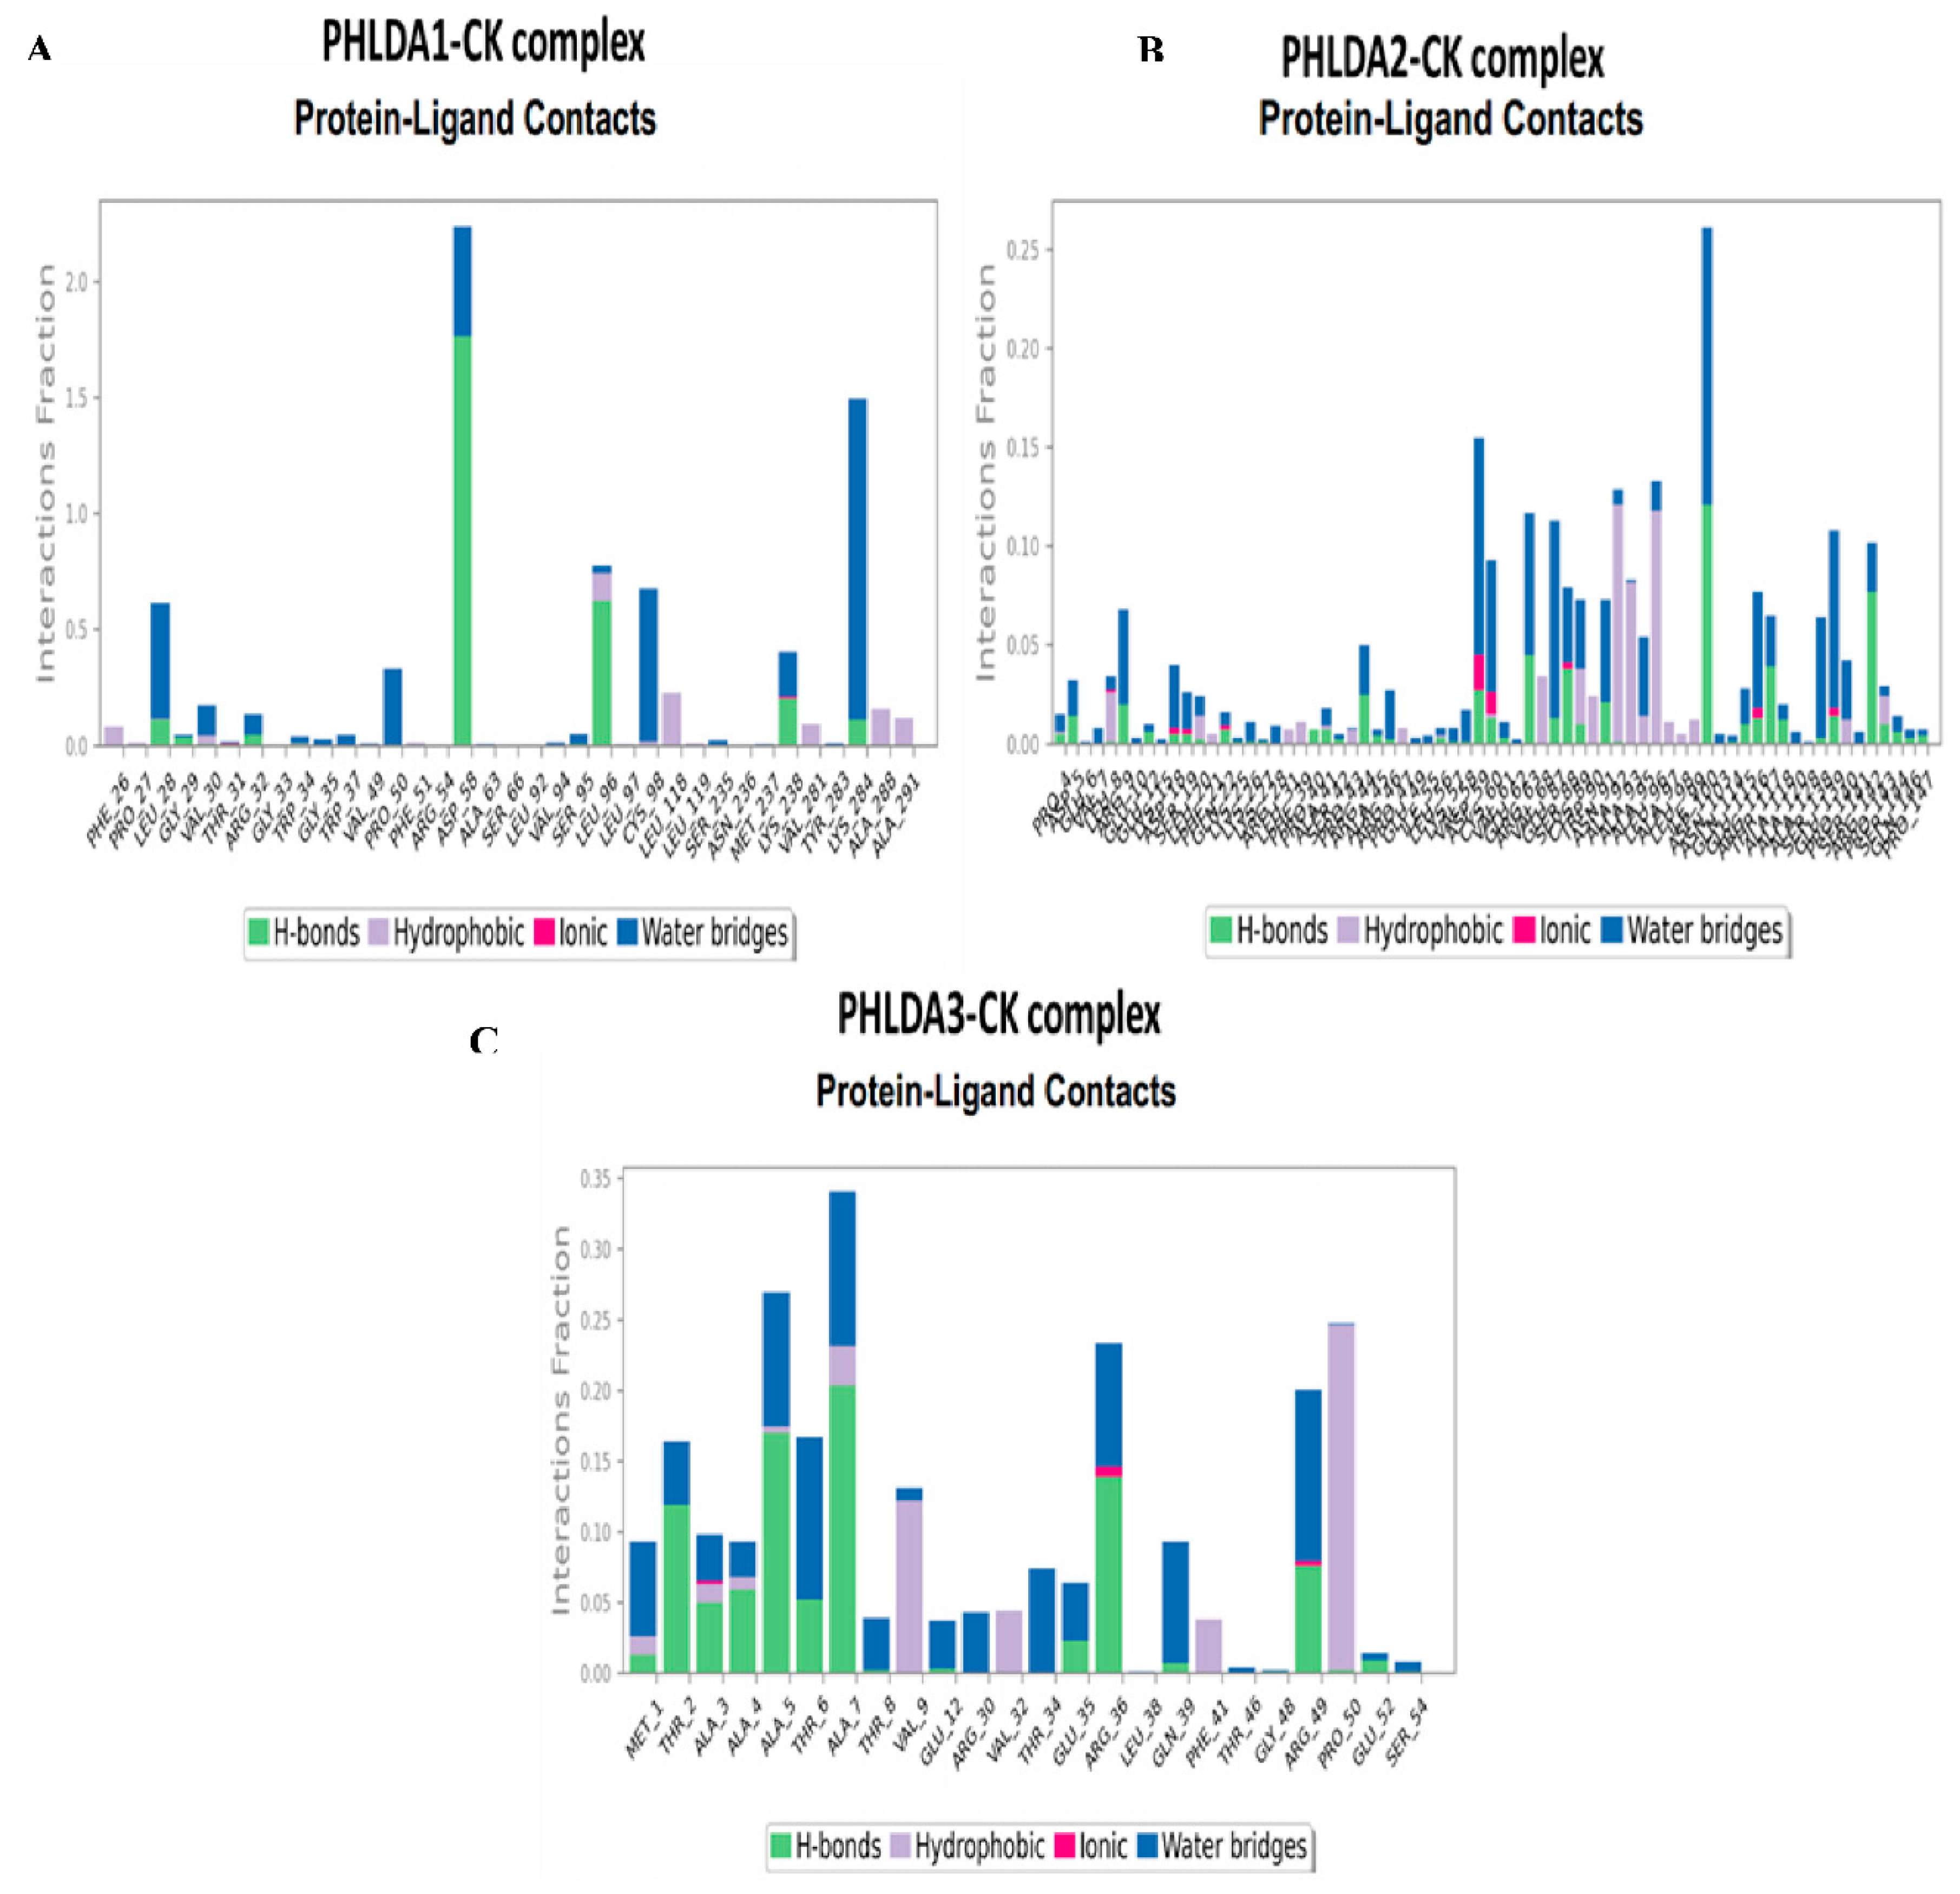
Figure 6.
MTT assay to determine cell viability percentage. (A) cell cytotoxicity evaluation for G-CK in HEK-293 cells compared to positive control (cisplatin). (B) cell cytotoxicity evaluation for G-CK in A498 cells compared to positive control (cisplatin). (C) cell cytotoxicity evaluation for G-CK in RAW 264.7 cells compared to positive control (cisplatin). (D) cell cytotoxicity evaluation for G-CK in HT-29 cells compared to positive control (cisplatin). (The means ± standard errors of three separate experiments are used to express each value; ***p < 0.001 compared to the control).
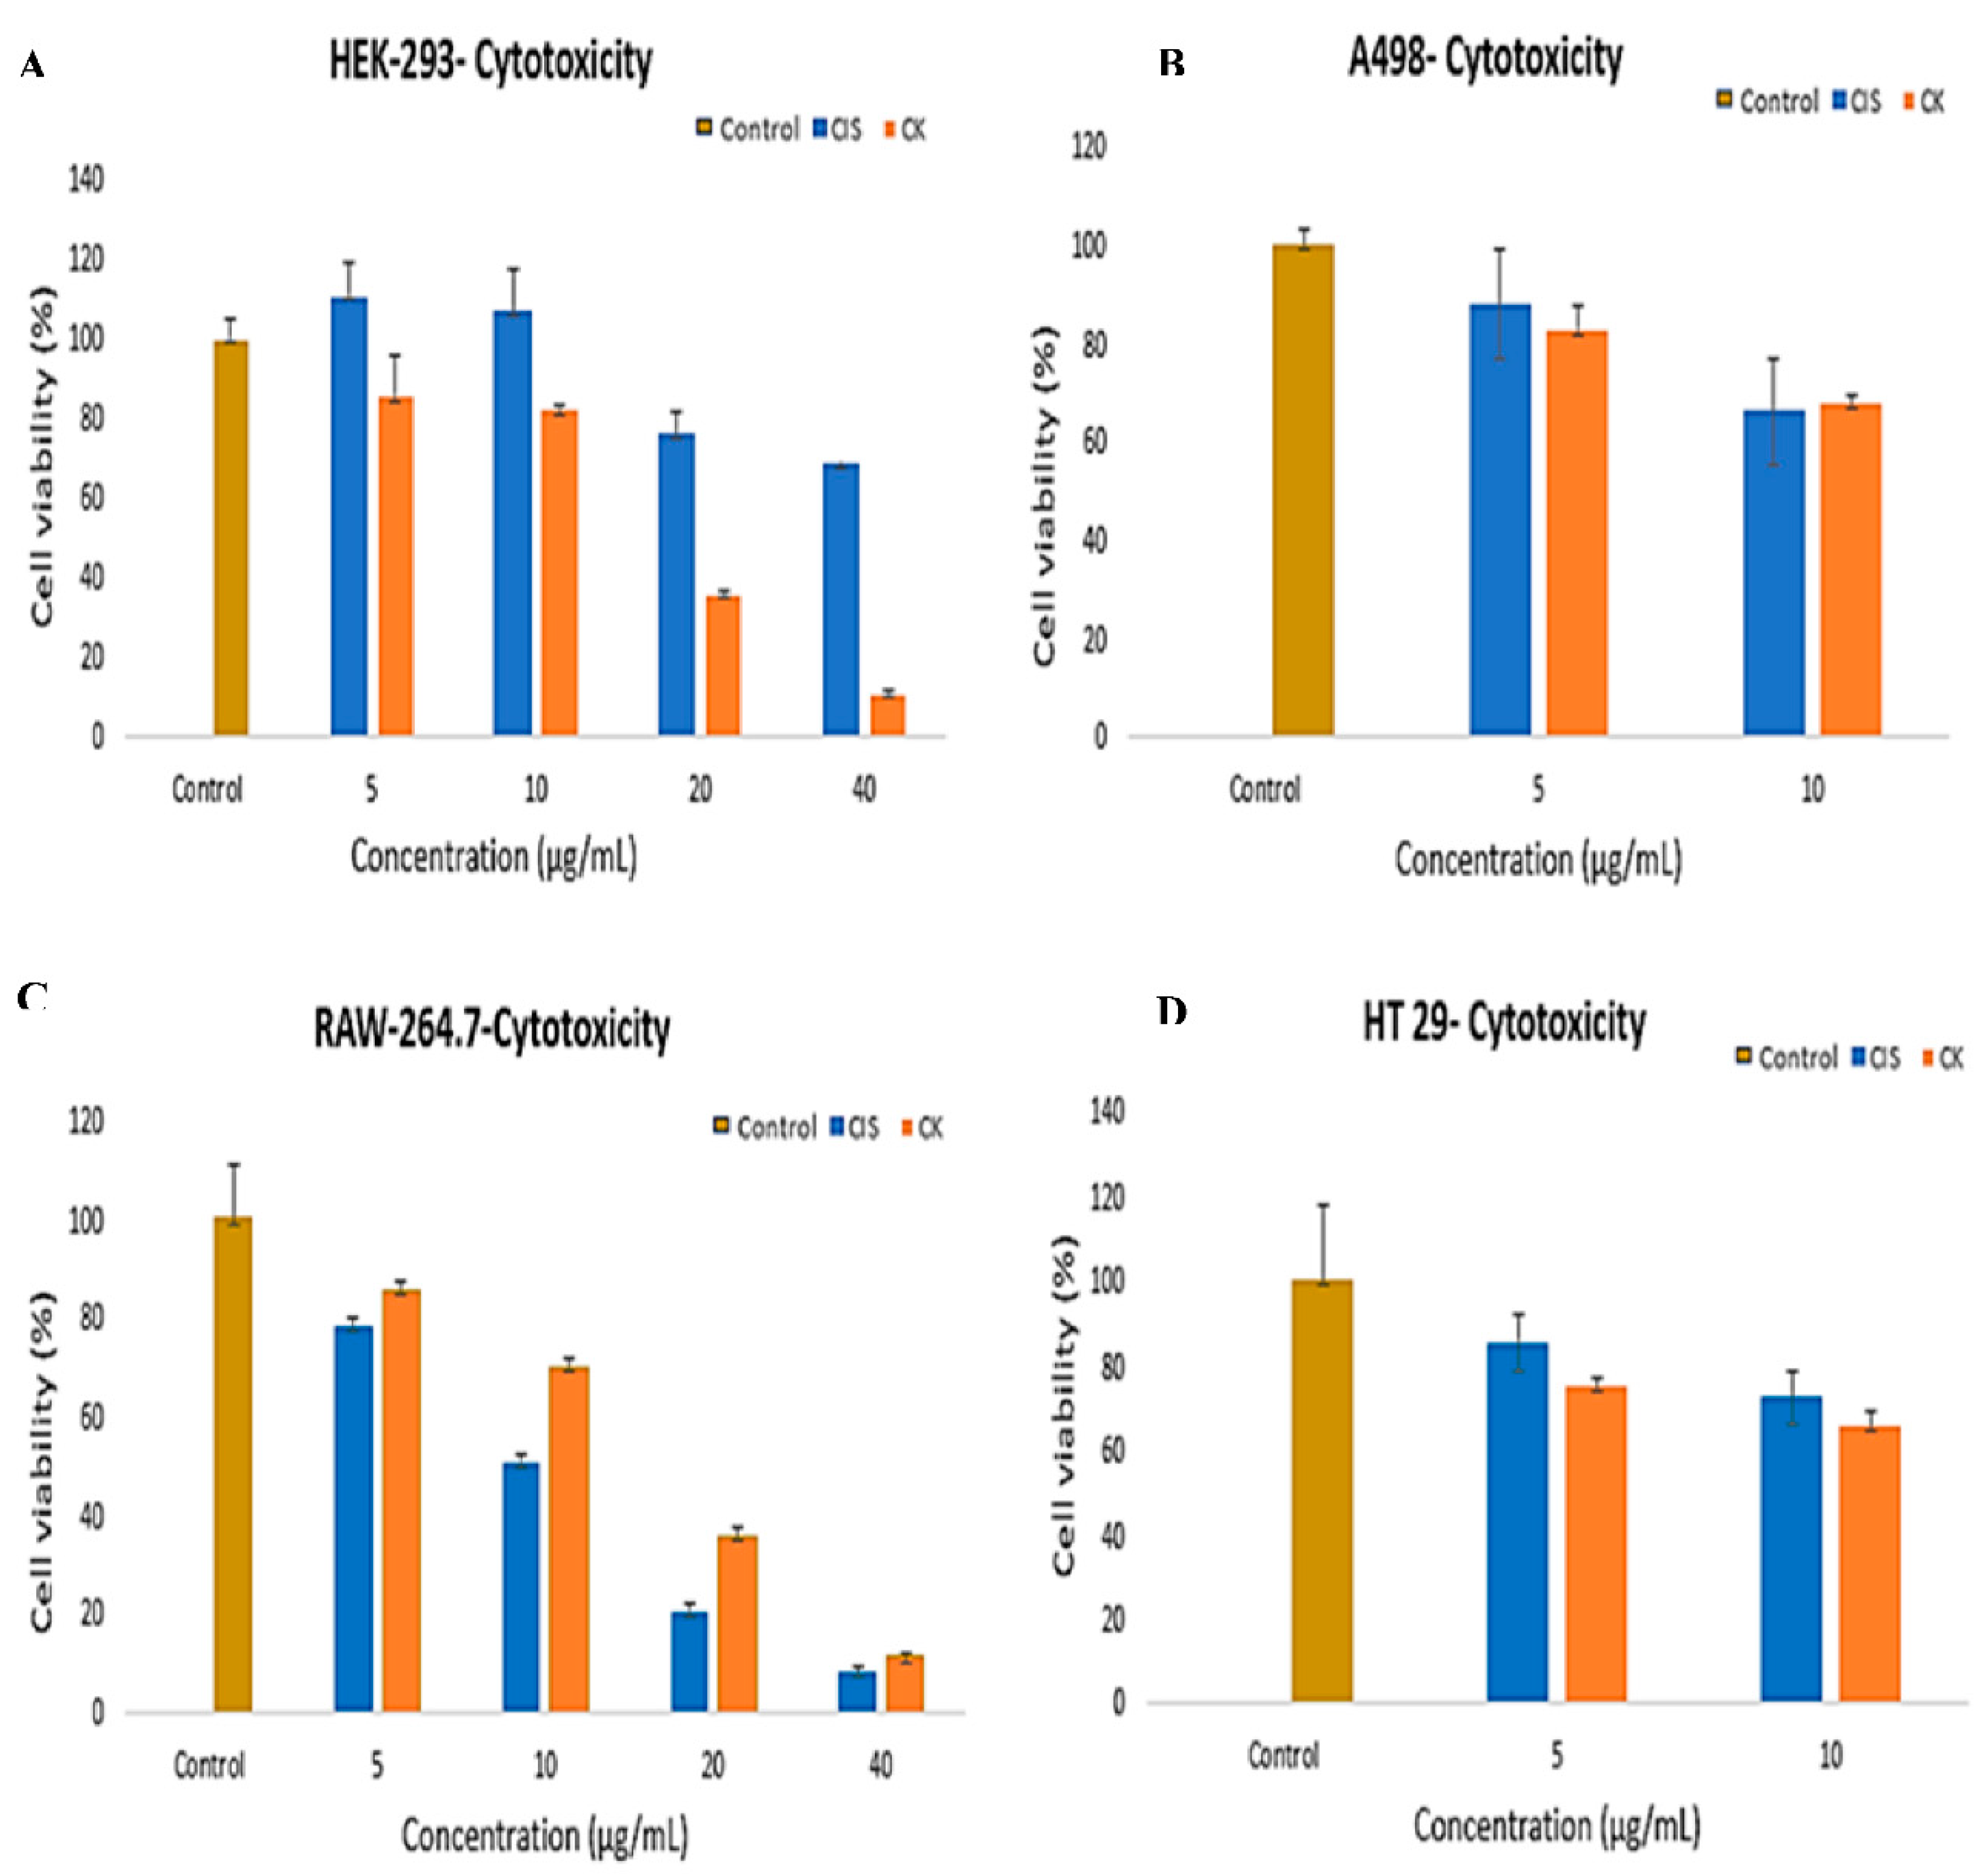
Figure 7.
Effects of cisplatin and ginsenoside CK (G-CK) on PHLDA1, PHLDA2, and PHLDA3 cDNA expression levels in colon cancer (HT-29) and kidney (A498) cell lines. Targeted genes (PHLDA1, PHLDA2, and PHLDA3) were expressed using RT-PCR in (A–B) and qRT-PCR in (C–D) (control: no treatment, and G-CK at 5 µg/µL and 10 µg/µL were applied for 24 hours, and cisplatin at 5 µg/µL and 10 µg/µL doses). We produced cDNA after extracting total RNA, and then we ran RT-PCR and qRT-PCR. In terms of qRT-PCR, the findings show the average ± standard error of duplicate samples from three separate trials (* p < 0.05 and ** p < 0.01 when comparing the non-treat group with Student's t-test).
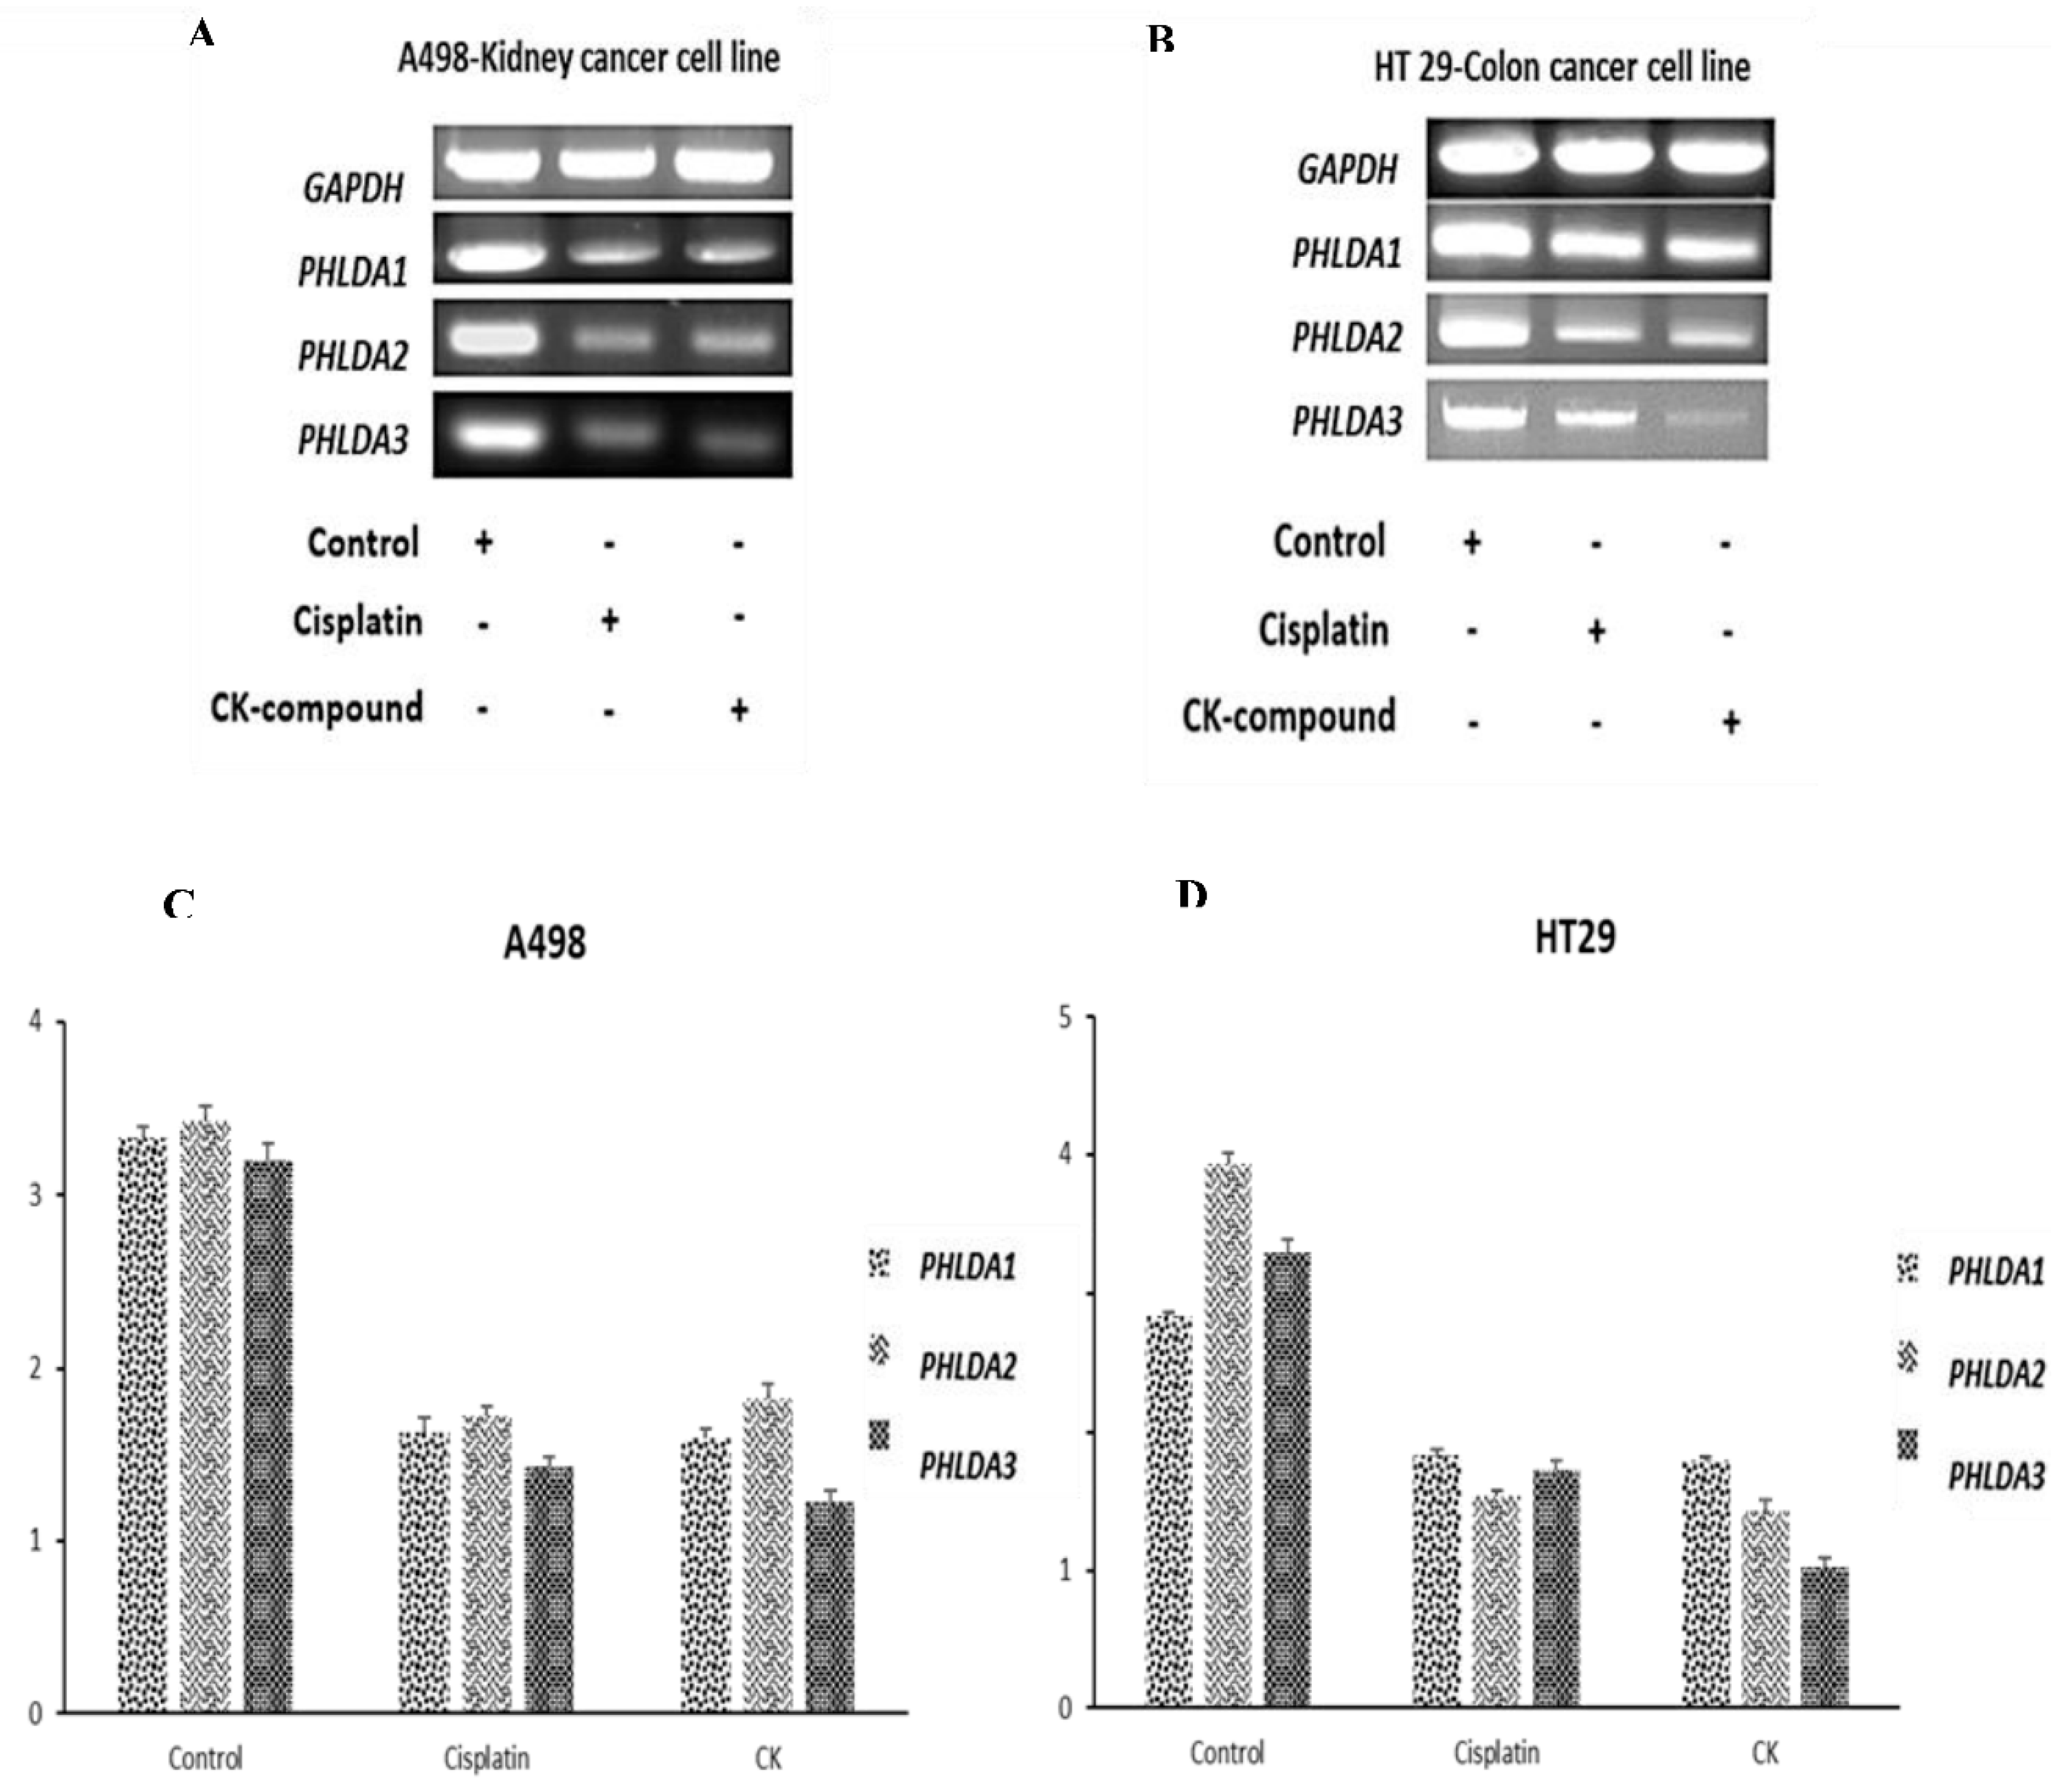

Table 1.
Protein symbol from Genecards.org online database protein sequence from the Universal Protein Resource (Uniport.org) database.
Table 1.
Protein symbol from Genecards.org online database protein sequence from the Universal Protein Resource (Uniport.org) database.
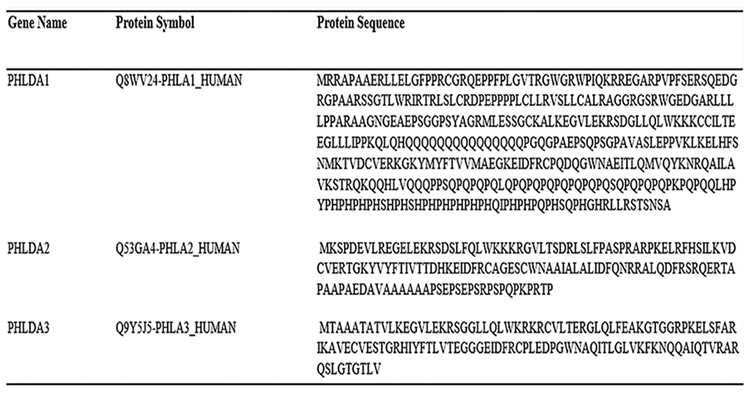 |
Table 2.
Final molecular docking simulation (MDS) score between PHLDA family genes and ginsenoside compound-K (G-CK).
Table 2.
Final molecular docking simulation (MDS) score between PHLDA family genes and ginsenoside compound-K (G-CK).
| Targets | Compound | Binding Energy | Hydrogen bond | Other bonds | Grid Box Center | Dimension |
|---|---|---|---|---|---|---|
| PHLDA1 | Compound K (CK) | -6.9 | SER235, GLY29 | TYR283. GLN287, ALA288, LEU 28, PRO27, VAL30, ASN285, PHE26 | x=1.662, y=-2.6093, Z= 4.3494 |
x=149.63, y=121.75, Z= 104.54 |
| Control (Levofloxacin) | -5.7 | ASP263 | GLN165, TRP167, ARG159, VAL243, GLU244, TYR251, LYS246 | x=1.662, y=-2.6093, Z= -4.3494 |
x=149.63, y=121.75, Z= 104.54 |
|
| PHLDA2 | Compound K (CK) | -7.3 | GLU12, ARG28, LYS26, PRO40 | LYS27, ALA41, LYS26, PHE39, PRO43, SER42, ARG44, PRO47, ALA45, ARG46 | x=-4.233, y=-2.692, Z= 5.189 |
x=89.71, y=47.33, Z= 78.76 |
| Control (Levofloxacin) | -5.7 | ARG16, ASP81 | GLU79,LYS15, ILE80, SER17, ASP18, LEU20, GLN22,SER19 | x=-12.82, y=-4.747, Z= 12.03 |
x=106.89, y=51.43, Z= 92.43 |
|
| PHLDA3 | Compound K (CK) | -6.8 | GLU52 | ARG36, THR34, VAL32, VAL9, ALA7, GLN39, PRO50, PHE41, ARG30, GLY48. GLY47, THR46, THR6 | x=-0.369, y=0.114, Z= 4.93 |
x=52.379, y=38.433, Z= 58.078 |
| Control (Levofloxacin) | -6.0 | TRP26. CYS63 | ARG18, ASP84, PHE73, GLU65, ARG86, THR67 | x=-4.17, y=0.114, Z= 8.49 |
x=59.98, y=38.43, Z= 65.20 |
Disclaimer/Publisher’s Note: The statements, opinions and data contained in all publications are solely those of the individual author(s) and contributor(s) and not of MDPI and/or the editor(s). MDPI and/or the editor(s) disclaim responsibility for any injury to people or property resulting from any ideas, methods, instructions or products referred to in the content. |
© 2025 by the authors. Licensee MDPI, Basel, Switzerland. This article is an open access article distributed under the terms and conditions of the Creative Commons Attribution (CC BY) license (http://creativecommons.org/licenses/by/4.0/).
Copyright: This open access article is published under a Creative Commons CC BY 4.0 license, which permit the free download, distribution, and reuse, provided that the author and preprint are cited in any reuse.


