
Submitted:
14 March 2025
Posted:
17 March 2025
You are already at the latest version
Abstract
Amidst the advent of Industry 4.0, the manufacturing industry is exploring AI methodologies and other data-driven approaches for the understanding and optimization of gas metal arc welding (GMAW) processes. Various data sources such as process data logs and image data are available to the users of modern welding systems. However, to make good use of the data for machine learning, data sets of different quality and information density have to be fused. In this paper, we propose strategies for improving the dataset quality of time series process data and image data from the GMAW process. We explore resampling strategies to ensure the harmonization of time series data. Additionally, ideas for improving image quality from welding process cameras are discussed.
Keywords:
GMAW
; Data Quality
; Image Processing
; Time Series
; Data Augmentation
1. Introduction
Technological advancements in digitalization such as the Internet of Things (IoT) are connecting the physical world to the digital world, facilitating concepts like the digital twins in manufacturing environments [1]. Based on these advances, Industry 4.0 aims to improve efficiency and productivity, utilization and downtime, defect detection and quality control. However, technical challenges such as system modeling and analysis, big data management, and interoperability, among others, are still open issues that can hinder the implementation [2].
Weld seams defects in manufacturing need a lot of time and cost for rework, and in the worst-case scenario, they result in scrap [3]. Quality control is performed in one or more steps after welding, resulting in potentially delayed defect detection. Moreover, even though quality control systems can differentiate between various types of defects in solidified weld seams, they often fail to provide explainable information about the root cause of the defect, such as lack of homogeneity in the material, auxiliary welding wires, variations in shielding gas flow, or fluctuations in the welding process. In this context, the European project called Data and Metadata for Advanced Digitalization of Manufacturing Industrial Lines (metaFacturing) aims to establish a more resilient production process by researching the development of a digitized tool-chain for metal part production, thereby reducing costly rework and scrap resulting from out-of-specification parts [4]. Operators will be equipped with enhanced information and process feedback.
Leveraging the integration of diverse types of data such as welding process data, process data from upstream processes (e.g., casting), quality control data, and material characteristics of the parts to be joined, we are able to analyze whether defects in weld seams may be correlated to information hidden in the characteristics of the corresponding data recorded during processing or along the process chain. By predicting the weld seam quality from the material and welding process data, defects can be identified early (maybe even online), significantly reducing rework, scrap, machine downtime, and energy spent, hence raising material, as well as process efficiency.
In this paper, we aim to address data challenges related to the welding production process. Our main focus is on data fusion across the entire process, encompassing pre-weld, weld, and post-weld stages. Specifically, we concentrate on analyzing both time series and image data to comprehend their complexity and challenges, with the goal of proposing strategies to enhance dataset quality before their utilization in machine learning applications within the welding industry. By leveraging weld pool images and process data obtained from metaFacturing welding lab trials, we explore the potential to extract valuable insights regarding process quality from these sources.
The remainder of the paper is organized as follows. In Section 2, we present an overview of our use case, and the motivation of this work. In Section 3, we describe the materials used in this paper and data challenges. In Section 4, we describe our methodology. In Section 5, we present the results and discussion section. The final section includes the concluding remarks.
2. Structural Gas Metal Arc Welding
The central aspect of the metaFacturing project is the development of two demonstrators with high potential for replication/adaptation and potential impact envisaged for their application and scale-up at the industrial level. The two demonstrators are built for the following production processes: casting and structural welding. In this paper, we are focusing on the welding production process.
2.1. Motivation
Gas metal arc welding (GMAW), also known as metal inert gas (MIG) and metal active gas (MAG) welding, is used for a wide range of applications across many different industries. In general, the goal of the welding process is to permanently join two metal parts. For this purpose, a consumable wire electrode is melted by an electric arc, which is formed between the wire electrode and the base material, and subsequently mixed with the base material. A shielding gas flow protects the welding process from atmospheric contamination. Since its invention in the first half of the 20th century, GMAW processes have evolved rapidly. Modern welding processes are highly dynamic, for example by utilization of pulsed arcs [5], e.g., Fronius Pulse Multi Control (PMC) and by incorporating a backward movement of the wire electrode, e.g., Fronius Cold Metal Transfer (CMT) [6]. Depending on the given application, these processes enable high welding speeds with low heat input, whilst ensuring the required quality criteria (e.g. weld penetration).
In robotic GMAW systems, many different factors such as the wear status of the welding system, the characteristics of the wire and base materials, the design of the parts, the trajectory of the welding torch and the environmental conditions (i.e., temperature, humidity) influence the welding process and therefore the quality of the resulting weld seams. When quality issues arise, identifying and resolving root causes is a difficult and time-consuming task that is typically performed by experts.
2.2. Objectives
The project metaFacturing aims to shed more light on the welding production process by utilizing a data-driven approach. The goal of the use case welding is to increase the efficiency of the process and improve the weld seam quality. The data fusion along the whole production process – pre-weld, weld and post-weld – is a necessary step for the data analysis and a sub-goal of the use case. Using trustworthy AI, the impact of process parameters on the weld seam quality can be identified However, this will only be possible if in an initial step the data is pre-processed to reach the required quality.
To achieve an optimal data environment for identifying and resolving root causes in the welding process, the following objectives have been defined:
- Implementing and evaluating sampling strategies for augmenting time series data.
- Evaluating the quality of the images captured by the camera and analysing possible improvements that could be made.
3. Materials
3.1. Dataset
Following, the data sets used in this work are described.
Time series process data. This dataset was generated by a Fronius TPS/i welding system installed in the production line of a project partner in metaFacturing during welding sessions. It contains 642 sets of historical time series of individual welding welds. In each set, there are two files with distinct sample rates: The first file encompassed 5 features sampled at 10 kHz and the second file included 32 features sampled at 1 kHz. The features can be divided into five different categories (see Table 1):
- (1)
- There are five features in this category which can change continuously and are sampled at 10 kHz. Exemplary features are the current (welding_current) and the voltage (welding_voltage) of the arc.
- (2)
- Ten continuous and dynamic features such as the welding speed (welding_speed) and the motor current of the wire feeder (motor_current) are sampled at 1kHz.
- (3)
- There are 15 boolean features sampled at 1 kHz. These features typically represent higher-order information, e.g., the welding process is currently active (arc_on).
- (4)
- The four discrete features describe the parametrization of the welding process and the status of the welding system at a higher level. Features such as the error code (error_number) generated by the detection of any malfunction of the system are part of this category.
- (5)
- The features in this last category, yield categorical information on the welding process, e.g., the name of the process, like CMT or PMC.
Before utilizing the datasets for analysis, preprocessing was imperative, especially for the features with low frequency. Specifically, for all 642 datasets, features with data values exclusively composed of strings were eliminated due to uniformity in their values. Additionally, the feature arc_on indicates the periods during which welding activity occurs, thereby defining the temporal bounds for our analysis. Within these datasets, one might anticipate unique identification for weld seams; however, this expectation is not met due to the absence of recorded IDs for the parts being welded. This limitation has consequently narrowed the scope of our use case definitions and analyses.
Welding image data. This data has been provided by laboratory phase trials at the Light Metals Technologies Ranshofen Center, known in German as Leichtmetallkompetenzzentrum Ranshofen (LKR), including images captured by the Fronius ArcView2 camera and process parameter information. So far, only one trial has been carried out without capturing HDR images, which is planned for the next phases. The resolution of the images is 1024 x 768 pixels. There are 6,719 images captured at 45 frames per second (fps).
3.2. Data Challenges
In this section, we discuss the challenges related to the previously introduced time series and image datasets.
Time series. The dataset faces challenges in precisely identifying weld seams over time and dealing with features collected at different sampling rates. Data augmentation is used to normalize the dataset for consistent analysis. To address sampling rate discrepancies, both downsampling and upsampling strategies are considered, each with its own set of challenges.
Downsampling involves lowering the sampling rate of a signal, such as reducing multivariate time series data from 10 kHz to 1 kHz, aiming to align high-frequency data with lower-frequency datasets. This adjustment helps reduce data volume, match sampling rates, and lessen noise. However, it poses challenges like aliasing and information loss, where important signal details are missed, leading to distortion [7]. Designing low-pass filters to prevent aliasing while avoiding phase distortion is another hurdle [8]. Additionally, downsampling must manage the computational demands of processing large, high-frequency datasets and maintain the integrity of multivariate relationships within the data.
Upsampling increases the sampling rate of data, in our case, from 1 kHz to 10 kHz, to achieve higher resolution across all features, which is beneficial for detailed analyses or modelling. However, this leads to challenges, primarily due to the introduction of a significant amount of missing data in the upsampled low-frequency features, constituting 90% missing data in our case. The challenges include selecting suitable data imputation methods to estimate missing values without introducing artifacts or distortions, especially in different segments of the data [9,10]. Furthermore, improper filtering during upsampling can result in aliasing, where high-frequency noise is mistaken for low-frequency variations [7]. The process also demands more computational power due to the increased data size and necessitates careful handling to maintain synchronicity in multivariate data, preventing time lags or misalignments that could affect data analysis.
In Section 4.1, we present the methods we applied to resolve most of these challenges.
Image quality. Cameras are increasingly being used in modern welding solutions, for example, to observe the process, measure quality [11], or detect defects [12]. This is because many characteristics of the weld pool and seam can be extracted from a series of frames. However, the quality of the image and its processing possibilities are strongly influenced by the used welding process. The image may or may not contain an arc, which is an important factor to consider. For instance, the CMT process, where the arc is periodically extinguised, allows capturing images with more data in the melt pool area, provided that the camera triggering is correct (see Figure 1a). Welding processes, where the arc is always present, are more demanding for image processing. This is because the arc covers some area of the melt pool and can significantly increase the image contrast. An example of such a process is PMC, which is shown in Figure 1c.
Another challenge is the high contrast in processes where the arc is always turned on, which can make data stored in the frame difficult to process and may cause issues with proper segmentation of the weld seam or weld pool. This issue is often associated with overexposure areas in frames, where the amount of light is too high for the camera sensor to capture the full dynamic range and causes details lost in such areas.
Proper camera angle setup is crucial for capturing the area to be processed. This may require testing different settings, because like for example in Figure 1 the weld pool may be covered by already welded seams. Another camera feature that needs to be set correctly is focus. This can sometimes be problematic, as additional light may be required to focus without an arc. In addition, due to heat haze occurring during welding, it may be more challenging.
What is important when capturing video frames is the correct frame rate, which should match the processing speed. It should be high enough to allow the capture of changes in the image to be processed. However, it has been shown that there is a level at which the results do not become more accurate [13]. In addition, there may be some technical limitations to triggering the camera at the chosen speed, so this must also be taken into account when choosing the frame rate.
4. Methodology
4.1. Data Augmentation for Time Series
In Section 3.2 we mentioned the challenges that are most likely to be expected when applying the downsampling and upsampling data augmentation strategies. In particular, for the time series dataset, the downsampling strategy means resampling five high-frequency features from 10 kHz to 1 kHz, while the upsampling is the vice versa. In this section, we discuss the methods that were utilized to address these challenges, particularly for our time series dataset.
Downsampling. To address the unique downsampling challenges of our dataset, we utilized a low-pass filter to mitigate aliasing, followed by either selecting every sample or averaging over bins of samples to reduce variability, ensuring data integrity and quality. We applied anti-aliasing filters to remove high-frequency components before downsampling, setting the cut-off frequency at 500 Hz to meet the Nyquist criterion [7]. Advanced techniques like wavelet-based filtering were employed to preserve essential information without losing detail [14]. To avoid phase distortion, which could misalign multivariate signals, zero-phase filtering was used, ensuring temporal alignment through forward and backward filtering [15]. Consistent downsampling across all features was maintained to preserve multivariate relationships, verified by cross-correlation analysis to ensure proper synchronicity [16].
Upsampling. The primary challenge of upsampling is the imputation of missing data. To address this, we need a sophisticated approach to resolve ambiguities in the data, which are categorized as either trivial or non-trivial. Trivial ambiguities occur when missing values are flanked by identical values, making imputation straightforward as the pattern is clear. Non-trivial ambiguities, however, arise when there is a transition in values across the missing data, indicating a potential change or event.
In the case of discrete and dynamic features affected by upsampling, we encounter non-trivial ambiguities where sequences transition between different values. These are imputed by maintaining the preceding value until an evident change occurs, thus preserving the sequence integrity. For the continuous and dynamic lower-frequency features, we employed linear interpolation and advanced deep learning models, such as generative adversarial networks (GANs) [17] and transformer-based models [18]. These models excel in capturing temporal dependencies and feature correlations, thereby generating realistic synthetic data for missing values and offering a nuanced imputation approach that outperforms traditional methods like mean imputation or linear regression.
For other challenges, like improper filtering and ensuring synchronicity in multivariate time series data, we applied strategies similar to those used in downsampling, focusing on maintaining the data’s integrity and coherence throughout the process.
4.2. Welding Image Quality Improvements
Capturing frames of a welding process is very challenging. There are many problems in this area, of which the most important for the metaFacturing project have been described in Section 3.2. In this section, initial ideas for improving image quality are presented. Good quality weld images are important because they can be processed in a further step and the information extracted can then enhance the time series analysis.
Frame rate selection. Selecting the correct frame rate for video frames of the welding process is very important. Not only does it have a high impact on the amount of data to be stored and processed, but it have influence on the overall defect classification. However, capturing more frames may not always help achieving higher defect detection quality [13]. Initially, the maximum frame rate of the camera can be selected and then, after model development, different trials with different numbers of frames per second can be examined to select the final one.
Camera image improvements. One of the biggest challenges in capturing a welding image is the very high contrast of the image. In addition, there are often areas that are overexposed, resulting in data loss. This problem is particularly evident in welding techniques where the arc is always on. Some materials, such as aluminium or titanium, are highly reflective, making further processing even more difficult.
As the metaFacturing project focuses on aluminium welding using a PMC welding process, the image captured by the camera using traditional methods can be very difficult to analyse. To improve image quality and the amount of data captured, the Fronius ArcView2 camera was used in conjunction with the High Dynamic Range (HDR) technology it supports. HDR is based on taking several images with different exposure times and then stitching them together to increase the dynamic range of the scene. An example of an HDR image from the ArcView2 camera for aluminium welding with CMT and PMC are shown in Figure 1b,d. It can be seen that both, the weld pool and the weld seam, are clearly visible compared to the regular image from the camera.
Image preprocessing. Once images have been captured, they often need to be pre-processed to prepare them for further analysis. One of the areas that can be additionally improved is the local image contrast. One of the most efficient and commonly used methods is Contrast Limited Adaptive Histogram Equalisation (CLAHE)[19], which computes many histograms of different regions and then redistributes the brightness values across the image. After image processing with CLAHE, some details are easier to see and the overall contrast is more balanced. When analysing images, it can be very valuable to reduce the amount of data to be processed. This can be achieved by selecting a region of interest (ROI) in the image that includes only interesting parts, like the weld seam, weld pool and nozzle.
Weld pool segmentation. The methods outlined in the preceding sections are expected to significantly enhance the camera-captured image quality, enabling clearer visibility of weld pool boundaries and facilitating the recognition of their shape and size. Moreover, these improvements should yield more detailed weld seams, thereby enhancing the quality of their analysis.
5. Results and Discussion
In this section, we review the results of the methodologies previously discussed. The effectiveness of the downsampling and upsampling strategies outlined in Section 4.1 is illustrated in Figure 2. We assessed these strategies by performing a frequency analysis on the original 10 kHz and 1 kHz features, along with their 1 kHz downsampled and 10 kHz upsampled versions, using wavelet concepts [20]. This analysis highlights changes in frequency content and energy across the time series, with the figure indicating that our sampling strategies successfully preserve the essential frequencies throughout the period.
The welding camera image improvements described in Section 4.2 were analysed and initially tested using images taken during laboratory phase trials at LKR. The camera software was not operated in HDR mode, so this improvement has only been tentatively examined using sample images provided by Fronius. The next trials will include HDR images, which will allow us to extend the analysis at a later stage.
For the initial analysis, 10 frames were selected from different video files. Due to the insufficient number of data for the deep learning approach, the weld pool segmentation was performed using the watershed algorithm. The results were visually analysed by a human.
With the initial setup (no HDR, with ROI selected) the weld pool was not correctly segmented, and the arc light was selected as the area in most of the images tested. With CLAHE added, the segmentation results were better, as they included most of the visible part of the weld pool. Due to the very bright arc, it was also selected, as well as additional reflections, which made the segmentation unusable for practical applications. For the images taken in HDR mode, the dynamic range of the image was sufficient to show the weld pool in the arc area and the segmentation was much more accurate as a result. A drawback of the algorithm used was that the segmented area boundaries contained a lot of noise and were not tight to the pool. After the next experiment trials, this problem will be further investigated and the deep learning method will be developed.
6. Conclusion and Future Work
In this paper, challenges related to time series data (i.e., sampling rate variations) and image data (i.e., very high contrast or overexposed areas due to an ever present welding arc) collected during the welding process have been presented. Additionally, strategies for increasing the quality of GMAW production data have been discussed.
We have introduced several techniques aimed at significantly enhancing the quality of image analysis outcomes. However, due to the limitation of having only initial images available for experimentation, our efforts in this area are preliminary.
For future work, particularly with the acquisition of more images, especially those captured in HDR mode, we plan to develop a deep learning-based method for weld pool segmentation. Additionally, we aim to extract various parameters from the images to provide insights into weld quality. In the future research dealing with the time series data, we intend to investigate anomalies in the generated upsampled and downsampled datasets. Additionally, we plan to incorporate features that will allow for the unique identification of weld seams and their quality statuses. This enhancement will broaden our analysis scope, enabling us to study and model the anomalies likely to arise during the welding process.
Acknowledgments
Funded by the European Union. Views and opinions expressed are however those of the author(s) only and do not necessarily reflect those of the European Union. Neither the European Union nor the granting authority can be held responsible for them. The work described in this paper is supported by the metaFacturing project (GA 101091635), which has received funding under the Horizon Europe programme. This preprint has not undergone peer review or any post-submission improvements or corrections. The Version of Record of this contribution is published in Lecture Notes in Networks and Systems (volume 1198), Distributed Computing and Artificial Intelligence, Special Sessions I, 21st International Conference Conference proceedings and is available online at https://doi.org/10.1007/978-3-031-76459-2_8
References
- Lampropoulos, G.; Siakas, K.; Anastasiadis, T. Internet of things in the context of industry 4.0: An overview. International Journal of Entrepreneurial Knowledge 2019, 4–19. [Google Scholar]
- Kalsoom, T.; Ahmed, S.; Rafi-ul Shan, P.M.; Azmat, M.; Akhtar, P.; Pervez, Z.; Imran, M.A.; Ur-Rehman, M. Impact of IOT on Manufacturing Industry 4.0: A new triangular systematic review. Sustainability 2021, 13, 12506. [Google Scholar] [CrossRef]
- Sousa, J.; Ferreira, J.; Lopes, C.; Sarraipa, J.; Silva, J. Enhancing the steel tube manufacturing process with a zero defects approach. In Proceedings of the ASME international mechanical engineering congress and exposition. American Society of Mechanical Engineers; 2020; Vol. 84492, p. V02BT02A022. [Google Scholar]
- metaFacturing Project Partners. Data and Metadata for Advanced Digitalization of Manufacturing Industrial Lines. https://metafacturing.eu/, 2023. Accessed: 2024-03-19.
- Kah, P.; Suoranta, R.; Martikainen, J. Advanced gas metal arc welding processes. The International Journal of Advanced Manufacturing Technology 2013, 67, 655–674. [Google Scholar] [CrossRef]
- Selvi, S.; Vishvaksenan, A.; Rajasekar, E. Cold metal transfer (CMT) technology - An overview. Defence Technology 2018, 14, 28–44. [Google Scholar] [CrossRef]
- Proakis, J.G. Digital signal processing: Principles, algorithms, and applications, 4/E. Pearson Education India, 2007. [Google Scholar]
- Oppenheim, Alan V. & Schafer, R.W. In Discrete-time signal processing; Pearson Education India, 1999.
- Agnihotri, S.; Grabinski, J.; Keuper, M. Improving Stability during Upsampling–on the Importance of Spatial Context. arXiv preprint arXiv:2311.17524, arXiv:2311.17524 2023.
- Jäger, S.; Allhorn, A.; Bießmann, F. A benchmark for data imputation methods. Frontiers in big Data 2021, 4, 693674. [Google Scholar] [CrossRef] [PubMed]
- Hartung, J.; Jahn, A.; Bocksrocker, O.; Heizmann, M. Camera-based in-process quality measurement of hairpin welding. Applied Sciences 2021, 11, 10375. [Google Scholar]
- Wang, J.; Zhang, Z.; Bai, Z.; Zhang, S.; Qin, R.; Huang, J.; Wen, G. On-line defect recognition of MIG lap welding for stainless steel sheet based on weld image and CMT voltage: Feature fusion and attention weights visualization. Journal of Manufacturing Processes 2023, 108, 430–444. [Google Scholar] [CrossRef]
- Javanbakhtghahfarokhi, N.; Lopez, A.N.; Rodrıguez-Echeverrıa, J.; Gautama, S. Towards a zero-defect in welding: An exploration of factors to improve the training data for image classification. In Proceedings of the Accepted for publication; 2024. [Google Scholar]
- Misiti, M.; Misiti, Y.; Oppenheim, G.; Poggi, J.M. Wavelets and their Applications; John Wiley & Sons, 2013.
- Smith, S.W.; et al. The scientist and engineer’s guide to digital signal processing, 1997.
- Shumway, R.H.; Stoffer, D.S.; Stoffer, D.S. Time series analysis and its applications; Vol. 3, Springer, 2000.
- Yoon, J.; Jordon, J.; Schaar, M. Gain: Missing data imputation using generative adversarial nets. In Proceedings of the International conference on machine learning. PMLR; 2018; pp. 5689–5698. [Google Scholar]
- Du, W.; Côté, D.; Liu, Y. Saits: Self-attention-based imputation for time series. Expert Systems with Applications 2023, 219, 119619. [Google Scholar] [CrossRef]
- Pizer, S.; Johnston, R.; Ericksen, J.; Yankaskas, B.; Muller, K. Contrast-limited adaptive histogram equalization: speed and effectiveness. In Proceedings of the [1990] Proceedings of the First Conference on Visualization in Biomedical Computing; 1990; pp. 337–345. [Google Scholar]
- Mallat, S. A wavelet tour of signal processing; Elsevier, 1999. [Google Scholar]
Figure 1.
An example captured frame of a CMT and PMC process of aluminium welding.
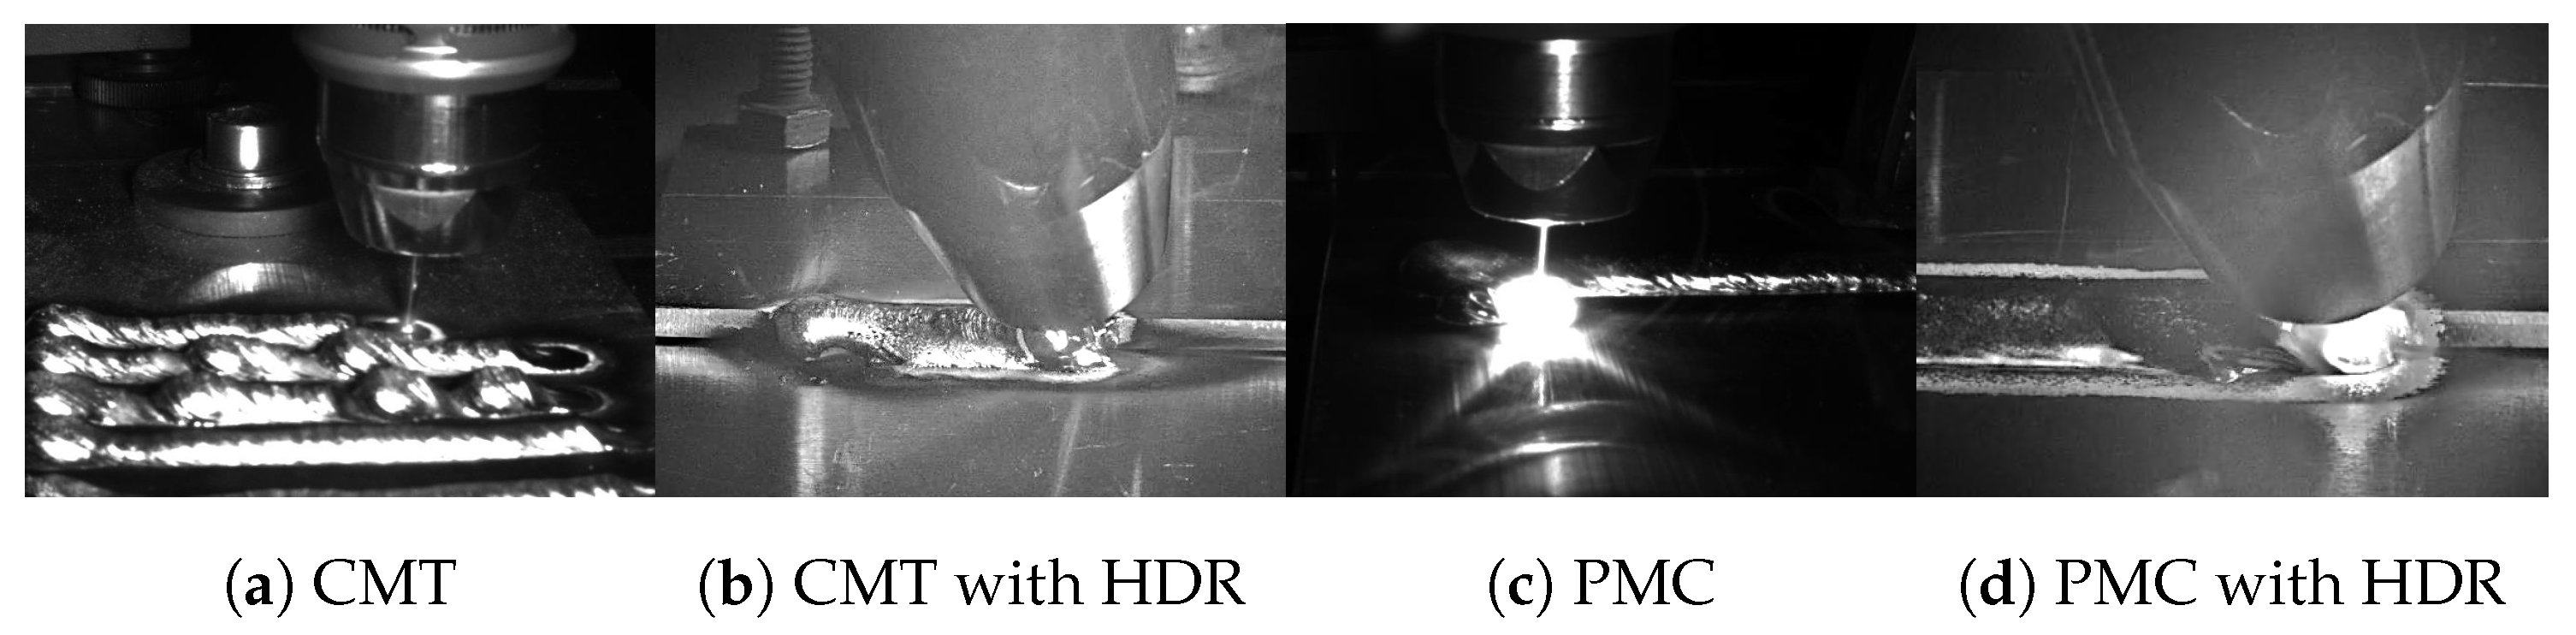
Figure 2.
Comparison of original 10 kHz welding_current and 1 kHz motor_current signals with their corresponding downsampled (resp. upsampled) versions.
Figure 2.
Comparison of original 10 kHz welding_current and 1 kHz motor_current signals with their corresponding downsampled (resp. upsampled) versions.


Table 1.
Features categories in welding datasets.
| Category | Feature count | Sample rate | Data type | Feature type |
|---|---|---|---|---|
| (1) | 5 | 10 kHz | Float | Continuous and dynamic |
| (2) | 10 | 1 kHz | Float | Continuous and dynamic |
| (3) | 15 | 1 kHz | Bool | Discrete and binary |
| (4) | 4 | 1 kHz | Integer | Discrete and dynamic |
| (5) | 3 | 1 kHz | String | Categorical and dynamic |
Disclaimer/Publisher’s Note: The statements, opinions and data contained in all publications are solely those of the individual author(s) and contributor(s) and not of MDPI and/or the editor(s). MDPI and/or the editor(s) disclaim responsibility for any injury to people or property resulting from any ideas, methods, instructions or products referred to in the content. |
© 2025 by the authors. Licensee MDPI, Basel, Switzerland. This article is an open access article distributed under the terms and conditions of the Creative Commons Attribution (CC BY) license (http://creativecommons.org/licenses/by/4.0/).
Copyright: This open access article is published under a Creative Commons CC BY 4.0 license, which permit the free download, distribution, and reuse, provided that the author and preprint are cited in any reuse.


