
Submitted:
14 March 2025
Posted:
17 March 2025
You are already at the latest version
Abstract
In this paper an integrated approach by using microwave and optical satellite data, respectively acquired by Sentinel-1 (S-1) and Sentinel-2 (S-2) was presented for monitoring vegetation status. Experimental data and electromagnetic models have been combined to relate backscattering from S-1 and optical indices from S-2 t to plant conditions, which were evaluated by measuring the vegetation photochemical reflectance index (PRI), the vegetation and the soil water content. Field data were collected in two sorghum fields close to Florence in Tuscany (Central Italy) dur-ing summers 2022 and 2023. The results show significant correlations between microwave and optical data with respect to field measurements, highlighting the potential of remote sensing techniques for agricultural monitoring and management, also in response to climate change.
Keywords:
Sentinel-1
; backscattering
; Sentinel-2
; optical indices
; PRI
; sorghum
; plant water content
; Water Cloud Model
1. Introduction
Monitoring crop conditions is essential for optimizing agricultural practices and reducing water wastes. The increasing impacts of climate change, with more and more frequent extreme weather events and persistent droughts [1,2], has strong effect on crop productivity [3], health and yields [4]. Recently, these risks have been expanding in several regions within the Mediterranean basin [5]. Therefore, an effective management of soil and water resources can be considered as a key factor to achieve sustainable food production [6]. In this context, monitoring vegetation from space can greatly enhance our understanding of Earth's surface processes as hydrological cycle and crop productivity. With the rapid advancements in remote sensing technology, estimation of several natural parameters with high spatiotemporal resolution is becoming more and more feasible. Remote sensing techniques support observations of the most important surface characteristics according to different sensors: the optical ones, such as visible-near-infrared [7], hyperspectral [8], and thermal infrared sensing [9], have limited penetration capabilities, making impossible to obtain soil information in presence of dense vegetation layers and of the entire vegetation structure in case of well-developed plants. Nevertheless, the signal in these wavelengths (λ) is very sensitive to vegetation pigments and photosynthetic activity [10]. Furthermore, the use of these sensors is hampered by weather conditions like the presence of clouds [11], rainfalls and solar illumination. Microwave sensors, such as synthetic aperture radar (SAR), have instead a deeper penetration and better capability to observe objects in absence of solar light and cloud cover. In this wavelength range, the dielectric properties of vegetation are affected both by water content and geometric characteristics of plants, including the size of leaves, branches, and stems [12]. These elements influence scattering and absorption mechanisms, which vary according to frequency, incidence angle of observation, and polarization [13,14]. Moreover, the electromagnetic response of soil under vegetation greatly influences the backscattering (σ0), due its high sensitivity to soil moisture content (SMC) and surface roughness [15]. The dielectric properties govern the interactions of backscatter with the medium through various phenomena such as absorption, scattering, and penetration The penetration of microwave signal increases at lower frequency, thus is higher in L- and P-band [16,17].
The launch of S-1 and S-2 missions by the European Space Agency (ESA) has significantly increased the possibility of monitoring crop conditions and soil moisture from space [18,19]. S-1, equipped with a C-band SAR, offers all-weather, day-and-night imaging capabilities that are crucial for consistent monitoring of agricultural fields. S-2 provides high-resolution optical imagery by using 13 spectral bands, allowing detailed assessment of vegetation health and vigor by most widely used vegetation indexes [20].
In this paper, a very important index, i.e. the Photochemical Reflectance Index (PRI), has been taken into consideration because it is widely considered as an indicator of photosynthetic efficiency, productivity and related to water-stress index [21]. PRI is obtained from the normalization between the difference of reflectivity at 531 nm and a reference wavelength, typically at 550 or 570 nm and it is used to assess Radiation Use Efficiency (RUE) at leaf, canopy, and ecosystem levels [22,23,24,25]. The consistency of the RUE–PRI relationship suggests a functional convergence in the components affecting carbon uptake efficiencies [26]. Then, complementing NDVI-like indices with PRI can improve the precise monitoring and management of agricultural ecosystems [27]. PRI can be measured in-situ by using portable sensors; however, due to the bands needed for its computation, PRI can be derived from MODIS but not from S-2.
Due to the peculiar characteristics of optical and microwave satellite data, the integration of these two types of measurements enables a comprehensive approach for assessing crop health, water status, and soil conditions, by combining different sensitivities, thus obtaining more in-depth information on the canopy [28]. The experimental results have been confirmed and evaluated by using well assessed electromagnetic models such as the Water Cloud Model (WCM) which was used for estimating the vegetation water content. Although the WCM is not conceived recently, it is still used at present in in remote sensing studies to estimate the water content in the canopy, the aboveground biomass and the soil moisture [29,30,31,32,33], since it offers a good tradeoff between accuracy and computational cost. In this study, WCM has been reappraised as proposed in [15], by coupling it with the Integral Equation Model (IEM) [34], Oh [35] and the Dobson model [36].
In this paper, the vegetation status and health in two sorghum fields close to Florence, Italy has been evaluated by exploiting on-site measurements of PRI and further integration with the PWC obtained from S-1 data. The analysis and data collection have been performed during summer 2022 [37] and in 2023 [38]. Additionally, we used a series of well-known S-2 derived indices, that are sensitive to plant health conditions to confirm their sensitivity to vegetation water status.
The novelty of this research work consists of the simultaneous use of SAR and multispectral data for estimating PWC and PRI. In particular, SAR data have been used as inputs of electromagnetic models as WCM and IEM for retrieving PWC, which in turn was correlated with PRI. Some indices derived from S-2 have been also related to PRI. Another important aspect was the use of morning and afternoon S-1 passes for exploiting the SAR sensitivity to the diurnal variations of PWC and PRI.
The results of this study are expected to contribute to improve agricultural management practices and enhance the understanding of remote sensing applications in monitoring crop water status and health.
2. Materials and Methods
2.1. Test Area
During summers of 2022 and 2023, measurement campaigns were carried out in two sorghum fields (Figure 1 and Figure 2). Both fields were flat, rainfed, and located close to Florence, in Italy with at the following coordinates: latitude 43.829625°, longitude 11.151517°; and 43.827674°, longitude 11.149736° [39]. Measurements were performed from 2nd of July to 1st of September in 2022 and from 2nd of July to 2nd of October in 2023.
2.2. Satellite Data
S-1 is a constellation of two polar-orbiting satellites, Sentinel-1A (S-1A) and Sentinel-1B (S-1B), sharing the same orbital plane and carrying a SAR in C-band (5.4 GHz). Unfortunately, S-1B experienced an anomaly rendering it unable to deliver radar data since the end of 2021, which reduced the revisiting frequency of most of the Earth's surface to 12 days from the original 6 days [40]. The orbits can be of ascending or descending type. Ascending orbits acquire images in the afternoon, while descending orbits in the morning. The characteristics of satellite data have been reported in Table 1.
S-2 has a temporal resolution of 5 days, overpassing the area at 10:13 UTC (12:13 UTC). S-2 has two identical satellites which operate simultaneously with a phase difference of 180° in a sun-synchronous orbit. The platform provides a total of 13 spectral bands with a spatial resolution ranging between 10 and 60 m. To understand the health status of the sorghum crops in the considered periods, the evolution of the following four S-2 derived indices were analyzed: NDRE (Normalized Difference Red Edge Index), RGR (Red Green Ratio), PSRI (Plant Senescence Reflectance Index) and SIPI (Structure Insensitive Pigment Index) (Table 2). These indices have been selected among many available indices as the best related to PRI, showing high determination coefficients (R2>0.5, 0.6), as it can be observed in the diagrams and tables of the section 3 Results.
Furthermore, the median value of the pixels in each field was chosen as the estimator, as for S-1 data.
Both S-1 and S-2 data were gathered from Google Earth Engine (GEE). GEE is a cloud computing platform designed for processing satellite imagery and other Earth observation data, with the capability to handle large datasets by distributing computations across multiple servers worldwide [45]. Users can interact with the platform via an interactive development environment (IDE), using Python and JavaScript libraries [46]. Only L2-A, S-2 cloud-free scenes were processed. Scenes from S1 and S2 acquired in (almost) the same day were considered as couple and described in Table 3. In these dates the plants reached 70% of their maximum height development in the field had a height corresponding at least to the 70% of the full height in order to exclude low PWC values because when plants are small and just started their photosynthetic activity, a low value of PWC can be associated to high PRI, especially on hot and sunny days. In the same way, for S-2 data, when the contribution of the soil to the reflectance signal was significant due to low vegetation fractional cover, we decided to exclude the points where the plants height were lower than 70% [47,48] compared to the full height.
Integrating the PRI in situ and combining this information with the PWC, obtained from S-1 data, and a series of well-known indices from S-2, which are sensitive to various plant conditions, a more precise and comprehensive investigation of crop health and water status over the two-year study period was achieved.
2.3. In-Situ Measurements
SMC was measured using the SPECTRUM-350 TDR probe [49], and vegetation PRI was assessed through the PlantPen PRI210® [50], during the satellite passes. In situ measurements started 20 minutes before and continued until 20 minutes after the satellite acquisitions. More in detail, PRI values were obtained by taking three measurements for leaf on four different leaves from a sample of ten sorghum plants. SMC values were obtained by taking three measurements per sample across ten distinct areas of the field. Given the relatively small size of the fields, a single value of PRI and SMC was associated with each satellite pass. To reduce the influence of potential outliers on ground and remote sensing measurements, the values of σ0, reflectance in the S-2 bands, and PRI over the fields were represented by the median, while SMC values were obtained using the mean, due to the strong spatial homogeneity of the measurements across different field zones. Consequently, each satellite pass was associated with a value of σ0 and reflectance corresponding to the in-situ measurements. Additionally, the soil roughness under bare soil conditions or when vegetation is very small was measured, using a needle profilometer to measure correlation length (Lc) and the standard deviation of surface height (s) through an image processing script implemented in Matlab. Moreover, PWC was obtained by measuring the fresh weight of a sample consisting of three plants in the field, then drying in an oven at 80°C for 24 hours. The plant density in the fields was about 33 plants per m² in 2022 and 40 per m² in 2023. The PWC was measured once for each pair of consecutive descending-ascending satellite passes, since the water variation over 36 hours is negligible [51] and comparable to the intrinsic uncertainties of the instruments.
2.4. Electromagnetic Models
In order to analyze and interpret the satellite data, some electromagnetic models were employed, including the WCM, the IEM, in combination with the Oh model for estimating the cross polar σ0 [35], and the Dobson model for calculating the dielectric permittivity of the soil. The WCM considers the canopy and underlying soil separately, allowing the estimation of PWC by accounting the vegetation attenuation effects. In our study, we measured the SMC and the variables to estimate PWC that minimize the difference between the σ0 measured by S-1 and simulated by the WCM by the formula:
where:
= incidence angle
= simulated soil backscatter
= free parameters
To estimate the parameters A and B, the couple (A, B) that minimizes the difference between the measured σ0 by S-1 and the one simulated by the WCM was determined. A and B parameters were estimated within a discrete set of values {A1, A2, A3, … AM} and {B1, B2, B3, … BN}. For each combination of elements from these sets, the absolute difference between the σ0 measured by S-1 and σ0WCM was calculated in linear scale. This process resulted in a matrix of σ0 linear differences with a number of rows corresponding to the cardinality of A (M) and columns corresponding to the cardinality of B (N). The cell with the smallest value indicates the couple (A, B), that minimize the difference between measured and simulated σ0. The A and B extracted for this study were 0.001 and 0.244, respectively, in VH polarization and exponential autocorrelation function for soil roughness estimation. In VV polarization the estimated PWC values were less reliable due to the higher sensitivity of VV polarization to SMC than VH, as it has already been demonstrated in literature [52] and verified experimentally during the 2022 campaign [37].
3. Results
During the two summer seasons the impact of SMC on photosynthetic activity was investigated. As it can be noted in Figure 3, where the rainfall data downloaded at [53] were reported, a very dry season occurred during summer 2022 and rainfall arrived shortly before the harvest in the last days of August. In March 2022, the rains were concentrated in only 2 thunderstorms, whereas, in 2023, rainfall was concentrated in spring and a dry September was present, when the crop was in senescence phase. The observation revealed that PRI has lower peaks in summer season of 2022, also indicating reduced photosynthetic activity in response to lower SMC. This behavior is illustrated in Figure 4, where the boxplots of measured PRI and SMC were compared for 2022 and 2023. The boxplots showed for PRI (left) and SMC (right) for each field and for the entire year. PRI values tend to be higher in 2023 than in 2022 (although with higher dispersion), whereas SMC increases significantly from 2022 to 2023 (although generally reaching low values: 5-10% in 2022 and 10-15 in 2023.
To better investigate the water and health status of vegetation, the indices listed in Table 2 were associated to the PRI measurements which have been collected simultaneously to S-2 passes. Figure 5 and Figure 6 show the relationships of the optical indices obtained from S-2 with PRI values measured on ground in the two years of observation, in the top leaves of vegetation and all leaves measured, respectively. Given the almost negligible penetration of the optical wavelengths inside the vegetation, the results using only the top leaves of vegetation tend to be better than those obtained using all the leaves.
Then, the relationship between the PWC derived from S-1 data and the PRI measured in-situ was explored to better understand the vegetation water status and its impact on photosynthetic efficiency. The results of Figure 7 showed a clear relationship between PWC and PRI, provided only data collected in well-developed conditions (more or equal to 70% of the maximum plant height) or senescence stage should be taken into consideration, as already stated in section 2.2.
To go deeper into this investigation, the relationships between PWC estimated from S-1 and the S-2 indices, already indicated in Table 2, were analyzed. The Figure 8 illustrates such relationships, highlighting the effectiveness of integrating SAR and optical remote sensing data for a more complete agricultural monitoring.
Finally, an analysis was performed to investigate the variations of PWC and PRI [54]. This was achieved by using the difference between ascending and descending orbits of S-1, taking advantage of the different time of their acquisitions (i.e. ascending in the afternoon and descending in the morning). The differences in PWC and PRI have been computed considering all orbit acquisitions, removing values corresponding to measures carried out in presence of surface water or mud and thus with extremely high SMC values (Figure 9). We made sure that were not due to variation in plant biomass, by taking into consideration only well-developed plants (in a range of PWC between 1.85 and 6 Kg/m2). From the diagram we can note that there is a rather clear trend between ΔPRI and ΔPWC, thus confirming the ability of both optical and SAR systems in assessing the water status of crops.
4. Discussion
The use of both SAR (of S-1) and multispectral and (S-2) can provide a robust approach for monitoring crop conditions, particularly for assessing vegetation water status under varying environmental conditions. The study demonstrated that the combination of these data is able to catch the complex interactions between soil and vegetation, providing valuable insights that single-sensor approaches might overlook or fail to evaluate. The relationship between PRI, an index sensitive to changes in the photosynthetic efficiency of plants (measured using a portable device) and SMC (measured on ground with TDR probes) highlighted how plants react with respect to stress environment conditions. This finding underscores the potentiality of combining SAR and optical indices to better understand plant-water-health relationships, which is crucial for improving irrigation practices and crop management. Data from S-1 can thus be used to estimate either PWC and SMC, whereas, the optical data from S-2 provided complementary information on leaf pigments and leaf water status, enhancing overall accuracy. Given the strong relationship between PRI and S-2 indices, similar information can also be derived using both satellite datasets avoiding the need of in-situ PRI leaf measurements. This novel approach offers a reliable method for identifying the plant water status. By leveraging the complementary strengths of SAR and optical sensors, it is possible to develop more accurate models for predicting crop yield, optimizing water usage, and responding to environmental stressors in almost real time. Furthermore, the analysis of S-1 data across different orbital passes (ascending and descending) highlighted notable temporal variations in PWC revealing variations in plant status. These variations [55], highlight the sensitivity of SAR measurements to changes in PWC, emphasizing the importance of integrating multi-sensor data. The corresponding observed variations of PRI offer a powerful tool for assessing crop health, particularly in semi-arid regions [56] where water availability is a critical factor. Although PRI cannot be measured from S-2, the correlations found between PRI and some selected optical indices derived from S-2 data confirms the possibility of investigating the water status and stress of crops from satellite. Furthermore, since most agricultural fields are rainfed, these methodologies can be used to understand the local health status of agricultural lands that in recent years have seen increasing damages caused by climate change, such as a yield loss [57,58,59].
5. Conclusions
This study aimed at exploring the integration between different satellite remote sensing data, i.e. SAR and multispectral data, to better investigating the water and health status of agricultural crops. The satellite data were compared with in-situ measurements of SMC, surface roughness, plant parameters, as well as leaf PRI measurements. The use of open-source data and products, such as those provided by the European Space Agency's Copernicus platform elaborated in GEE, ensured the full reproducibility of the methodologies developed in this study. The integration of electromagnetic models such as the WCM and IEM allowed for a detailed analysis and interpretation of the obtained information. The comparison of data from very close S-1 and S-2 passes allowed the assessment of some relationships between optical indices and the daily variations of PWC, which was directly measured in the field. PRI values were associated with several S-2 indices, showing a correlation between these variables, consistent with studies reported in the literature. These comparisons have clearly highlighted the relationships between the analysed multispectral indices and the vegetation water content, and consequently, the health status of the plants. The analysis also revealed a correlation between the variations in PWC and the xanthophyll cycle, which characterizes the photosynthetic state of the plants. Given PRI's sensitivity to plant health and stress, the study demonstrated that consistent variations in PRI may correspond to changes in water content as measured by satellite sensors. The methodology adopted in this study suggests several paths to follow for future research. One possible direction is the validation of the methodology on larger scales, for instance, by using PRI values obtained from the MODIS satellite platform, although with worse spatial resolutions, in the order of 500 meters or 1 kilometer. In any case, the high correlations found between optical indices from S-2 and PRI allow the possibility of investigating the crop water status directly from satellite. An additional area of investigation could be the represented by the analysis of the problem from a radiometry perspective, as well as the possibility of improving vegetation parameterization using more complex electromagnetic models and potentially for different frequencies. Consequently, additional experimental data and analyses will be necessary to move this research forward.
Author Contributions
conceptualization: S. Pilia., E. P., G. F.; methodology: S. Pilia.; software: S.Pilia., F. P.; validation: S. Pilia., G. R.; data curation: S. Pilia, L. S., F. B., A. L.; formal analysis: F. B.; investigation: E. P., G. R., A. L.; resources: L. S.; writing—original draft: S. Pilia.; writing—review and editing, G. F.; E. S., S. Pettinato., S. Paloscia.; supervision: G. F.; E. S., S. Paloscia.
Funding
This research was partially funded by Ente Cassa di Risparmio through the projects “Formazione di nuovi ricercatori esperti nelle tecnologie sviluppate presso lFAC-CNR per agro-sensing, diagnostica medica precoce, monitoraggio dell’aria, processi di degrado del patrimonio culturale e del costruito (IFACxFI)”, number DIT.AD016.099 and FOE 2020 “Transizione industriale e resilienza delle Società post-Covid19 – AGROSENSING, number DIT.AD022.180.
Data Availability Statement
Conflicts of Interest
The authors declare no conflicts of interest. The funders had no role in the design of the study; in the collection, analyses, or interpretation of data; in the writing of the manuscript; or in the decision to publish the results.
References
- Furtak, K., & Wolińska, A. (2023). The impact of extreme weather events as a consequence of climate change on the soil moisture and on the quality of the soil environment and agriculture–A review. Catena, 231, 107378. [CrossRef]
- Donati, I. I. M., Viaggi, D., Srdjevic, Z., Srdjevic, B., Di Fonzo, A., Del Giudice, T., Cimino, O., Martelli, A., Dalla Marta, A., Henke, R., & Altobelli, F. (2023). An analysis of preference weights and setting priorities by irrigation advisory services users based on the analytic hierarchy process. Agriculture, 13(8), 1545. [CrossRef]
- Della Rocca, F., De Feis, I., Masiello, G., Pasquariello, P., & Serio, C. (2023, October). Comparison of the IASI water deficit index and other vegetation indices: the case study of the intense 2022 drought over the Po Valley. In Remote Sensing of Clouds and the Atmosphere XXVIII (Vol. 12730, pp. 94-107). SPIE.
- Farooq, A., Farooq, N., Akbar, H., Hassan, Z. U., & Gheewala, S. H. (2023). A critical review of climate change impact at a global scale on cereal crop production. Agronomy, 13(1), 162. [CrossRef]
- Ramat, G., Santi, E., Paloscia, S., Fontanelli, G., Pettinato, S., Santurri, L., Souissi, N., Da Ponte, E., Abdel Wahab, M.M., Khalil, A.A., Essa Y.H., Ouessar, M., Dhaou, H., Sghaier, A., Kassouk, Z. & Lili Chabaane, Z. (2023). Remote sensing techniques for water management and climate change monitoring in drought areas: case studies in Egypt and Tunisia. European Journal of Remote Sensing, 56(1), 2157335. [CrossRef]
- FAO. 2023. FAO publications catalogue 2023. Rome. [CrossRef]
- Tian, J., Zhang, Z., Philpot, W. D., Tian, Q., Zhan, W., Xi, Y., Wang, Y & Zhu, C. (2023). Simultaneous estimation of fractional cover of photosynthetic and non-photosynthetic vegetation using visible-near infrared satellite imagery. Remote Sensing of Environment, 290, 113549. [CrossRef]
- Thenkabail, P. S., Smith, R. B., & De Pauw, E. (2000). Hyperspectral vegetation indices and their relationships with agricultural crop characteristics. Remote sensing of Environment, 71(2), 158-182.
- Harries, J., Carli, B., Rizzi, R., Serio, C., Mlynczak, M., Palchetti, L., ì.Maestri, T., Brindley, H., & Masiello, G. (2008). The far-infrared Earth. Reviews of Geophysics, 46(4).
- Wolanin, A., Camps-Valls, G., Gómez-Chova, L., Mateo-García, G., van der Tol, C., Zhang, Y., & Guanter, L. (2019). Estimating crop primary productivity with Sentinel-2 and Landsat 8 using machine learning methods trained with radiative transfer simulations. Remote sensing of environment, 225, 441-457. [CrossRef]
- Murino, L., Amato, U., Carfora, M. F., Antoniadis, A., Huang, B., Menzel, W. P., & Serio, C. (2014). Cloud detection of MODIS multispectral images. Journal of Atmospheric and Oceanic Technology, 31(2), 347-365. [CrossRef]
- Paloscia, S., Santi, E., Fontanelli, G., Montomoli, F., Brogioni, M., Macelloni, G., Pampaloni, P., & Pettinato, S. (2014). The sensitivity of COSMO-SkyMed backscatter to agricultural crop type and vegetation parameters. IEEE Journal of Selected Topics in Applied Earth Observations and Remote Sensing, 7(7), 2856-2868. [CrossRef]
- Santi, E., Paloscia, S., Pettinato, S., Fontanelli, G., Mura, M., Zolli, C., Maselli, F.,Chiesi, M., Bottai, L., & Chirici, G. (2017). The potential of multifrequency SAR images for estimating forest biomass in Mediterranean areas. Remote Sensing of Environment, 200, 63-73. [CrossRef]
- Macelloni, G., Paloscia, S., Pampaloni, P., Marliani, F., & Gai, M. (2001). The relationship between the backscattering coefficient and the biomass of narrow and broad leaf crops. IEEE Transactions on Geoscience and Remote Sensing, 39(4), 873-884. [CrossRef]
- Paloscia, S., Pettinato, S., Santi, E., Notarnicola, C., Pasolli, L., & Reppucci, A. J. R. S. O. E. (2013). Soil moisture mapping using Sentinel-1 images: Algorithm and preliminary validation. Remote Sensing of Environment, 134, 234-248. [CrossRef]
- Khati, U., Lavalle, M., & Singh, G. (2021). The role of time-series L-band SAR and GEDI in mapping sub-tropical above-ground biomass. Frontiers in Earth Science, 9, 752254. [CrossRef]
- Hensley, S., Van Zyl, J., Lavalle, M., Neumann, M., Michel, T., Muellerschoen, R., Pinto N., Simard, M., & Moghaddam, M. (2015, October). L-band and P-band studies of vegetation at JPL. In 2015 IEEE Radar Conference (pp. 516-520). IEEE. [CrossRef]
- Potin, P., Rosich, B., Grimont, P., Miranda, N., Shurmer, I., O'Connell, A., Torres, R., & Krassenburg, M. (2016, June). Sentinel-1 mission status. In Proceedings of EUSAR 2016: 11th European conference on synthetic aperture radar (pp. 1-6). VDE.
- Segarra, J., Buchaillot, M. L., Araus, J. L., & Kefauver, S. C. (2020). Remote sensing for precision agriculture: Sentinel-2 improved features and applications. Agronomy, 10(5), 641. [CrossRef]
- Xue, J., & Su, B. (2017). Significant remote sensing vegetation indices: A review of developments and applications. Journal of sensors, 2017(1), 1353691. [CrossRef]
- Gamon, J. A., Penuelas, J., & Field, C. B. (1992). A narrow-waveband spectral index that tracks diurnal changes in photosynthetic efficiency. Remote Sensing of environment, 41(1), 35-44. [CrossRef]
- Peñuelas, J., Filella, I., & Gamon, J. A. (1995). Assessment of photosynthetic radiation-use efficiency with spectral reflectance. New Phytologist, 131(3), 291-296. [CrossRef]
- Garbulsky, M. F., Peñuelas, J., Gamon, J., Inoue, Y., & Filella, I. (2011). The photochemical reflectance index (PRI) and the remote sensing of leaf, canopy and ecosystem radiation use efficiencies: A review and meta-analysis. Remote sensing of environment, 115(2), 281-297.
- Zhang, C., Filella, I., Garbulsky, M. F., & Peñuelas, J. (2016). Affecting factors and recent improvements of the photochemical reflectance index (PRI) for remotely sensing foliar, canopy and ecosystemic radiation-use efficiencies. Remote Sensing, 8(9), 677. [CrossRef]
- Gamon, J. A., Kovalchuck, O., Wong, C. Y. S., Harris, A., & Garrity, S. R. (2015). Monitoring seasonal and diurnal changes in photosynthetic pigments with automated PRI and NDVI sensors. Biogeosciences, 12(13), 4149-4159. [CrossRef]
- Garbulsky, M. F. (2007). Remote estimation of carbon dioxide uptake of terrestrial ecosystems. Nature Precedings, 1-1.
- Zarco-Tejada, P. J., Hornero, A., Hernández-Clemente, R., & Beck, P. S. A. (2018). Understanding the temporal dimension of the red-edge spectral region for forest decline detection using high-resolution hyperspectral and Sentinel-2a imagery. ISPRS Journal of Photogrammetry and Remote Sensing, 137, 134-148. [CrossRef]
- Mateo-Sanchis, A., Piles, M., Muñoz-Marí, J., Adsuara, J. E., Pérez-Suay, A., & Camps-Valls, G. (2019). Synergistic integration of optical and microwave satellite data for crop yield estimation. Remote sensing of environment, 234, 111460. [CrossRef]
- Attema, E. P. W., & Ulaby, F. T. (1978). Vegetation modeled as a water cloud. Radio science, 13(2), 357-364. [CrossRef]
- Baghdadi, N., El Hajj, M., Zribi, M., & Bousbih, S. (2017). Calibration of the water cloud model at C-band for winter crop fields and grasslands. Remote Sensing, 9(9), 969. [CrossRef]
- Gao, Q., Zribi, M., Escorihuela, M. J., & Baghdadi, N. (2017). Synergetic use of Sentinel-1 and Sentinel-2 data for soil moisture mapping at 100 m resolution. Sensors,17(9), 1966. [CrossRef]
- Bao, X., Zhang, R., He, X., Shama, A., Yin, G., Chen, J., Zhang, H., & Liu, G. (2024). An Integrated Time-Series Relative Soil Moisture Monitoring Method Based on a SAR Backscattering Model. IEEE Journal of Selected Topics in Applied Earth Observations and Remote Sensing. [CrossRef]
- Santi, E., Paloscia, S., Pettinato, S., Entekhabi, D., Alemohammad, S. H., & Konings, A. G. (2016, July). Integration of passive and active microwave data from SMAP, AMSR2 and Sentinel-1 for Soil Moisture monitoring. In 2016 IEEE International Geoscience and Remote Sensing Symposium (IGARSS) (pp. 5252-5255). IEEE.
- Fung, A. K. (1994). Microwave scattering and emission models and their applications.
- Oh, Y., Sarabandi, K., & Ulaby, F. T. (1992). An empirical model and an inversion technique for radar scattering from bare soil surfaces. IEEE transactions on Geoscience and Remote Sensing, 30(2), 370-381. [CrossRef]
- Dobson, M. C., Ulaby, F. T., Hallikainen, M. T., & El-Rayes, M. A. (1985). Microwave dielectric behavior of wet soil-Part II: Dielectric mixing models. IEEE Transactions on geoscience and remote sensing, (1), 35-46. [CrossRef]
- Pilia, S., Fontanelli, G., Santurri, L., Ramat, G., Baroni, F., Santi, E., Lapini, A., Pettinato, S., & Paloscia, S. (2023, November). Data integration of Sentinel-1 and Sentinel-2 for evaluating vegetation biomass and water status. In 2023 IEEE International Workshop on Metrology for Agriculture and Forestry (MetroAgriFor) (pp. 694-698). IEEE.
- Pilia, S., Baroni, F., Fontanelli, G., Ramat, G., Palchetti, E., Paloscia, S., Pettinato, S., Santi, E., Santurri, L. (2024, July). Soil and Vegetation Water Status Monitoring by Integrating Optical and Microwave Satellite Data. In IGARSS 2024-2024 IEEE International Geoscience and Remote Sensing Symposium (pp. 1470-1473). IEEE.
- https://world-soils.com/.
- https://www.esa.int/Applications/Observing_the_Earth/Copernicus/Sentinel-1/Mission_ends_for_Copernicus_Sentinel-1B_satellite.
- Barnes, E. M., Clarke, T. R., Richards, S. E., Colaizzi, P. D., Haberland, J., Kostrzewski, M., Waller, P., Choi, C., Riley, E., Thompson, T., Lascano, R.J., Li, H., Moran, M. S. (2000, July). Coincident detection of crop water stress, nitrogen status and canopy density using ground based multispectral data. In Proceedings of the fifth international conference on precision agriculture, Bloomington, MN, USA (Vol. 1619, No. 6).
- Gamon, J. A., & Surfus, J. S. (1999). Assessing leaf pigment content and activity with a reflectometer. The New Phytologist, 143(1), 105-117. [CrossRef]
- Merzlyak, M. N., Gitelson, A. A., Chivkunova, O. B., & Rakitin, V. Y. (1999). Non-destructive optical detection of pigment changes during leaf senescence and fruit ripening. Physiologia plantarum, 106(1), 135-141. [CrossRef]
- Penuelas, J., Baret, F., & Filella, I. (1995). Semi-empirical indices to assess carotenoids/chlorophyll a ratio from leaf spectral reflectance. Photosynthetica, 31(2), 221-230.
- Gorelick, N., Hancher, M., Dixon, M., Ilyushchenko, S., Thau, D., & Moore, R. (2017). Google Earth Engine: Planetary-scale geospatial analysis for everyone. Remote sensing of Environment, 202, 18-27. [CrossRef]
- Clemente, J. P., Fontanelli, G., Ovando, G. G., Roa, Y. L. B., Lapini, A., & Santi, E. (2020, March). Google Earth Engine: Application of algorithms for remote sensing of crops in Tuscany (Italy). In 2020 IEEE Latin American GRSS & ISPRS Remote Sensing Conference (LAGIRS) (pp. 195-200). IEEE.
- Cai, Y., Zhang, M., & Lin, H. (2020). Estimating the urban fractional vegetation cover using an object-based mixture analysis method and Sentinel-2 MSI imagery. IEEE Journal of Selected Topics in Applied Earth Observations and Remote Sensing, 13, 341-350. [CrossRef]
- Andreatta, D., Gianelle, D., Scotton, M., & Dalponte, M. (2022). Estimating grassland vegetation cover with remote sensing: A comparison between Landsat-8, Sentinel-2 and PlanetScope imagery. Ecological Indicators, 141, 109102. [CrossRef]
- https://www.specmeters.com/FieldScout-TDR350-Soil-Moisture-Meter.
- https://handheld.psi.cz/products/plantpen-ndvi-and-pri/.
- Konings, A. G., Rao, K., & Steele-Dunne, S. C. (2019). Macro to micro: microwave remote sensing of plant water content for physiology and ecology. New Phytologist, 223(3), 1166-1172. [CrossRef]
- Ulaby, F. T., Moore, R. K., & Fung, A. K. (1982). Microwave remote sensing: Active and passive. Volume 2-Radar remote sensing and surface scattering and emission theory.
- https://www.lamma.toscana.it/meteo/osservazioni-e-dati/dati-stazioni.
- Takala, T. L., & Mõttus, M. (2016). Spatial variation of canopy PRI with shadow fraction caused by leaf-level irradiation conditions. Remote Sensing of Environment, 182, 99-112. [CrossRef]
- Ouaadi, N., Jarlan, L., Ezzahar, J., Khabba, S., Le Dantec, V., Rafi, Z., Zribi, M., & Frison, P. L. (2020, March). Water stress detection over irrigated wheat crops in semi-arid areas using the diurnal differences of Sentinel-1 backscatter. In 2020 Mediterranean and Middle-East Geoscience and Remote Sensing Symposium (M2GARSS) (pp. 306-309). IEEE.
- Rockström, J., Karlberg, L., Wani, S. P., Barron, J., Hatibu, N., Oweis, T., Bruggeman A., Farahani J., & Qiang, Z. (2010). Managing water in rainfed agriculture—The need for a paradigm shift. Agricultural Water Management, 97(4), 543-550. [CrossRef]
- https://joint-research-centre.ec.europa.eu/european-and-global-drought-observatories/current-drought-situation-europe_en.
- Amiri, M. A., & Gocic, M. (2023). Analysis of temporal and spatial variations of drought over Serbia by investigating the applicability of precipitation-based drought indices. Theoretical and Applied Climatology, 154(1), 261-274. [CrossRef]
- Edwards, B., Gray, M., & Hunter, B. (2019). The social and economic impacts of drought. Australian Journal of Social Issues, 54(1), 22-31.
Figure 1.
On the left, sorghum ripening in 2022, on the right sorghum in the well-developed phase.
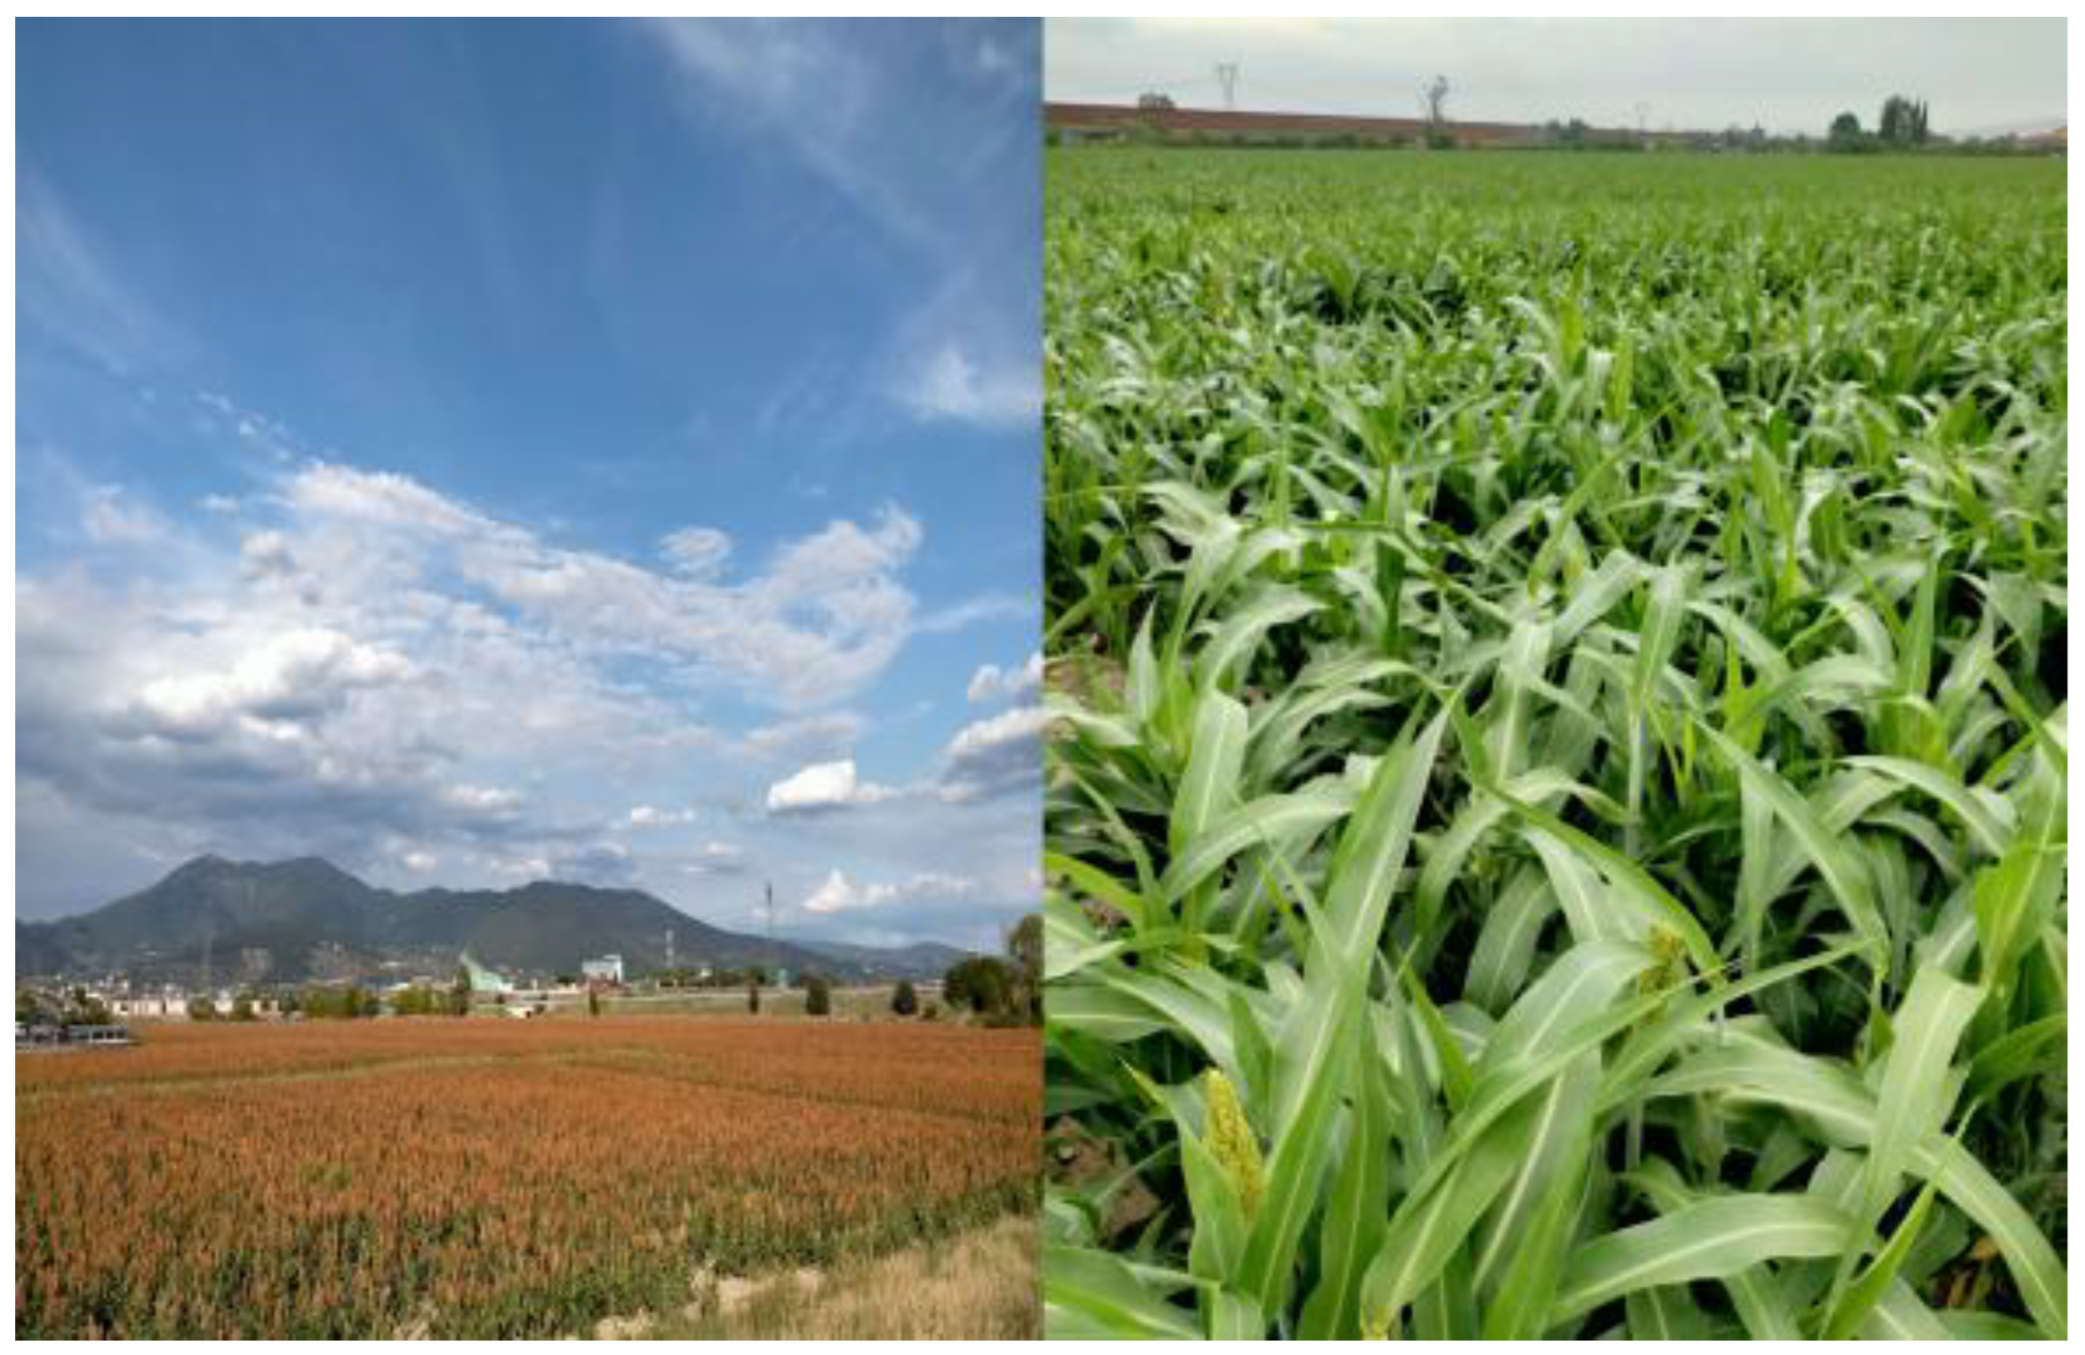
Figure 2.
Area where sorghum was sown in 2022, in yellow, and 2023, in green.
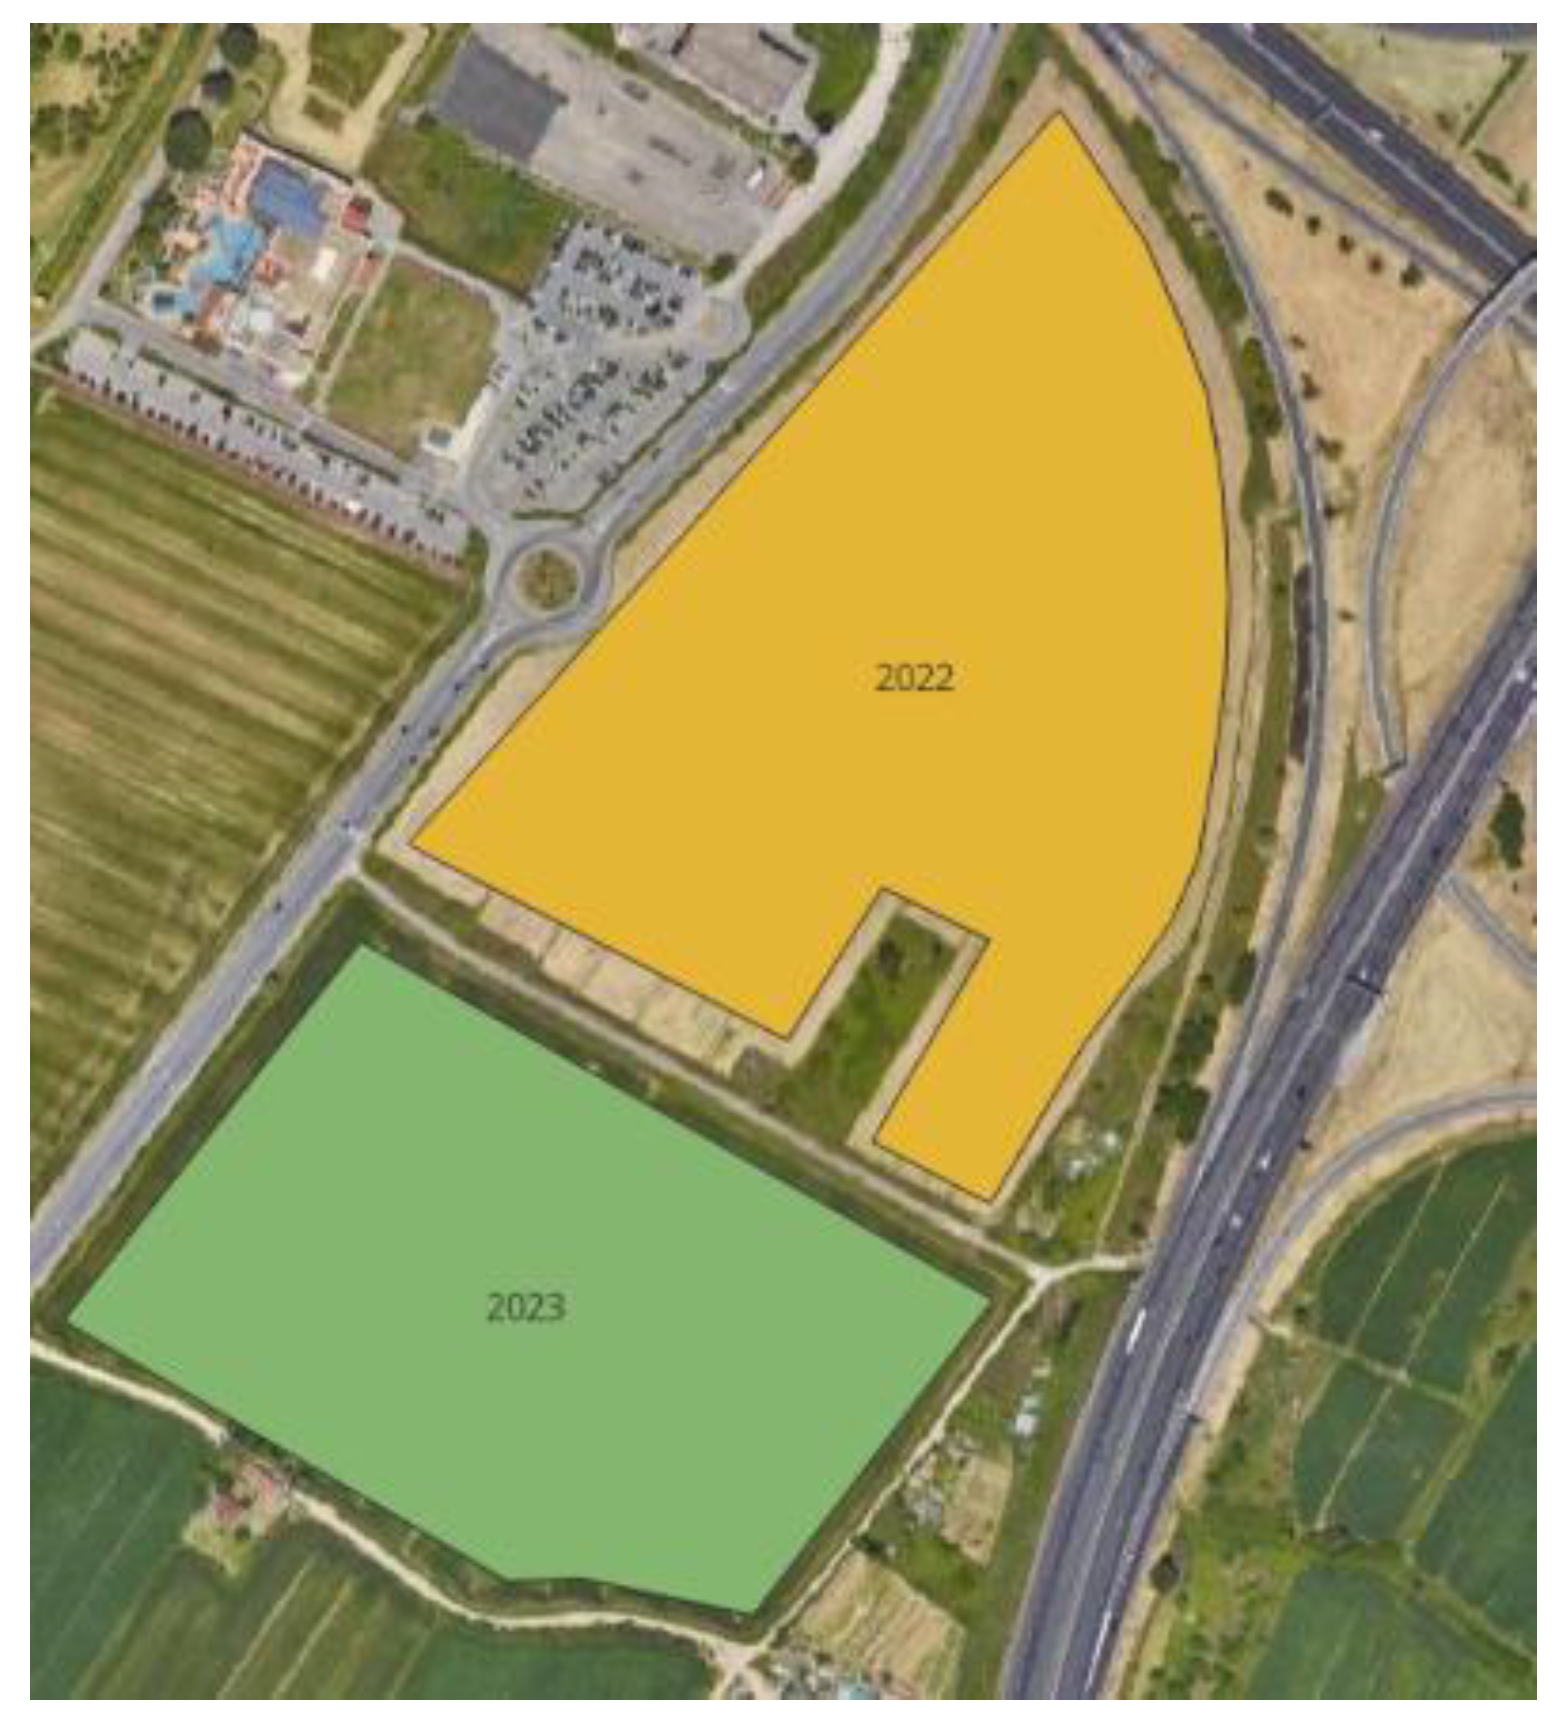
Figure 3.
Cumulated rainfall during 2022 and 2023. The green boxes indicate the growth cycle of sorghum for each year.
Figure 3.
Cumulated rainfall during 2022 and 2023. The green boxes indicate the growth cycle of sorghum for each year.
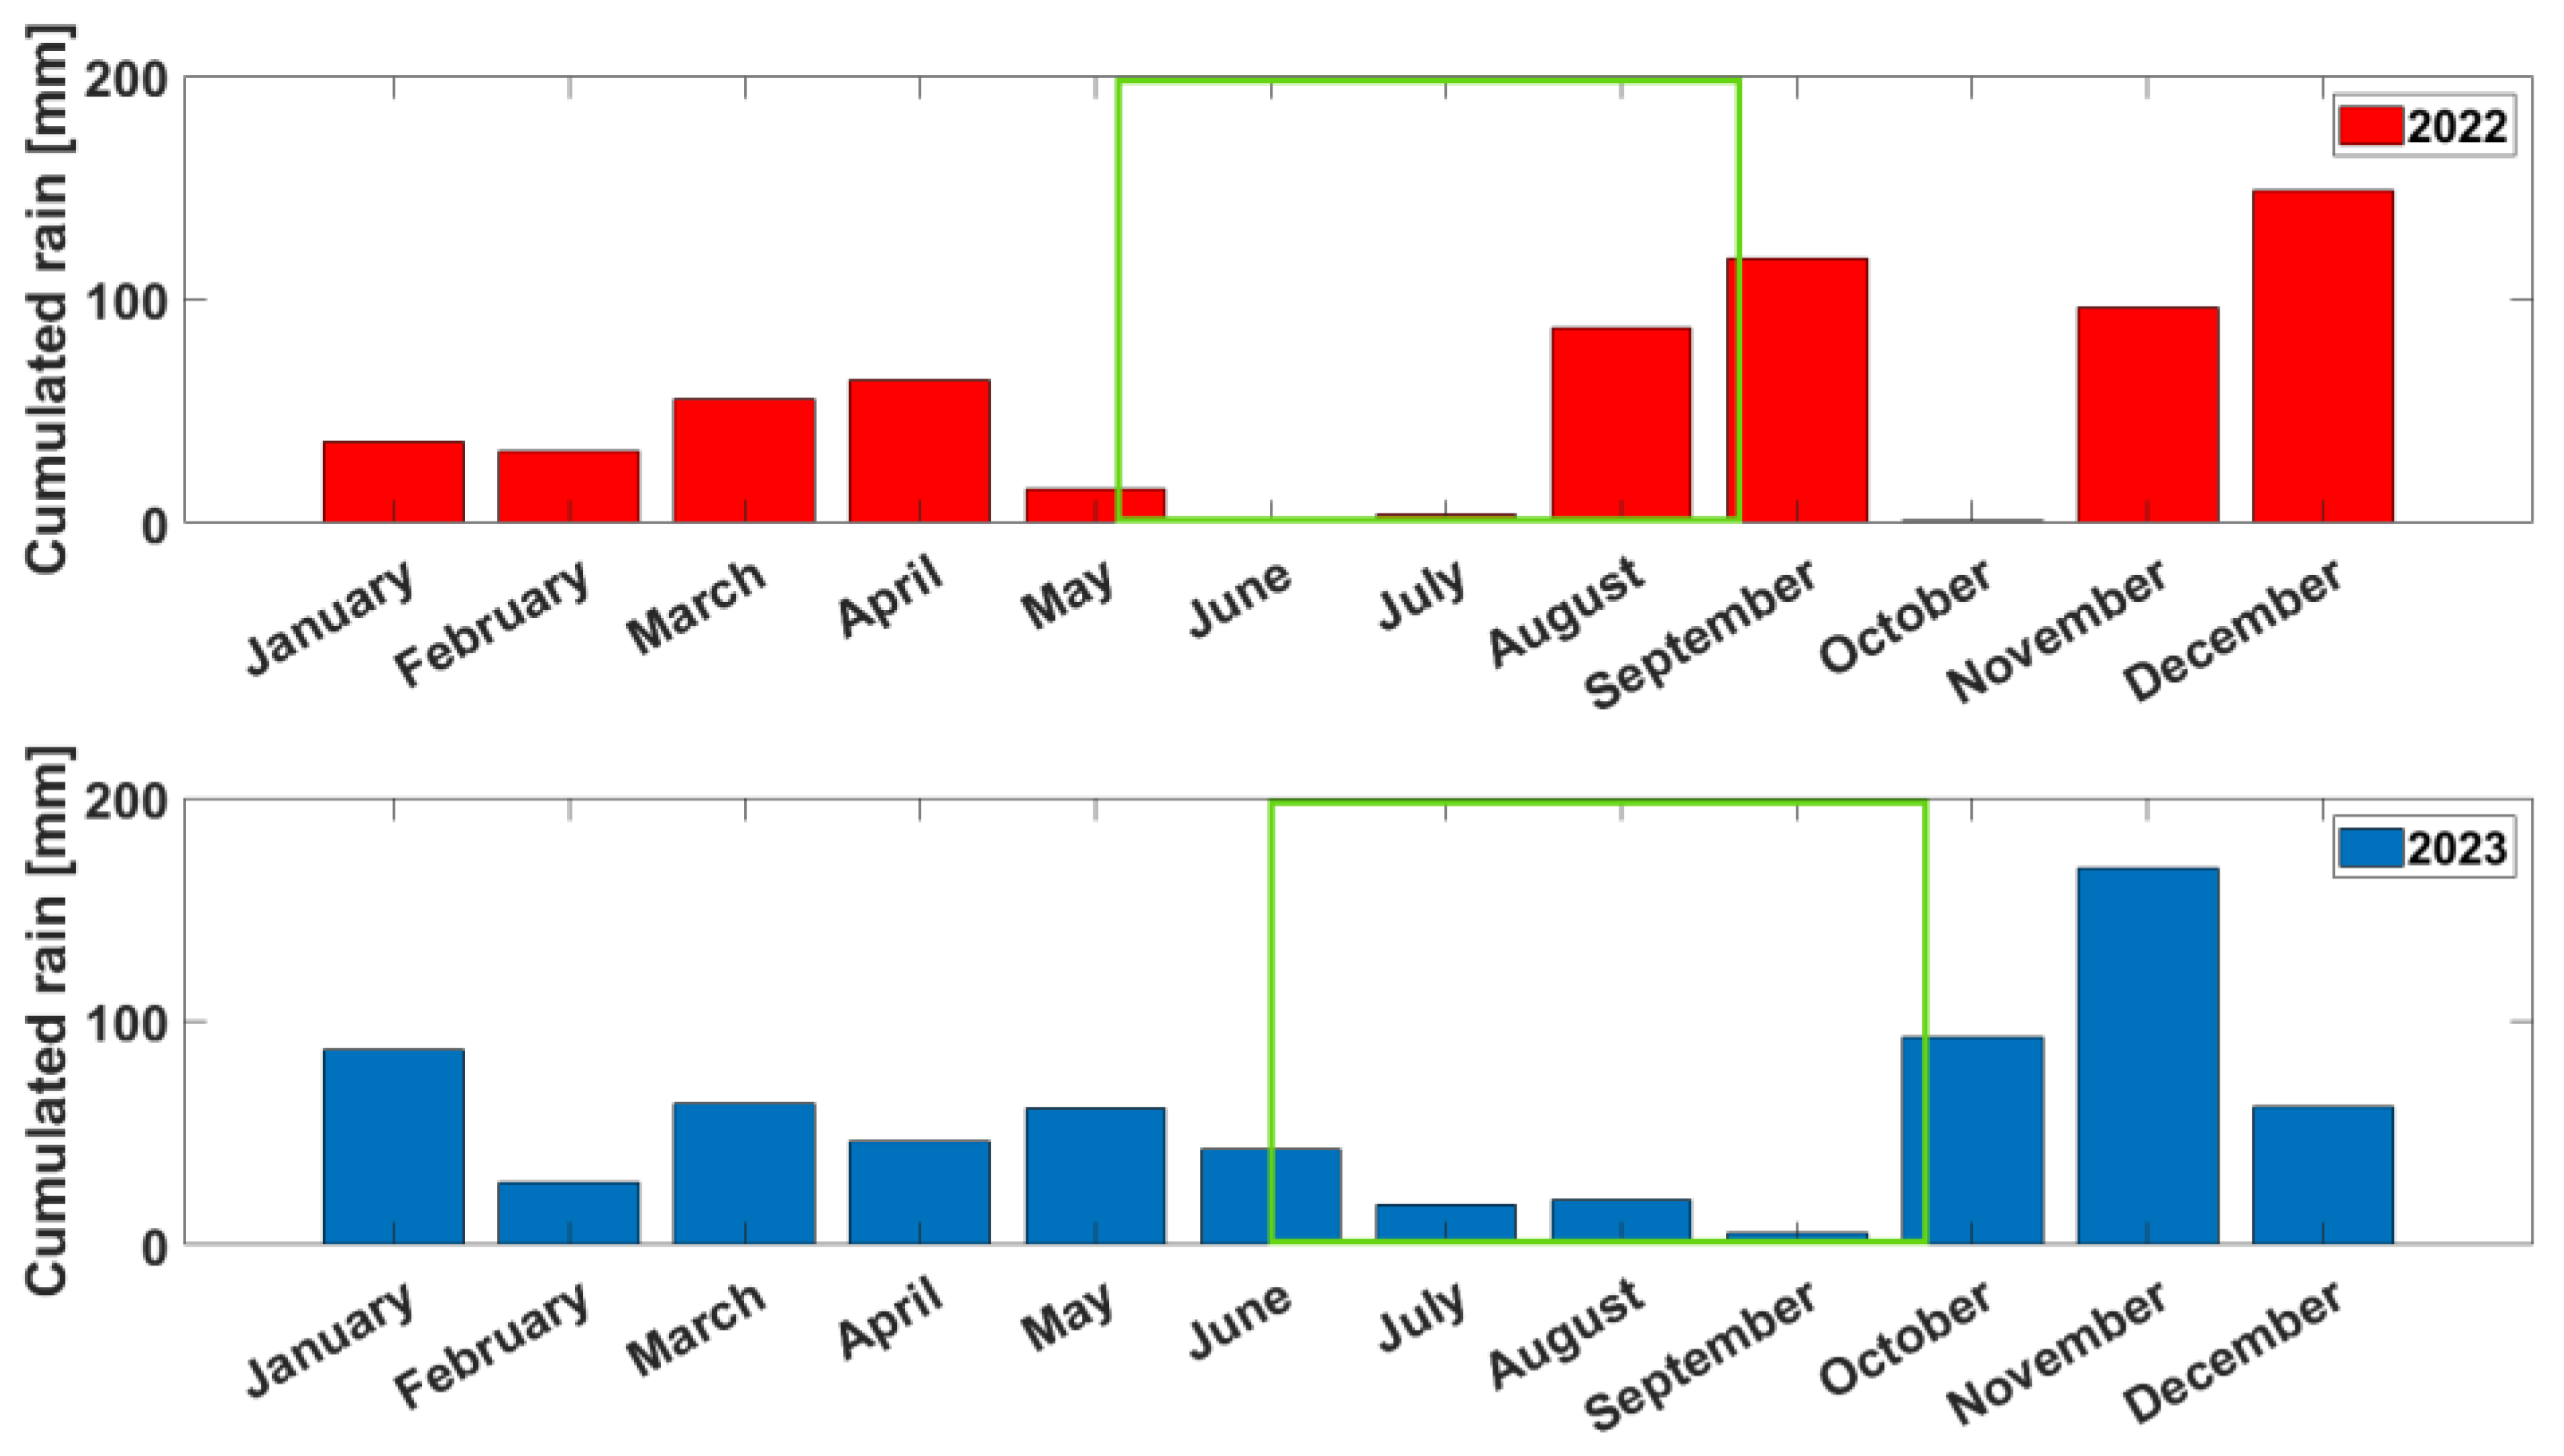
Figure 4.
Boxplots of PRI (left) and SMC (right) during 2022 and 2023. PRI intensities are usually lower when soil is in dry conditions.
Figure 4.
Boxplots of PRI (left) and SMC (right) during 2022 and 2023. PRI intensities are usually lower when soil is in dry conditions.
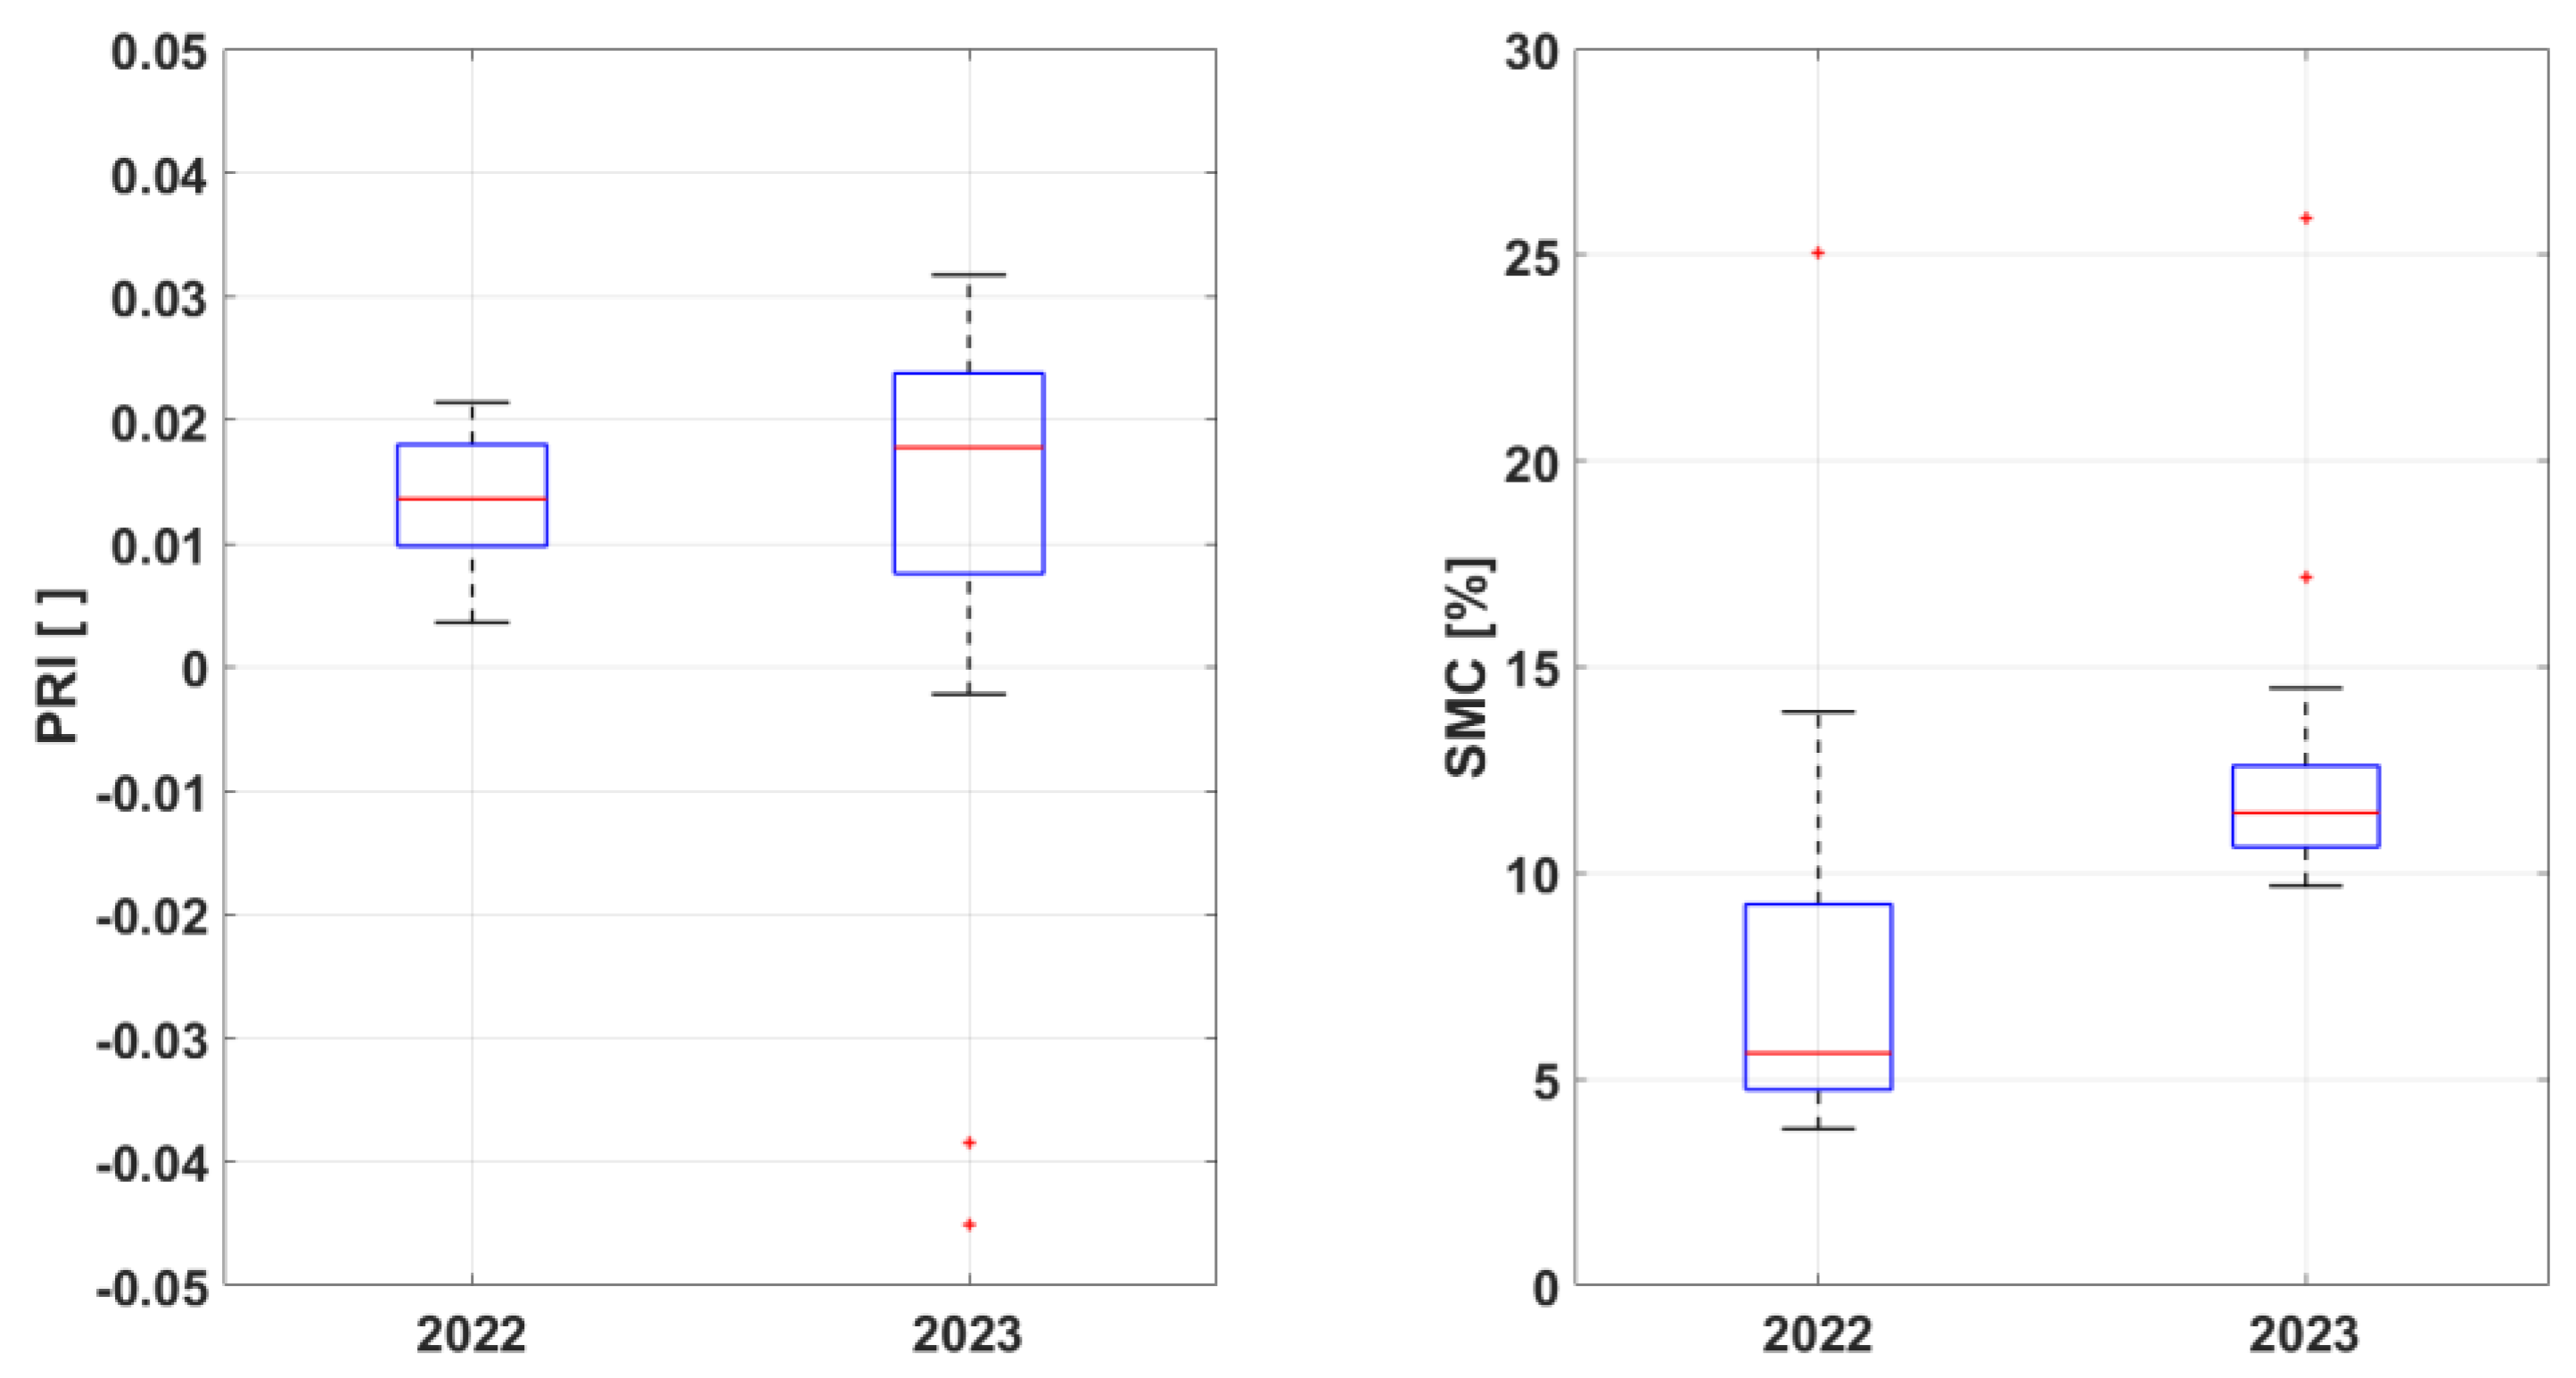
Figure 5.
Index values obtained from the S-2 bands compared to the foliar PRI measured in the for the first two leaves of the plant. Data relating to the 2022 seasons, in red, and 2023, in blue. Values of correlations are shown in Table 4.
Figure 5.
Index values obtained from the S-2 bands compared to the foliar PRI measured in the for the first two leaves of the plant. Data relating to the 2022 seasons, in red, and 2023, in blue. Values of correlations are shown in Table 4.
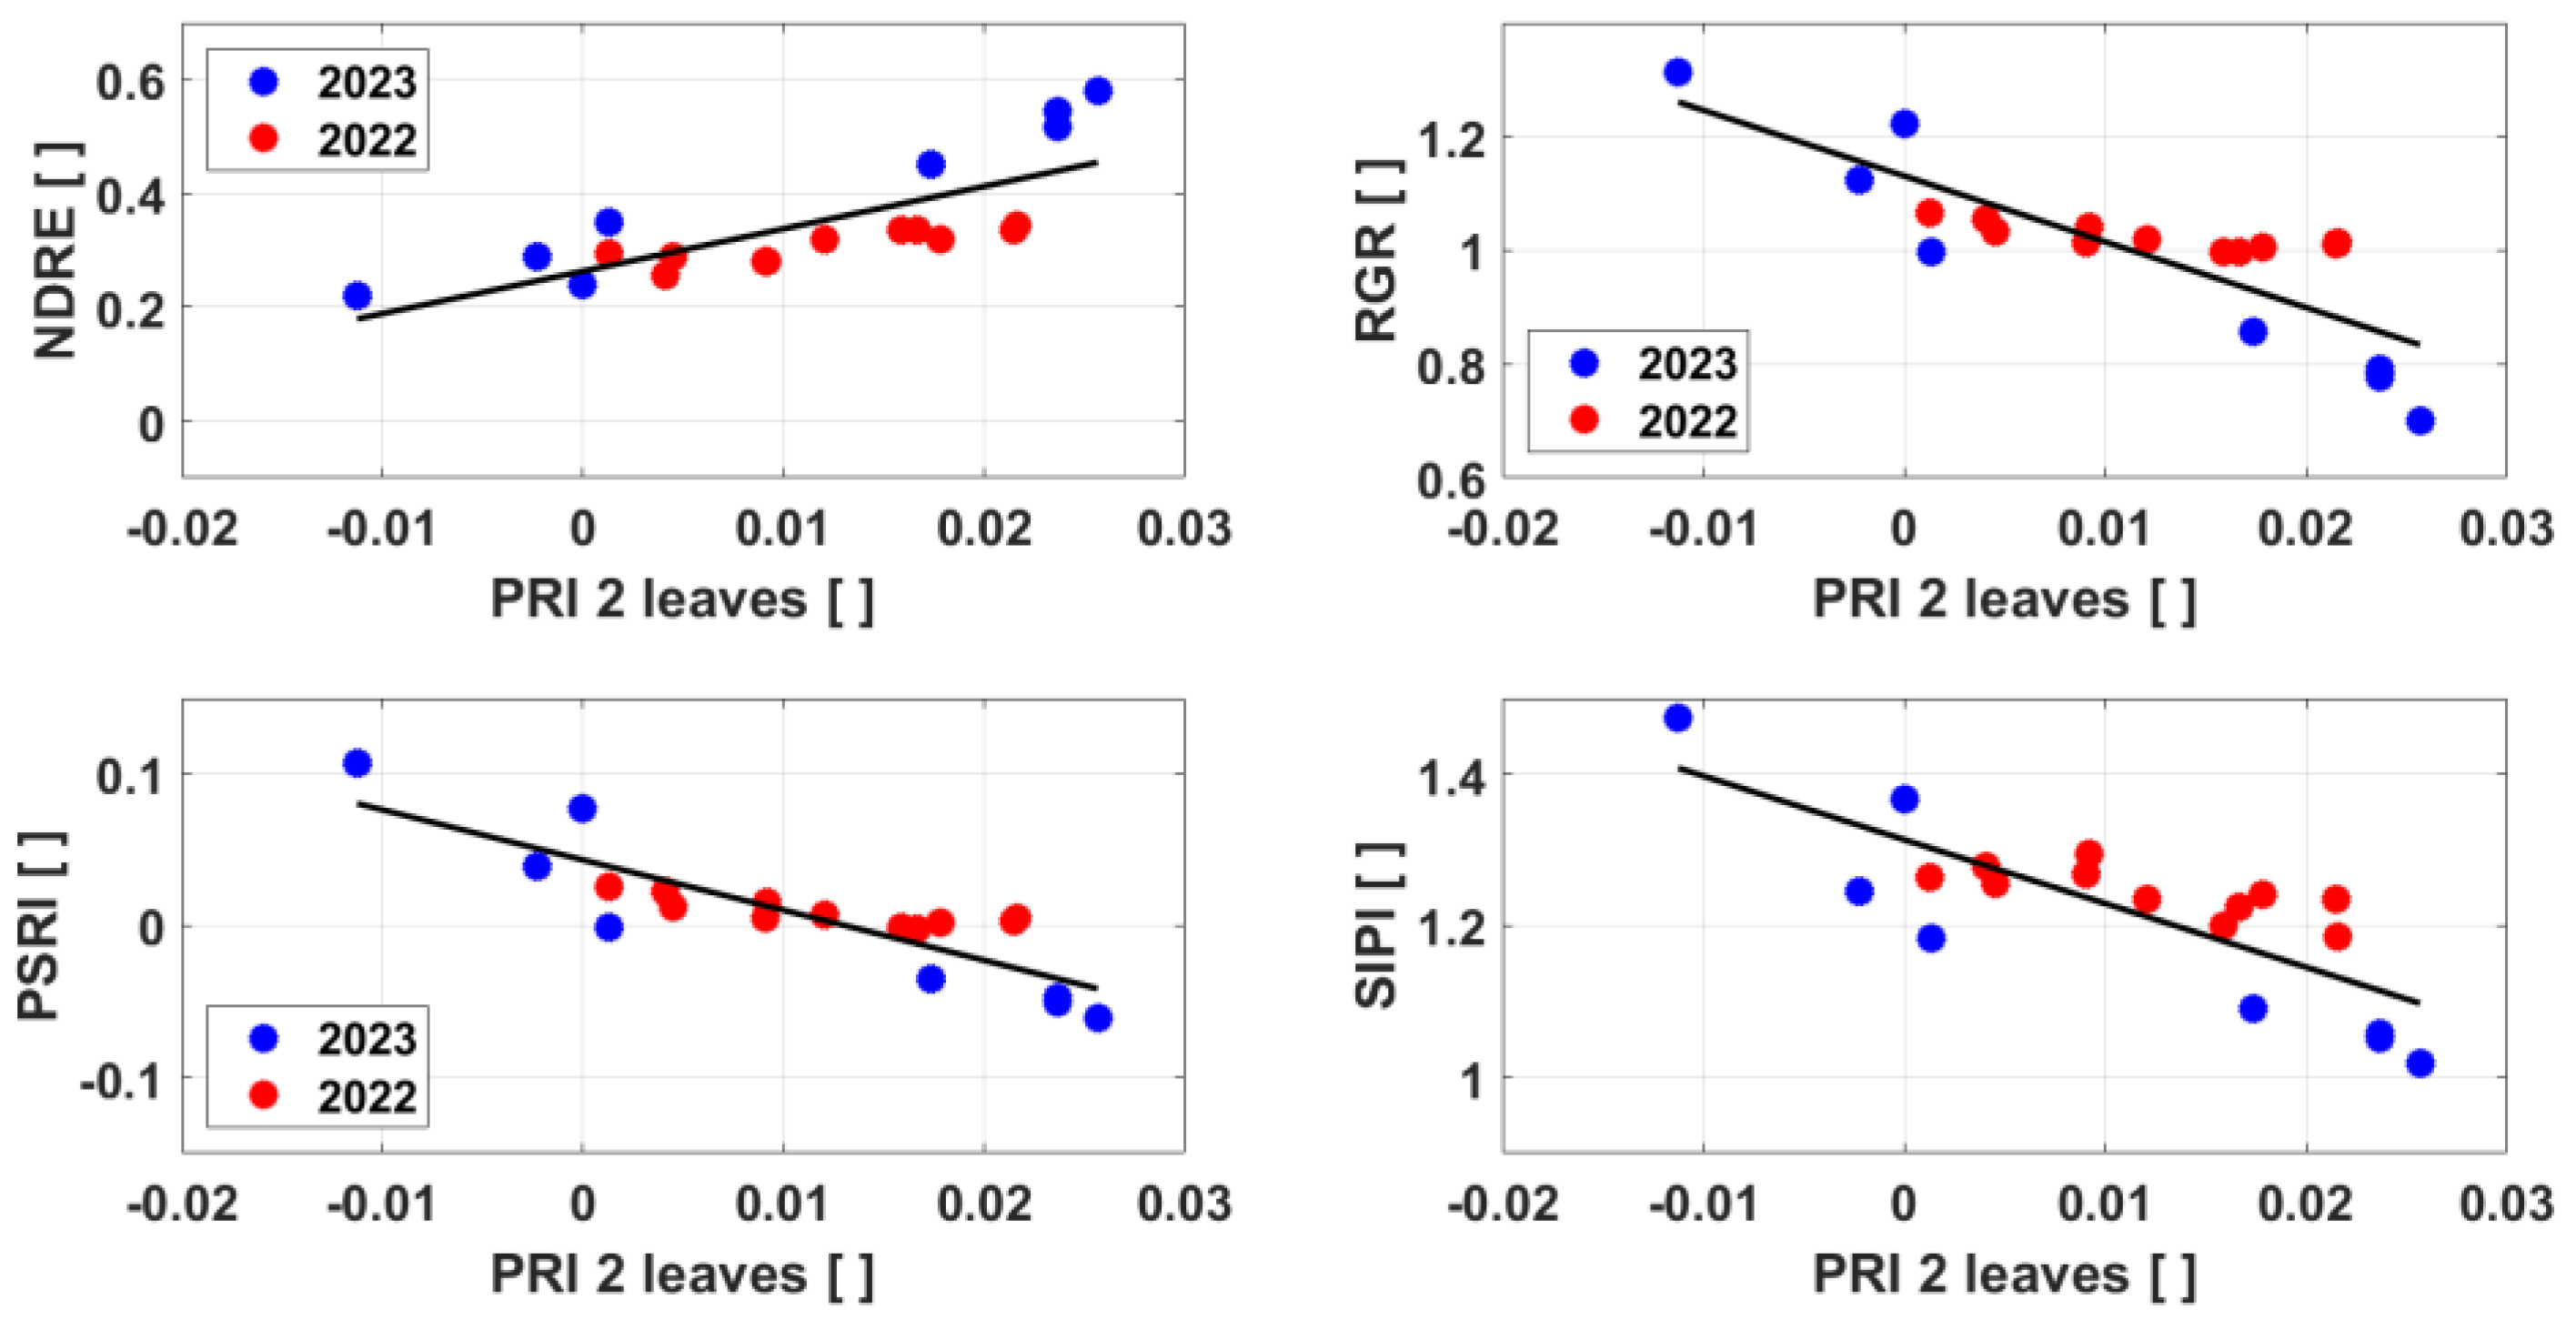
Figure 6.
Index values obtained from the S-2 bands compared to the leaf PRI measured in the field for all 4 leaves measured. Data relating to the 2022 seasons, in red, and 2023, in blue. Value of fittings in Table 5.
Figure 6.
Index values obtained from the S-2 bands compared to the leaf PRI measured in the field for all 4 leaves measured. Data relating to the 2022 seasons, in red, and 2023, in blue. Value of fittings in Table 5.
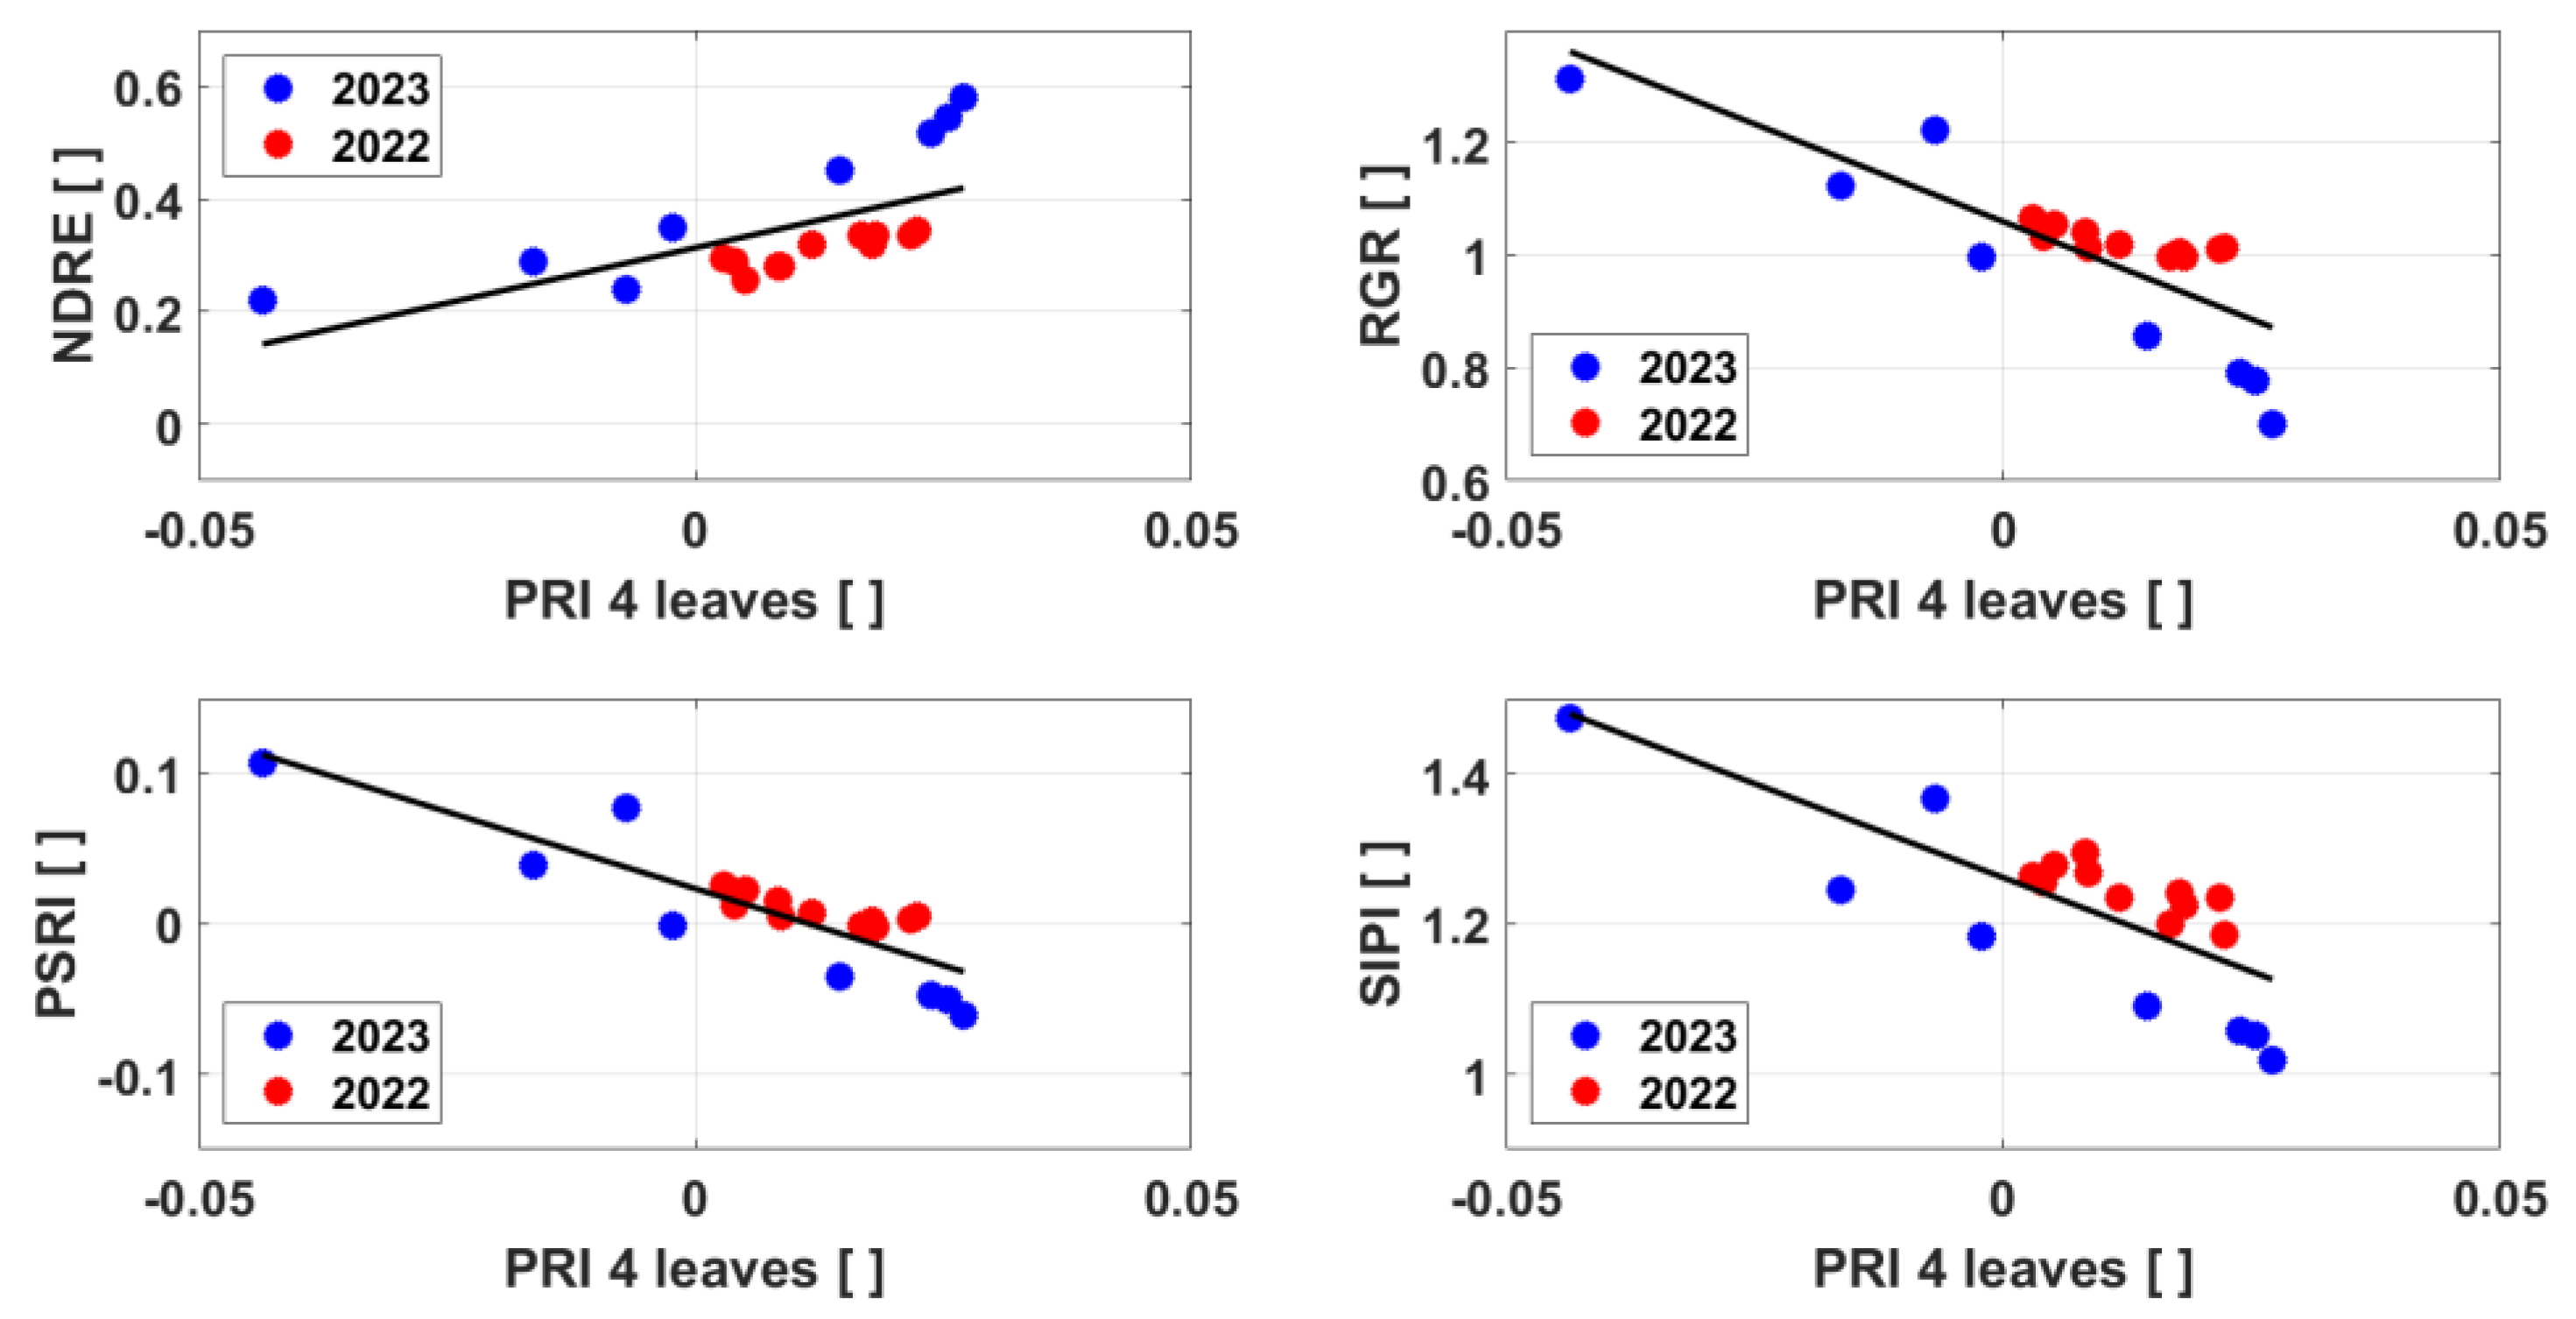
Figure 7.
PRI measured on the top 4 leaves as a function of the PWC estimated from σ0. The points with similar dry soil conditions (SMC < 15%) were considered, by improving the result in terms of a reduction in the uncertainty of PWC. (R2=0.51; PRI=0.0915ln (PWC) - 0.133). In the color bars, the days after the sow of the crop.
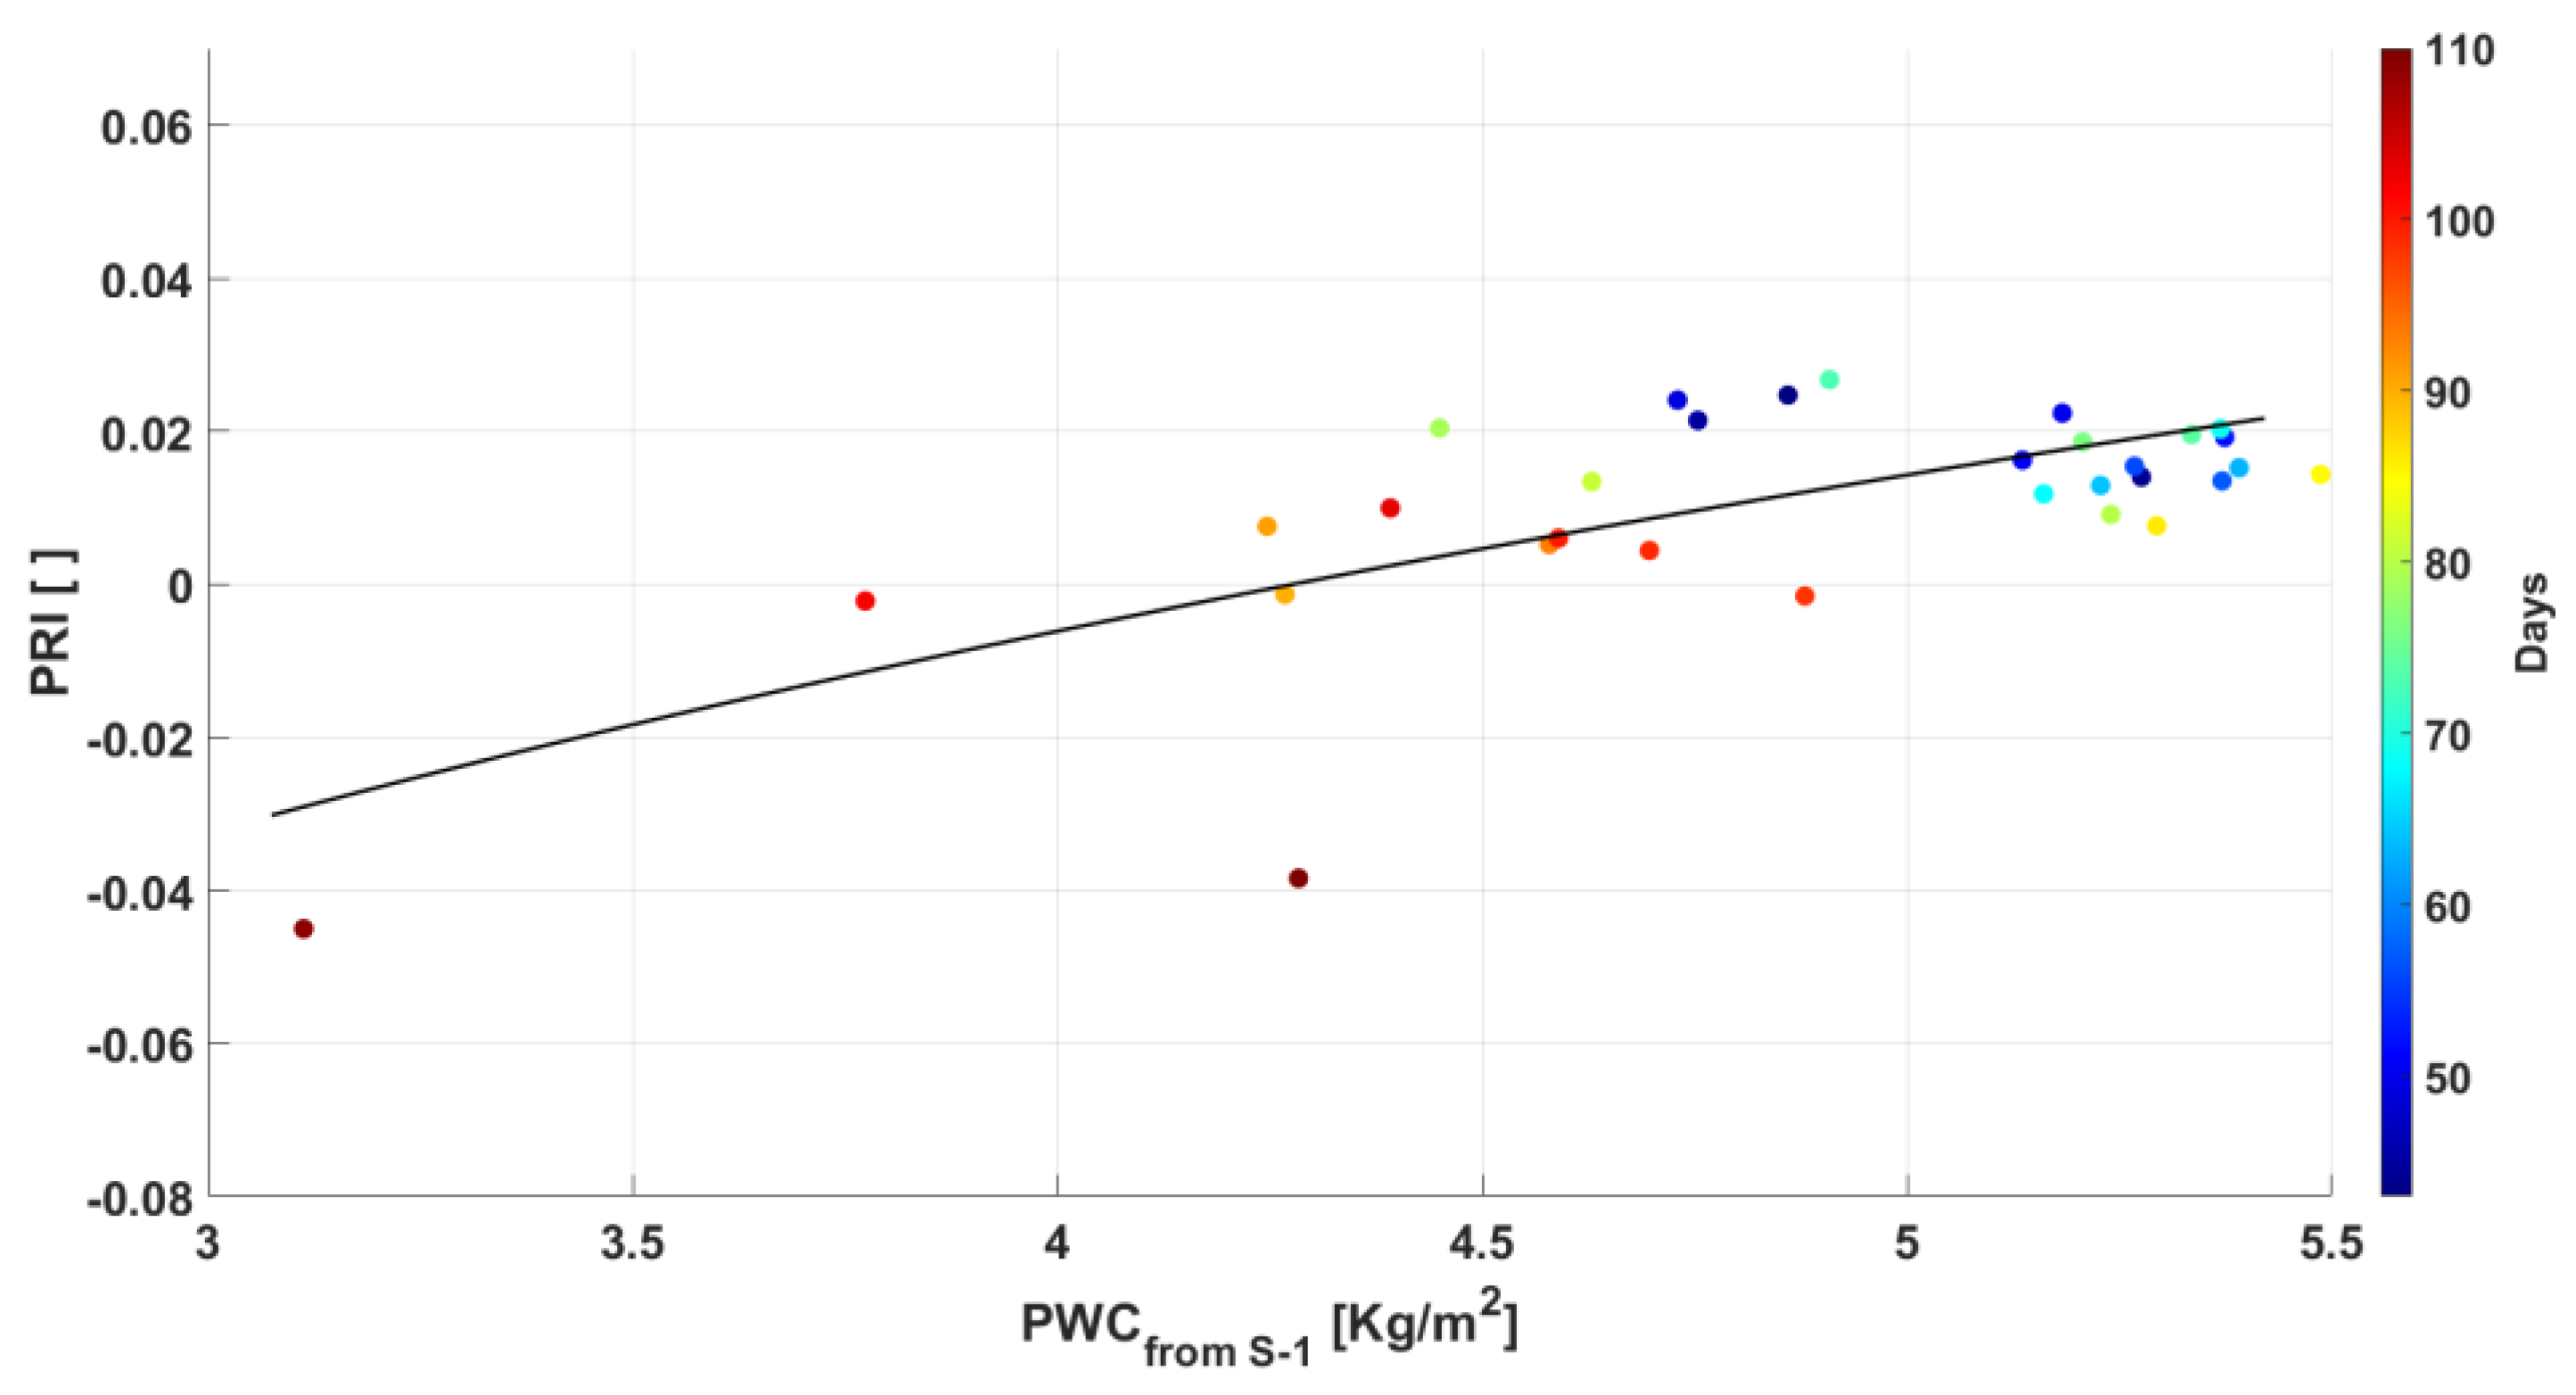
Figure 8.
Indices obtained from the S-2 bands compared to PWC obtained from the S-1 data through the WCM model. In red the data of 2022 and in blue those of 2023. Regression equations are reported in Table 6.
Figure 8.
Indices obtained from the S-2 bands compared to PWC obtained from the S-1 data through the WCM model. In red the data of 2022 and in blue those of 2023. Regression equations are reported in Table 6.
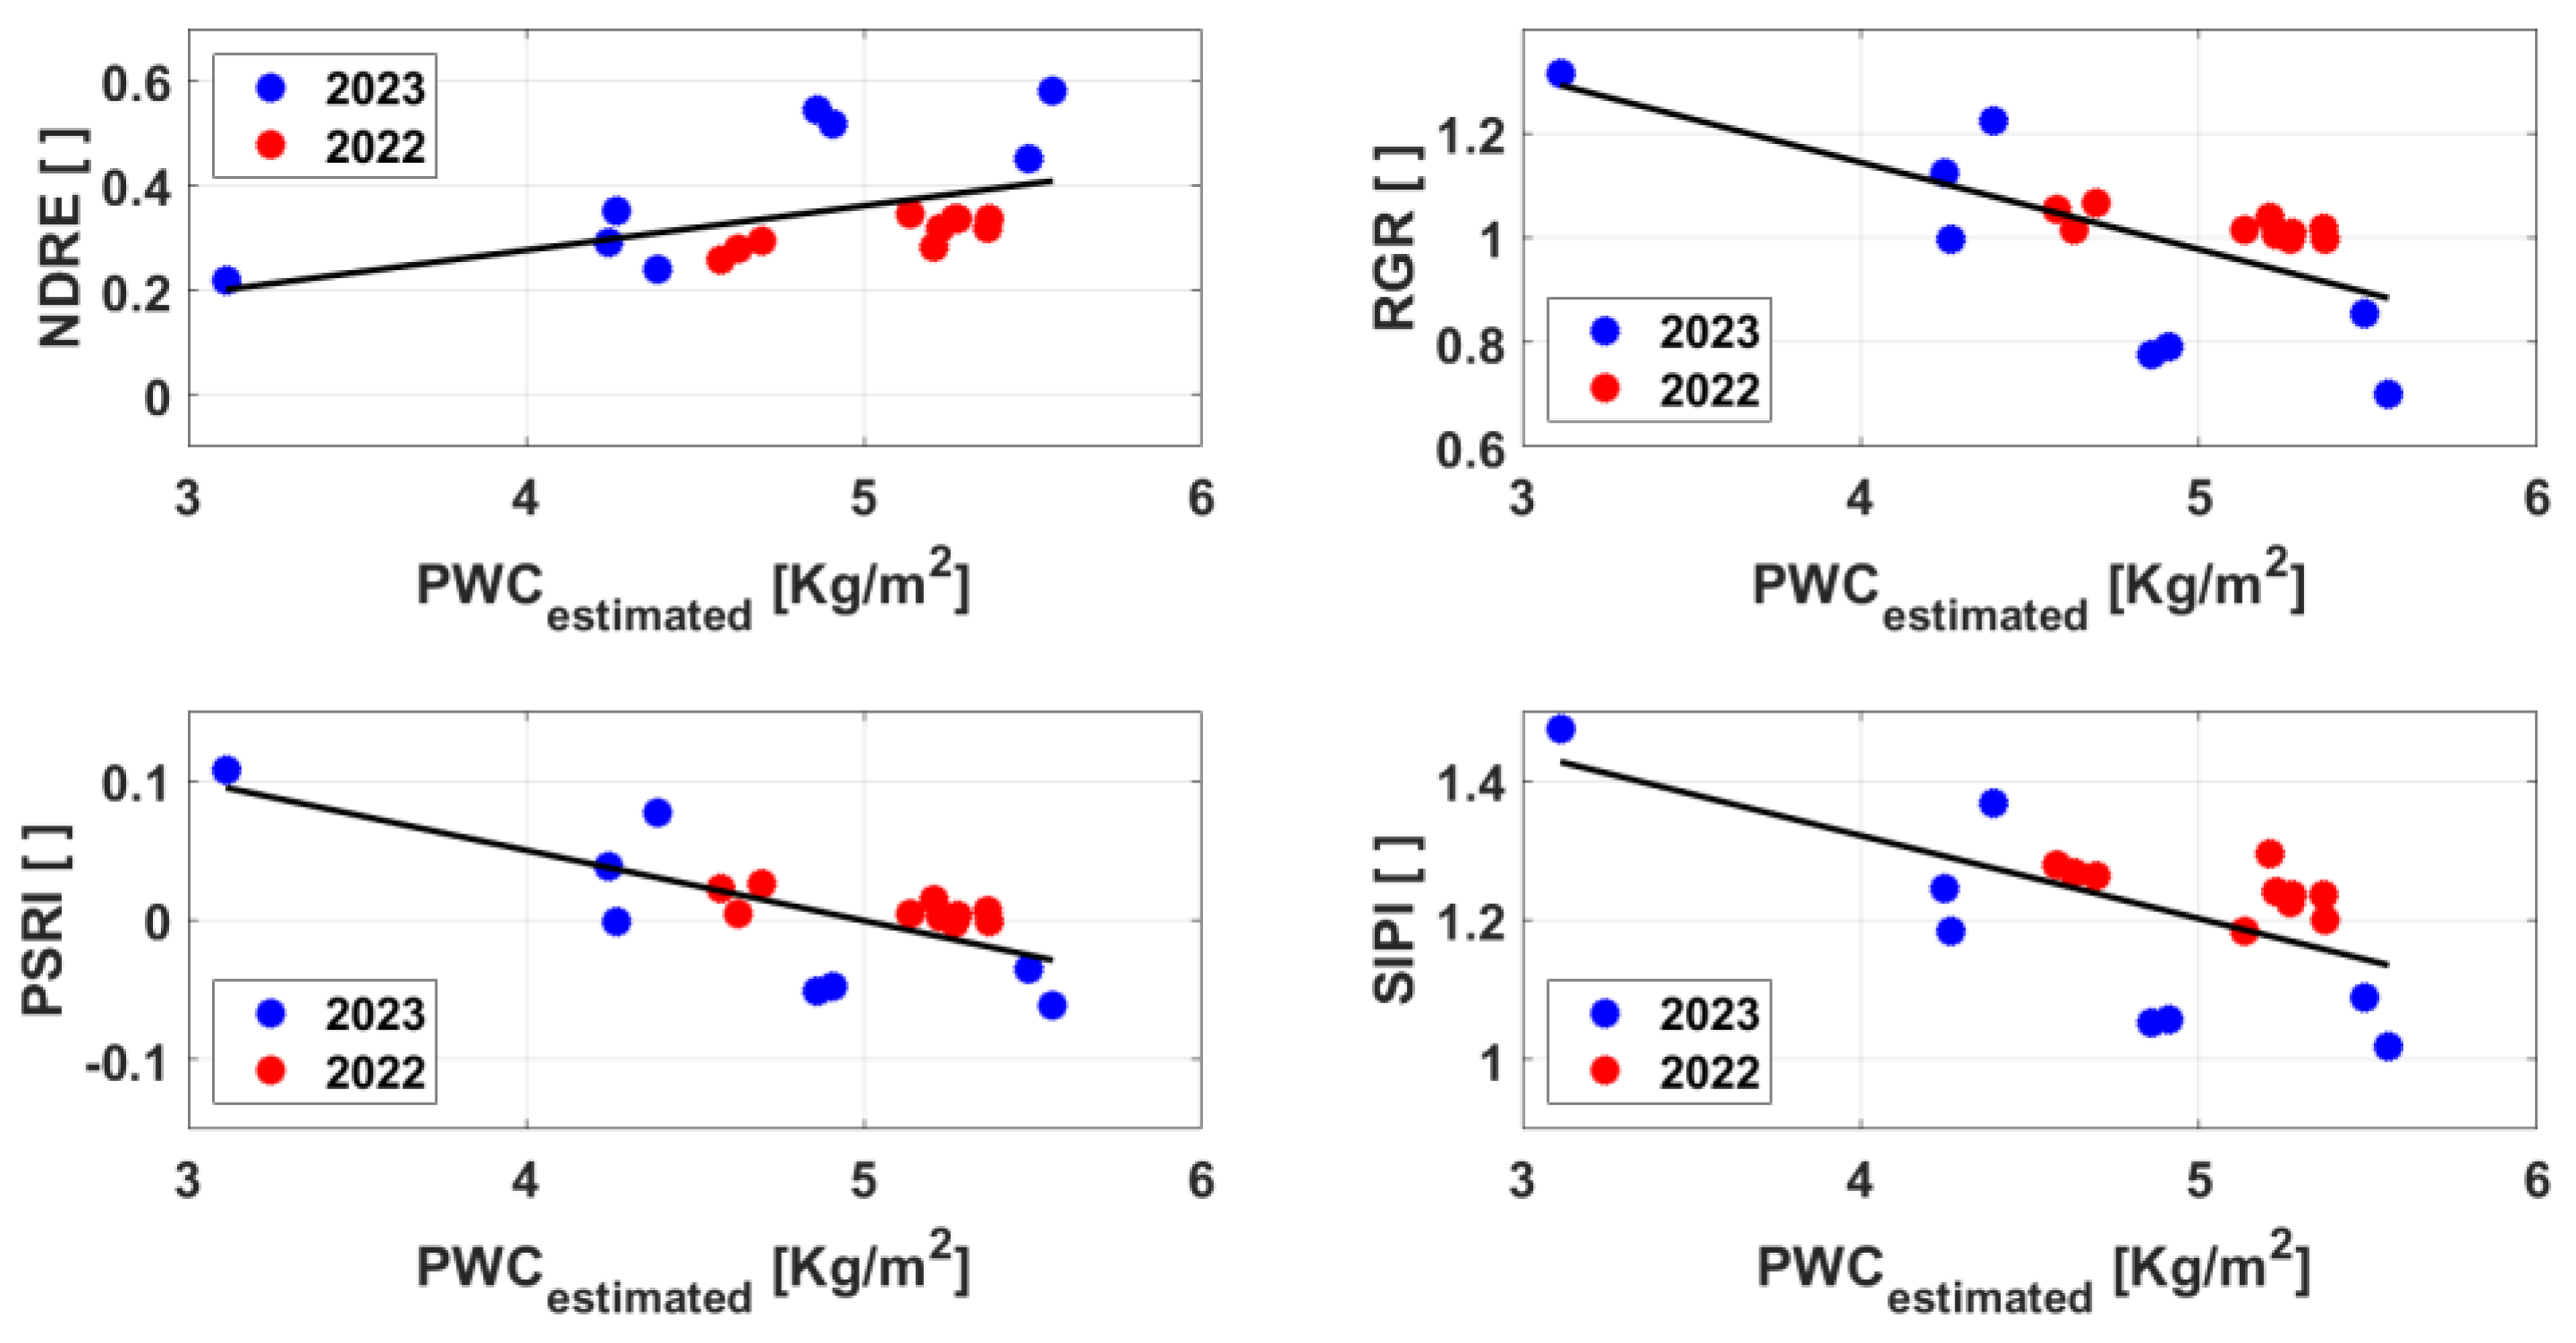
Figure 9.
Variations between PRI and PWC obtained from morning and afternoon satellite passes and considering only dry soil conditions only (R2=0.46; ΔPRI = 0.0201⋅ΔPWC + 0.0017).
Figure 9.
Variations between PRI and PWC obtained from morning and afternoon satellite passes and considering only dry soil conditions only (R2=0.46; ΔPRI = 0.0201⋅ΔPWC + 0.0017).
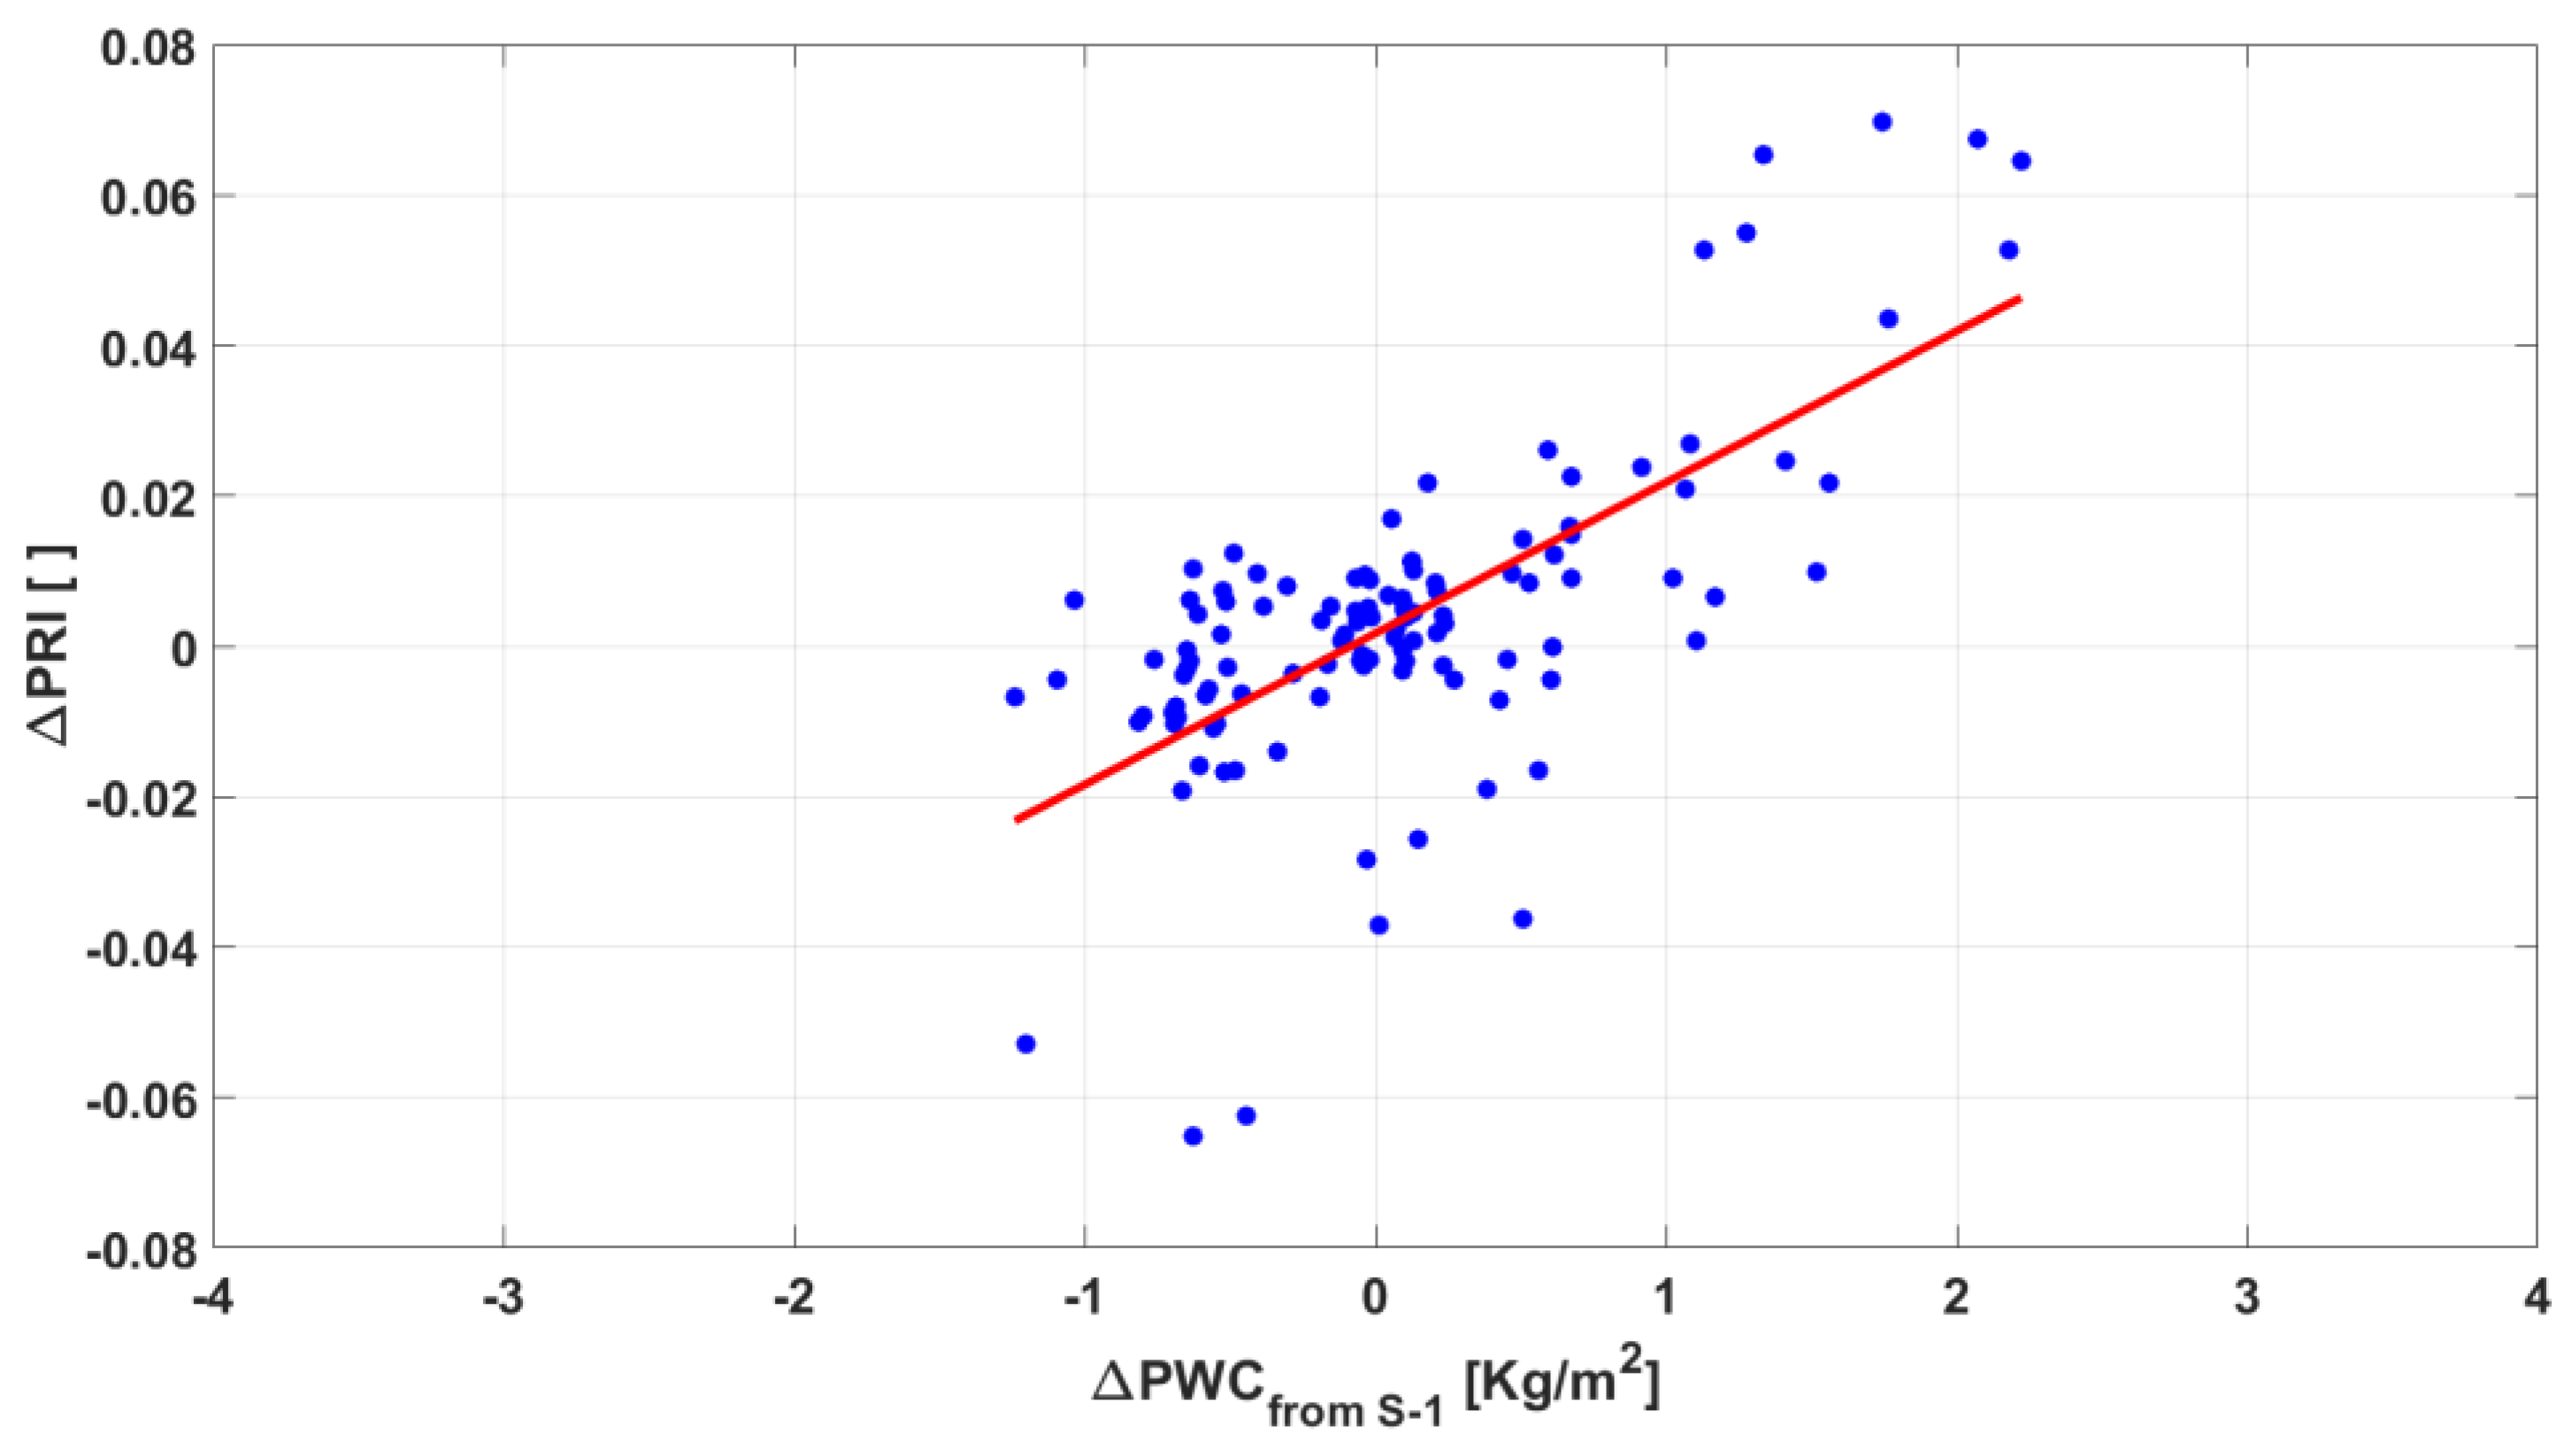

Table 1.
S-1 orbit information.
| S-1 Orbit | Angle of incidence [deg] | Overpass time [UTC] |
|---|---|---|
| 117-Ascending | 34.20 | 17:06 |
| 15-Ascending | 43.82 | 17:14 |
| 95-Descending | 43.18 | 05:19 |
| 168-Descending | 33.20 | 05:27 |
Table 2.
Indices derived from S-2 bands.
| Index | Formula | Reference |
|---|---|---|
| NDRE | [41] | |
| RGR | [42] | |
| PSRI | [43] | |
| SIPI | [44] |
Table 3.
Temporal associations between S-1 and S-2 passages.
| Date S-1 | Date S-2 | Type of orbit |
|---|---|---|
| 07/07/2022 | 07/07/2022 | Descending |
| 14/07/2022 | 12/07/2022 | Descending |
| 19/07/2022 | 17/07/2022 | Descending |
| 20/07/2022 | 22/07/2022 | Ascending |
| 27/07/2022 | 27/07/2022 | Ascending |
| 01/08/2022 | 01/08/2022 | Ascending |
| 08/08/2022 | 06/08/2022 | Ascending |
| 13/08/2022 | 16/08/2022 | Ascending |
| 25/08/2022 | 26/08/2022 | Ascending |
| 31/08/2022 | 31/08/2022 | Descending |
| 27/07/2023 | 27/07/2023 | Ascending |
| 15/08/2023 | 16/08/2023 | Ascending |
| 26/08/2023 | 26/08/2023 | Descending |
| 07/09/2023 | 05/09/2023 | Descending |
| 12/09/2023 | 10/09/2023 | Descending |
| 13/09/2023 | 15/09/2023 | Ascending |
| 25/09/2023 | 25/09/2023 | Ascending |
| 01/10/2023 | 30/09/2023 | Descending |
Table 4.
Fittings and R2 of the pictures present in Figure 5.
Table 4.
Fittings and R2 of the pictures present in Figure 5.
| Index | Regressions | R2 |
|---|---|---|
| NDRE | PRI + 0.2634 | 0.58 |
| RGR | PRI + 1.1308 | 0.70 |
| PSRI | PRI + 0.0434 | 0.73 |
| SIPI | PRI + 1.3135 | 0.64 |
Table 5.
Fittings and R2 of the pictures present in Figure 6.
Table 5.
Fittings and R2 of the pictures present in Figure 6.
| Index | Fitting | R2 |
|---|---|---|
| NDRE | PRI + 0.3136 | 0.43 |
| RGR | PRI + 1.06 | 0.67 |
| PSRI | PRI + 0.0236 | 0.75 |
| SIPI | PRI + 1.2618 | 0.61 |
Table 6.
Regressions and R2 of the diagrams of Figure 8.
Table 6.
Regressions and R2 of the diagrams of Figure 8.
| Index | Fitting | R2 |
|---|---|---|
| NDRE | 0.0849·PWC - 0.0634 | 0.24 |
| RGR | -0.1664·PWC + 1.8097 | 0.46 |
| PSRI | -0.0505·PWC + 0.2521 | 0.54 |
| SIPI | -0.1191·PWC + 1.7976 | 0.41 |
Disclaimer/Publisher’s Note: The statements, opinions and data contained in all publications are solely those of the individual author(s) and contributor(s) and not of MDPI and/or the editor(s). MDPI and/or the editor(s) disclaim responsibility for any injury to people or property resulting from any ideas, methods, instructions or products referred to in the content. |
© 2025 by the authors. Licensee MDPI, Basel, Switzerland. This article is an open access article distributed under the terms and conditions of the Creative Commons Attribution (CC BY) license (https://creativecommons.org/licenses/by/4.0/).
Copyright: This open access article is published under a Creative Commons CC BY 4.0 license, which permit the free download, distribution, and reuse, provided that the author and preprint are cited in any reuse.


