Preprint
Article

This version is not peer-reviewed.

Does Palm Oil Really Rule the Supermarket?

A peer-reviewed article of this preprint also exists.

Submitted:

13 March 2025

Posted:

14 March 2025

Read the latest preprint version here

Abstract

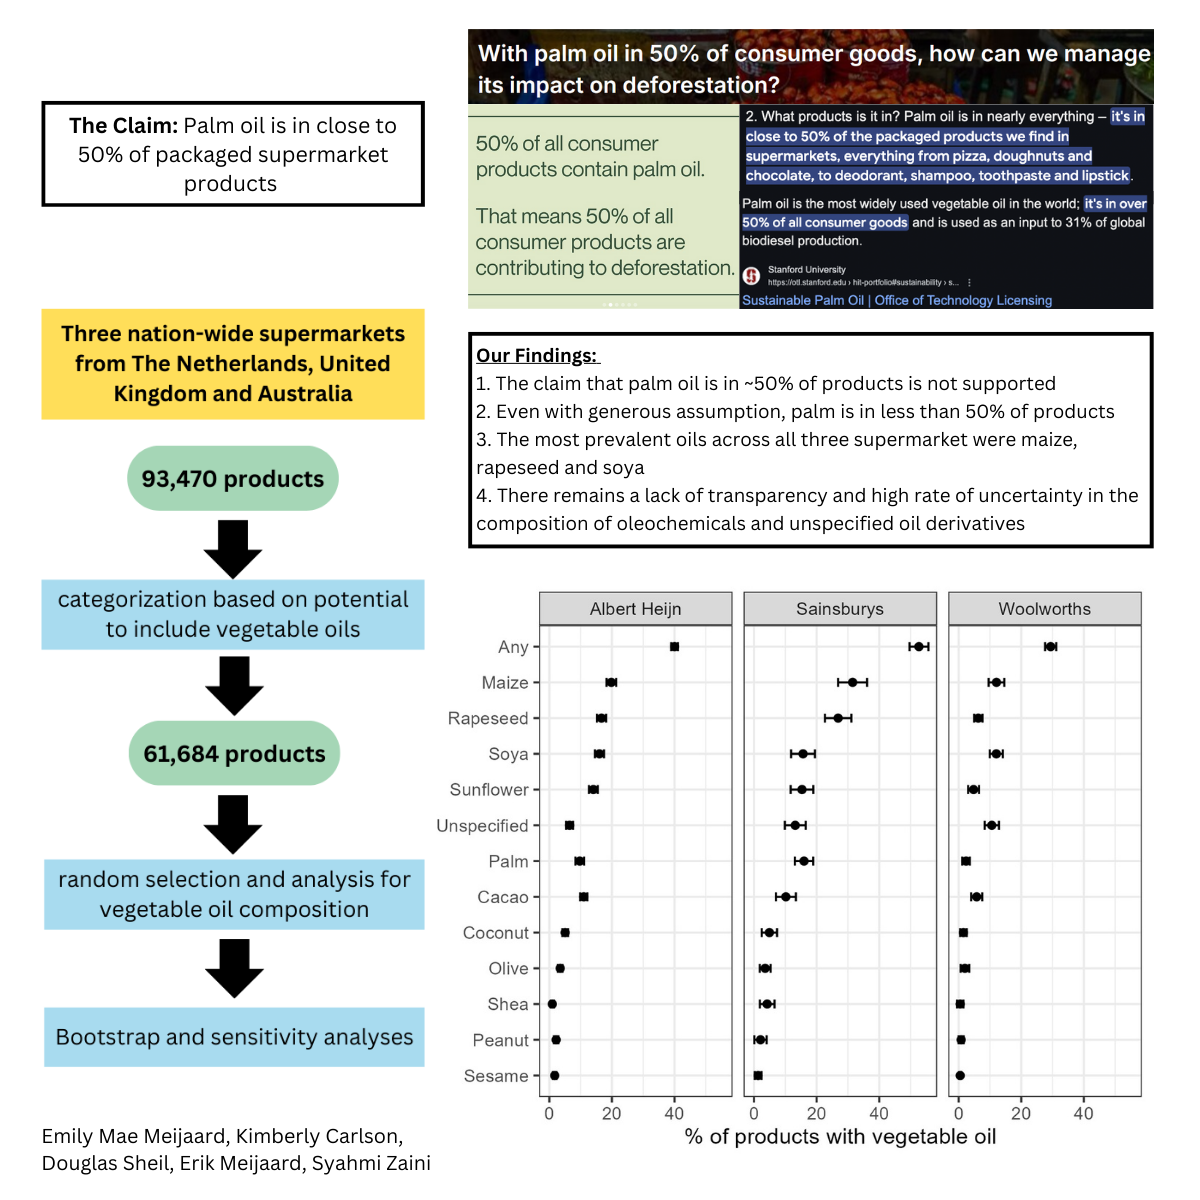
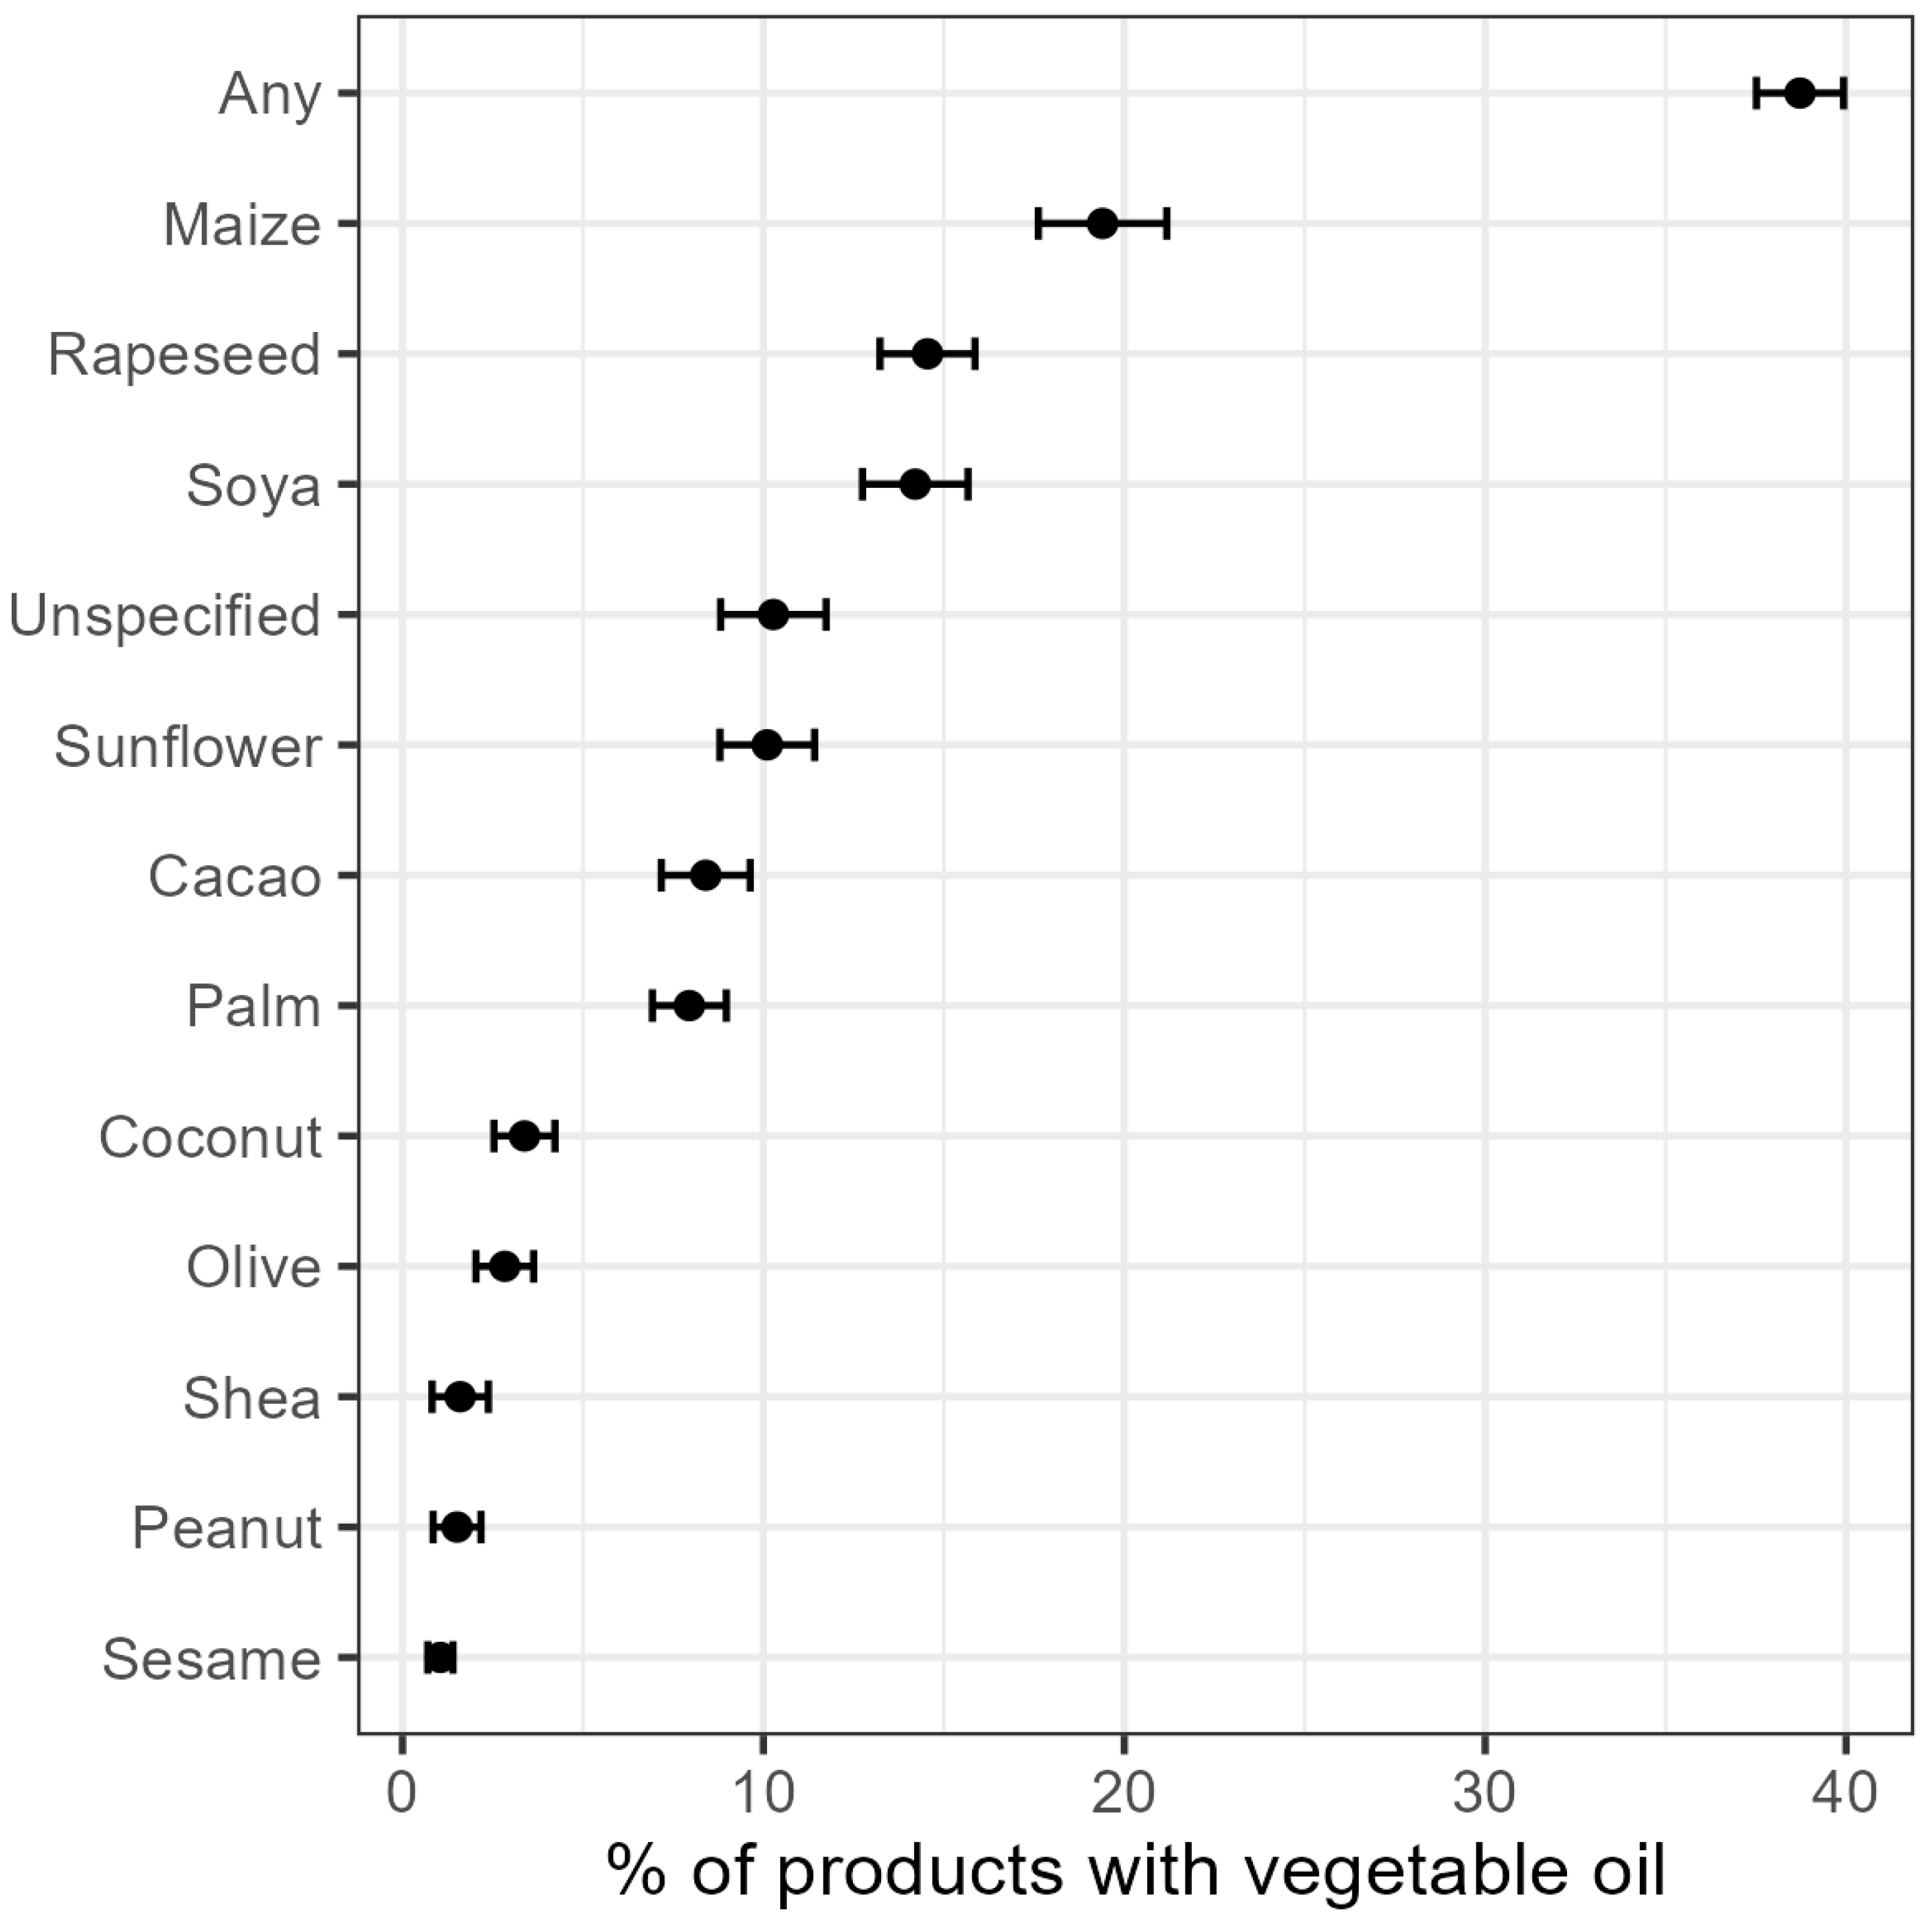
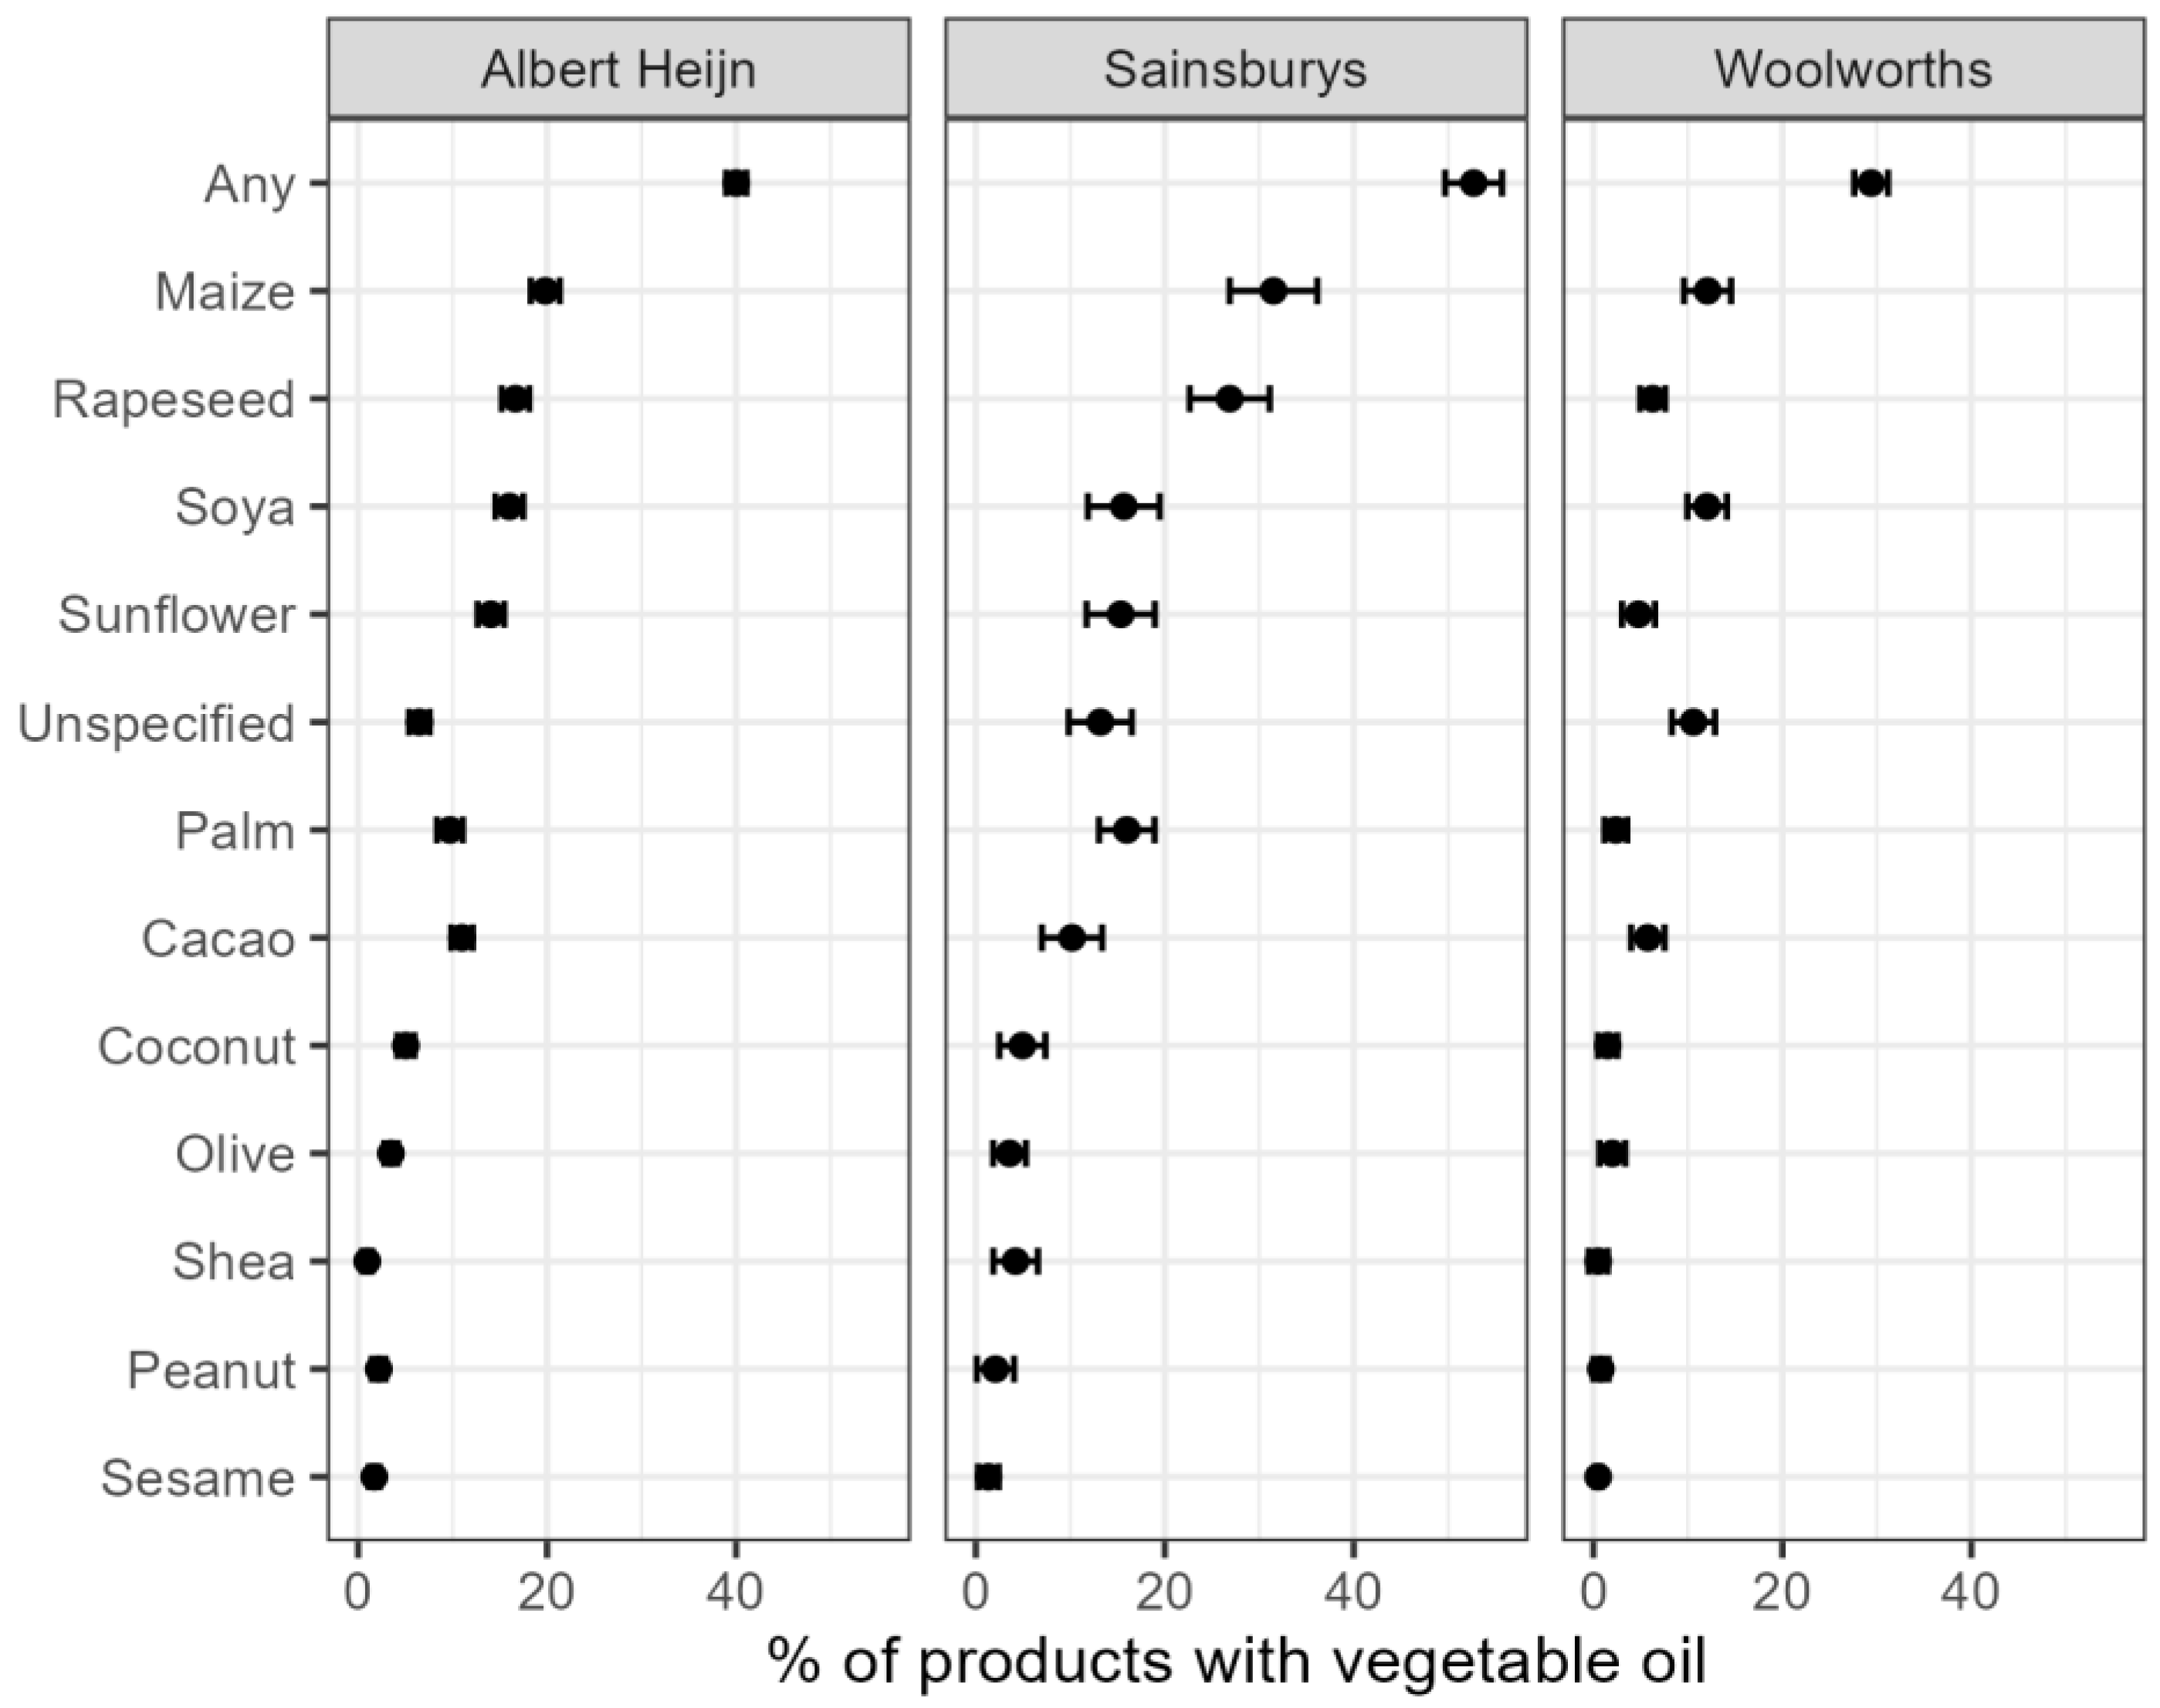
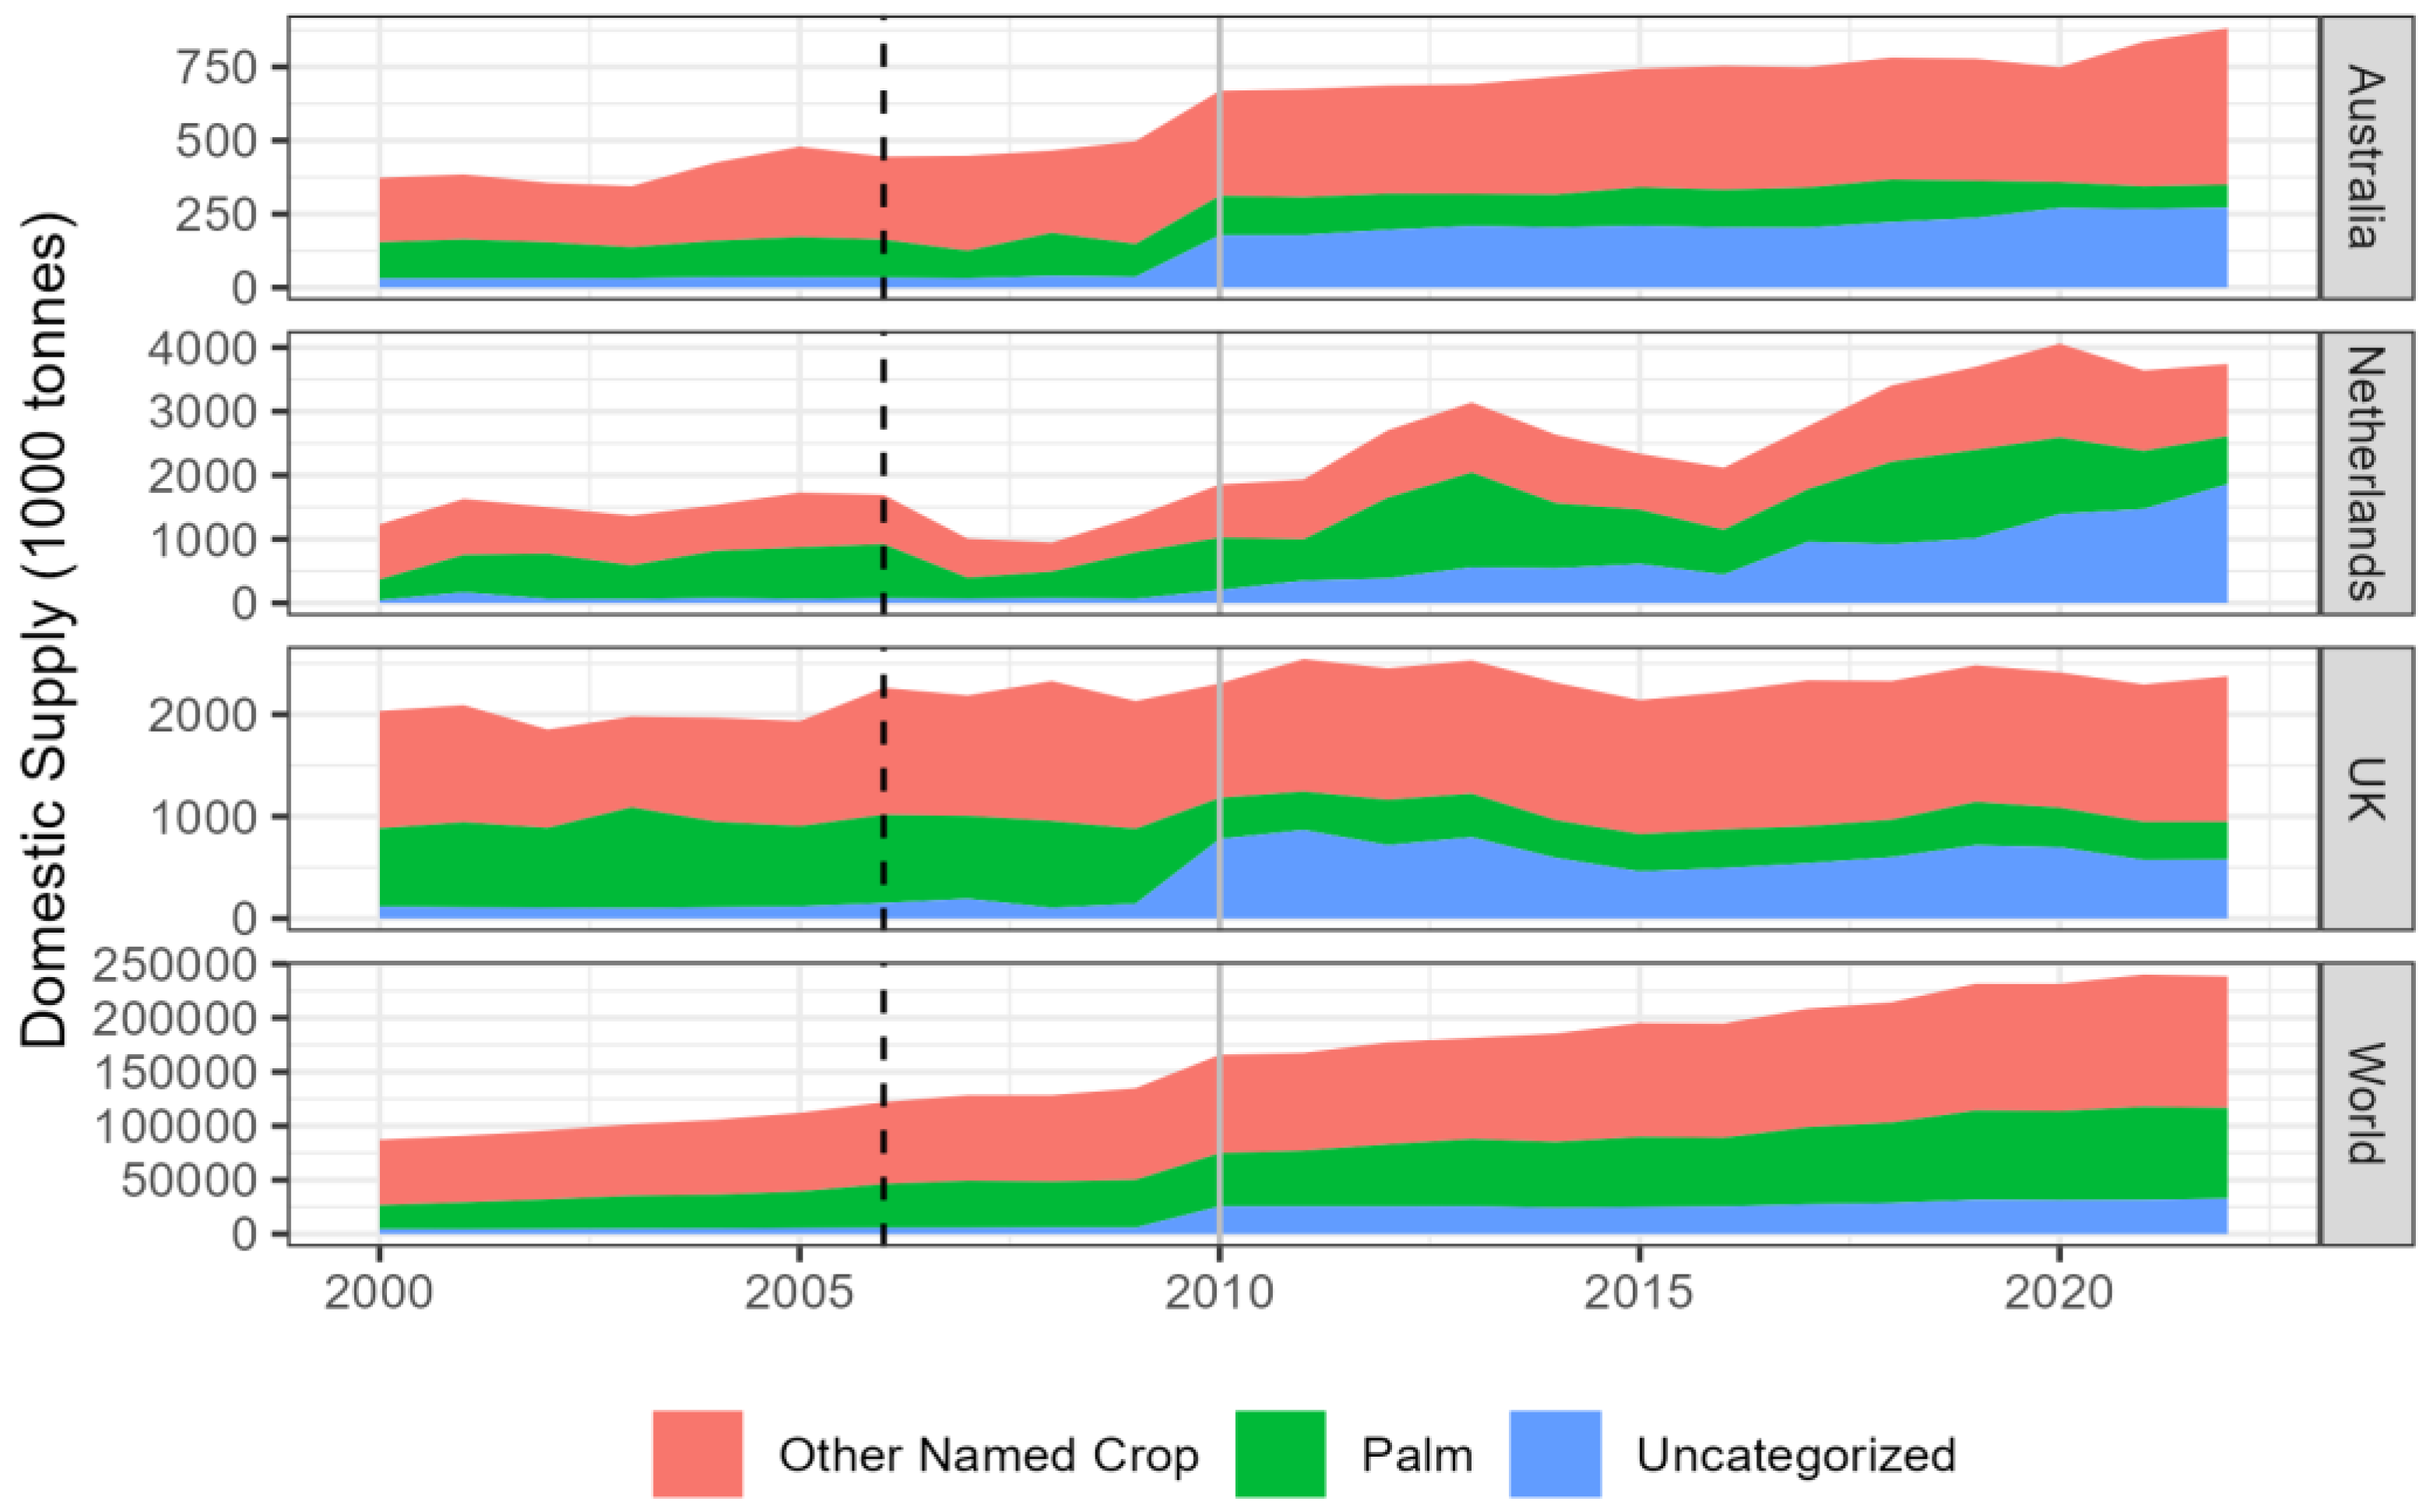
The widely cited claim that 50% of supermarket products contain palm oil appears wrong. Our analysis of ~1,600 products from supermarkets in the Netherlands, United Kingdom, and Australia found palm oil in 7.9% of products, while maize (19%), rapeseed (15%), and soya (14%) were more common. However, up to 40% of products may contain palm oil through unspecified vegetable oils or oleochemicals. While reported declines in palm oil consumption in Europe and Australia, indicate a shift in consumer preferences, these figures correlate with an increased substitution of alternative oils. These alternatives often have higher land requirements than oil palm, raising sustainability concerns. Additionally, incomplete and ambiguous reporting of product composition, particularly for oleochemicals, may obscure the true prevalence of vegetable oils. Regulatory efforts like the EU Deforestation Regulation (EUDR) aim to improve transparency, but challenges remain at the consumption supply chain node where consumers should not only know what vegetable oils are in products, but also the conditions under which those oils were produced. Our findings highlight the need for better food labeling, and impact evaluations, enabling consumers to make informed choices.

Keywords: 
;  ;  ;  ;  ;  ;  ;  ;  ;  

Introduction

Activist and industry groups have shaped public perceptions via branding and social media, leading to polarized views on oils like palm, coconut, and olive, often reinforcing ethical and environmental narratives that may not align with scientific assessments [1-6]. Despite growing demand for supply chain and ingredient transparency [7,8], a widely cited claim (Table S1) that 50% of supermarket products contain palm oil [9] remains unverified. This lack of verification raises questions about the claim’s accuracy and currency, and its implications for the true impact of consumer choices on the conditions under which vegetable oils are produced.
The 50% claim remains widely repeated and has shaped public perception and policy discussions for nearly two decades (Table S1). Palm oil is well known for its role in driving deforestation and loss of biodiversity in Southeast Asia [6]. The belief that increasing palm oil production is caused by the average consumer through everyday purchasing behaviour, underscored by the 50% claim, has fueled non-governmental and consumer activism, leading to boycotts of palm oil-containing products and increased demand for palm oil-free alternatives [10]. Companies have responded by engaging in more sustainable sourcing (e.g., certified palm oil) or removing palm oil from products altogether. Governments and international bodies have introduced stricter palm oil labelling laws [11] and traceability regulations [12] focused on palm oil and other deforestation-risk commodities (e.g., the EU Deforestation Regulation). In the Global North these changes have displaced demand to other oils (e.g., soya, rapeseed, coconut), which like palm oil also have major negative environmental impacts [4]. Understanding the ubiquity of this 50% claim, and the potential influence it may have had on consumers and industry actors, we wanted to determine its validity.
Tracing the claim —that approximately half of supermarket products include palm oil—through time reveals inconsistencies and a lack of supporting research. For the year 2004, we found a statement that 10% of all supermarket products contain palm oil derivatives (Table S1). Two years later, in 2006, this claim was revised to 50%, reportedly by the Worldwide Fund for Nature’s (WWF) global palm oil team. Other organizations such as Greenpeace then started its online use (see Table S1). Over the years, the claim has been repeatedly cited with variations (Table S1 shows 60 variations), with statements referring to “consumer goods,” “packaged goods,” “all products on store shelves,” or “daily products.” Some sources suggest the estimate applies globally, while others restrict it to supermarkets in Australia, the USA, or the UK. The percentage itself has also varied, with claims such as “50% of all packaged supermarket products,” “50-75% of household products,” or “up to 50 to 68% of supermarket products” (Table S1). Personal correspondence with those familiar with the history of the claim suggests that it may have been more of an estimate than a data-driven conclusion (Table S1; C. Barton, in litt.; D. Webber, in litt.; F. Ardiansyah, pers. comm.). The WWF estimate was updated in 2017 by the Singapore Alliance for Sustainable Palm Oil (SASPO) and WWF Singapore [13] to “more than half of packaged supermarket products,” but only in reference to Singapore supermarkets. The SASPO/WWF report did not explain methods, and when we requested more details, no one responded. The persistence of these unverified statistics highlights the broader issue of information surrounding various crops and commodities–in this case, oil palm and palm oil–potentially influencing both consumer behaviour and corporate decision-making despite the absence of clear supporting evidence.
Consumer perceptions of the impact of including or excluding vegetable oils from their consumption is shaped largely by social media and long-standing statistics like WWF's 50% claim. In the case of palm oil, representation in the media has led to a largely negative view of the commodity. A recent survey by Meijaard et al. [4] of 694 people across five continents found that 69% of European respondents actively avoid palm oil when given a choice. Similarly, a 2022 survey by Kantar (unpublished data, see [4]) found that among 1,000 respondents in 18 countries, 54% (SD 13.7) had heard of palm oil, with the majority holding negative views. Specifically, 22% (SD 7.1) had heard about palm oil’s environmental impact, with 82% (SD 14.8) worrying about them, while of the 22% (SD 7.9) of the total respondents who heard about palm oil’s health impacts, 69% (SD 16.3) were worried about these. Fewer people (13.8%, SD 4.5) had heard about palm oil’s negative social impacts, but of those that had, 82% (SD 10.5) were concerned about them.
These negative perceptions shape consumer behaviour. A meta-analysis of studies on palm oil in products concluded that concerns about environmental and health impacts discourage consumers from purchasing products containing palm oil (Savarese et al., 2022). Yet, despite its reputation, palm oil is not uniquely problematic compared to other major vegetable oils [4]. While concerns over deforestation and biodiversity loss are legitimate, social media discourse often exaggerates palm oil’s negative impacts while downplaying similar issues in the production of soya, rapeseed, or sunflower oil. As a result, many consumers mistakenly believe that avoiding palm oil is an inherently sustainable choice, without considering the broader environmental consequences of its alternatives.
Widely cited statistics about the prevalence of palm oil in consumer products have also been used to influence policy decisions, even when those figures may not fully reflect reality. For example, the claim that 50% of supermarket products contain palm oil has been used by NGOs to emphasize the global significance of palm oil, particularly in regions far from its production [9], as a means to encourage policymakers to address sustainability challenges in its supply chain [4]. These campaigns were largely successful in driving action. However, ensuring that policies and consumer behaviors are guided by accurate and complete information is crucial. Claims about the relative importance of different oils in consumption need to be accurate and account for the impact of all vegetable oils in the supply chain [4]. Accuracy and omission fallacies may mislead both policymakers and consumers about the actual impact that restricting palm oil consumption in these markets would have. In response to concerns about the sustainability of vegetable oils, regulatory requirements for clearer food labeling have increased [11], but accurate and comprehensive information—including the role of all oils—must underpin policy and governance to ensure informed decision-making.
Here we assess the prevalence of palm oil and other vegetable oils in supermarket products and compare this with the often quoted 50% of products containing palm oil. We analyze products from three supermarkets that publish suitable ingredient information online. Specifically, we consider the following questions: 1) what percentage of products available from these supermarkets currently contain palm oil and other major vegetable oils?; 2) how do these percentages vary among countries?; 3) which oils dominate particular product categories?; and 4) what are the limitations to such assessments with public data?

Results

Our analysis of the three supermarkets included assessments of 1,604 from a total of 93,470 products (Table S2). Our methods are fully described in the Experimental Procedures section below.
If we exclude 288 sampled products with only oleochemicals from the analysis, about 39% (95% Confidence Interval [CI] 38-40%) of all products at all supermarkets contained vegetable oils. We found significant variation in vegetable oil crops used among products and supermarkets. Maize was found in an estimated 19% of supermarket products (CI 18-21%), followed by rapeseed (15%, CI 13-16%), soya (14%, CI 13-16%), unspecified (10%, CI 8.8-12%), sunflower (10%, CI 8.8-11%), and cacao (8.4%, CI 7.2-10%). Palm oil was seventh and occurred in an estimated 7.9% of all supermarket products without oleochemicals (CI 6.9-9.0%) (Figure 1).
There were differences between the three supermarkets, with the presence of palm oil being relatively high in Sainsbury’s (16%, CI 13-19%) and low at Woolworths (2.4%, CI 1.2-3.6%), but still, maize remained the most frequently used named oil crop across all supermarkets (Figure 2).
In addition to named oil crops, we also identified 111 unique chemicals with likely vegetable oil origins in product lists (Table S3). About 65% of these oleochemicals are commonly produced from palm oil and 64% from coconut, with sunflower, soya, rapeseed, wheat, peanut, and olive presumably being used more rarely (Table S3). The potential dominance of palm and coconut oil in cosmetics, toiletries, and health products is clear (Figure S2). When these products were included, the overall occurrence of vegetable oil increased to 58% (CI 55-60%) of all products across all markets. The prevalence of palm and coconut oil increased to 33% (CI 30-37%) and 30% (CI 27-33%), of all products, respectively (Figure S1). If, in the most extreme case, we also assume that all “unspecified oils” are palm, we find that 40% (CI 37-43%) of all supermarket products contain palm or palm kernel oil. Yet, this maximum is exceeded by maize (46%, CI 43-49%) rapeseed (44%, 41-47%), soya (43%, 40-46%), and sunflower (43%, 40-46%) oils if unspecified oils are attributed to these crops.

Discussion

Our study suggests that WWF’s 50% claim is no longer accurate—if it ever was. Across major Western supermarkets, palm oil was present in only an estimated 7.9% to 40% of products, depending on whether oleochemicals and oils of uncertain provenance were included. Thus, we suspect the “50% claim” is either an outdated zombie statistic or has always been wrong.
The use of the 50% claim appears to have had two major objectives and strategies. First, groups like WWF and the Roundtable on Sustainable Palm Oil (RSPO), both groups that promote sustainable palm oil, aim to emphasize that palm oil is everywhere, hence unavoidable and therefore we need to focus on sustainable palm oil. Second, there are groups that are against palm oil, who argue that because palm oil is everywhere, we need to make an even greater effort to avoid it - hence the "contains no palm oil" labelling. Both groups leverage the 50% zombie statistic for their own aims, but no matter their aim, a high number plays better than a low one. This is also exemplified by a new statistic promoted by the RSPO that 70% of cosmetics contain either palm oil or palm kernel oil derivatives [14], although there is no published method supporting the estimate.
From Table S1 we note we are dealing not with one well-defined claim, but rather with a plethora of similar-sounding claims differing in categories mentioned and where they apply. We lack the data across regions to address all of these but at least for the supermarkets we have sampled, in 2024, we can conclude that palm oil, palm kernel oil and their derivatives are not present in 50% of listed products, packaged products, foodstuffs, or packaged foodstuffs. Indeed, within food products, palm prevalence was on par with that of cacao. We lack a clear definition for some concepts such as “household products” and “daily products”. If these concepts are equivalent to what we categorized as cosmetics and toiletries, palm oil could be present in >50% of these categories if oleochemicals are derived mainly from oil palm, an extreme assumption (Figure S2).
It remains unclear whether palm oil use in supermarket products has genuinely declined since 2006 due to reformulation or whether the original statistic was simply inaccurate. At the national level where our sampled supermarkets were located, domestic vegetable oil use data from the Food and Agriculture Organization indicate a relative decline in palm oil consumption. Between 2006 and 2022 (the most recent year for which data are available), palm and palm kernel oil’s share of the domestic supply of vegetable oils included in this study dropped from 29% to 9% in Australia, from 38% to 16% in the UK, and from 50% to 20% in the Netherlands (Figure 3). While changes in data collection may influence the UK data, the declines in Australia and the Netherlands largely occurred after 2010, when tracking methods remained consistent. During the same period, at a global level, palm oil’s share of vegetable oil supply increased from 33% to 35% (Figure 3), potentially indicating a displacement of palm oil from the Global North to South.
The Netherlands, UK, and Australia supermarkets currently rely heavily on rapeseed, sunflower, maize, and soya (Figure 1). Global production of these oils has indeed increased between 2006 and 2022, by 47.5%, 75.5%, 34.2% and 65.9%, respectively, although none as much as palm oil (100.1%) and palm kernel oil (86.2%) [17]. These global changes in vegetable oil production have consequences for global land use. An estimated 37% of agricultural land is globally allocated to crops that can produce oil (including maize and soya, which are mostly used for animal feed) [4]. The production of palm oil requires 3.7 to 4.8 less land than other oil crops because of oil palm’s high yields [6]. Yet, we are aware of no statistics or campaigns based on the percentage of products on supermarket shelves that contain other vegetable oils including soya, maize, cacao, and coconut, which like palm are strongly linked to tropical deforestation and biodiversity declines [18-21].
If there has been a shift away from palm oil in supermarket products in Europe and Australia, this could be interpreted as a victory for anti–palm oil campaigns. With palm oil production increasing globally, and consumption in the Global North shifting to countries such as India, Indonesia, Pakistan, China and Malaysia, it is, however, unlikely that any substitution of palm oil has resulted in net environmental and social benefits [6]. Thus, rather than achieving a meaningful reduction in environmental and social harm, the shift away from palm oil in Europe and Australia may ultimately be a Pyrrhic victory for anti–palm oil campaigners, as it redirects rather than resolves the underlying issues.
It may also be that the supermarkets we studied are exceptional in terms of the choices they make about vegetable oils, leading them to sell fewer products with palm oil than the average supermarket. While all three studied supermarkets have palm (kernel) oil policies with goals for sustainability of their own brand products, none has a policy or goal of removing palm oil from their market [22-24], such as has been attempted at other supermarkets [25]. Thus, we do not expect these supermarkets to be biased toward or against palm oil products. Moreover, each supermarket commands a significant market share in its respective country, ranging from 15% (Sainsbury’s) to 37-38% (Woolworths and Albert Heijn) in 2024 [26-28].
Navigating the complex landscape of food choices is no easy task for consumers, who find themselves caught between online (dis)information, science-based facts, and a desire to make sustainable choices. The year 2025 marks a decade since the Rockefeller-Lancet Commission report brought the interdependence of human and environmental health to the forefront, and six years since the EAT-Lancet Report proposed the Planetary Health Diet—guidelines aimed at feeding a growing global population without further exceeding planetary boundaries [29]. Among these recommendations, the diet outlines specific targets for daily oil consumption: 6.8 g of saturated fats and 40 g of unsaturated fats. Given the environmental and health implications of dietary choices [30-32], many consumers seeking to align their behavior with such guidelines are interested in knowing which oils are in the products they consume. Yet, poor transparency in product labeling makes it difficult to verify which oils are present in supermarket goods.
Consumer-driven resources like Open Food Facts offer some insights into the presence or absence of some vegetable oils and their derivatives in many products but their accessibility and usage remain limited and confined by temporal and geographic restrictions. Furthermore, ingredient lists are self-reported by application users, which may pose issues of accuracy. In many cases, shoppers must physically examine product labels to determine their oil consumption. Even then, front labels—where claims like "contains no palm oil" or "made with shea butter" appear prominently—rarely provide the full picture, often requiring consumers to check the back label for more details. These back labels are infrequently consulted by consumers [33], and, as our study shows, do not provide consumers with comprehensive information about the oil crops used in the product and the social and environmental (and nutritional) impacts of their production, processing and trade, and how this aligns with consumers’ values. For instance, we found that about 18% of our product sample contained only oleochemical names, not the origins of these oils. Purchasing groceries online creates an additional major barrier to transparency. The three supermarkets studied here were unique for sharing ingredients for most products online.
Despite widespread concerns about palm oil, identifying its presence in products remains surprisingly difficult. In our study, “unidentified” vegetable oil was present in 10% of all products, and products only containing oleochemicals likely derived from vegetable oils comprised almost a fifth of our sample. Even the FAO statistics indicate a quickly growing portion of vegetable oil not linked to any specific crop (Figure 3). This lack of transparency is linked to the concentration of power in agricultural supply chains, where just a handful of multinational corporations control production, processing, and trade [4]. These companies substitute oils based on market conditions, labeling them with terms such as “palm and/or soybean oil”. As a result, product labels obscure ingredient origins, and regulatory frameworks shaped by corporate lobbying reinforce this opacity. Moreover, the same crop can be produced under vastly different conditions, meaning that even crop-specific product labels mask the actual environmental and social impacts of production [4]. Absent labeling undertaken voluntarily by corporations (e.g., indicating third party sustainable certification), consumers must apply heuristics (e.g., palm is bad, olive is good) that are unlikely to reflect the embodied qualities of the specific product they are consuming. Without structural reforms to increase transparency, consumer choice remains constrained, and sustainability efforts risk being undermined by the dominance of a few key players.
Like all studies, ours has important limitations. First, our analysis relies on supermarkets providing accurate and complete ingredient information — something we could not independently verify. The apparent lumping of palm and palm kernel oil – despite distinctly different chemical characteristics – is an example. Second, uncertainty remains regarding the presence of vegetable oils in non-food products, such as cosmetics and toiletries, where ingredient sourcing is often opaque. Given the interchangeability of oil crops in the production of oleochemicals [34], this further complicates consumer efforts to make informed choices. Third, ingredient lists only mention the presence of oil crops, but not which derivative was used. This could be oil, but it could also be glucose, protein, or another derivative. This likely results in overestimates for soya and maize which are often used for non-oil purposes. Fourth, we also wondered if the 50% claim may not refer to all listed products but to 50% of the contents of an average shopping trolley or basket as selected and bought by an average consumer, or some such refined definition that would give more weight to more consumed items–we lack the information that would be required for such an assessment (though the supermarkets themselves likely know this).
Ultimately, consumers need clear and transparent information to make dietary choices that align with sustainability goals like the Planetary Health Diet. However, outdated data, vague labelling, and polarized narratives obscure the reality of vegetable oil sourcing. While producers at the beginning of the supply chain are increasingly subject to strict traceability requirements under regulations like the European Deforestation Regulation (EUDR), similar transparency is rarely demanded of supermarkets and consumer goods companies. This needs to change. Consumers should have access to detailed product attributes, such as the percentage of palm oil sourced from Indonesia, Malaysia, or smallholder farms, the origin of peanuts in peanut butter, or the proportion of soya from regions like Mato Grosso versus São Paulo. With advances in supply chain traceability, providing this information is now feasible—and essential—to help consumers make truly informed and sustainable choices.

Experimental Procedures

Supermarket Selection

We sampled products from three major supermarket chains that listed product ingredients online between 6 September 2024 and 10 January 2025. The main sample was collected from Albert Heijn, the largest supermarket chain in the Netherlands, and representative of a national, Western European supermarket that provided complete online information on the ingredients in their products. A total of 926 products were randomly sampled from Albert Heijn. Initially, three additional supermarkets were selected for comparison: Sainsbury’s (United Kingdom), Woolworths (Australia), and Walmart (United States). Each supermarket was selected based on its status as a large nationwide chain that provides comprehensive online ingredient listings. We later excluded Walmart due to a lack of information on ingredients in cosmetics and toiletries and incomplete product listings. At Sainsbury’s and Woolworths, we sampled 340 and 338 products, respectively. None of the sampled supermarkets make claims about reducing or limiting palm oil on their shelves, but all have committed to sourcing only RSPO and/or ISCC-certified products [22-24]. We were unable to find comparable data (i.e., online ingredient lists) for supermarkets in Asia and South America.

Product Sampling Strategy

We used a stratified sampling strategy that relied on supermarket-defined categories and subcategories of products, for example, Dairy (category) and Milk; Cheese (subcategories).
We first assessed each subcategory for the likelihood of containing vegetable oils. To do so, we randomly selected 10 products from that subcategory and reviewed the ingredients in these products. If at least one product contained oleochemicals or vegetable oils, we included the subcategory in our sample. We recorded the total number of products for subcategories without vegetable oils or oleochemicals but did not sample them. For vegetable oil-containing subcategories, we recorded the total number of products and proceeded with sampling as described below. From the population of 93,470 products across three supermarkets, 31,786 were in subcategories that did not contain vegetable oil. We classified subcategories into classes consisting of Food & Drink, Cosmetics & Toiletries, Health, and Other to evaluate the diversity of oil content across different classes of products.
In some cases, subcategories were repeated in more than one category (e.g. ‘Butter’ as a subcategory falling under both the ‘Dairy, Eggs and Butter’ and ‘Breakfast and Spreads’ categories). In these events, we cross-checked that the categories were exact repeats and, if so, excluded the repeated category.
At each supermarket, we then sampled all vegetable oil-containing subcategories. First, we divided the total sample (926 for Albert Heijn, ~340 for the other two markets) equally across all oil-containing categories (e.g., if there were 10 categories at Sainsbury's, each would be assigned 34). Within each category, the sample was distributed only across oil-containing subcategories as identified above, proportional to the number of products in those subcategories. Finally, within these subcategories, products were randomly selected using a random number generator [35]. Using these numbers, products were selected, counting horizontally from left to right across rows on the website, starting with the first product as number 1. No sorting methods were applied to the product selection (e.g., sorting by ascending price). Because some products occurred in multiple subcategories, there were some repeated products in our sample. For a complete list of sampled products, see Resource Availability.

Ingredient Data

For each sampled product, we recorded the product name and ingredient list from the website in a spreadsheet. Next, we examined the ingredient list and noted which vegetable oil(s) or oil-producing crops were present in the list. While palm oil and palm kernel oil have quite different uses, the latter is rarely specified on product labels, and we merged the two oils into one palm oil class. We noted when a product was listed to contain: palm or palm kernel oil, sunflower, soya, rapeseed, coconut, peanut, olive, maize, sesame, shea, or cacao. These are the 11 main oil-producing crops by production volume, excluding those such as cottonseed and castor oil which are rarely used in supermarket products [4]. Infrequently used vegetable oils, such as lemon oil, almond oil, avocado oil, grapeseed oil and jojoba oil were omitted from the analyses. One category of emulsifiers, mono- and diglycerides of fatty acids, is common in food products but it can be produced from different oil crops. Products with this emulsifier were labelled with the “unspecified oils” category.
Many health and beauty products do not list the actual oils but rather mention the oleochemicals derived from these oils. Through chemical processing, these oleochemicals can be derived from a wide range of oils [36]. While oils are to a considerable extent interchangeable [34], certain oils are most often used for certain oleochemicals. Examples include ammonium lauryl sulfate (commonly made from palm or coconut oil), arachidyl glucoside (made from peanut oil), behentrimonium chloride (often made from rapeseed), and lecithin (often made from soya, rapeseed or sunflower). We first noted each product that contained such oleochemicals. Then we looked up the individual oleochemicals online and determined how each was generally produced (see Table S3). This included ingredients or E numbers (European coding system for substances used as food additives) likely sourced from vegetable oil crops like “hydroxystearic acid” (generally sourced from coconut or palm), “vegetable oils” (which can be sourced from any oil), or “E442” (i.e., ammonium phosphatides, generally sourced from rapeseed). For oleochemicals that are generally derived from more than one oil we added multiple most likely oil crops as their source (e.g., ammonium laurel sulfate can be derived from either coconut or palm or both, so we added both coconut and palm to the spreadsheet). If the oil source was unknown based on our online search, we reported the oleochemical as ‘unspecified oils’ to prevent undercounting of specific oils.

Statistical Analysis

Our main analysis estimated the relative proportion of supermarket products containing each type of oil crop, excluding products with oleochemicals because of their uncertainty. First, we applied a bootstrap analysis in R [37] to sampled subcategories. In our design, specified with the survey package [38], we used the sampled supermarket-subcategory groups as strata, and the total number of products in each subcategory to correct for finite populations. We converted this to a bootstrap replicate design using the svrep package [39], with 1000 replicates, using the “Rao-Wu-Yue-Beaumont” bootstrap method and other default settings. Then, we computed the mean and 95% confidence interval (CI) of the proportion of products in sampled subcategories that contained each oil or any oil for various groupings (i.e., across all markets; by market; by market and class). To correct for categories and subcategories that contained no oils and were excluded from the sample, we calculated weighted means for these groupings. Weights were the proportion of sampled and unsampled products in each grouping, and values associated with weights were the mean or confidence intervals (sampled products) or zero (unsampled products containing no oils).

Sensitivity Analysis

We conducted two sensitivity analyses using modified datasets in the bootstrapping approach described above. First, we included products with oleochemicals, including the most likely oil crop source for these oleochemicals. Increasing the total number of products considered in the analysis sometimes reduced the estimated prevalence of certain oils (e.g., maize) in supermarket product populations. Second, we assumed that all “unspecified oils” were derived from palm oil.

Resource Availability

Lead contact. Emily Meijaard: emilymeijaard@borneofutures.org. Data and code availability. Supermarket sample data are available at https://doi.org/10.5281/zenodo.14886251.

Supplementary Materials

The following supporting information can be downloaded at the website of this paper posted on Preprints.org, Figures S1–S3 and Table S1-S4.

Author Contributions

Conceptualization: E.M.; Methodology: E.M.M., K.C., D.S., S.Z., E.M.; Formal Analysis: K.C.; Investigation; E.M.M., S.Z., E.M.; Data Curation: E.M.M., S.Z.; Writing – Original Draft: E.M.M., K.C., D.S., E.M.; Writing – Review & Editing: E.M.M., K.C., D.S., E.M.; Visualization: K.C.

Acknowledgments

This report was developed with the financial support of Soremartec SA and Soremartec Italia, Ferrero Group, and its Sustainable Nutrition Scientific Board. The funders had no role in study design, data collection, and analysis, decision to publish, or preparation of the manuscript.

Conflicts of Interest

E.M. is an independent member of the Sustainable Nutrition Scientific Board. E.M., D.S. and K.C. are members of the IUCN Oil Crops Task Force. D.S., E.M. and K.C. have facilitated student research on palm oil and soybean.

References

  1. Candellone, E. , Aleta, A., Ferraz de Arruda, H., Meijaard, E., and Moreno, Y. (2024). Understanding the Vegetable Oil Debate and Its Implications for Sustainability through Social Media. Communications Earth & Environment 5, 391. [CrossRef]
  2. Ostfeld, R. , Howarth, D., Reiner, D., and Krasny, P. (2019). Peeling back the label—exploring sustainable palm oil ecolabelling and consumption in the United Kingdom. Environmental Research Letters 14, 014001. [CrossRef]
  3. LaPorte, P.S. , Meijaard, E., and Carlson, K.M. (in press). Scientific evidence and conservation community member perceptions about palm oil. PLOS Sustainability and Transformation.
  4. Meijaard, E. , Virah-Sawmy, M., Newing, H.S., Ingram, V., Holle, M.J.M., Pasmans, T., Omar, S., van den Hombergh, H., Unus, N., Fosch, A., et al. (2024). Exploring the future of vegetable oils. Oil crop implications - Fats, forests, forecasts, and futures (IUCN and SNSB). [CrossRef]
  5. Gassler, B. , and Spiller, A. (2018). Is it all in the MIX? Consumer preferences for segregated and mass balance certified sustainable palm oil. Journal of Cleaner Production 195, 21-31. [CrossRef]
  6. Meijaard, E., Brooks, T.M., Carlson, K.M., Slade, E.M., Garcia-Ulloa, J., Gaveau, D.L.A., Lee, J.S.H., Santika, T., Juffe-Bignoli, D., Struebig, M.J., et al. The environmental impacts of palm oil in context. Nature Plants 2020, 6, 1418–1426. [Google Scholar] [CrossRef]
  7. Wu, W. , Zhang, A., van Klinken, R.D., Schrobback, P., and Muller, J.M. (2021). Consumer Trust in Food and the Food System: A Critical Review. Foods 10, 2490.
  8. Mollenkopf, D.A. , Peinkofer, S.T., and Chu, Y. (2022). Supply chain transparency: Consumer reactions to incongruent signals. Journal of Operations Management 68, 306-327. [CrossRef]
  9. WWF (2009). WWF Palm Oil Buyers’ Scorecard 2009. How ‘green’ is the palm oil purchased by European companies? WWF International/Forest Conversion Programme.
  10. Meijaard, E. , and Sheil, D. (2019). The Moral Minefield of Ethical Oil Palm and Sustainable Development. Frontiers in Forests and Global Change 2, 28 May. [CrossRef]
  11. Sheargold, E. , and Mitchell, A.D. (2011). Oils ain’t oils: Product labelling, palm oil and the WTO. Melbourne Journal of International Law 12, [148]-170.
  12. Pacheco, P. , Schoneveld, G., Dermawan, A., Komarudin, H., and Djama, M. (2020). Governing sustainable palm oil supply: Disconnects, complementarities, and antagonisms between state regulations and private standards. Regulation & Governance 14, 568-598. [CrossRef]
  13. SASPO (2018). Guide To Sustainable Palm Oil For Singapore Companies: Economic Opportunities And Sourcing Guidelines. SASPO,.
  14. RSPO (undated, post 2020). Factsheet on home and personal care sector. Roundtable on Sustainable Palm Oil.
  15. FAO (2020). FAOSTAT. Food Balances (-2013, old methodology and population). Metadata. https://www.fao.org/faostat/en/#data/FBSH/metadata.
  16. FAO (2024). Food Balances (2010-). Metadata. https://www.fao.org/faostat/en/#data/FBS/metadata.
  17. FAO (2024). FAOSTAT. Crops and livestock products. Global production quantify. https://www.fao.org/faostat/en/#data/QCL.
  18. Goldman, E. , Weisse, M., Harris, N.L., and Schneider, M. (2020). Estimating the Role of Seven Commodities in Agriculture-Linked Deforestation: Oil Palm, Soy, Cattle, Wood Fiber, Cocoa, Coffee, and Rubber. World Resources Institute. November 2020.
  19. Song, X.-P., Hansen, M.C., Potapov, P., Adusei, B., Pickering, J., Adami, M., Lima, A., Zalles, V., Stehman, S.V., Di Bella, C.M., et al. Massive soybean expansion in South America since 2000 and implications for conservation. Nature Sustainability 2021, 4, 784–792. [Google Scholar] [CrossRef] [PubMed]
  20. Jayathilake, H.M., Prescott, G.W., Carrasco, L.R., Rao, M., and Symes, W.S. Drivers of deforestation and degradation for 28 tropical conservation landscapes. Ambio 2021, 50, 215–228. [Google Scholar] [CrossRef]
  21. Meijaard, E., Abrams, J.F., Juffe-Bignoli, D., Voigt, M., and Sheil, D. Coconut oil, conservation and the conscientious consumer. Current Biology 2020, 30, R757–R758. [Google Scholar] [CrossRef]
  22. Woolworths (2023). Policy - Sustainable Palm Oil Sourcing for Woodworths Own Brand Food and Formulated Non-Food Products. POL.022. Woolworths Group Limited.
  23. Albert Heijn (2024). Duurzame keurmerken. Available online: https://www.ah.nl/inspiratie/duurzaamheid/duurzame-keurmerken (accessed on 19 February 2025).
  24. Sainsbury (2024). Sustainable Palm Oil. Available online: https://www.about.sainsburys.co.uk/sustainability/plan-for-better/our-stories/2023/palm-oil (accessed on 24 June 2024).
  25. Butler, S. (2022). Iceland reverts to palm oil ‘with regret’ as Ukraine war hits food prices. Available online: https://www.theguardian.com/business/2022/mar/28/iceland-reverts-to-palm-oil-with-regret-as-ukraine-war-hits-food-prices (accessed on 5 February 2025).
  26. Retail Detail (2025). Expansion earns Albert Heijn market share growth despite tobacco ban. Dated 21 January 2025. Available online: https://www.retaildetail.eu/news/food/expansion-earns-albert-heijn-market-share-growth-despite-tobacco-ban/ (accessed on 26 February 2025).
  27. Statista (2024). Market share of grocery stores in Great Britain from January 2017 to November 2024. Dated 4 December 2024. Available online: https://www.statista.com/statistics/280208/grocery-market-share-in-the-united-kingdom-uk/ (accessed on 26 February 2025).
  28. Statista (2024). Market share of grocery retailers in Australia in financial year 2023. Dated 31 May 2024. Available online: https://www.statista.com/statistics/994601/grocery-retailer-market-share-australia/ (accessed on 26 February 2025).
  29. Willett, W. , Rockström, J., Loken, B., Springmann, M., Lang, T., Vermeulen, S., Garnett, T., Tilman, D., DeClerck, F., Wood, A., et al. (2019). Food in the Anthropocene: the EAT–Lancet Commission on healthy diets from sustainable food systems. The Lancet 393, 447-492. [CrossRef]
  30. Shah, U.A. , and Merlo, G. (2023). Personal and Planetary Health-The Connection With Dietary Choices. Jama 329, 1823-1824. 10.1001/jama.2023.6118.
  31. Cai, H. , Talsma, E.F., Chang, Z., Wen, X., Fan, S., van't Veer, P., and Biesbroek, S. (2024). Health outcomes, environmental impacts, and diet costs of adherence to the EAT-Lancet Diet in China in 1997–2015: a health and nutrition survey. The Lancet Planetary Health 8, e1030-e1042. [CrossRef]
  32. Chiriacò, M.V. , Galli, N., Latella, M., and Rulli, M.C. (2025). Pressure on Global Forests: Implications of Rising Vegetable Oils Consumption Under the EAT-Lancet Diet. Glob Chang Biol 31, e70077. [CrossRef]
  33. Grunert, K.G.; Wills, J.M. A review of European research on consumer response to nutrition information on food labels. Journal of Public Health 2007, 15, 385–399. [Google Scholar] [CrossRef]
  34. Parsons, S.; Raikova, S.; Chuck, C.J. The viability and desirability of replacing palm oil. Nature Sustainability 2020, 3, 412–418. [Google Scholar] [CrossRef]
  35. Random Lists (2024). Random Number Generator. Available online: https://www.randomlists.com/random-numbers.
  36. Hill, K. Fats and oils as oleochemical raw materials. 2000, 72, 1255–1264. [Google Scholar] [CrossRef]
  37. R Core Team (2024). R: A language and environment for statistical computing. R Foundation for Statistical Computing. Available online: http://www.R-project.org/.
  38. Lumley, T. (2024). Survey: analysis of complex survey samples. R package version 4.4.
  39. Schneider, B. (2023). svrep: Tools for Creating, Updating, and Analyzing Survey Replicate Weights. R package version 0.6.0.
Figure 1. Overall relative presence of oil crop derivatives in supermarket products across three supermarkets in the Netherlands, United Kingdom and Australia, excluding products for which only oleochemicals were listed. “Any” signifies products that contain at least one vegetable oil, including the unspecified category. The circles represent means, and the bars represent 95% confidence intervals derived from bootstrapping.
Preprints 152309 g001
Figure 2. Relative presence of oil crop derivatives in supermarket products by supermarket, excluding products for which only oleochemicals were listed. “Any” signifies products that contain at least one vegetable oil, including the unspecified category. The circles represent means, and the bars represent 95% confidence intervals derived from bootstrapping.
Preprints 152309 g002
Figure 3. Change in domestic supply of vegetable oils derived from FAO Food Balance Sheets from 2000 to 2022 in three countries and the world. We aggregated the supply of palm oils (palm oil + palm kernel oil; “Palm”), other major vegetable oils included in this study (i.e., soya, peanut, sunflower, rape, coconut, sesame, olive, and maize; “Other Named Crop”), and the FAO’s “other” oil crop oil category which includes several crops such as jojoba as well as margarine (“Uncategorized”). From 2000 to 2009 we used the old food balance sheet methodology [15], and from 2010 to 2022 the new methodology, which accounts for discontinuities between the 2009 and 2010 data [16]. The vertical dashed black line indicates 2006 (the year the 50% palm oil figure was initially reported by WWF) and the vertical solid grey line indicates 2010, the initial year of updated FAO methodology.
Preprints 152309 g003
Disclaimer/Publisher’s Note: The statements, opinions and data contained in all publications are solely those of the individual author(s) and contributor(s) and not of MDPI and/or the editor(s). MDPI and/or the editor(s) disclaim responsibility for any injury to people or property resulting from any ideas, methods, instructions or products referred to in the content.
Copyright: This open access article is published under a Creative Commons CC BY 4.0 license, which permit the free download, distribution, and reuse, provided that the author and preprint are cited in any reuse.
Prerpints.org logo

Preprints.org is a free preprint server supported by MDPI in Basel, Switzerland.

Subscribe

Disclaimer

Terms of Use

Privacy Policy

Privacy Settings

© 2026 MDPI (Basel, Switzerland) unless otherwise stated