Preprint
Article

This version is not peer-reviewed.

Does Palm Oil Really Rule the Supermarket?—An Assessment of Three Western Supermarket Chains

A peer-reviewed article of this preprint also exists.

Submitted:

22 September 2025

Posted:

23 September 2025

You are already at the latest version

Abstract

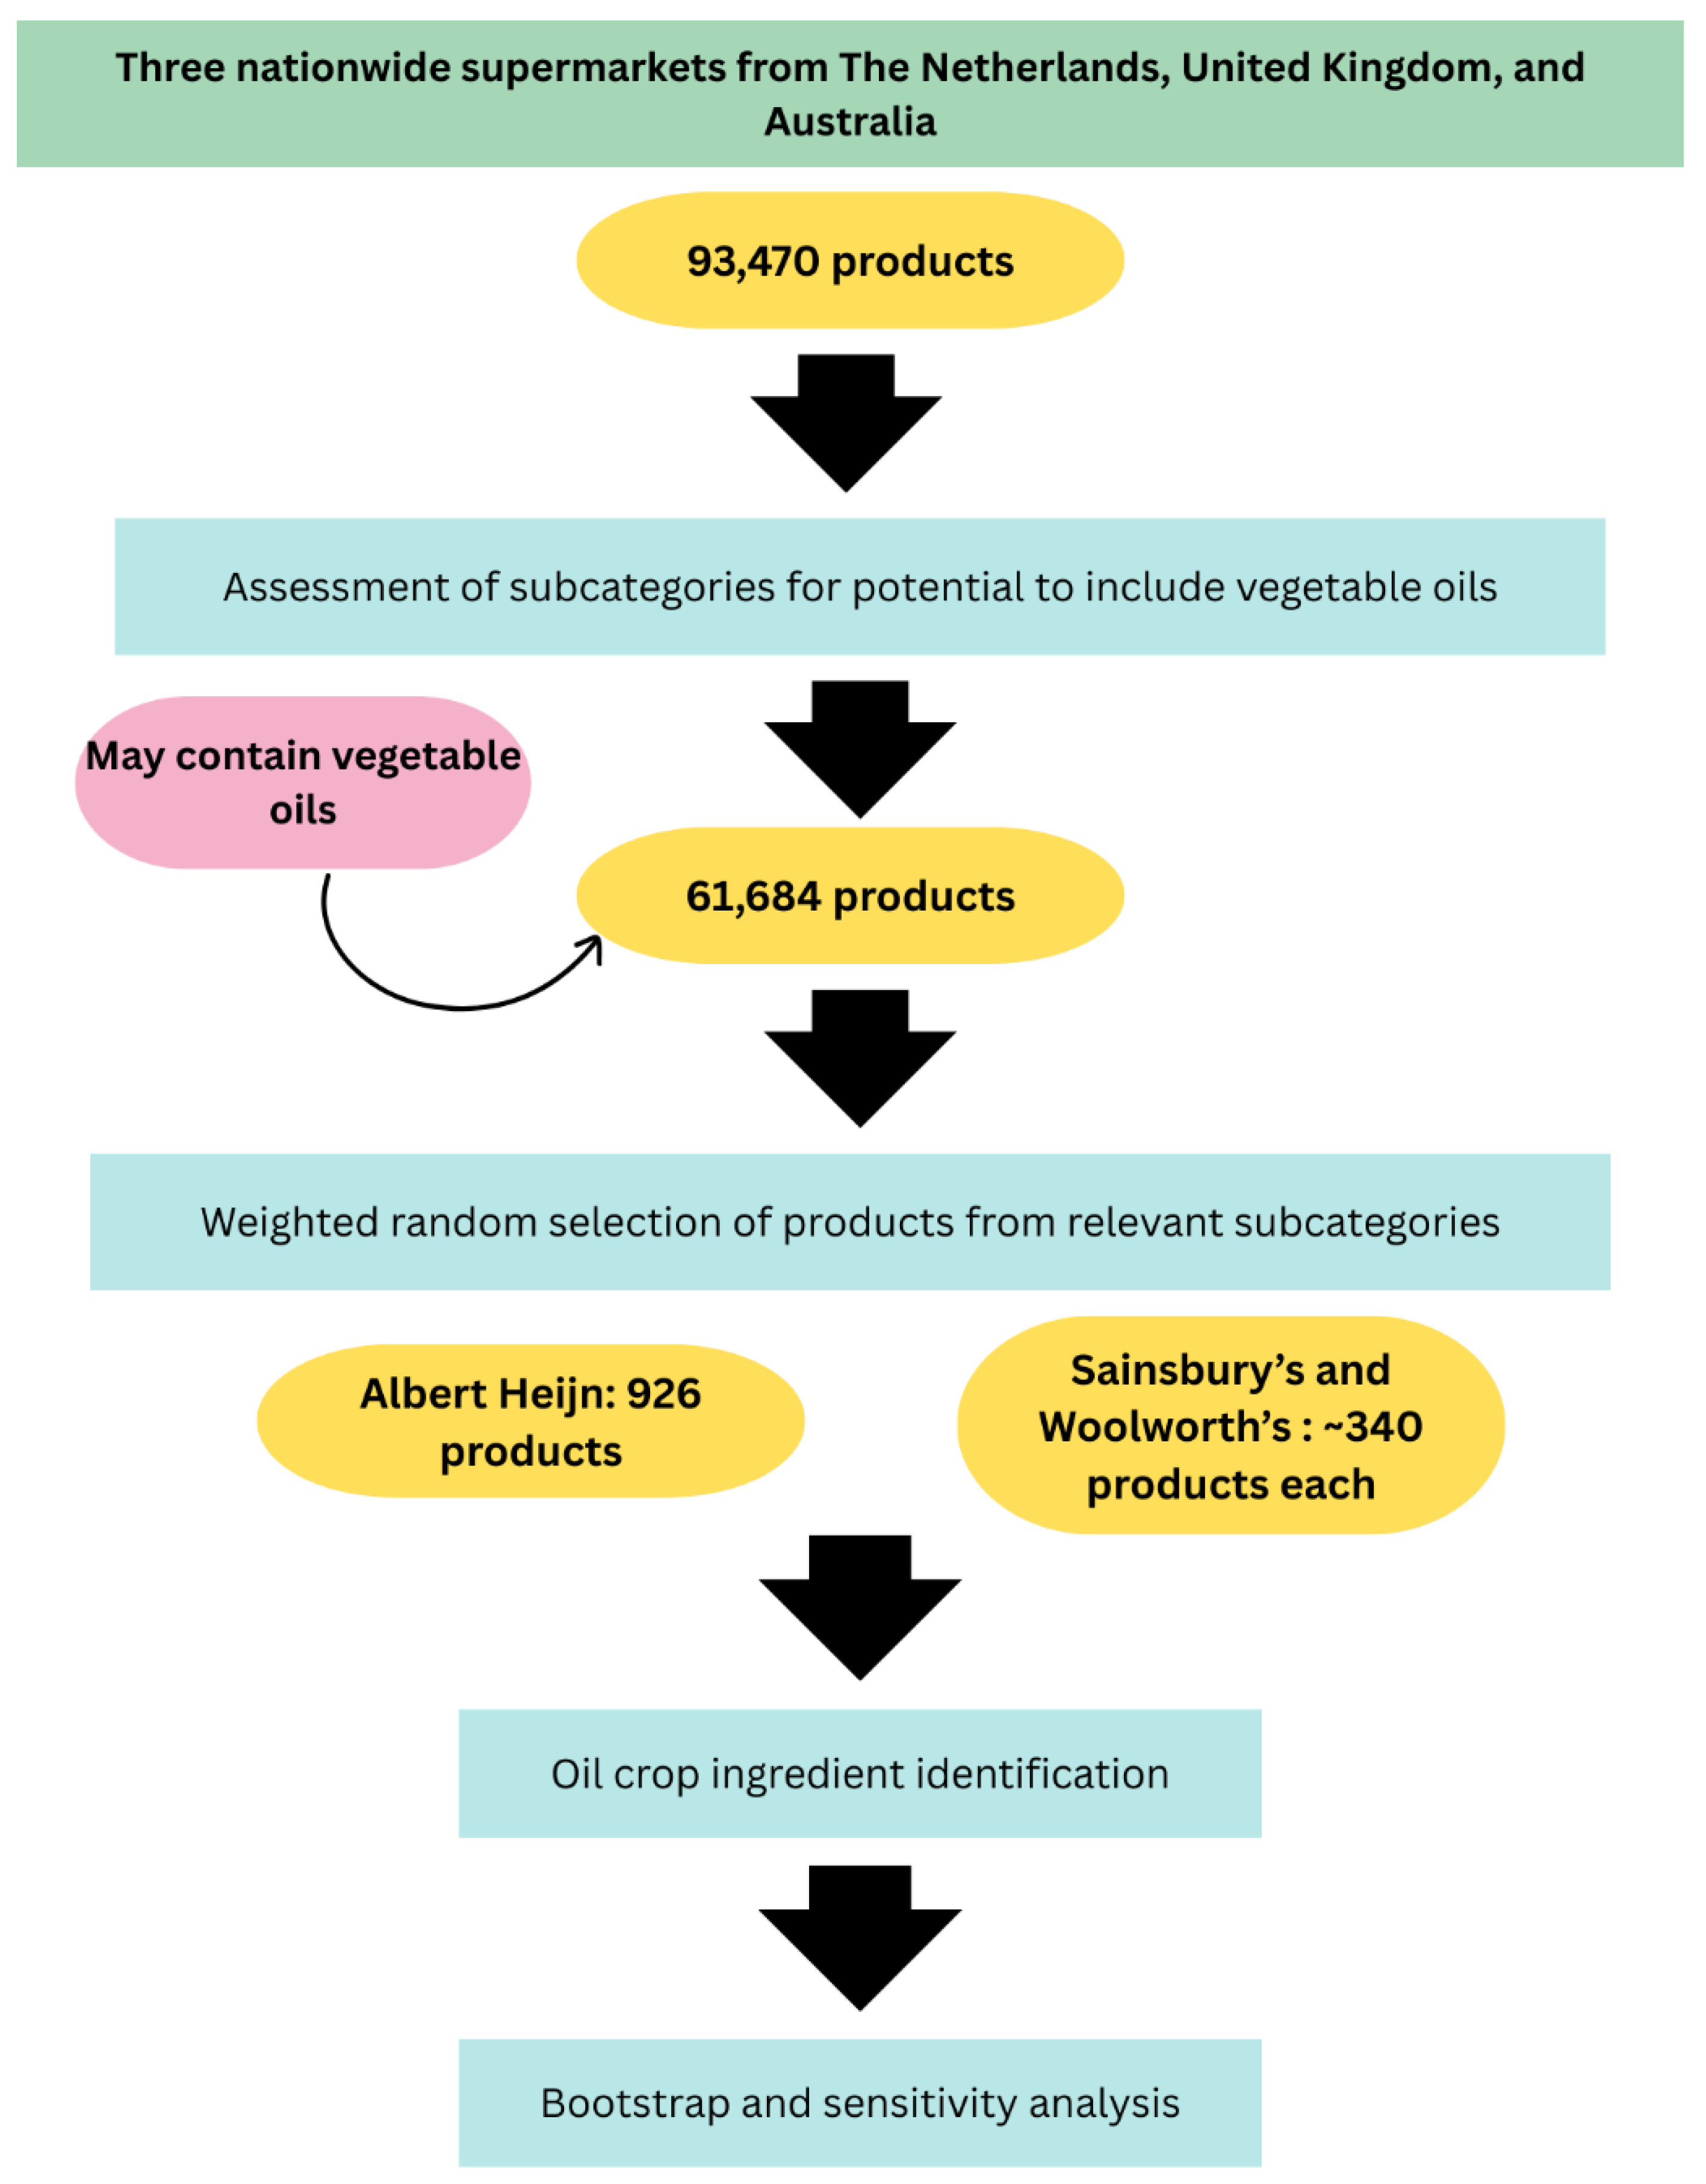
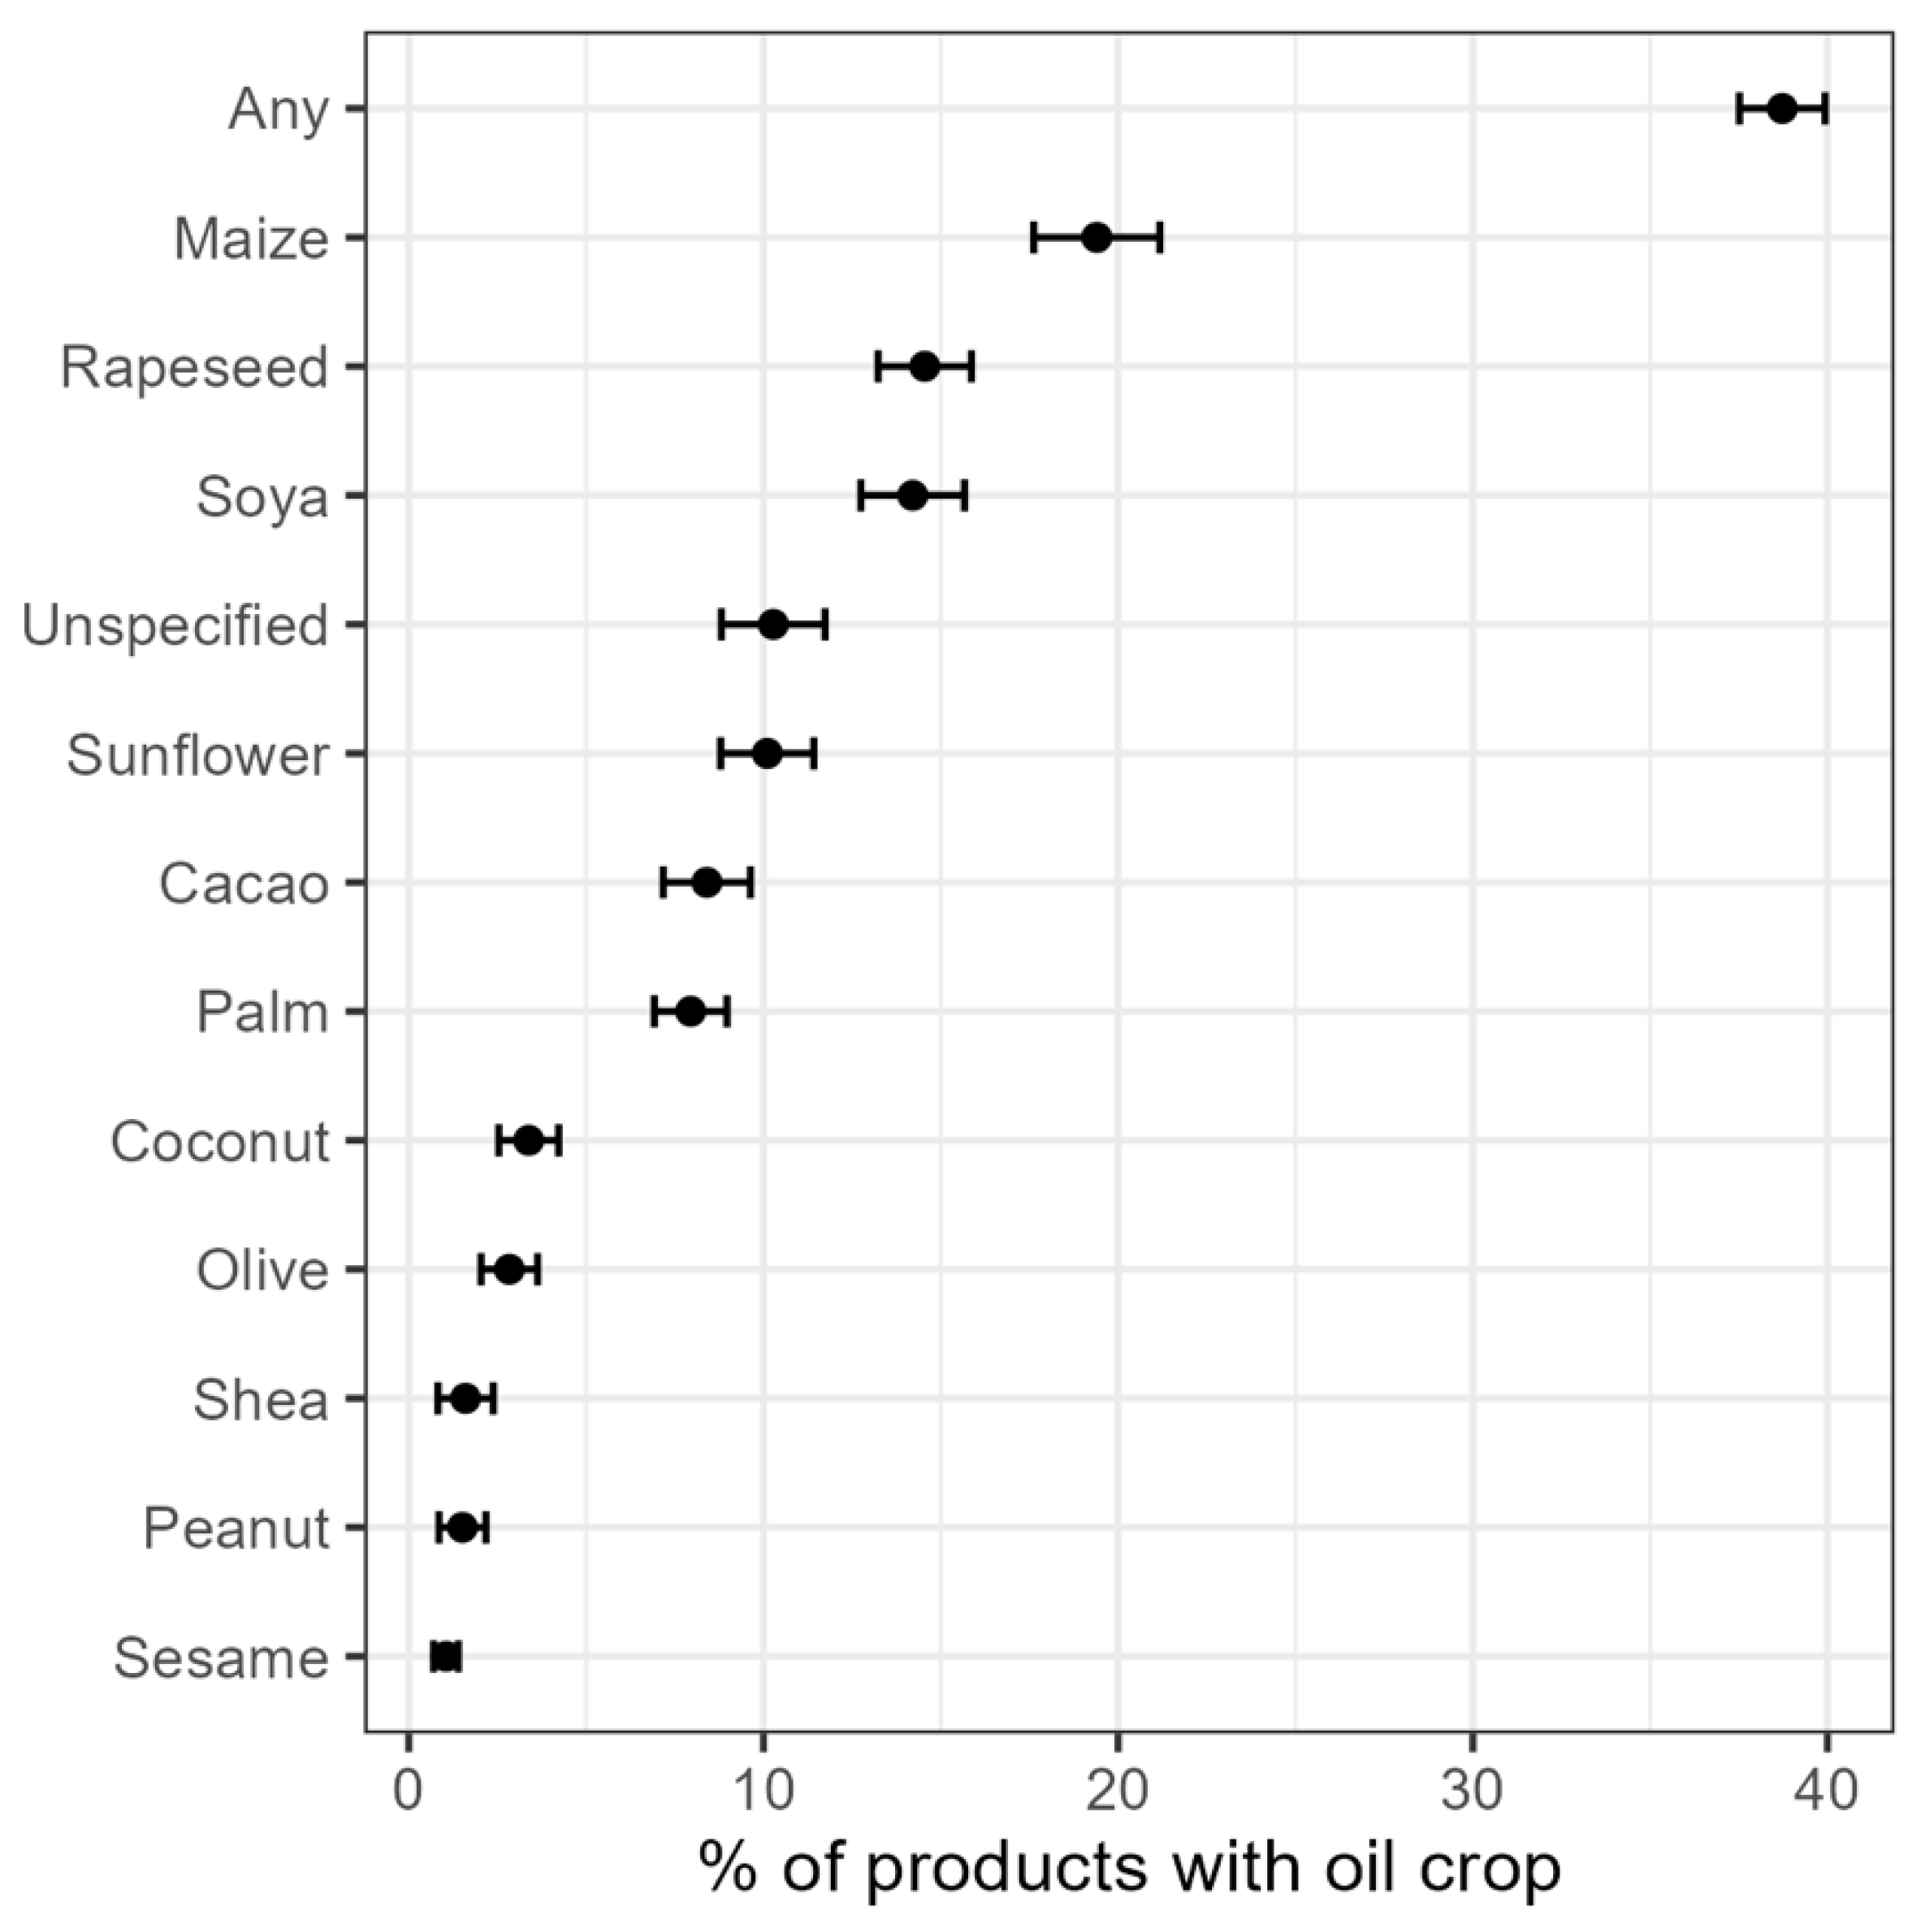
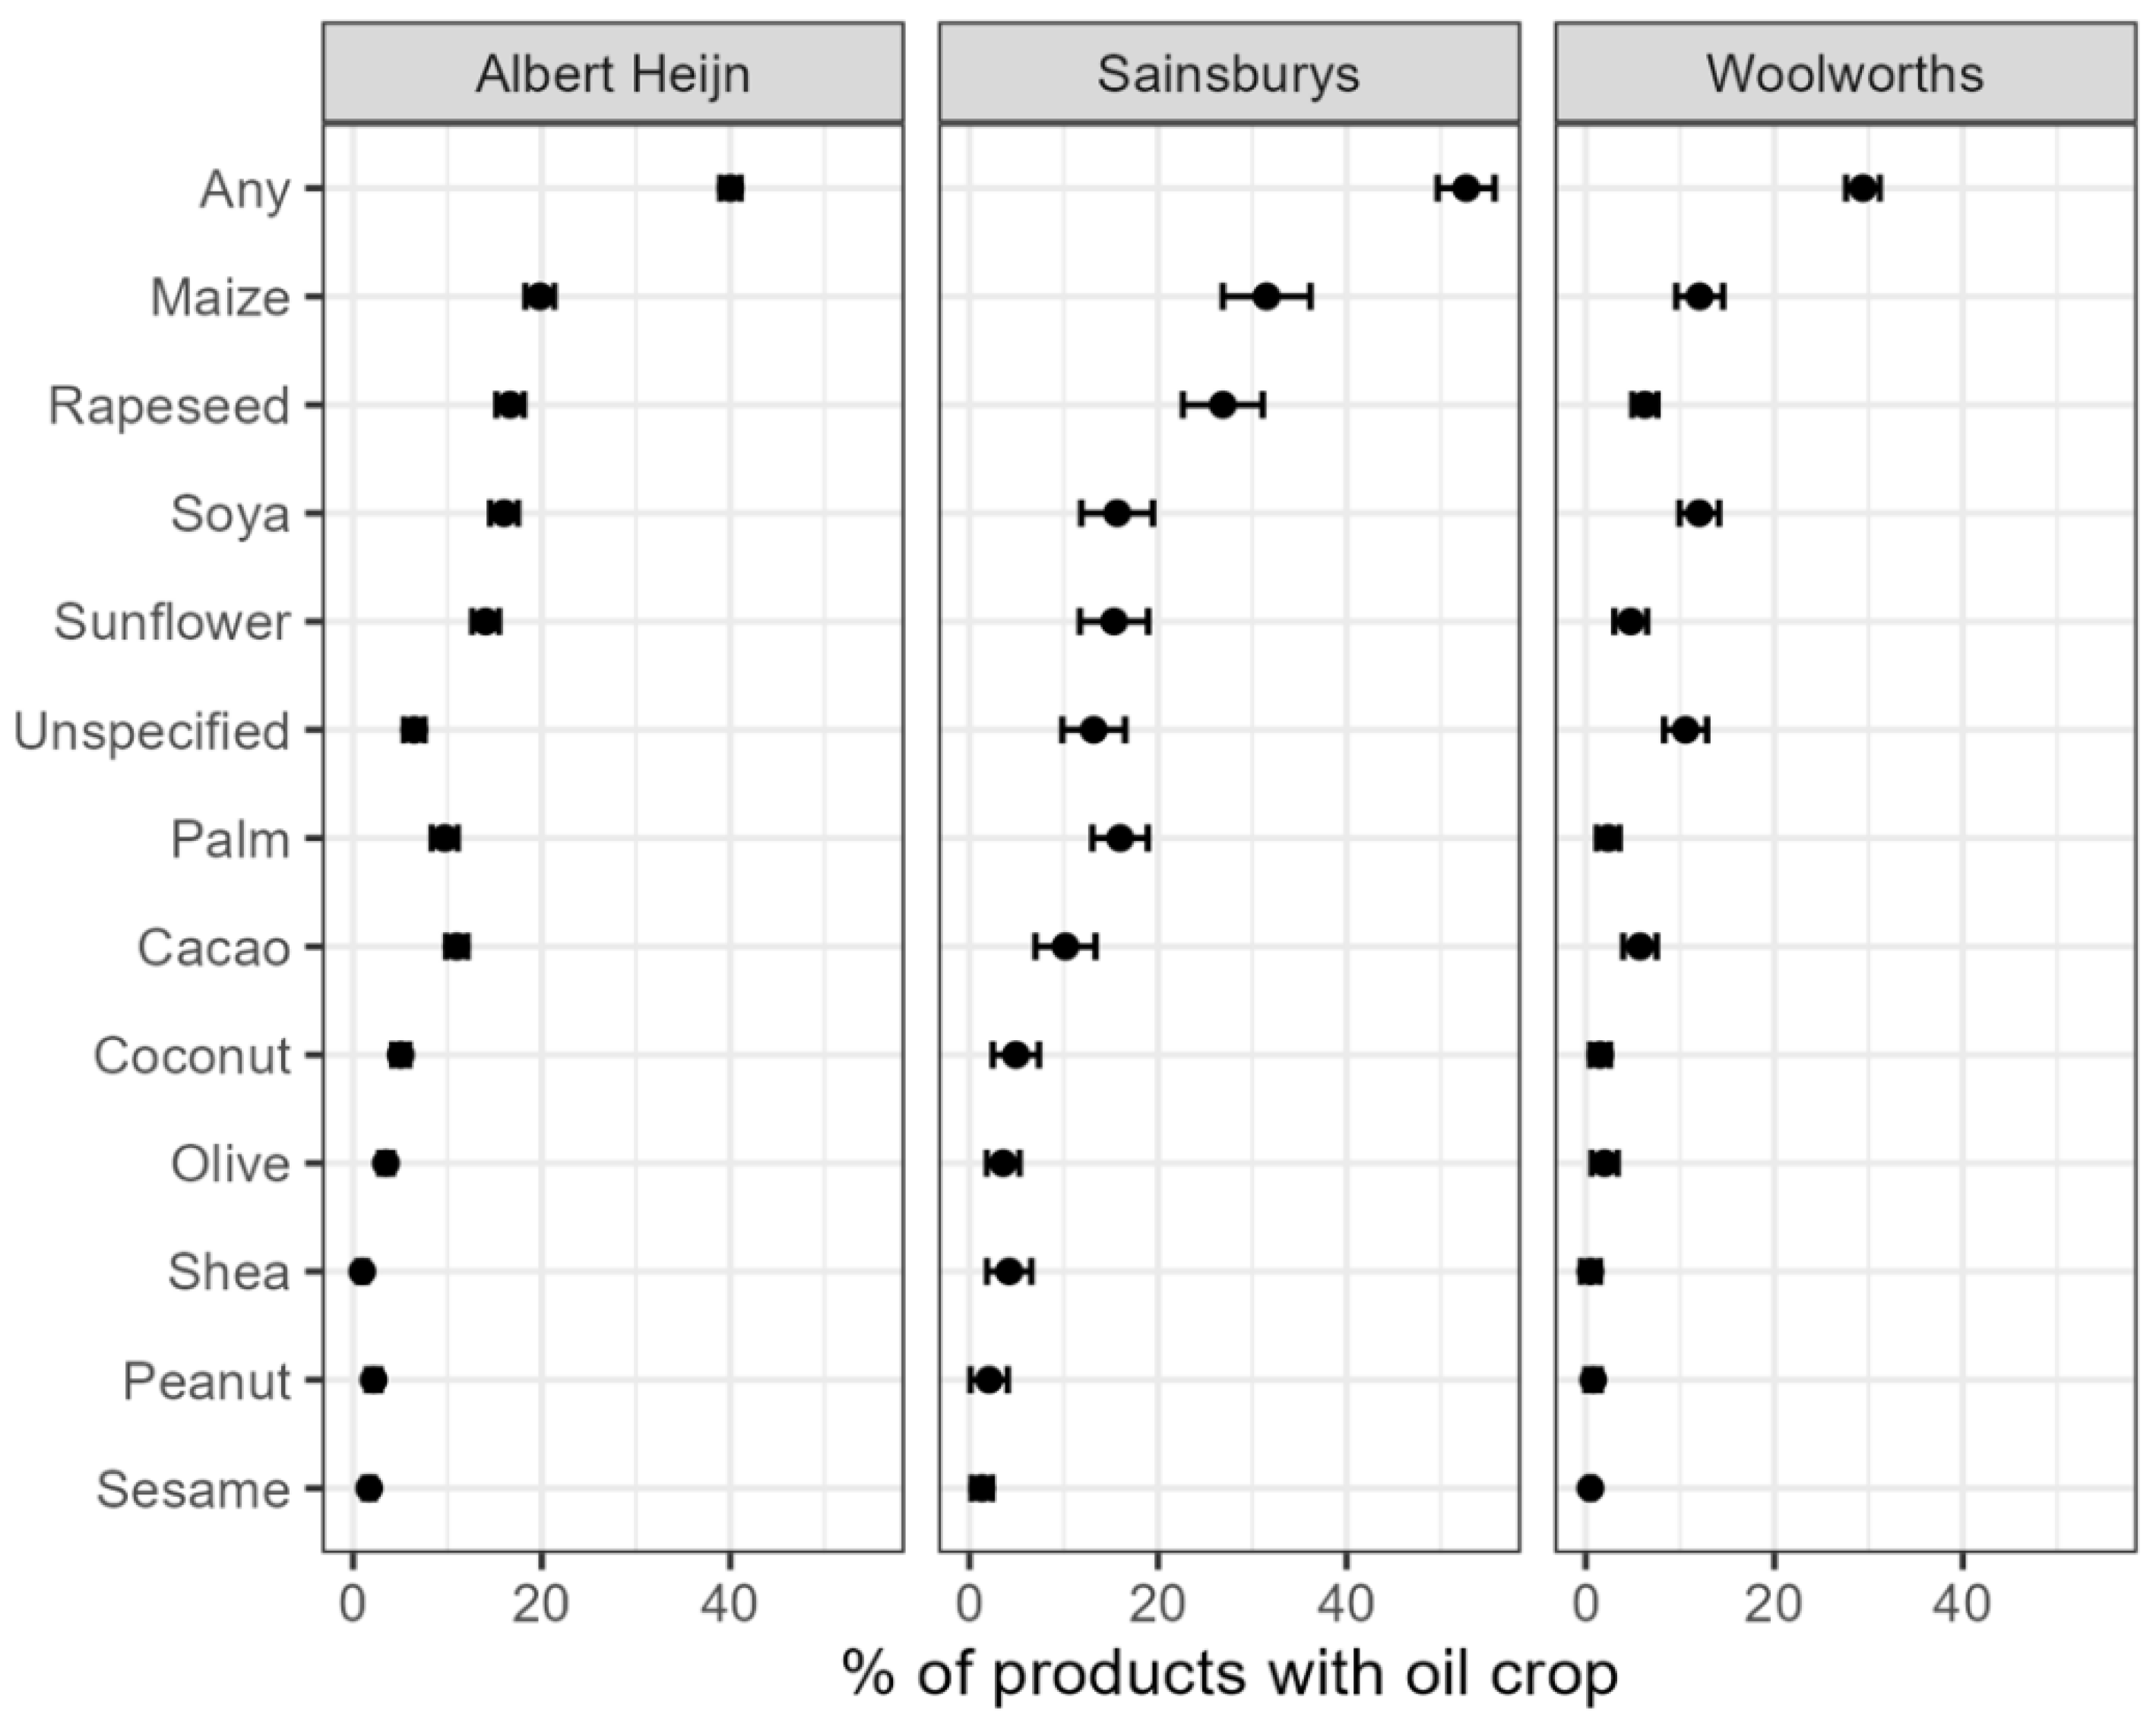
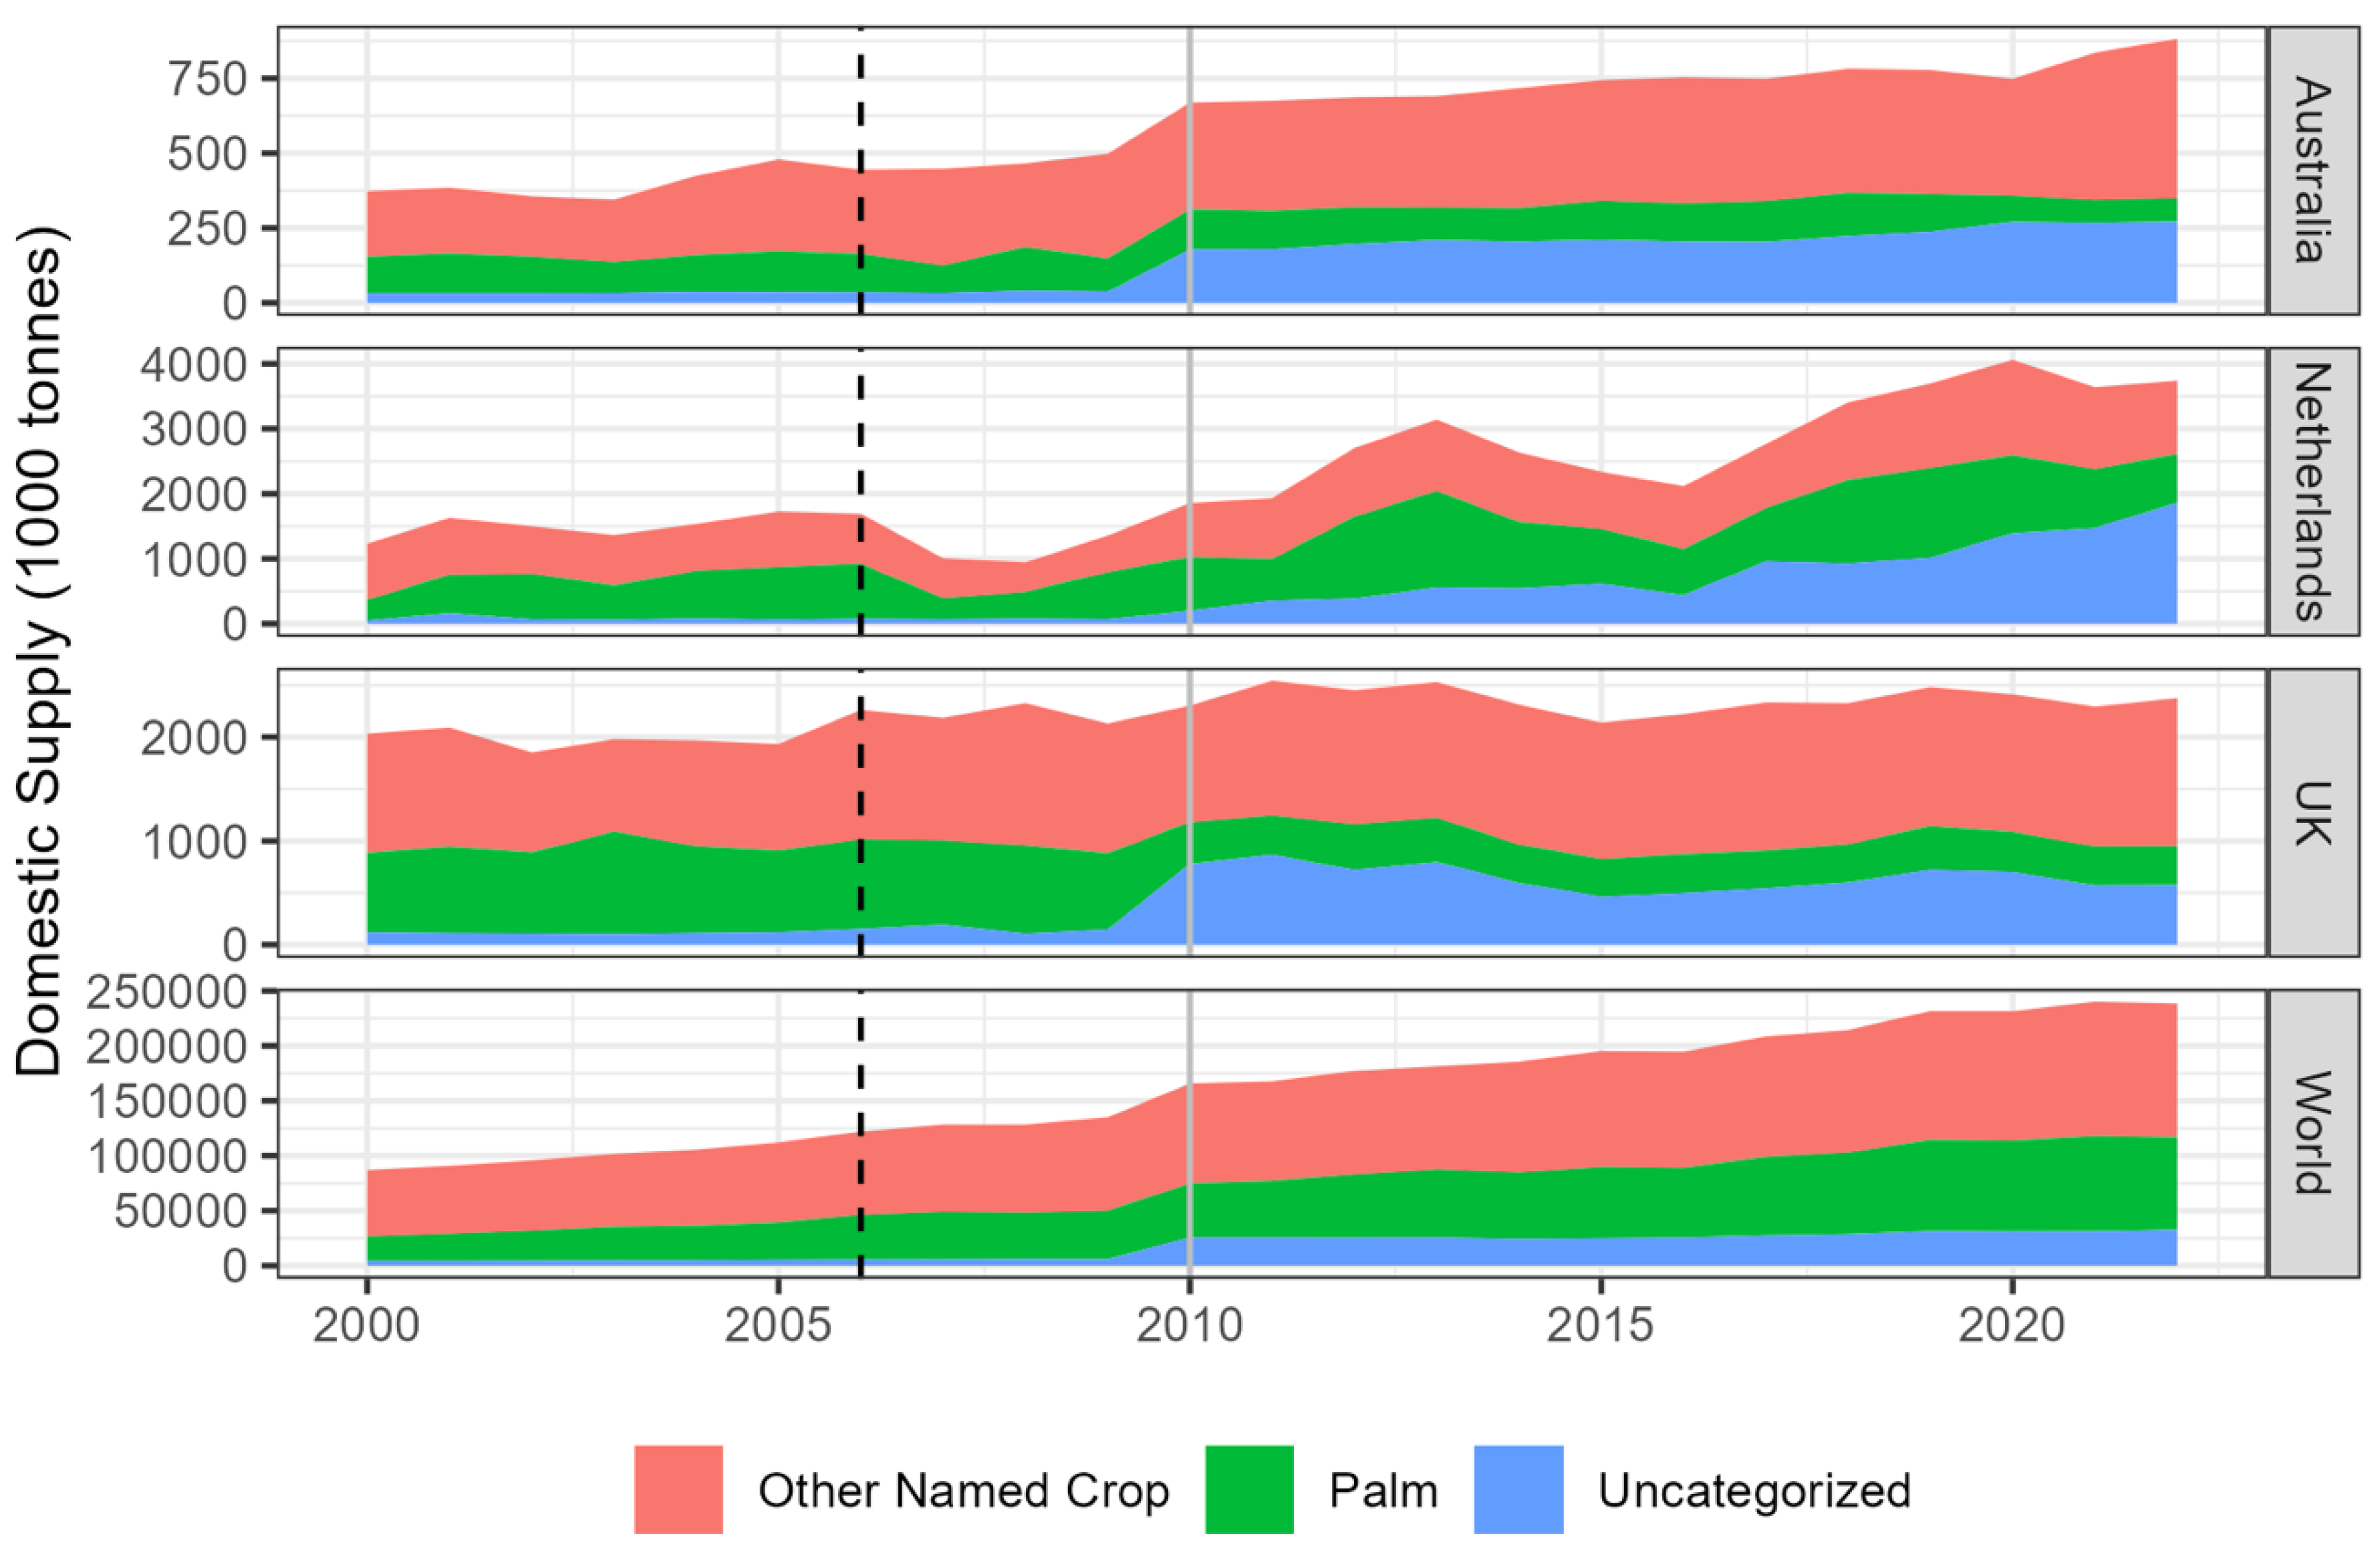
The claim that 50% of supermarket products contain palm oil is widely cited and repeated to underscore the relevance of activist campaigns and sustainability efforts in the oil palm sector. Yet evidence supporting this claim has never been publicly available. We investigated the accuracy of this claim at three large supermarket chains across three countries, where adequate online product and ingredient data were available. We compiled and analysed ingredient lists from approximately 1,600 food products from three supermarkets in the Netherlands, the United Kingdom, and Australia to evaluate the prevalence of palm and palm kernel oil, as well as other major vegetable oil crops. Across these supermarkets, palm and/or palm kernel oil were explicitly listed in 7.9% (95% CI [6.9%, 9.0%]) of products, whereas maize (19% [18%, 21%]), rapeseed (15% [13%, 16%]), and soya (14% [13%, 16%]) were more prevalent. Up to 40% (95% CI [37%, 43%]) of products at these supermarkets may contain palm oil through unspecified vegetable oils or oleochemicals, which were found in about 18% of all sampled products. This underscores a broader challenge: modern processed foods are part of complex global supply chains that rely on interchangeable commodities such as palm oil. While traceability mechanisms like those promoted by the EU Deforestation Regulation (EUDR) aim to enhance upstream accountability, consumer-facing labelling transparency remains inadequate. We emphasise the need for clearer food labelling and broader systems-level impact assessments if consumers are to make fully informed choices to align with their values and goals.

Keywords: 
;  ;  ;  ;  ;  ;  ;  ;  ;  

1. Introduction

In an era of growing ingredient awareness, consumers are demanding greater transparency about what goes into their food, not only for health reasons but also to align with their values [1]. Products like coffee, cocoa, and palm oil are no longer seen as just commodities, but as symbols of broader environmental and social issues [2]. Activist and industry groups have exploited this dynamic through branding and social media. By associating specific ingredients with issues such as deforestation, human rights abuses, or climate change, these groups often reinforce ethical and generalised environmental narratives that do not reflect the complexity and detail conveyed in scientific assessments [3,4,5,6,7,8]. When consumers perceive that everyday products contribute to harm, whether through carbon emissions, biodiversity loss, or exploitation, they are more likely to change their behaviour or support reform campaigns [9]. Palm oil, in particular, has become a target for public concern.
A widely cited and unverified claim that over 50% of supermarket products contain palm oil [10], is often used to present the pervasiveness of palm oil as a reason for urgent system reform. The statistic is cited both as an argument for sustainable sourcing by groups such as the Worldwide Fund for Nature (WWF) and the Roundtable on Sustainable Palm Oil (RSPO), and to support anti-palm oil campaigns, as seen in "contains no palm oil" labelling. Both sides benefit from citing a figure that demonstrates the pervasiveness of palm oil. This is further illustrated by a newer RSPO statistic that 70% of cosmetics contain palm-derived ingredients [11]. No published methodologies support either estimate.
Despite growing demand for transparency [12], the accuracy of such claims remain unclear. This raises questions not only about the role of palm oil in consumer products but also about how these narratives, whether simplified or outdated, can shape public perception, policy debates, and corporate commitments in ways that may not reflect the full complexity of the scientific evidence or supply chains. The persistence of these claims may stem from the fact that palm oil’s extensive integration into global supply chains lends them surface credibility. The planting and cultivation of oil palm has driven tropical deforestation, carbon emissions, and loss of biodiversity, especially in Southeast Asia [6]. Oil palm fruits are initially processed into crude palm oil and palm kernel oil. These intermediate products are then converted to diverse substances that are used for purposes ranging from cooking oils to biofuels to cosmetics to prescription drugs to plastics to animal feed, lending plausibility to the claim that half of all supermarket products contain palm and/or palm kernel oil.
The 50% claim, which likely originated from WWF in the mid-2000s, has been repeated often in a wide range of languages and media contexts (Table S1), and has shaped public perception and policy discussions for nearly two decades. The belief that increasing palm oil production and associated environmental harm is caused by the average consumer through everyday purchasing behaviour, underscored by the 50% claim, has fuelled non-governmental and consumer activism, leading to boycotts of palm oil-containing products and increased demand for palm oil-free alternatives [13]. The 50% claim has specifically been used by civil society organizations to emphasize the global significance of palm oil, particularly in regions far from its production [10], as a means to encourage policymakers to address sustainability challenges in their supply chains [7]. These campaigns were largely successful in driving action, as shown in Norway where claims that 62% of food products contained palm oil prompted reformulation, reduced imports, and financial divestment [14,15]. Companies that handle oil palm products in their supply chains have responded by engaging in more sustainable sourcing (e.g., by purchasing only sustainably-certified palm oil [16]) or removing palm oil from products altogether [17]. Governments and international bodies have introduced stricter palm oil labelling laws [18], as well as traceability regulations [19] focused on palm oil and other deforestation-risk commodities (e.g., the EU Deforestation Regulation). In the Global North, restrictions on palm oil have been accompanied by greater reliance on other oils (e.g., soya, rapeseed, coconut), which, like palm oil, also have major negative environmental impacts [6,7,20]. Understanding the ubiquity of WWF’s 50% claim and the potential influence it may have had on consumers and industry actors, we wanted to determine its validity.
Consumers, especially those in Europe, have very negative views of palm oil. A recent survey by Meijaard et al. [7] of 694 people across five continents found that 69% of European respondents actively avoid palm oil when given a choice. Similarly, a 2022 survey by Kantar (unpublished data, see [7]) found that among 1,000 respondents in 18 countries, more than half had heard of palm oil, with the majority holding negative views. Specifically, 22% (± 7.1) (mean across countries ± standard deviation) had heard about palm oil’s environmental impact, with 82% (± 14.8) worrying about it, while of the 22% (± 7.9) of the total respondents who heard about palm oil’s health impacts, 69% (± 16.3) were worried about these. Fewer people (13.8%, ± 4.5) had heard about palm oil’s negative social impacts, but of those who had, 82% (± 10.5) were concerned about them. These negative perceptions shape consumer behaviour. A meta-analysis of studies on palm oil in products concluded that concerns about environmental and health impacts discourage consumers from purchasing products containing palm oil.
Despite its reputation, palm oil is not uniquely problematic compared to other major vegetable oils [7]. For instance, the expansion of soya in South America, including for the production of soybean oil, is another leading driver of tropical deforestation [7,21]. Coconut palm expansion has recently been identified as driving substantial forest loss [22]. Other major oilseeds like rapeseed and sunflower are grown largely in temperate regions, and come with their own set of environmental concerns, such as heavy fertilizer and pesticide use [20]. Yet, we are aware of no statistics or campaigns based on the percentage of products on supermarket shelves that contain other vegetable oils, including soya, maize, cacao, and coconut, which, like palm, are strongly linked to tropical deforestation and biodiversity declines [23,24,25,26]. While the relative production and consumption of different vegetable oil crops at a country level is relatively well known, and the degree to which products contain soybeans has been investigated because of allergies to this legume [27], to our knowledge, the distribution of these oil crops across consumer products has not been consistently measured across regions.
Because policies and consumer behaviours are related to claims about the relative importance of different oils in consumption, there is a great need for accurate and consistent understanding of the pervasiveness of diverse vegetable oils in consumer products [7]. To address this knowledge gap, we assess the prevalence of palm oil, palm kernel oil, and other major vegetable oils as listed in supermarket products in three large Western supermarket chains where sufficient data are available. We compare this with the often-quoted previous estimate that 50% of products contain palm oil.
We analyse products from three supermarkets in the Netherlands, UK, and Australia, that publish suitable ingredient information online. Specifically, we consider the following questions: 1) What percentage of products available from these supermarkets currently contain oil palm and other major vegetable oil crops? 2) How do these percentages vary among countries? 3) Which crops dominate particular product categories? and 4) What are the limitations to such assessments with public data? In making these assessments, we identify limitations due to available information and identify uncertainties and assumptions. We acknowledge that the scope is restricted to high-income Western markets, which may differ from patterns in other regions.

2. Experimental Procedures

2.1. Claim Tracing

We researched claims about the occurrence of palm oil in supermarket products. To do so, we searched the internet for such claims and recorded them in a table (see supplementary material, Table S1). We stopped our search when we turned up no substantially new claims. We also contacted individuals knowledgeable about the history of the 50% claim, and discussed its origins with them.

2.2. Supermarket Selection

We sampled products from three nationwide supermarket chains that comprehensively listed products and their ingredients online between 6 September 2024 and 10 January 2025. We selected supermarkets that provided their full product ranges online, including complete ingredient lists in languages spoken by the authors, to avoid potential misclassifications from automatic translation services. Importantly, these supermarkets were not chosen because they reflect global or even national product composition. Rather, they served as large case study databases, enabling us to analyse observable trends in vegetable oil use within their offerings. We acknowledge the limitation this presents to the generalisability of our findings, as well as for future research, particularly in terms of data collection and the ability to conduct similar assessments in regions with less accessible labelling information. Our conclusions therefore apply only to these supermarkets and are intended to guide future research, not to generalize broader consumption patterns.
The main sample was collected from Albert Heijn, the largest supermarket chain in the Netherlands, and representative of a national, Western European supermarket. A total of 926 products were randomly sampled from Albert Heijn. Initially, three additional supermarkets were selected for comparison: Sainsbury’s (United Kingdom), Woolworths (Australia), and Walmart (United States). We later excluded Walmart due to a lack of information on ingredients in cosmetics and toiletries and incomplete product listings. At Sainsbury’s and Woolworths, we sampled 340 and 338 products, respectively. By 2025, none of the sampled supermarkets made claims about reducing or limiting palm oil on their shelves, but all had committed to sourcing only Roundtable on Sustainable Palm Oil (RSPO) and/or International Sustainability and Carbon Certification (ISCC)-certified products [28,29,30]. We were unable to find comparable data (i.e., online ingredient lists) for any supermarkets in other world regions (e.g., Asia and South America) and, therefore, could not include them in our sample.

2.3. Product Sampling Strategy

We used a stratified sampling strategy that relied on supermarket-defined categories and subcategories of products, for example, Dairy (category) and Milk, Cheese (subcategories). These categories are outlined in the supplementary materials (Table S2). Our sampling approach is similar to previous studies of ingredient lists in online supermarket databases, such as those conducted for 22,077 products from two Australian online supermarkets for identifying ingredients and allergens [31], or 32,719 products from four online UK supermarkets for identifying the presence of emulsifiers [32].
We first assessed each subcategory for the likelihood that it might contain vegetable oils. To do so, we randomly selected 10 products from that subcategory and reviewed the ingredients in these products. If at least one product contained oleochemicals or vegetable oils, we included the subcategory in our sample. We recorded the total number of products for subcategories without vegetable oils or oleochemicals, but did not sample them. We did not sample categories containing items such as clothing, homeware, and appliances, as no items in these categories contained ingredient information, despite the possibility that they might include oil derivatives and oleochemicals in, for example, plastic components. For vegetable oil/oleochemical-containing subcategories, we recorded the total number of products and proceeded with sampling as described below. From the population of 93,470 products across three supermarkets, 31,786 were in subcategories that did not contain vegetable oils or oleochemicals (Figure 1). We classified subcategories into classes consisting of Food & Drink, Cosmetics & Toiletries, Health, and Other to evaluate the diversity of oil content across different classes of products.
In some cases, subcategories were repeated in more than one category (e.g. “Butter” as a subcategory falling under both the “Dairy, Eggs and Butter” and “Breakfast and Spreads” categories). In these events, we cross-checked that the categories were exact repeats and, if so, excluded the repeated category.
At each supermarket, we sampled all vegetable oil-containing subcategories. The total sample size was 926 products at Albert Heijn and ~340 products at each of the other two supermarkets. We first divided these totals equally across all oil-containing categories (e.g., if Sainsbury’s had 10 categories, each was assigned 34 products). Within each category, the sample was then distributed proportionally across the oil-containing subcategories, based on the number of products in each. From these subcategories, products were randomly selected using a random number generator. We counted products horizontally from left to right across rows on the supermarket website, with the first product designated as number 1. No sorting methods (e.g., by price) were applied before selection. Because some products appeared in multiple subcategories, a small number were repeated in the sample. A complete list of sampled products is provided in Resource Availability.

2.4. Ingredient Data

For each sampled product, we recorded the product name and ingredient list from the website in a spreadsheet. Next, we examined the ingredient list and noted which oil-producing crops were present in the list. Specifically, we noted when a product contained: oil palm, sunflower, soya, rapeseed, coconut, groundnut (peanut), olive, maize, sesame, shea, or cacao. These are the 11 main oil-producing crops by production volume, excluding those such as castor oil, which are rarely used in supermarket products [7]. For instance, when an ingredient list included palm oil and/or palm kernel oil, we labelled the product as containing oil palm. One category of emulsifiers, mono- and diglycerides of fatty acids, is common in food products, but it can be produced from different oil crops. Products with these emulsifiers were labelled with the “unspecified oils” category. We did not assess the nutrition of products, which could provide more insight into the specific vegetable oil present in instances of uncertainty. We we did not extrapolate information, such as the presence or absence of plastic in packaging, or make any other assumptions about composition if not explicitly stated in the ingredient lists.
Many health and beauty products use oleochemicals derived from vegetable oils, without noting the crop used to produce the oleochemical. Through chemical processing, these oleochemicals can be derived from a wide range of oils [33]. While oils are to a considerable extent interchangeable [34], certain oils are most often used for certain oleochemicals. Examples (Table S3) include ammonium lauryl sulphate (commonly made from oil palm or coconut oil), arachidyl glucoside (made from peanut oil), behentrimonium chloride (often made from rapeseed), hydroxystearic acid (generally sourced from coconut or oil palm), and lecithin (often made from soya, rapeseed or sunflower). We first noted each product that contained such oleochemicals. Then we looked up the individual oleochemicals online and determined how each was generally produced (see Table S3). This included ingredients or E numbers (European coding system for substances used as food additives) likely sourced from vegetable oil crops like “vegetable oils” (which can be sourced from any oil), or “E442” (i.e., ammonium phosphatides, generally sourced from rapeseed). For oleochemicals that are generally derived from more than one oil crop, we labelled the product with all of these oil crops (e.g., ammonium laurel sulphate can be derived from coconut, oil palm, or both, so we labelled this oleochemical with both coconut and oil palm). If the oil source was unknown based on our online search, we reported the oleochemical as “unspecified oils” to prevent undercounting of specific oils.

2.5. Statistical Analysis

Our main analysis estimated the relative proportion of supermarket products containing each type of oil crop, excluding products with oleochemicals because of their uncertainty. First, we applied a bootstrap analysis in R [35] to sampled subcategories. In our design, specified with the Survey package [36], we used the sampled supermarket-subcategory groups as strata, and the total number of products in each subcategory to correct for finite populations. We converted this to a bootstrap replicate design using the svrep package [37], with 1000 replicates, using the “Rao-Wu-Yue-Beaumont” bootstrap method and other default settings. Then, we computed the mean and 95% confidence interval (CI) of the proportion of products in sampled subcategories that contained each oil or any oil for various groupings (i.e., across all markets; by market; by market and class). To correct for categories and subcategories that contained no oils and were excluded from the sample, we calculated weighted means for these groupings. Weights were the proportion of sampled and unsampled products in each grouping, and values associated with weights were the mean or confidence intervals (sampled products) or zero (unsampled products containing no oils).
2.6 Sensitivity Analysis
We conducted two sensitivity analyses using modified datasets in the bootstrapping approach described above. First, we included products with oleochemicals, including the likely oil crop source(s) for these oleochemicals, as well as any other crops specified in the product’s ingredient list. Increasing the total number of products considered in the analysis sometimes reduced the estimated prevalence of certain oils (e.g., maize) in supermarket product populations. Second, as a bookend scenario to understand the maximum possible prevalence of oil palm in products, we assumed that all “unspecified oils” were derived from palm oil, as this is the cheapest oil in the market [7].

3. Results

Our analysis of the three supermarkets assessed 1,604 products from a total of 93,470 (Table S2). If we exclude the 288 sampled products with any oleochemicals from the analysis, about 39% (95% Confidence Interval [CI] [38%, 40%]) of all products at three supermarkets contained oil crop derivatives. We found substantial variation in vegetable oil crops used across products and supermarkets. Maize was found in 19% (95% CI [18%, 21%]) of supermarket products followed by rapeseed (15%, [ 13%, 16%]), soya (14% [ 13%, 16%]), unspecified vegetable oil (10%, [8.8%, 12%]), sunflower (10% [ 8.8%, 11%]), and cacao (8.4% [ 7.2%, 10%]). Palm oil was seventh and occurred in 7.9% (95% CI [6.9%, 9.0%]) of all supermarket products without oleochemicals (Figure 2).
There were differences between the three supermarkets, with the presence of oil palm relatively high at Sainsbury’s (16%, 95% CI [13%, 19%]) and low at Woolworths (2.4%, 95% CI [1.2%, 3.6%]), but still, maize remained the most frequently used named oil crop across all supermarkets (Figure 3).
In addition to named oil crops, we identified 111 unique chemicals with likely vegetable oil origins in product lists (Table S3). About 65% of these oleochemicals are commonly produced from palm oil and 64% from coconut, with sunflower, soya, rapeseed, wheat, peanut, and olive presumably being used more rarely (Table S3). The potential dominance of oil palm and coconut in cosmetics, toiletries, and health products is clear (Figure S2). When these products were included, the overall occurrence of vegetable oil crops increased to 58% (95% CI [55%, 60%]) of all products across all markets. The prevalence of oil palm and coconut increased to 33% (95% CI [30%, 37%]) and 30% [27%, 33%], of all products, respectively (Figure S1). If, in the most extreme case, we also assumed that all “unspecified oils” were derived from oil palm, we found that 40% (95% CI [37%, 43%]) of all supermarket products contained oil palm. Yet, this maximum was exceeded by maize (46%, 95% CI [43%, 49%]) rapeseed (44%, [41%, 47%]), soya (43%, [40%, 46%]), and sunflower (43%, [40%, 46%]) if unspecified oils are attributed to these crops.
When we traced the claim that approximately half of supermarket products include palm oil through time, we found variability and a lack of methodological clarity or transparency. Table S1 includes the claims detected in our research. For the year 2004, we found a statement that 10% of all supermarket products contain palm oil derivatives. Two years later, in 2006, this claim was revised to 50%, reportedly by WWF’s global palm oil team. Other organizations, such as Greenpeace, repeated these claims. Over the years, the claim has been repeatedly cited with variations (Table S1 shows 65 variations), with statements referring to “consumer goods,” “packaged goods,” “all products on store shelves,” or “daily products.” Some sources suggest the estimate applies globally, while others restrict it to supermarkets in Australia, Norway, the United States, or the United Kingdom. The percentage itself has also varied, with claims such as “50% of all packaged supermarket products,” “50-75% of household products,” or “up to 50 to 68% of supermarket products”.
Personal correspondence with those familiar with the history of the claim suggests that it may have been more of an estimate than a data-driven conclusion (C. Barton, in litt.; D. Webber, in litt.; F. Ardiansyah, pers. comm.). The WWF estimate was updated in 2017 by the Singapore Alliance for Sustainable Palm Oil (SASPO) and WWF Singapore [38] to “more than half of packaged supermarket products,” but only in reference to Singapore supermarkets. The SASPO/WWF report did not explain methods, and when we requested more details, no one responded. The persistence of these unverified statistics highlights the broader issue of information surrounding various crops and commodities, in this case, oil palm and palm oil, potentially influencing both consumer behaviour and corporate decision-making despite the absence of clear supporting evidence.

4. Discussion

Our study suggests that, across these three major Western supermarkets, palm oil was present in up to 40% of products when oleochemicals and oils of uncertain provenance were included. For the three supermarkets we have sampled, in 2024, we can conclude that palm oil, palm kernel oil and their derivatives are not present in 50% of listed products, packaged products, foodstuffs, or packaged foodstuffs on offer online. Indeed, within food products, palm prevalence was on par with that of cacao. Thus, we suspect the “50% claim” is an outdated statistic, has always been wrong, applies to other world regions or supermarket chains, or was always impossible to verify because of the uncertainties around the crop origin of oleochemical and “unspecified oils”. From Table S1, we note that we are dealing not with one well-defined claim, but rather with a plethora of similar-sounding claims differing in categories mentioned and where they apply. We lack a clear definition for some concepts used in these claims, such as “household products” and “daily products”. If these concepts are equivalent to what we categorized as cosmetics and toiletries, palm oil could be present in >50% of these categories if oleochemicals are derived mainly from oil palm—an extreme assumption (Figure S2).
It remains unclear whether oil palm use in supermarket products has genuinely declined since 2006 due to reformulation or whether the original statistic was simply inaccurate or without a credible scientific basis. At the national level where our sampled supermarkets were located, domestic vegetable oil use data from the Food and Agriculture Organization indicate a relative decline in palm oil consumption. Between 2006 and 2022 (the most recent year for which data are available), palm and palm kernel oil’s share of the domestic supply of vegetable oils included in this study dropped from 29% to 9% in Australia, from 38% to 16% in the UK, and from 50% to 20% in the Netherlands (Figure 4). While changes in data collection starting in 2010 may influence the UK data, the declines in Australia and the Netherlands largely occurred after 2010, when tracking methods remained consistent. During the same period, at a global level, palm oil’s share of vegetable oil supply increased from 33% to 35% (Figure 4), potentially indicating a displacement of palm oil from the Global North to the Global South.
Norway provides an instructive example of how transparency both complicates and improves assessments of palm oil prevalence. In 2012, palm oil was estimated to be present in around 62% of packaged food products [14]. Following consumer campaigns and the 2014 labelling law requiring palm oil to be explicitly named, palm oil usage reportedly fell by more than 70% by volume as major producers reformulated products [41]. Yet, recent data from the Norwegian Food Safety Authority indicate that 1,556 of 2,137 packaged foods (72.8%) still list palm oil as an ingredient [42]. This apparent increase likely reflects changes in product scope and improved labelling transparency rather than renewed growth in usage. Importantly, Norway’s Environmental Information Act enables citizens and NGOs to request detailed ingredient information directly from companies, while national barcode-based food databases provide searchable ingredient data for packaged goods [41,42]. This combination of legal and technical infrastructure illustrates how improved transparency can paradoxically make palm oil appear more common, even as actual usage declines or stays stable.
The Netherlands, UK, and Australia supermarkets that we studied currently rely heavily on rapeseed, sunflower, maize, and soya (Figure 1). Global production of these oils has indeed increased between 2006 and 2022, by 48%, 76%, 34% and 66%, respectively, although none as much as palm oil (100%) and palm kernel oil (86%) [43]. These global changes in vegetable oil production have consequences for land use. An estimated 37% of agricultural land is globally allocated to crops that can produce oil (including maize and soya, which are mostly used for animal feed) [7]. The production of palm oil requires 3.7 to 4.8 times less land than other oil crops because of the oil palm’s high yields [6].
If there has been a shift away from palm oil in supermarket products in Europe and Australia, this could be interpreted as a victory for anti–palm oil campaigns [41]. With palm oil production increasing globally, and relative consumption shifting increasingly to countries such as India, Indonesia, Pakistan, China and Malaysia, it is unlikely that any substitution of palm oil for other vegetable oils in the Global North has resulted in net environmental and social benefits [6]. Thus, rather than achieving a meaningful reduction in environmental and social harm, any shift away from palm oil in Europe and Australia may ultimately be a Pyrrhic victory for anti–palm oil campaigners, as it redirects rather than resolves the underlying issues associated with oil palm expansion and production.
It may also be that the supermarkets we studied are exceptional in terms of the choices they make about vegetable oils, leading them to sell fewer products with palm oil than the average supermarket. While all three studied supermarkets have oil palm policies with goals for sustainability of their own brand products, none has a policy or goal of removing oil palm-derived ingredients from their market [28,29,30], such as has been attempted at other supermarkets [43]. Thus, we do not expect these supermarkets to be biased toward or against oil palm products. Moreover, each supermarket commands a significant market share in its respective country, ranging from 15% (Sainsbury’s) to 37-38% (Woolworths and Albert Heijn) in 2024 [44,45,46].
Navigating the complex landscape of food choices is no easy task for consumers, who find themselves caught between online (dis)information, science-based facts, and a desire to make sustainable choices [20]. The year 2025 marks a decade since the Rockefeller-Lancet Commission report brought the interdependence of human and environmental health to the forefront, and six years since the EAT-Lancet Report proposed the Planetary Health Diet—guidelines aimed at feeding a growing global population without further exceeding planetary boundaries [47]. Given the environmental and health implications of dietary choices [48,49,50], many consumers seeking to align their behaviour with such guidelines are interested in knowing which oils are in the products they consume. Yet, our results show that poor transparency in product labelling sometimes makes it difficult to verify which oil crops are present in supermarket goods.
Our findings suggest a lack of transparency regarding the origins of ingredients in supermarket products. First, only three supermarkets provided online ingredient data suitable for this study, and second, even for these three, the information was not always adequate to judge ingredient origins. For instance, we found that about 18% of our product sample contained ingredients with only oleochemical names, not the origins of these chemicals. Consumer-driven resources like Open Food Facts [51] offer some insights into the presence or absence of some vegetable oils and their derivatives in many products, but their accessibility and usage remain limited and confined by temporal and geographic restrictions. Furthermore, ingredient lists are self-reported by application users, which may pose issues of accuracy. In many cases, shoppers must physically examine product labels to determine their oil consumption. Even then, front labels—where claims like "contains no palm oil" or "made with shea butter" appear prominently—rarely provide the full picture, often requiring consumers to check the back label for more details. These back labels are infrequently consulted by consumers [52], and, as our study shows, do not provide consumers or even committed researchers like us with comprehensive information about the oil crops used in the product and the social and environmental impacts of their production, processing and trade, and how this aligns with consumers’ values. Purchasing groceries online creates an additional major barrier to transparency. The three supermarkets studied here stand out in consistently sharing ingredients for most products online.
Despite widespread concerns about palm oil, identifying its presence in products remains surprisingly difficult. In our study, “unidentified” vegetable oil was present in 10% of all products, and products only containing oleochemicals likely derived from vegetable oils comprised almost a fifth of our sample. Even the FAO statistics indicate a quickly growing portion of vegetable oil not attributed to any specific crop (Figure 3). This lack of transparency is linked to the concentration of power in agricultural supply chains, where just a handful of multinational corporations control production, processing, and trade [7]. These companies substitute oils based on market conditions, labelling them with terms such as “palm and/or soybean oil”. As a result, product labels obscure ingredient origins, and regulatory frameworks shaped by corporate lobbying reinforce this opacity. Moreover, the same crop can be produced under vastly different conditions, meaning that even crop-specific product labels mask the actual environmental and social impacts of production [7,20]. Absent labelling undertaken voluntarily by corporations (e.g., indicating third-party sustainable certification), consumers must apply heuristics (e.g., palm is bad, olive is good) that are unlikely to reflect the embodied qualities of the specific product they are consuming. Without structural reforms to increase transparency, consumer choice remains constrained, and sustainability efforts risk being undermined by the dominance of a few key players.
Like all studies, ours has important limitations. First, our analysis relies on supermarkets providing accurate and complete ingredient information — something we could not independently verify. Second, uncertainty remains regarding the presence of vegetable oil crops in non-food products, such as cosmetics and toiletries, where ingredient sourcing is often opaque. This stems from the variable and often undisclosed origin of oleochemicals, which can vary depending on the availability of interchangeable oils with similar properties [34]. This further complicates consumer efforts to make informed choices. There may also be various oil crop derivatives used in the production, processing and packaging that are not identified (for example, in the feed given to farmed salmon, or the use of oil palm-derived chemicals in plastic packaging). Third, ingredient lists sometimes mention only the presence of oil crops, but not which derivative was used. This could be oil, but it could also be glucose, protein, or another derivative. This meant we could not always discern vegetable oils from other ingredients derived from oil crops. Fourth, we also wondered if WWF’s 50% claim may not refer to all listed products but to 50% of the contents of an average shopping trolley or basket as selected and bought by an average consumer, or some such refined definition that would give more weight to more consumed items—we lack the information that would be required for such an assessment (though the supermarkets themselves likely know this).
Ultimately, consumers require clear, comprehensive, and transparent information to make informed dietary choices that align with sustainability goals, such as the Planetary Health Diet. However, outdated data, vague labelling, and polarized narratives obscure the reality of vegetable oil sourcing. While producers at the beginning of the supply chain are increasingly subject to strict traceability requirements under regulations like the European Deforestation Regulation (EUDR) [53], similar transparency is rarely demanded of supermarkets and consumer goods companies. This needs to change. Consumers should have access to detailed product attributes, such as the percentage of palm oil sourced from Indonesia, Malaysia, or smallholder farms, the origin of peanuts in peanut butter, or the proportion of soya from regions like Mato Grosso versus São Paulo. With advances in supply chain traceability, providing this information is now feasible and essential to help consumers make truly informed and sustainable choices.

Supplementary Materials

The following supporting information can be downloaded at the website of this paper posted on Preprints.org. Figures S1–S3 and Table S1-S4.

Author Contributions

Conceptualization: E.M.; Methodology: E.M.M., K.C., D.S., S.Z., E.M.; Formal Analysis: K.C.; Investigation; E.M.M., S.Z., E.M.; Data Curation: E.M.M., S.Z.; Writing – Original Draft: E.M.M., K.C., D.S., E.M.; Writing – Review & Editing: E.M.M., K.C., D.S., E.M.; Visualization: K.C.

Data Availability Statement

Lead contact. Emily Meijaard: emilymeijaard@borneofutures.org
Data and code availability. Supermarket sample data are available at https://doi.org/10.5281/zenodo.14886251, and code is available from Github (XX).

Acknowledgement

This report was developed with the financial support of Soremartec SA and Soremartec Italia, Ferrero Group, and its Sustainable Nutrition Scientific Board. The funders had no role in study design, data collection, and analysis, decision to publish, or preparation of the manuscript. We thank Miriam van Heist and Anders Haug Larsen for assisting with analysis of palm oil in Norwegian products.

Conflicts of Interests

E.M. is an independent member of the Sustainable Nutrition Scientific Board. E.M., D.S. and K.C. are members of the IUCN Oil Crops Task Force. D.S., E.M. and K.C. have facilitated student research on palm oil and soybean.

References

  1. Van Rijswijk, W.; Frewer, L.J. Consumer needs and requirements for food and ingredient traceability information. Int. J. Consum. Stud. 2011, 36, 282–290. [Google Scholar] [CrossRef]
  2. Schouten, G.; Padfield, R.; Kraamwinkel, D. Contested representations: A comparative analysis of palm oil sustainability in Malaysian and Dutch media. World Dev. Sustain. 2023, 3. [Google Scholar] [CrossRef]
  3. Candellone E, Aleta A, Ferraz de Arruda H, Meijaard E, Moreno Y 2024 Understanding the vegetable oil debate and its implications for sustainability through social media. Comms. Earth Env. 5 391. [CrossRef]
  4. Gassler, B.; Spiller, A. Is it all in the MIX? Consumer preferences for segregated and mass balance certified sustainable palm oil. J. Clean. Prod. 2018, 195, 21–31. [Google Scholar] [CrossRef]
  5. LaPorte, P.S.; Meijaard, E.; Carlson, K.M. The impact of reading a synthesis report on perceptions of palm oil in the global conservation community. PLOS Sustain. Transform. 2025, 4, e0000183. [Google Scholar] [CrossRef]
  6. Meijaard, E.; Brooks, T.M.; Carlson, K.M.; Slade, E.M.; Garcia-Ulloa, J.; Gaveau, D.L.A.; Lee, J.S.H.; Santika, T.; Juffe-Bignoli, D.; Struebig, M.J.; et al. The environmental impacts of palm oil in context. Nat. Plants 2020, 6, 1418–1426. [Google Scholar] [CrossRef]
  7. Meijaard E, Virah-Sawmy M, Newing H S, Ingram V, Holle M J M, Pasmans T, et al 2024 Exploring the future of vegetable oils. Oil crop implications - fats, forests, forecasts, and futures. Gland, Switzerland: IUCN and SNSB. 186 p.
  8. Ostfeld, R.; Howarth, D.; Reiner, D.; Krasny, P. Peeling back the label—exploring sustainable palm oil ecolabelling and consumption in the United Kingdom. Environ. Res. Lett. 2019, 14, 014001. [Google Scholar] [CrossRef]
  9. Narayanan, S.; Singh, G.A. From Stimulus to Response: Understanding the Causes and Outcomes of Consumer Activism. J. Consum. Behav. 2024, 24, 820–845. [Google Scholar] [CrossRef]
  10. WWF. Wwf palm oil buyers’ scorecard 2009. How ‘green’ is the palm oil purchased by european companies? Gland, Switzerland: WWF International/Forest Conversion Programme; 2009.
  11. RSPO. Factsheet on home and personal care sector. Kuala Lumpur, Malaysia: Roundtable on Sustainable Palm Oil; 2021.
  12. Gupta A, Mason M. A transparency turn in global environmental governance. In: Gupta A, Mason M, editors. Transparency in global environmental governance: Critical perspectives. Earth system governance. Cambridge MA, USA: MIT Press; 2014. p. 3-38.
  13. Meijaard, E.; Sheil, D. The Moral Minefield of Ethical Oil Palm and Sustainable Development. Front. For. Glob. Chang. 2019, 2. [Google Scholar] [CrossRef]
  14. Rainforest Foundation Norway 2012 The day the norwegians rejected palm oil and deforestation. Https://www.Regnskog.No/en/long-reads-about-life-in-the-rainforest/the-day-the-norwegians-rejected-palm-oil-and-deforestation-1. Accessed on 30 july 2025.
  15. Crothers L 2019 Norway sees sharp drop in palm oil biofuel consumption after ban on government purchasing. Https://news.Mongabay.Com/2019/06/norway-sees-sharp-drop-in-palm-oil-biofuel-consumption-after-ban-on-government-purchasing/?Utm_source=chatgpt.Com, accessed on 5 august 2025.
  16. Ferrero 2024 Palm oil charter.
  17. Mackay H 2019 Iceland removed own label from 17 products rather than palm oil. Https://www.Bbc.Com/news/uk-46984349. Accessed on 20 may 2025.
  18. Sheargold E, Mitchell A D 2011 Oils ain’t oils: Product labelling, palm oil and the wto. Melbourne J. Int. Law. 12 [148]-70.
  19. Pacheco, P.; Schoneveld, G.; Dermawan, A.; Komarudin, H.; Djama, M. Governing sustainable palm oil supply: Disconnects, complementarities, and antagonisms between state regulations and private standards. Regul. Gov. 2018, 14, 568–598. [Google Scholar] [CrossRef]
  20. Meijaard E, Sheil D, Virah-Sawmy M 2025 No oil crop is inherently bad — but our thinking might be. Cell Rep. Sust. [CrossRef]
  21. Pendrill, F.; Gardner, T.A.; Meyfroidt, P.; Persson, U.M.; Adams, J.; Azevedo, T.; Lima, M.G.B.; Baumann, M.; Curtis, P.G.; De Sy, V.; et al. Disentangling the numbers behind agriculture-driven tropical deforestation. Science 2022, 377, 1168. [Google Scholar] [CrossRef]
  22. Burnett, M.W.; French, R.; Jones, B.; Fischer, A.; Holland, A.; Roybal, I.; White, T.; Steibl, S.; Anderegg, L.D.L.; Young, H.; et al. Satellite imagery reveals widespread coconut plantations on Pacific atolls. Environ. Res. Lett. 2024, 19, 124095. [Google Scholar] [CrossRef]
  23. Goldman, E.D.; Weisse, M.; Harris, N.; Schneider, M. Estimating the Role of Seven Commodities in Agriculture-Linked Deforestation: Oil Palm, Soy, Cattle, Wood Fiber, Cocoa, Coffee, and Rubber. 2020. [Google Scholar] [CrossRef]
  24. Song, X.-P.; Hansen, M.C.; Potapov, P.; Adusei, B.; Pickering, J.; Adami, M.; Lima, A.; Zalles, V.; Stehman, S.V.; Di Bella, C.M.; et al. Massive soybean expansion in South America since 2000 and implications for conservation. Nat. Sustain. 2021, 4, 784–792. [Google Scholar] [CrossRef]
  25. Jayathilake, H.M.; Prescott, G.W.; Carrasco, L.R.; Rao, M.; Symes, W.S. Drivers of deforestation and degradation for 28 tropical conservation landscapes. AMBIO 2020, 50, 215–228. [Google Scholar] [CrossRef]
  26. Meijaard, E.; Abrams, J.F.; Juffe-Bignoli, D.; Voigt, M.; Sheil, D. Coconut oil, conservation and the conscientious consumer. Curr. Biol. 2020, 30, R757–R758. [Google Scholar] [CrossRef]
  27. AllergyUK 2022 Your quick guide to: Your quick guide to: Soya (soy) allergy. Version 3. Https://www.Allergyuk.Org/wp-content/uploads/2022/10/soya-allergy.Pdf. Accessed on 17 september 2025.
  28. Woolworths. Policy - sustainable palm oil sourcing for woodworths own brand food and formulated non-food products. Pol.022. Woolworths Group Limited; 2023.
  29. Albert Heijn 2024 Duurzame keurmerken. Https://www.Ah.Nl/inspiratie/duurzaamheid/duurzame-keurmerken. Accessed on 19 february 2025.
  30. Sainsbury 2024 Sustainable palm oil. Https://www.About.Sainsburys.Co.Uk/sustainability/plan-for-better/our-stories/2023/palm-oil. Dated 24 june 2024. Accessed 18 february 2025.
  31. Maganja, D.; Davies, T.; Sanavio, L.; Louie, J.C.Y.; Huffman, M.D.; Trieu, K.; Wu, J.H.Y. Current food labelling practices in online supermarkets in Australia. Int. J. Behav. Nutr. Phys. Act. 2023, 20, 1–11. [Google Scholar] [CrossRef]
  32. Olzenak, K.; French, S.; Sherwood, N.; Redden, J.P.; Harnack, L. How Online Grocery Stores Support Consumer Nutrition Information Needs. J. Nutr. Educ. Behav. 2020, 52, 952–957. [Google Scholar] [CrossRef]
  33. Hill, K. Fats and oils as oleochemical raw materials. Pure Appl. Chem. 2000, 72, 1255–1264. [Google Scholar] [CrossRef]
  34. Parsons, S.; Raikova, S.; Chuck, C.J. The viability and desirability of replacing palm oil. Nat. Sustain. 2020, 3, 412–418. [Google Scholar] [CrossRef]
  35. R Core Team. R: A language and environment for statistical computing. R foundation for statistical computing. Http://www.R-project.Org/. Vienna, Austria; 2024.
  36. Lumley T 2024 Survey: Analysis of complex survey samples. R package version 4.4.
  37. Schneider B 2023 Svrep: Tools for creating, updating, and analyzing survey replicate weights. R package version 0.6.0.
  38. SASPO. Guide to sustainable palm oil for singapore companies: Economic opportunities and sourcing guidelines. Singapore: SASPO,; 2018.
  39. FAO 2020 Faostat. Food balances (-2013, old methodology and population). Metadata. Https://www.Fao.Org/faostat/en/#data/fbsh/metadata.
  40. FAO 2024 Food balances (2010-). Metadata. Https://www.Fao.Org/faostat/en/#data/fbs/metadata.
  41. Rainforest Foundation Norway 2014 Running a successful palm oil campaign. Https://www.Regnskog.No/en/what-we-do/how-we-create-political-change/running-a-successful-palm-oil-campaign?Utm_source=chatgpt.Com. Accessed on 31 july 2025.
  42. Trygg Mat 2025 Palmeolje: Disse matvarene inneholder palmeolje. Https://www.Tryggmat.App/tilsetninger/palmeolje. Accessed on 5 august 2025.
  43. Butler S 2022 Iceland reverts to palm oil ‘with regret’ as ukraine war hits food prices. Https://www.Theguardian.Com/business/2022/mar/28/iceland-reverts-to-palm-oil-with-regret-as-ukraine-war-hits-food-prices. Accessed on 5 february 2025.
  44. Retail Detail 2025 Expansion earns albert heijn market share growth despite tobacco ban. Dated 21 january 2025. Accessed 26 february 2025. Https://www.Retaildetail.Eu/news/food/expansion-earns-albert-heijn-market-share-growth-despite-tobacco-ban/.
  45. Statista 2024 Market share of grocery stores in great britain from january 2017 to november 2024. Dated 4 december 2024. Accessed 26 february 2025. Https://www.Statista.Com/statistics/280208/grocery-market-share-in-the-united-kingdom-uk/.
  46. Statista 2024 Market share of grocery retailers in australia in financial year 2023. Dated 31 may 2024. Accessed 26 february 2025. Https://www.Statista.Com/statistics/994601/grocery-retailer-market-share-australia/.
  47. Willett, W.; Rockström, J.; Loken, B.; Springmann, M.; Lang, T.; Vermeulen, S.; Garnett, T.; Tilman, D.; DeClerck, F.; Wood, A.; et al. Food in the Anthropocene: the EAT–Lancet Commission on healthy diets from sustainable food systems. Lancet,.
  48. Shah, U.A.; Merlo, G. Personal and Planetary Health—The Connection With Dietary Choices. JAMA 2023, 329, 1823–1824. [Google Scholar] [CrossRef]
  49. Cai, H.; Talsma, E.F.; Chang, Z.; Wen, X.; Fan, S.; Veer, P.V.; Biesbroek, S. Health outcomes, environmental impacts, and diet costs of adherence to the EAT-Lancet Diet in China in 1997–2015: a health and nutrition survey. Lancet Planet. Heal. 2024, 8, e1030–e1042. [Google Scholar] [CrossRef]
  50. Chiriacò, M.V.; Galli, N.; Latella, M.; Rulli, M.C. Pressure on Global Forests: Implications of Rising Vegetable Oils Consumption Under the EAT-Lancet Diet. Glob. Chang. Biol. 2025, 31, e70077. [Google Scholar] [CrossRef] [PubMed]
  51. Open Food Facts 2025 Https://world.Openfoodfacts.Org/. Accessed on 17 september 2025.
  52. Grunert, K.G.; Wills, J.M. A review of European research on consumer response to nutrition information on food labels. J. Public Health 2007, 15, 385–399. [Google Scholar] [CrossRef]
  53. European Commission, n.d. Regulation on deforestation-free products. Https://environment.Ec.Europa.Eu/topics/forests/deforestation/regulation-deforestation-free-products_en. Accessed on 17 september 2025.
Figure 1. Diagram showing the sampling strategy for determining oil use in supermarket products across three nationwide supermarkets that provided complete ingredient information in their online product databases.
Preprints 177703 g001
Figure 2. Overall relative presence of oil crop derivatives in supermarket products across three supermarkets in the Netherlands, the United Kingdom and Australia, excluding products for which only oleochemicals were listed. “Any” signifies products that contain at least one vegetable oil, including the unspecified category. The circles represent means, and the bars represent 95% confidence intervals derived from bootstrapping.
Preprints 177703 g002
Figure 3. Relative presence of oil crops in supermarket products by supermarket, excluding products for which any oleochemicals were listed. “Any” signifies products that contain at least one vegetable oil, including the unspecified category. The circles represent means, and the bars represent 95% confidence intervals derived from bootstrapping.
Preprints 177703 g003
Figure 4. Change in domestic supply of vegetable oils derived from FAO Food Balance Sheets from 2000 to 2022 in three countries and the world. We aggregated the supply of palm oils (palm oil + palm kernel oil; “Palm”), other major vegetable oils included in this study (i.e., soya, peanut (groundnut), sunflower, rape, coconut, sesame, olive, and maize; “Other Named Crop”), and the FAO’s “other” oil crop oil category which includes several crops such as jojoba as well as margarine (“Uncategorized”). From 2000 to 2009, we used the old food balance sheet methodology [39], and from 2010 to 2022, the new methodology, which accounts for discontinuities between the 2009 and 2010 data [40]. The vertical dashed black line indicates 2006 (the year the 50% palm oil figure was initially reported by WWF), and the vertical solid grey line indicates 2010, the initial year of the updated FAO methodology.
Preprints 177703 g004
Disclaimer/Publisher’s Note: The statements, opinions and data contained in all publications are solely those of the individual author(s) and contributor(s) and not of MDPI and/or the editor(s). MDPI and/or the editor(s) disclaim responsibility for any injury to people or property resulting from any ideas, methods, instructions or products referred to in the content.
Copyright: This open access article is published under a Creative Commons CC BY 4.0 license, which permit the free download, distribution, and reuse, provided that the author and preprint are cited in any reuse.
Prerpints.org logo

Preprints.org is a free preprint server supported by MDPI in Basel, Switzerland.

Subscribe

Disclaimer

Terms of Use

Privacy Policy

Privacy Settings

© 2025 MDPI (Basel, Switzerland) unless otherwise stated