
Submitted:
12 March 2025
Posted:
13 March 2025
You are already at the latest version
Abstract
Background: Osteosarcoma (OS) is a highly aggressive primary bone malignancy, for which treatment and prognosis remain unchanged for three decades. This study aimed to delineate molecular subtypes of early-stage, treatment-naive OS to improve molecular stratification and guide precise therapeutic strategies. Methods: The top 10% of the most variable genes of 102 OS tumour tissues were used in NMF to classify the tumours into three subtypes, S1, S2, and S3. Differential expression analysis was carried out using DESeq2 and functional enrichment analysis using clusterProfiler and CancerHallmarks. Tumor microenvironment composition was estimated through ESTIMATE and CIBERSORT, and drug sensitivity prediction using OncoPredict. NMF was also applied to RNA-seq data from 19 osteosarcoma cell lines and DEGs between the groups were correlated with the DEGs from patients' subtypes. SAOS-2, representing S1, was used in the viability assays to determine the effects of hesperidin, alone or in combination with doxorubicin and 5-fluorouracil. Results: S1 was enriched in cell cycle regulation, vesicular transport, and RNA metabolism with high tumor purity and high resistance to chemotherapeutics. S2 and S3 were enriched in extracellular matrix organization and protein translation pathways, respectively. KIF20A was significantly overexpressed gene indicating a poor prognosis of S1. AURKB, a hesperidin target, was found as an important gene for the pathogenesis of S1. Hesperidin significantly reduced SAOS-2 cell viability and enhanced the efficacy of doxorubicin. Conclusions: Our results offer a strong molecular basis for OS subclassification, highlighting subtype-specific mechanisms of tumour progression and chemoresistance. Our findings support the prospect of customized therapeutic approaches, with hesperidin being a promising co-adjuvant to improve the prognosis of high-risk OS patients.
Keywords:
transcriptomic data analysis
; osteosarcoma stratification
; drug targeting
; combine treatment
1. Introduction
Osteosarcoma (OS) is a highly aggressive primary malignant bone tumor that predominantly affects children, adolescents, and young adults with an incidence of 5 cases per million people under the age of 20 [1]. Although the 5–year survival rate is 65.5% [2], patients with metastases and recurrence, have a significantly lower survival rate of ~30% [3]. Despite this concerning statistic, the treatment for OS has remained largely unchanged over the past three decades [3]. This stagnation in treatment innovation highlights the urgent need for further research and development in therapies tailored specifically for OS, especially given the aggressive nature of the disease and the significant impact of current treatment regimens on patients’ quality of life [4].
The chemotherapy used for this type of tumor mostly consists of combinations of different drugs, including doxorubicin, methotrexate, cisplatin, ifosfamide, epirubicin, cyclophosphamide, gemcitabine, etoposide, and vincristine [5,6,7]. These drugs are categorized into four distinct classes based on their mechanisms of action: alkylating agents, antimetabolites, topoisomerase inhibitors, and mitotic inhibitors [8]. However, the high doses required for the treatment of OS patients can have significant drawbacks leading to short and long-term adverse effects on patients' health with hepatotoxicity, nephrotoxicity, neurotoxicity, cardiotoxicity, ototoxicity, hematological, gastrointestinal, and gonadal toxicity being reported [9,10,11,12,13,14,15,16,17,18,19,20,21,22,23,24]. Enhancing therapy and minimizing side effects are particularly crucial for younger patients. Although they are generally more tolerant to higher doses of chemotherapeutics, they are likely to face many more years living with a reduced quality of life [25]. In recent years, significant attention has been focused on precision and personalized medicine to optimize therapy and enhance quality of life. This approach considers both inter- and intra-tumor variability in gene expression and tumor microenvironments (TME)[26].
The identification of molecular subtypes of OS could lead to more precise treatments tailored for specific subtype. Currently, classification is mostly based on OS localization and histologic characteristics [27]. On the other hand, molecular classification is still relatively rare and mainly focuses on the tumor microenvironment characteristics or immunological expression profiles [28,29,30,31,32,33]. The challenges associated with characterizing OS present an opportunity for improvement, especially considering the significant toxicity of the chemotherapeutic agents used for treatment. By improving our understanding of OS, we can develop more effective and safer therapeutic strategies.
Despite the recent research in the field, previous studies only analyzed OS tumors after neoadjuvant chemotherapy [29] or did not differentiate the patients based on the presence of metastasis [34]. To the best of our knowledge, our study represents the first investigation into the processes occurring in early stages of OS and before treatment and, focusing only on tumors that have not metastasized and have not undergone chemotherapy treatment.
Our study has delineated non treated, non-metastatic human samples into three molecular OS subtypes which show considerable heterogeneity in functional enrichment, tumor purity and drug sensitivity. We distinguished one OS subtype as having the worst prognosis and identified a prognostic factor for patient survival. Finally, we highlighted hesperidin as a potential co-adjuvant treatment of this most resistant OS subtype.
2. Materials and Methods
Data acquisition: Publicly available RNA-seq data was downloaded from the Target-OS (https://gdc.cancer.gov/publication-tag/target-os) project and Gene expression omnibus (GEO, https://www.ncbi.nlm.nih.gov/geo/) databases. From the Target-OS project data was acquired using TCGAbiolinks package (version, 2.34.0) in R studio software (version, 4.4.2) [35] . From the GEO, we have downloaded the data from GSE87624. The raw data for GSE253548 was provided by Prof. Sulev Koks from the Health Futures Institute, Murdoch University, Australia. Obtained patients’ datasets were filtered and samples that have not been treated with chemotherapeutics and did not have metastases at the time of sampling were used in the analysis. From the acquired datasets, after filtering and outlier removal, we had 109 samples (102 from OS tumor tissues and 7 from healthy tissues of OS patients). Batch correction using the Combat_seq algorithm in R [36] was performed on pooled datasets and the obtained data was further used in the analysis (Figure S1A,B).
From the depmap database (https://depmap.org/portal.) we have downloaded expression data of 19 OS cell lines isolated from primary tumors. Further, we used the NMF algorithm to classify cell lines into groups. The obtained DEGs between the groups were correlated to the DEGs between subtypes. The RNA sequencing data set GSE198158 was used to validate aurora kinase B (AURKB) expression in OS cell line SAOS-2 compared to hFOB1.19 normal osteoblasts cell line.
Non-negative matrix factorization: We have utilized the non-negative matrix factorization (NMF) R package (version, 0.28) to identify the molecular subtypes in our OS patient dataset [37]. The input was comprised of 10% of the most variable genes from 102 tumor samples. We filtered the genes with low counts (<10) and after variance stabilizing transformation, the variance for each gene was calculated. Subsequently, to determine the cophenetic values, we used the nmfEstimateRank function, with 100 iterations. Non-smooth NMF (nsNMF) algorithm was further used for our analysis with 500 iterations for the calculated cophenetic value
Differential gene expression analysis and functional enrichment: DEGs have been identified by using DESeq2 R package (version, 1.46.0). We compared the gene expression profiles across the identified subtypes (Subtype vs remaining). Adjusted P-value <0.05 and log2 Fold Change >1 were used as cutoffs for determining DEGs. The identified DEGs were used as input for functional analysis of enriched biological processes with the clusterProfiler (version, 4.14.6) R package and to identify enrichment in the 10 tumor hallmarks (https://cancerhallmarks.com). For visualizing Venn diagrams VennDiagram (version, 1.7.3) R package was used. Further, we analyzed changes in gene expression in tumor subtypes when compared to normal bone tissue using DESeq2. The obtained upregulated DEGs were used to construct a stringApp (version, 2.2.0) protein-protein interaction (PPI) network in Cytoscape (version, 3.10.1). The constructed networks were analyzed using MCODE (version, 2.0.3) to identify significant clusters, and CyTargetLinker (version, 4.1.0) was used to extend the obtained networks with drug - target interactions from the DrugBank (https://www.drugbank.com). For the cell line expression data, limma R package (version, 3.62.2) was used. GSE198158 was analyzed using Geo2R website tool to determine DEGs between SAOS-2 and hFOB1.19.
Weighted gene co-expression network analysis: The weighted gene co-expression network analysis was conducted using the WGCNA (version, 1.73) package in R. Since there was no significant difference in the expression of some genes, we calculated mean absolute deviation (MAD) for each gene and set the threshold at > 0.75 MAD. After filtering, 7297 genes were obtained which were further used to calculate the scale independence and mean connectivity using the pickSoftThreshold function in the WGCNA package (Figure S2A). The chosen power of 10, based on the scale of independence and mean connectivity, was further used within the blockwiseModules function for “signed” network construction with a mergeCutHeigth of 0.15 and a minimum module size of 30. Further, we used the biweight midcorrelation (bicor) to calculate the correlation of each module to each identified subtype. The p adjusted values were calculated using the Benjamini-Hochberg method for each module. For visualizing the module-trait heatmap, we first filtered out the obtained modules between -0.3 and 0.3 and then used the labeledHeatmap function to create the module- subtype correlation heatmap. Modules with the highest correlation values that were significant were used to construct a stringApp PPI network in Cytoscape for visualization and further analysis. We have further analyzed the PPI networks and identified the top 30 interconnected genes as hub genes. The expression of these genes, with important biological roles were further characterized by overlapping with upregulated DEGs.
Assessment of tumor microenvironment (TME) score and immune cell infiltration: Estimation of Stromal and Immune cells in Malignant Tumors using Expression algorithm, ESTIMATE (version, 1.0.13) was utilized to analyze the TME and calculate the stromal score, immune score and the estimate score [38]. The CIBERSORT (version, 0.1.0) algorithm was used to characterize the tumor infiltrating immune cells (TIICs) of the TME [39]. The fractions of immune cells were quantified using the LM22 as the signature matrix. To determine the significance of the differences between subtypes the Kruskal-Wallis test was used with p<0.05 considered as significant. Next, Spearman’s correlation was used to calculate the correlations between different immune cell types.
Drug sensitivity estimation analysis: OncoPredict (version, 1.2) was utilized to calculate the drug sensitivity of the analyzed pooled dataset [40]. Data from the OncoPredict, precisely the Genomics of drug sensitivity in cancer (GDSC, https://www.cancerrxgene.org/) datasets containing the drug sensitivity and expression information of 805 cell lines and 198 drugs, were used. From this dataset 9 commonly used OS chemotherapeutics were filtered and the estimated IC50 of each identified subtype was calculated. The differences in sensitivity to each chemotherapeutic were analyzed using the Kruskal-Wallis test and p<0.05 was considered as significant.
Survival analysis: Survival analysis was performed in R software, ver. 4.4.2 using survival [41,42], survminer [43] and ggplot2 packages [44]. Univariate Cox proportional-hazards model [45] was used to reveal the association between the survival time of patients (in years) and the expression of selected genes (previously detected as significant for OS subtypes 1-3). The follow-up time for censored data was 6 months after the last detected death in specific patient subtype. Median expression value was used as a cut off to create "high" and "low" gene expression groups. Wald test was used to test the significance of the association. Statistical significance was set at p<0.05, while statistical trend (marginal significance) was set at 0.05<p<0.1. The hazard ratio (HR) with 95% confidence interval (CI) was used as a measure of the strength of an association.
Cell culture and treatment: SAOS-2 cells were cultured in Dulbecco's Modified Eagle Medium high-glucose (DMEM; 4.5 g/L glucose, Gibco, United Kingdom) supplemented with 10% fetal bovine serum (PAN Biotech, Germany) and Penicillin-Streptomycin-Amphotericin B solution (PAN Biotech, Germany). Cells were maintained at 37°C in a humidified atmosphere with 10% CO₂. After reaching confluency, cells were passaged and seeded, at a density of 1.5x10⁴, in 96 well plates. The next day, cells were treated with hesperidin (Sigma-Aldrich, USA) and/or chemotherapeutics, doxorubicin (Ebewe, Austria) or 5-Fluorouracil (Sigma-Aldrich, USA) and were incubated with their respective treatments for 24h. For the viability assay, the treatments consisted of growing concentrations of Hesperidin (20 - 180μM) alone or with doxorubicin.
MTT Viability assay: The viability of SAOS-2 cells was evaluated using the MTT assay (Sigma-Aldrich, USA) according to the manufacturer’s instructions. Briefly, cells were seeded in 96-well plates and incubated with MTT solution (0.5 mg/mL in cell culture medium) for 2 hours at 37°C. After incubation, the MTT solution was removed, and formed formazan crystals were dissolved in DMSO (Serva Electrophoresis GmbH, Germany). Absorbance was measured at 550 nm using a Tecan Infinite 200 PRO microplate reader (Tecan Subtype Ltd., Switzerland). Statistical analysis was performed by using R studio One way ANOVA test was used to calculate p-values (p-value >0.05, *p-value < 0.05, p-value < 0.01, *p-value < 0.001). Data is shown as a mean ± SD (Standard Deviation of the Means).
3. Results
3.1. Identification of Three OS Molecular Subtypes with Distinct Biological and Cancer Hallmark Enrichment Profiles
To classify the 102 obtained non-metastasized, non-treated OS patient samples into subtypes and determine their molecular signatures, we utilized the NMF R package to find the optimal rank for the NMF algorithm, based on the cophenetic values. The calculated cophenetic correlation value equaled three (Figure 1A) and analyzed OS samples were classified into three subtypes, S1 (27 samples), S2 (31 samples), and S3 (44 samples) (Figure 1B). Functional enrichment analyses of the DEGs identified for each of the OS subtypes showed that S1 exhibited enriched cell cycle, microtubule associated processes, and RNA metabolism processes (Figure 1C). On the other hand, subtype S2 had enriched processes related to the extracellular matrix organization, migration, vasculature development and transforming growth factor-beta signaling (Figure 1E). The subtype S3 showed enrichment in cytoplasmic translation, ribosome biogenesis, protein maturation and the Notch signaling pathway (Figure 1G). Further, we utilized CancerHallmarks [46] which provides a consensus gene set associated with ten cancer hallmarks, facilitating a comprehensive enrichment analysis. Using this platform, we identified cancer hallmarks overrepresented in each of the subtypes. All three identified subtypes showed statistically significant enrichment in four hallmarks - sustaining proliferative signaling, resisting cell death, tissue invasion and metastasis, and evading growth suppressors (Figure 1D,F,H) In addition to the identified similarities, our analysis has revealed significant differences between the three subtypes. Namely, S1 has shown a marked enrichment of reprogramming energy metabolism (Figure 1D) while S2 had significant enrichment in the sustained angiogenesis hallmark (Figure 1F). S3 had a statistically significant enrichment in the replicative immortality and evading immune destruction (Figure 1H).
Our analysis identified 3 molecular subtypes of OS that exhibit considerable differences in the enrichment of biological processes. Analysis of the enrichment of ten cancer hallmarks revealed which processes contribute to the pathogenesis of each tumor subtype pathogenesis, emphasizing the heterogeneity of OS.
3.2. Gene Co-Expression Networks Reveal Subtype-Specific Functional Enrichment in OS
To identify significantly correlated modules to each subtype, we have utilized the WGCNA package to construct a gene co-expression network for each OS subtype. Our analysis has identified 31 co-expression modules, each presented with their own designated color (Figure S2B) and the number of associated genes (Figure S2C). For further examination we have chosen the modules based on the highest correlation values to individual OS subtype and the top ~30 most interconnected genes (hub genes). Namely, we have identified the pink module as the most significantly correlated to S1 (cor = 0.5; p adj = 6e-07) while the darkred and grey60 modules were significantly correlated to S2 (cor = 0.49; p adj = 1e-06) and (cor = 0.63; p adj = 3e-11) respectively. Finally, the yellow (cor = 0.58; p adj = 2e-09) and salmon (cor = 0.65; p adj = 4e-12) modules have shown the highest correlation to S3 (Figure S2D). To further characterize the identified modules, we analyzed the functional enrichment of Gene Ontology biological processes of each module. The pink module associated with S1 is significantly enriched in processes related to vesicles and intracellular transport (including Golgi, endosomal, and Golgi-to-plasma membrane protein trafficking), p53-mediated signal transduction, protein localization during cytokinesis, circadian rhythm, and microtubule polymerization. From the identified 30 hub genes within the pink module, with the highest degree values, we singled out 12 genes that are significantly upregulated DEGs (Figure 2A) in S1 compared to other OS subtypes. Further we analyzed the modules which correlated to S2 (Figure 2B). The darkred module is enriched in glycoprotein/oligosaccharide catabolism, endothelial development, and PDGF/PI3K-AKT signaling, whereas the grey60 module is predominantly enriched in integrin-mediated cell adhesion, extracellular matrix organization, and chemotaxis. Among the 31 genes in the darkred module, 10 were also found in the upregulated DEGs while in the grey60 module 21 genes were significantly upregulated in S2 (Figure 2B). After the analysis of the functional enrichment in modules correlated with S3 we have shown that the salmon module is primarily involved in Golgi vesicle transport and ER stress response, whereas the yellow module is enriched in processes related to ossification, osteoblast differentiation, and embryonic skeletal and cardiac development. Out of the 30 hub genes 14 and 21 genes were upregulated, in S3, in the salmon and yellow modules, respectively. (Figure 2C).
Overall, from the 31 identified modules we have chosen the significant modules with the highest correlation values to individual subtypes. We have shown that the processes enriched in S1 of OS are mainly connected to cellular transport, and Golgi apparatus organelle functions, and cytokinesis. On the other hand, S2 correlated modules have shown enrichment mostly in extracellular matrix organization, adhesion, platelet derived growth factor and integrin mediated signaling. Further, S3 has shown considerable enrichment in Golgi apparatus processes, response to endoplasmic reticulum stress, and bone forming processes such as ossification and bone development.
3.3. TME Analysis Reveals Subtype-Specific Immune Infiltration and Prognostic Implications
In recent years, the microenvironment has been recognized as having a prominent role in tumor development and could consequently provide valuable insights into the pathogenesis of OS [47]. To characterize the identified OS subtypes, we analyzed the TME scores calculated by ESTIMATE. The obtained scores quantify the abundance of stromal and immune cells in tumors, offering insights into TME composition and tumor purity using the ESTIMATE score [48]. We have shown that S1 has a lower immune and stromal score indicating a lower estimate score when compared to other subtypes. S2 has the highest estimate and stromal score when compared to other subtypes (Figure 3A). Further, to better analyze the composition of TIICs we utilized the CIBERSORT algorithm and have shown that S1 had significantly larger fractions of T follicular helper cells, and eosinophils while having the smallest fraction of M2 macrophages when compared to the other identified subtypes (Figure 3B). Also, the first subtype has shown to have larger fractions of T CD8 and B memory cells than S3, while S2 had a larger fraction of resting mast cells and the smallest fraction of dendritic resting cells when compared to the other subtypes. Moreover, the second subtype has shown larger fractions of B memory cells, NK resting cells and activated dendritic cells than S3, while having less T gamma delta cells (Figure 3B).
From previous research it is known that lower ESTIMATE scores (higher tumor purity), are associated with poor prognosis in OS patients [49]. Our study observed significant differences in ESTIMATE scores for the identified OS subtypes, indicating a poor prognosis for S1, which had the lowest score. We have identified significant differences in the fractions of infiltrated immune cells, with M0 and M2 macrophages comprising the largest proportions across all subtypes. In addition, we have shown that S1 has a significantly larger fraction of T follicular helper cells compared to the other 2 subtypes.
3.4. OS Drug Sensitivity
Utilizing the oncopredict R package we determined the estimated IC50 values for defined OS subtypes for commonly used chemotherapeutics. In the analysis we included chemotherapeutics such as methotrexate, etoposide, doxorubicin, gemcitabine, cisplatin, epirubicin, cyclophosphamide, 5-fluorouracil (Figure 4A–H)[5,50,51,52]. Markedly, S1 has shown a statistically significant increase in resistance to treatment with doxorubicin, cisplatin, epirubicin and 5-fluorouracil when compared to the other subtypes. When compared to S3, S2 has shown significantly higher IC50 values for methotrexate, cisplatin, cyclophosphamide, etoposide, gemcitabine, epirubicin and 5-fluorouracil. On the other hand, S2 is more sensitive to doxorubicin, cisplatin, epirubicin and 5-fluorouracil compared to S1. Finally, we have shown that S3 has the lowest IC50 values among the identified subtypes.
To conclude, S1 has shown to be the most resistant to the analyzed therapeutics compared to other identified subtypes of OS.
3.5. Differential Gene Expression, Drug Targeting and Functional Enrichment
To better characterize the defined subtypes, we identified the DEGs between normal tissues and each subtype. Our analysis revealed that all three subtypes share 384 downregulated genes and 74 upregulated genes. Additionally, we found that S1has 368 downregulated DEGs and 385 upregulated DEGs, S2 has 161 downregulated DEGs and 45 upregulated DEGs, and S3 has 546 downregulated DEGs and 203 upregulated DEGs (see Figure S3A,B). To conduct a more in-depth study of the obtained upregulated DEGs we have constructed a PPI network and identified the most significant gene clusters. All the identified clusters had enrichment in biological processes connected to cell division and cell cycle positive regulation (Figure 5B and Figure S3C,F).
Furthermore, we extended the networks with information from the DrugBank to identify potential therapeutics for each subtype (Figure 5A and Figure S3C,E). We have focused on analyzing the top 10% of interconnected genes in each cluster due to their important biological functions within each cluster. (Figure 5A and Figure S3C,E). Analysis of S1 subtype, which was shown to have significant resistance to chemotherapy (Figure 4), highlighted hesperidin as a promising candidate for treating this OS subtype. Our analysis revealed that hesperidin targets aurora kinase B (AURKB), a gene that has been highlighted in the literature as a crucial factor in OS progression and metastasis [53,54,55]. This finding is especially important because subtype S1, which exhibits the highest tumor purity, shows the highest resistance to various commonly used chemotherapeutics compared to other identified subtypes (Figure 5A).
Furthermore, we assessed the association between the gene expression and survival probability for the top 10% of interconnected genes. Our analysis has shown that none of the analyzed genes are correlated to survival in S2. On the other hand, AURKB marginally increased the hazard for S3 while high expressions of the PBK and CENPA genes were associated with a reduced hazard for this OS subtype (Figure S4A–C). For S1, high expression of kinesin family member 20A (KIF20A) increased the hazard (p=0.02, HR=2300728353.3, 95% CI=0-infinite), but small sample size in this case could not provide appropriate model fit to calculate precise HR and CI (Figure 5C). Moreover, we have validated our results regarding KIF20A using 2 independent datasets. Using these samples, we have identified KIF20A as a gene whose expression significantly impacts survival rates in patients (Figure 5D). It is important to emphasize that, according to the dataset GSE39055 utilized in this validation, 80% of the patients who died displayed elevated expression levels of the analyzed gene. All of these patients had an unfavorable response to chemotherapy with the tumor necrosis after chemotherapy being below 90%.
Based on our results, we can conclude that the three identified subtypes share a core group of dysregulated genes, while also having a notable number of DEGs specific to each subtype. The functional enrichment analysis of the three most significant clusters indicates that, despite their differing compositions, they are enriched in similar biological processes related to the cell cycle progression and mitosis. Furthermore, our analysis of survival probability of OS patients revealed and validated its significant association with the expression of the KIF20A gene.
3.6. Analysis of Hesperidins Effect on SAOS-2 Cell Line
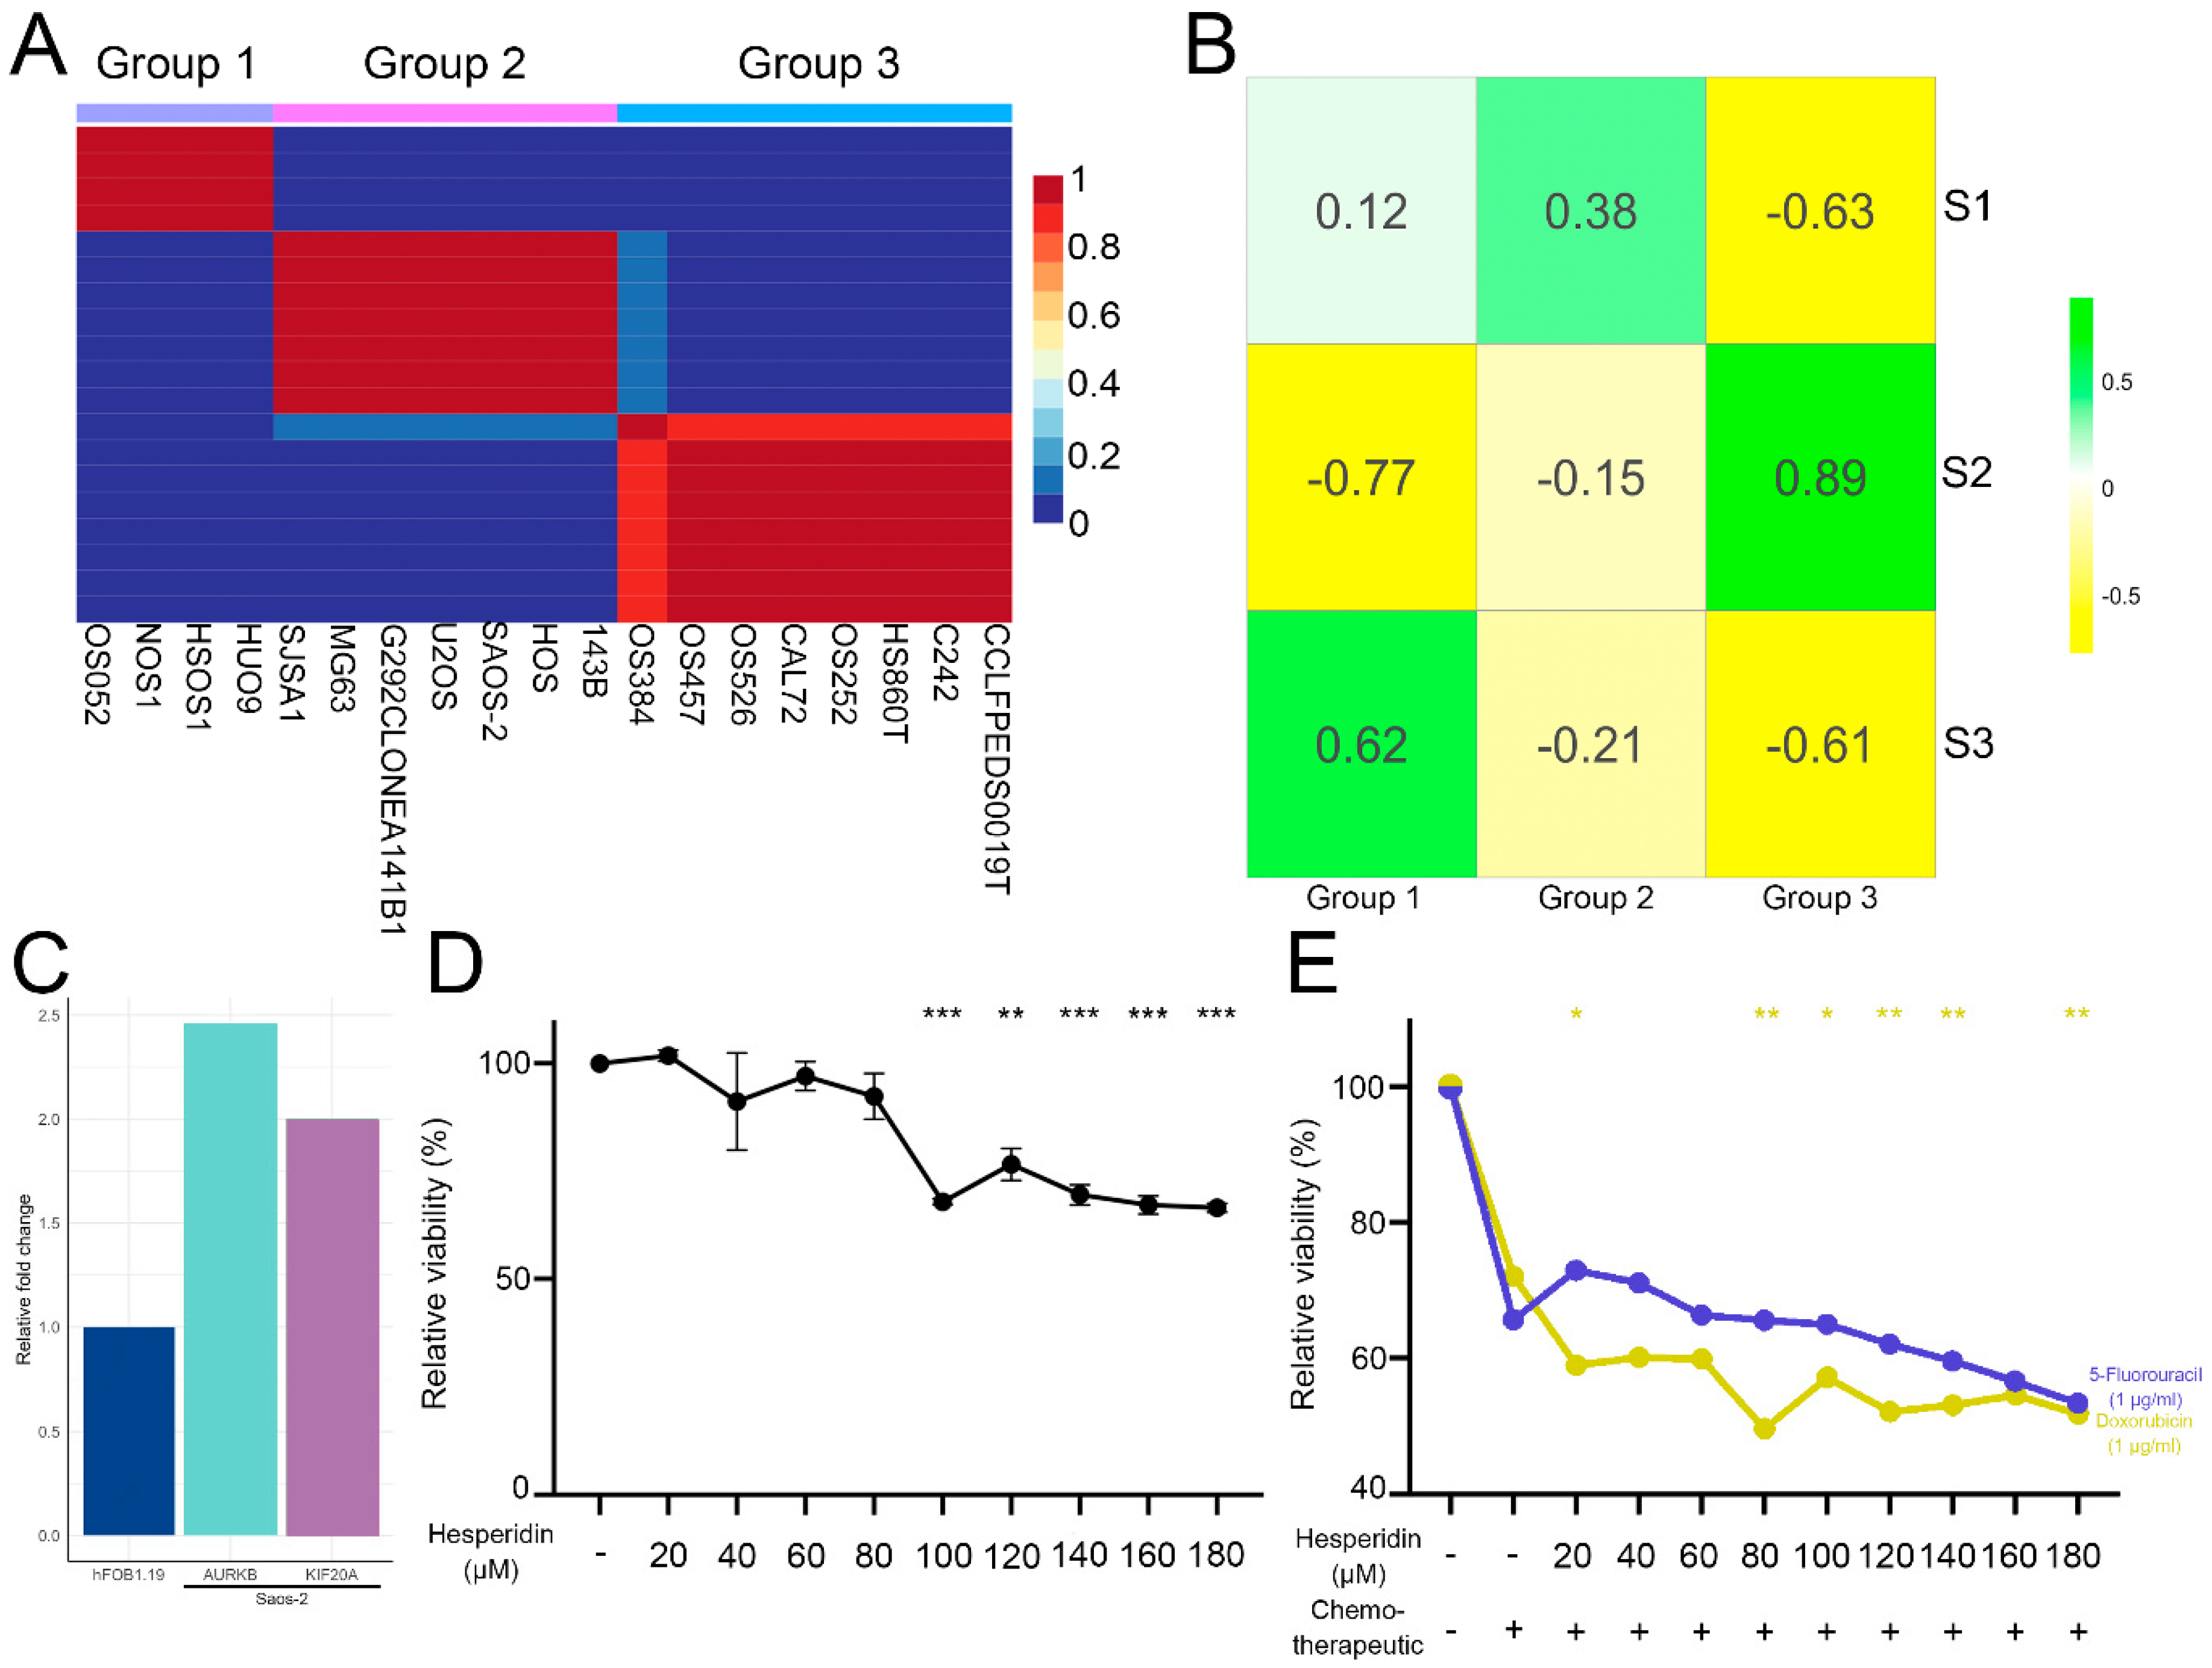
To validate our predicted classification of human patient samples into the subtypes, and find adequate cell lines corresponding to each predicted OS subtype, we performed NMF on 19 osteosarcoma lines obtained from primary tumors within the DepMap portal [56]. Our analysis has shown that all 19 cell lines could be classified into three groups, groups 1, 2, and 3 (Figure 6A). Further, we correlated the significant (p adj <0.05) DEGs identified between the cell line groups with human sample subtypes. Group 1 correlated strongly with S3 (cor=0.62). The cell lines in group 3 had a very strong correlation to S2 (cor=0.89) while group 2 cell lines had the highest correlation to S1 (cor=0.38) (Figure 6B). To verify drug targeting predictions for OS subtype S1, we selected the SAOS-2 cell line which corresponds to the S1 subtype. Our results have demonstrated that the expression levels of AURKB and KIF20A, both of which rank among the top 10% of interconnected upregulated genes in the most significant cluster in S1, are increased by 2.5-fold and 2-fold, respectively, in SAOS-2 cells when compared to the hFOB1.19 normal osteoblast cell line (Figure 6C). Subsequently, we have analyzed hesperidin’s effect on SAOS-2 cell viability alone or in combination with doxorubicin and 5-fluorouracil to which subtype S1 has shown resistance. Hesperidin has shown a considerable statistically significant effect on SAOS-2 cell viability decreasing it by 30% at concentrations of 100 μM and above (Figure 6D). We also evaluated the efficacy of hesperidin in a combined treatment with doxorubicin and 5-fluorouracil at concentrations approximating those found in patients' plasma [57,58]. The combined treatment led to a further decrease of SAOS-2 cell viability when compared to cells treated with doxorubicin alone, increasing the treatments efficacy by ~20% at hesperidin concentrations 20, 80, 120, 140 and 180 μM (Figure 6E). Nevertheless, hesperidin hasn’t increased the effect of 5-fluorouracil on the SAOS-2 cell viability, while the combination with 180 μM hesperidin has shown a statistical trend (0.05<p<0.1) of viability decrease compared to cells treated with only 5-fluorouracil.
The combined treatment led to a further decrease in SAOS-2 cell viability when compared to cells treated with doxorubicin alone, increasing the treatment efficacy by ~20% at hesperidin concentrations of 80, 120, 140, and 180 μM (Figure 6E). However, hesperidin did not enhance the effect of 5-fluorouracil on the SAOS-2 cell viability. Notably, the combination with 180 μM hesperidin showed a statistical trend (0.05<p<0.1) for decreased viability compared to cells treated solely with 5-fluorouracil.
Additionally, we analyzed the drug interactions of doxorubicin and hesperidin, demonstrating that hesperidin enhanced the effect of doxorubicin on SAOS-2 cells at concentrations of 20, 80, 120, 140, and 180 µM. The coefficient of drug interaction (CDI), calculated using the response additivity approach [59], ranged from 0.68 to 1.28 (Table S1). Although the CDI at 80 µM was 0.68, it was not statistically lower than 1, suggesting an additive rather than a synergistic effect at this concentration. The CDI values at higher concentrations also supported an additive effect between the two compounds.
Our findings indicate that the OS cell lines can be categorized into three distinct groups. The correlation of DEGs between these OS cell line groups and the identified OS subtypes have shown a significant relationship, indicating which cell lines may best represent each specific OS subtype. Consequently, we have selected the SAOS-2 cell line as our model system for analyzing the effects of hesperidin on cell viability. Our analysis revealed that hesperidin significantly decreased the viability of SAOS-2 cells and exhibited an additive effect when combined with doxorubicin, compared to cells treated with doxorubicin alone. However, this additive interaction was not observed when we analyzed the combined treatment with 5-fluorouracil. These results highlight the potential of hesperidin, particularly in combination with doxorubicin, for treating the S1 subtype of OS and underscore the importance of subtype-specific approaches in optimizing therapeutic strategies.
4. Discussion
Despite the advances in medicine, the treatment and prognosis for OS has remained unchanged for the last three decades [3]. The current classification, based solely on histology and tumor localization, has proven inadequate, underlining an urgent need for a molecular-based approach that would delineate the different subtypes and enable more precise, targeted treatments. Given that OS primarily arises in people younger than 20 years old and that the conventional therapy has highly toxic effects, we have analyzed the early stages of disease development before metastasis and chemotherapeutic treatment to shed light on the molecular mechanisms found in each subtype as well as to identify potential therapeutics. This approach would allow for precise treatment of each subtype, potentially lessening the acute and chronic deleterious effects of chemotherapy and improving patients' quality of life.
Previous studies have analyzed OS molecular subtypes and have identified subtypes based on gene sets associated with the tumor microenvironment, endoplasmic reticulum stress, macrophage-related genes, Golgi apparatus-related genes or cancer stem cell-related genes [30,31,60,61,62,63,64,65,66,67,68,69,70]. On the other hand, only a few papers have subcategorized OS samples based on a relatively large number of genes with variable expression between the samples [28,29,34]. This approach facilitates a robust estimate of the subtypes analyzing multiple aspects and classifying the samples accordingly. Moreover, the previously mentioned studies did not differentiate between the patients who had metastases at the time of sampling and those who did not. Therefore, our study focused on patients prior to chemotherapy, who had not yet developed metastases at the time of sampling. This strategy enables better characterization of these early stages of pathogenesis and may help determine adequate treatment approaches for each OS subtype. We delineated three subtypes of OS, which exhibit considerable functional heterogeneity in enriched biological processes and tumor hallmarks.
We have successfully identified distinct co-expressed modules significantly correlated to each identified subtype. Each module exhibited a unique set of enriched biological processes. In particular, the module correlated with S1 subtype had the majority of enriched processes associated with the intracellular transport, Golgi apparatus functioning and cytokinesis. It is known that the Golgi apparatus and intracellular transport are important for regulating cell metabolism allowing for increased growth and heightened proliferative capacity of tumors [71]. Notably, many types of tumors, including OS, can sequester and eliminate chemotherapeutics via vesicular transport, extruding them and diminishing the effects of chemotherapy [72,73]. Moreover, Pan et al. have shown that this type of transport and communication between cells in OS can lead to horizontal transfers of resistance to cisplatin treatment [74]. Precisely, they have analyzed the transfer of a circular RNA molecule, via vesicular transport, between cisplatin-resistant and sensitive cell lines. Their result indicates that vesicular transport has a significant role in the spreading of chemotherapy resistance and overall prognosis in OS [74]. Our results indicate that the increased resistance of S1 subtype could also be explained by this mechanism.
We have analyzed the TME of the identified OS subtypes and revealed significant differences in the TME composition. We have shown that S1 has the lowest ESTIMATE score indicating high tumor purity which is correlated to poor prognosis [49]. We observed that macrophages M0 and M2, make up the largest fractions in all of the subtypes, while the high-risk subtype S1 exhibited a lower M2 fraction compared to the lower risk subtypes S2 and S3. Moreover, the S1 subtype had significantly larger fractions of follicular helper T cells and eosinophils. The role of the TME immune composition in OS and its correlation to prognosis has been somewhat disputed. Deng et al. have shown that higher infiltration of M2 macrophages and follicular helper T cells were correlated to good prognosis [75]. On the other hand, Yang et al. have shown that higher infiltrations of M2 macrophages are correlated with a poor prognosis [76]. Furthermore, the follicular helper T cells have not yet received attention in the context of OS TME. They have shown pleiotropic effects on progression and outcome in different tumors. Namely, these cells produce multiple types of immunologic mediators linked to a better overall immune response to tumors, but there have been several studies showing their correlation to poor prognosis [77]. Lu et al. have investigated the role of follicular helper cells in OS patient’s peripheral blood. Their results suggest that these cells have significant implications on prognosis with high fractions of these cells in peripheral blood being linked to poor prognosis [78]. In conclusion, the role of these immune cells in OS TME has yet to be elucidated.
Jiang et al. have integrated and analyzed multi-omics data of 121 OS patients after the chemotherapy and classified OS samples into four consensus subtypes. They singled out one specific subtype as having the poorest prognosis and being the most resistant to chemotherapy, which was attributed to the enrichment in cellular metabolism [29]. Our analysis has shown that high-risk subtype S1 exhibits a significant enrichment in RNA biosynthesis, cell cycle and notably cellular metabolism. The three chemotherapeutics used by Jiang et al. were also analyzed in our study and we have shown that the S1 subtype is the most resistant to two out of three used drugs. The results of Jiang et al. together with our results reaffirm the significant role of metabolism in OS resistance to chemotherapy. This further highlights the need for precise therapy for each OS subtype to improve the outcome and reduce the adverse effects of chemotherapy.
By comparing genes expression profiles in OS subtypes versus normal bone tissue, we have uncovered a shared core of DEGs alongside subtype-specific differences. Within each identified OS subtype, the analysis of the expression profiles revealed a key cluster enriched in processes associated with the cell division. This suggests that each OS subtype may utilize distinct mechanisms to regulate cell proliferation, highlighting the importance of targeted therapies that address the specific expression profiles of each distinct subtype. Understanding these unique profiles can aid in developing more effective, personalized therapeutic strategies for OS patients. During the investigation of the top 10% most interconnected genes within the cell division cluster identified in the S1 subtype, KIF20A and AURKB emerged as particularly significant. KIF20A is a member of the kinesin super family of microtubule-dependent molecular motor proteins and plays a key role in cell division by transporting chromosomes during mitosis [79]. Furthermore, this gene has been associated with poor overall survival in various tumor types, highlighting its role in tumorigenesis and its correlation to negative outcomes in patients [79]. Zhu et al. have shown that the increase of KIF20A expression correlated with poor prognosis in sarcoma patients [80]. Additionally, in a study that analyzed OS progression and metastasis-associated genes, KIF20A was recognized as a hub gene in OS, suggesting its important role in the progression of this type of tumor [81]. The upregulation of KIF20A expression has also been linked to proliferation in OS U2OS cell lines [82]. Results of our study revealed that KIF20A overexpression is associated with poor outcomes and may serve as a new prognostic factor for OS patients. The involvement of KIF20A in vesicular transport (15), along with the observed low survival rates associated with its expression, may further substantiate the hypothesis that resistance of S1 subtypes primarily relies on the vesicular sequestration and transport of chemotherapeutic agents out of the cell.
It is widely recognized that abnormal proliferation of cancer cells is crucial for the development of cancer and its metastasis. In OS, tumor cells are highly proliferative, and display altered metabolic pathways to sustain their uncontrolled growth. To enhance their survival and aggressive growth, cancer cells reprogram their energy metabolism to ensure an adequate supply of energy [83]. We have observed that this cancer hallmark is enriched in the most resistant OS subtype S1 which exhibits overexpression of the AURK family member AURKB. AURKB plays a vital role in regulating mitosis and is essential for the proper segregation of chromosomes during cell division [84]. The abnormal expression of AURKB was associated with pathogenesis and drug resistance in a variety of cancers. AURKB affects the proliferation of clear cell renal cell carcinoma by regulating fatty acid metabolism [85]. In OS, AURKB is overexpressed and silencing AURKB effectively suppresses the malignant phenotype in vitro [55].
The drug targeting analysis conducted in this study highlights hesperidin as a promising therapeutic option for OS, particularly within the most significant cluster in the S1 subtype. Hesperidin, a naturally occurring flavonoid in citrus fruits, is known for its pro-apoptotic effects across various cancers [86]. It also modulates cellular metabolism by reducing glycolysis, commonly referred to as the Warburg effect [86,87]. The effects of hesperidin, well-documented in the literature, suggest its role in cancer prevention and treatment of various types of tumors alone or in combination with different chemotherapeutics [87]. For instance, Shakiba et al. demonstrated hesperidin’s effect on breast cancer cells in vivo, exhibiting significant anti-angiogenic and anti-proliferative [88]. Additionally, hesperetin, a derivative of hesperidin, has been shown to sensitize human lung cancer cells to chemotherapeutic drugs [89]. Both hesperetin and neohesperidin decrease cell viability and promote apoptosis and G2 phase arrest of U2OS and HOS OS cell lines [90,91]. Also, hesperetin has been shown to have an additive effect with a chemotherapeutic drug etoposide in reducing OS cell proliferation [90]. In our study, we also found that hesperidin exhibited an additive effect when used alongside doxorubicin. This combined treatment led to a statistically significant reduction in cell viability compared to treatment with either chemotherapeutic alone. These findings suggest that hesperidin could be beneficial as an adjuvant treatment in clinical practice.
5. Conclusions
Our study revealed significant differences in gene expression, functional enrichment, and treatment resistance among the identified subtypes at the early stages of OS pathogenesis. This highlights the need for improved clinical stratification based on the molecular characteristics of each OS subtype. The presented data emphasizes the important role of vesicular transport in OS's resistance to chemotherapy. We have identified adequate cell models that represent each human OS subtype and examined the effects of hesperidin on cell viability in the SAOS-2 cell line, which is representative of the most resistant subtype, S1. However, further analysis is required to uncover the molecular mechanisms through which hesperidin acts on OS cells. Understanding the molecular mechanisms will significantly contribute to the development and enhancement of existing therapies, thereby facilitating advancements in the treatment of this specific type of tumor.
Supplementary Materials
The following supporting information for this study: Figure S1: Principal component analysis, Figure S2: Construction and identification of modules associated with subtypes, Figure S3: Differential gene expression, significant cluster identification and functional enrichment, Figure S4: Survival probability and gene expression association; Table S1: Coefficients of drug interactions.
Author Contributions
Conceptualization, L.B. and M.M.; Data curation, L.B., M.M.; Formal analysis, L.B. J.K.; Investigation, L.B., M.P., J.K., E.M., N.K.G. Supervision, M.M., Validation, L.B., Visualisation, L.B., J.K., M.P. Visualization, L.B.J.K.; Writing – Original Draft Preparation, L.B., M.M.; Writing – Review & Editing, all authors have read and agreed to the final version of the manuscript.
Acknowledgments
This research was supported by the Ministry of Science, Technological Development and Innovation of the Republic of Serbia (grant no: 451-03-136/2025-03/200042).
Conflicts of Interest
All authors declare that they have no competing interests.
Abbreviations
The following abbreviations are used in this manuscript:
| OS | Osteosarcoma |
| NMF | Non-negative matrix factorization |
| GEO | Gene expression omnibus |
| TCGA | The cancer genome atlas |
| TME | Tumor microenvironment |
| AURKB | Aurora kinase B |
| KIF20A | Kinesin family member 20A |
| WGCNA | Weighted gene co-expression network analysis |
| MAD | Mean absolute deviation |
| PPI | Protein-protein interaction |
| CDI | Coefficient of drug interaction |
References
- NCCR*Explorer: An interactive website for NCCR cancer statistics [Internet]. National Cancer Institute; 2023 Sep 7. [updated: 2023 Sep 8; cited 2024 Aug 8]. Available from: https://nccrexplorer.ccdi.cancer.gov.
- Dharanikota, A.; Arjunan, R.; Dasappa, A. Factors Affecting Prognosis and Survival in Extremity Osteosarcoma. Indian J Surg Oncol 2021, 12, 199–206. [Google Scholar] [CrossRef] [PubMed]
- Sayles, L.C.; Breese, M.R.; Koehne, A.L.; Leung, S.G.; Lee, A.G.; Liu, H.Y.; Spillinger, A.; Shah, A.T.; Tanasa, B.; Straessler, K.; et al. Genome-Informed Targeted Therapy for Osteosarcoma. Cancer Discov 2019, 9, 46–63. [Google Scholar] [CrossRef] [PubMed]
- Hong, W.; Yuan, H.; Gu, Y.; Liu, M.; Ji, Y.; Huang, Z.; Yang, J.; Ma, L. Immune-related prognosis biomarkers associated with osteosarcoma microenvironment. Cancer Cell Int 2020, 20, 83. [Google Scholar] [CrossRef]
- Jiang, Z.-Y.; Liu, J.-B.; Wang, X.-F.; Ma, Y.-S.; Fu, D. Current Status and Prospects of Clinical Treatment of Osteosarcoma. Technology in Cancer Research & Treatment 2022, 21, 15330338221124696. [Google Scholar] [CrossRef]
- Rathore, R.; Van Tine, B.A. Pathogenesis and Current Treatment of Osteosarcoma: Perspectives for Future Therapies. J Clin Med 2021, 10. [Google Scholar] [CrossRef]
- Society, A.C. Chemotherapy and Other Drugs for Osteosarcoma. Availabe online: https://www.cancer.org/cancer/types/osteosarcoma/treating/chemotherapy.html (accessed on 11.02.2025). (accessed on 11.02.2025).
- van den Boogaard, W.M.C.; Komninos, D.S.J.; Vermeij, W.P. Chemotherapy Side-Effects: Not All DNA Damage Is Equal. Cancers (Basel) 2022, 14. [Google Scholar] [CrossRef]
- Thatishetty, A.V.; Agresti, N.; O'Brien, C.B. Chemotherapy-Induced Hepatotoxicity. Clinics in Liver Disease 2013, 17, 671–686. [Google Scholar] [CrossRef]
- Santos, M.L.C.; de Brito, B.B.; da Silva, F.A.F.; Botelho, A.; de Melo, F.F. Nephrotoxicity in cancer treatment: An overview. World J Clin Oncol 2020, 11, 190–204. [Google Scholar] [CrossRef]
- Malyszko, J.; Kozlowska, K.; Kozlowski, L.; Malyszko, J. Nephrotoxicity of anticancer treatment. Nephrol Dial Transplant 2017, 32, 924–936. [Google Scholar] [CrossRef]
- Lokich, J.J. Managing Chemotherapy-Induced Bone Marrow Suppression in Cancer. Hospital Practice 1976, 11, 61–67. [Google Scholar] [CrossRef]
- Hirotaka, F.; Ryuichi, F.; Hideo, Y.; Tatsuo, Y.; Akira, H.; Masatoshi, K. Anti-Cancer Agent-Induced Nephrotoxicity. Anti-Cancer Agents in Medicinal Chemistry 2014, 14, 921–927. [Google Scholar] [CrossRef]
- Grigorian, A.; O'Brien, C.B. Hepatotoxicity Secondary to Chemotherapy. J Clin Transl Hepatol 2014, 2, 95–102. [Google Scholar] [CrossRef] [PubMed]
- Emadi, A.; Jones, R.J.; Brodsky, R.A. Cyclophosphamide and cancer: golden anniversary. Nature Reviews Clinical Oncology 2009, 6, 638–647. [Google Scholar] [CrossRef]
- Taillibert, S.; Le Rhun, E.; Chamberlain, M.C. Chemotherapy-Related Neurotoxicity. Current Neurology and Neuroscience Reports 2016, 16, 81. [Google Scholar] [CrossRef] [PubMed]
- Magge, R.S.; DeAngelis, L.M. The double-edged sword: Neurotoxicity of chemotherapy. Blood Reviews 2015, 29, 93–100. [Google Scholar] [CrossRef]
- Yeh, E.T.H. Cardiotoxicity Induced by Chemotherapy and Antibody Therapy. Annual Review of Medicine 2006, 57, 485–498. [Google Scholar] [CrossRef]
- Pai, V.B.; Nahata, M.C. Cardiotoxicity of Chemotherapeutic Agents. Drug Safety 2000, 22, 263–302. [Google Scholar] [CrossRef]
- Oun, R.; Moussa, Y.E.; Wheate, N.J. The side effects of platinum-based chemotherapy drugs: a review for chemists. Dalton Transactions 2018, 47, 6645–6653. [Google Scholar] [CrossRef]
- Coradini, P.P.; Cigana, L.; Selistre, S.G.A.; Rosito, L.S.; Brunetto, A.L. Ototoxicity From Cisplatin Therapy in Childhood Cancer. Journal of Pediatric Hematology/Oncology 2007, 29, 355–360. [Google Scholar] [CrossRef]
- Mitchell, E.P. Gastrointestinal Toxicity of Chemotherapeutic Agents. Seminars in Oncology 2006, 33, 106–120. [Google Scholar] [CrossRef]
- Boekelheide, K. Mechanisms of Toxic Damage to Spermatogenesis. JNCI Monographs 2005, 2005, 6–8. [Google Scholar] [CrossRef] [PubMed]
- Roness, H.; Kashi, O.; Meirow, D. Prevention of chemotherapy-induced ovarian damage. Fertility and Sterility 2016, 105, 20–29. [Google Scholar] [CrossRef]
- van den Boogaard, W.M.C.; Komninos, D.S.J.; Vermeij, W.P. Chemotherapy Side-Effects: Not All DNA Damage Is Equal. Cancers 2022, 14, 627. [Google Scholar] [CrossRef]
- Hoeben, A.; Joosten, E.A.J.; van den Beuken-van Everdingen, M.H.J. Personalized Medicine: Recent Progress in Cancer Therapy. Cancers 2021, 13, 242. [Google Scholar] [CrossRef] [PubMed]
- Rothzerg, E.; Xu, J.; Wood, D. Different Subtypes of Osteosarcoma: Histopathological Patterns and Clinical Behaviour. Journal of Molecular Pathology 2023, 4, 99–108. [Google Scholar] [CrossRef]
- Southekal, S.; Shakyawar, S.K.; Bajpai, P.; Elkholy, A.; Manne, U.; Mishra, N.K.; Guda, C. Molecular Subtyping and Survival Analysis of Osteosarcoma Reveals Prognostic Biomarkers and Key Canonical Pathways. Cancers (Basel) 2023, 15. [Google Scholar] [CrossRef] [PubMed]
- Jiang, Y.; Wang, J.; Sun, M.; Zuo, D.; Wang, H.; Shen, J.; Jiang, W.; Mu, H.; Ma, X.; Yin, F.; et al. Multi-omics analysis identifies osteosarcoma subtypes with distinct prognosis indicating stratified treatment. Nature Communications 2022, 13, 7207. [Google Scholar] [CrossRef]
- Wang, H.; Liu, H.; Wang, L.; Xu, S.; Pi, H.; Cheng, Z. Subtype Classification and Prognosis Signature Construction of Osteosarcoma Based on Cellular Senescence-Related Genes. Journal of Oncology 2022, 2022, 4421952. [Google Scholar] [CrossRef]
- Zhao, X.; Zhang, J.; Liu, J.; Chen, Q.; Cai, C.; Miao, X.; Wu, T.; Cheng, X. Identification of mitochondrial-related signature and molecular subtype for the prognosis of osteosarcoma. Aging (Albany NY) 2023, 15, 12794–12816. [Google Scholar] [CrossRef]
- Llaneza-Lago, S.; Fraser, W.D.; Green, D. Bayesian unsupervised clustering identifies clinically relevant osteosarcoma subtypes. Briefings in Bioinformatics 2024, 26. [Google Scholar] [CrossRef]
- Wan, Y.; Qu, N.; Yang, Y.; Ma, J.; Li, Z.; Zhang, Z. Identification of a 3-gene signature based on differentially expressed invasion genes related to cancer molecular subtypes to predict the prognosis of osteosarcoma patients. Bioengineered 2021, 12, 5916–5931. [Google Scholar] [CrossRef] [PubMed]
- Zheng, K.; Hou, Y.; Zhang, Y.; Wang, F.; Sun, A.; Yang, D. Molecular features and predictive models identify the most lethal subtype and a therapeutic target for osteosarcoma. Front Oncol 2023, 13, 1111570. [Google Scholar] [CrossRef] [PubMed]
- Team, R.C. R: a language and environment for statistical computing. Availabe online: https://www.R-project.
- Zhang, Y.; Parmigiani, G.; Johnson, W.E. ComBat-seq: batch effect adjustment for RNA-seq count data. NAR Genomics and Bioinformatics 2020, 2. [Google Scholar] [CrossRef]
- Gaujoux, R.; Seoighe, C. A flexible R package for nonnegative matrix factorization. BMC Bioinformatics 2010, 11, 367. [Google Scholar] [CrossRef]
- Yoshihara, K.; Shahmoradgoli, M.; Martínez, E.; Vegesna, R.; Kim, H.; Torres-Garcia, W.; Treviño, V.; Shen, H.; Laird, P.W.; Levine, D.A.; et al. Inferring tumour purity and stromal and immune cell admixture from expression data. Nat Commun 2013, 4, 2612. [Google Scholar] [CrossRef]
- Chen, B.; Khodadoust, M.S.; Liu, C.L.; Newman, A.M.; Alizadeh, A.A. Profiling Tumor Infiltrating Immune Cells with CIBERSORT. Methods Mol Biol 2018, 1711, 243–259. [Google Scholar] [CrossRef]
- Maeser, D.; Gruener, R.F.; Huang, R.S. oncoPredict: an R package for predicting in vivo or cancer patient drug response and biomarkers from cell line screening data. Briefings in Bioinformatics 2021, 22. [Google Scholar] [CrossRef] [PubMed]
- Therneau, T.M.; Grambsch, P.M. Modeling Survival Data: Extending the Cox Model; Springer New York: 2013.
- Therneau, T.M. A Package for Survival Analysis in R. Availabe online: https://CRAN.R-project.
- Kassambara A, K.M. , Biecek P survminer: Drawing Survival Curves using 'ggplot2'. Availabe online: https://CRAN.R-project.
- Wickham, H. ggplot2: Elegant Graphics for Data Analysis. Availabe online: https://ggplot2.tidyverse.
- Cox, D.R. Regression Models and Life-Tables. Journal of the Royal Statistical Society: Series B (Methodological) 1972, 34, 187–202. [Google Scholar] [CrossRef]
- Menyhart, O.; Kothalawala, W.J.; Győrffy, B. A gene set enrichment analysis for the cancer hallmarks. Journal of Pharmaceutical Analysis 2024. [Google Scholar] [CrossRef]
- Pingping, B.; Yuhong, Z.; Weiqi, L.; Chunxiao, W.; Chunfang, W.; Yuanjue, S.; Chenping, Z.; Jianru, X.; Jiade, L.; Lin, K.; et al. Incidence and Mortality of Sarcomas in Shanghai, China, During 2002–2014. Frontiers in Oncology 2019, 9. [Google Scholar] [CrossRef]
- Liao, S.; Gao, X.; Zhou, K.; Kang, Y.; Ji, L.; Zhong, X.; Lv, J. Exploration of metastasis-related signatures in osteosarcoma based on tumor microenvironment by integrated bioinformatic analysis. Heliyon 2025, 11, e41358. [Google Scholar] [CrossRef]
- Wang, H.; Li, J.; Li, X. Construction and validation of an oxidative-stress-related risk model for predicting the prognosis of osteosarcoma. Aging (Albany NY) 2023, 15, 4820–4843. [Google Scholar] [CrossRef] [PubMed]
- Gu, Z.; Zhou, Y.; Cao, C.; Wang, X.; Wu, L.; Ye, Z. TFAP2C-mediated LINC00922 signaling underpins doxorubicin-resistant osteosarcoma. Biomed Pharmacother 2020, 129, 110363. [Google Scholar] [CrossRef]
- Wippel, B.; Gundle, K.R.; Dang, T.; Paxton, J.; Bubalo, J.; Stork, L.; Fu, R.; Ryan, C.W.; Davis, L.E. Safety and efficacy of high-dose methotrexate for osteosarcoma in adolescents compared with young adults. Cancer Medicine 2019, 8, 111–116. [Google Scholar] [CrossRef]
- Yang, D.; Xu, T.; Fan, L.; Liu, K.; Li, G. microRNA-216b enhances cisplatin-induced apoptosis in osteosarcoma MG63 and SaOS-2 cells by binding to JMJD2C and regulating the HIF1α/HES1 signaling axis. J Exp Clin Cancer Res 2020, 39, 201. [Google Scholar] [CrossRef] [PubMed]
- Zhao, Z.; Jin, G.; Yao, K.; Liu, K.; Liu, F.; Chen, H.; Wang, K.; Gorja, D.R.; Reddy, K.; Bode, A.M.; et al. Aurora B kinase as a novel molecular target for inhibition the growth of osteosarcoma. Mol Carcinog 2019, 58, 1056–1067. [Google Scholar] [CrossRef] [PubMed]
- Wu, X.; Liu, J.-m.; Song, H.-h.; Yang, Q.-k.; Ying, H.; Tong, W.-l.; Zhou, Y.; Liu, Z.-l. Aurora-B knockdown inhibits osteosarcoma metastasis by inducing autophagy via the mTOR/ULK1 pathway. Cancer Cell International 2020, 20, 575. [Google Scholar] [CrossRef]
- Zhong, Y.; Liu, Y.; Tong, W.; Xie, X.; Nie, J.; Yang, F.; Liu, Z.; Liu, J. [High expression of AURKB promotes malignant phenotype of osteosarcoma cells by activating nuclear factor-κB signaling via DHX9]. Nan Fang Yi Ke Da Xue Xue Bao 2024, 44, 2308–2316. [Google Scholar] [CrossRef]
- B, D. DepMap 24Q4 Public. (: Availabe online.
- Inc., P. Inc., P. Doxorubicin Clinical Pharmacology. Availabe online: https://www.pfizermedicalinformation.com/doxorubicin/clinical-pharmacology (accessed on 06.02.). (accessed on 06.02.).
- Zheng, J.F.; Wang, H.D. 5-Fluorouracil concentration in blood, liver and tumor tissues and apoptosis of tumor cells after preoperative oral 5'-deoxy-5-fluorouridine in patients with hepatocellular carcinoma. World J Gastroenterol 2005, 11, 3944–3947. [Google Scholar] [CrossRef]
- Foucquier, J.; Guedj, M. Analysis of drug combinations: current methodological landscape. Pharmacol Res Perspect 2015, 3, e00149. [Google Scholar] [CrossRef]
- Song, Y.J.; Xu, Y.; Deng, C.; Zhu, X.; Fu, J.; Chen, H.; Lu, J.; Xu, H.; Song, G.; Tang, Q.; et al. Gene Expression Classifier Reveals Prognostic Osteosarcoma Microenvironment Molecular Subtypes. Front Immunol 2021, 12, 623762. [Google Scholar] [CrossRef]
- Guo, L.; Yan, T.; Guo, W.; Niu, J.; Wang, W.; Ren, T.; Huang, Y.; Xu, J.; Wang, B. Molecular subtypes of osteosarcoma classified by cancer stem cell related genes define immunological cell infiltration and patient survival. Front Immunol 2022, 13, 986785. [Google Scholar] [CrossRef] [PubMed]
- Shu, Y.; Peng, J.; Feng, Z.; Hu, K.; Li, T.; Zhu, P.; Cheng, T.; Hao, L. Osteosarcoma subtypes based on platelet-related genes and tumor microenvironment characteristics. Front Oncol 2022, 12, 941724. [Google Scholar] [CrossRef] [PubMed]
- Pan, R.; Pan, F.; Zeng, Z.; Lei, S.; Yang, Y.; Yang, Y.; Hu, C.; Chen, H.; Tian, X. A novel immune cell signature for predicting osteosarcoma prognosis and guiding therapy. Front Immunol 2022, 13, 1017120. [Google Scholar] [CrossRef]
- Zhang, W.B.; Han, F.M.; Liu, L.M.; Jin, H.B.; Yuan, X.Y.; Shang, H.S. Characterizing the critical role of metabolism in osteosarcoma based on establishing novel molecular subtypes. Eur Rev Med Pharmacol Sci 2022, 26, 2926–2943. [Google Scholar] [CrossRef] [PubMed]
- Liu, Z.; Zhang, L.; Zhong, Y. Characterization of osteosarcoma subtypes mediated by macrophage-related genes and creation and validation of a risk score system to quantitatively assess the prognosis of osteosarcoma and reflect the tumor microenvironment. Ann Transl Med 2022, 10, 1318. [Google Scholar] [CrossRef]
- Zheng, D.; Yang, K.; Chen, X.; Li, Y.; Chen, Y. Analysis of Immune-Stromal Score-Based Gene Signature and Molecular Subtypes in Osteosarcoma: Implications for Prognosis and Tumor Immune Microenvironment. Front Genet 2021, 12, 699385. [Google Scholar] [CrossRef]
- Zhang, J.; Liu, J.; Ding, R.; Miao, X.; Deng, J.; Zhao, X.; Wu, T.; Cheng, X. Molecular characterization of Golgi apparatus-related genes indicates prognosis and immune infiltration in osteosarcoma. Aging (Albany NY) 2024, 16, 5249–5263. [Google Scholar] [CrossRef]
- Wu, W.-Q.; Zou, C.-D.; Wu, D.; Fu, H.-X.; Wang, X.-D.; Yao, F. Construction of molecular subtype model of osteosarcoma based on endoplasmic reticulum stress and tumor metastasis-related genes. Heliyon 2024, 10, e25691. [Google Scholar] [CrossRef]
- Dong, C.; Sun, Y.; Zhang, Y.; Qin, B.; Lei, T. Construction of Molecular Subtype and Prognosis Prediction Model of Osteosarcoma Based on Aging-Related Genes. J Oncol 2022, 2022, 8177948. [Google Scholar] [CrossRef]
- Hong, X.; Fu, R. Construction of a 5-gene prognostic signature based on oxidative stress related genes for predicting prognosis in osteosarcoma. PLoS One 2023, 18, e0295364. [Google Scholar] [CrossRef] [PubMed]
- Sneeggen, M.; Guadagno, N.A.; Progida, C. Intracellular Transport in Cancer Metabolic Reprogramming. Frontiers in Cell and Developmental Biology 2020, 8. [Google Scholar] [CrossRef] [PubMed]
- Pompili, S.; Vetuschi, A.; Sferra, R.; Cappariello, A. Extracellular Vesicles and Resistance to Anticancer Drugs: A Tumor Skeleton Key for Unhinging Chemotherapies. Frontiers in Oncology 2022, 12. [Google Scholar] [CrossRef]
- Fu, H.; Wu, Y.; Chen, J.; Hu, X.; Wang, X.; Xu, G. Exosomes and osteosarcoma drug resistance. Front Oncol 2023, 13, 1133726. [Google Scholar] [CrossRef]
- Pan, Y.; Lin, Y.; Mi, C. Cisplatin-resistant osteosarcoma cell-derived exosomes confer cisplatin resistance to recipient cells in an exosomal circ_103801-dependent manner. Cell Biol Int 2021, 45, 858–868. [Google Scholar] [CrossRef]
- Deng, C.; Xu, Y.; Fu, J.; Zhu, X.; Chen, H.; Xu, H.; Wang, G.; Song, Y.; Song, G.; Lu, J.; et al. Reprograming the tumor immunologic microenvironment using neoadjuvant chemotherapy in osteosarcoma. Cancer Sci 2020, 111, 1899–1909. [Google Scholar] [CrossRef]
- Yang, X.; Zhang, W.; Xu, P. NK cell and macrophages confer prognosis and reflect immune status in osteosarcoma. J Cell Biochem 2019, 120, 8792–8797. [Google Scholar] [CrossRef] [PubMed]
- Gutiérrez-Melo, N.; Baumjohann, D. T follicular helper cells in cancer. Trends in Cancer 2023, 9, 309–325. [Google Scholar] [CrossRef]
- Lu, J.; Kang, X.; Wang, Z.; Zhao, G.; Jiang, B. The activity level of follicular helper T cells in the peripheral blood of osteosarcoma patients is associated with poor prognosis. Bioengineered 2022, 13, 3751–3759. [Google Scholar] [CrossRef]
- Jin, Z.; Peng, F.; Zhang, C.; Tao, S.; Xu, D.; Zhu, Z. Expression, regulating mechanism and therapeutic target of KIF20A in multiple cancer. Heliyon 2023, 9, e13195. [Google Scholar] [CrossRef]
- Zhu, Z.; Jin, Z.; Zhang, H.; Zhang, M.; Sun, D. Knockdown of <i>Kif20a</i> inhibits growth of tumors in soft tissue sarcoma <i>in vitro</i> and <i>in vivo</i>. Journal of Cancer 2020, 11, 5088–5098. [Google Scholar] [CrossRef] [PubMed]
- Li, J.; Bai, Y.; Zhang, H.; Chen, T.; Shang, G. Single-cell RNA sequencing reveals the communications between tumor microenvironment components and tumor metastasis in osteosarcoma. Frontiers in Immunology 2024, 15. [Google Scholar] [CrossRef] [PubMed]
- Groth-Pedersen, L.; Aits, S.; Corcelle-Termeau, E.; Petersen, N.H.T.; Nylandsted, J.; Jäättelä, M. Identification of Cytoskeleton-Associated Proteins Essential for Lysosomal Stability and Survival of Human Cancer Cells. PLOS ONE 2012, 7, e45381. [Google Scholar] [CrossRef] [PubMed]
- Shi, Y.; Yue, X.; Luo, Q. Metabolic reprogramming in osteosarcoma. Pediatric Discovery 2023, 1, e18. [Google Scholar] [CrossRef]
- Ducat, D.; Zheng, Y. Aurora kinases in spindle assembly and chromosome segregation. Exp Cell Res 2004, 301, 60–67. [Google Scholar] [CrossRef]
- Yang, Y.; Li, D.; Liu, Z.; Zhou, K.; Li, W.; Yang, Y.; Sun, R.; Li, Y. AURKB affects the proliferation of clear cell renal cell carcinoma by regulating fatty acid metabolism. Discover Oncology 2025, 16, 91. [Google Scholar] [CrossRef]
- Aggarwal, V.; Tuli, H.S.; Thakral, F.; Singhal, P.; Aggarwal, D.; Srivastava, S.; Pandey, A.; Sak, K.; Varol, M.; Khan, M.A.; et al. Molecular mechanisms of action of hesperidin in cancer: Recent trends and advancements. Exp Biol Med (Maywood) 2020, 245, 486–497. [Google Scholar] [CrossRef]
- Rahmani, A.H.; Babiker, A.Y.; Anwar, S. Hesperidin, a Bioflavonoid in Cancer Therapy: A Review for a Mechanism of Action through the Modulation of Cell Signaling Pathways. Molecules 2023, 28, 5152. [Google Scholar] [CrossRef]
- Shakiba, E.; Bazi, A.; Ghasemi, H.; Eshaghi-Gorji, R.; Mehdipour, S.A.; Nikfar, B.; Rashidi, M.; Mirzaei, S. Hesperidin suppressed metastasis, angiogenesis and tumour growth in Balb/c mice model of breast cancer. J Cell Mol Med 2023, 27, 2756–2769. [Google Scholar] [CrossRef]
- Kong, W.; Ling, X.; Chen, Y.; Wu, X.; Zhao, Z.; Wang, W.; Wang, S.; Lai, G.; Yu, Z. Hesperetin reverses P-glycoprotein-mediated cisplatin resistance in DDP-resistant human lung cancer cells via modulation of the nuclear factor-κB signaling pathway. Int J Mol Med 2020, 45, 1213–1224. [Google Scholar] [CrossRef]
- Coutinho, L.; Oliveira, H.; Pacheco, A.R.; Almeida, L.; Pimentel, F.; Santos, C.; Ferreira de Oliveira, J.M.P. Hesperetin-etoposide combinations induce cytotoxicity in U2OS cells: Implications on therapeutic developments for osteosarcoma. DNA Repair 2017, 50, 36–42. [Google Scholar] [CrossRef] [PubMed]
- Wang, S.; Li, Z.; Liu, W.; Wei, G.; Yu, N.; Ji, G. Neohesperidin Induces Cell Cycle Arrest, Apoptosis, and Autophagy via the ROS/JNK Signaling Pathway in Human Osteosarcoma Cells. The American Journal of Chinese Medicine 2021, 49, 1251–1274. [Google Scholar] [CrossRef] [PubMed]
Figure 1.
NMF analysis and functional enrichment differences between OS subtypes. A) Cophenetic correlation coefficients were calculated for rank = 2-8. B) NMF heatmap for rank = 3. C-H) Gene ontology and tumor hallmarks enrichment of OS tumor subtypes S1 (C, D), S2 (E, F), and S3 (G, H). In the cancer hallmark plots, colored slices represent significantly enriched hallmarks (p adj < 0.05), with larger slices having more significant enrichment. Dots indicate the number of genes within each gene set; grey slices represent non-significant enrichment. The distance of the dots from the central circle is proportional to the number of genes upregulated in the defined gene set. OS – Osteosarcoma; NMF - Non-negative matrix factorization.
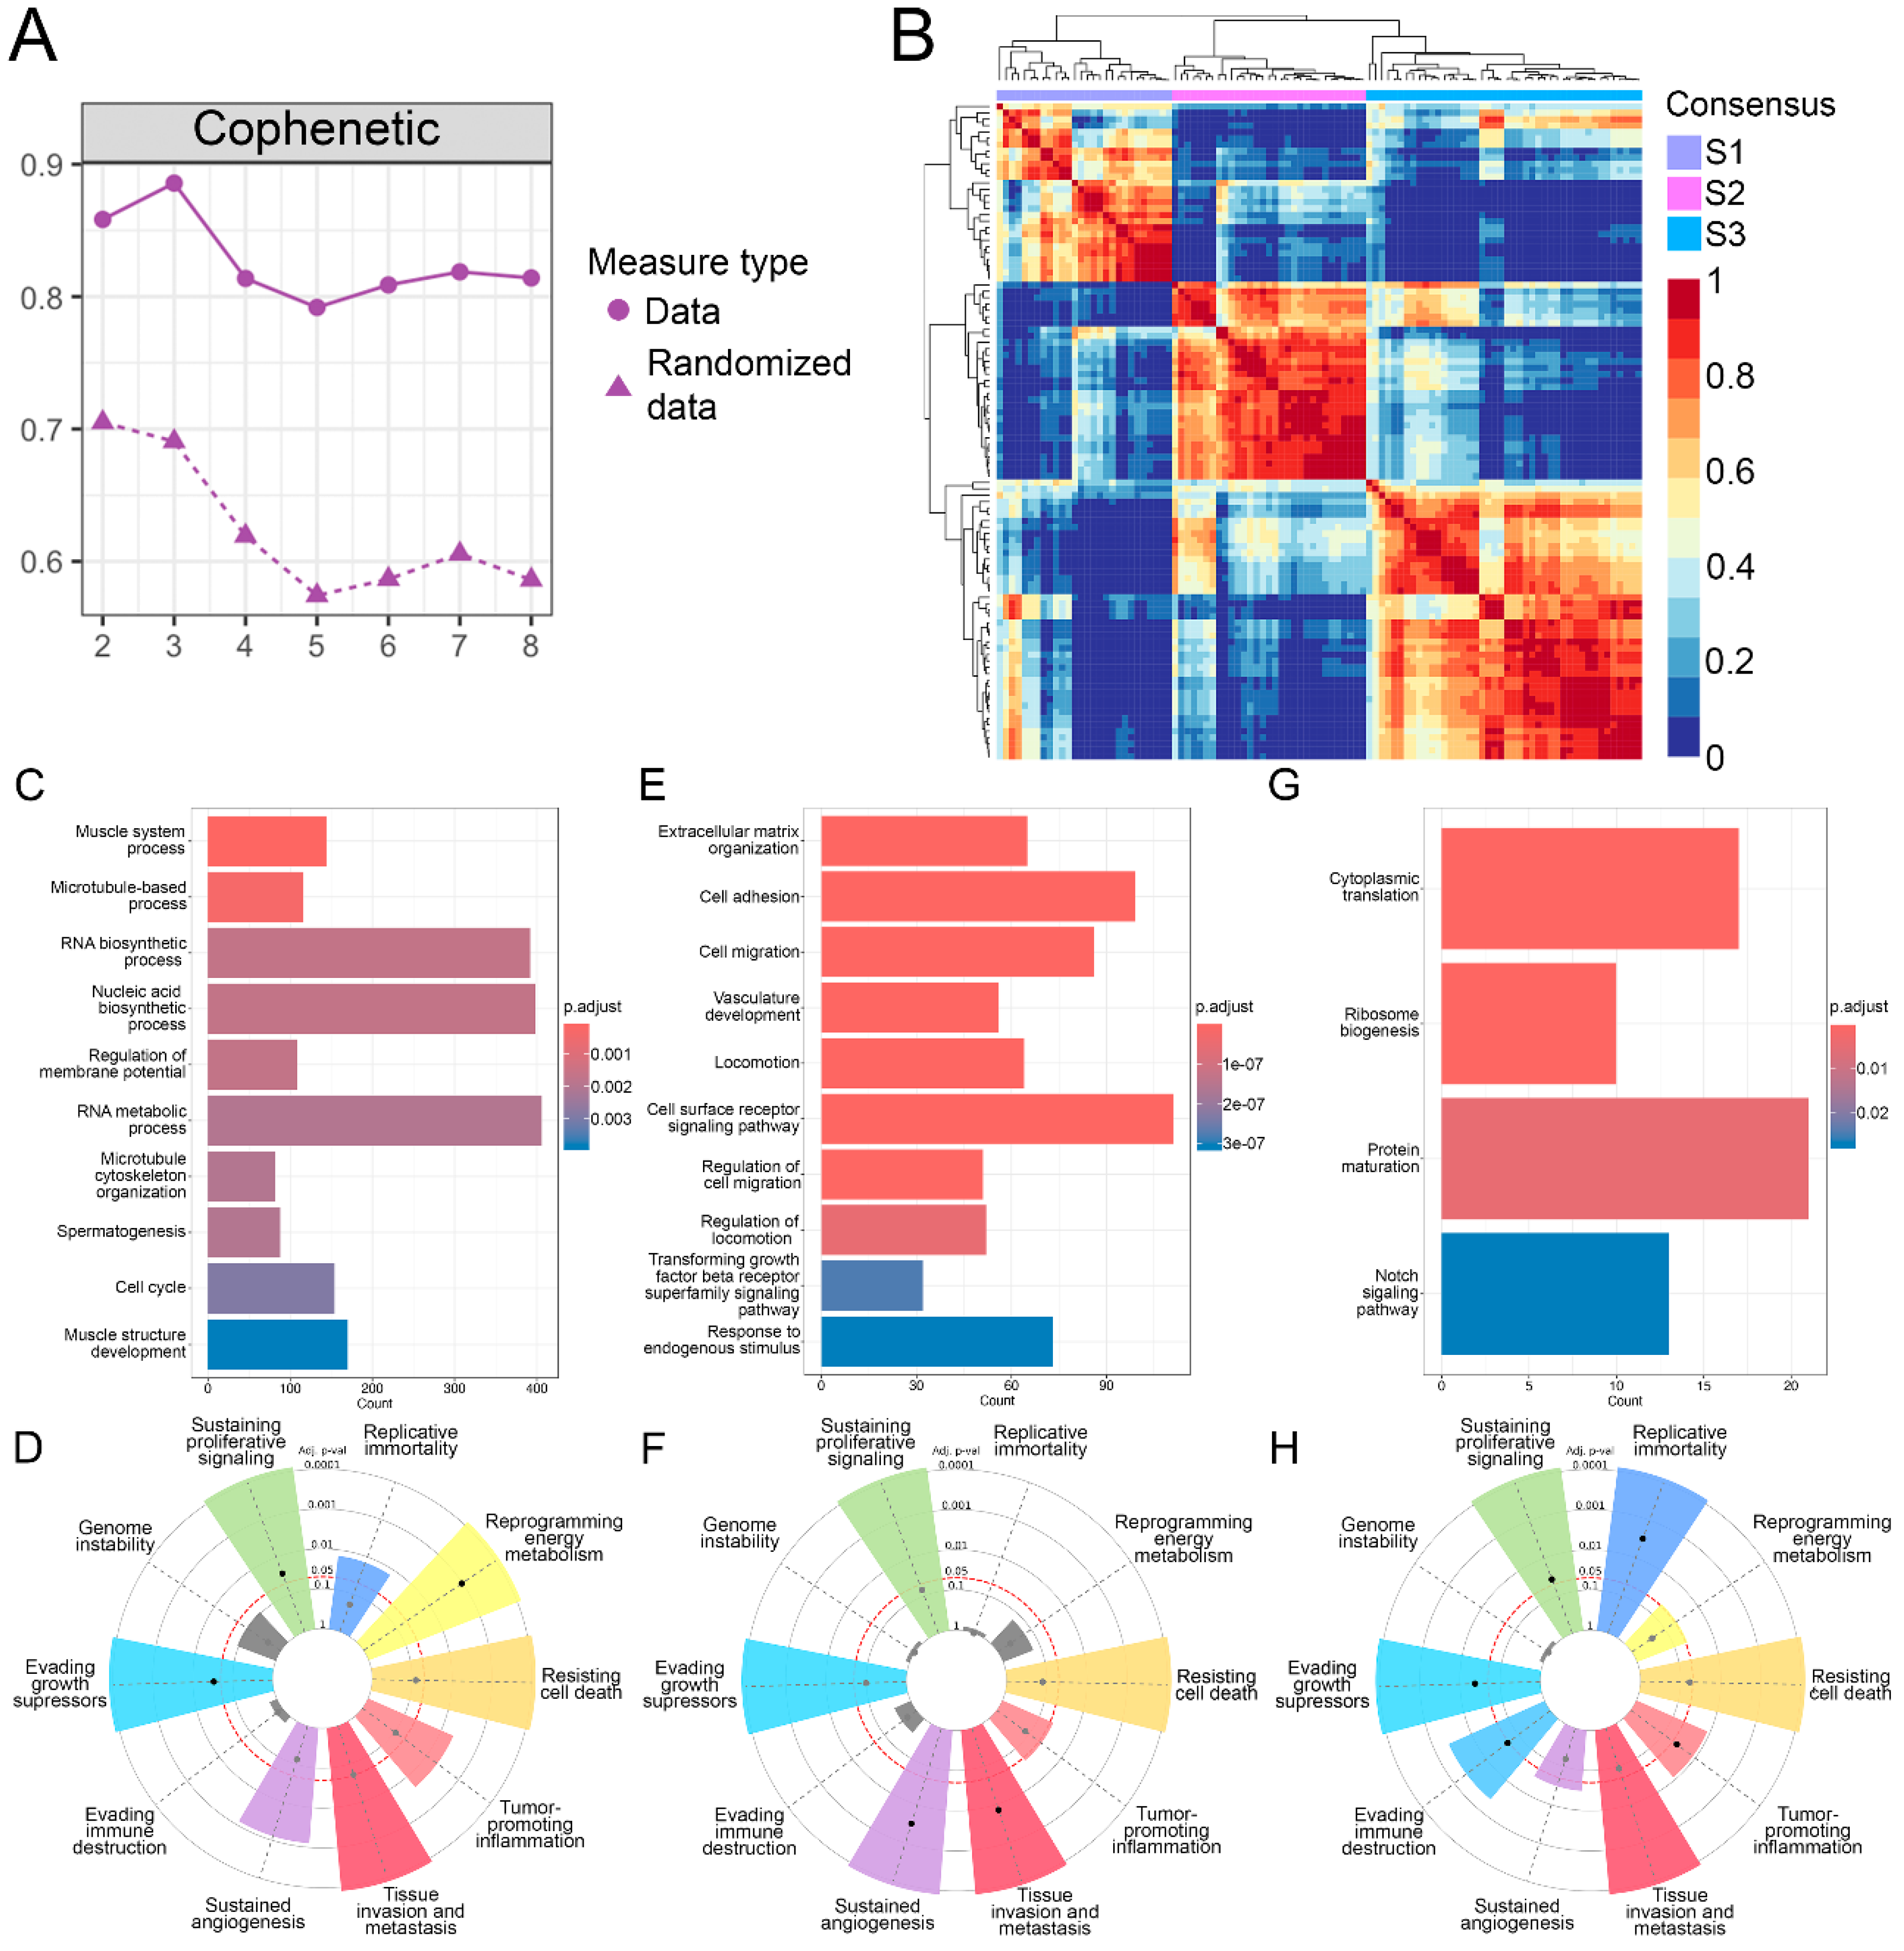
Figure 2.
Coexpressed module hub genes and module biological process enrichment. A) S1-correlated pink module B) S2-correlated darkred and grey60 modules C) S3-correlated salmon and yellow modules.
Figure 2.
Coexpressed module hub genes and module biological process enrichment. A) S1-correlated pink module B) S2-correlated darkred and grey60 modules C) S3-correlated salmon and yellow modules.
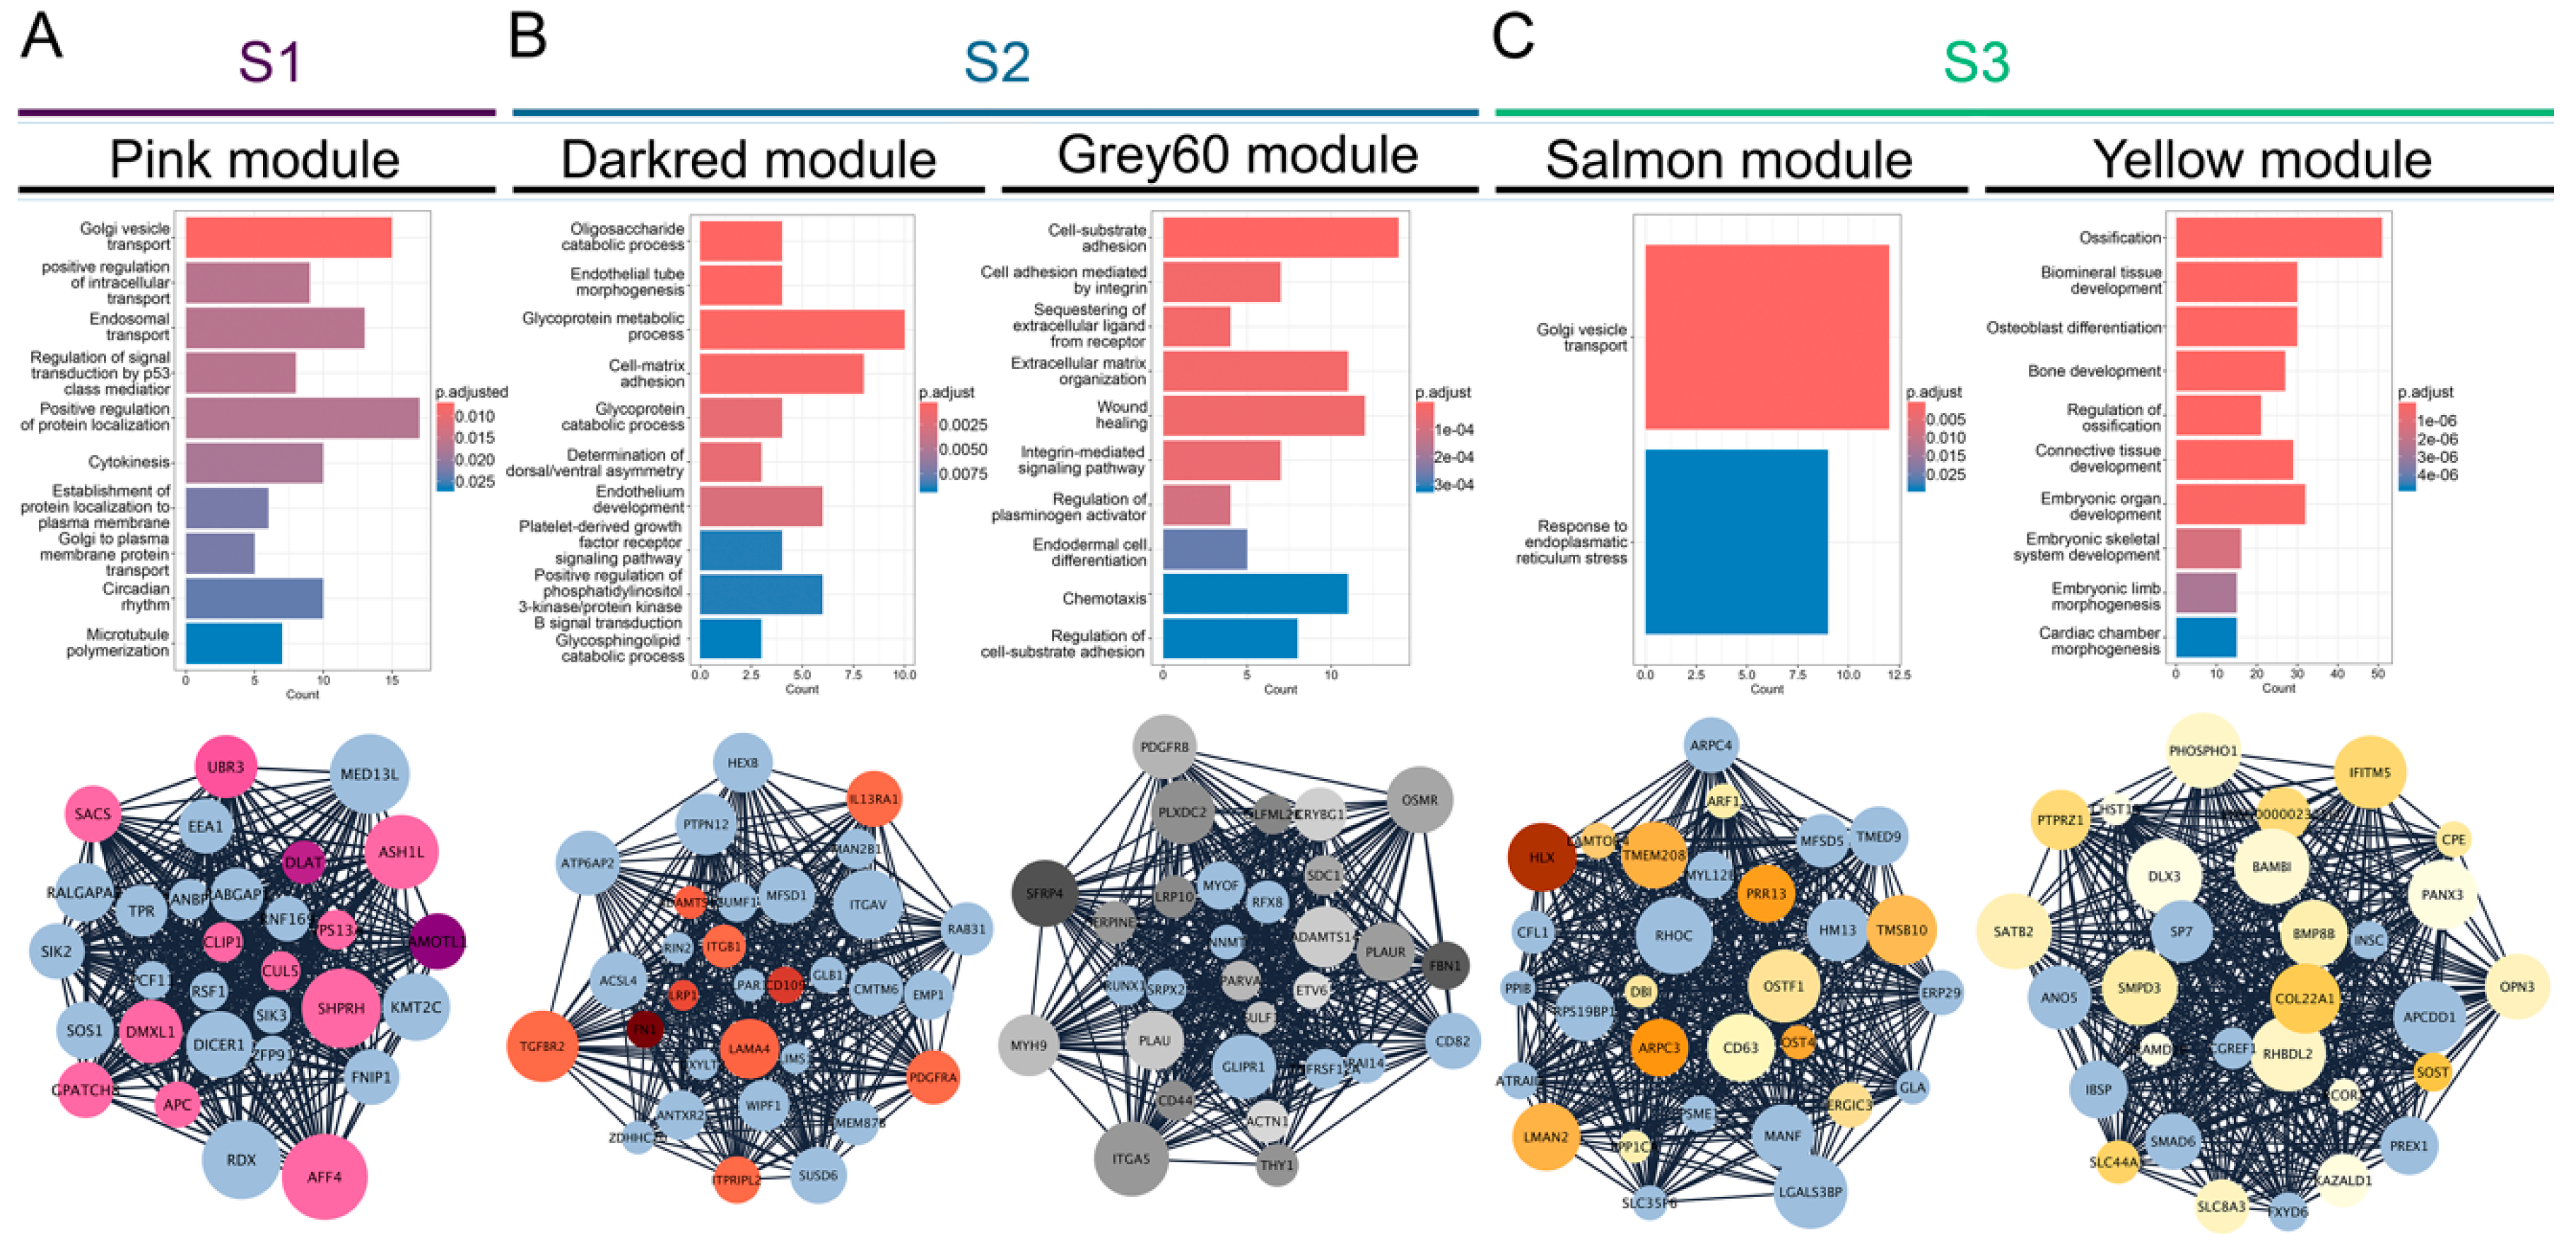
Figure 3.
Tumor microenvironment and tumor infiltrating immune cells. A) Estimate, immune and stromal scores of each subtype predicted by ESTIMATE algorithm. B) Fractions of 22 TIICs in each identified OS subtype. Statistically significant difference is shown as: *p-value < 0.05, **p-value < 0.01, ***p-value < 0.001. TME – Tumor microenvironment; TIICs – Tumor infiltrating immune cells; OS – Osteosarcoma.
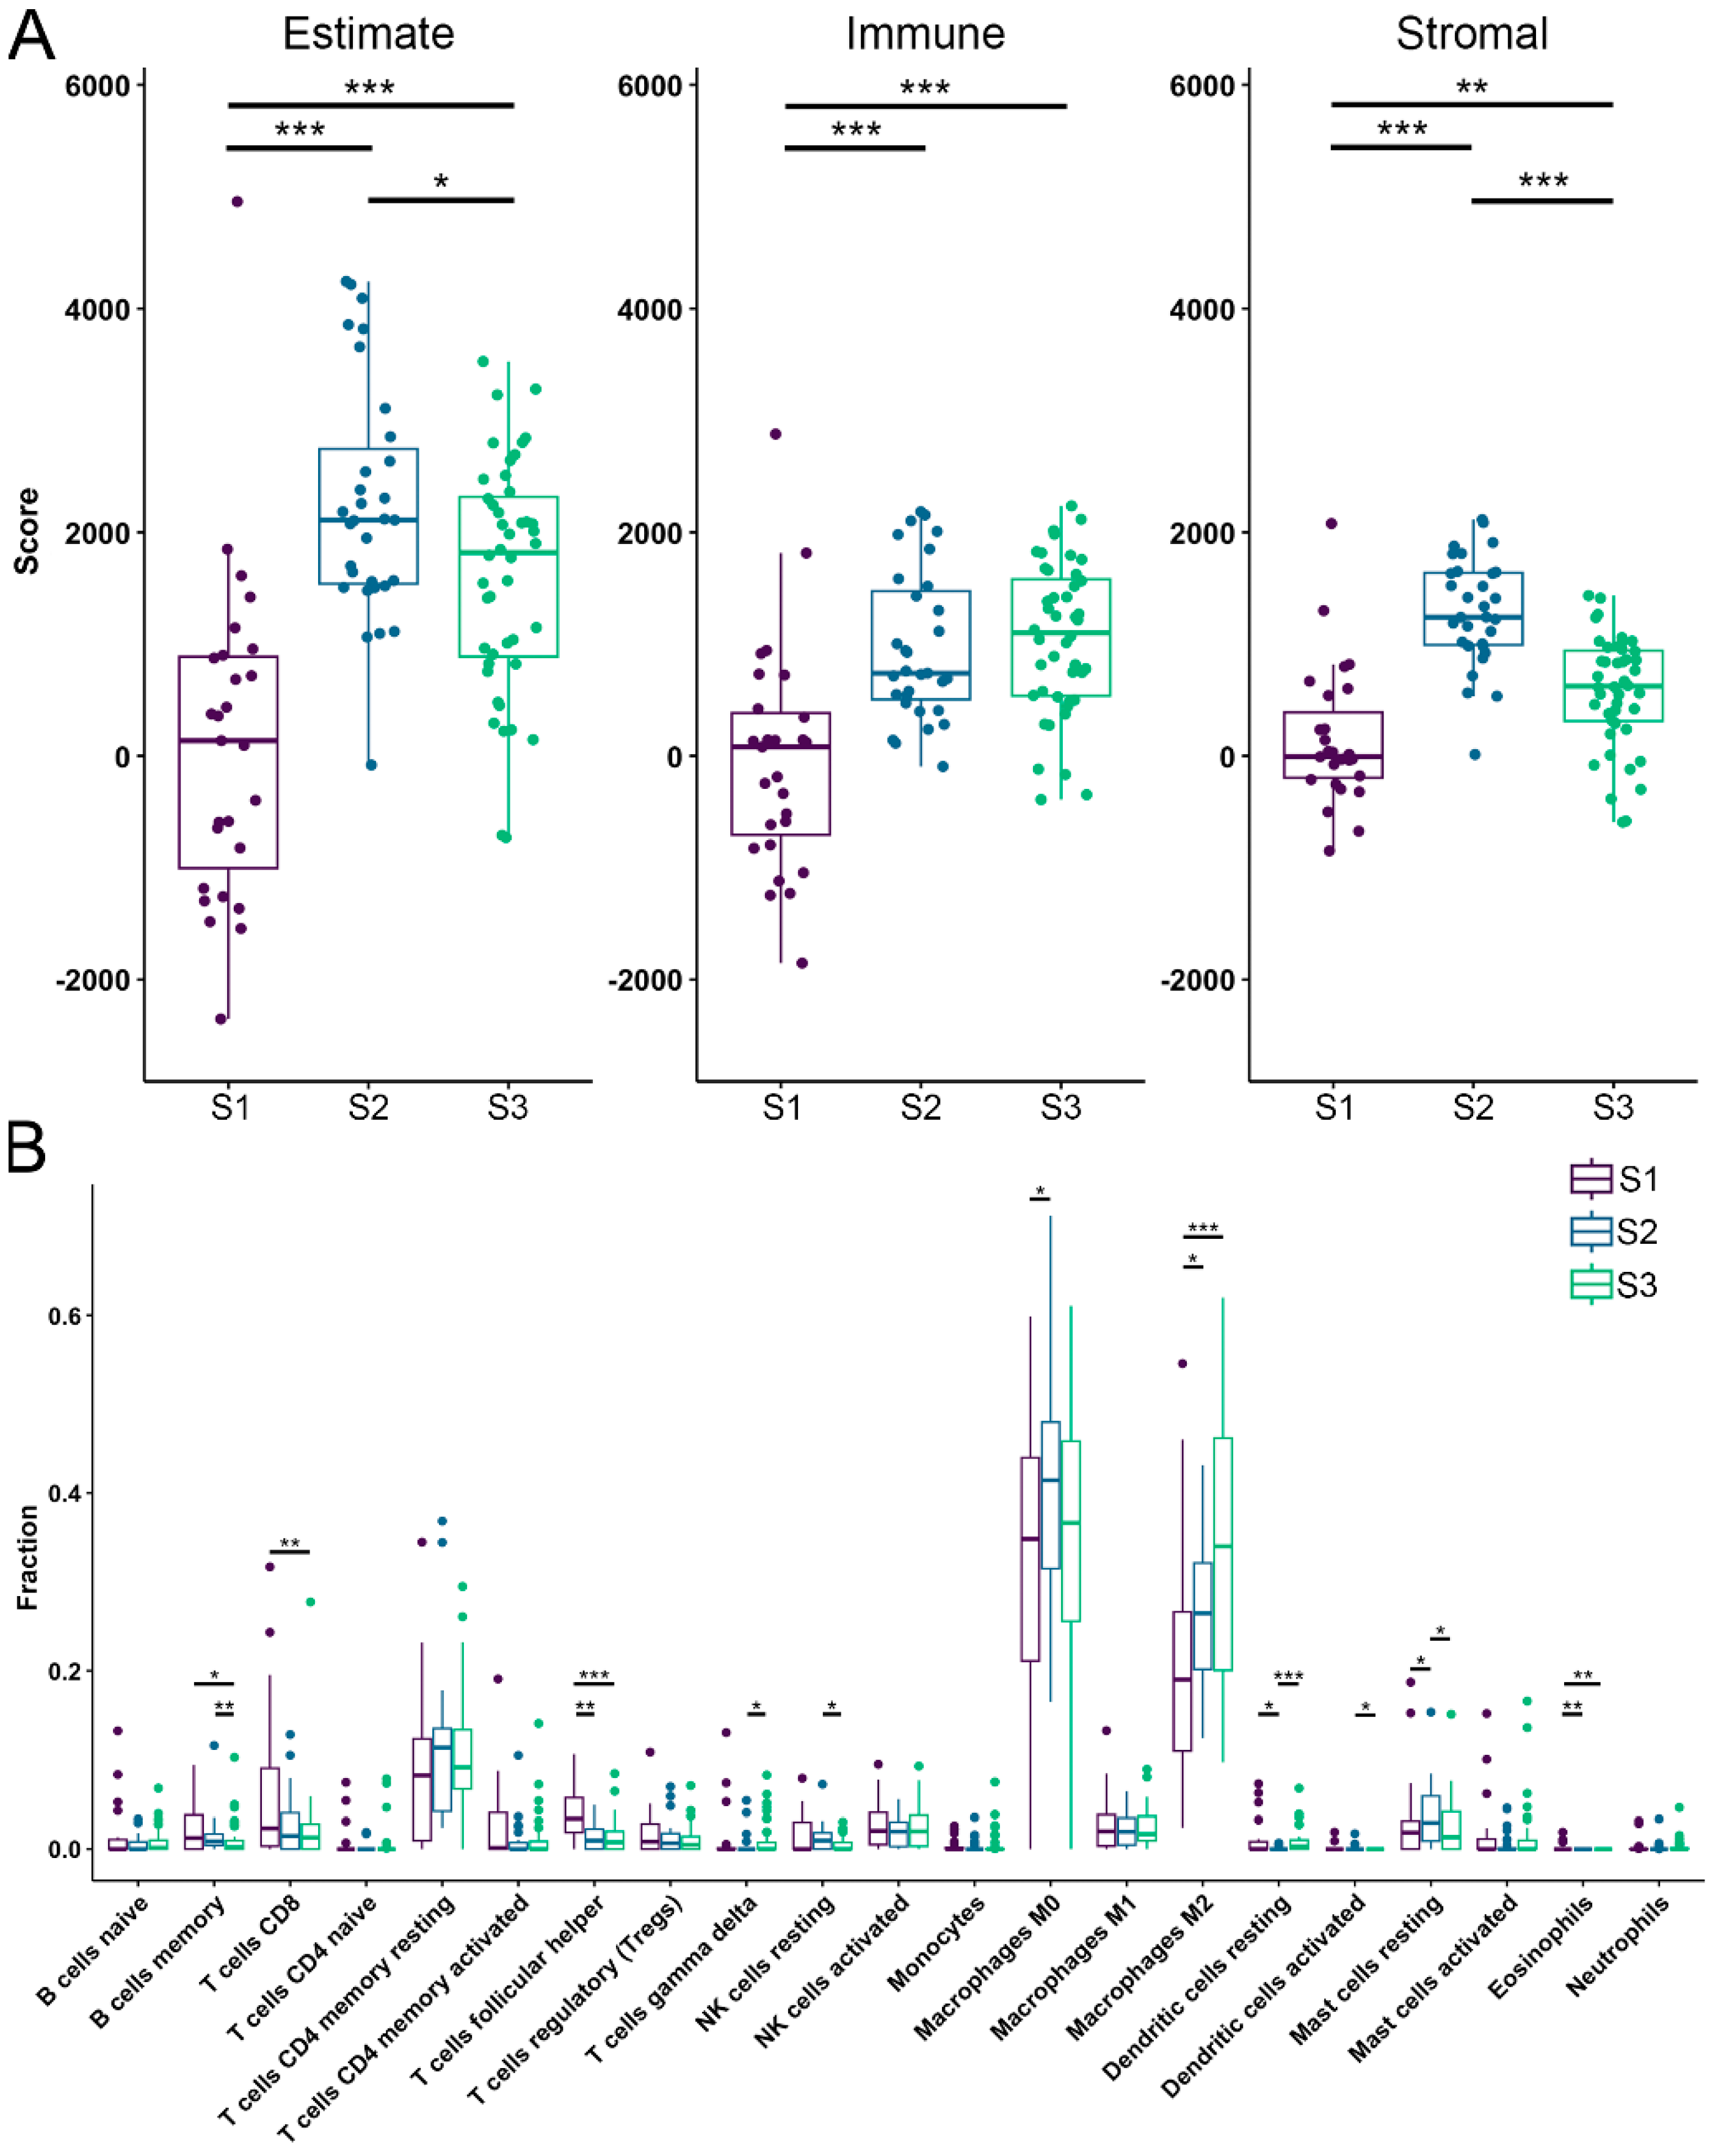
Figure 4.
Drug susceptibility analysis of OS subtypes to eight commonly used chemotherapeutics. A) Methotreaxate, B) Etoposide, C) Doxorubicin, D) Gemcitabaine, E) Cisplatin, F) Epirubicin, G) Cyclophosphoamide and H) 5-fluorouracil were the drugs used to test for drug sensitivity. Statistically significant difference is shown as: *p-value < 0.05, **p-value < 0.01, ***p-value < 0.001. OS – Osteosarcoma.
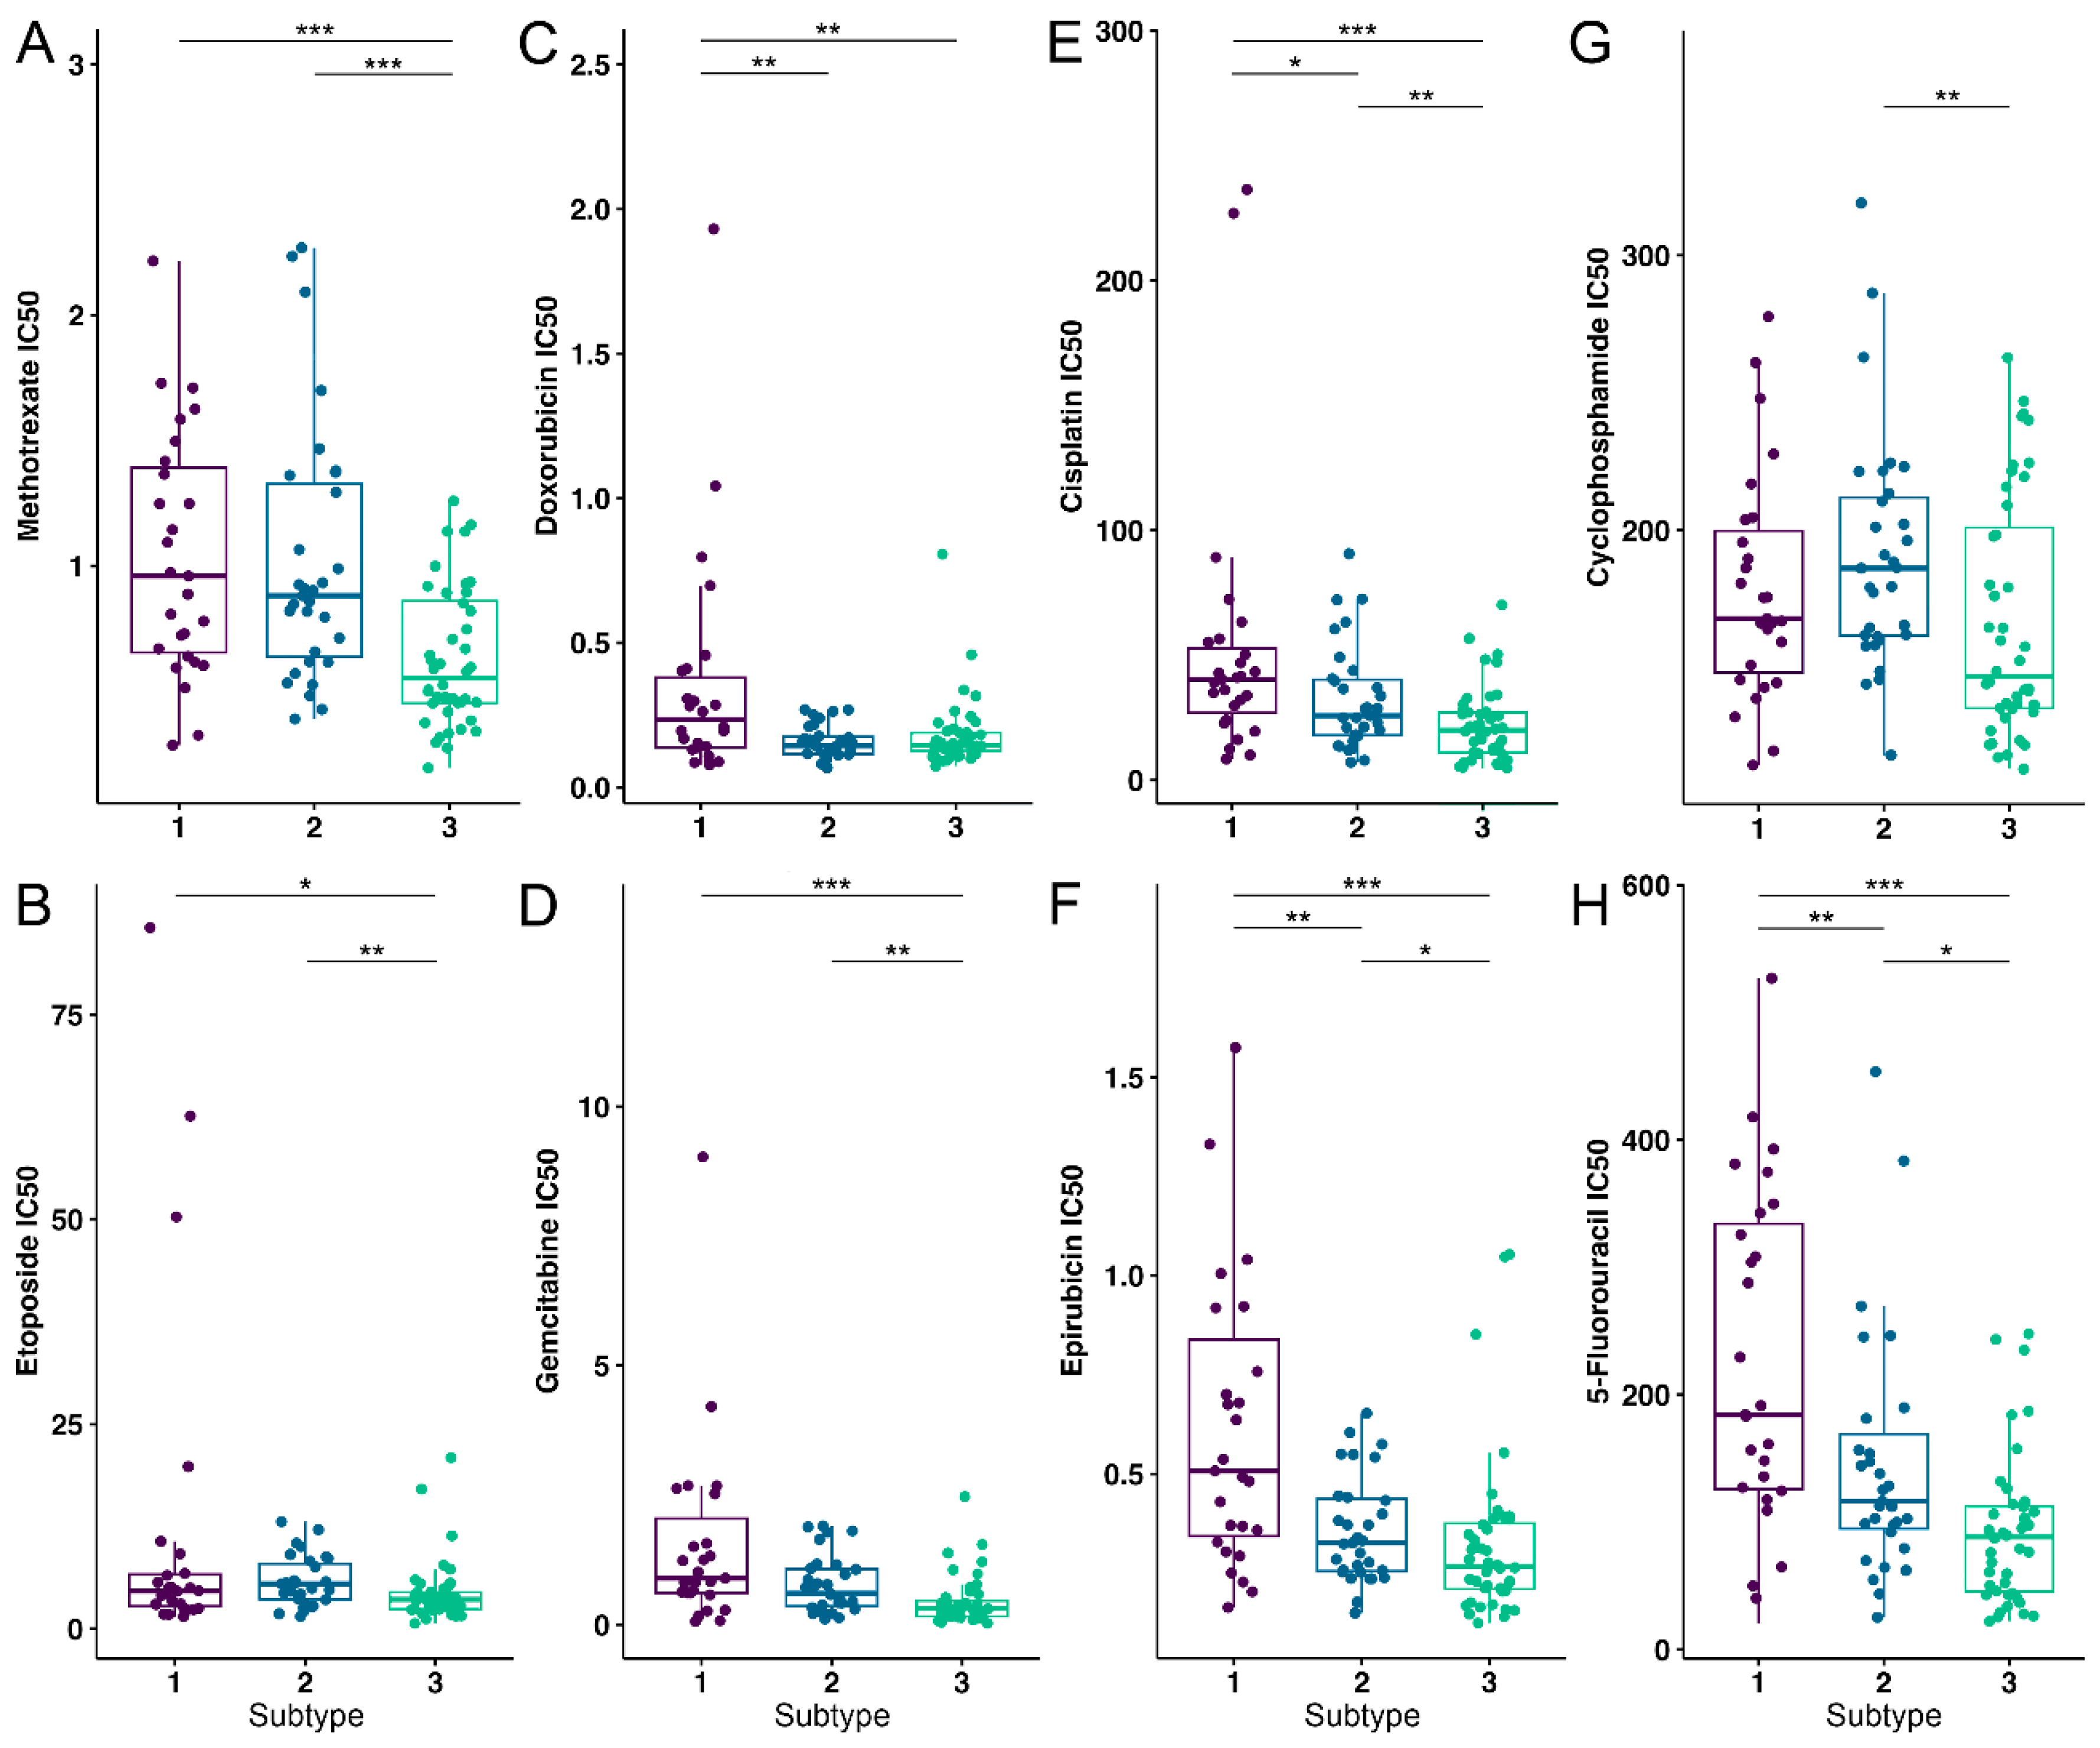
Figure 5.
Significant S1 cluster identification and functional enrichment. A, B) Most significant MCODE cluster and the corresponding biological process functional enrichment in S1. C, D) Survival probability association plot with KIF20A in S1. Within the identified clusters, genes have been color-coded based on Log2 fold change with increased color density representing higher fold change values. Nodes of the identified drugs are blue and connect to predicted genes via edges. The top 10% based on degree have green gene labels.
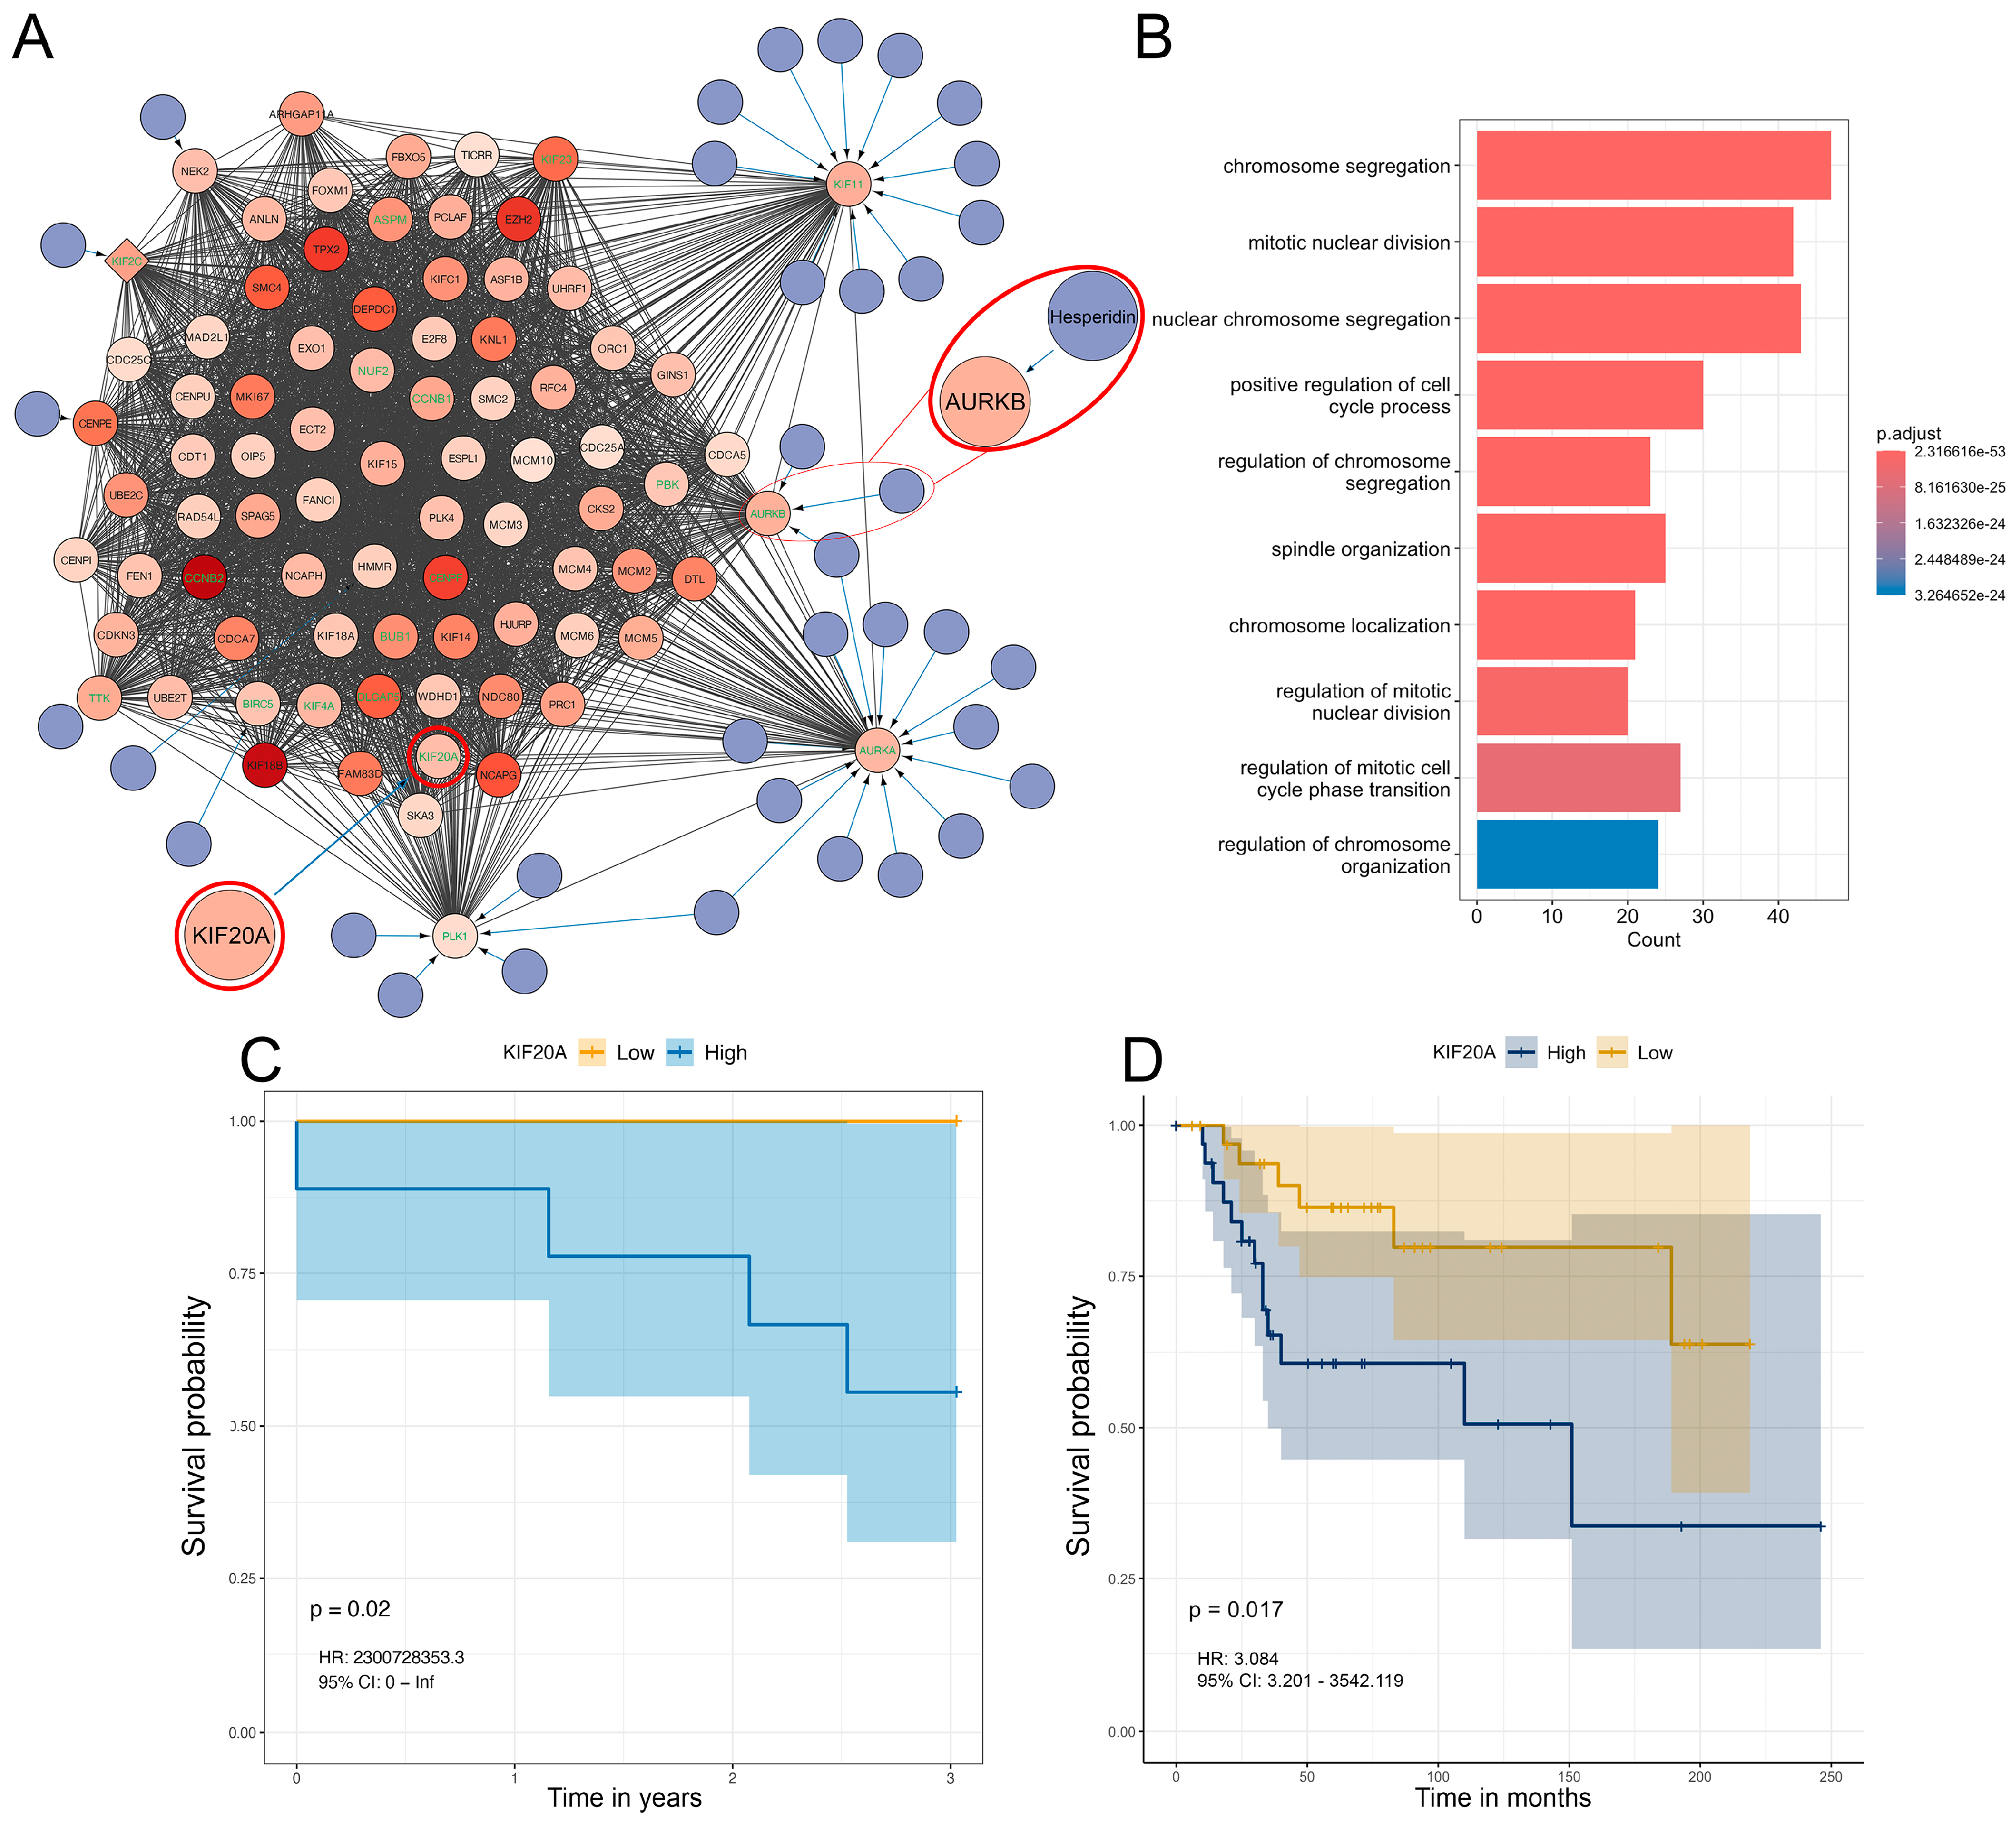
Figure 6.
Clustering validation, OS cell line groups correlation to identified patient subtypes and hesperidin treatment of SAOS-2 A) NMF cell line heatmap for k = 3, B) Correlation heatmap between cell line groups and patient subtypes, C) AURKB expression in SAOS-2 compared to hFOB1.19 from GSE197158 dataset. D) SAOS-2 cell viability after 24h of hesperidin treatment. E) SAOS-2 cells viability after combined treatment of chemotherapeutics with increasing doses of hesperidin for 24h. Statistically significant differences are shown as: *p-value < 0.05, **p-value < 0.01, ***p-value < 0.001. Correlation heatmaps show positive correlations between groups and subtypes as green and negative correlations as yellow with color density being proportional to correlation values. OS – Osteosarcoma.
Disclaimer/Publisher’s Note: The statements, opinions and data contained in all publications are solely those of the individual author(s) and contributor(s) and not of MDPI and/or the editor(s). MDPI and/or the editor(s) disclaim responsibility for any injury to people or property resulting from any ideas, methods, instructions or products referred to in the content. |
© 2025 by the authors. Licensee MDPI, Basel, Switzerland. This article is an open access article distributed under the terms and conditions of the Creative Commons Attribution (CC BY) license (http://creativecommons.org/licenses/by/4.0/).
Copyright: This open access article is published under a Creative Commons CC BY 4.0 license, which permit the free download, distribution, and reuse, provided that the author and preprint are cited in any reuse.


