
Submitted:
13 March 2025
Posted:
14 March 2025
You are already at the latest version
Abstract
After developing the experimental database of RC column specimens retrofitted with stiff type polyurea (STPU), this study implemented STPU in finite element (FE) modeling. The numerical analysis aimed to evaluate seismic performance factors by establishing a structural analysis model based on the experimental data. The model was calibrated and validated against experimental results, showing consistency in maximum displacement and strain within acceptable deviations. Key findings indicate that the dissipation energy and crack propagation were significantly reduced in reinforced specimens compared to unreinforced ones, demonstrating the effectiveness of STPU and glass fiber-reinforced polyurea (GFPU). The FE model further confirmed that circular specimens exhibited superior reinforcement effects compared to rectangular specimens due to their continuous surface geometry. These results enhance the understanding of STPU's seismic reinforcement capabilities and provide a foundation for its practical application. The study results are discussed in detail in the paper.
Keywords:
RC column
; Glass Fiber-Reinforced Polyurea (GFPU)
; Stiff Type Polyurea (STPU)
; FE modelling
; seismic reinforcement
1. Introduction
Recently, magnitude of 2.0 or more earthquakes on the Richter scale have occurred in South Korea, including the Gyeong-Ju earthquake (September 12, 2016) and Po-Hang magnitude of 5.4 Richter scale earthquake (November 15, 2017), the largest observed earthquakes in South Korea [1,2]. Based on the Earthquake and Disaster Countermeasures Act enacted in 2009, the 2017 earthquake-resistance design standards were revised in South Korea, and their application to all structures was announced. However, the social infrastructure structures built before the enforcement decree were still vulnerable to seismic load. The necessity for maintenance and reinforcement of earthquake-vulnerable RC structures is increasing [3]. The seismic resistance effect of newly developed stiff-type polyurea (STPU) for the maintenance and reinforcement of RC structures was verified through experiments [4].
Research on the reinforcement performance evaluation of structures enhanced with Polyurea has been conducted by on experiments and FEM simulations. Samiee et al. (2013) examined the explosive load resistance of a steel plate reinforced with PU using the LS-DYNA explicit finite element analysis program [5]. When the coating thickness of PU exceeded 2 mm, better reinforcing effects were achieved when PU reinforcement was applied to the other side of a steel plate subjected to explosive loads. Parniani and Toutanji (2015) performed a flexural load test and evaluated the fatigue performance of PU-coated RC beams. In the flexural load test, the PU 5 mm-coated RC beam (P-B-M-2), PU 2.5 mm-coated RC beam (P-B-M-1), and the uncoated RC beam (C-M-B) demonstrated superior performance in that order, validating the reinforcing effect of PU for flexural loads. The difference in fatigue performance between PU with thicknesses of 2.5 mm and 5 mm was not significant, indicating that both thicknesses have almost identical behavior under fatigue load conditions [6]. Wang et al. (2017) evaluated the blast resistance of masonry walls reinforced with PU. PU reinforcement enhanced blast resistance by 4.5–11 times [7]. Song et al. (2020) reinforced RC columns using glass fiber-reinforced polyurea (GFRPU) and measured the shear strength under quasistatic cyclic loading. The shear strength of the GFRPU-reinforced columns was approximately 8.7% greater than that of the unreinforced RC columns [8].
In this paper, FE model is constructed for RC columns reinforced with STPU using the experimental data from Lee et al. (2022) paper. Building FE modelling in dynamic inelastic analysis is an important tool for the evaluation of the performance of RC structures under strong earthquakes. FE modelling. FE analysis allow for reducing the cost associated with experiments and enables the identification of other factors that may not have been observable during experimentation [9]. In this paper, 3D FE model was constructed using ABAQUS, and calibration of the FE model was conducted using the experimental data from Lee et al. (2022) paper. With the calibrated model, the extent of damage for each specimen was assessed to compare and analyze the reinforcement performance under seismic load.
Lee et al. (2022) presented the seismic performance evaluation of RC column retrofitted by STPU through pseudo-dynamic and shaking table tests. In this paper, the seismic reinforcement performance of STPU was evaluated by developing a 3D FE model based on the experimental results. All the notations from the Lee et al. (2022) paper will be retained.
2. FE Modelling
In order to evaluate the strengthening effect and stiffness enhancement from the application of STPU, Implicit ABAQUS (2020) commercial FE program was used to perform dynamic simulations due to its high convergence rate and solution accuracy. Due to extreme nonlinearity of the structural behavior under dynamic loading, element size and time increment for the simulations are refined to achieve stable convergence and accurate solutions [10,11].
2.1. Analytical Procedure
The material properties, specimen dimensions, and test setup conditions used in the dynamic simulations are as same as those from the experiments. As same as the test specimens, the prestressing force applied to the column is modeled by implementing an expansion coefficient of 1×10⁻⁵ followed by prestressing force of 3.5 tons (e.g., using pre-defined field option) to the truss element placed in the center of the column in the longitudinal direction before the application of seismic loading. After the prestressing condition is implemented, the earthquake load of El Centro ground acceleration as a function of time is applied.
For an element type, incompressible and hyper-elastic model type of C3D8RH element of 3D, 8 nodes brick type with reduced integration and hourglass control is used, which is given in ABAQUS Standard library [12,13]. For GFRP strengthening plate, an element type S4R (4 node shell element) with reduced integration and hourglass control is used, which is also given in the library. In order to eliminate shear locking behavior from occurring during the seismic simulations, 3D quadrilateral element with 8 nodes(C3D8R) and 4 nodes(C3D4) are applied together. Figure 1 and Figure 2 show the rectangular and circular cross-section column models and corresponding boundary conditions, respectively used for the dynamic simulations.
2.2. Material Models
2.2.1. Concrete Damage Plasticity
The concrete constitutive model used for the simulation was Concrete Damage Plasticity (CDP). The parameters that need to be defined in CDP material model are dilation angle (), flow potential eccentricity (), biaxial/uniaxial compression plastic strain ratio (), invariant stress ratio (), and viscosity parameter (), where all of the parametric values used in the simulations are tabulated in Table 1. In CDP model, the damage state of the element cannot be discretely shown at the integration points. Therefore, the damage state or crack pattern of the simulation results are shown by using equivalent plastic strain (PEEQ) obtained as output. PEEQ results represent the plastic strains occurring in the element after exceeding the tensile strength of the material. Therefore, when PEEQ results give a positive value, this indicates that the crack has formed in the element [13,14].
2.2.2. PU, GFRP
In order to compare the simulation results of behavior of the RC column strengthened by PU to the experimental results, Arruda-Boyce model was used as a constitutive model for PU. In Arruda-Boyce model, hyperelastic material behavior shown in rubber like incompressible plastic material. Arruda-Boyce model uses strain energy potential as a function of strain to obtain its stress-strain relation as shown in Equation (1) [15].
where, is the elongation rate in longitudinal direction; is the deviatoric strain invariant; is the elastic volumetric rate; and and D are the volume compression controlling material coefficients.
In order to obtain the material coefficients to be used in the simulation, a uniaxial tensile test is performed and the stress-strain relation curve is obtained as shown in Figure 3a,b, respectively. The tensile strength and percent elongation of PU is 19 MPa and 165 %, respectively.
Generally, GFRP rebars and sheets with in-plain debonding failure was modeled using Hashin Damage model [16]. In this model, the stress states based on damage criteria for 4 damage mechanisms are used as shown in Equations (2)–(5).
where, , , , are damage criteria of fiber tension, fiber compression, matrix tension, and compression, respectively. , , , , , are FRP’s longitudinal tensile strength, longitudinal compressive strength, transverse tensile strength, transverse compressive strength, longitudinal shear strength, and transverse shear strength, respectively, the stress tensors of , , represent effective stresses.
3. Verification of Numerical Analysis Results
Based on the experimental results, the simulations are performed. The objective of the simulation work is to quantify the strengthening effect of the application of PU on RC columns under seismic loading. For the calibration of the simulation model, the simulation and experimental results of maximum and minimum deflection, acceleration, and maximum and minimum strain in longitudinal rebars are compared. As shown in Figure 4, the locations where the acceleration and rebar strain results obtained for both the experiments and simulations are identical.
The experimental and numerical results for acceleration, displacement, and longitudinal rebar strain history for all specimen types are presented and compared in Figure 5, Figure 6, and Figure 7, respectively. Also, the maximum column head displacements and longitudinal rebar strains from the experimental and simulation results for all of the specimen types are summarized in Table 2 and Table 3, respectively. From the comparison of the experimental and simulation results, two significant conclusions can be drawn. One is that the experimental and simulation displacement and strain results are similar within 3% and 14%, respectively, validating precision of the simulation model.
From the result comparison, the column head displacements between circular and rectangular columns from both experiments and simulation are relatively same. Also, the comparison between the non-strengthened RC columns to the strengthened PU and GFPU columns showed that non-strengthened ones had slightly larger displacements in both circular and rectangular columns.
However, the longitudinal rebar strain results show that the circular columns have approximately 2 folds of strains than the rectangular columns from both the experiments and simulations. This trend can be attributed to the fact that the circular columns have much better seismic resisting capacity than the rectangular columns from having much larger effective stress resisting cross-section area than the rectangular ones. When the stains of the circular columns are compared, the non-strengthened RC had approximately 2100~2400με, PU only strengthened one had approximately 1400~1600με, and PU and GFRP strengthened one had approximately 600με. This result trend is logical since the GFPU strengthening is more effective than the PU only strengthening from GFRP applying more confinement and stiffness to the core RC columns than PU only applied condition. In the rectangular columns, the non-strengthened RC showed approximately 4 times more strain than the strengthened ones caused by large crack damages along the column compared to the concentrated damage at the base joint region in PU and GFPU strengthened columns, which are reflected by the strain results in Table 3.
To quantitatively analyze the reinforcement effect through the previously constructed analytical model, the lateral shear force–displacement relationship of specimens reinforced with PU and GFRP was compared. In order to increase the effectiveness of the reinforcement effect analysis, the criteria were set through the PEEQ parameter, which is the failure criteria of the concrete material model that occurred at 450 mm point (1/2 point of reinforcement position) from the bottom of the test specimen. The stiffness of the structure was analyzed by the ratio of shear force for each specimen based on the later displacement when concrete failure first occurred in the reinforced RC test specimen. As shown in the following Figure 8, both rectangular cross-section specimens and circular cross-section specimens showed a trend of increasing load on the structure compared to the same displacement in the order of GFPU>PU>RC. As a result of comparing the stiffness of the structure through slope, improvements of 15.04 and 24.46% compared to the non-reinforced specimen were confirmed at R-RC 31.26, R-PU 35.96, and R-GFPU 41.54, respectively, and improvements of 21.35 and 31.75% were confirmed at C-RC 31.53, C-PU 38.26, C-GFPU 41.54, respectively.
ABAQUS/Standard can show the progress of structural failure and deformation as dissipated energy (ALLDMD) through the structural damage criteria of the properties input in the analysis model. In general, if a structure has excellent rigidity and seismic performance, the energy that can be dissipated as the load action increases, resulting in high stability of the structure. Notably, the corresponding parameter has a proportional relationship to the failed material volume of the member when the same load is applied [17]. The damage dissipated energy (ALLDMD, M_D) can be calculated using Equation (6).
In the formula, represents the duration of ground motion, is the material volume, is the stress, is the cracking strain.
Figure 9 presents the comparison of the ALLDMD graphs for all specimens, with data up to the initial 10 sec considered to show the macroscopic differences. According to the data, the energy dissipated when the specimen was destroyed was compared for different reinforcement methods. As shown in Figure 9, critical failure occurred in the specimen between 2 and 6 secs when the maximum seismic load was applied. Since the failure of the specimen against compression and tensile stress occurs repeatedly due to the characteristics of the seismic loading, it is necessary to analyze the reinforcing effect of the reinforcing material based on a specific period. To analyze the initial loss of the stiffness of the specimen, the dissipated energy of the specimen according to each cross-sectional shape was compared based on the time of initial concrete destruction. Table 4 lists the range of dissipated energy values with this period. Compared to the non-reinforced circular column, the circular cross-section specimen showed a reduction with the range of dissipated energy values of 76% and 82% when PU and GFPU reinforcement were applied, respectively. Compared to the non-reinforced rectangular column, the rectangular cross-section specimen showed a reduction with the range of dissipated energy values of 80% and 60% when PU and GFPU reinforcement were applied, respectively. It is defined as both PU and GFPU reinforcement causing damage due to stress concentration due to repeated loads as the PU was torn off from the corner without a single movement of the PU and GFRP sheets. For a circular cross-sectional specimen without edges, it is defined as that the circular cross-sectional specimen has superior energy dissipation ability than the prismatic cross-sectional specimen due to the formation of a discontinuous surface in the synthesis of PU.
To explain the difference in the trend of the dissipated energy for the different cross-sectional PU and GFPU reinforced specimens, the von Mises stress distribution of each specimen and degree of concrete fracture were compared at the specific time that the first concrete failure occurred, which has come up with ALLDMD. PEEQ was used to visualize cracks in the concrete elements with the CDP model used as the material model of concrete. Figure 10 and Figure 11 show the distribution of the von Mises stress and PEEQ for each specimen. As in the case of the ALLDMD graph, considerable stress occurred in the circular cross-section specimen. In addition, similar to the trend of the dissipated energy, for the square specimens, a wider distribution and larger stress occurred in the GFPU reinforced specimen than those in the PU reinforced specimen. The contrasting trend was observed for the circular specimen.
The CDP model used as a concrete material model is a continuum damage model based on plastic deformation of concrete. The model assumes tensile cracking and compressive crushing as the main fracture mechanisms of concrete elements. The progression of concrete cracking is controlled by two hardening parameters, which mean tensile and compressive equivalent plastic strains (PEEQ, ε_t^(~ pl), ε_c^(~ pl)), both of which are the major failure mechanisms mentioned above. It is affected by tensile and compressive forces. The concrete damage plasticity model has no concept that cracks occur at the integration point of the mesh using the material model. Therefore, the concept of effective crack direction can be introduced for the purpose of graphic visualization of crack patterns in concrete specimens. Various criteria have been studied to define the crack direction. In this study, the concept of crack initiation of concrete is used at the integration point where the equivalent plastic strain (PEEQ) is greater than zero, proposed by Lubliner et al (1989) [18]. Also, the concept assumes that the propagation direction of cracks is parallel to the propagation direction of equivalent plastic strain (PEEQ) [14,19,20]. Through this, the concrete cracks of each specimen were evaluated.
The PEEQ output parameter indicated that the crack occurrence decreased in the order of RC, PU, GFPU when comparing the crack height that progressed in the upper direction of the column from the expected concrete fracture (foundation and column starting point). It was confirmed that crack heights of 454 mm and 450 mm were generated in the case of R-PU and R-GFPU, respectively, and crack heights of 425 mm and 400 mm were generated in the case of C-PU and C-GFPU, respectively. As mentioned previously, it can be analyzed that in the case of a rectangular cross-section specimen, discontinuous edges that exist on the surface of the specimen have led to insufficiency of reinforcement effect to the reinforcement material compared to the circular cross-sectional test specimen.
Through this approach, it is possible to quantitatively evaluate the degree of structural destruction in the context of the reinforcement effect, and the findings can provide valuable guidance for selecting the optimal reinforcement construction method for actual structures.
4. Conclusions
In this paper, numerical models were developed to quantitatively evaluate the seismic reinforcement of STPU-strengthened RC columns on experimental results of specimens and the numerical results are as follows.
- (1)
- In order to implement STPU and GFRP on the FE model, the material model provided by the ABAQUS material library was analyzed. The Arruda-Boyce model was applied to STPU and the Hashin damage model was applied to GFRP.
- (2)
- The validity of the analysis model was verified through the main result values derived from RC column specimens. As a result, it was confirmed that similar trends and data between the experimental results and the analysis results were derived, increasing reliability.
- (3)
- As a result of FE modeling, developed based on experimental data, the range of dissipated energy (ALLDMD) and equivalent plastic strains (PEEQ) of the specimen generated were compared. Compared to the non-reinforced circular column, the circular cross-section specimen showed a reduction with the range of dissipated energy values of 63% and 91% when PU and GFPU reinforcement were applied, respectively. Compared to the non-reinforced rectangular column, the rectangular cross-section specimen showed a reduction with the range of dissipated energy values of 82% and 73% when PU and GFPU reinforcement were applied, respectively. The PEEQ output parameter indicated that the crack occurrence decreased in the order of RC, PU, GFPU reinforced specimen when comparing the crack height that progressed in the upper direction of the column.
- (4)
- In the case of circular specimens, the performance of GFPU reinforcement was superior to that of PU reinforcement. In the case of the rectangular specimens, the effect of the two reinforcement types was comparable albeit superior to that of non-reinforced specimens. Compared to the circular cross-sectional specimens, it can be analyzed that in the case of a rectangular cross-section specimen, discontinuous edges that exist on the surface of the specimen have led to insufficiency of reinforcement effect to the reinforcement material.
Author Contributions
“Investigation, data analysis, main writing Tae-Hee Lee, Investigation, writing Soo-Hoo Han, and conceptualization, methodology J.H.J Kim.
Funding
This work is supported by the Korea Agency for Infrastructure Technology Advancement (KAIA) grant funded by the Ministry of Land, Infrastructure and Transport (Grant RS-2021-KA163381).
Institutional Review Board Statement
Not applicable
Data Availability Statement
The data presented in this research are available on request from the first author.
Acknowledgments
This work is supported by the Korea Agency for Infrastructure Technology Advancement (KAIA) grant funded by the Ministry of Land, Infrastructure and Transport (Grant 21CFRP-C163382-01).
Conflicts of Interest
The authors declare no conflicts of interest.
References
- Han, J.; Nur, A. S.; Syifa, M.; Ha, M., Lee, C. W.; Lee, K. Y. Improvement of earthquake risk awareness and seismic literacy of Korean citizens through earthquake vulnerability map from the 2017 pohang earthquake, South Korea. Remote Sensing, 2021, 13(7), 1365. [CrossRef]
- Lim, H.; Deng, K.; Kim, Y. H.; Ree, J. H.; Song, T. R.; Kim, K. H. The 2017 Mw 5.5 Pohang earthquake, South Korea, and poroelastic stress changes associated with fluid injection. Journal of Geophysical Research: Solid Earth, 2020, 125(6), e2019JB019134. [CrossRef]
- Siddika, A.; Al Mamun, M. A.; Ferdous, W.; Alyousef, R. Performances, challenges and opportunities in strengthening reinforced concrete structures by using FRPs–A state-of-the-art review. Engineering Failure Analysis, 2020, 111, 104480. [CrossRef]
- Lee, T. H.; Choi, S. J.; Yang, D. H.; Kim, J. H. J. Experimental seismic structural performance evaluations of RC columns strengthened by stiff-type polyurea. International Journal of Concrete Structures and Materials, 2022, 16(1), 65. . [CrossRef]
- Samiee, A.; Amirkhizi, A. V.; Nemat-Nasser, S. Numerical study of the effect of polyurea on the performance of steel plates under blast loads. Mechanics of materials, 2013, 64, 1-10. [CrossRef]
- Parniani, S.; Toutanji, H. Monotonic and fatigue performance of RC beams strengthened with a polyurea coating system. Construction and Building Materials, 2015, 101, 22-29. [CrossRef]
- Wang, J.; Ren, H.; Wu, X.; Cai, C. Blast response of polymer-retrofitted masonry unit walls. Composites Part B: Engineering, 2017, 128, 174-181. [CrossRef]
- Song, J. H.; Eun, H. C. Improvement of flexural and shear strength of RC beam reinforced by glass fiber-reinforced polyurea (GFRPU). Civil Engineering Journal, 2021, 7(3), 407-418. [CrossRef]
- Bruna-Rosso, C.; Demir, A. G.; Previtali, B. Selective laser melting finite element modeling: Validation with high-speed imaging and lack of fusion defects prediction. Materials & Design, 2018, 156, 143-153. [CrossRef]
- Genikomsou, A. S.; Polak, M. A. Finite element analysis of punching shear of concrete slabs using damaged plasticity model in ABAQUS. Engineering structures, 2015, 98, 38-48. [CrossRef]
- Mitani, Y.; Wang, F.; Okeke, A. C.; Qi, W. Dynamic analysis of earthquake amplification effect of slopes in different topographic and geological conditions by using ABAQUS. In Progress of Geo-Disaster Mitigation Technology in Asia, (pp. 469-490). Springer, Berlin, Heidelberg (2013). [CrossRef]
- Su, X.; Yang, Z.; Liu, G. Finite element modelling of complex 3D static and dynamic crack propagation by embedding cohesive elements in Abaqus. Acta Mechanica Solida Sinica, 2010, 23(3), 271-282. [CrossRef]
- Sun, E. Q. Shear locking and hourglassing in MSC Nastran, ABAQUS, and ANSYS. In Msc software users meeting (pp. 1-9) (2006, July).
- Chen, B.; Wu, J.; Liu, C.; Liu, Y.; Zhou, W.; Xiao, Y. Analysis for Shear Behavior of SRC Deep Beams Based on Tests, Digital Image Correlation Technique, and Finite Elemental Simulation. Shock and Vibration, 2021, 2021(1), 5964480. [CrossRef]
- Arruda, E. M.; Boyce, M. C. A three-dimensional constitutive model for the large stretch behavior of rubber elastic materials, Journal of the Mechanics and Physics of Solids, 1993, 41, 389-412. [CrossRef]
- Hashin, Z. Failure Criteria for Unidirectional Fiber Composites. J. Appl. Mech. 1980, 47, 329–334. [CrossRef]
- Litchfield, A.; Thomson, R.; Orifici, A., Response characterization in CFRP notched coupons with energy-based multi-axial failure data, in Don Love (ed.) Third Asia-Pacific International Symposium on Aerospace Technology (APISAT 2011), Melbourne, Australia, 28 February - 3 March 2011, pp. 1-10.
- Lubliner, J.; Oliver, J.; Oller, S.; Oñate, E. A plastic-damage model for concrete, International Journal of Solids and Structures, 1989, 25(3), 299-326. [CrossRef]
- ABAQUS, 2014, Version 6.14 User's manual, Dassault Systemes Simulia Corp., Providence, RI, USA.
- Yang, H.; Bu, Y.; Guo, S.; Liu, H.; Du, J.; Cao, X. C. Effects of in-situ stress and elastic parameters of cement sheath in salt rock formation of underground gas storage on seal integrity of cement sheath, Journal of Engineering Failure Analysis, 2021, 123. [CrossRef]
Figure 1.
Finite element meshing.
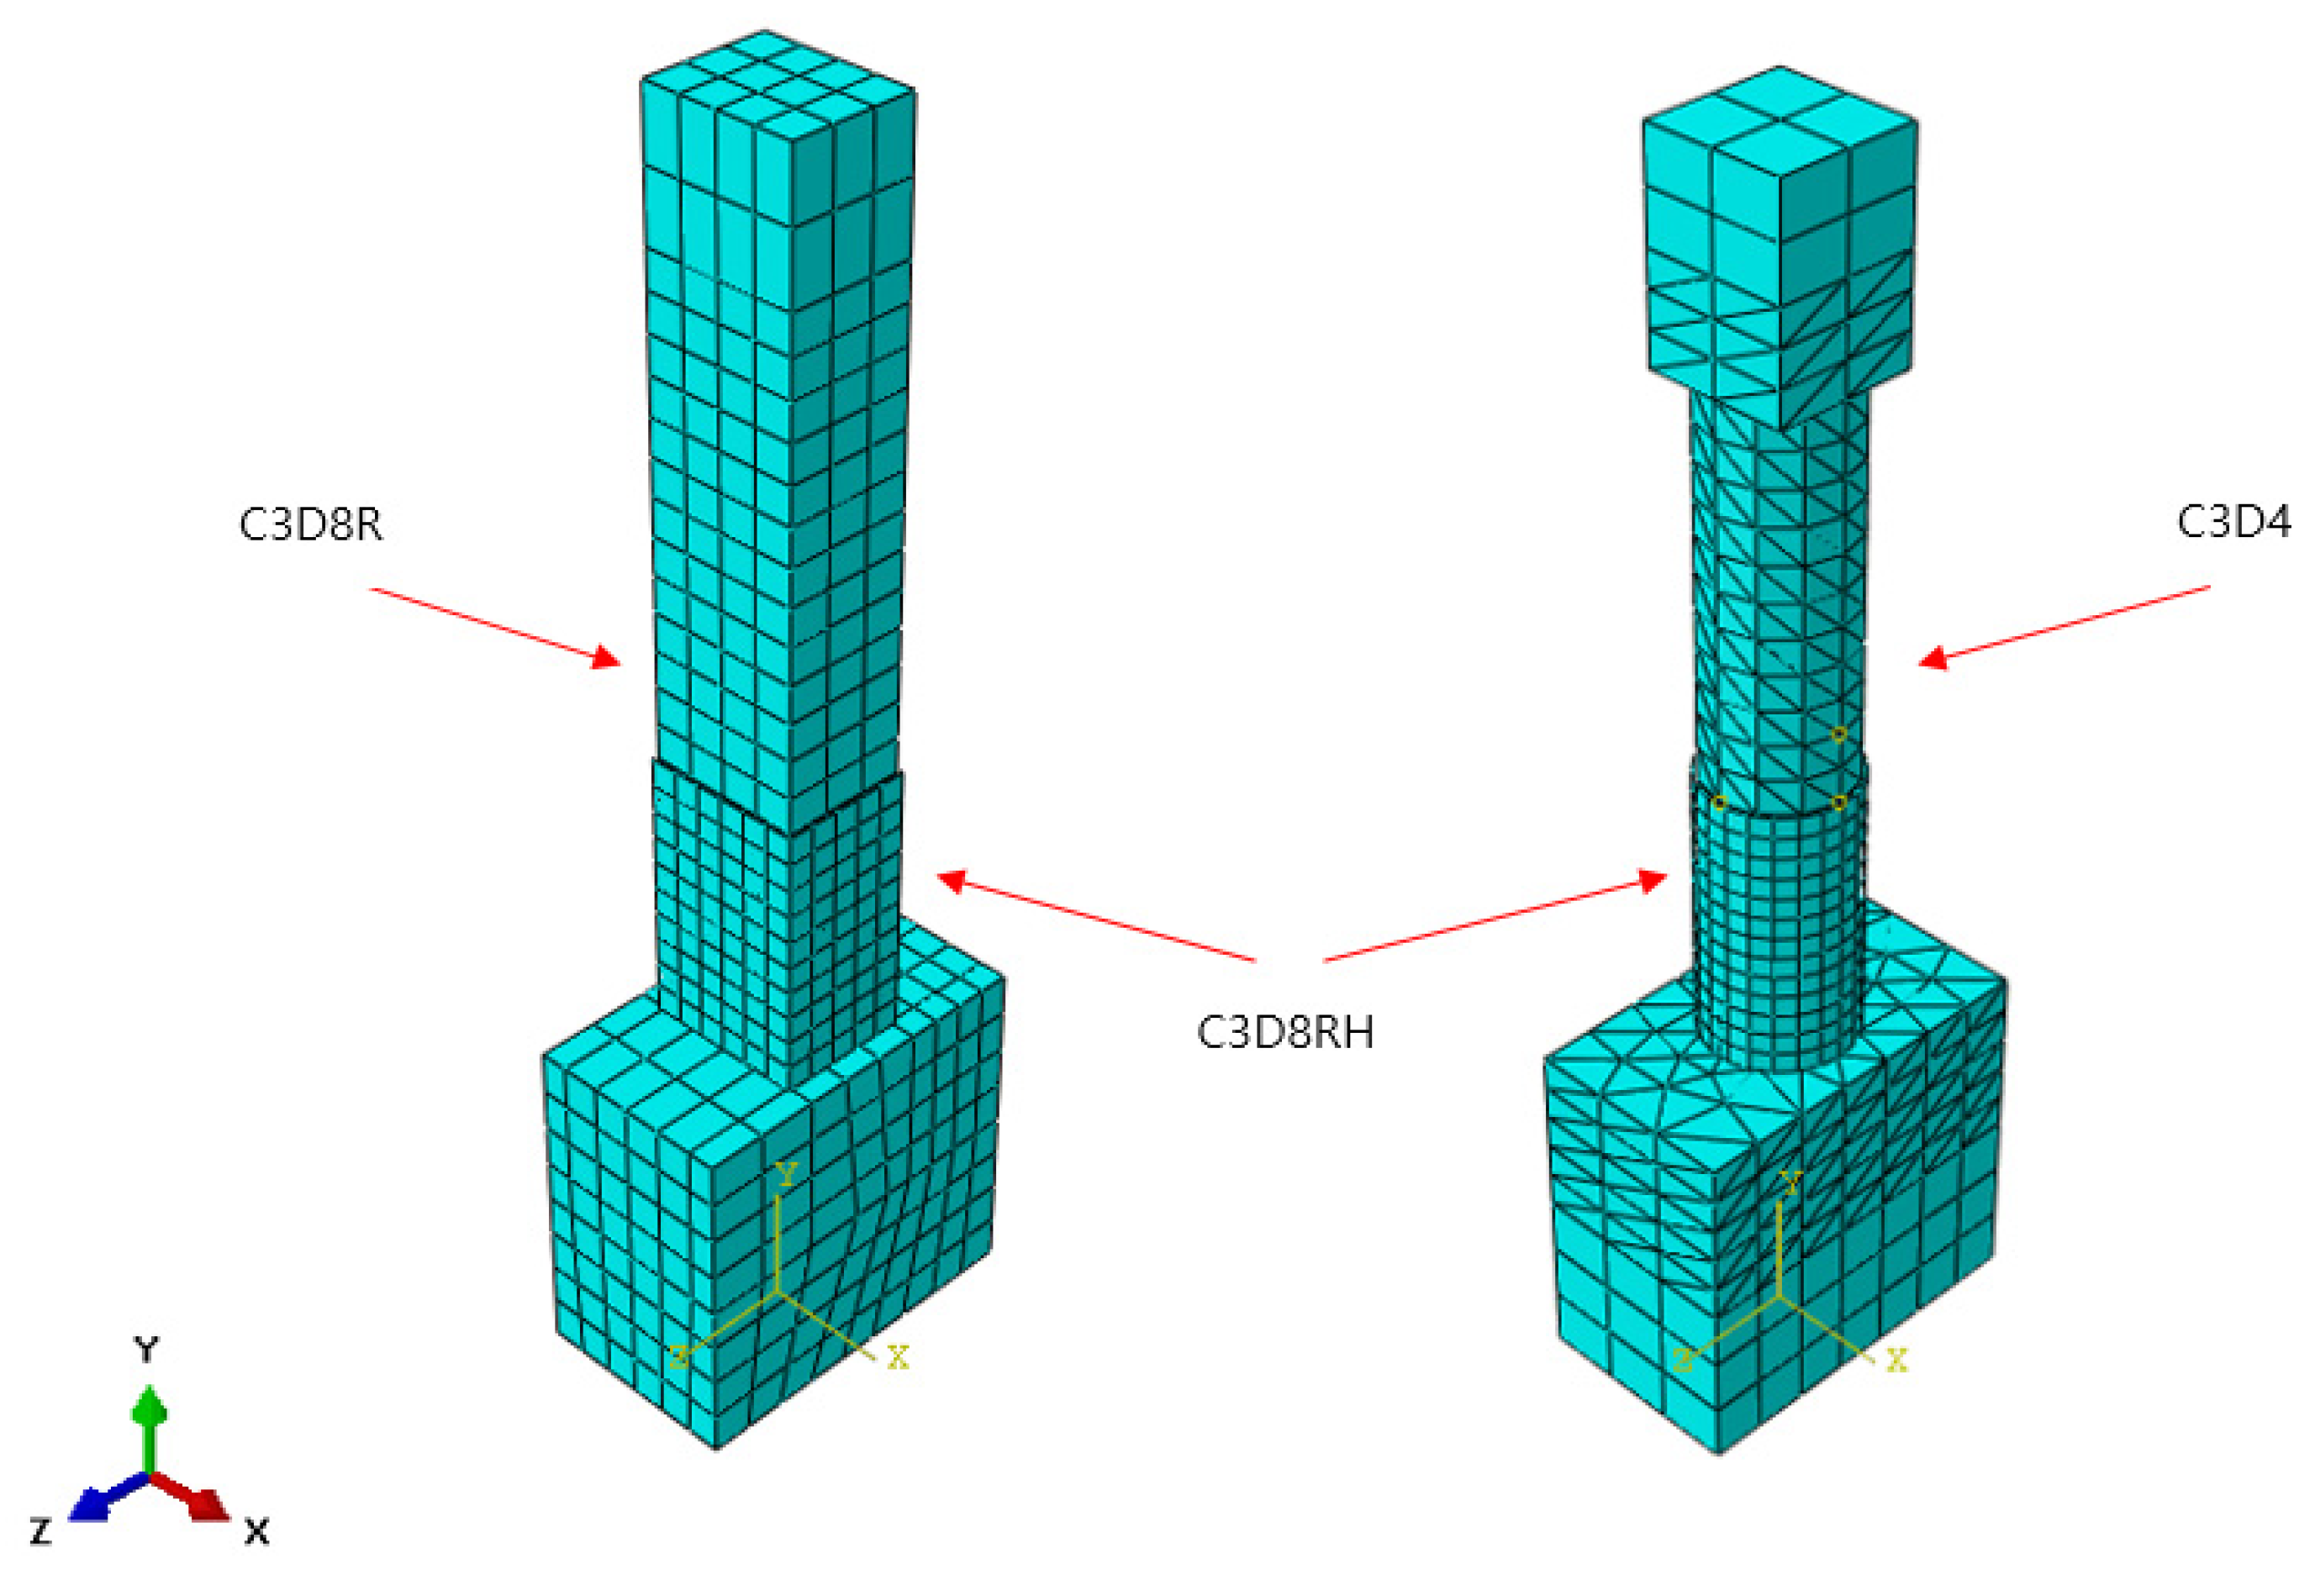
Figure 2.
Loading and boundary condition.
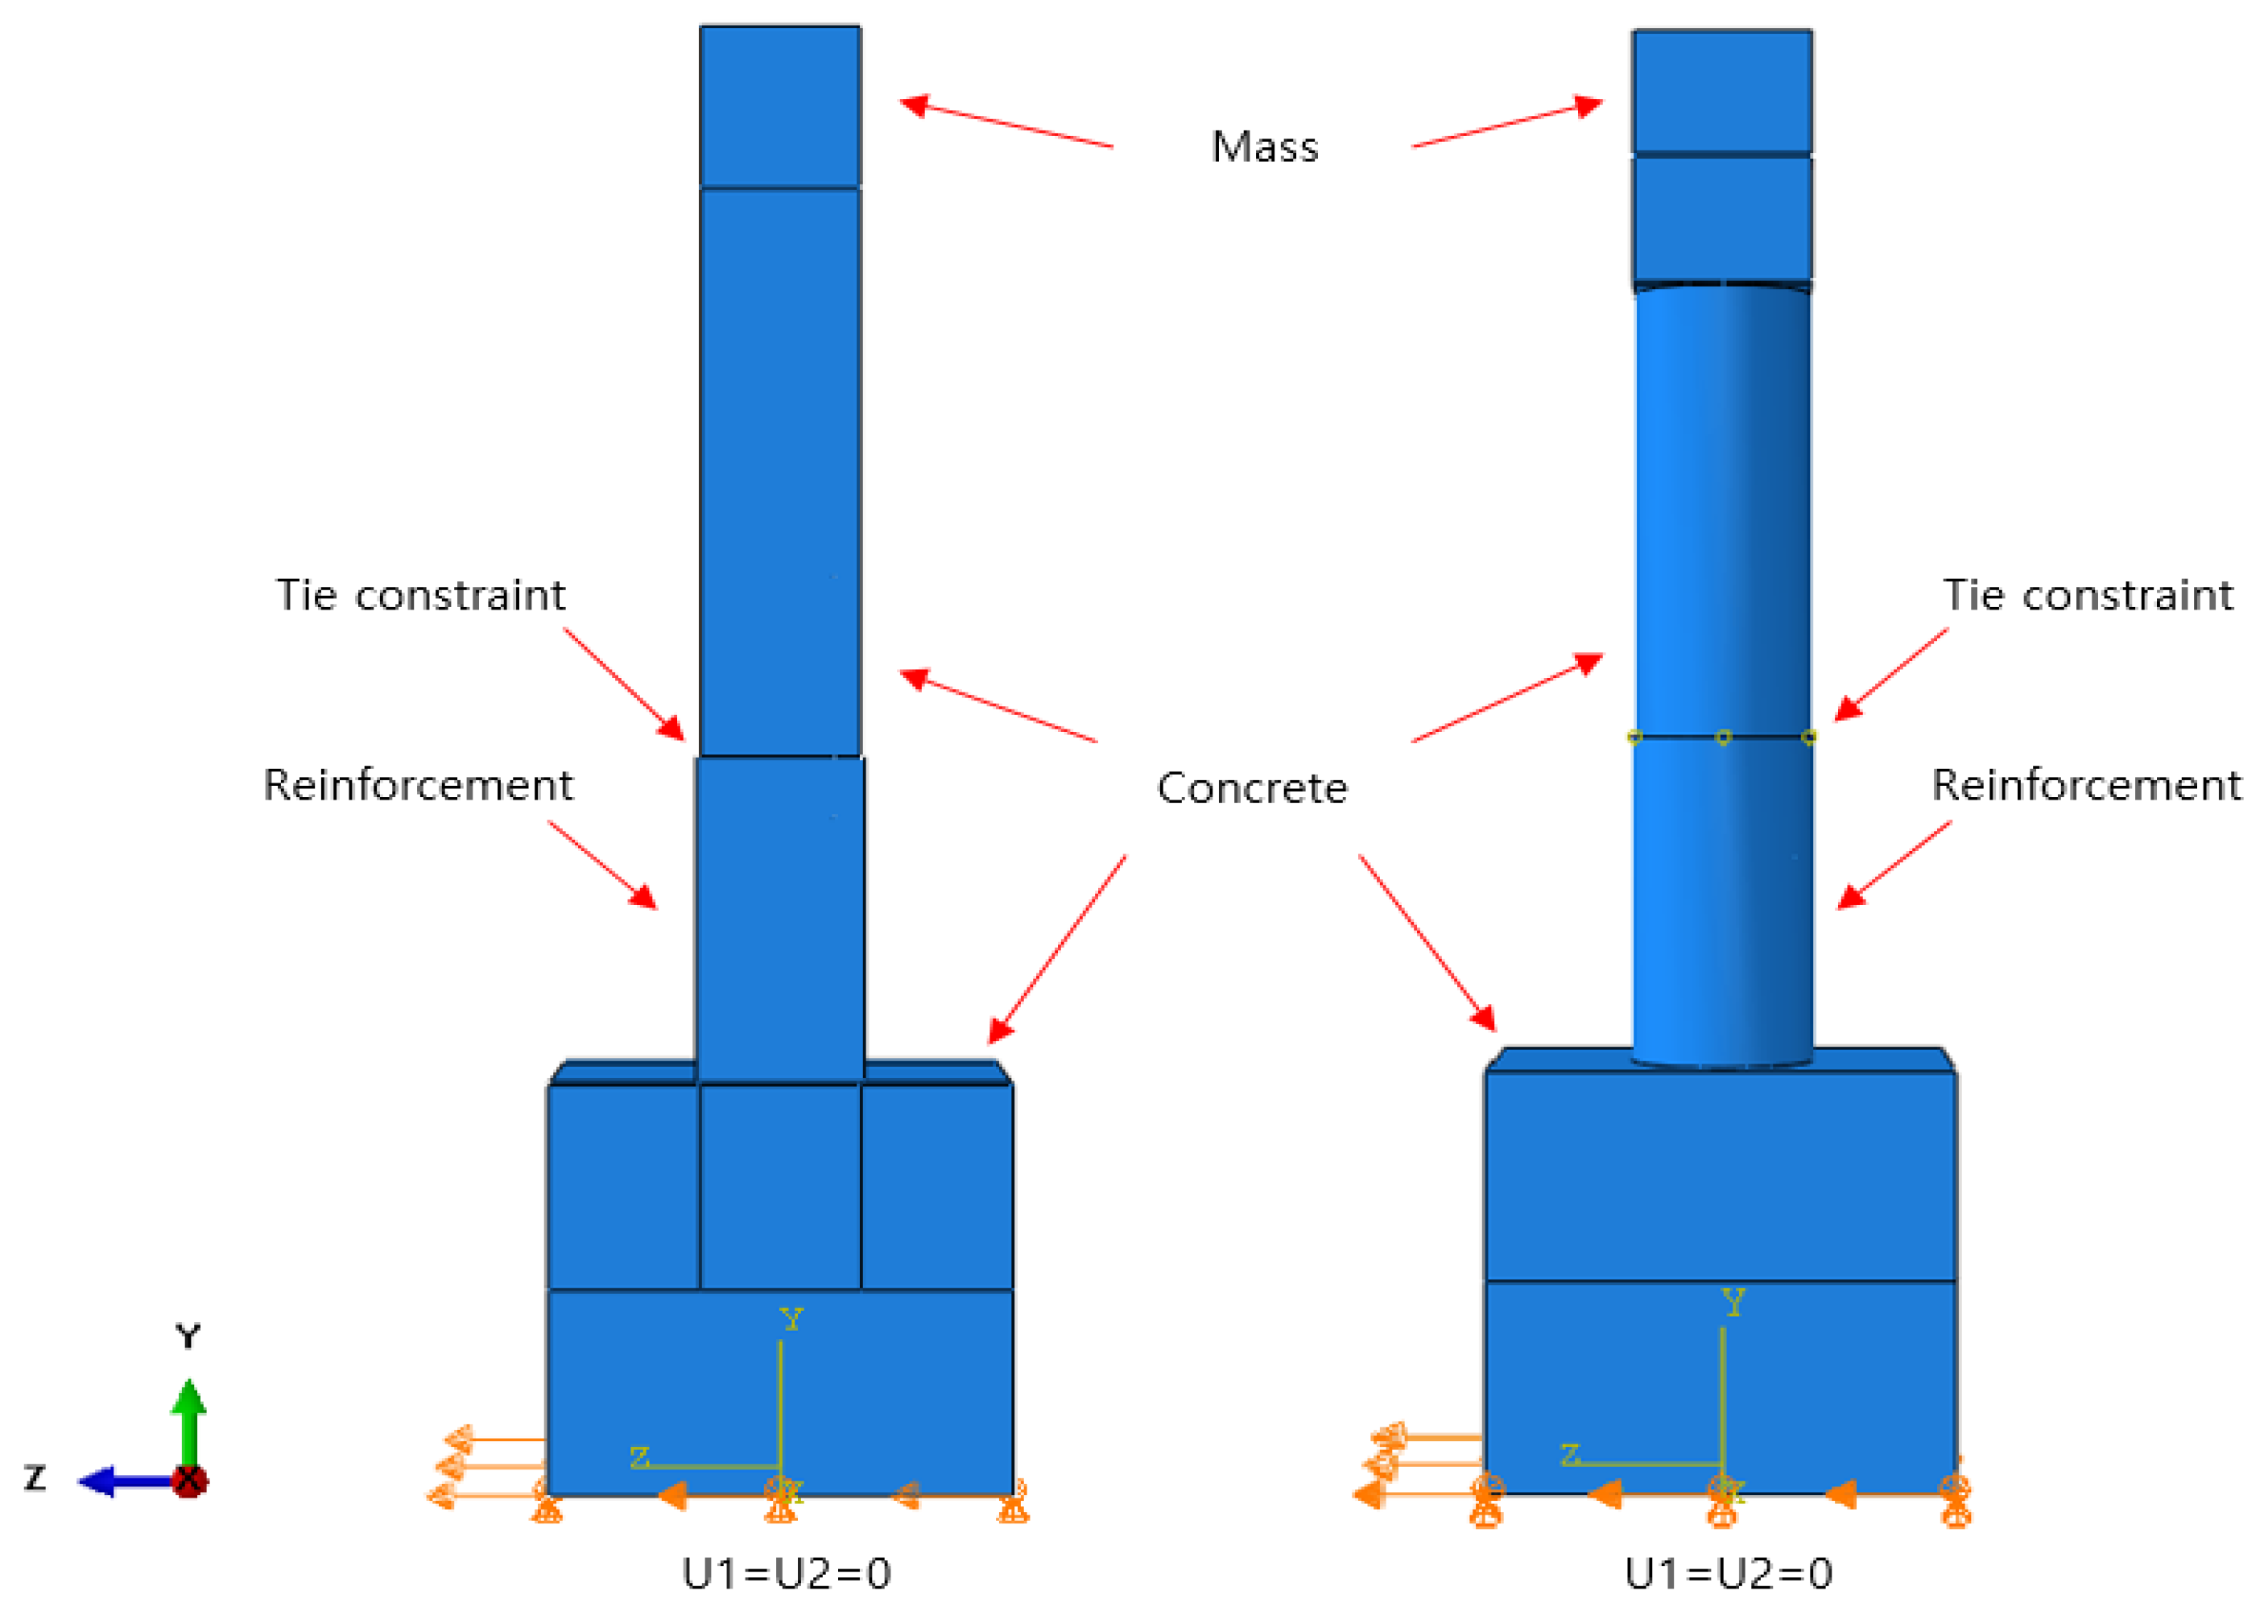
Figure 3.
Material evaluation of PU: (a) Uniaxial tensile test of Polyurea; (b) Stress-Strain curve to evaluate hyperelastic material.
Figure 3.
Material evaluation of PU: (a) Uniaxial tensile test of Polyurea; (b) Stress-Strain curve to evaluate hyperelastic material.
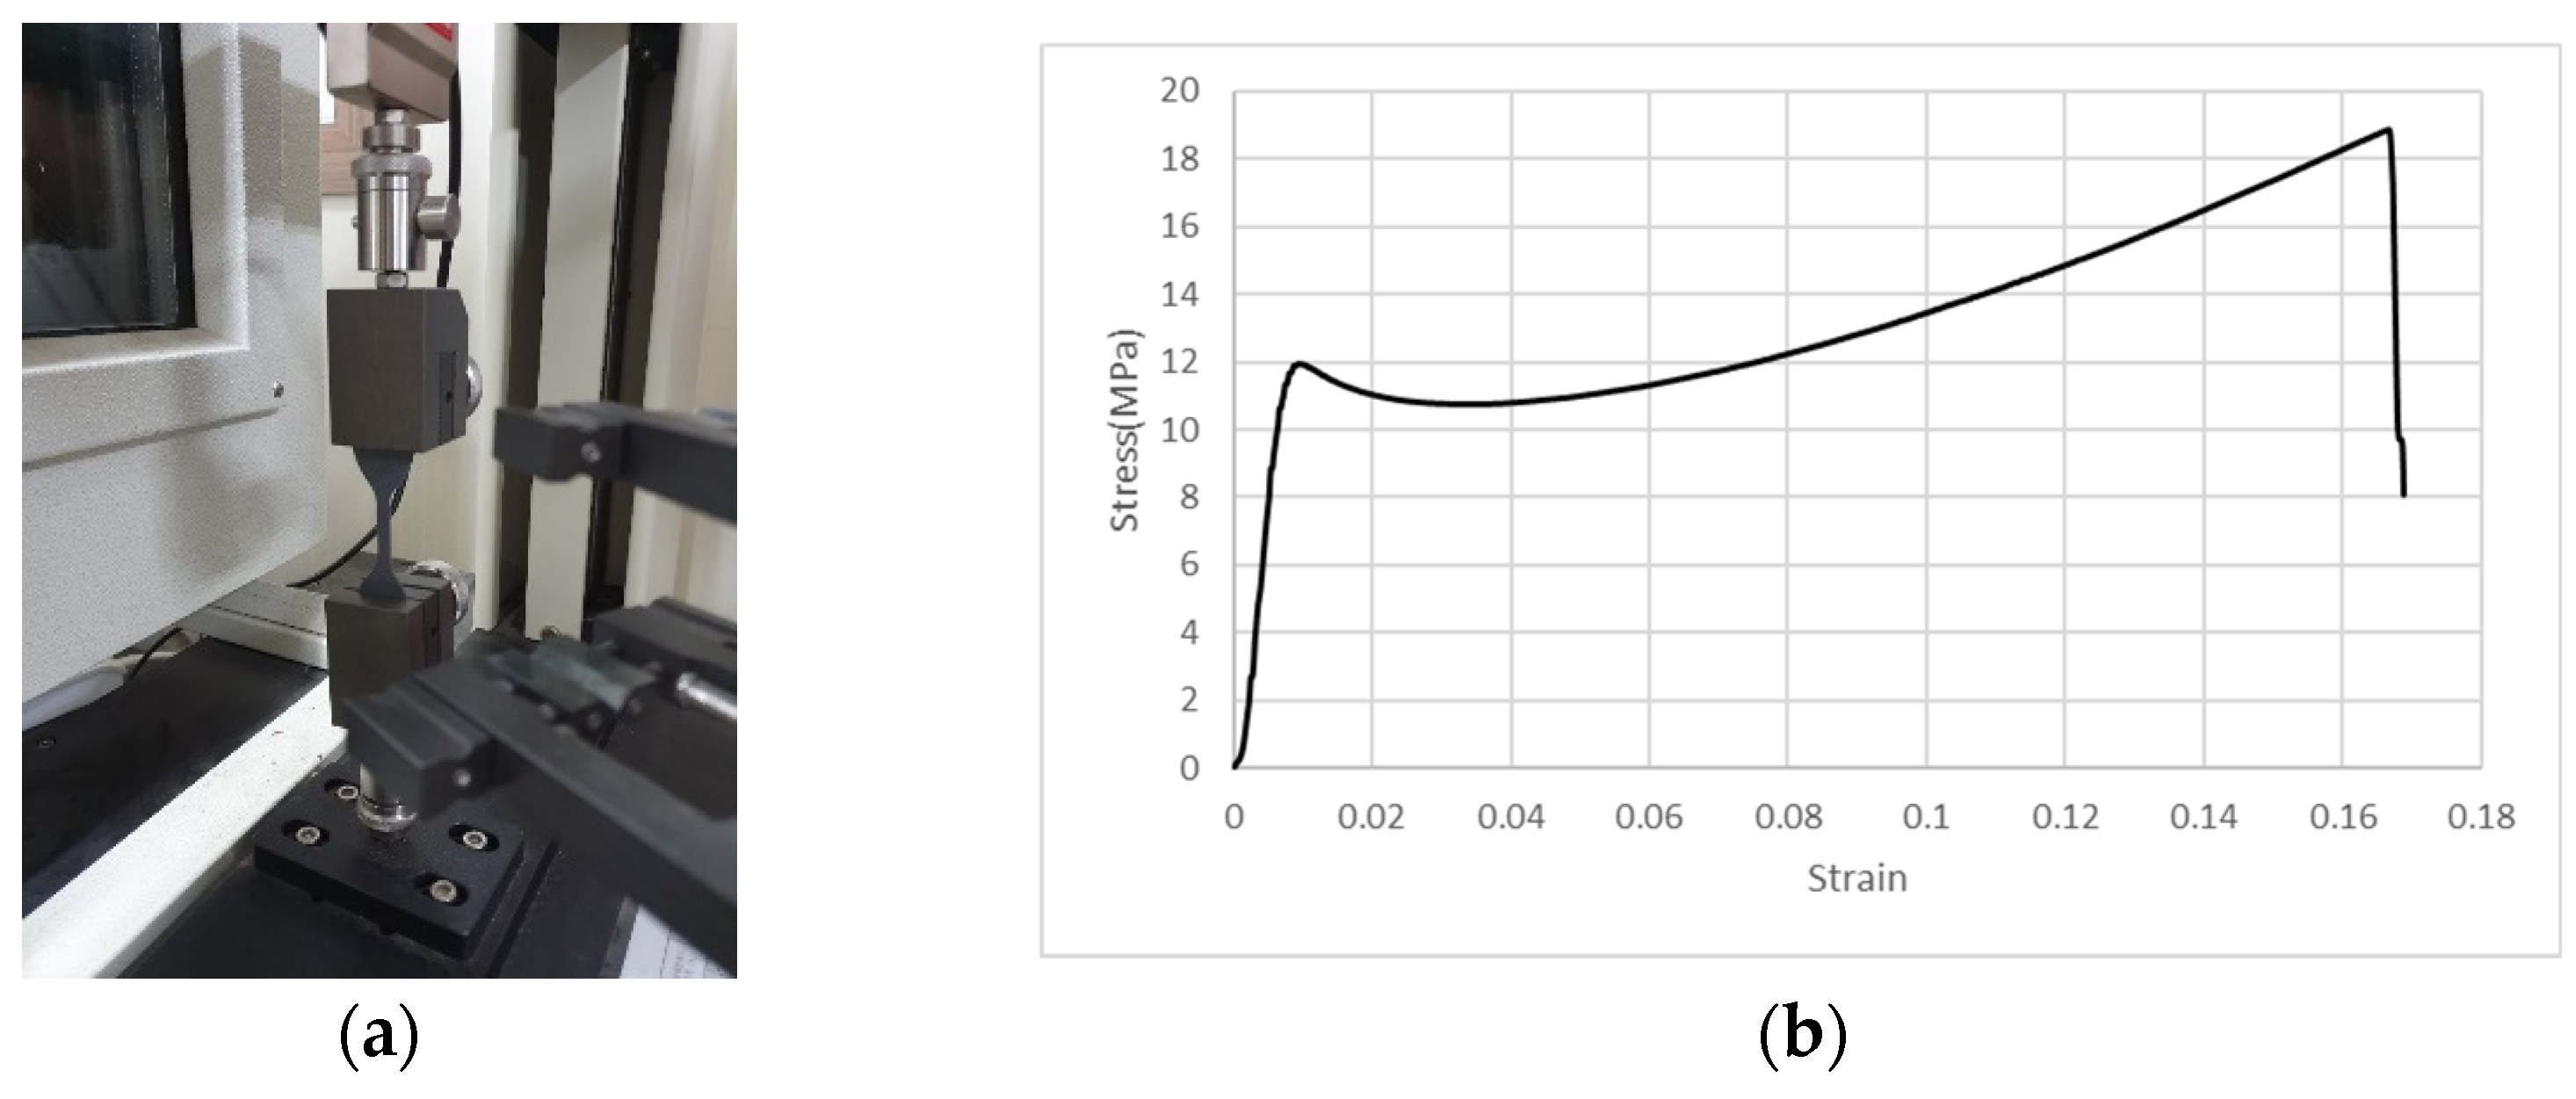
Figure 4.
Comparison point for experimental and numerical results.
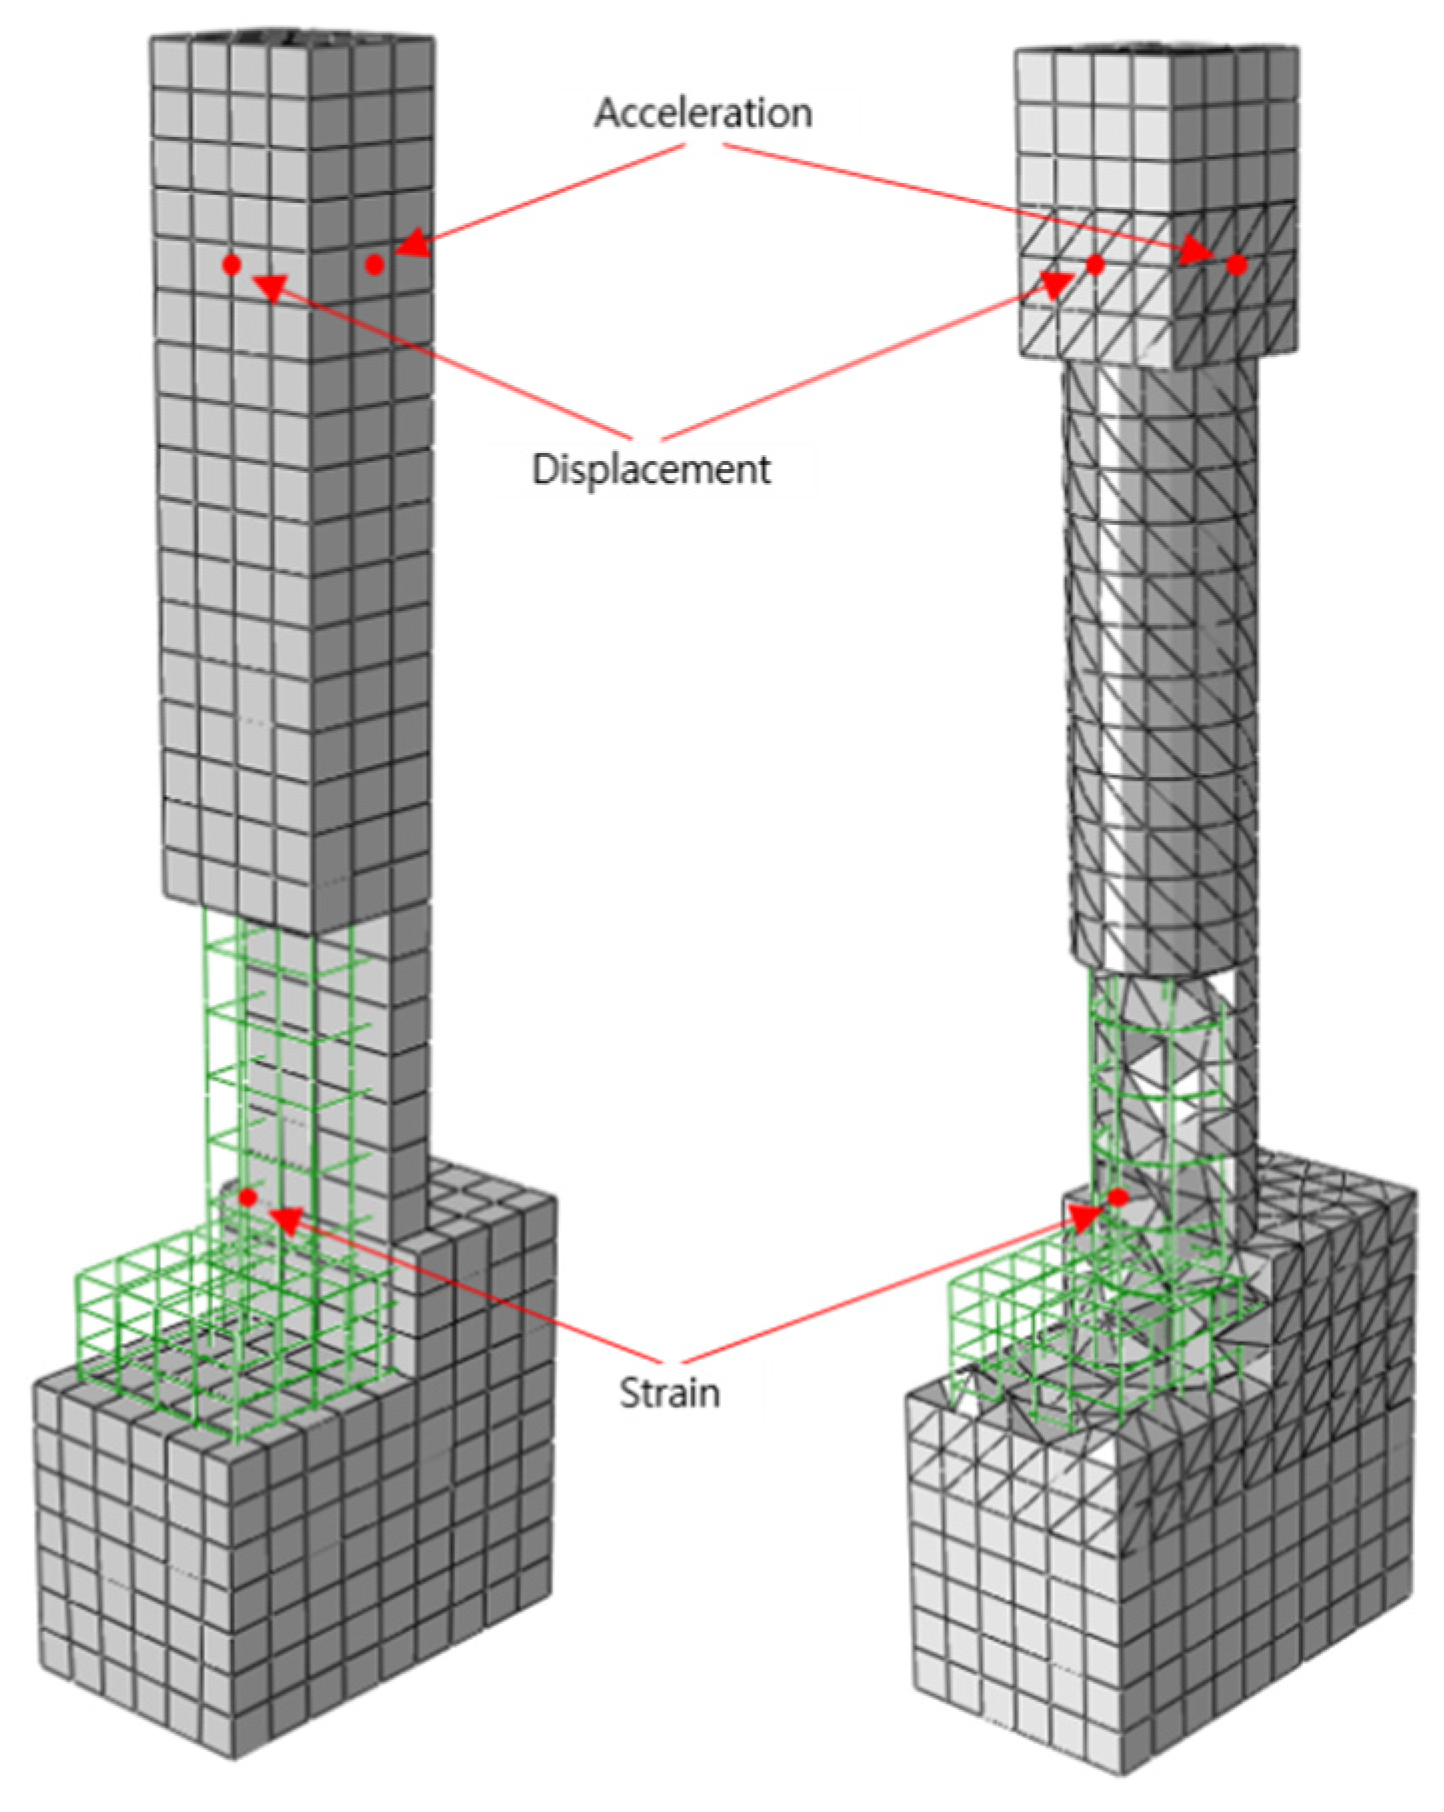
Figure 5.
Comparison of experimental and simulation acceleration: (a) R-RC; (b) C-RC; (c) R-PU; (d) C-PU; (e) R-GFPU; (f) C-GFPU. * RC: Non-strengthened, C-: Circular column, R-: Rectangular column.
Figure 5.
Comparison of experimental and simulation acceleration: (a) R-RC; (b) C-RC; (c) R-PU; (d) C-PU; (e) R-GFPU; (f) C-GFPU. * RC: Non-strengthened, C-: Circular column, R-: Rectangular column.
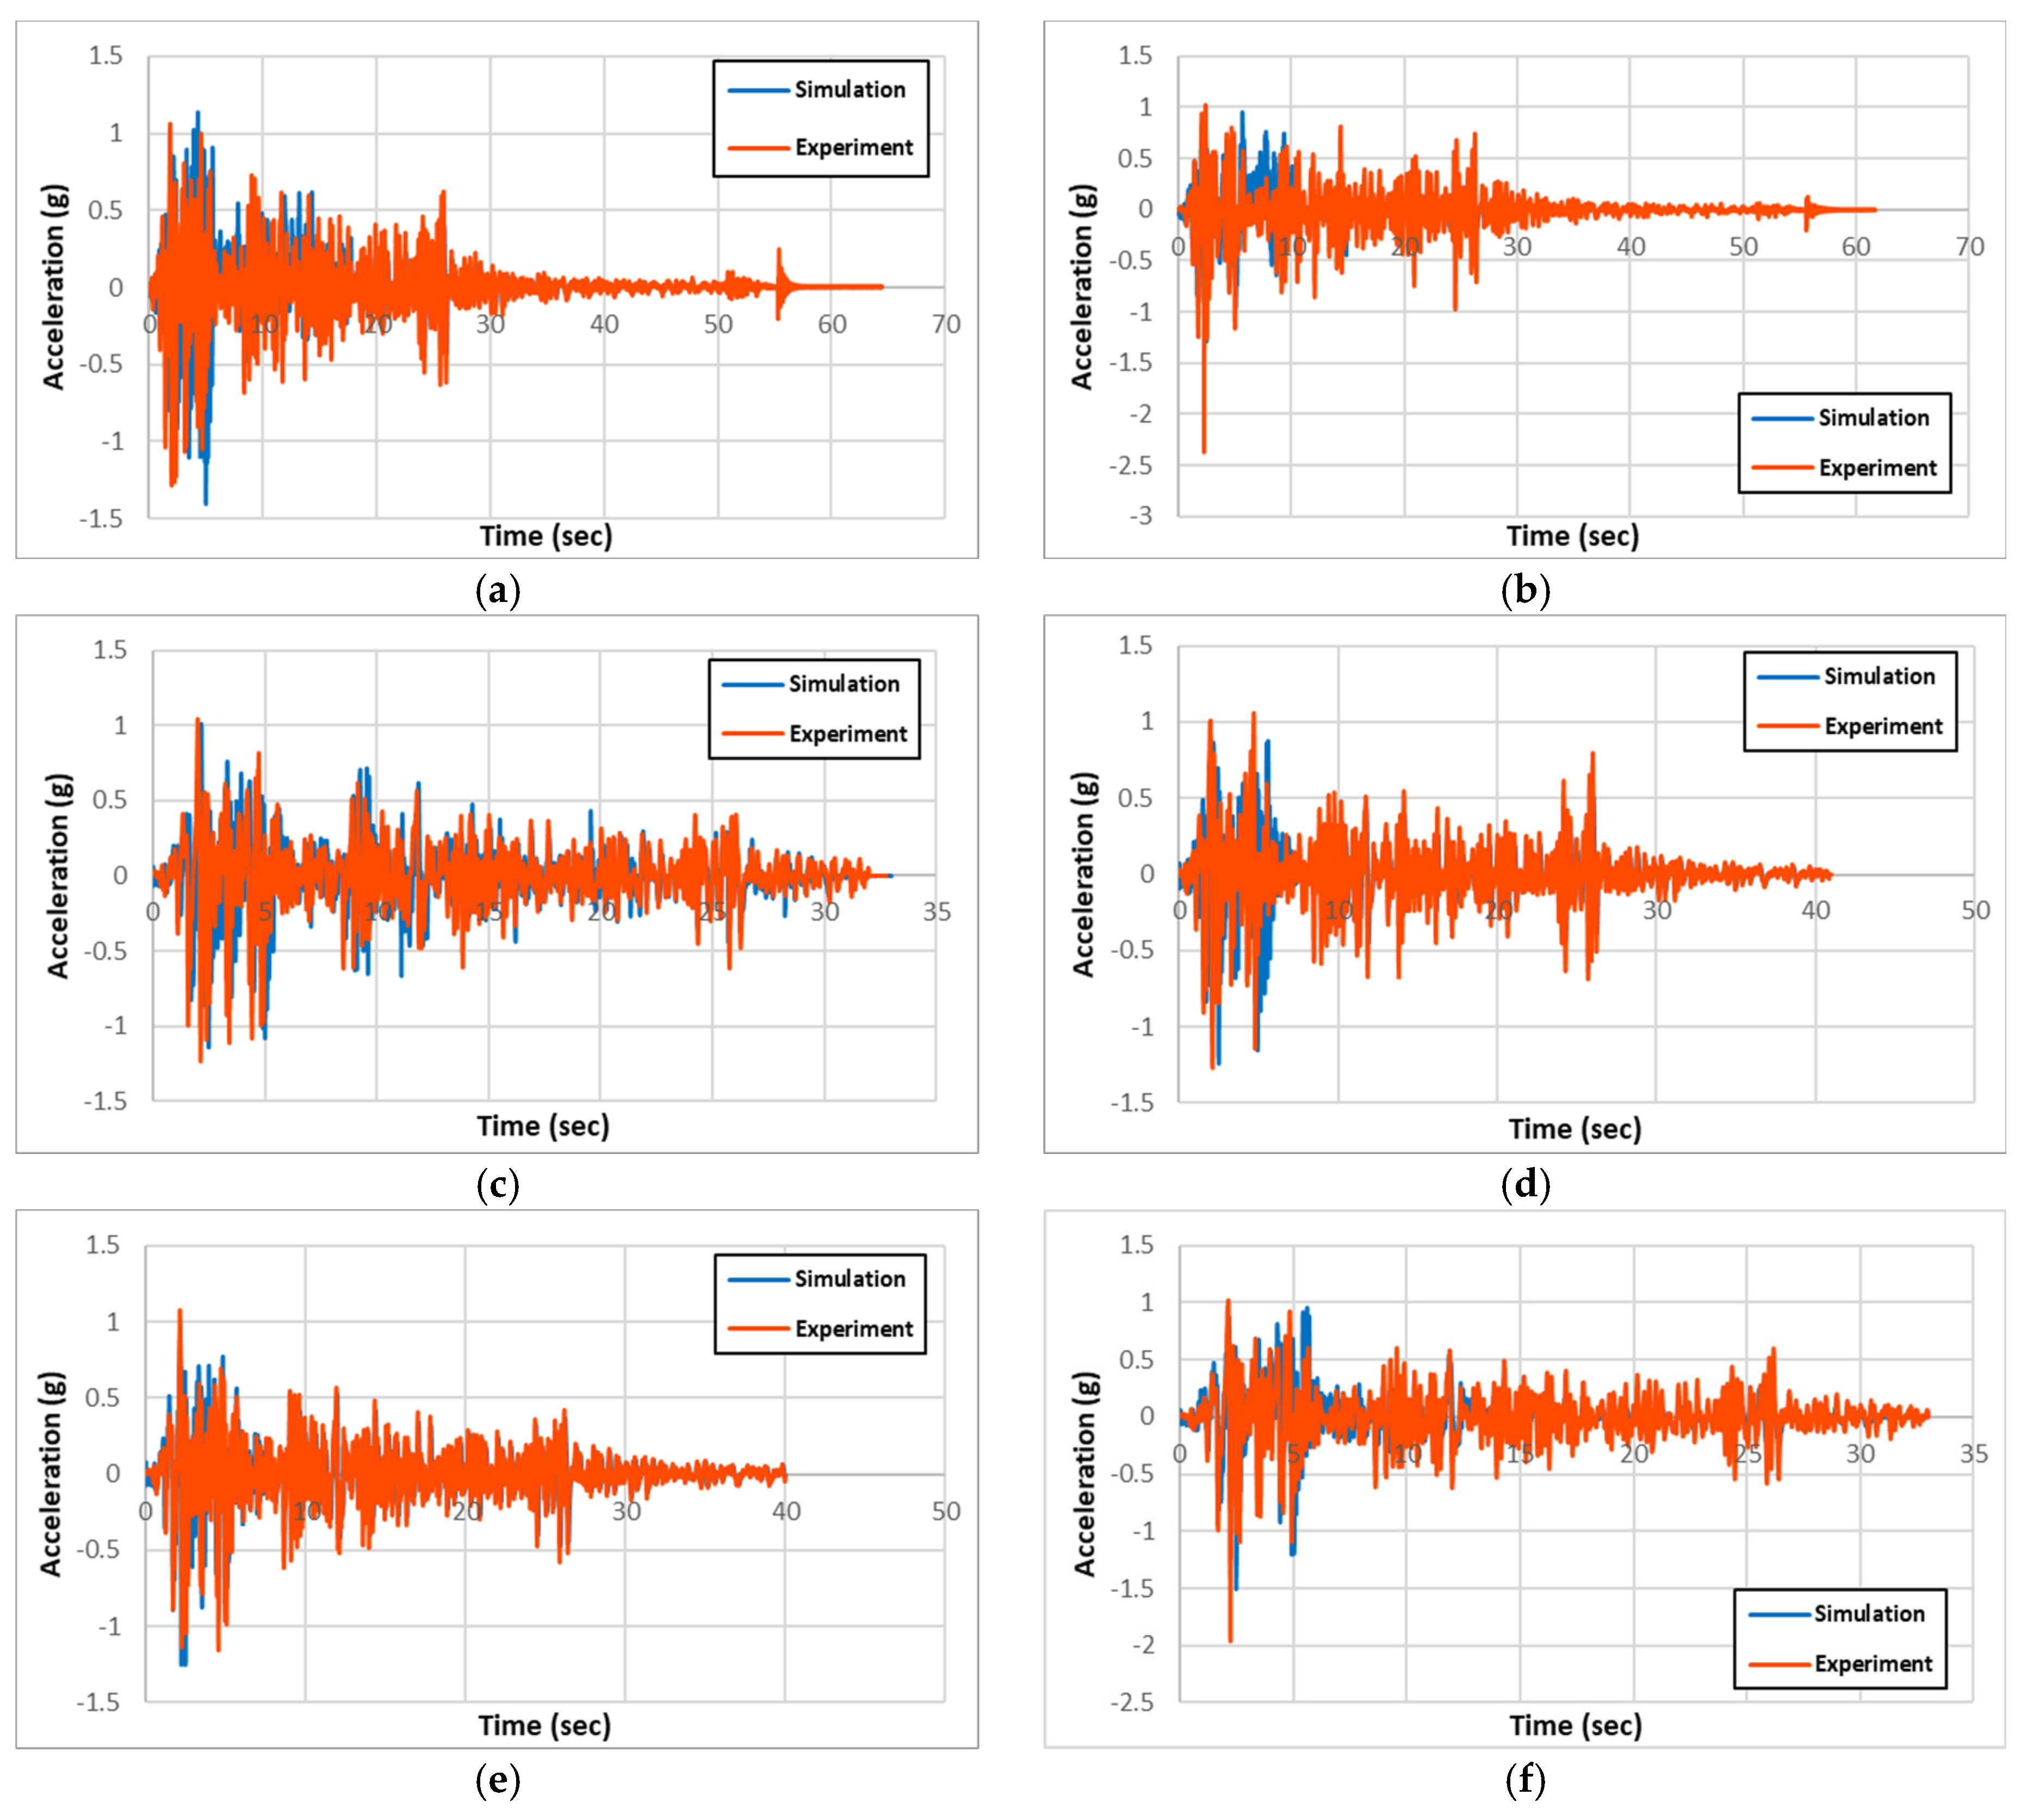
Figure 6.
Comparison of experimental and simulation displacement: (a) R-RC; (b) C-RC; (c) R-PU; (d) C-PU; (e) R-GFPU; (f) C-GFPU. * RC: Non-strengthened, C-: Circular column, R-: Rectangular column.
Figure 6.
Comparison of experimental and simulation displacement: (a) R-RC; (b) C-RC; (c) R-PU; (d) C-PU; (e) R-GFPU; (f) C-GFPU. * RC: Non-strengthened, C-: Circular column, R-: Rectangular column.
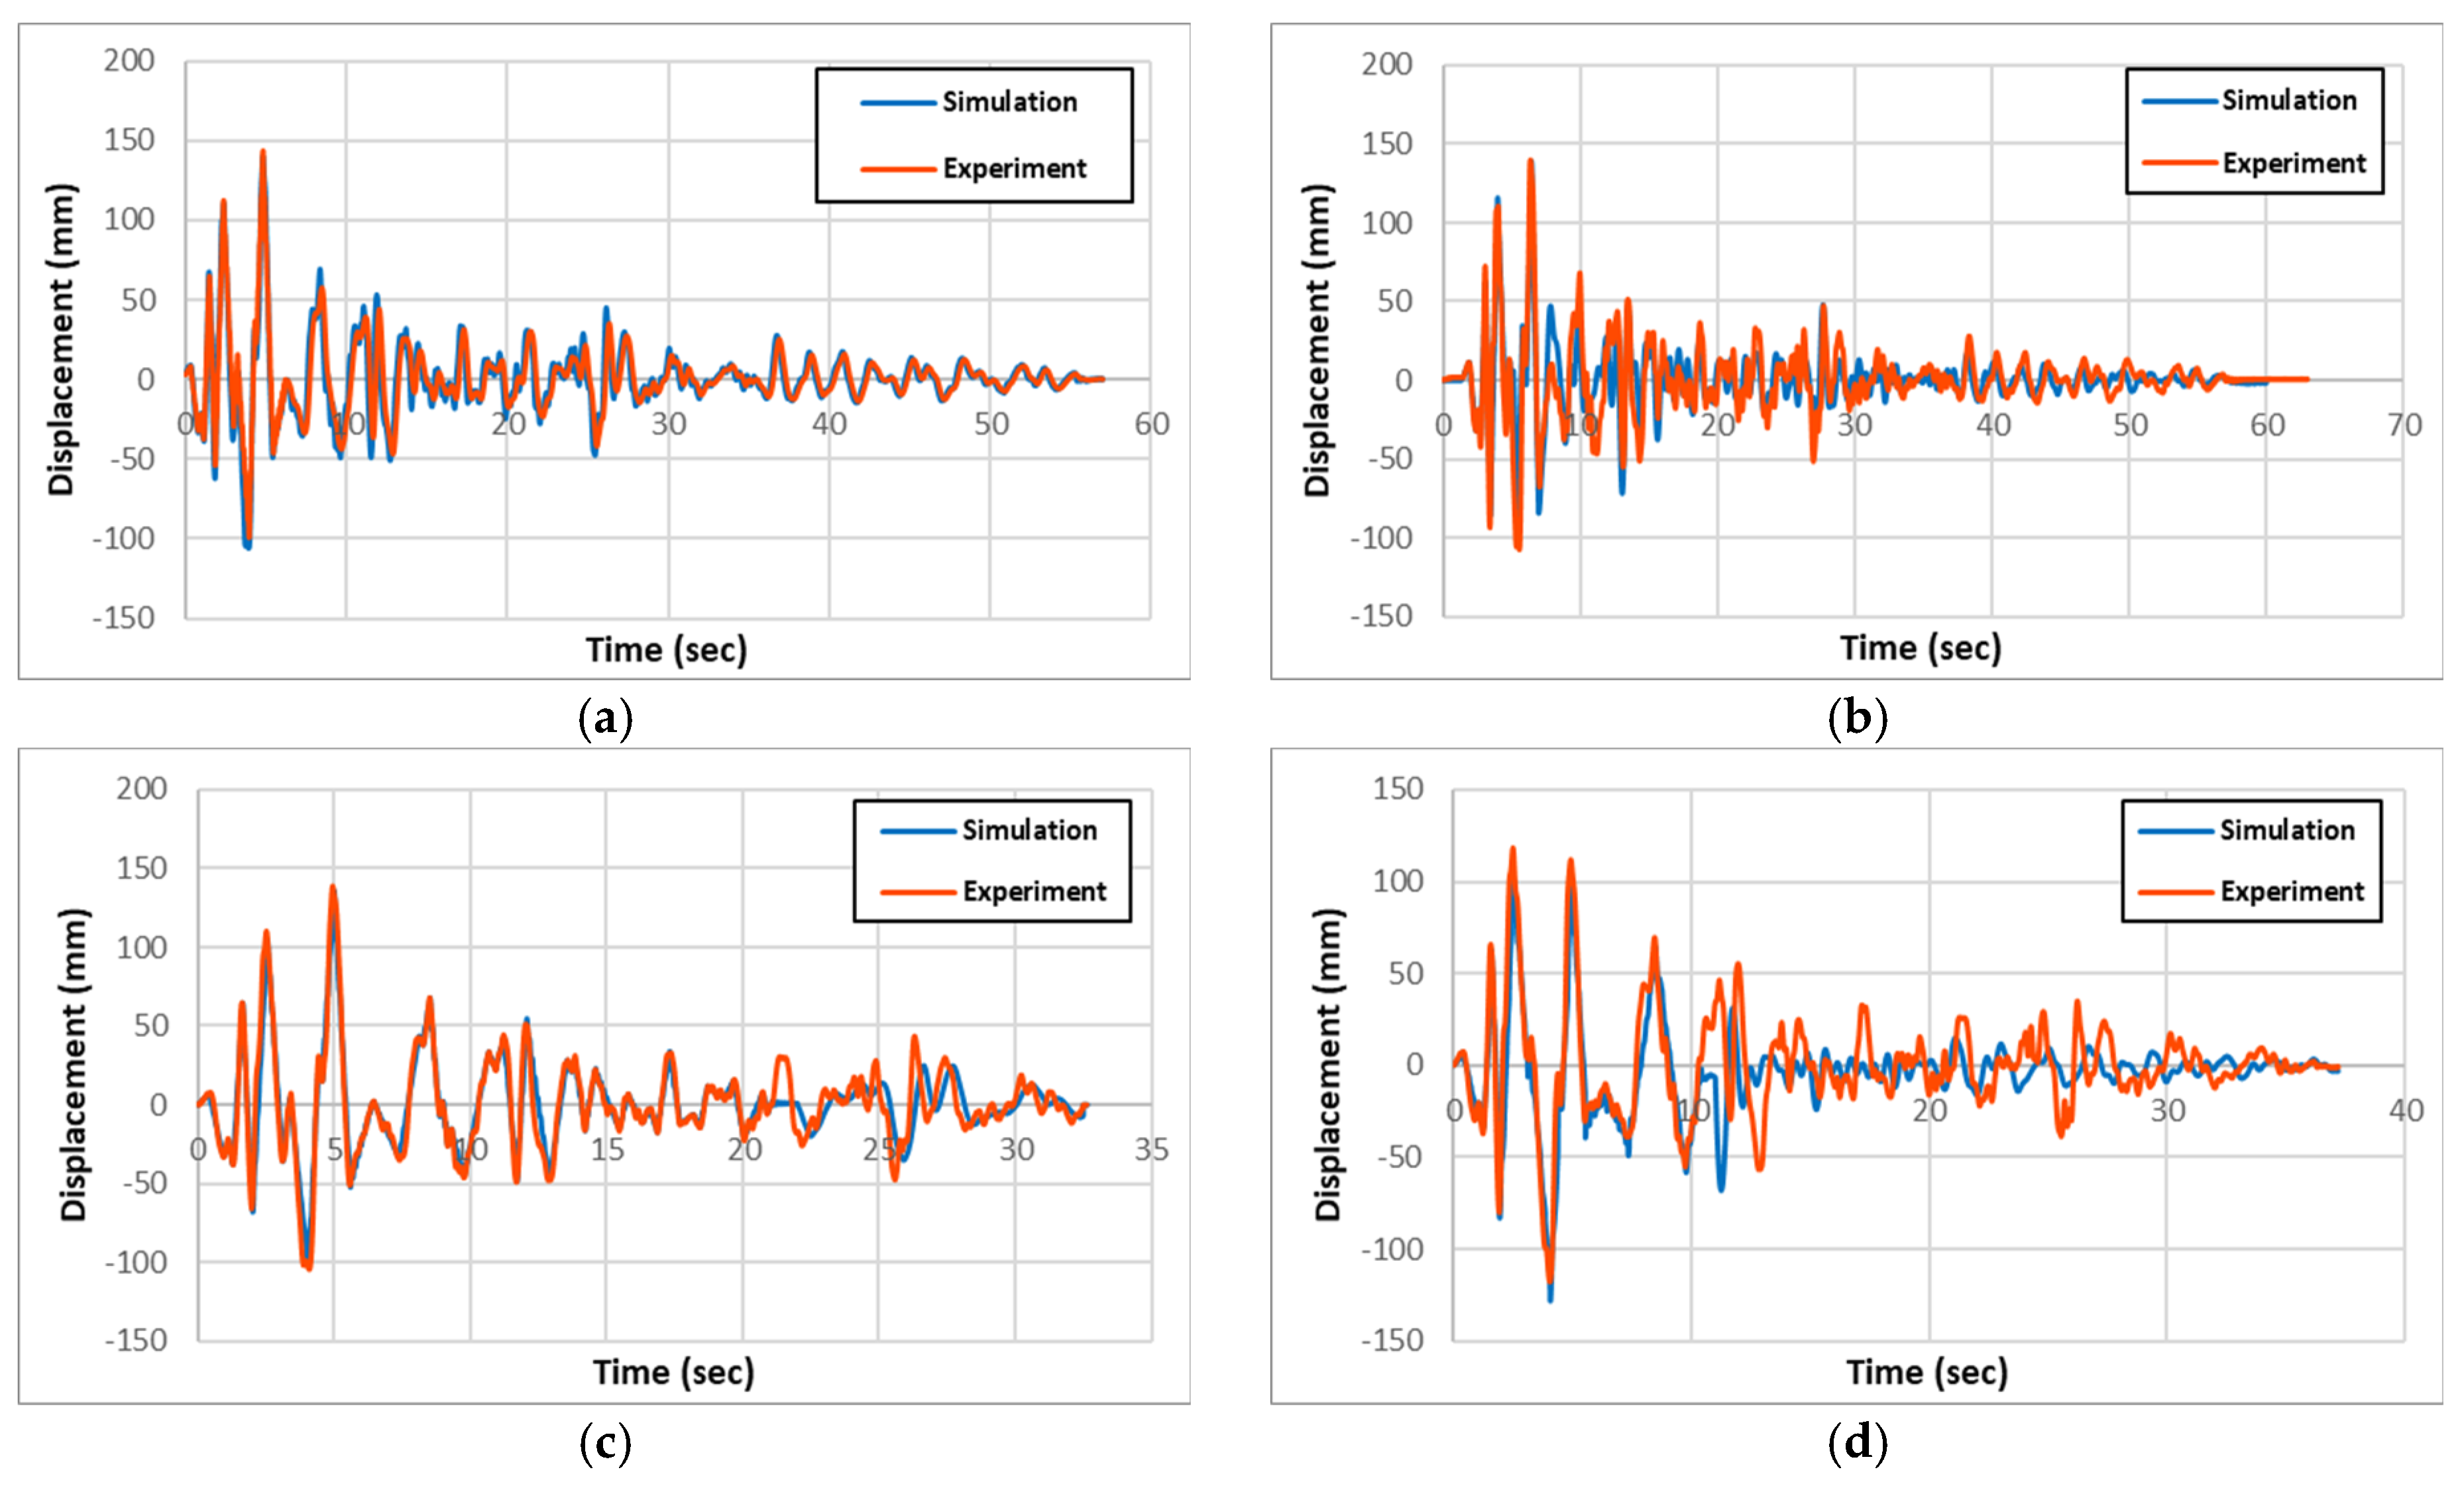
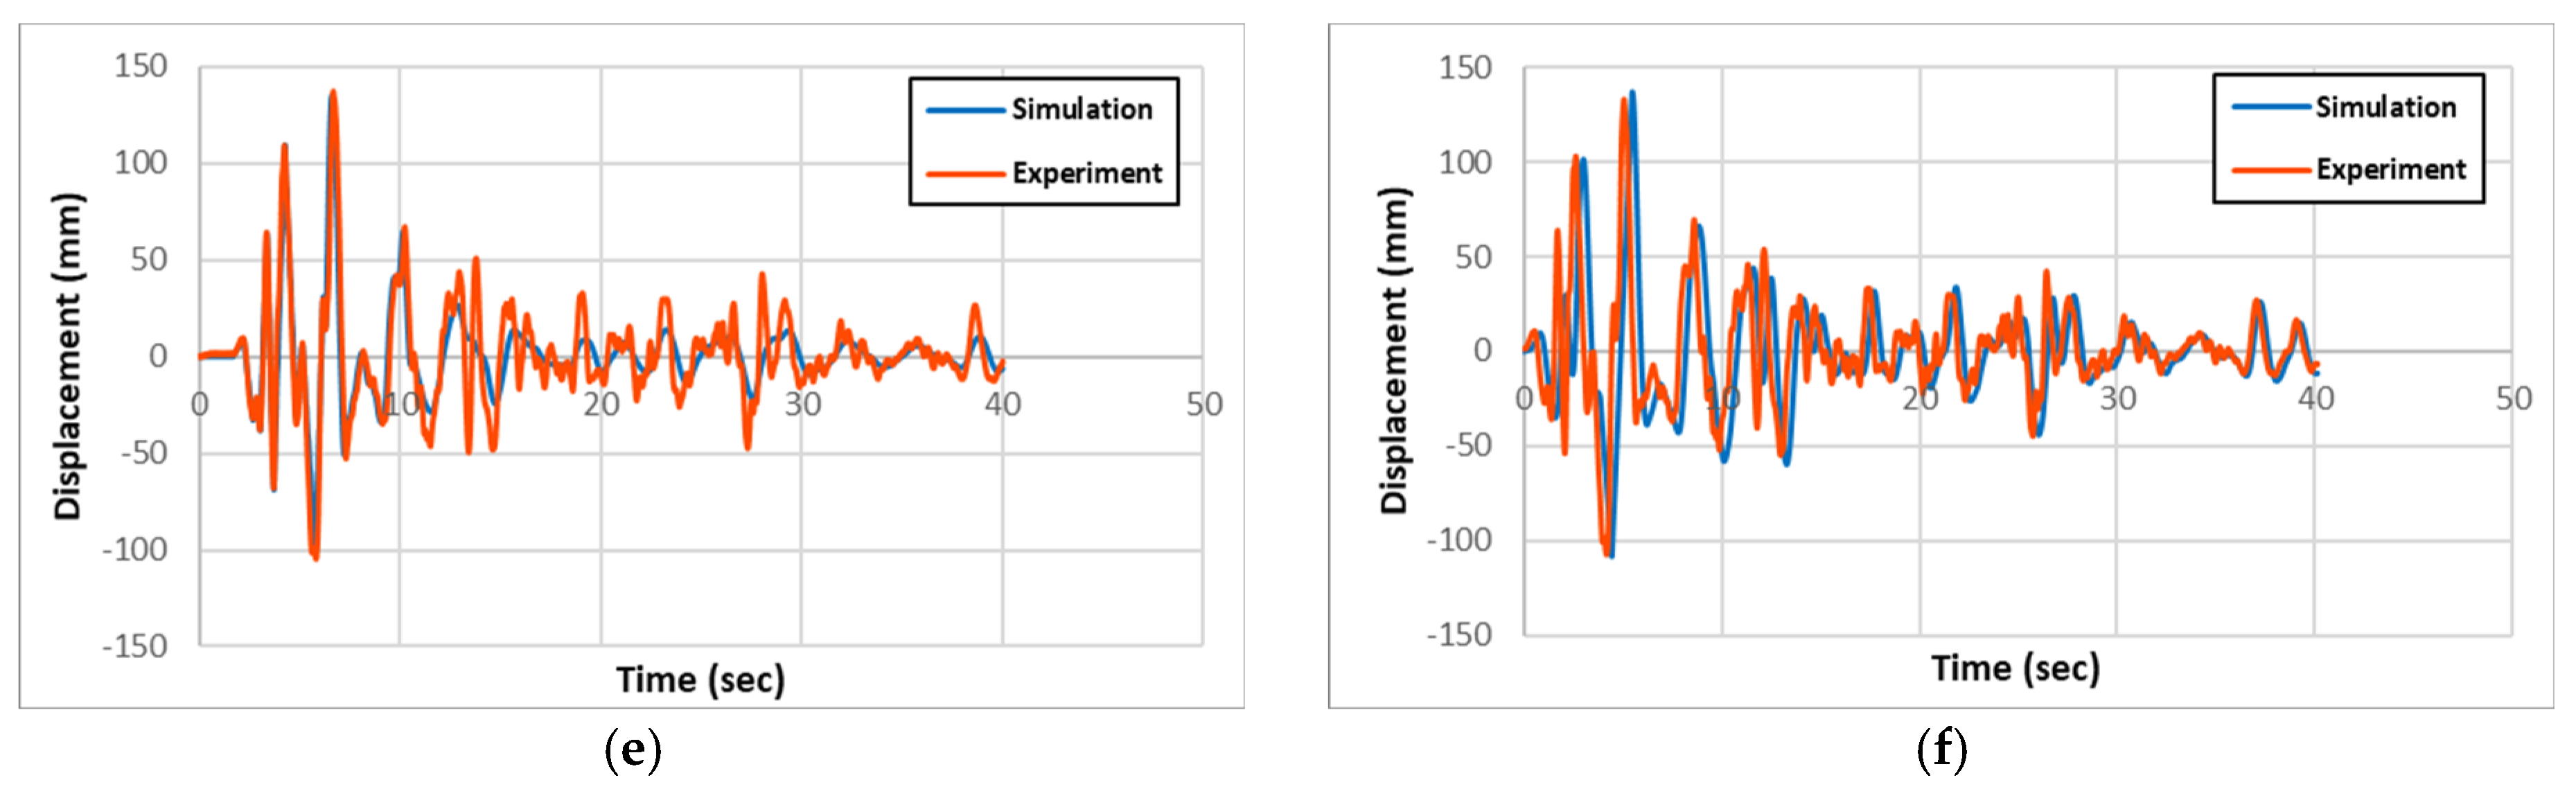
Figure 7.
Comparison of experimental and simulation strain: (a) R-RC; (b) C-RC; (c) R-PU; (d) C-PU; (e) R-GFPU; (f) C-GFPU. * RC: Non-strengthened, C-: Circular column, R-: Rectangular column.
Figure 7.
Comparison of experimental and simulation strain: (a) R-RC; (b) C-RC; (c) R-PU; (d) C-PU; (e) R-GFPU; (f) C-GFPU. * RC: Non-strengthened, C-: Circular column, R-: Rectangular column.
Figure 8.
Force-displacement response and comparison of stiffness: (a) Rectangular cross-section specimen; (b) Circular cross-section specimen.
Figure 8.
Force-displacement response and comparison of stiffness: (a) Rectangular cross-section specimen; (b) Circular cross-section specimen.
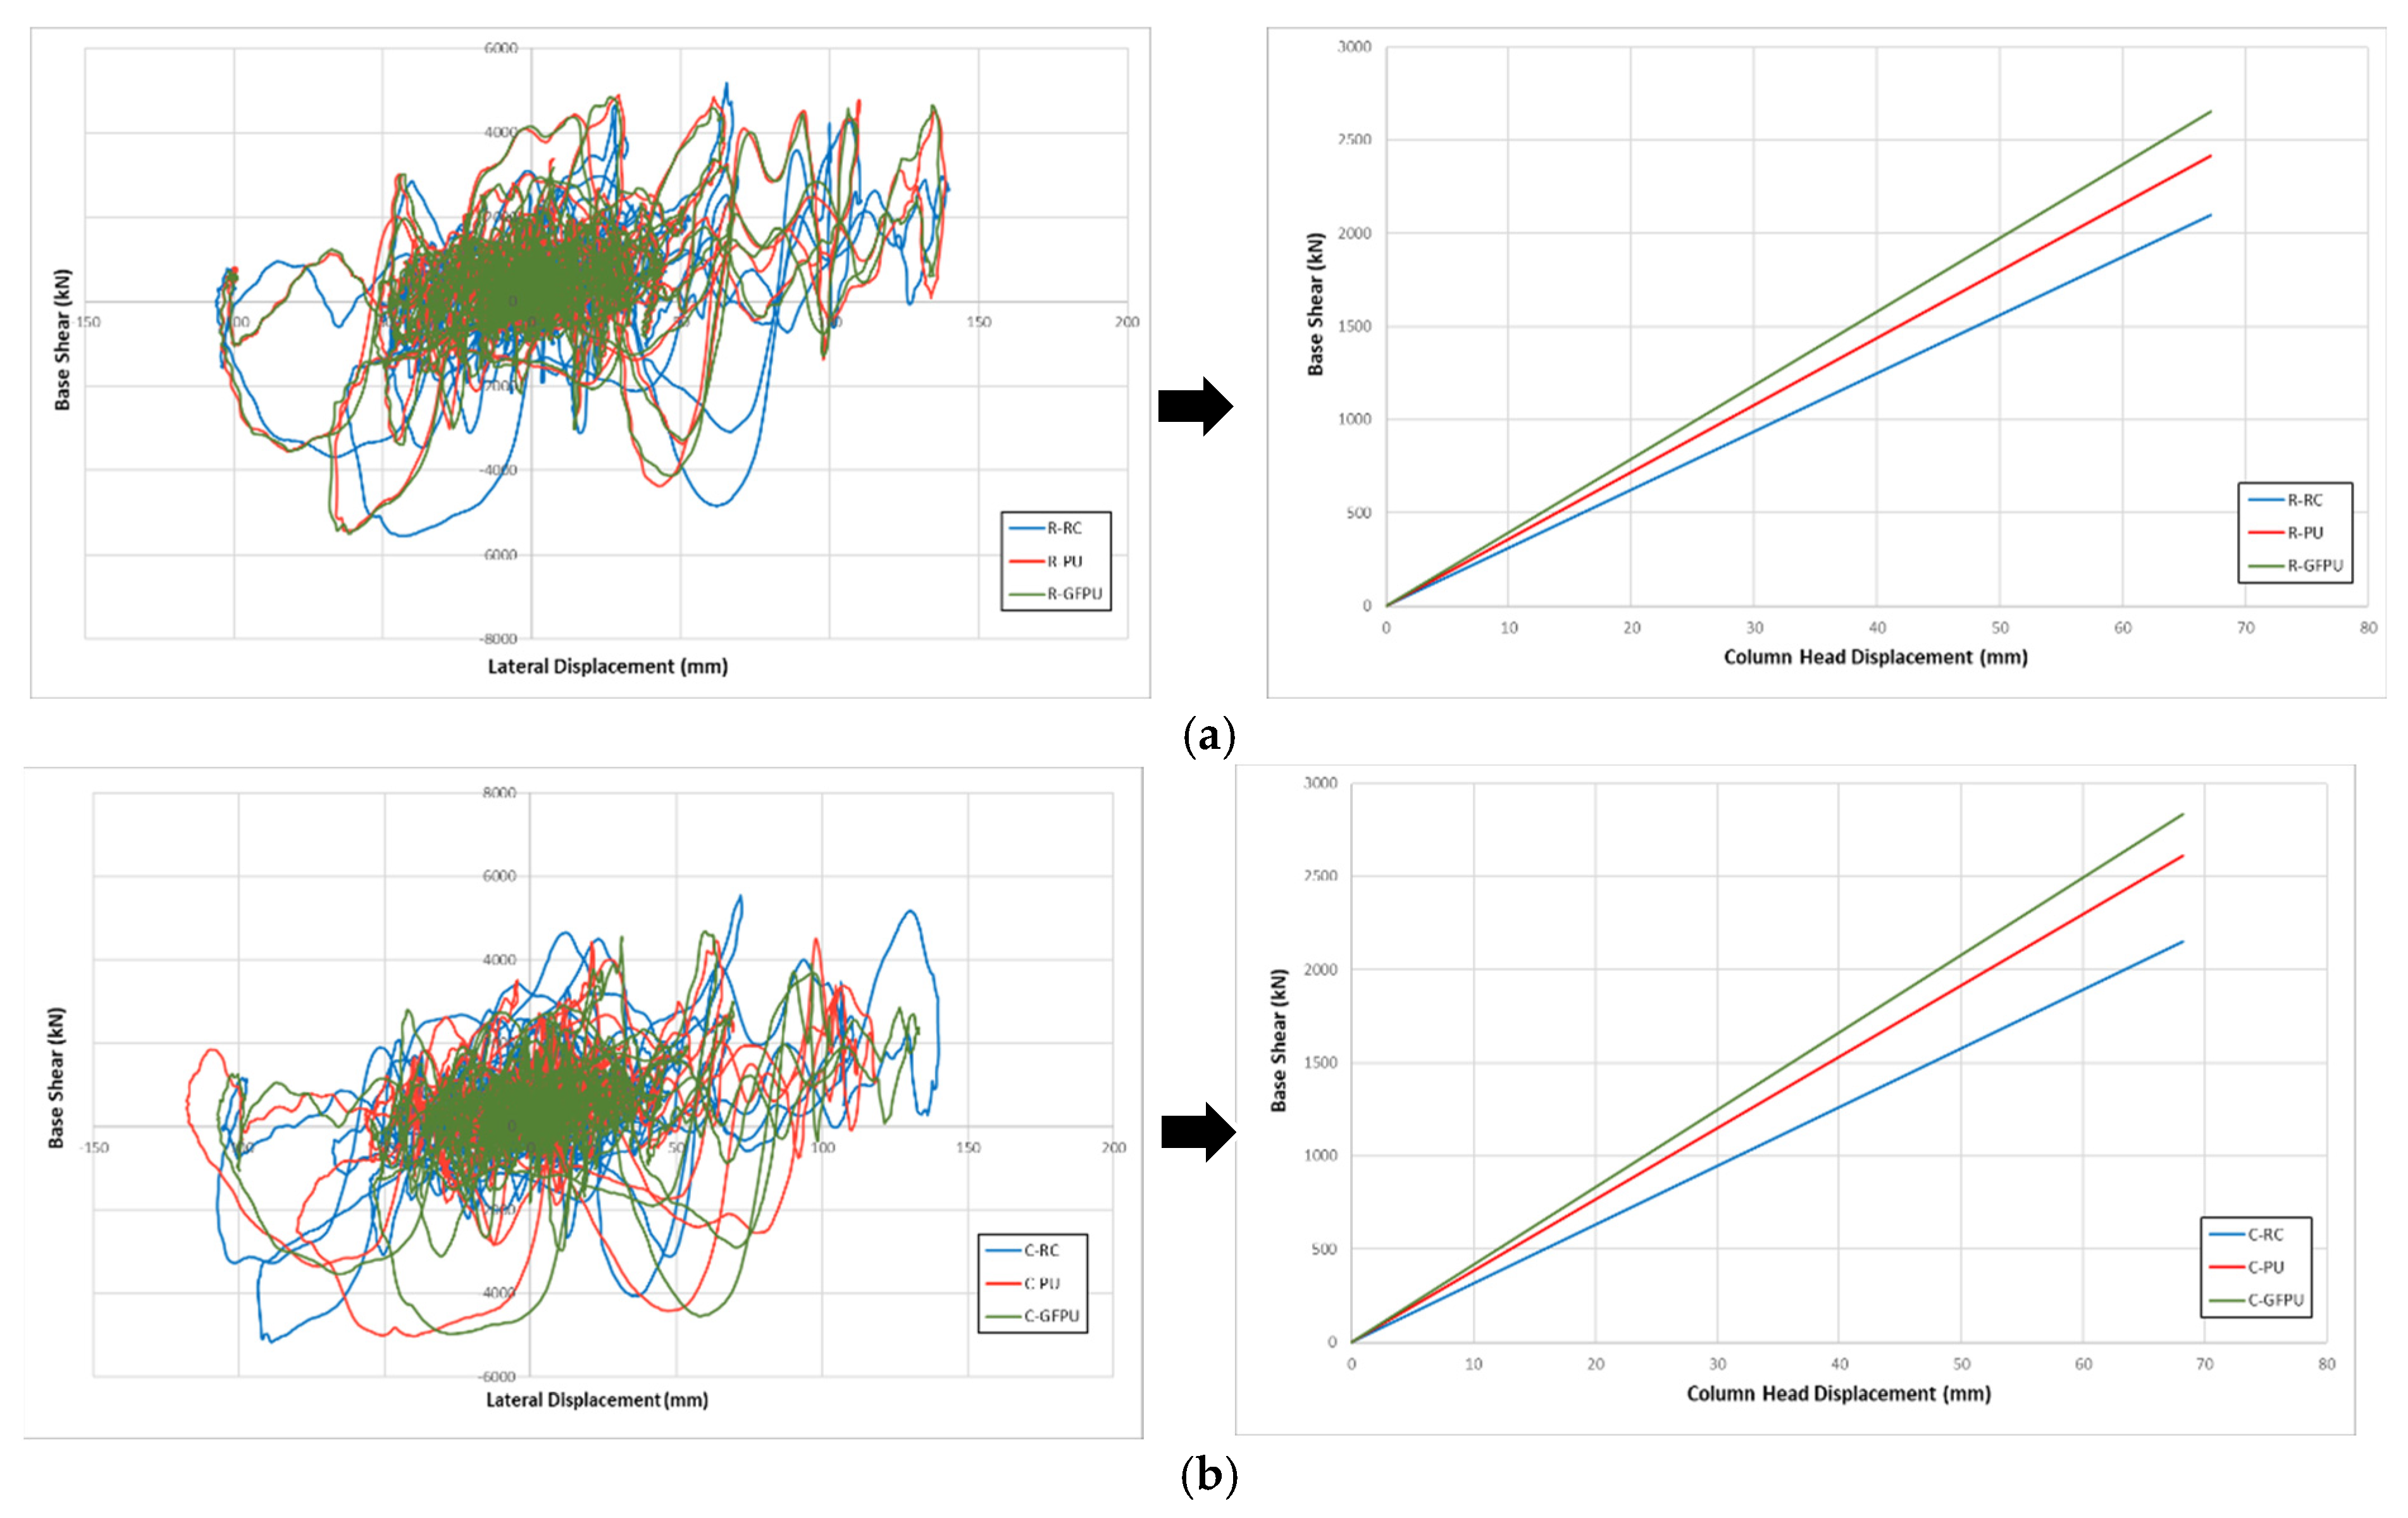
Figure 9.
ALLDMD for column specimen using reinforcement method as the variable: (a) Rectangular cross-section; (b) Circular cross-section.
Figure 9.
ALLDMD for column specimen using reinforcement method as the variable: (a) Rectangular cross-section; (b) Circular cross-section.
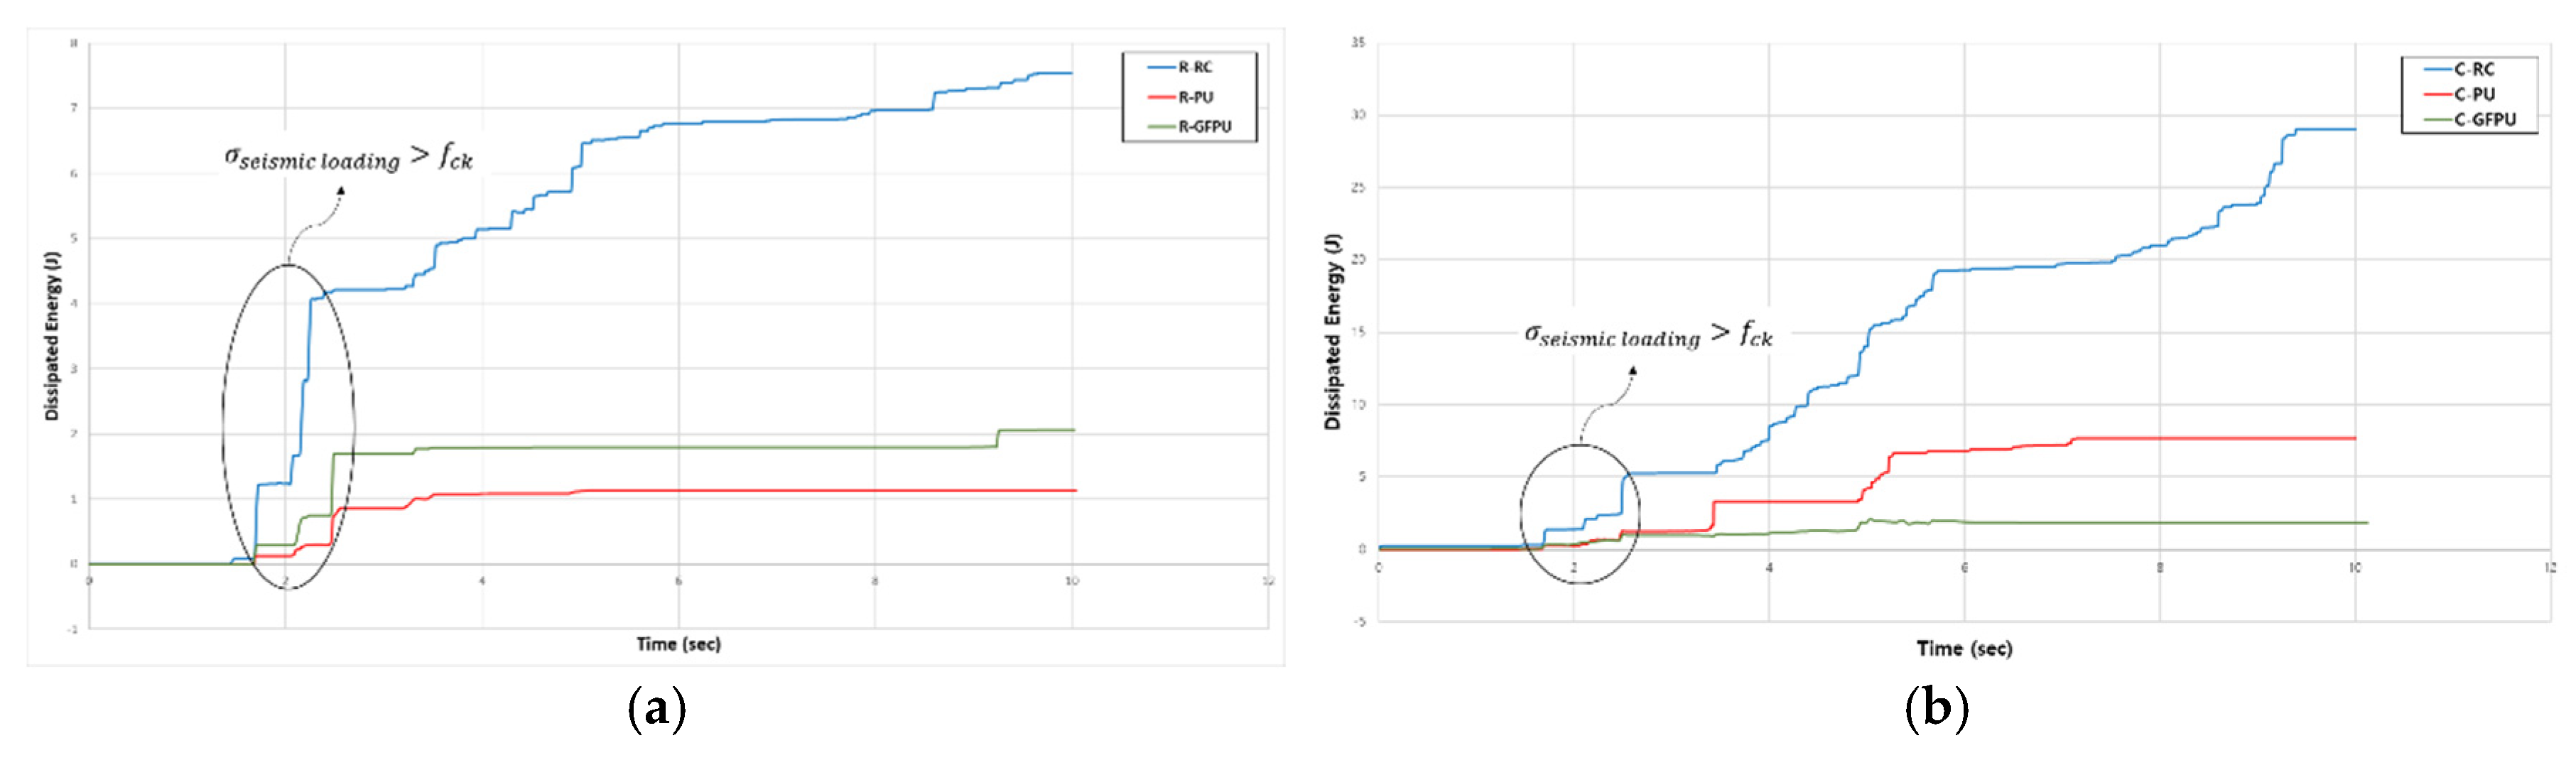
Figure 10.
von-Mises stress distribution: (a) R-RC; (b) R-PU; (c) R-GFPU; (d) C-RC; (e) C-PU; (f) C-GFPU. * RC: Non-strengthened, C-: Circular column, R-: Rectangular column.
Figure 10.
von-Mises stress distribution: (a) R-RC; (b) R-PU; (c) R-GFPU; (d) C-RC; (e) C-PU; (f) C-GFPU. * RC: Non-strengthened, C-: Circular column, R-: Rectangular column.
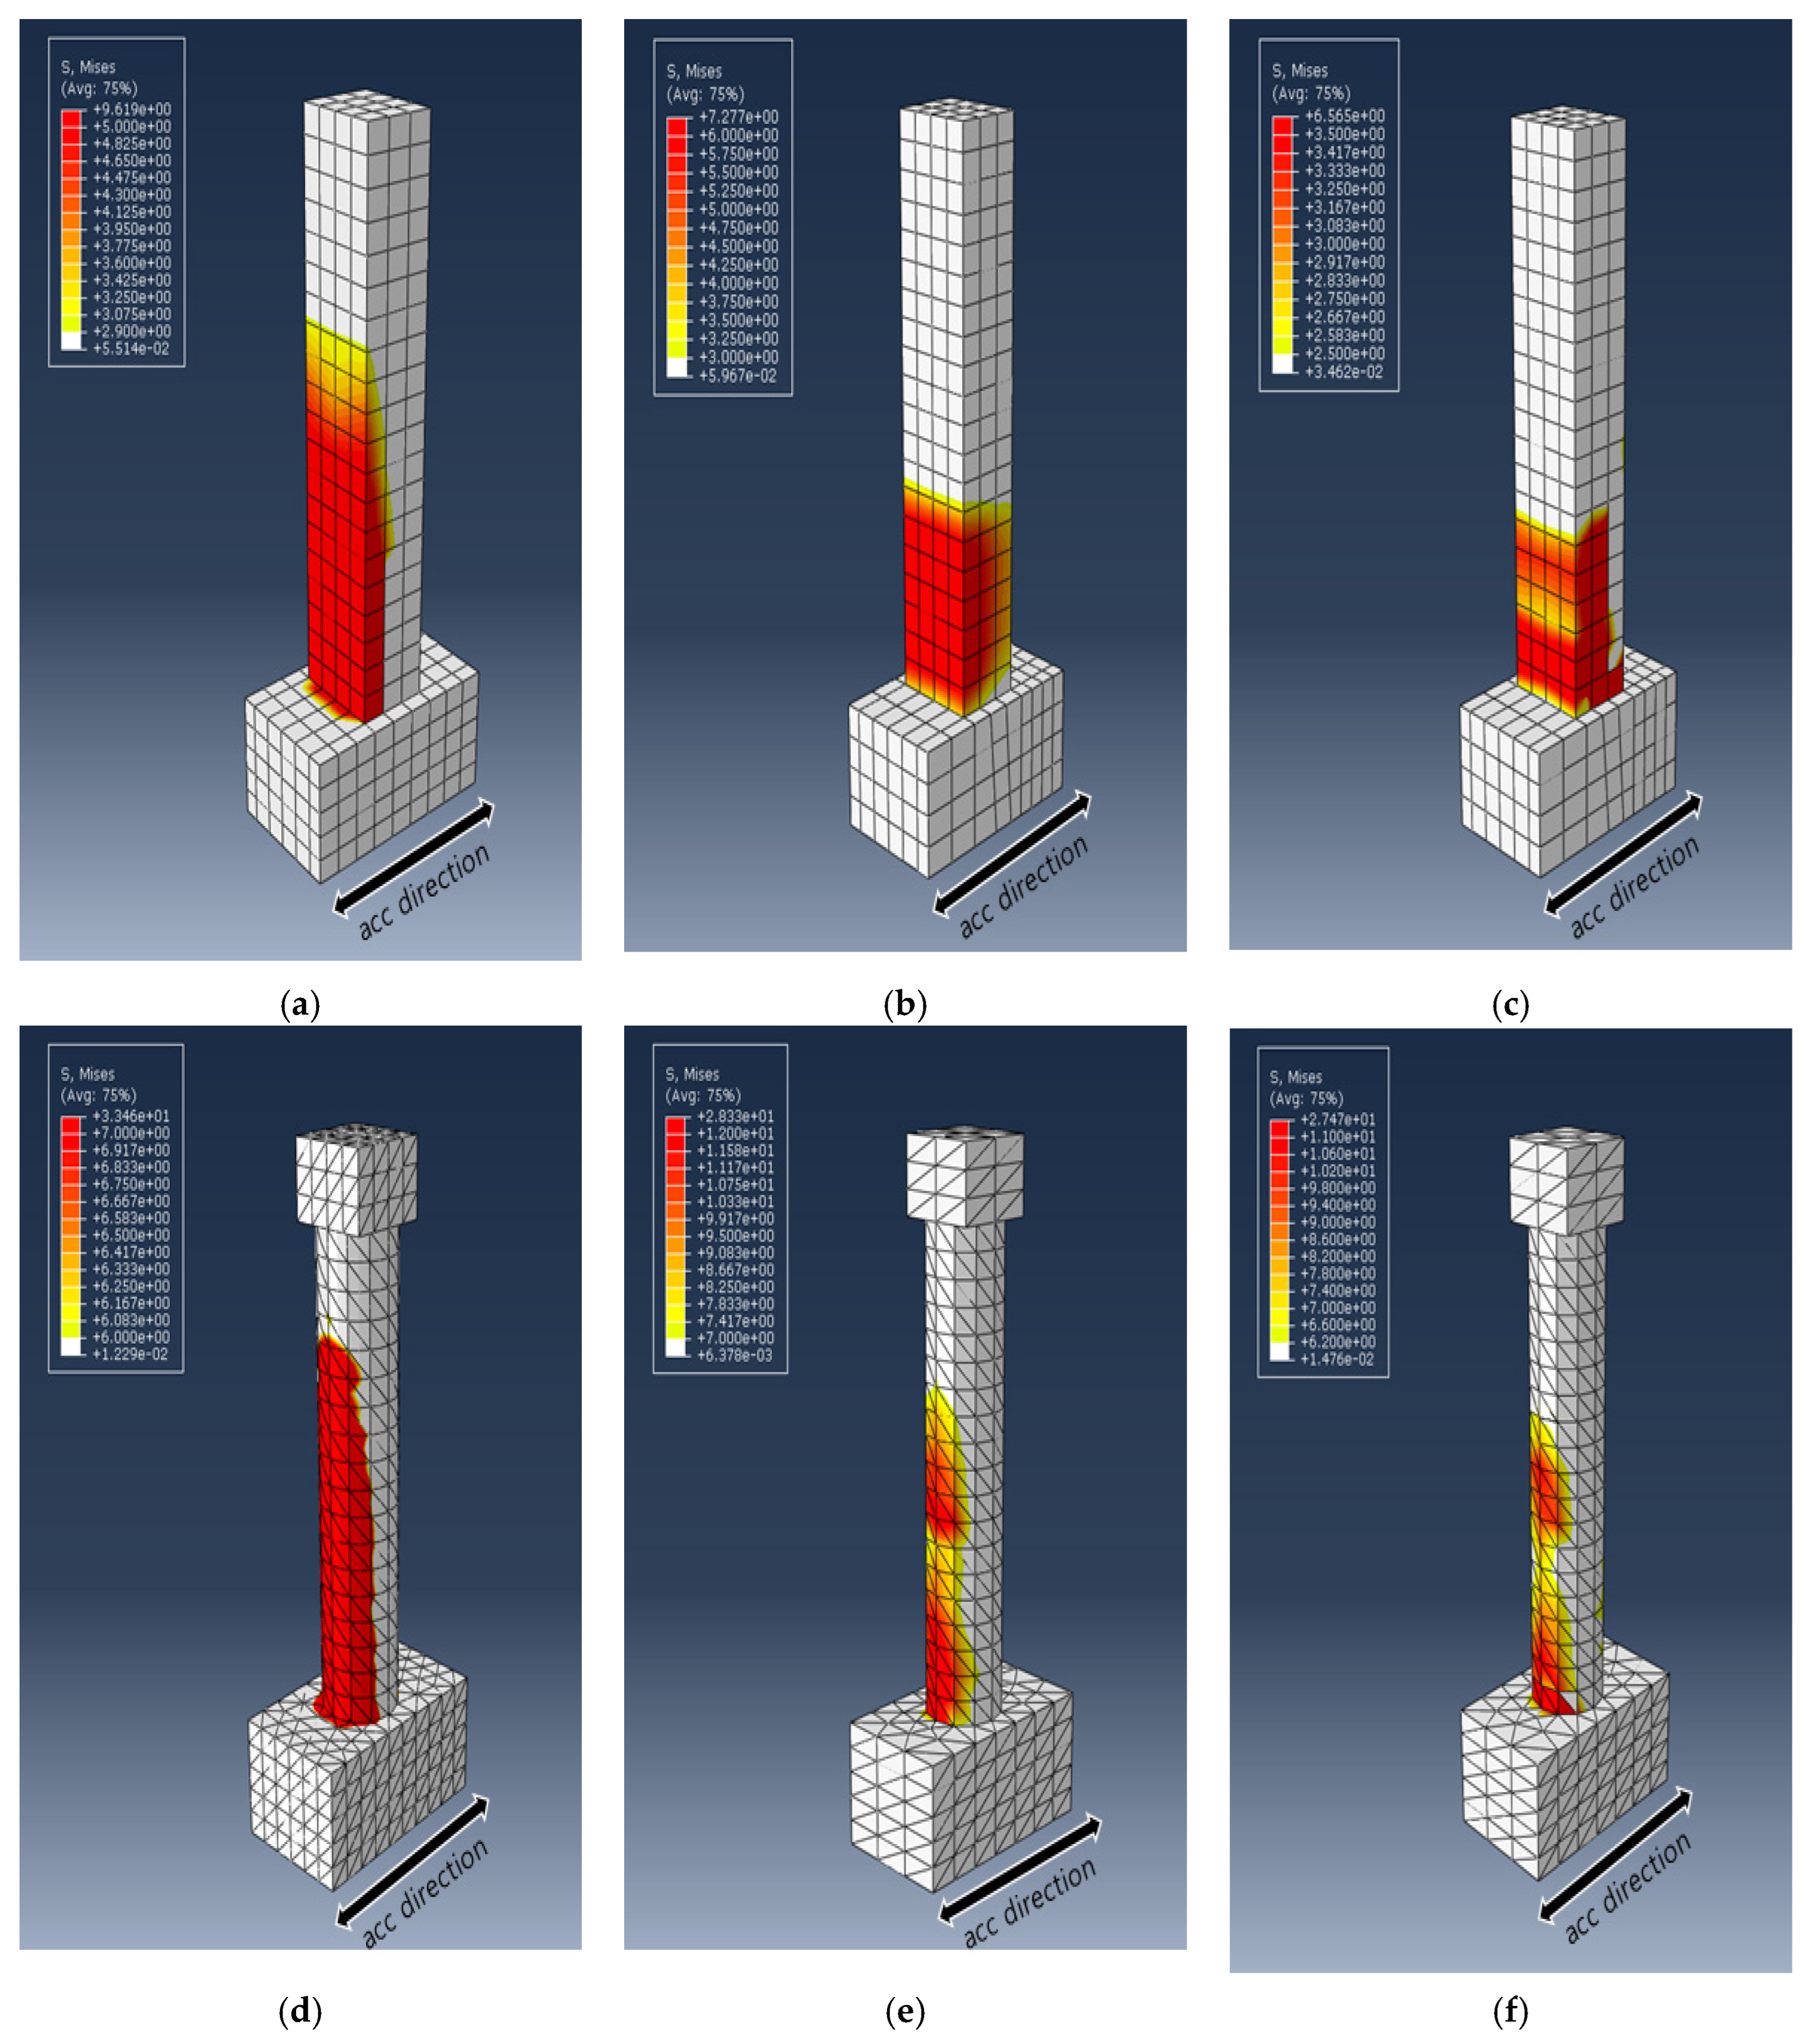
Figure 11.
Effective plastic strain, PEEQ distribution: (a) R-RC; (b) R-PU; (c) R-GFPU; (d) C-RC; (e) C-PU; (f) C-GFPU. * RC: Non-strengthened, C-: Circular column, R-: Rectangular column.
Figure 11.
Effective plastic strain, PEEQ distribution: (a) R-RC; (b) R-PU; (c) R-GFPU; (d) C-RC; (e) C-PU; (f) C-GFPU. * RC: Non-strengthened, C-: Circular column, R-: Rectangular column.
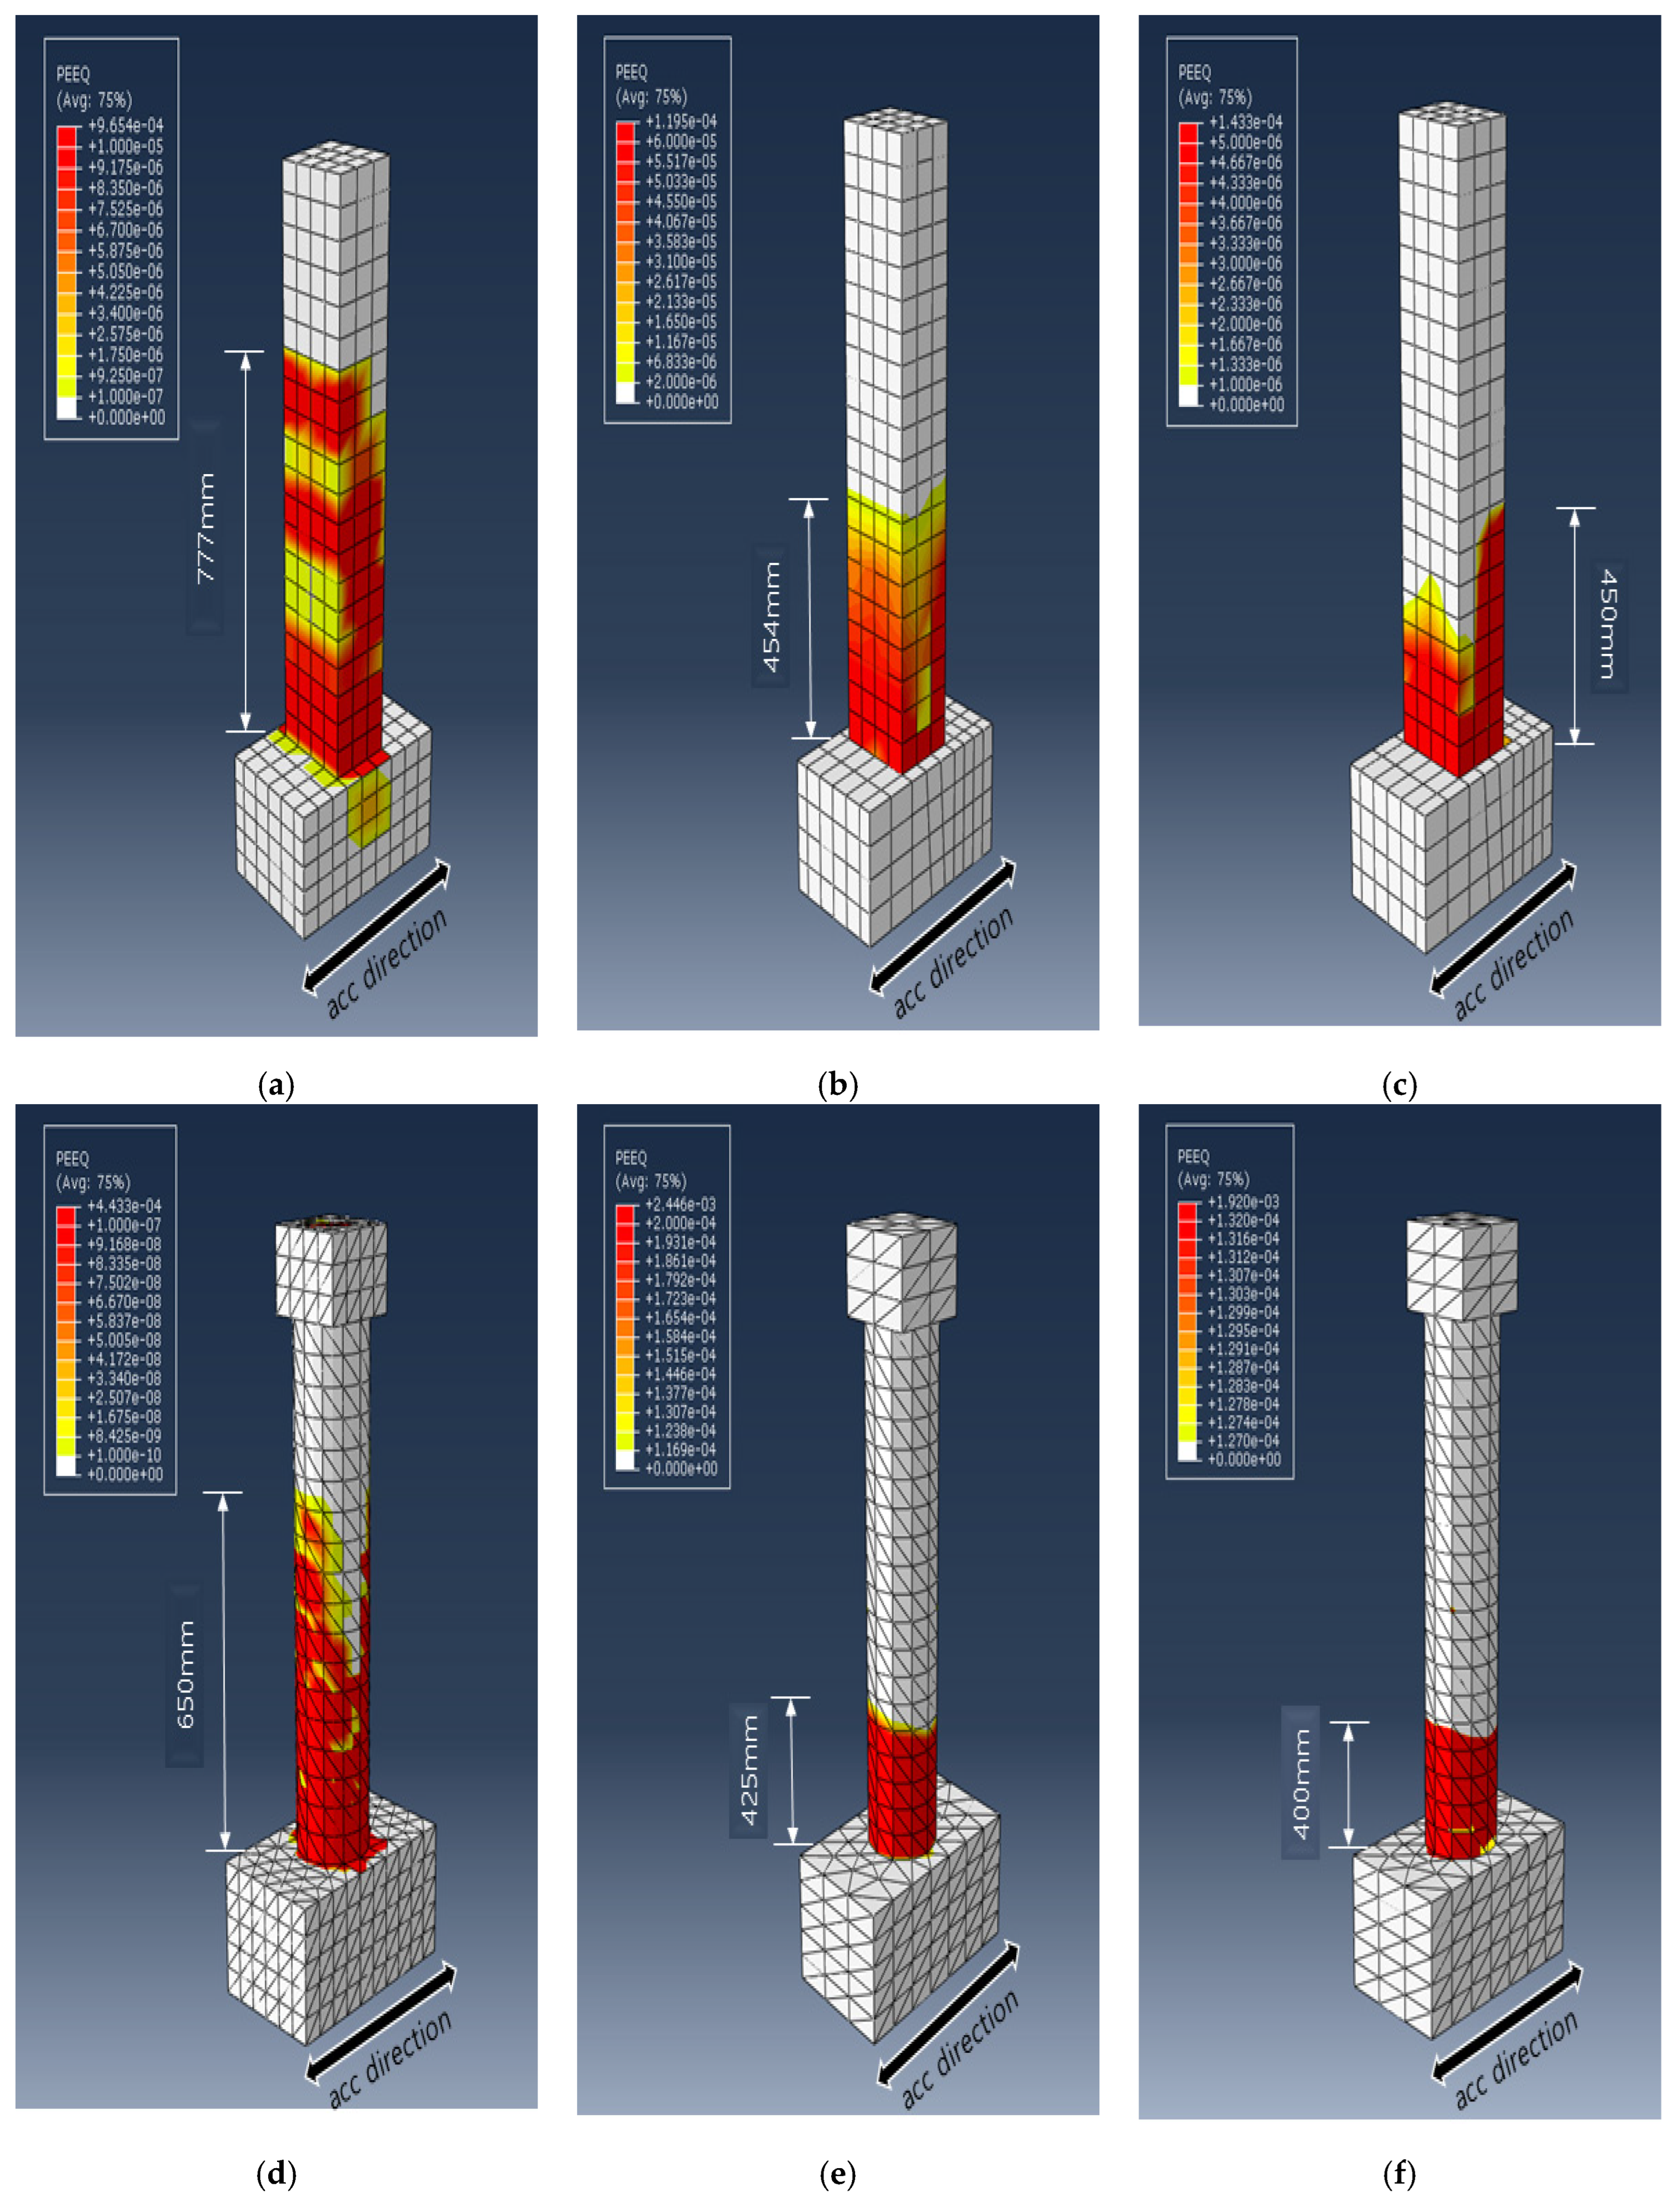

Table 1.
Material Property for Concrete Damage Plasticity.
| Elastic Modulus (MPa) | ψ | ||||||
|---|---|---|---|---|---|---|---|
| 2400 | 27537 | 0.167 | 15 | 0.1 | 1.16 | 0.667 | 0.0005 |
Table 2.
Maximum displacement results of column head for all specimen types.
| Specimen | Column Head(mm) | Difference Rate (%) | |
|---|---|---|---|
| Experiment | Simulation | ||
| R-RC | 140.17 | 143.39 | 2.6 |
| R-PU | 138.86 | 135.74 | 2.3 |
| R-GFPU | 137.41 | 135.06 | 1.7 |
| C-RC | 139.97 | 138.9 | 0.8 |
| C-PU | 118.37 | 128.26 | 8.4 |
| C-GFPU | 133.14 | 137.04 | 2.9 |
Table 3.
Maximum strain results of longitudinal rebar for all specimen types.
| Specimen | Longitudinal rebar strain | Difference Rate (%) | |
|---|---|---|---|
| Experiment | Simulation | ||
| R-RC | 1200 | 1124 | 6.3 |
| R-PU | 330 | 315 | 4.5 |
| R-GFPU | 300 | 335 | 11.7 |
| C-RC | 2420 | 2098 | 13.3 |
| C-PU | 1630 | 1407 | 13.7 |
| C-GFPU | 620 | 630 | 1.6 |
Table 4.
Range of ALLDMD and ratio comparison.
| Specimen | Range of Dissipated Energy (J) | Ratio |
|---|---|---|
| R-RC | 4.21 | 1.00 |
| R-PU | 0.85 | 0.20 |
| R-GFPU | 1.69 | 0.40 |
| C-RC | 5.26 | 1.00 |
| C-PU | 1.23 | 0.24 |
| C-GFPU | 0.97 | 0.18 |
* RC: Non-strengthened, C-: Circular column, R-: Rectangular column.
Disclaimer/Publisher’s Note: The statements, opinions and data contained in all publications are solely those of the individual author(s) and contributor(s) and not of MDPI and/or the editor(s). MDPI and/or the editor(s) disclaim responsibility for any injury to people or property resulting from any ideas, methods, instructions or products referred to in the content. |
© 2025 by the authors. Licensee MDPI, Basel, Switzerland. This article is an open access article distributed under the terms and conditions of the Creative Commons Attribution (CC BY) license (http://creativecommons.org/licenses/by/4.0/).
Copyright: This open access article is published under a Creative Commons CC BY 4.0 license, which permit the free download, distribution, and reuse, provided that the author and preprint are cited in any reuse.


