Submitted:
12 March 2025
Posted:
13 March 2025
Read the latest preprint version here
Abstract
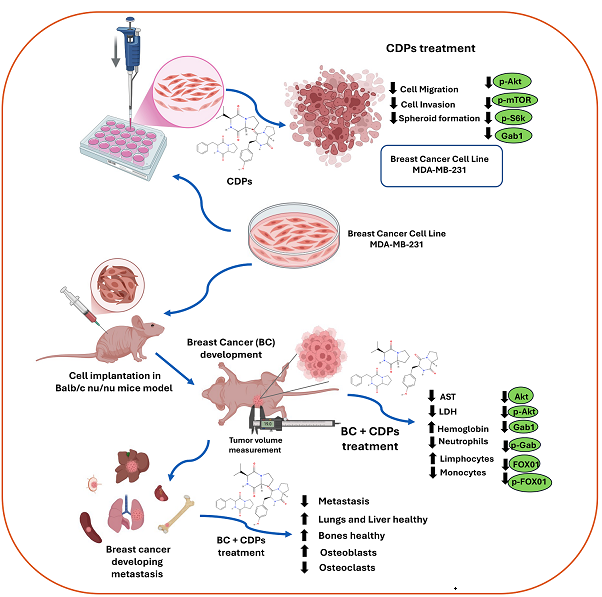
Background: Triple-negative breast cancer (TN-BC) is the leading cause of death from neoplasms in women worldwide, related to a high rate of metastasis and low survival in patients. Bacterial cyclodipeptides (CDPs) have anticancer properties in several types of cancer in vitro as in vivo models, targeting several signaling pathways. Methods: The effect of the CDPs on advanced-stage tumors developed and their ability to prevent the appearance of metastatic foci through the implantation of the TN-BC MDA-MB-231 cells in the mammary tissue of mice model was evaluated. Results: CDPs treatment decreased the migratory and invasive capacity of the MDA-MB-231 and MCF-7 breast cancer lines in vitro more efficiently than methotrexate (MTX) (p>0.001). The anti-metastatic effect in the TN-BC was associated with the down-regulation of the Akt/mTOR/S6K pathway and the metastasis markers Gab1, MMP-9, and Vimentin. Mice xenografted with MDA-MB-231 administrated with CDPs and combined with CDPs+MXT showed a significant decrease in primary tumor development and metastatic foci (p>0.001). Likewise, the metastatic foci were observed in the lungs, liver, and femur, which were inhibited by CDPs. Metastatic behavior in the skeletal system was alleviated with the CDPs and CDPs+MTX treatments. In addition, the metastasis markers p-Akt, Gab1, and FOX01 were significantly down-expressed in the tumor tissue of mice implanted with TN-BC submitted to CDPs treatment. Conclusions: The anti-metastatic effects of bacterial CDPs involve the phosphorylation inhibition of the Akt/mTOR/S6K pathway and the metastasis markers Gab1, MMP-9, Vimentin, and FOX01. The finding indicates that the CDPs, in combination with MTX, potentialize the anti-neoplastic property in TN-BC, proposing the CDPs as a viable alternative in human breast cancer therapy.
Keywords:
Cyclodipeptides
; anti-metastatic
; breast cancer
; invasiveness
; metastasis
; immunosuppression mice model
1. Introduction
Breast cancer is the principal cause of death in women worldwide; it is a clinically heterogeneous disease and around 10-15% of patients present aggressive phenotypes and develop metastasis [1]. Triple-negative breast cancer comprises a group of diseases with different histological, genomic, and immunological profiles, characterized by lacking hormonal estrogen and progesterone receptors, as well as HER2 receptors. According to postulate in the “soil and seed” theory, tumor cells thrive in those tissues with genetic and metabolic characteristics similar to their needs. For example, breast cancer cells tend to metastasize the bone, lung, and liver [https://www.cancer.gov]. Other factors in developing breast cancer, such as obesity, represent a poor prognosis for patients since the interaction of adipocytes with tumor cells provides an optimal microenvironment that favors proliferation, invasion, metastasis, or resistance to cell death[2]. The tumor microenvironment also recruits the malignant cells with other types of cells, such as adipocytes, mesenchymal-type cells such as fibroblasts, and the cells of the immune system, such as macrophages, T-lymphocytes, and neutrophils. These interactions are mediated by secretion of chemokines, interleukins, or growth factors, which promote proliferation, invasion, and resistance to cell death, positioning these components as possible new therapeutic strategies[3].
Among the first-line therapeutic options for treating metastatic breast cancer are taxanes, anthracyclines, methotrexate, carboplatin, PD-1 or PD-L1 inhibitors, PARP inhibitors, and their combination with immunotherapy, radiotherapy, and surgery[4]. However, a significant percentage of patients negatively respond to these treatments, resulting in low survival and poor quality of life. Therefore, the search for new therapeutic options that improve the prognosis for patients with metastatic breast cancer is of great importance.
Bone metastasis is a common complication in advanced-stage breast and prostate cancer, disrupting the bone remodeling cycle mediated by osteoblasts and osteoclasts[5]. Currently, available T cell-based immunotherapies promise in cancer treatment; however, potential benefits for patients with bone metastases remain unclear[6]. Metastases predominantly occur in trabecular and red marrow-rich bones, suggesting that specific bone environments favor metastatic growth[7]. Other common metastatic sites include the lungs and brain. Once bone metastases develop, the five-year survival rate drops to approximately 20%[8]. Bone metastases significantly impact patient health, yet current treatments—including bisphosphonates and antiresorptive antibodies remain insufficient; therefore, develop of novel therapies that target both tumor cells and the bone microenvironment with dual antiresorptive (reducing bone remodeling) and anticancer properties are required[9].
Cyclodipeptides are a class of molecules synthesized by a broad type of organisms, which possess enjoyable biological activities such as cytotoxic effects in different cancer cell lines[10,11,12]. Previously, we described that CDPs produced by the Pseudomonas aeruginosa PAO1 bacterium induce apoptosis in cervical, colon, leukemia, and melanoma cancer cells by inhibiting phosphorylation of multiple kinases from the PI3K/Akt/mTOR pathway, including mTORC1/C2 complexes[11]. Furthermore, in a mouse murine melanoma model, a significant decrease of tumors in mice treated with CDPs at 0.1 mg/g of weight was found. Additionally, treatment with CDPs led to restoration of hematological parameters and decrease in tissue damage markers AST and ALT, as well as a marked decrease in the expression of proteins mediating pathways involved in energy metabolism, lipid synthesis, epithelial-mesenchymal transition, invasion, and metastasis[13]. Interestingly, transcriptomic analysis in HeLa cells found that CDPs inhibit gene expression in the mevalonate pathway and lipid synthesis[14]. Given this background, we sought to determine whether CDPs could have a promising effect on breast cancer and whether this effect could be observed in advanced stages of tumorigenesis[15].
In this work, we first used monolayer culture to evaluate the migratory and invasive potential of MDA-MB-231 and MCF-7 human breast cancer cell lines treated with CDPs and combined with Methotrexate. Further, the effect of the CDPs on advanced-stage mammary tumors developed and their ability to prevent the appearance of metastatic foci through the implantation of the MDA-MB-231 cells in the mammary tissue of mice model was evaluated.
2. Materials and Methods
2.1. Chemicals, Reagents, and Cell Culture
Chemicals and reagents included are Dulbecco’s modified Eagle’s medium (DMEM; Sigma-Aldrich), fetal bovine serum (FBS; Gibco Life Technology), and trypsin solution (Sigma Life Science). Cyclodipeptides were isolated from P. aeruginosa PAO1 cells-free supernatant[16]. CDPs were dissolved in a DMSO-water ratio of 1:3 to prepare stock solutions (100 mg/mL). The MCF-7 is a human metastatic breast cancer cell line (adenocarcinoma) dependent on estrogen, progesterone, and glucocorticoid receptors (ATCC, Manassas, VA, USA)[17]. The MDA-MB-231 cell line was obtained from invasive ductal carcinoma (ATCC, Manassas, VA, USA). This cell line is estrogen receptor (ER), progesterone receptor (PR), and E-cadherin negative, p53 mutated, lacking the growth factor receptor HER2, commonly used as a study model of triple-negative breast cancer[18]. MDA-MB-231 cells, when implanted in xenografts, spontaneously metastasize to lymph nodes. MDA-MB-231 and MCF-7 cell lines were cultured in complete media [DMEM supplemented with 10% (v/v) FBS, 100 units/mL of penicillin, 40 µg/mL of streptomycin, and 1 µg/mL of amphotericin B (Sigma-Aldrich Co.), supplemented with 1.6 g/L of glucose. Cell culture media were changed twice a week, incubating at 37 °C under 80% humidity and an atmosphere of 5% CO2 to confluency. Cells were then trypsin-treated, counted using a hemocytometer chamber, and used for subsequent assays. Cell cultures and other procedures were performed in class II biological safety cabinets.
2.2. Wound Closure Migration Assay
MDA-MB-231 and MCF-7 cell lines were grown in a 95% confluent monolayer, and three wounds were made per plate with a sterile pipette tip in assays by triplicate. Plates were washed with PBS twice, and fresh complete medium was placed; the CDPs, MTX, and combined treatments were placed for 48 h, and photographs were taken every 24 h to subsequently quantify the wound area using the ImageJ software (NIH).
2.3. Invasion Assay
MDA-MB-231 or MCF-7 cell lines were cultured in a transwell chamber previously coated with Matrigel (Corning, Life Sciences) with complete DMEM medium. Co-culture was carried out using Raw 264.7 macrophages seeded in the lower chamber with complete DMEM medium and treatments with CDPs or MTX at 0.01 and 0.005 mg/mL concentrations, respectively.
2.4. Multicellular Microspheroids
MDA-MB-231 or MCF-7 cell lines were cultured (2 x10⁵ cells) under non-stick conditions (0.6% agarose) in complete DMEM medium for 14 days with periodic medium changes until the spheroids reached a size of 40-50 µm. Once, treatment with CDPs (0.1 mg/mL), CDPs+cd (0.1 mg/mL), or CDPs-MTX containing (0.1 mg/mL CDPs, 0.05 mg/mL MTX) was applied. Photographs were taken at 72 h of treatment, and a cell viability test was performed on the remaining cells using an MTT reduction assay. MTT, 50 mg/mL in PBS, was added to each well and incubated for 4 h at 37°C. Finally, 100 µL of 2-propanol/1M HCl (19:1, v/v) was added to dissolve the formazan crystals, and the absorbance was measured at 595 nm using a microplate reader (BioTek Instruments).
2.5. Western Blot
Confluent MCF-7 and MDA-MB-231 cells treated with 0.1 mg/ml of CDPs incubated for 15 min, 1 h, and 4 h were harvested after trypsin treatment and washed twice with PBS, subsequently centrifuged at 5000 × g at 4 °C for 10 min and resuspended in RIPA lysis buffer. The cell suspension or tumor tissue were lysed by three cycles of sonication at low intensity (20 kHz, 5 W) for 30 s each at 4 °C (Hielscher-LS24 Ultrasound Technol). The protein extract free of cellular debris was obtained by centrifugation at 7500 × g for 15 min, and the protein concentration was determined by the Bradford method (BioRad). Protein extract were separated on 10% (SDS-PAGE) polyacrylamide gels and transferred to PVDF membranes (Millipore, Billerica, MA, USA) in a BioRad transfer chamber at 15 volts for 45 min. Briefly, PVDF membranes were incubated with TBS-T (Tris-HCL 10 mM; NaCl 0.9%; tween-20 0.1%, dry milk 5%, pH 7.8). They were washed three times with TBS-T for 6 min each and incubated with primary antibodies dissolved in TBS-T at the concentration suggested by the manufacturer. Antibodies were used: anti-AKT, anti-p-AKT (Ser 473), anti-mTOR, anti-p-mTOR, anti-S6K, anti-p-S6K, anti-Vimentin; anti-Gab1, anti-FOX01, anti-p-FOX01, and anti-b-actin (Santa Cruz Biotechnology, Santa Cruz, CA, USA and Cell Signaling Technology, MA, USA). All primary antibodies were incubated for 12 h at 4°C and subsequently three washes by 6 min with TBS-T were performed and then incubated with anti-mouse secondary HRP-conjugated antibody (BioRad, CA, USA) at a concentration of 1:10,000 in TBS-T for 2 h; membranes were washed as above and developed with Supersignal West Pico Luminol (Pierce; Thermo Fisher Scientific, Waltham, MA, USA). Then, images were captured using a ChemiDoc™ MP System (Bio-Rad). Assays were conducted at least three times, and representative images are shown. The Image J software (NIH) was used to quantify image band intensities.
2.6. Orthotopic Model of Metastatic Breast Cancer
Immunosuppressed Balb/c nu/nu female mice aged 8 weeks were adapted for 15 days in a pathogen-free environment with a standard diet and drinking water ad libitum. The cages, water, food, and bedding were autoclaved. Animal manipulation was authorized by the Institutional Animal and Use Committee (IACUC) from the Universidad Michoacana de San Nicolás de Hidalgo (IIIQB-UMSNH-IACUC-2022-35). Experiments complied with standard guidelines for the welfare of animals following the Institutional Committee and recommendations of the Mexican Official Regulations for the Use and Care of Animals (NOM 062-ZOO-1999; Ministry of Agriculture, Mexico). Animal handling, feeding, and care were done by trained personnel under the NIH guide for the care and use of laboratory animals.
Once the adaptation period had concluded with 100% survival of the mice, 1 x10⁵ MDA-MB-231 metastatic breast cancer cells suspended in Matrigel were inoculated by direct injection into the nearest breast fat pad to the right armpit. Mice were sedated with a ketamine (ket)/xylazine (xyl) solution intraperitoneally (IP) (80 mg/kg ket + 10-15 mg/kg xyl) and kept on a thermal mat during sedation to prevent hypothermia. The mice's weight was monitored, and the longest diameter “a” and the shortest diameter “b” of the tumor were measured with a caliper; the tumor volume was determined using the tumor volume formula (TV) = (0.4) (ab2), “a” was the long diameter and “b” the short diameter of the visual tumor. The treatment consisted of 0.25 mg/kg of body weight of CDPs (0.1 mg/mL CDPs) via the IP or 0.05 mg/kg of MTX in physiological saline by IP via or in CDPs+MTX (0.1 mg/mL CDPs, 0.05 mg/mL MTX) combined treatment. The CDPs treatments were carried out by three rounds of administration, each consisting of three doses administered every 3 days (two days between each administration) with a week of rest between each administration round, summing nine doses per mouse. The groups evaluated were the following: mice without tumor and without treatment (C); mice without tumor administered with the CDPs (C+CDPs); mice with tumor and without treatment (BC); mice with tumor and treatment with CDPs from cell inoculation in early stage [BC+CDPs(i)]; mice with tumor and treatment with CDPs at 35th-day post-inoculation in advanced stage (BC+CDPs (m)); advanced-stage tumor-bearing and MTX-treated mice [BC+MTX(m)]; mice with tumor and combined CDPs+MTX treatment [BC+CDPs+MTX(m)]; each group with n=5.
2.7. Animal Euthanasia and Biological Samples
All mice were injected with a lethal dose of sodium pentobarbital intraperitoneally (100-150 mg/Kg body weight) as recommended by IIQB/UMSNH/IACUC and NOM 062-ZOO-1999. The tumors were removed, whole blood was obtained by cardiac puncture, and collected in a microtube with EDTA anticoagulant. The liver, lungs, spleen, kidneys, and femur of both legs were also removed and weighed. Blood hematocrit (Hct) was determined in a capillary tube with heparin by centrifugation at 3500 rpm for 5 min, and Hemoglobin (Hb) was determined by the Hct value divided by 3.3. The whole blood was centrifuged at 3500 rpm for 10 min to separate the blood serum. Subsequently, the enzymes aspartate aminotransferase (AST), alanine aminotransferase (ALT), and lactate dehydrogenase (LDH) were determined using a Fuji Dry-Chem NX 700 Fujifilm equipment.
X-ray imaging and development of osteolytic lesions in mice was performed by radiography using a Faxitron MX-20 with a digital camera (Faxitron X-ray Corporation). The image analysis system MetaMorph software (Universal Imaging Corporation) quantified the lesion area.
2.8. Histological Analysis
All organs were fixed in a 4% paraformaldehyde (PFA) solution in PBS for at least 72 h and subsequently subjected to dehydration in increasing concentrations of ethanol and xylol. The dehydrated tissues were embedded in HYCEL paraffin, and 4 µm sections were cut on a microtome. Hematoxylin-eosin (H&E) staining tissues were mounted in epoxy resin and stored at room temperature. Histopathological and photographs were analyzed by optical microscopy.
2.9. Bones and Tissue Histology
After euthanasia, the lower limbs of the mice were dissected, removing skin and muscle tissue in the femurs. Femurs were fixed in paraformaldehyde and treated with 3 mL decalcification solution (10% EDTA, pH 7.4) for four weeks. For dehydration, samples underwent sequential ethanol treatments with increasing concentrations (80–100%), followed by xylene treatment and paraffin infiltration (Hycel) in two cycles before embedding in histological molds. The femurs were sectioned longitudinally to 5 μm-thick slices using a rotary HM 355S microtome (Thermo Fisher Scientific). To assess bone resorption activity, tumor area, and the presence of osteoclasts and osteoblasts, the bone sections were stained with hematoxylin and eosin (H&E).
Livers and lungs were fixed in 4% paraformaldehyde remained until dehydration. The samples were subjected to a dehydration process of 4 h at different concentrations of ethanol and xylene, and embedded in paraffin. Tissue sections of 4 μm were cut and placed on slides for subsequent staining with H&E. Photographs were taken under the optic microscopy and recorded using an Accu-Scope EXC-120 LED microscope camera at magnifications of 4x, 10x, 40x, and 100x across tissue sections.
2.10. Statistical Analysis
All data were evaluated using analysis of variance (ANOVA; significant differences (p < 0.05) are indicated by asterisks; * p < 0.05, ** p < 0.01, *** p < 0.001, **** p < 0.0001) and Dunnett's or with Bonferroni posthoc tests using GraphPad Prism 6.0 software (GraphPad Software).
3. Results
3.1. Bacterial Cyclodipeptides Decrease Migration and Invasiveness in Breast Cancer Lines
Previously, the cytotoxic and apoptotic properties of the CDPs isolated from the P. aeruginosa PAO1 bacterium have been reported using human cancer cell lines such as HeLa and CaCo-2 [19] and malignant lines from animals[13]. However, the anti-metastasis capability of the bacterial CDPs is unknown. Thus, the MDA-MB-231 cell line was utilized as a model study of triple metastatic breast cancer to evaluate the anti-metastatic properties of CDPs.
The migration of the MDA-MB-231 cell line measured by injury area in monolayer plates showed a recovery of 90% of the cell monolayer in the control plate without treatment at 48 h incubation (25 µm2). Still, the CDPs treatment (0.01 mg/mL) caused significant inhibition of the MDA-MB-231 cell monolayer migration, showing ~180 µm2 of injury area after 48 h (Figure 1a). In addition, as positive control, methotrexate (MTX) at 0.005 mg/mL, showed a monolayer migration ~140 µm2 of injury area after 48 h. In contrast, the combination of CDPs+MTX treatment showed a monolayer migration of ~180 µm2 of injury area. Similar confirmative results were obtained in the MCF-7 cell line (Figure 1a).
On the other hand, chemokines favor malignancy and tumor progression, which is stimulated by seeding macrophages, promoting the invasive capacity of cancer cells[3]. The invasive phenotype of cancer cells was measured by the ability to degrade components of the extracellular matrix and filter through small porosities and by using co-culture with Raw cells to test the interaction between macrophages and tumor cells. In this test, the number of cells stained with crystal violet corresponds to the cells that were able to degrade the Matrigel and penetrate the pores of the membrane of the transwell chamber, which remained adhered to the lower face of the porous membrane. We observed first that the interaction of cancer cells with RAW macrophages co-cultured stimulated the number of invasive cells in both MDA-MB-231 and MCF-7 cell lines (Figure 1b). Secondly, the CDPs treatment (0.01 mg/mL) decreased the number of invasive cells significantly around 75% and 60% at single or co-cultured with RAW cells, respectively. In contrast to the invasive capacity of cancer cells treated with MTX (0.005 mg/mL), it was less efficient than the CDPs treatment (Figure 1b).
Additionally, microspheroids are cellular aggregates representing a model of a three-dimensional culture of cancer cells, which are used as a study model of tumorigenesis. Thus, microspheroids structuration of the MDA-MB-231 and MCF-7 cell lines were treated with CDPs. The results showed a significant decrease in the number and size of spheroids in both MDA-MB-231 and MCF-7 lines when they were treated with CDPs alone, combining CDPs with cyclodextrins, and in a combination of CDPs with the anti-neoplastic MTX (Figure 1c). Interestingly, the CDPs was more effective in inhibiting the cell spheroids conformation than MTX. When the viability was determined at the cell microspheroids, the CDPs treatment suspended into cyclodextrins was the better condition to cause death in both the MDA-MB-231 and MCF-7 cancer cell lines (Figure 1d).
3.2. Effect of the Bacterial CDPs in Cell Proliferation and Invasiveness Pathways
The signaling pathways involved in the anti-neoplastic effect of the bacterial CDPs in the MDA-MB-231 and MCF-7 breast cancer cells were studied. Results showed that the CDPs treatment did not modify the expression of the total Akt and mTOR proteins and did not function over time. Interestingly, the phosphorylation of both the p-Akt and p-mTOR proteins was significantly decreased by the CDPs treatment in a time-dependent manner (Figure 2). In addition, the p-S6K, Vimetin, and Gab1 proteins were also significantly down-regulated in their expression level in the MDA-MB-231 cell line by the CDPs treatment (Figure 2).
3.3. Effect of the Bacterial CDPs in the Metastatic MDA-MB-231 Cell Line in Breast Cancer Mice Model
The metastatic model of study involves the implantation of the MDA-MB-231cell line (triple negative human breast cancer cells) in immunosuppressed mice. The metastatic MDA-MB-231 cell line was inoculated into the breasts of immunosuppressed female mice, obtaining 100% performance in generating mammary tumors.
Two treatment conditions were tested; first, the MDA-MB-231cell line inoculation joined with the CDPs treatment at the time of cell implantation, following the treatment of nine doses of CDPs (0.25 mg/g) under 35 days procedure (Figure 3a). The second procedure consisted in the development of metastatic tumor by MDA-MB-231cell line inoculation during 35 days; after that, the CDPs treatment was started and followed by nine doses of CDPs (0.25 mg/g) during 35 days procedure (Figure 3a). During the development of the study, the weight was monitored in the animals submitted to CDPs treatment. Results show that the slopes of weight gain were similar in all the mice groups, except for the mice groups with breast cancer implantation treated with CDPs (BC+CDPs) and the mice groups with breast cancer implantation treated with MTX plus CDPs [BC+CDPs+MTX (m)] (Figure 3b).
The tumor volume was monitored in the mice groups until the procedure. Figure 4a-b show the images of tumors in the animal groups implanted with breast cancer and submitted to CDPs treatment (60th day); the BC mice group showed means of tumor volume of ~300 mm3 (Figure 4a-b). Interestingly, the BC mice groups treated with CDPs since the implantation of the MDA-MB-231 cells or after the metastatic development phase (on the 35th day of the MDA-MB-231 cells implantation) showed a significant reduction of the means of tumor volume ~10 mm3 and ~3 mm3, respectively; being more efficient than the MTX treatment presenting ~90 mm3 tumors means (Figure 4a-b).
Once the animals were euthanized, the organs and tumors were dissected and studied in detail. Tumors in the BC group showed weight means of ~0.9 g. In comparison, the BC animals treated with CDPs in both procedures showed means of ~0.15 g and ~0.05 g of weight, respectively (Figure 4). Additionally, in the group treated with MTX, the means weight in tumors of ~0.15 g, while that in the BC+MTX+CDPs (m) were significantly lesser tumor weight that 0.05 g, but notably in the 40% of animals, the tumors presence was missing (Figure 4c).
3.4. Anti-Metastatic Effect of Bacterial CDPs of the MDA-MB-231 Cells Line in the Lungs and Liver
Studies have described that the most common metastasis sites in patients with breast cancer are lung, liver, brain, and bones. In our metastatic model, the group of mice with mammary tumors without treatment (BC), a significant increase in the weight of the lung, kidneys, liver, and spleen was observed (Figure 5a-b), which was related to the observation of metastatic foci in organs. Interestingly, the groups treated with CDPs and MTX showed a reversion of the weight of lungs, kidneys, liver, and spleen, also observed by reversion of the metastatic foci in organs (Figure 4a-b).
The enzymes ALT, AST, and LDH as markers of hepatocellular tissue injury were determined in the blood serum of animals implanted with breast tumors. The BC mouse group showed a significant increase in AST and LDH enzyme activities (Figure 5c), which were reversed in the BC mice treated with CDPs, MTX, and CDPs+MTX combination. The treatment with CDPs in the healthy CDPs-treated control mouse group did not alter AST and LDH levels as shown in the control mouse group. The hemoglobin parameter in the blood serum showed impairment in the groups of mice with mammary tumor BC and BC+MTX; however, in the BC+CDPs mice treated, a restoration in hemoglobin was observed, almost at the level of the control of healthy mice (Figure 5d). The cells count of leucocytes showed differences in the neutrophils, lymphocytes, and monocytes in the blood of the mice group BC and BC+MTX; interestingly, the groups treated with CDPs showed similar leucocytes counts to the group of healthy mice. Additionally, healthy mice treated with the CDPs (C+CDPs) did not show an alteration in these hematological parameters concerning the control group (Figure 5d).
Histological analyses of lungs and liver sections stained with H&E revealed an increased number of cells of the MDA-MB-231 line and cells of inflammatory infiltrates in the BC mice group (Figure 6a-b). Notably, the BC animals treated with CDPs or MTX exhibited a significantly decreased cell infiltration and foci of tumoral implantation in the lung and hepatic tissues. As expected, there was no apparent lung and liver damage in the control groups in the CDPs or MTX administration (Figure 6a-b).
3.5. Anti-Metastasic and Invasion Effect of Bacterial CDPs of the MDA-MB-231cell Line in the Bone of Breast Tumors Mice Model
The anti-metastasic and invasiveness of the MDA-MB-231 line were determined in the exploration of bone health (Figure 7). Densitometric analysis of bones such as the femur and pelvis further confirms that in the BC mice group, the decalcification in the zones indicated was observed, this effect was reverted in the mice groups treated with CDPs and in combination with CDPs+MTX (Figure 7a-b). The determination of calcium by acid treatment of the femur bone of the mice groups showed that the BC group had the lowest calcium levels compared to the CDPs and CDPs+MTX treated groups (Figure 7c).
3.6. CDPs Revert Metastatic Foci in Mice Bones with Breast Cancer Implantation
Bone marrow, tumor areas, osteoclasts, and osteoblasts were identified using H&E staining. We evaluated the potential of CDPs alone and in combination with MTX to assess bone metastasis in a xenotransplant mouse model.
Histological analyses of femur bone sections stained with H&E revealed an increased number of cells of the MDA-MB-231 line and cells of inflammatory infiltrates in the BC mice group (Figure 8). Notably, the BC animals treated with CDPs exhibited a significantly decreased number of cell infiltration and foci of tumoral implantation in the femur. As expected, in the control groups, bone damage was not observed, nor was apparent damage observed in control with CDPs administration (Figure 8). In addition, the number of osteoclasts was increased in the BC group, which were reverted in the BC+CDPs treatment; contrary to, the osteoblasts were increased in the BC group treated with CDPs (Figure 8b). The treatment with MTX was no soon efficient than the CDPs or combination between CDPs+MTX.
Tumor cell populations indicate regions of tumor in bone (TB) (outlined with red dotted lines in Figure 8, appearing as pink areas, while the purple regions represent bone marrow (BM). The results showed that in the untreated breast cancer group (BC), tumor infiltration in bone (TB) regions was more frequent in comparison to groups treated with CDPs, either from disease onset (BC+CDPs (i)) or at advanced stages (BC+CDPs (m), and [BC+CDPs+MTX (m)]. Additionally, bone marrow areas were more extensive in BC groups treated with the CDPs-MTX combination, suggesting a potential reversion of bone integrity (Figure 8).
Additionally, osteons (indicated by arrows and the legend "Os") were observed, particularly in groups treated with CDPs from the onset. In the BC+CDPs (m) group, areas of immature bone (IB) were identified (marked by arrows and the IB legend). Furthermore, adipose tissue (AT) (indicated by triangles and the AT legend) was predominantly observed in groups treated with MTX.
Conversely, osteoclasts (indicated by arrows and asterisks in Figure 8 and osteoblasts (indicated by arrows and the label "Ob") were observed in the femur sections (Figure 8). Quantification of osteoclasts and osteoblasts in femur sections revealed that CDPs-treated groups reduced osteoclast numbers while showing an increase in osteoblast populations (Figure 8b).
3.7. Targets of CDPs on Proliferation and Invasiveness Signaling Pathways
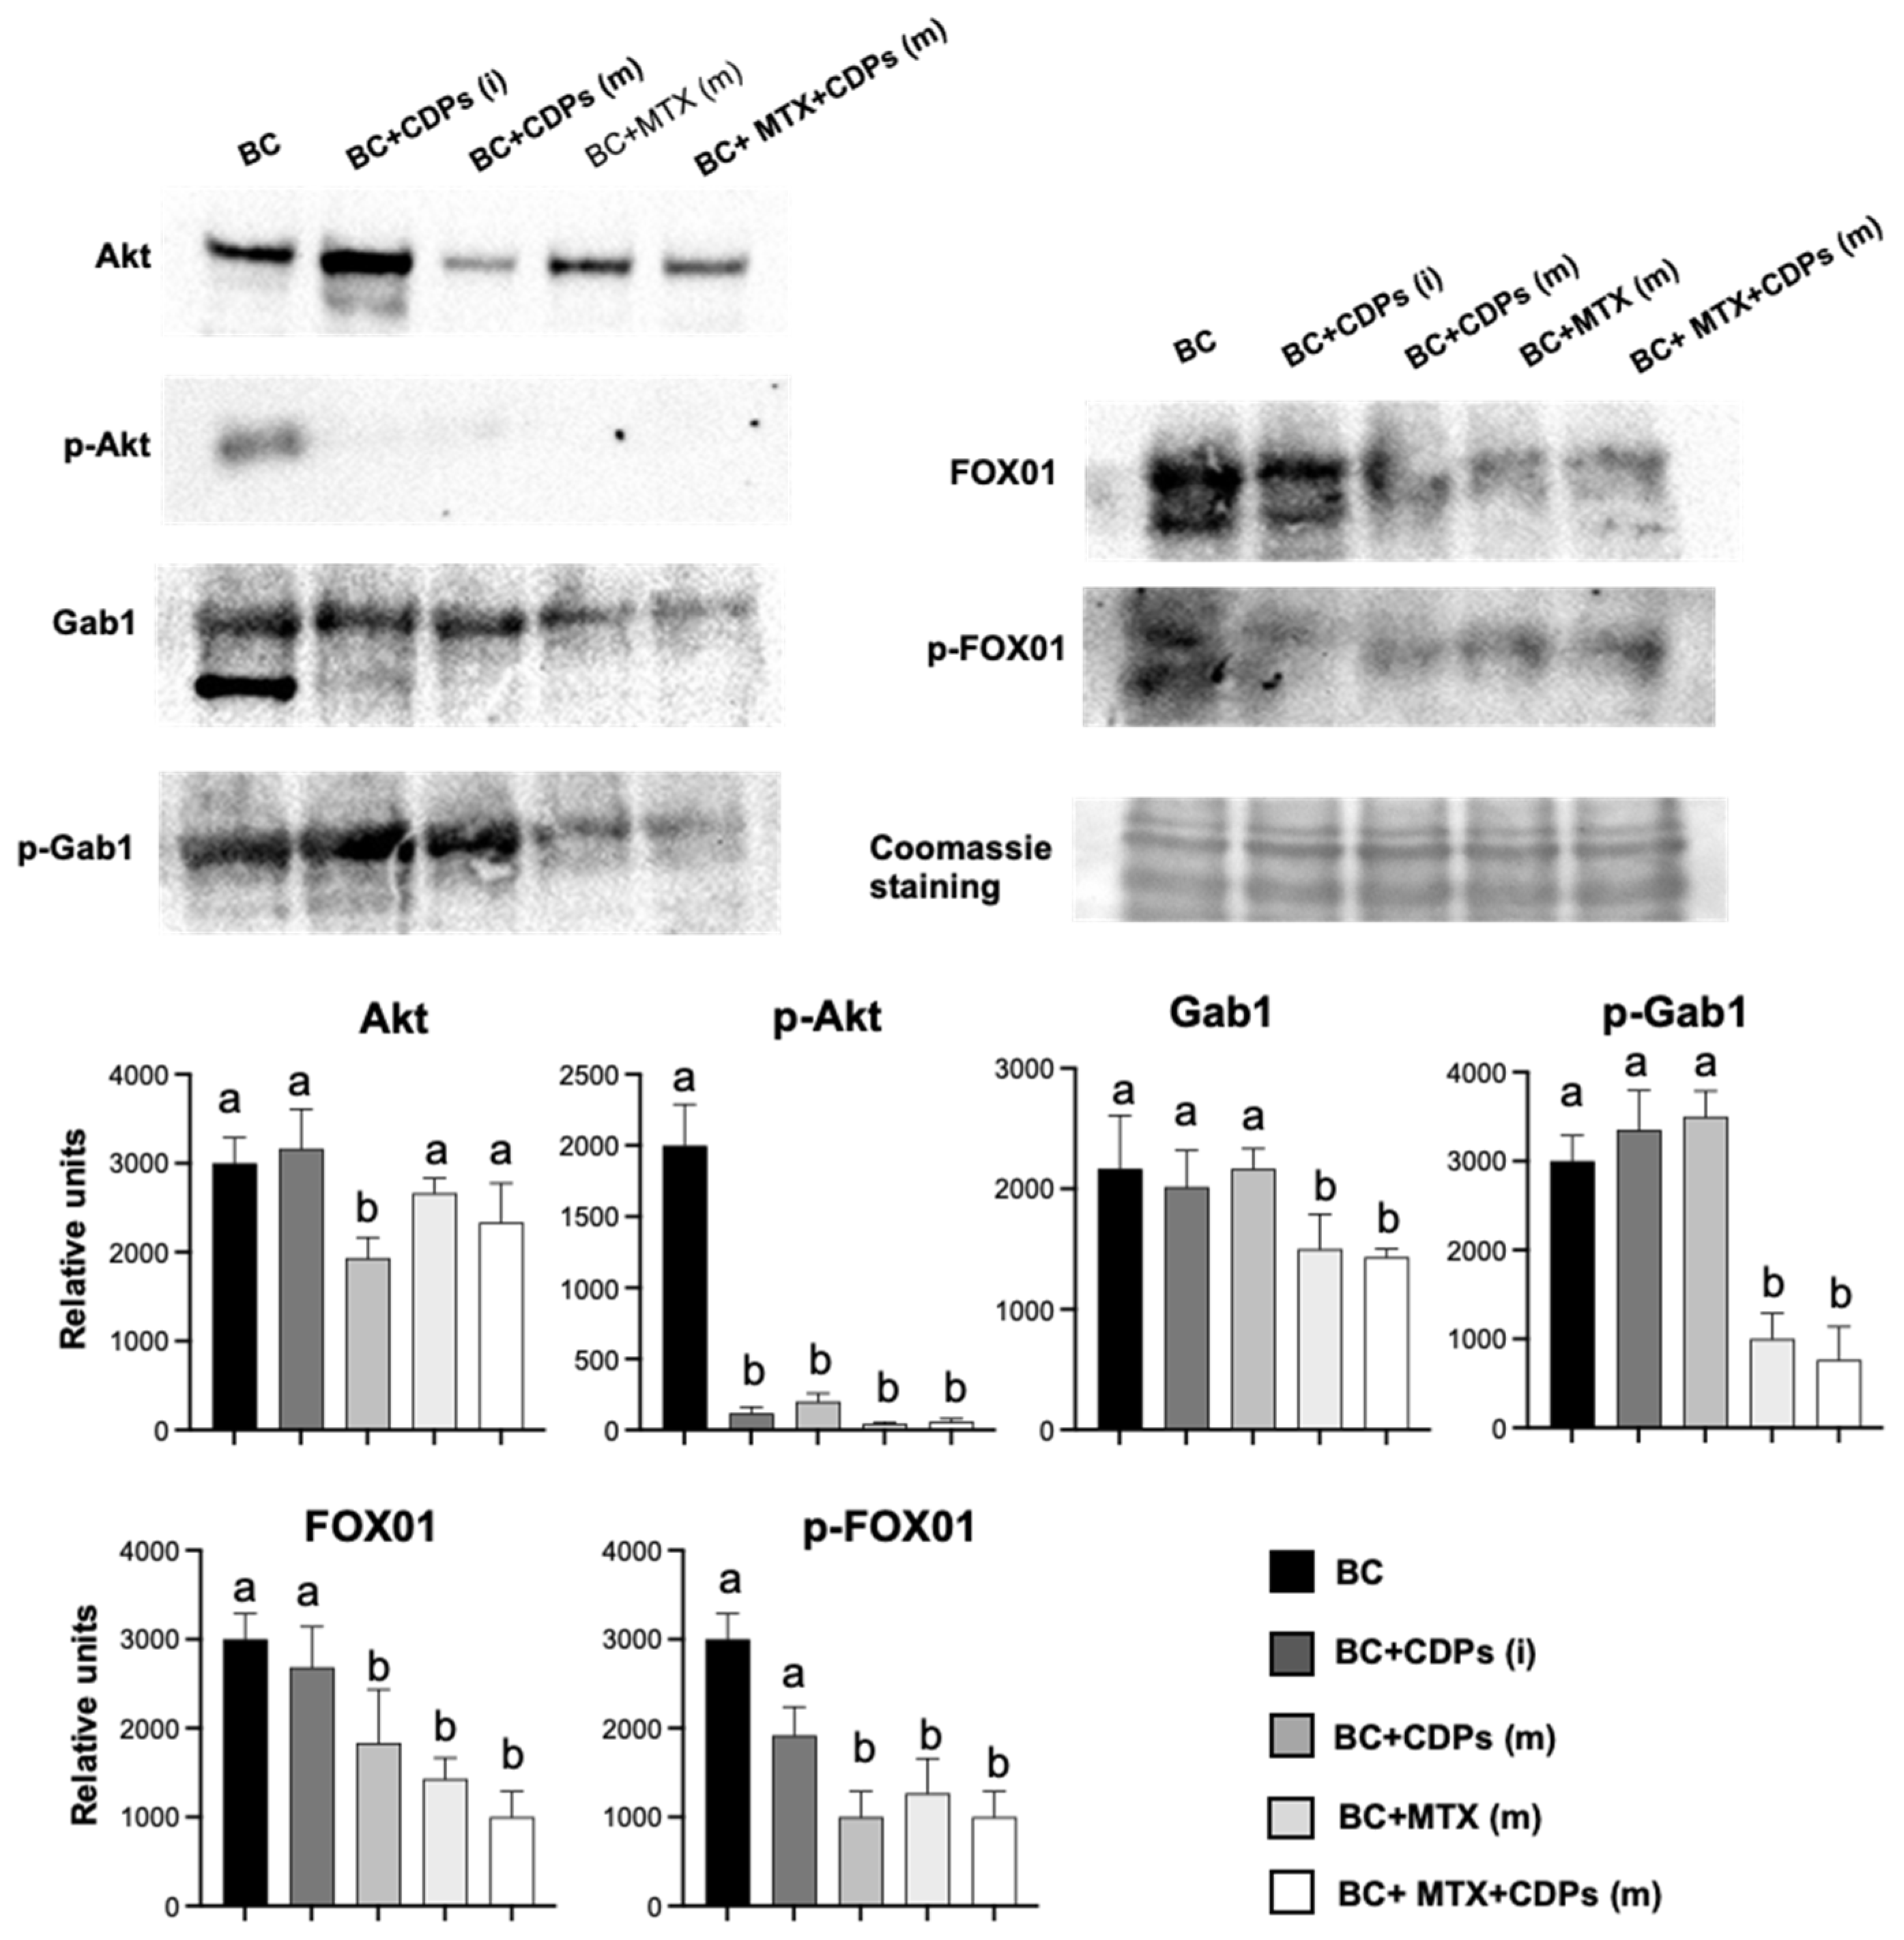
Protein immunodetection analysis was conducted to study the signaling pathways involved in the anti-neoplastic and anti-metastatic effects of the bacterial CDPs in the MDA-MB-231 breast cancer cells implanted in the immunosuppressed mice model. Results showed that the expression of total Akt protein was not significantly modified by the treatments, except in the BC+CDPs(m) group (Figure 9). However, the CDPs and MTX treatments inhibited the expression of the total Akt phosphorylation. The Gab1 protein decreased significantly in the BC+MTX(m) and BC+CDPs+MTX(m) treatments, which was similar to the results for the p-Gab1 protein. This protein inhibition was observed in the expression of the FOX01. Its phosphorylated protein p-FOX01 was decreased in the tumors of mice groups treated with CDPs and in combination with CDPs+MTX (Figure 9).
4. Discussion
CDPs (diketopiperazines) have emerged as promising candidates for anticancer therapy due to their structural stability, high selectivity, and ability to effectively inhibit key cancer-related pathways[20]. Previously, the cytotoxic and apoptotic effects of the bacterial CDPs have been demonstrated in various cancer cell lines [10,11,12,15,19]; in addition, their impact on breast cancer lines MCF-7 and MDA-MB-231 cells was described, triggering apoptosis in both cell lines in a concentration-dependent manner [12].
Several specific CDPs have exhibited potent anticancer activity; Cyclo(Phe-Pro) inhibits the growth of HT-29, MCF-7 and HeLa cells[21], Cyclo(Tyr-Cys) inhibits cervical carcinoma cells HT-29 and MCF7 [22], Cyclo(L-Leu-D-Arg) shows cytotoxicity against MDA-MB-231 cells [23]. Diketopiperazines such as fumitremorgin C analogs have shown potential in overcoming multidrug resistance, including inhibition of the breast cancer resistance protein (BCRP), a key efflux transporter responsible for reducing intracellular drug accumulation. Moreover, the novel diketopiperazine-based compound HLY838 functions as an O-GlcNAc transferase (OGT) inhibitor, potentiating the anti-tumor effects of CDK9 inhibitors by downregulation c-Myc and E2F1 expression [24]. Collectively, these findings highlight the CDPs as anticancer agents. Similarly, Verticillin A, a diketopiperazine-derived compound, suppresses c-Met phosphorylation and its downstream Ras/Raf/MEK/ERK signaling pathway, significantly reducing colon cancer cell metastasis [25]. Bacterial CDPs have demonstrated significant potential as anti-metastasic agents by targeting key proteins involved in epithelial-mesenchymal transition (EMT) and metastasis. In the murine melanoma model, CDPs derived from the P. aeruginosa bacterium significantly reduced the expression of critical EMT markers, including MMP-1, E-cadherin, N-cadherin, HIF-1a, Vimetin, and CK-1; indicating that CDPs may impact cancer cell migration and invasion [13].
In this work, functional assays further confirmed the anti-metastasic effects of P. aeruginosa CDPs. Wound healing assays in monolayers of cell lines cultures of the MCF7 and MDA-MB-231 breast cancer lines revealed that CDPs-treated cancer cells exhibited a wound area twice as large as the control and 1.5 times that of cells treated with methotrexate (MTX). MCF7 cells displayed lower migratory capacity than MDA-MB-231 cells in all conditions (Figure 1a).
Transwell chamber assays using Matrigel and co-culture with macrophages revealed that tumor-associated macrophages (TMAs) enhanced cancer cell invasion by promoting Matrigel degradation and membrane penetration. However, treatment with CDPs significantly reduced the number of invasive cells in both monoculture and co-culture conditions, suggesting their potential as metastatic agents. This inhibitory effect was comparable to MTX, which has been evaluated in combination therapies for metastatic disease, including bone metastases (Figure 1b). These findings align with previous reports indicating that TAMs play a crucial role in tumor progression by secreting chemokines and growth factors that facilitate cancer cells proliferation, migration and survival [26]. Moreover, TAMs have been implicated in modulating drug resistance, further supporting their relevance as therapeutic targets. The ability of the bacterial CDPs to disrupt TAM cancer cell interactions highlights their potential dual role in inducing apoptosis and inhibiting metastasis.
The multicellular microspheroid model contains subpopulations of cancer stem cells (CSCs) [27] exhibiting self-renewal capacity and therapy resistance. Our micro spheroids assay with MCF7 and MDA-MB-231 cells demonstrated distinct phenotypic differences between the two lines. MCF7 spheroids were more compact and more enormous, likely due to their epithelial phenotype and high E-cadherin expression [28], while MDA-231-MB microspheroids were looser and more heterogeneous, reflecting their mesenchymal phenotype. Notably, the CDPs treatment significantly reduced spheroids size, number, and viability in both cell lines compared to untreated controls and MTX-treated (Figure 1c-e). These results underscore the potential of bacterial CDPs as effective anti-metastatic agents by targeting both tumor cell invasion and CSC-associated resistance.
Previous studies from our group have demonstrated the involvement of the PI3K/AKT/mTOR pathway in the anticancer effects of PAO1-CDPs [10,11,13]. Based on these findings, we analyzed key components of this pathway in the MDA-MB-231 cell line, observing a significant decrease in the phosphorylation levels of AKT, mTOR, and S6K (Figure 2). This reduction in protein expression is associated with decreased cell viability, impaired tumor growth, and induction of apoptosis, corroborating previous observations [12]. Additionally, our results revealed a notable decrease in the expression of Vimentin and Gab1 following treatment with CDPs, further supporting the role of these molecules in targeting metastatic and invasive pathways (Figure 2). Gab1 overexpression has been linked to enhanced breast cancer metastasis [29]. At the same time, Vimetin is a well-established marker of EMT and is consistently upregulated during cancer progression and metastasis [30]. Therefore, the observed downregulation of Gab1 and Vimetin suggests reduced invasive and migratory capacities, which may translate into decreased tumor aggressiveness.
Weight loss is often one of the earliest detectable symptoms of cancer disease and its progression, leading to severe muscle wasting, which significantly contributes to morbidity and mortality. This condition is primarily driven by the increased production of cytokines and other pro-inflammatory molecules secreted by the immune system to inhibit tumor progression [31,32]. In our orthotopic model of metastatic breast cancer, body weight was monitored throughout the treatment period. While the overall pattern of weight gain remained consistent across groups, a transient weight loss was observed in animals treated with CDPs during the initial weeks of administration (Figure 3b). Nevertheless, this effect did not persist; no behavioral changes or signs of deteriorating health were observed, suggesting that the temporary weight loss did not indicate toxicity or systemic distress. Although the volume and weight of the tumors generated in the BC group were significantly observed (Figure 4), they did not significantly modify the weight of the animals (Figure 3b). Notably, the administration of CDPs in mice prevented the generation of large and heavy tumors, observing that 40% of animals did not show tumors (Figure 4).
In breast cancer patients, alterations in leukocyte composition, particularly in the neutrophil-to-lymphocyte ratio (NRL) have been documented. NLR is widely recognized as a prognostic biomarker in cancer, with elevated levels correlating with worse prognosis, increased tumor aggressiveness, and reduced overall survival [33]. The findings suggest that changes in leukocyte distribution may have significant clinical implications in breast cancer progression. In our study, alterations in leukocyte composition were also observed in mice with breast cancer. NLR analysis revealed that the BC group exhibited the highest value (NLR=8). In contrast, the groups BC+CDPs(i) (NLR=3) and BC+MTX+CDPs (NLR=3.5) showed significantly lower values, suggesting a potential reduction in tumor aggressiveness following CDPs treatment. Anemia is also common among cancer patients (Muthanna et al., 2022). In our hematological analysis, hemoglobin levels showed improvement in animals treated with CDPs (Figure 5d), indicating a potential benefit of these molecules in mitigating cancer-associated hematological alterations.
Liver metastases are common in patients with breast cancer. Previous studies have described that liver function is poor in 92% of all patients diagnosed with breast cancer liver metastasis (BCLM) [34]. Moreover, ALT, AST, GGT, AP, and LDH levels are significantly higher in patients with BCLM (Nesbit et al., 2021). The determination of AST, ALT, and LDH showed a drastic increase in the group with BC and without treatment (Figure 5c). The presence of metastatic foci was observed in this group of animals (Figure 5a); consistent with these observations, an increase in the weight of this organ was also observed (Figure 5b). Histological analysis of lung and liver in mice revealed that treatment with CDPs inhibited malign cells and tumor focus (Figure 6). These findings suggest that the animals treated with CDPs presented levels of AST, ALT, and LDH and organs similar to the control without disease, indicating a positive anti-tumor capability associated with the CDPs treatment.
Histological analysis of the femur in mice revealed that treatment with CDPs led to an increase in the number of osteoblasts (Figure 7d and Figure 8). These cells play a crucial role in osteogenesis by producing and depositing the organic bone matrix [35]. This finding suggests a potential pro-osteogenic effect of CDPs. A similar increase in osteoblast number was observed in the group treated with both CDPs+MTX (Figure 7d). However, in the BC [CDPs+MTX(i)] group, a notable accumulation of bone marrow adipose tissue (BMAT) was also detected. This increase in BMAT was similarly observed in the sections of animals treated exclusively with MTX, indicating that the presence of BMAT was primarily driven by the administration of this chemotherapeutic agent (Figure 8).
The development of BMAT is a normal physiological process; however, excessive BMAT accumulation may have a significant pathological implication [36]. Previous studies have proposed that chemotherapy-induced bone defects arise from multiple mechanisms, including impaired nutrient absorption and malnutrition due to chemotherapy-induced intestinal mucosal damage and disruptions in bone modeling and remodeling (Figure 5b). Densitometry analysis of bones further shows the decalcification of the pelvis and femur in the BC group, which was alleviated by the CDPs treatment (Figure 7). In agreement, infiltration of breast cancer MDA-MB-231 cells and leukocytes in tissue was observed by histological analysis of the femur from the BC group, which was recovered in the mice treated with CDPs (Figure 8).
Furthermore, critical tumorigenic markers were repressed in the BC CDPs-treated mice, and a significant reduction in p-AKT levels was observed in tumors from rodents subjected to treatment (Figure 9). Notably, animals treated with CDPs also exhibited a decrease in total AKT protein levels, suggesting a potential disruption of the PI3K/AKT/mTOR signaling pathway in tumors.
AKT is pivotal in regulating FOX01 phosphorylation, a key factor in cell cycle regulation and apoptosis. Under normal conditions, AKT phosphorylates FOX01, excluding it from the nucleus and suppressing its transcriptional activity. However, when FOX01 remains dephosphorylated, it is translocated to the nucleus, activating apoptosis-related genes and cell cycle arrest [37].
FOX01, a member of the Forkhead box family of transcription factors, is known to regulate cell cycle arrest, autophagy, and apoptosis. Its tumor-suppressive role has been reported in several malignancies, including breast cancer, where its dysregulated is frequently observed [38]. In our study, tumors from CDPs-treated mice exhibited reduced phosphorylation of FOX01, supporting that CDPs inhibit tumor progression (Figure 9). These findings align with our previous transcriptomic analysis in HeLa cells treated with CDPs, where genes involved in the FOX01 signaling pathway, including GADD45A and SGK1, were upregulated [14]. Suggesting a differential regulation of FOX01 by CDPs in the triple-negative breast cancer model.
Contrary to observations in the MDA-MB-231 cell line (Figure 2), Gab1 levels remained unchanged in response to CDPs treatment alone. However, a notable decrease in both total Gab1 and phosphorylated Gab1 (p-Gab1) levels was detected in tumors from the BC (CDPs+MTX) and BC (MTX) groups. Given that Gab1 acts as a key integrator of multiple signaling pathways involved in cell survival, proliferation, angiogenesis, and invasion [39]. The Gab1 downregulation suggests a potential mechanism through which CDPs, particularly in combination with MTX, inhibit tumor progression.
5. Conclusions
Data provide new insights into the molecular mechanisms involved in CDPs anti-metastatic effects, suggesting that the signal transduction mechanism is related to the inhibition of the phosphorylation of the Akt/mTOR/S6K pathway and the metastasis markers Gab1, MMP-9, Vimentin, and FOX01. Since Gab1 inhibitors have been proposed as promising anticancer agents, the observed reduction in Gab1 expression further supports the therapeutic potential. The findings indicate that the CDPs, combined with MTX, potentialize the anti-neoplastic property in TN-BC, proposing the bacterial CDPs as a viable alternative in human breast cancer therapy.
Author Contributions
Conceptualization, J. Campos-García; Data curation, L. Martínez-Alcantar; Formal analysis, L. Martínez-Alcantar; Funding acquisition, J. Campos-García; Investigation, M. Durán-Maldonado, N. Ramírez-Gallardo and L. Martínez-Alcantar; Methodology, M. Durán-Maldonado, N. Ramírez-Gallardo and M. Campos-Morales; Supervision, L. Hernández-Padilla and J. Campos-García; Writing – original draft, L. Martínez-Alcantar and L. Hernández-Padilla; Writing – review & editing, L. Martínez-Alcantar and J. Campos-García.
Funding
This research was funded by Secretaría de Ciencia, Humanidades, Tecnología e Innavación (SECIHTI, before CONAHCYT) of México (grant number 256119) and by a grant from the Universidad Michoacana de San Nicolás de Hidalgo/C.I.C.2.14.
Institutional Review Board Statement
The study was conducted in accordance with the Declaration of Helsinki. The animal studies were performed after receiving approval from the Institutional Animal and Use Committee (IACUC) from the Universidad Michoacana de San Nicolás de Hidalgo (IIIQB-UMSNH-IACUC-2022-33). The experiments followed the Institutional Committee and recommendations of the Mexican Official Regulations for the Use and Care of Animals (NOM 062-ZOO-1999; Ministry of Agriculture, Mexico).
Informed Consent Statement
Not applicable.
Data Availability Statement
The authors confirm that the data supporting the findings of this study are available within the article.
Acknowledgments
Thanks to the Secretaría de Ciencia, Humanidades, Tecnología e Innovación (SECIHTI, before CONAHCYT) of México and the Universidad Michoacana de San Nicolás de Hidalgo by scholarship grants to M.X.D.M., N.A.R.G., and L.H.P.
Conflicts of Interest
The authors declare no conflicts of interest. The funders had no role in the study's design, in the collection, analyses, or interpretation of data, in the writing of the manuscript, or in the decision to publish the results.
References
- Sung H, Ferlay J, Siegel RL, Laversanne M, Soerjomataram I, Jemal A, et al. Global Cancer Statistics 2020: GLOBOCAN Estimates of Incidence and Mortality Worldwide for 36 Cancers in 185 Countries. CA Cancer J Clin. 2021;71(3):209-49. [CrossRef]
- Derakhshan F, Reis-Filho JS. Pathogenesis of Triple-Negative Breast Cancer. Annu Rev Pathol. 2022;17:181-204.
- Liang Y, Zhang H, Song X, Yang Q. Metastatic heterogeneity of breast cancer: Molecular mechanism and potential therapeutic targets. Semin Cancer Biol. 2020;60:14-27. [CrossRef] [PubMed]
- Xie Y, Wang B, Zhao Y, Tao Z, Wang Y, Chen G, et al. Mammary adipocytes protect triple-negative breast cancer cells from ferroptosis. Journal of Hematology & Oncology. 2022;15(1):72. [CrossRef]
- Pang L, Gan C, Xu J, Jia Y, Chai J, Huang R, et al. Bone Metastasis of Breast Cancer: Molecular Mechanisms and Therapeutic Strategies. Cancers. 2022;14(23). [CrossRef]
- Peng Z, Huang W, Xiao Z, Wang J, Zhu Y, Zhang F, et al. Immunotherapy in the Fight Against Bone Metastases: A Review of Recent Developments and Challenges. Current treatment options in oncology. 2024;25(11):1374-89. [CrossRef]
- Kakhki VR, Anvari K, Sadeghi R, Mahmoudian AS, Torabian-Kakhki M. Pattern and distribution of bone metastases in common malignant tumors. Nuclear medicine review Central & Eastern Europe. 2013;16(2):66-9. [CrossRef]
- Ryan C, Stoltzfus KC, Horn S, Chen H, Louie AV, Lehrer EJ, et al. Epidemiology of bone metastases. Bone. 2022;158:115783.
- Clézardin P, Coleman R, Puppo M, Ottewell P, Bonnelye E, Paycha F, et al. Bone metastasis: mechanisms, therapies, and biomarkers. Physiological reviews. 2021;101(3):797-855. [CrossRef] [PubMed]
- Hernández-Padilla L, Vázquez-Rivera D, Sánchez-Briones LA, Díaz-Pérez AL, Moreno-Rodríguez J, Moreno-Eutimio MA, et al. The Antiproliferative Effect of Cyclodipeptides from Pseudomonas aeruginosa PAO1 on HeLa Cells Involves Inhibition of Phosphorylation of Akt and S6k Kinases. Molecules. 2017;22(6):1024. [CrossRef]
- Hernández-Padilla L, Reyes de la Cruz H, Campos-García J. Antiproliferative effect of bacterial cyclodipeptides in the HeLa line of human cervical cancer reveals multiple protein kinase targeting, including mTORC1/C2 complex inhibition in a TSC1/2-dependent manner. Apoptosis. 2020;25(9):632-47. [CrossRef]
- Hernández-Padilla L, Durán-Maldonado MX, Martínez-Alcantar L, Rodríguez-Zavala JS, Campos-García J. The HGF/Met Receptor Mediates Cytotoxic Effect of Bacterial Cyclodipeptides in Human Cervical Cancer Cells. Current Cancer Drug Targets. 2025;25(3):230-43. [CrossRef]
- Durán-Maldonado MX, Hernández-Padilla L, Gallardo-Pérez JC, Díaz-Pérez AL, Martínez-Alcantar L, Reyes De la Cruz H, et al. Bacterial Cyclodipeptides Target Signal Pathways Involved in Malignant Melanoma. Front Oncol. 2020;10:1111. [CrossRef] [PubMed]
- Lázaro-Mixteco PE, González-Coronel JM, Hernández-Padilla L, Martínez-Alcantar L, Martínez-Carranza E, López-Bucio JS, et al. Transcriptomics Reveals the Mevalonate and Cholesterol Pathways Blocking as Part of the Bacterial Cyclodipeptides Cytotoxic Effects in HeLa Cells of Human Cervix Adenocarcinoma. Front Oncol. 2022;12:790537. [CrossRef]
- Martínez-Alcantar L, Hernández-Padilla L, Díaz-Pérez AL, Villalón-Magallán LG, Durán-Maldonado MX, Díaz-Pérez C, et al. Cyclic Peptides as Protein Kinase Modulators and Their Involvement in the Treatment of Diverse Human Diseases. Kinases and Phosphatases. 2024;2(4):346-78. [CrossRef]
- González O, Ortíz-Castro R, Díaz-Pérez C, Díaz-Pérez AL, Magaña-Dueñas V, López-Bucio J, et al. Non-ribosomal Peptide Synthases from Pseudomonas aeruginosa Play a Role in Cyclodipeptide Biosynthesis, Quorum-Sensing Regulation, and Root Development in a Plant Host. Microbial ecology. 2017;73(3):616-29. [CrossRef]
- Tian T. MCF-7 cells lack the expression of Caspase-3. International journal of biological macromolecules. 2023;231:123310.
- Amaro A, Angelini G, Mirisola V, Esposito AI, Reverberi D, Matis S, et al. A highly invasive subpopulation of MDA-MB-231 breast cancer cells shows accelerated growth, differential chemoresistance, features of apocrine tumors and reduced tumorigenicity in vivo. Oncotarget. 2016;7(42):68803-20. [CrossRef] [PubMed]
- Vázquez-Rivera D, González O, Guzmán-Rodríguez J, Díaz-Pérez AL, Ochoa-Zarzosa A, López-Bucio J, et al. Cytotoxicity of cyclodipeptides from Pseudomonas aeruginosa PAO1 leads to apoptosis in human cancer cell lines. BioMed research international. 2015;2015. [CrossRef]
- Hasan MM, Shawon ARM, Aeyas A, Uddin MA. Cyclic peptides as an inhibitor of metastasis in breast cancer targeting MMP-1: Computational approach. Informatics in Medicine Unlocked. 2022;35:101128. [CrossRef]
- Brauns SC, Milne P, Naudé R, Van de Venter M. Selected cyclic dipeptides inhibit cancer cell growth and induce apoptosis in HT-29 colon cancer cells. Anticancer Res. 2004;24(3a):1713-9.
- van der Merwe E, Huang D, Peterson D, Kilian G, Milne PJ, Van de Venter M, et al. The synthesis and anticancer activity of selected diketopiperazines. Peptides. 2008;29(8):1305-11. [CrossRef]
- Nishanth SK, Nambisan B, Dileep C. Three bioactive cyclic dipeptides from the Bacillus sp. N strain associated with entomopathogenic nematode. Peptides. 2014;53:59-69. [CrossRef]
- Wauters I, Goossens H, Delbeke E, Muylaert K, Roman BI, Van Hecke K, et al. Beyond the Diketopiperazine Family with Alternatively Bridged Brevianamide F Analogues. J Org Chem. 2015;80(16):8046-54. [CrossRef]
- Liu QQ, Zeng XL, Guan YL, Lu JX, Tu K, Liu FY. Verticillin A inhibits colon cancer cell migration and invasion by targeting c-Met. J Zhejiang Univ Sci B. 2020;21(10):779-95. [CrossRef]
- Li C, Xu X, Wei S, Jiang P, Xue L, Wang J. Tumor-associated macrophages: potential therapeutic strategies and future prospects in cancer. J Immunother Cancer. 2021;9(1). [CrossRef] [PubMed]
- Reynolds DS, Tevis KM, Blessing WA, Colson YL, Zaman MH, Grinstaff MW. Breast Cancer Spheroids Reveal a Differential Cancer Stem Cell Response to Chemotherapeutic Treatment. Sci Rep. 2017;7(1):10382. [CrossRef] [PubMed]
- Eslami Amirabadi H, Tuerlings M, Hollestelle A, SahebAli S, Luttge R, van Donkelaar CC, et al. Characterizing the invasion of different breast cancer cell lines with distinct E-cadherin status in 3D using a microfluidic system. Biomed Microdevices. 2019;21(4):101. [CrossRef]
- Wang X, Peng J, Yang Z, Zhou PJ, An N, Wei L, et al. Elevated expression of Gab1 promotes breast cancer metastasis by dissociating the PAR complex. J Exp Clin Cancer Res. 2019;38(1):27. [CrossRef]
- Usman S, Waseem NH, Nguyen TKN, Mohsin S, Jamal A, Teh MT, et al. Vimentin Is at the Heart of Epithelial Mesenchymal Transition (EMT) Mediated Metastasis. Cancers. 2021;13(19). [CrossRef]
- Murray S, Schell K, McCarthy DO, Albertini MR. Tumor growth, weight loss and cytokines in SCID mice. Cancer Lett. 1997;111(1-2):111-5. [CrossRef]
- Siff T, Parajuli P, Razzaque MS, Atfi A. Cancer-Mediated Muscle Cachexia: Etiology and Clinical Management. Trends Endocrinol Metab. 2021;32(6):382-402. [CrossRef]
- Chen J, Deng Q, Pan Y, He B, Ying H, Sun H, et al. Prognostic value of neutrophil-to-lymphocyte ratio in breast cancer. FEBS Open Bio. 2015;5:502-7.
- Leser C, Dorffner G, Marhold M, Rutter A, Döger M, Singer C, et al. Liver function indicators in patients with breast cancer before and after detection of hepatic metastases-a retrospective study. PLoS One. 2023;18(3):e0278454. [CrossRef]
- Henry JP, Bordoni B. Histology, Osteoblasts. StatPearls. Treasure Island (FL): StatPearls Publishing Copyright © 2025, StatPearls Publishing LLC.; 2025.
- Aaron N, Costa S, Rosen CJ, Qiang L. The Implications of Bone Marrow Adipose Tissue on Inflammaging. Front Endocrinol (Lausanne). 2022;13:853765. [CrossRef]
- Jiramongkol Y, Lam EW. FOXO transcription factor family in cancer and metastasis. Cancer Metastasis Rev. 2020;39(3):681-709. [CrossRef] [PubMed]
- Khan MA, Massey S, Ahmad I, Sadaf, Akhter N, Habib M, et al. FOXO1 Gene Downregulation and Promoter Methylation Exhibits Significant Correlation With Clinical Parameters in Indian Breast Cancer Patients. Front Genet. 2022;13:842943. [CrossRef]
- Pérez-Baena MJ, Cordero-Pérez FJ, Pérez-Losada J, Holgado-Madruga M. The Role of GAB1 in Cancer. Cancers. 2023;15(16). [CrossRef]
Figure 1.
Effects of CDPs on migratory and invasiveness of MDA-MB-231 and MCF-7 breast cancer cells. a) Representative photographs of wound closure migration assays taken at 0 h and 48 h in breast cancer cells treated with the saline solution vehicle, CDPs, MTX, or combined CDPs+MTX treatment. b) Representative photographs of the cancer cells that managed to invade the Matrigel-covered membrane stained with crystal violet. The simple culture conditions and co-culture with Raw 264.7 macrophages are shown. (a-b) On the right, the quantification of the wound area and invasive cells from (a) and cell number from (b) is done using ImageJ Software. c) Representative photographs of multicellular microspheroids of MDA-MB-231. d) Cell viability of the microspheroids of MDA-MB-231 and MCF-7 cell cultures submitted to CDPs treatments for 72 h. e) Cell viability of the microspheroids from (d) determined by the MTT assay. Bars represent means ±SE, n=3. Statistical analysis was performed using one-way ANOVA with Dunnett's posthoc test. SE values are shown as bars, and significant differences are indicated with different letters (p˂0.05). CDPs, cyclodipeptides; MTX, methotrexate; CDPs-cd, cyclodipeptides dissolved in β-cyclodextrins; CDPs-cd+MTX, combined treatment.
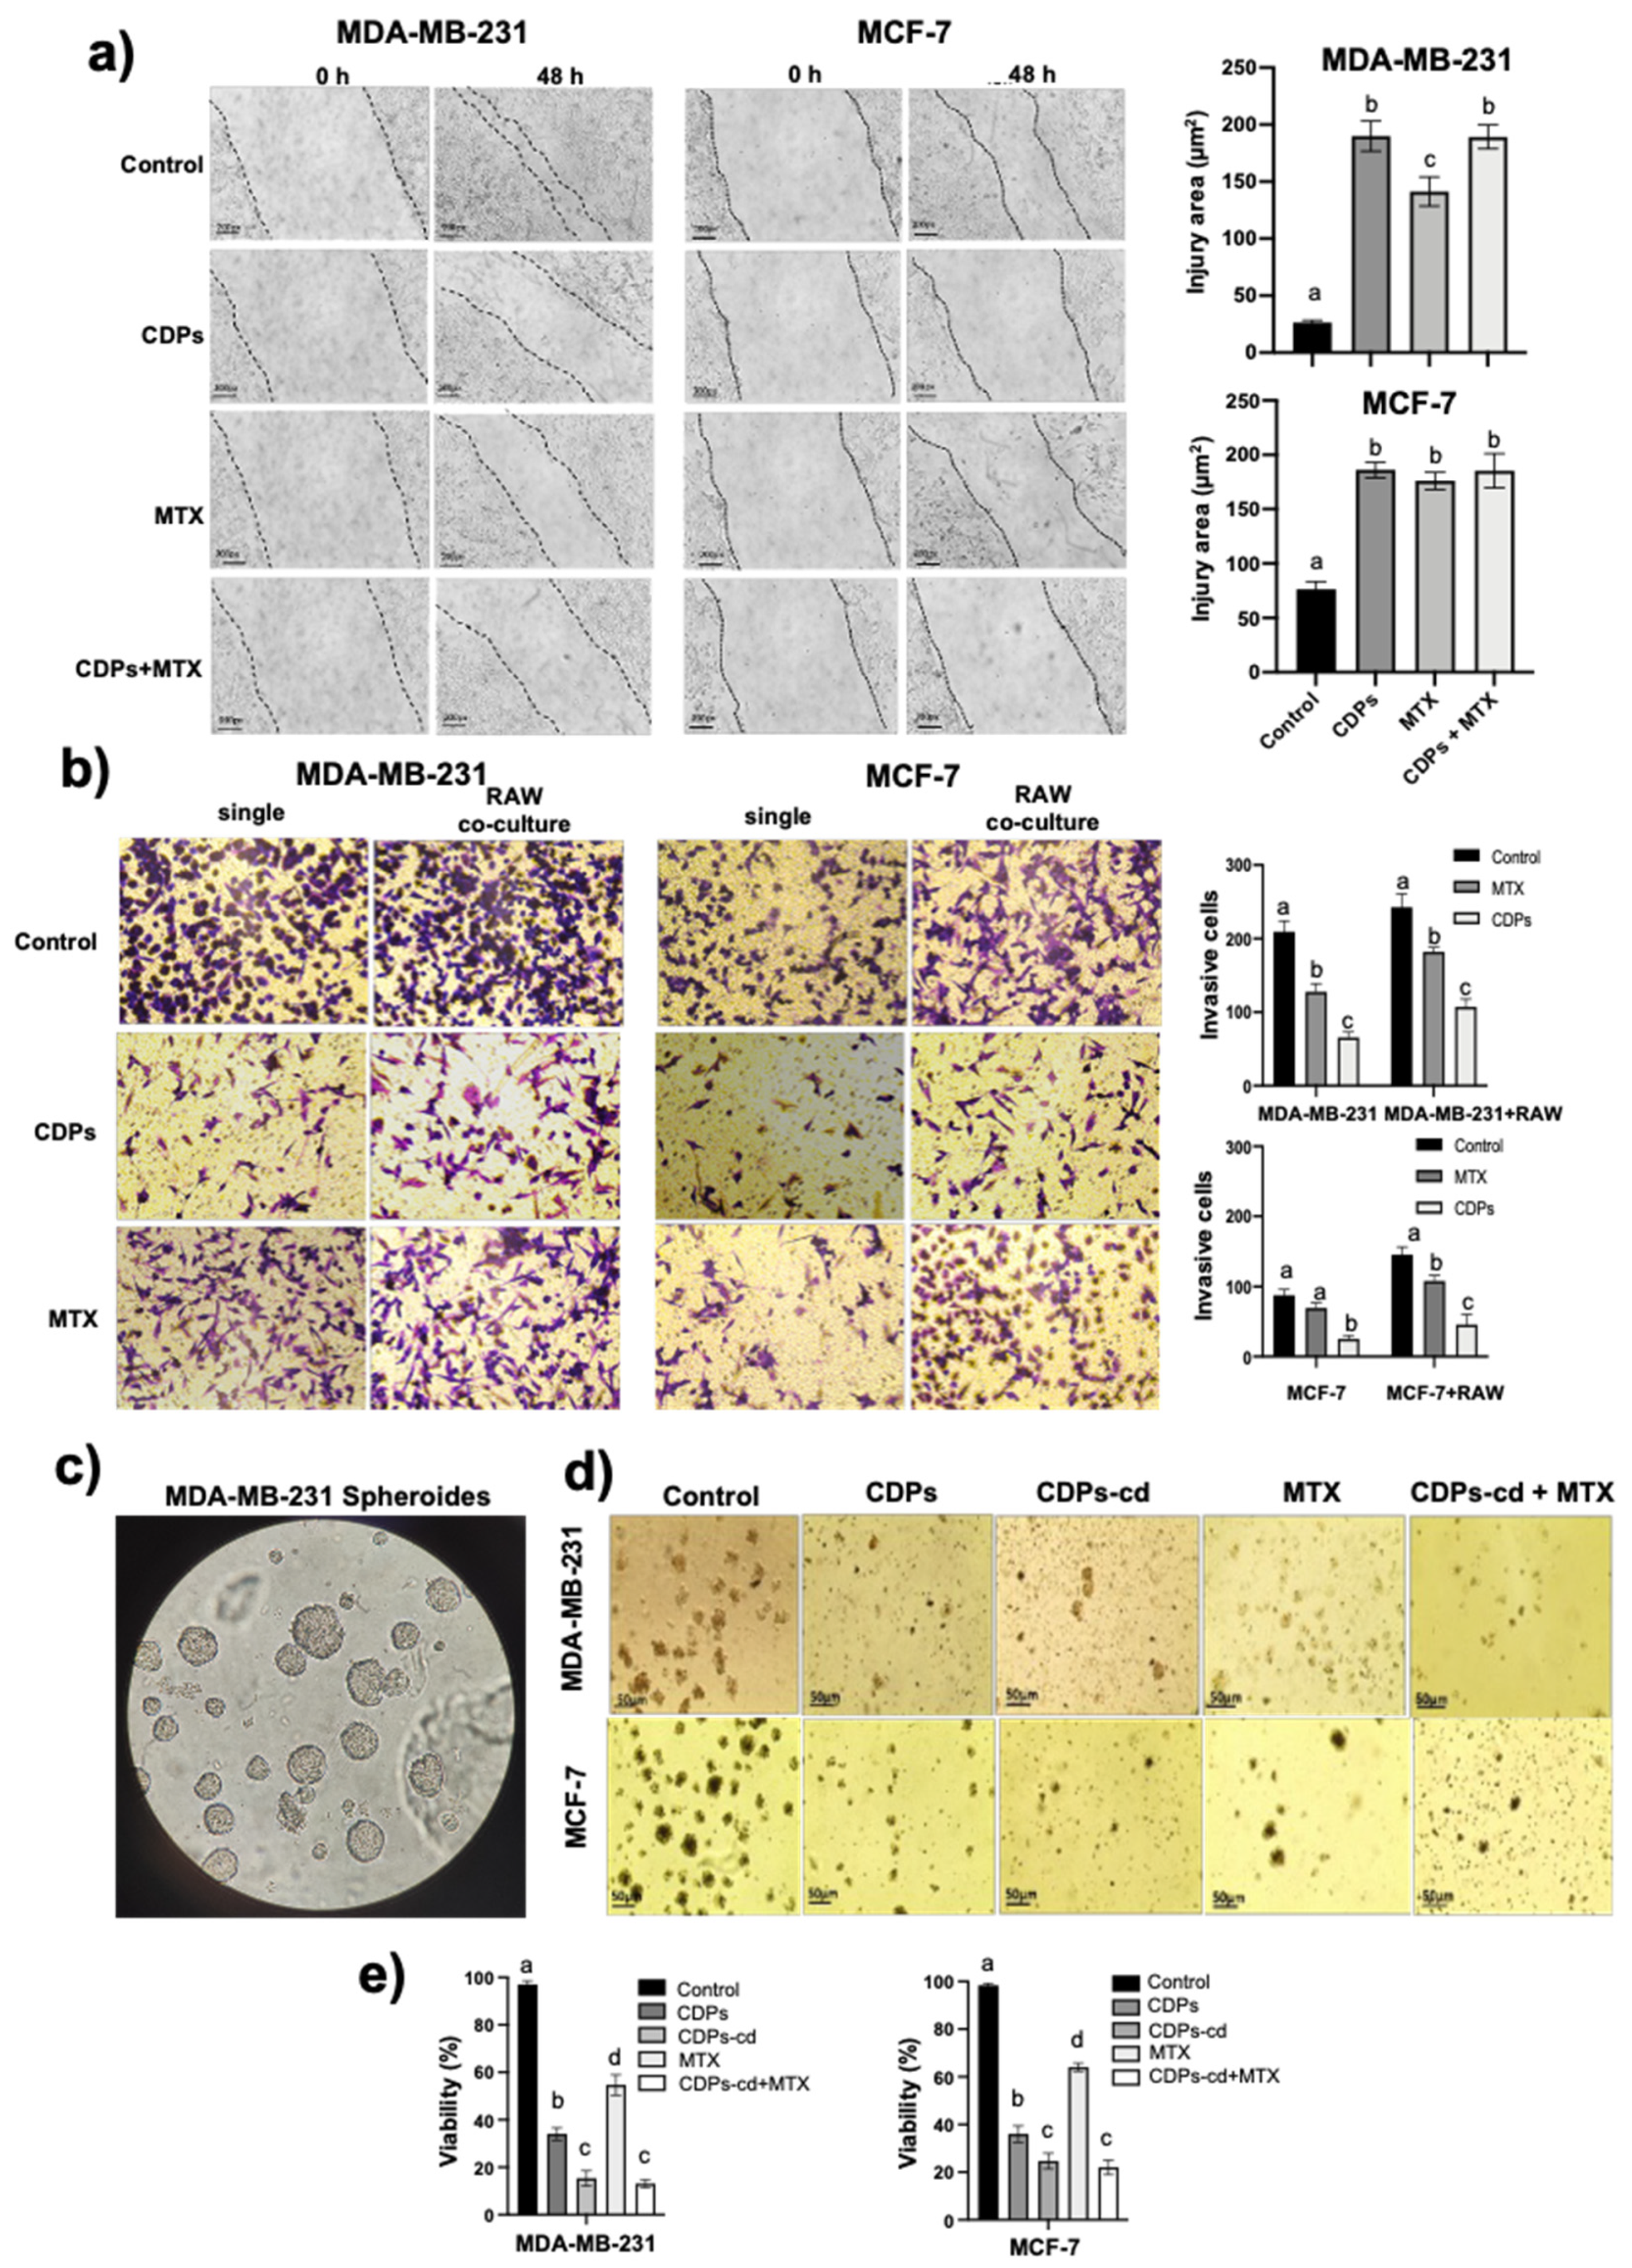
Figure 2.
Effect of CDPs on proteins involved in proliferation, invasion, and metastasis in MDA-MB-231 breast cancer cells. Protein extracts obtained from the cell cultures treated with CDPs (0.1 mg/mL) in function of time were subjected to immunodetection. Protein expression for the total Akt, phosphorylated Akt, total mTOR, phosphorylated mTOR, total S6K, phosphorylated S6K, Vimentin, and B-actin are shown. Densitometric analyses of the protein immunodetection results are presented on the right. The bars represent the means ± SE, n=3 per group. Statistical analysis was performed using one-way ANOVA, followed by Dunnett's post hoc test; SE values are shown as bars, and significant differences are indicated with different letters (p <0.05).
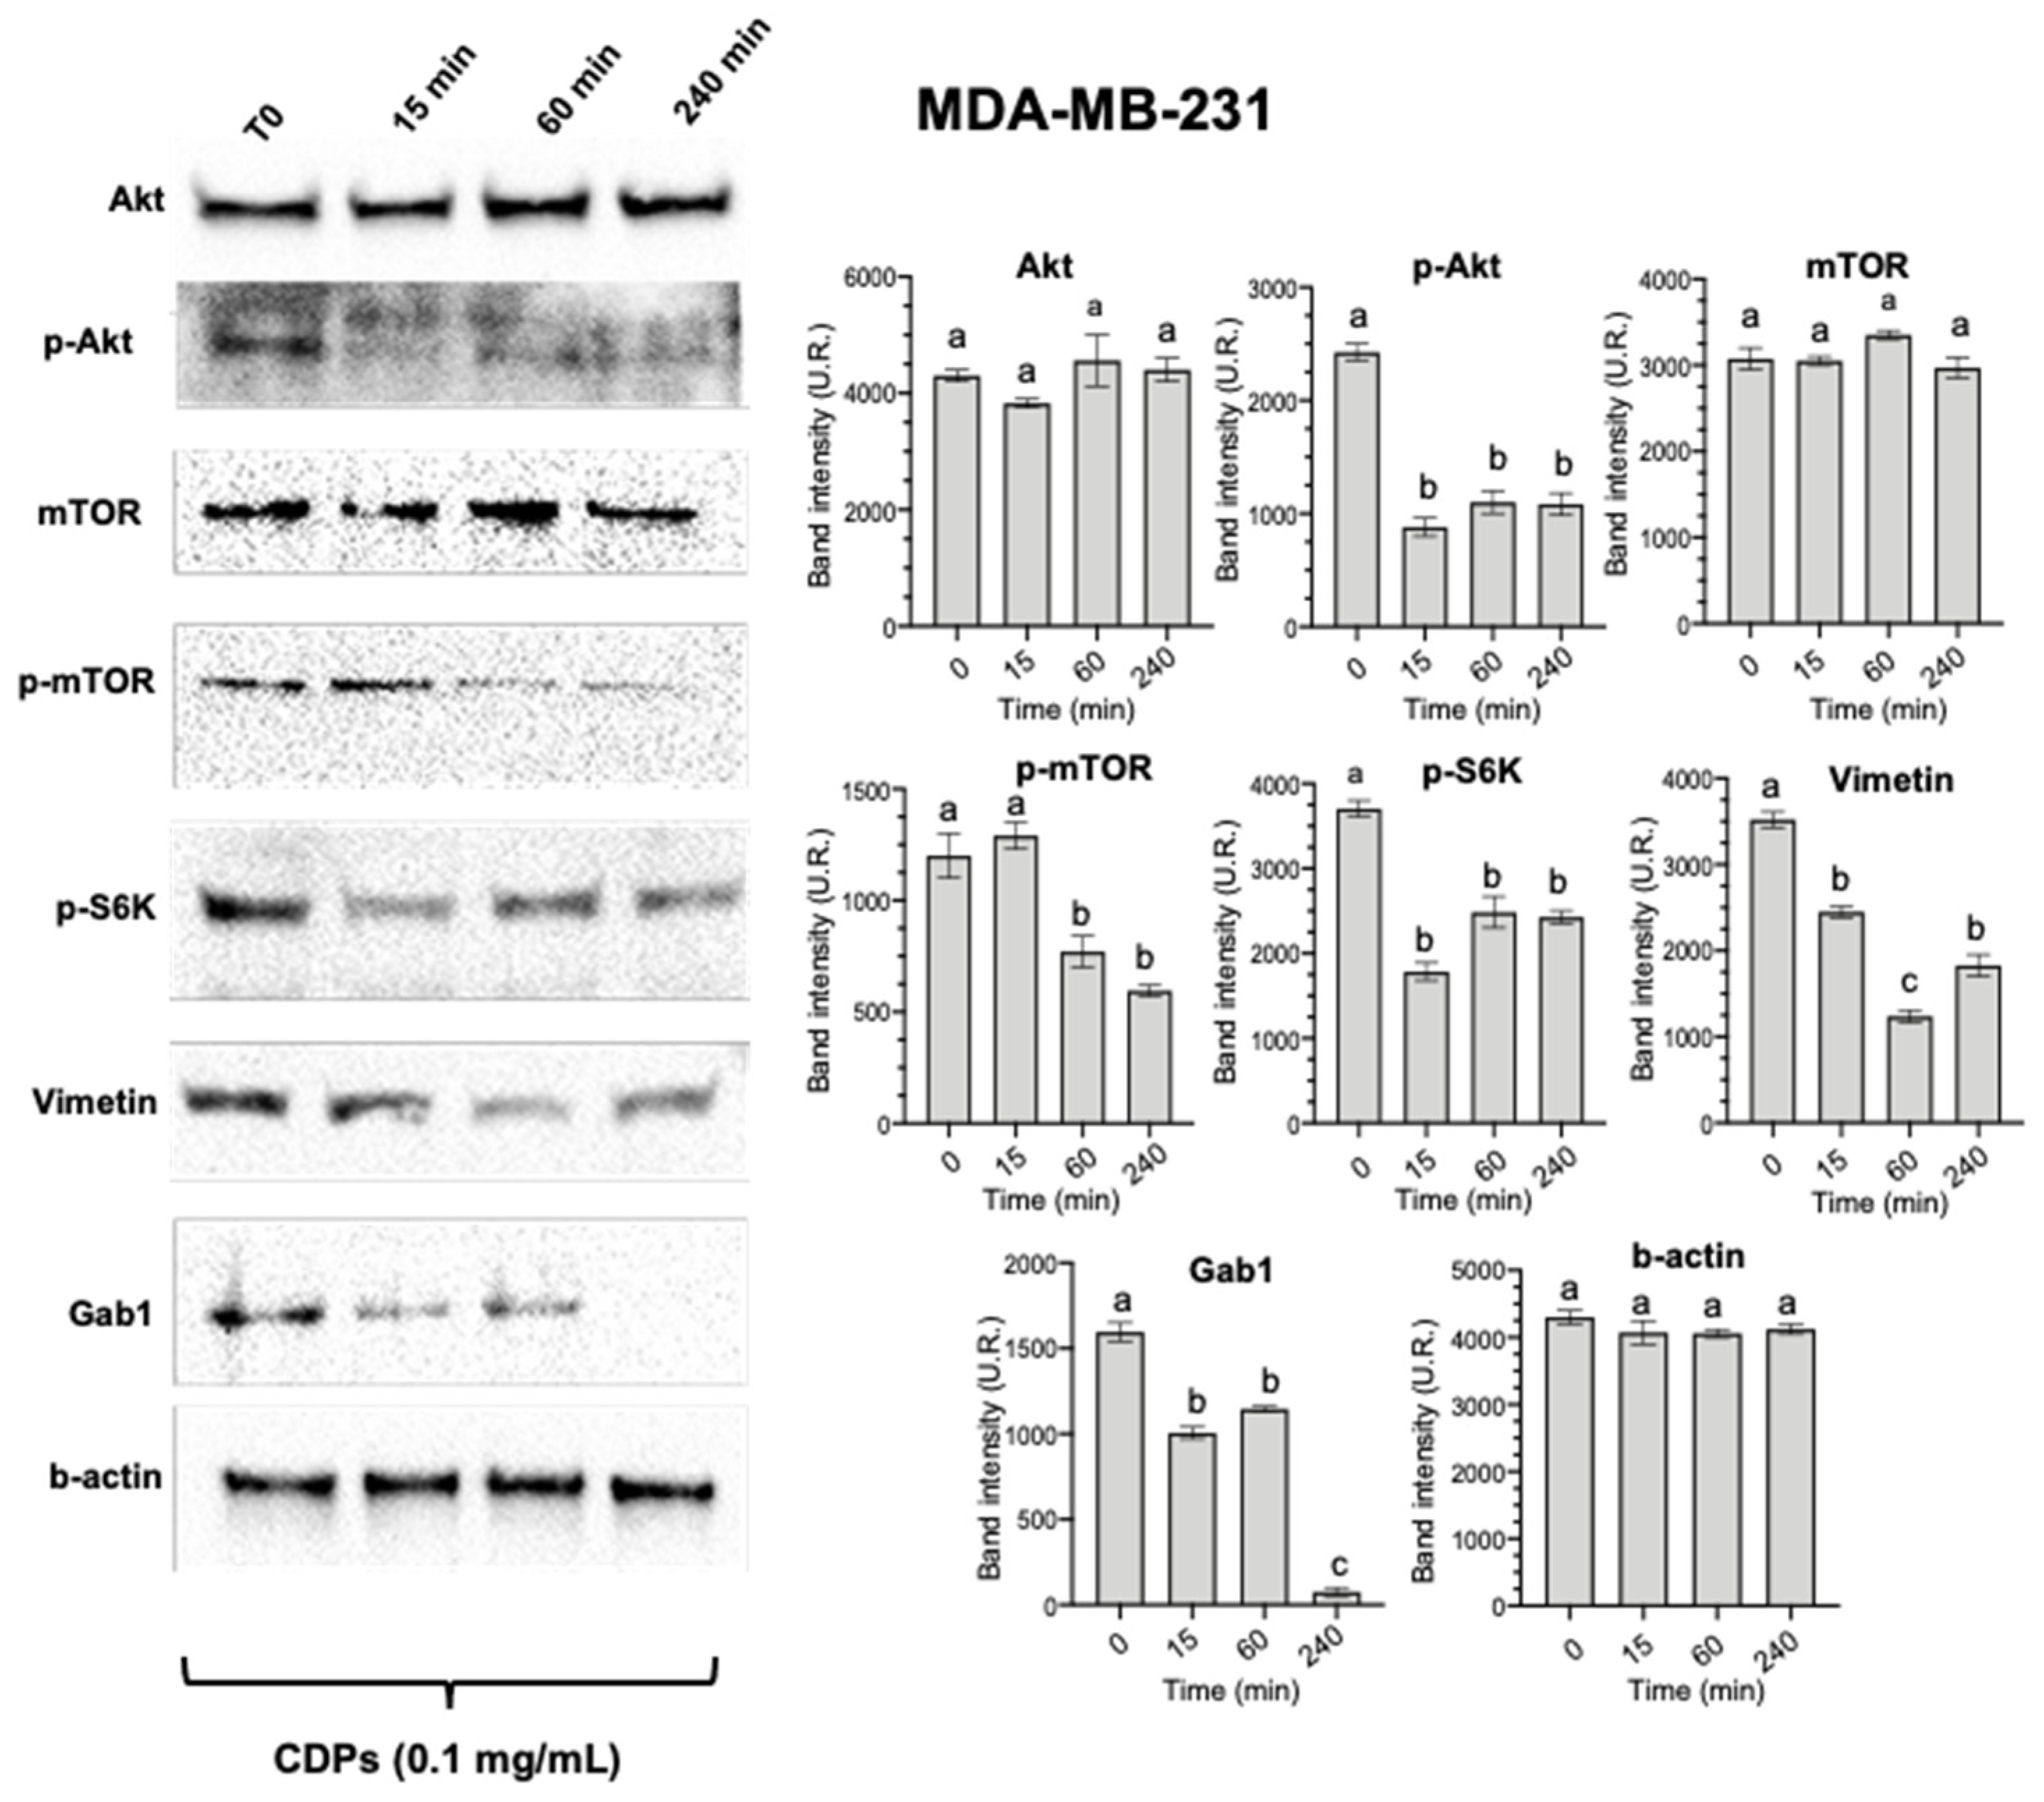
Figure 3.
Anti-tumor procedure in MDA-MB-231 immunosuppressed mice breast cancer model by CDPs treatment. Female Balb/c nu/un mice (8 weeks old) were submitted to an anti-tumor study by 60 days. a) Two treatment conditions were tested: i) the MDA-MB-231cell line inoculation joined with the CDPs treatment at the time of cell implantation, following the treatment of nine doses of CDPs (0.25 mg/g) under 35 days procedure (arrows). The second procedure consisted of the development of metastatic tumor by MDA-MB-231cell line inoculation during 30 days; after that, the CDPs treatment was started and followed by nine doses of CDPs (0.25 mg/g) during 35 days procedure (arrows). b) During the development of the study, the body weight was monitored. The slope of weight gain values is shown in all the mice groups (right). Statistical analysis was performed using t-student; values are displayed, and significant differences are indicated with asterisks (p <0.05). Control (C), animals that received standard rodent diet without treatment; C+CDPs, animals control that received CDPs treatment; BC, animals that developed breast cancer without treatment; BC+CDPs (i), BC animals that received CDPs treatment as the procedure (i); BC+CDPs (m), ), BC animals that received CDPs treatment as procedure (m); BC+MTX (m), ), BC animals that received methotrexate treatment as procedure (m); BC+CDPs+MTX (m), BC animals that received CDPs + methotrexate treatment as procedure (m).
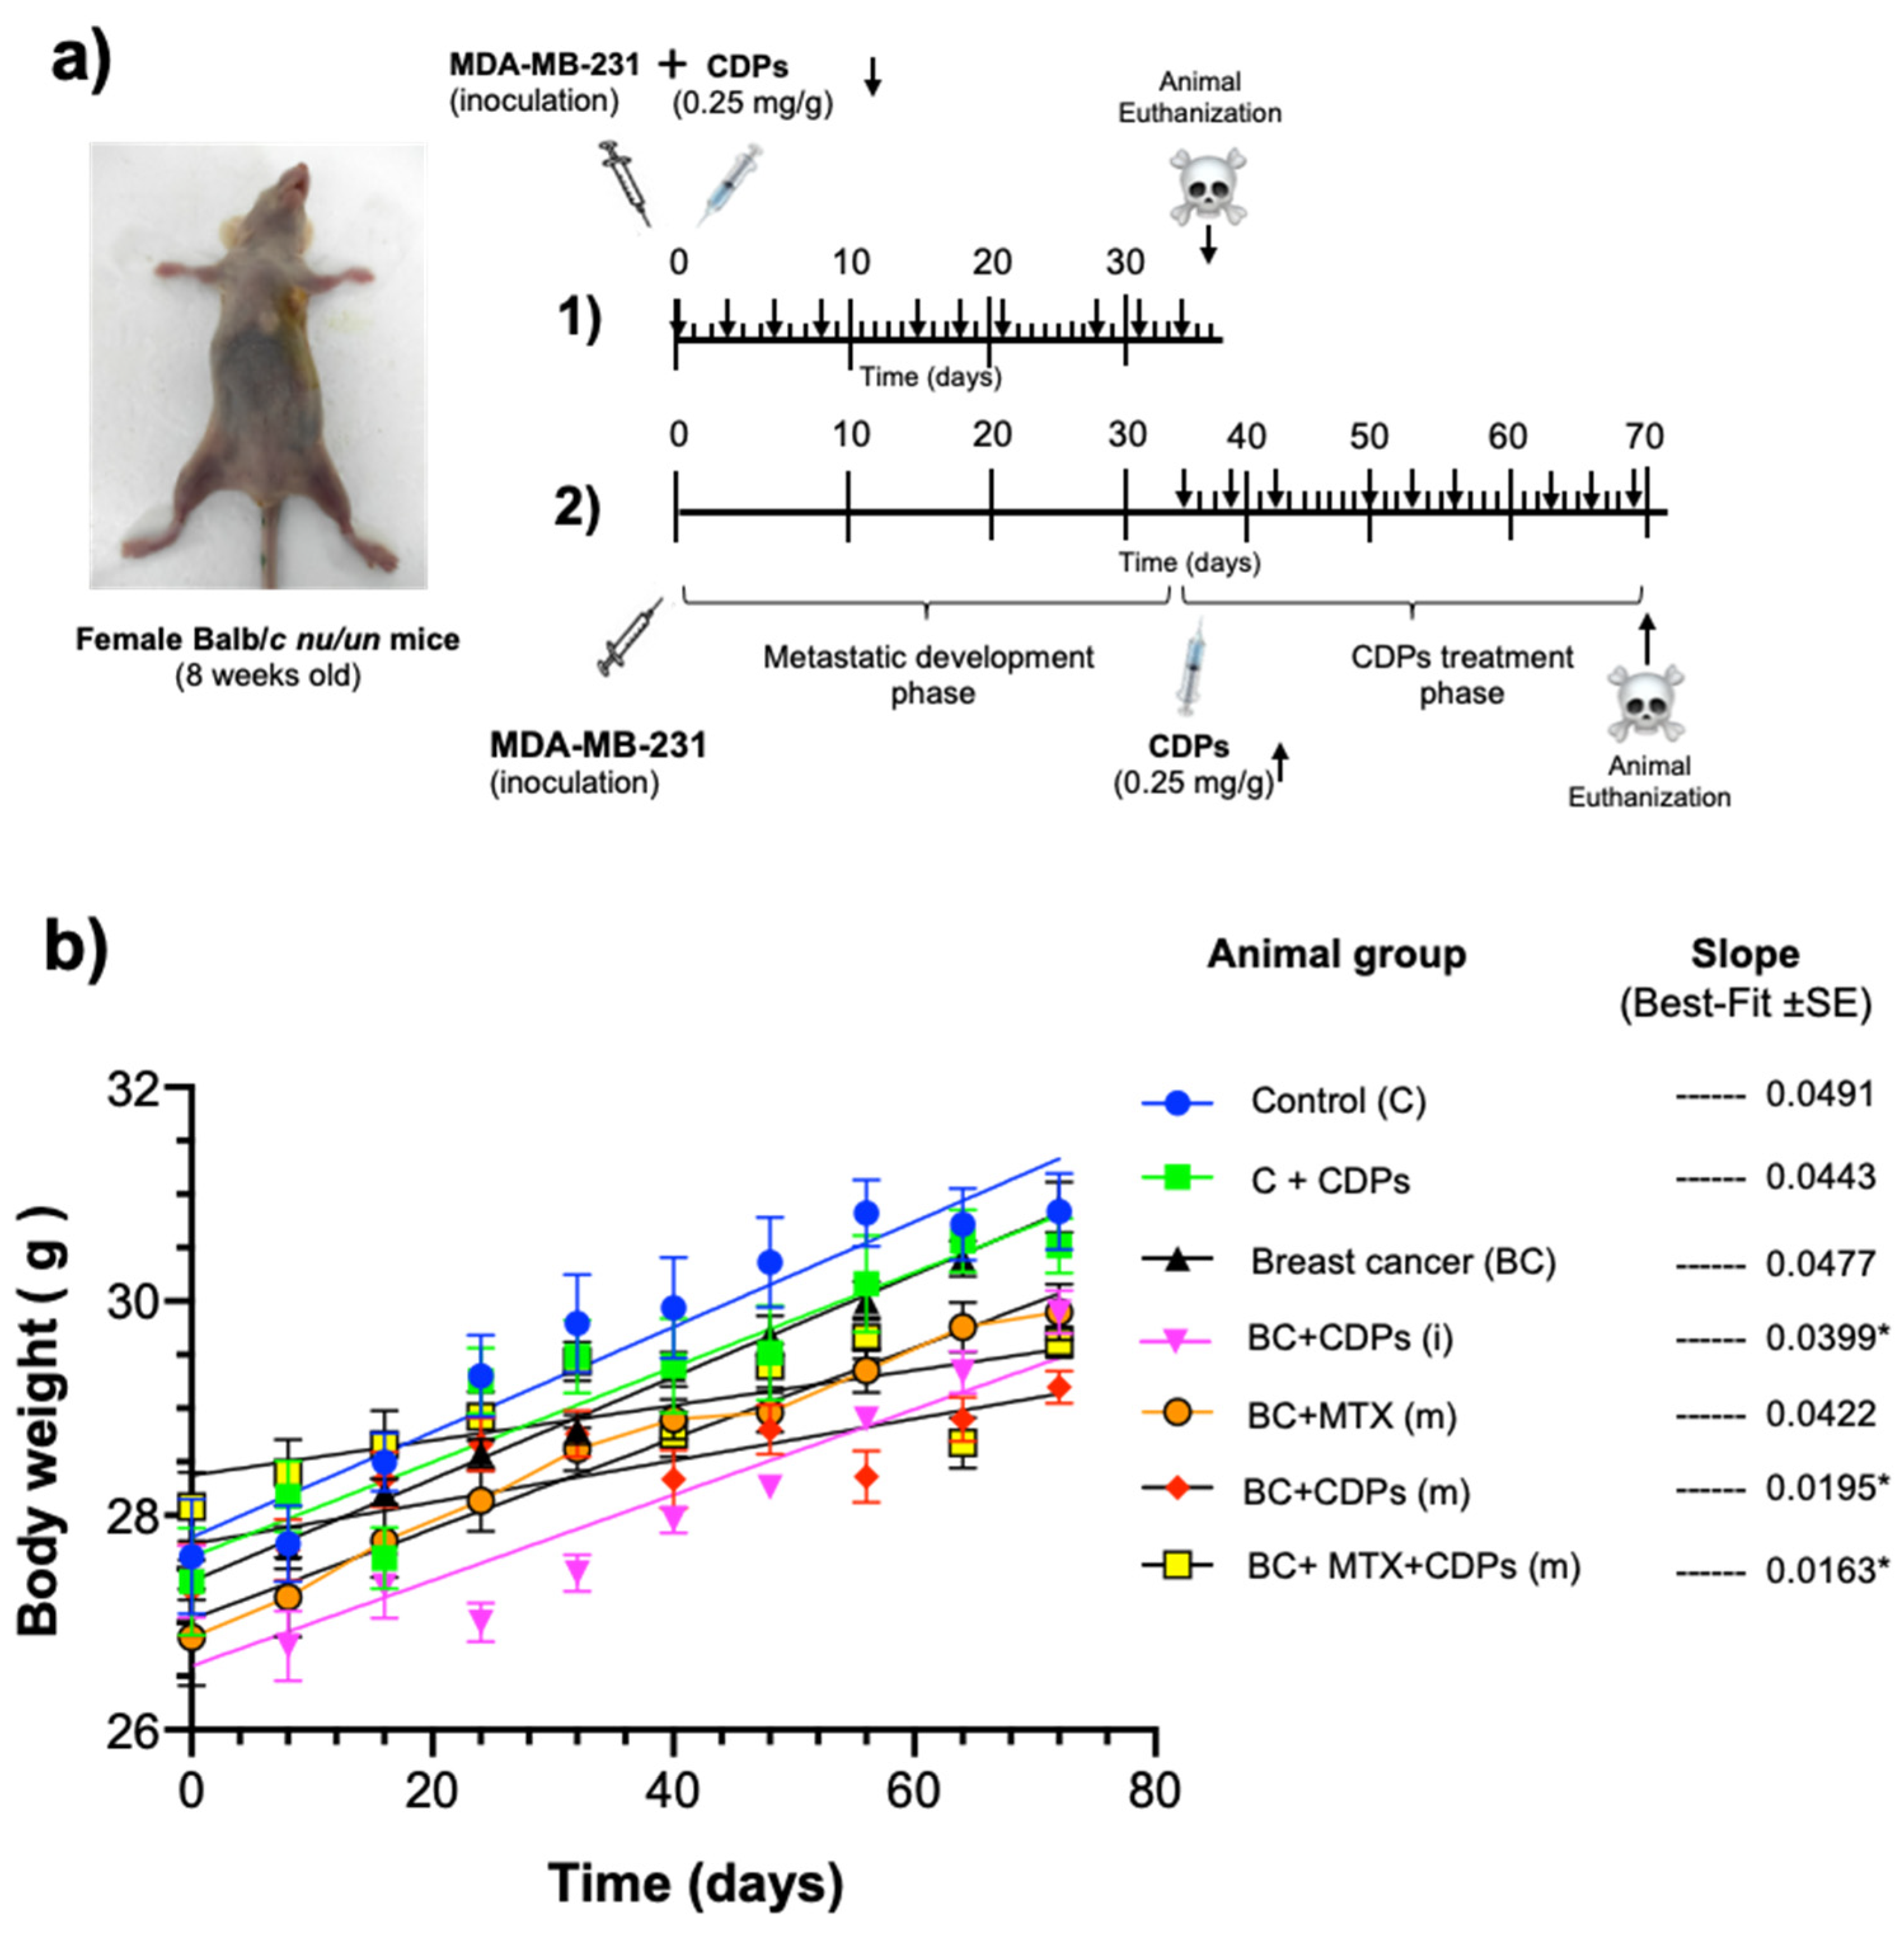
Figure 4.
Anti-tumor effect of CDPs on xenografted breast cancer MDA-MB-231 cells in immunosuppressed mice. a) Photograph of mouse groups on the 60th day of the experimental procedure before euthanizing. Representative photographs of tumors from each mouse group are shown; nomenclature is indicated in Figure 3. The scale of the ruler corresponds to centimeters. b) Determination of tumor volume expressed in mm3. c) Tumor weight expressed in grams. Bars represent the means ± SE, n = 5. One-way ANOVA with Bonferroni post-hoc test was used to compare treatments with the untreated group (BC); significant differences (p< 0.05) are indicated with an asterisk (*).
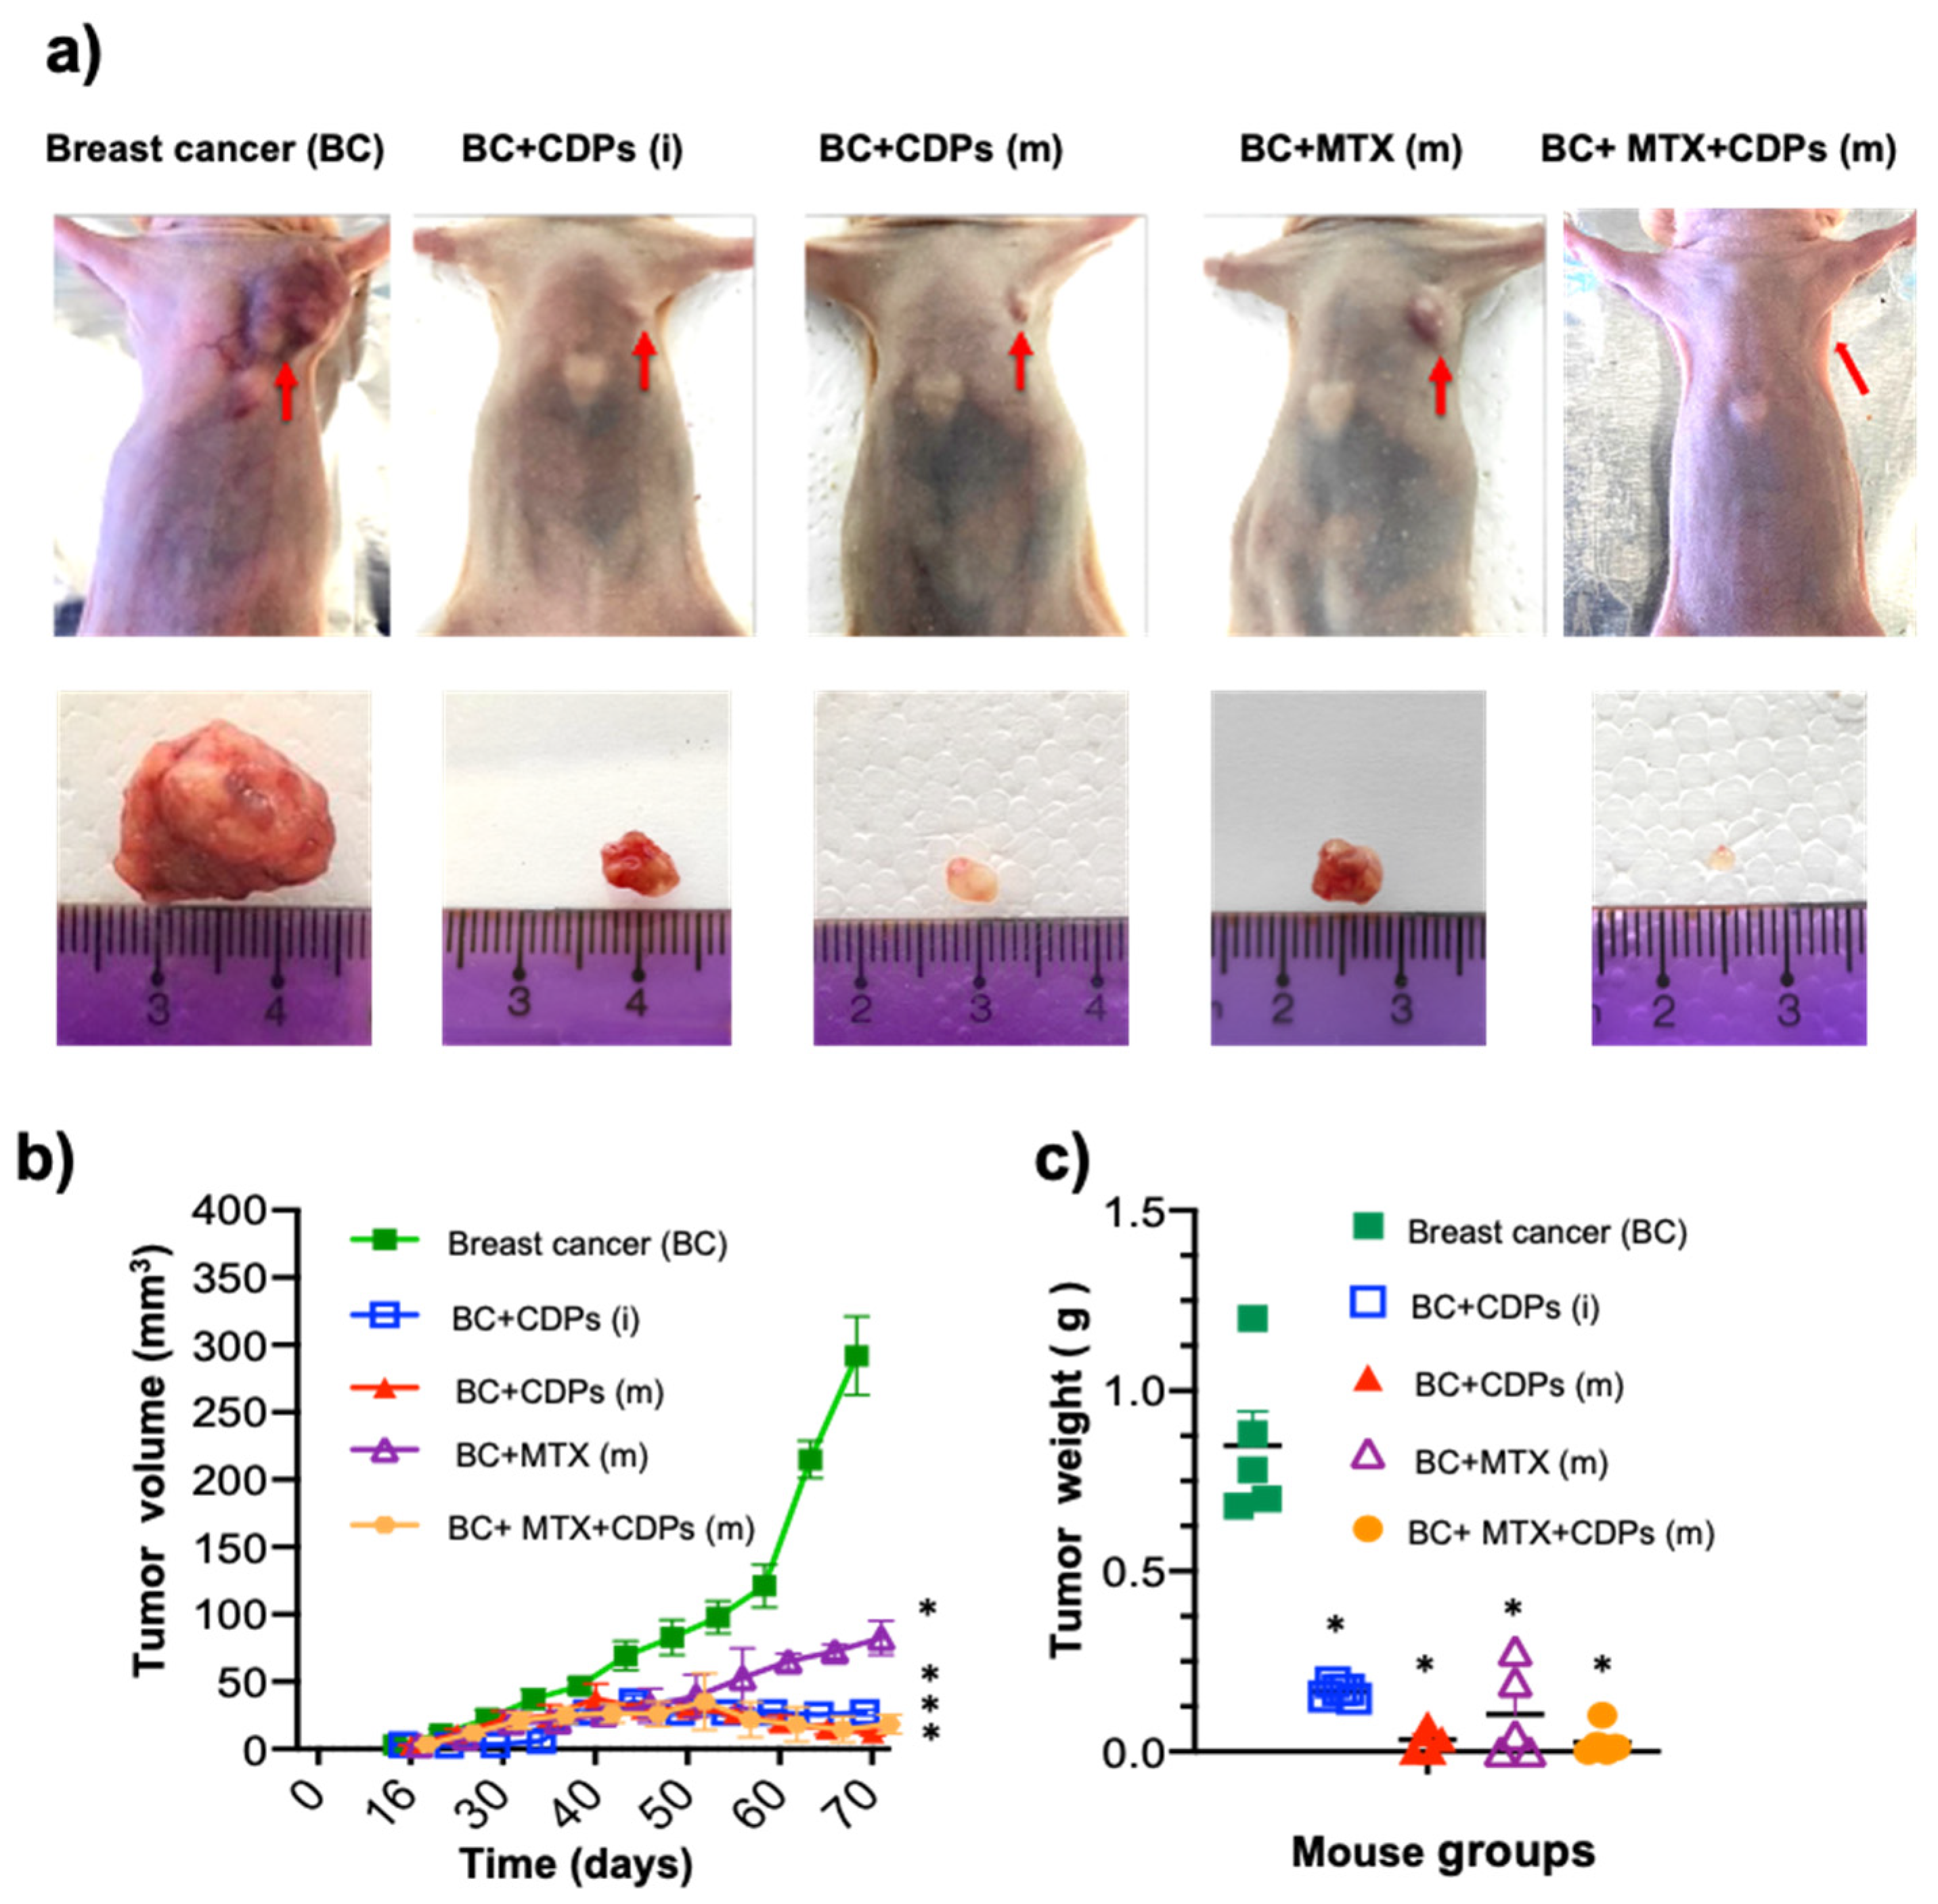
Figure 5.
Anti-tumor effect of CDPs on organs of xenografted breast cancer MDA-MB-231 cells in immunosuppressed mice. a) Photograph of lungs and liver of mice dissected on the 60th day of the experimental procedure. Arrows indicate metastatic foci in organs. Representative photographs of organs from each mouse group are shown; nomenclature is shown in Figure 3. b) Determination of organ weight expressed in grams. c) Determination of enzyme activity of AST, ALT, and LDH in serum of mice groups. d) Hematological profile, hemoglobin (g/dL), and leucocyte counts in mice with metastatic breast cancer implantation. Graphs represent the means ± SE, n = 5. One-way ANOVA with Bonferroni post-hoc test was used to compare treatments with the untreated group (BC); significant differences (p< 0.05) are indicated as different letters or with asterisks (*).
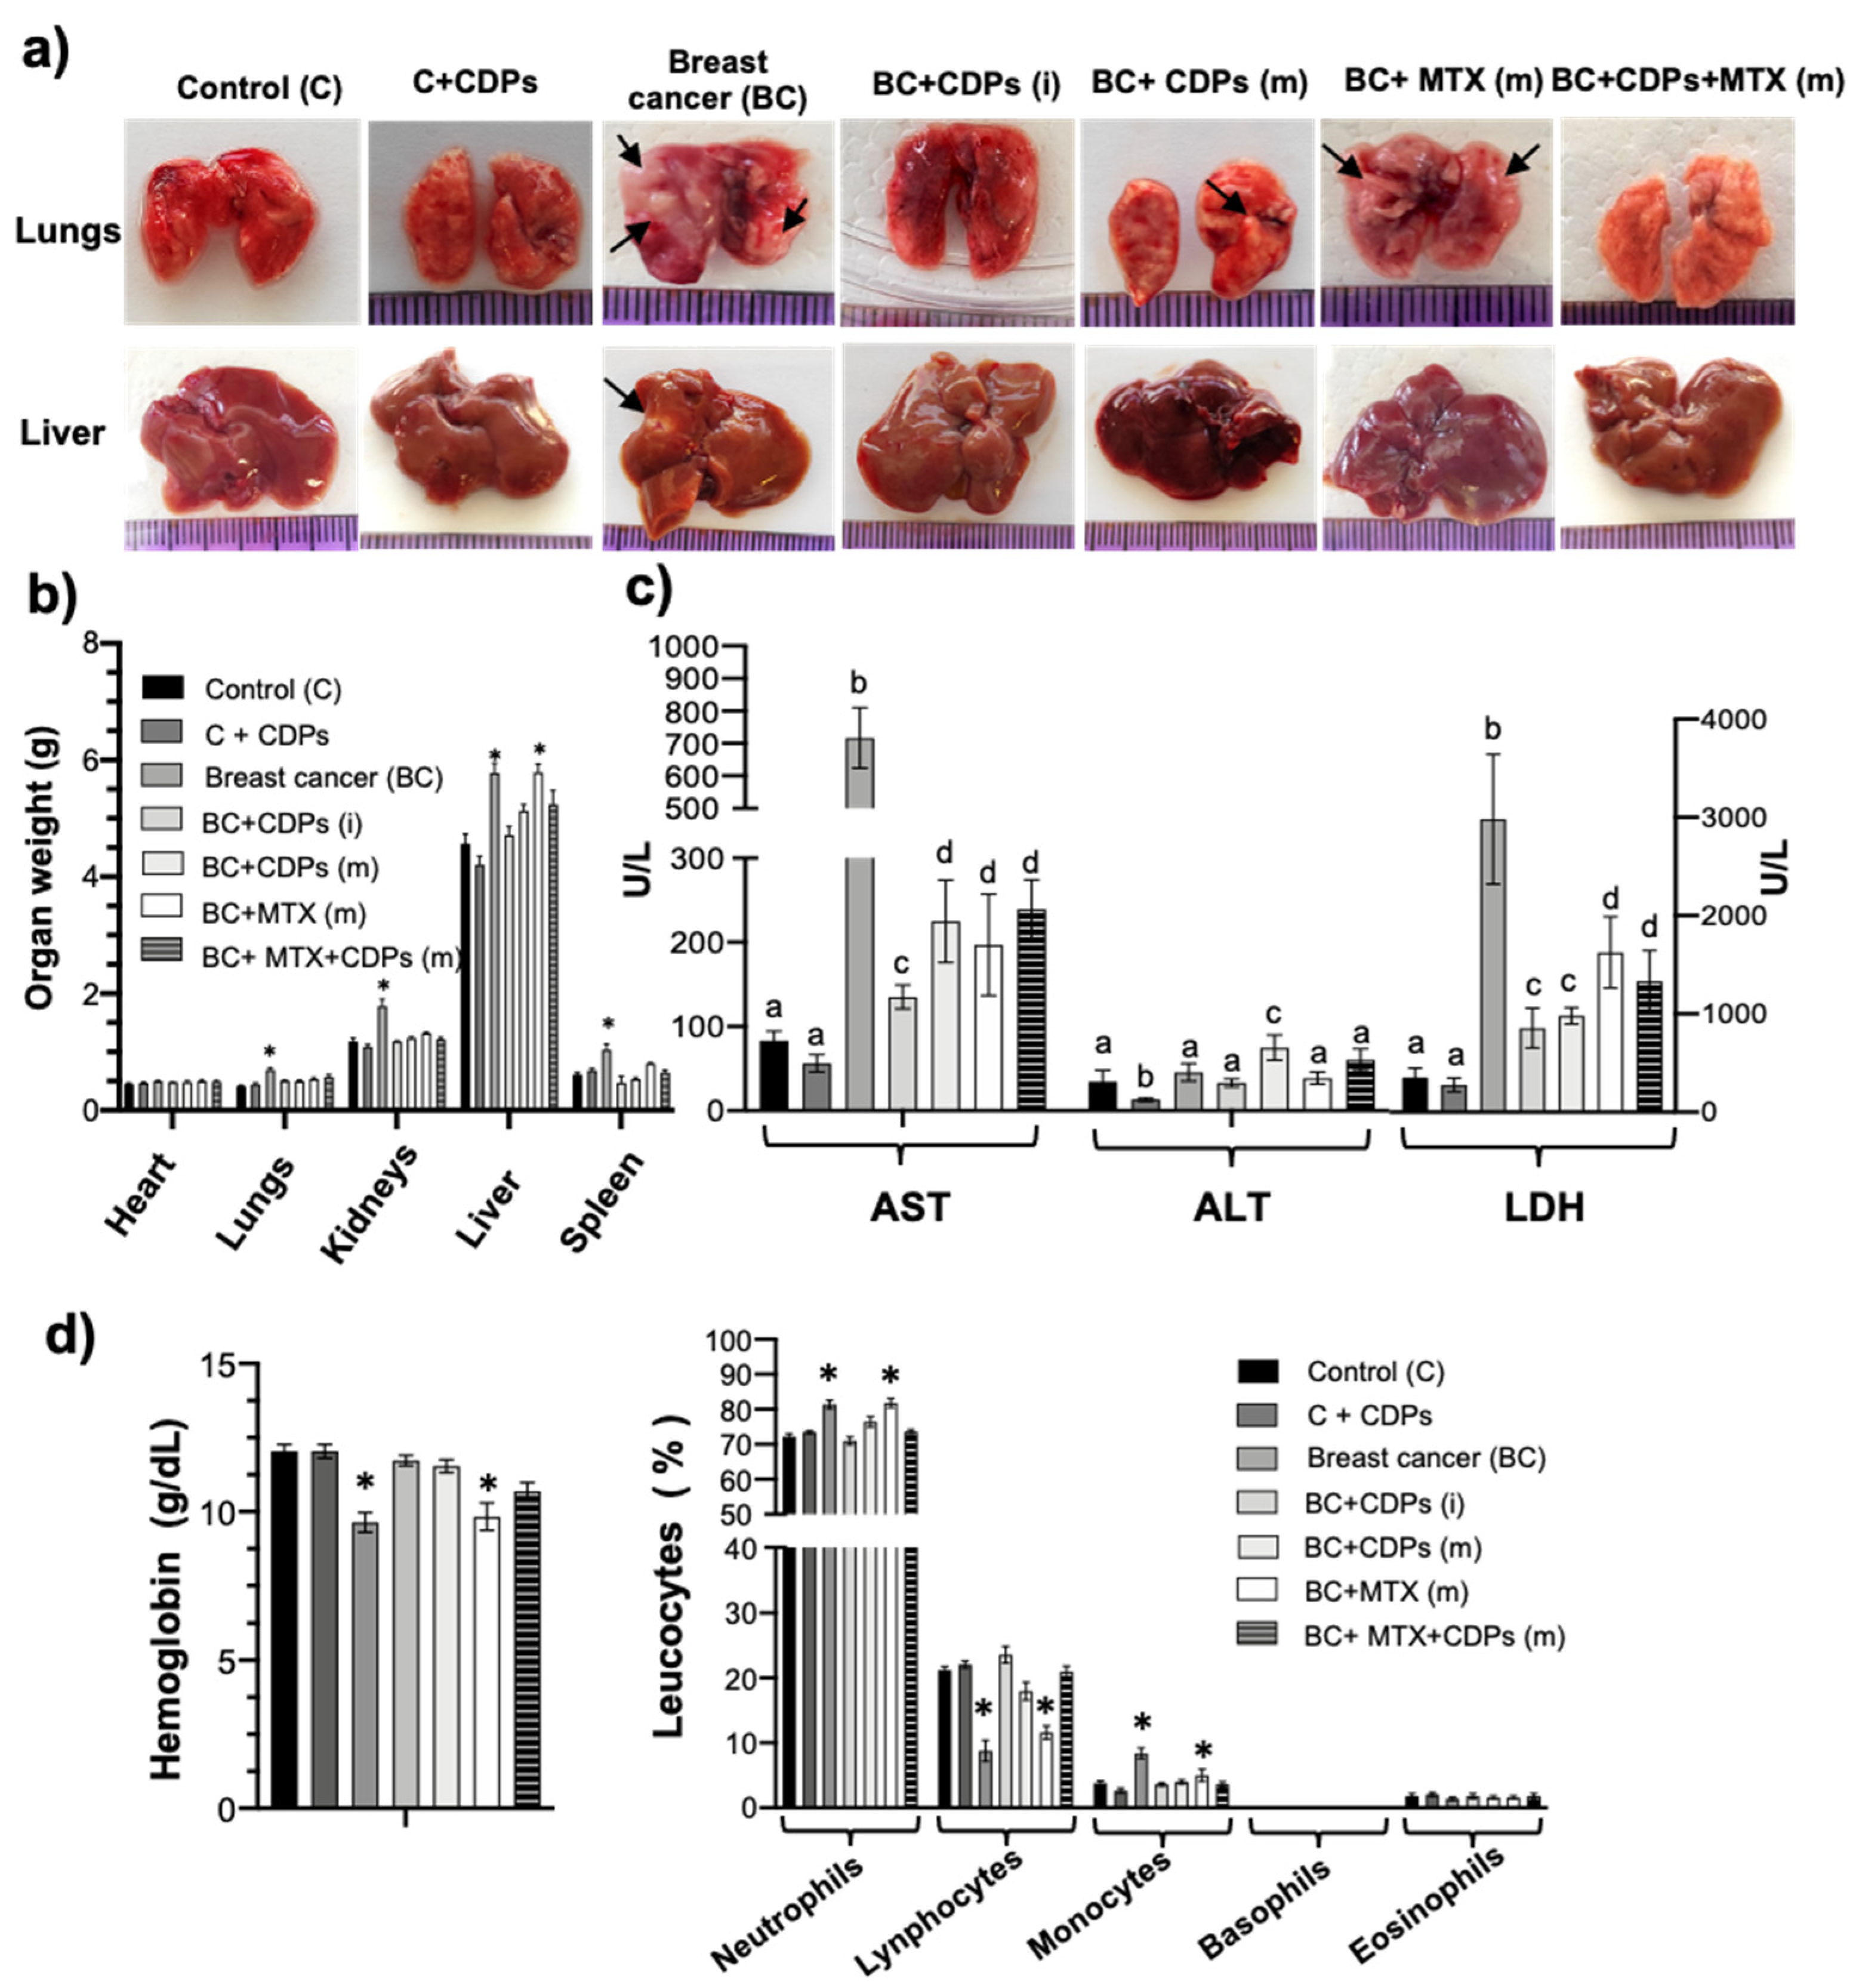
Figure 6.
Histological features of lungs and liver of xenografted breast cancer MDA-MB-231 cells in immunosuppressed mice treated with CDPs. Female Balb/c nu/nu mice (8 weeks old) were submitted to an anti-tumor study by 60 days. Liver tissue sections were stained with hematoxylin and eosin and observed using microscopy; representative photographs of tissues dissected from the animal groups are shown and named in Figure 3. Arrows show breast cancer MDA-MB-231 cell infiltration; boxes indicate leukocyte infiltration in liver tissue.
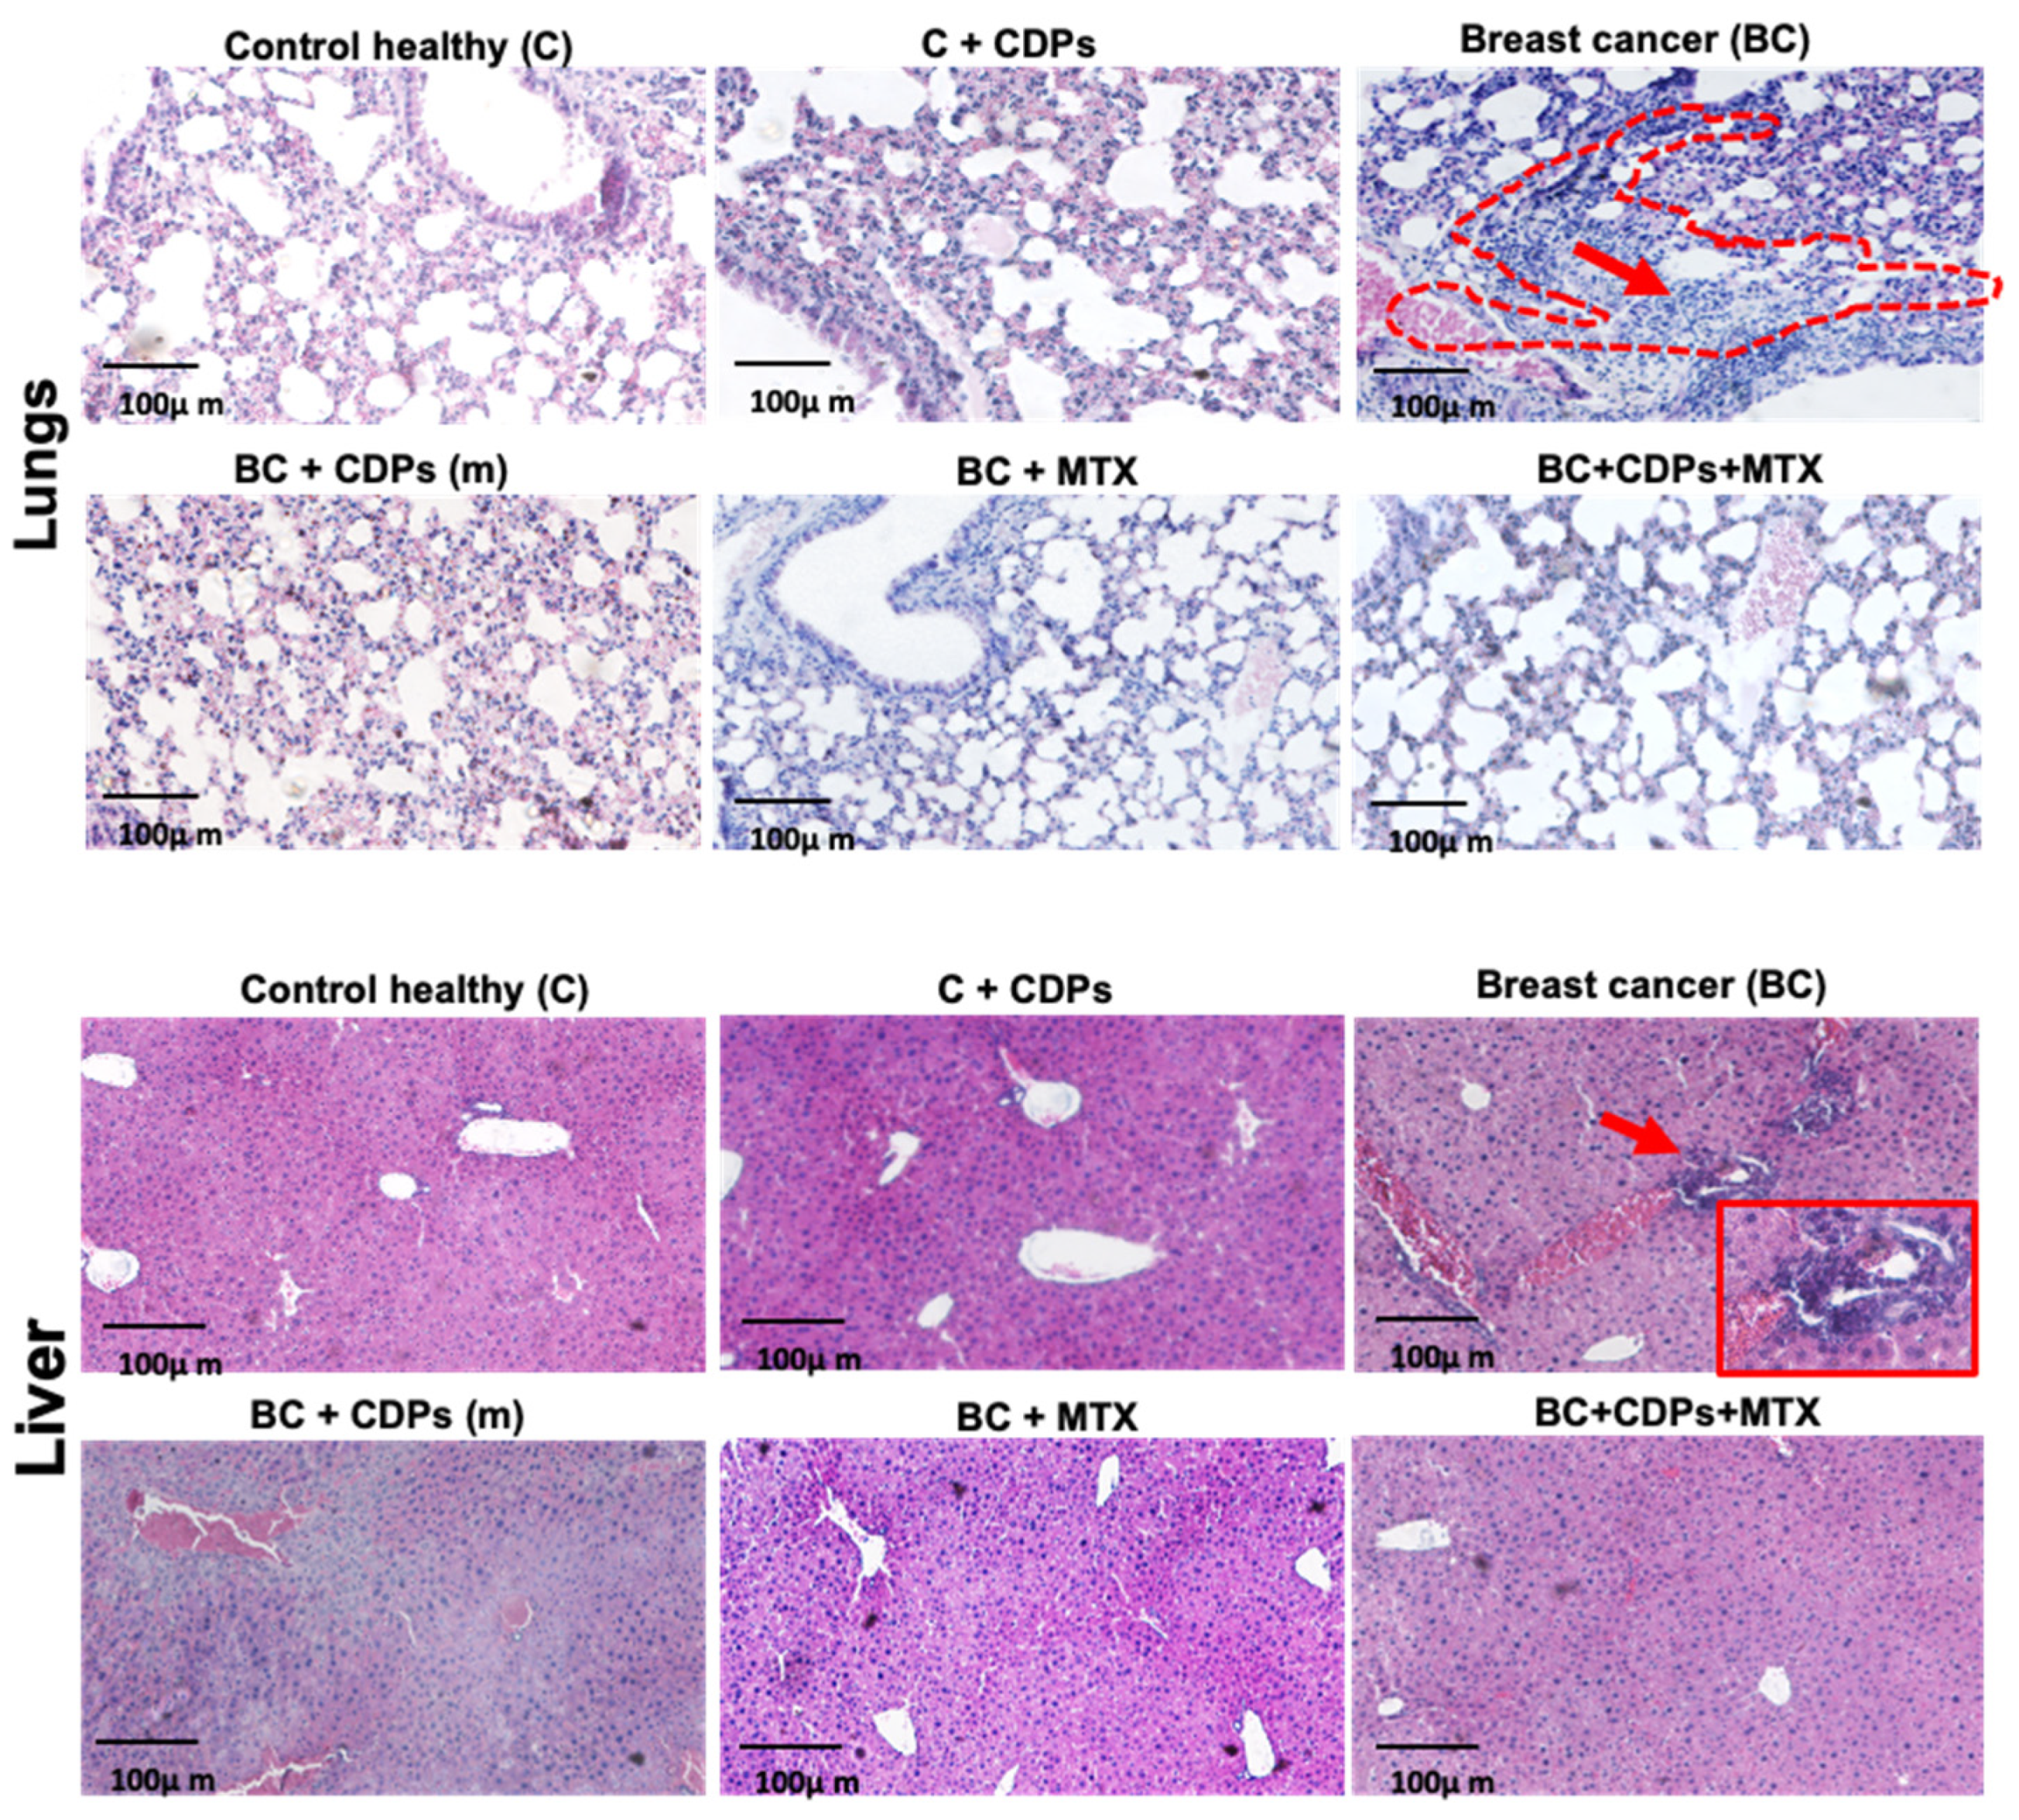
Figure 7.
Analysis of bone cancer in xenografted breast cancer MDA-MB-231 cells in immunosuppressed mice treated with CDPs. Female Balb/c nu/un mice (8 weeks old) were submitted to an anti-tumor study by 60 days. Animal groups are named as in Figure 3. a) Radiographic images show representative images of animal groups implanted with breast cancer (BC) and treated with anti-neoplastic drugs. The zoom of the pelvis and femur are shown, and the zones of bone destruction are used to carry out a densitometric analysis using the Image J software. b) Densitometry of Femur and pelvis. C) Determination of calcium in the femur. Graphs represent the means ± SE, n = 5. One-way ANOVA with Bonferroni post-hoc test was used to compare treatments with the untreated group (BC); significant differences (p< 0.05) are indicated as different letters.
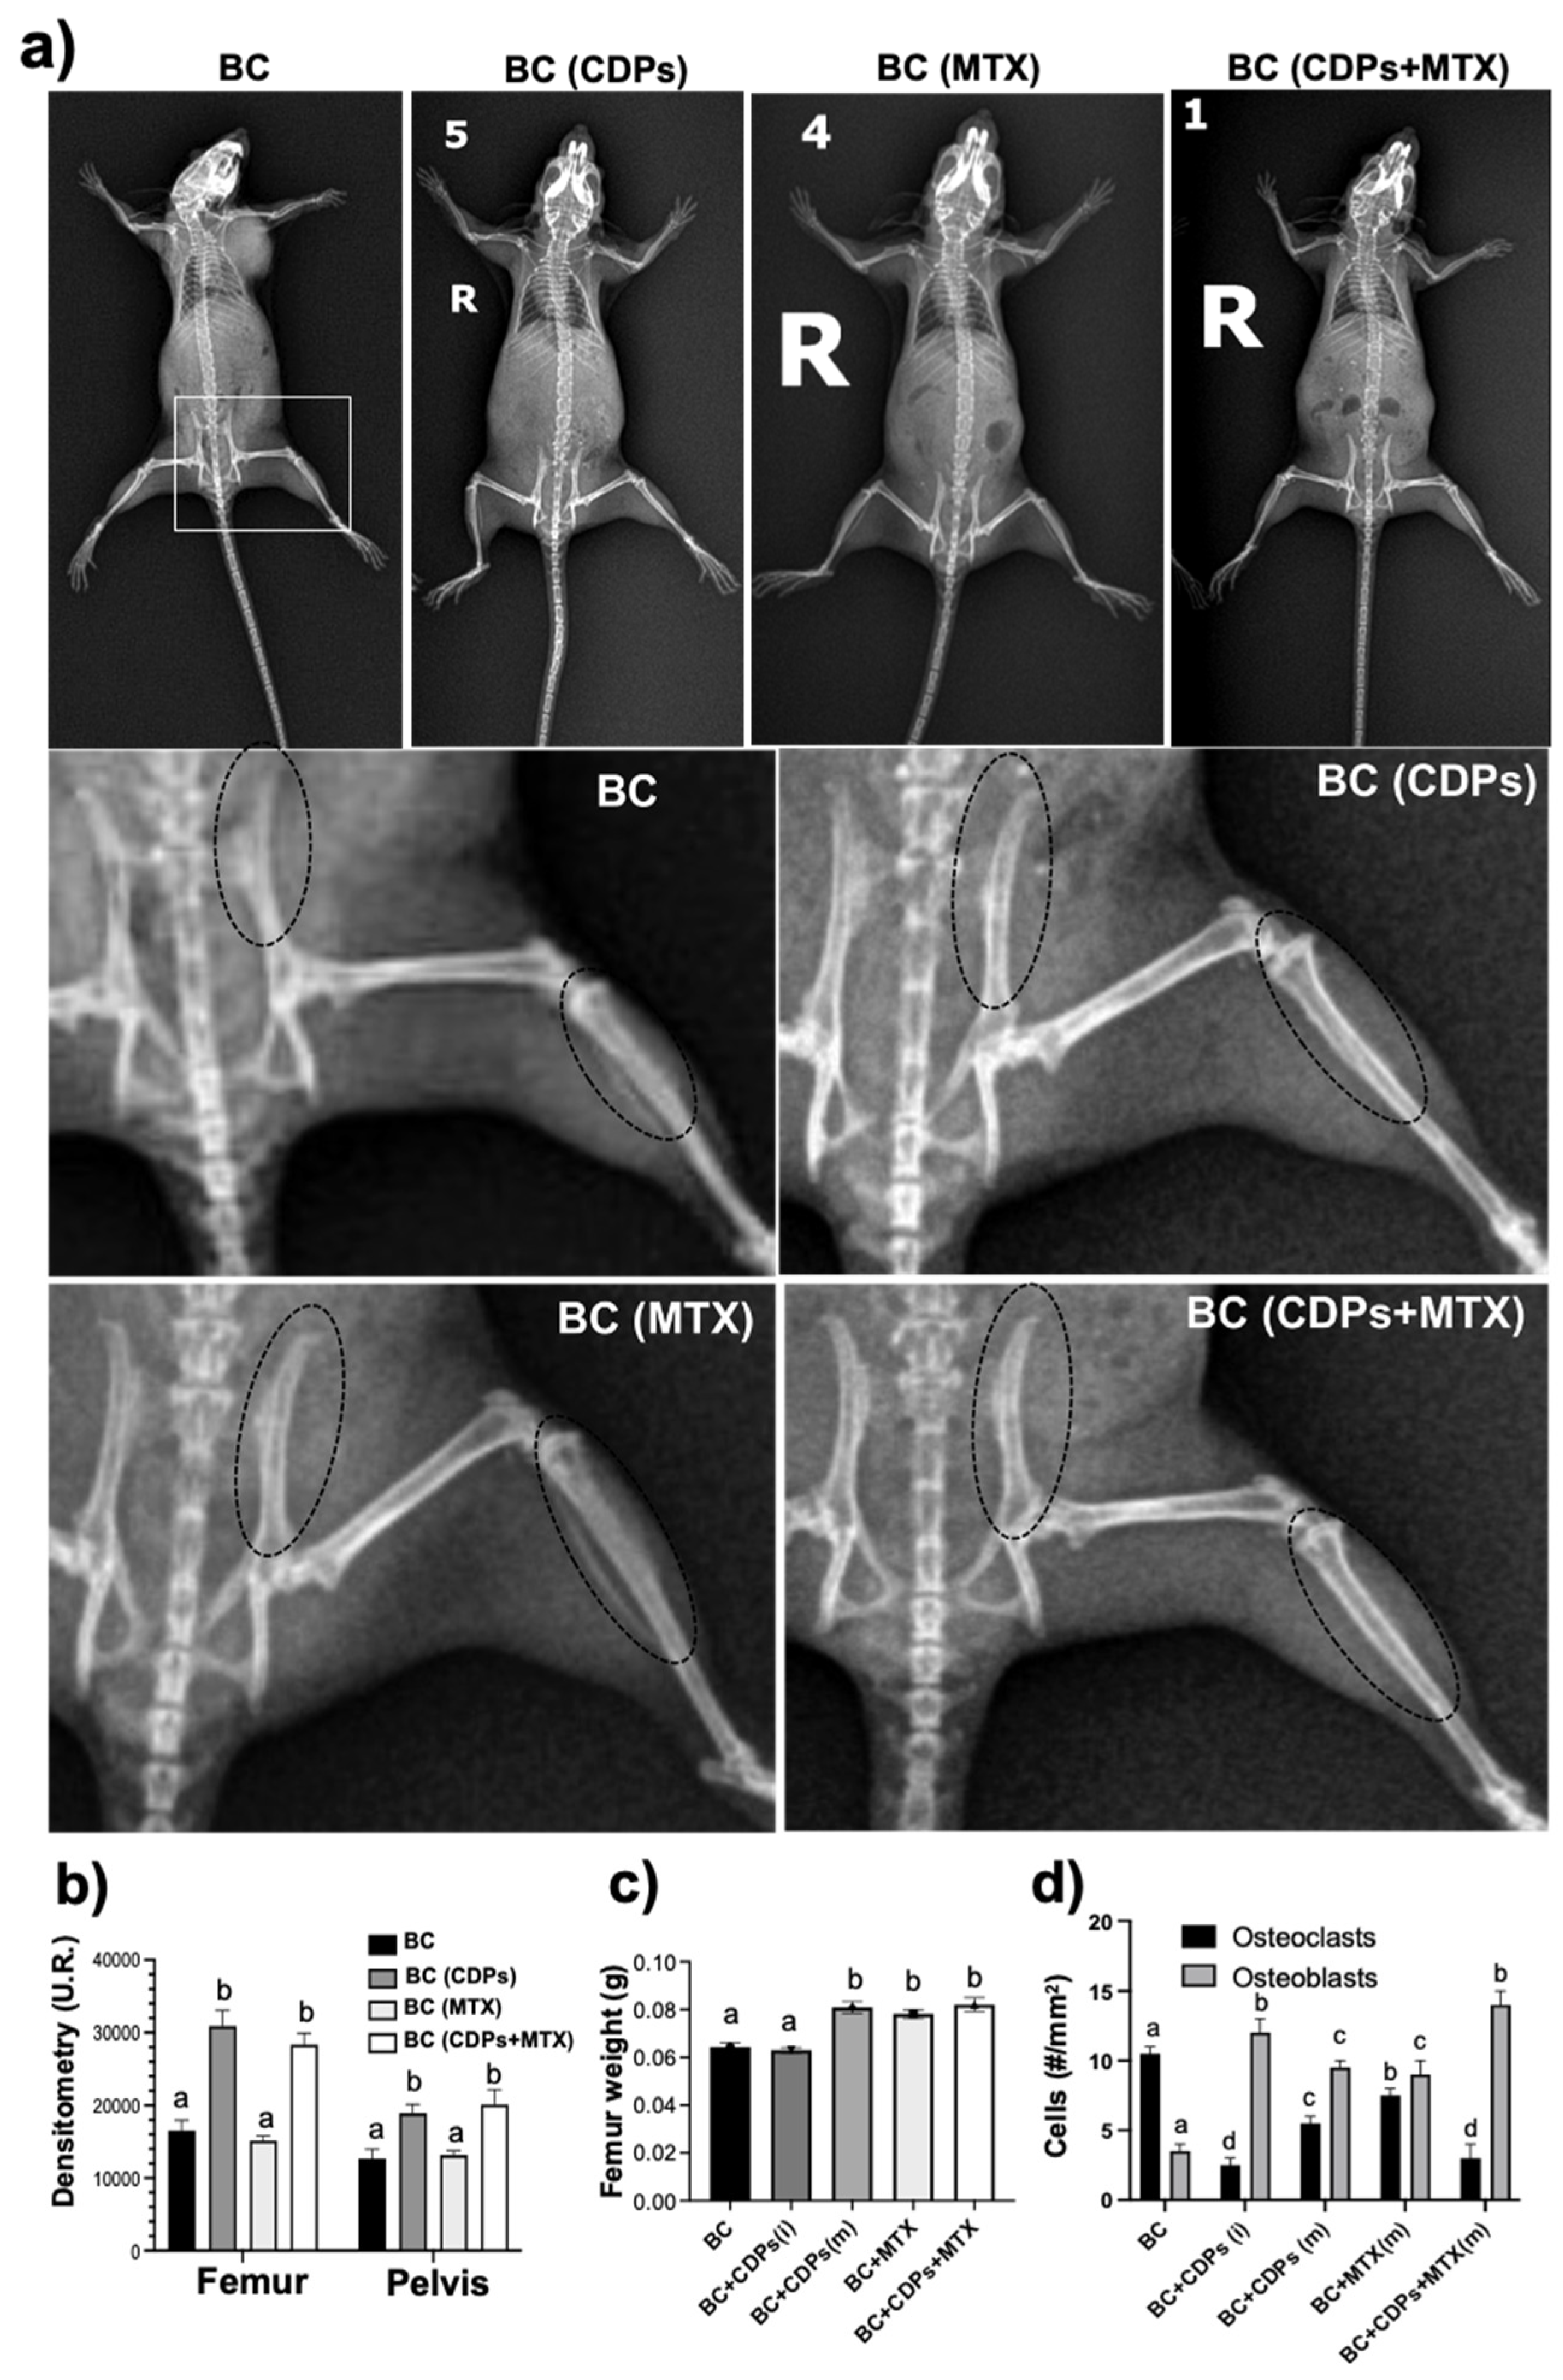
Figure 8.
Histological features of femurs from xenografted breast cancer MDA-MB-231 cells in immunosuppressed mice treated with CDPs. Female Balb/c nu/un mice (8 weeks old) were submitted to an anti-tumor study by 60 days. Femur tissue sections were stained with hematoxylin and eosin and observed using microscopy; representative photographs of tissues dissected from the animal groups are shown and named as in Figure 3. Arrows show breast cancer MDA-MB-231 cell infiltration; boxes indicate leukocyte infiltration in liver tissue. Representative sections stained by H&E (×4 magnification, Scale bar =200 μm; ×10 magnification, Scale bar =100 μm and ×40 magnification, Scale bar =50 μm) methods of the femur in experimental groups. Red dotted lines outline tumor cell populations indicating tumor bone (TB), which are represented as pink areas. The purple region represents the bone marrow (BM). Tumor bone (TB), osteoblasts (Ob), osteons (Os), immature bone (IB), osteoclasts (*), and bone marrow adipose tissue (AT). Quantification of osteoclasts and osteoblasts in H&E-stained femur sections. Bars represent mean ± SE (n = 3), with statistical significance at p < 0.05. Data were analyzed using one-way ANOVA followed by Tukey's test for multiple comparisons against the control. Statistically significant differences are indicated by letters. Abbreviations: BC (Breast Cancer, no treatment); BC+CDPs (i) (Cyclodipeptides treatment from the start); BC+CDPs (m) (Cyclodipeptides treatment in advanced cancer); MTX (Methotrexate treatment); BC+CDPs+MTX (m) (Combination of Cyclodipeptides and Methotrexate in advanced cancer).
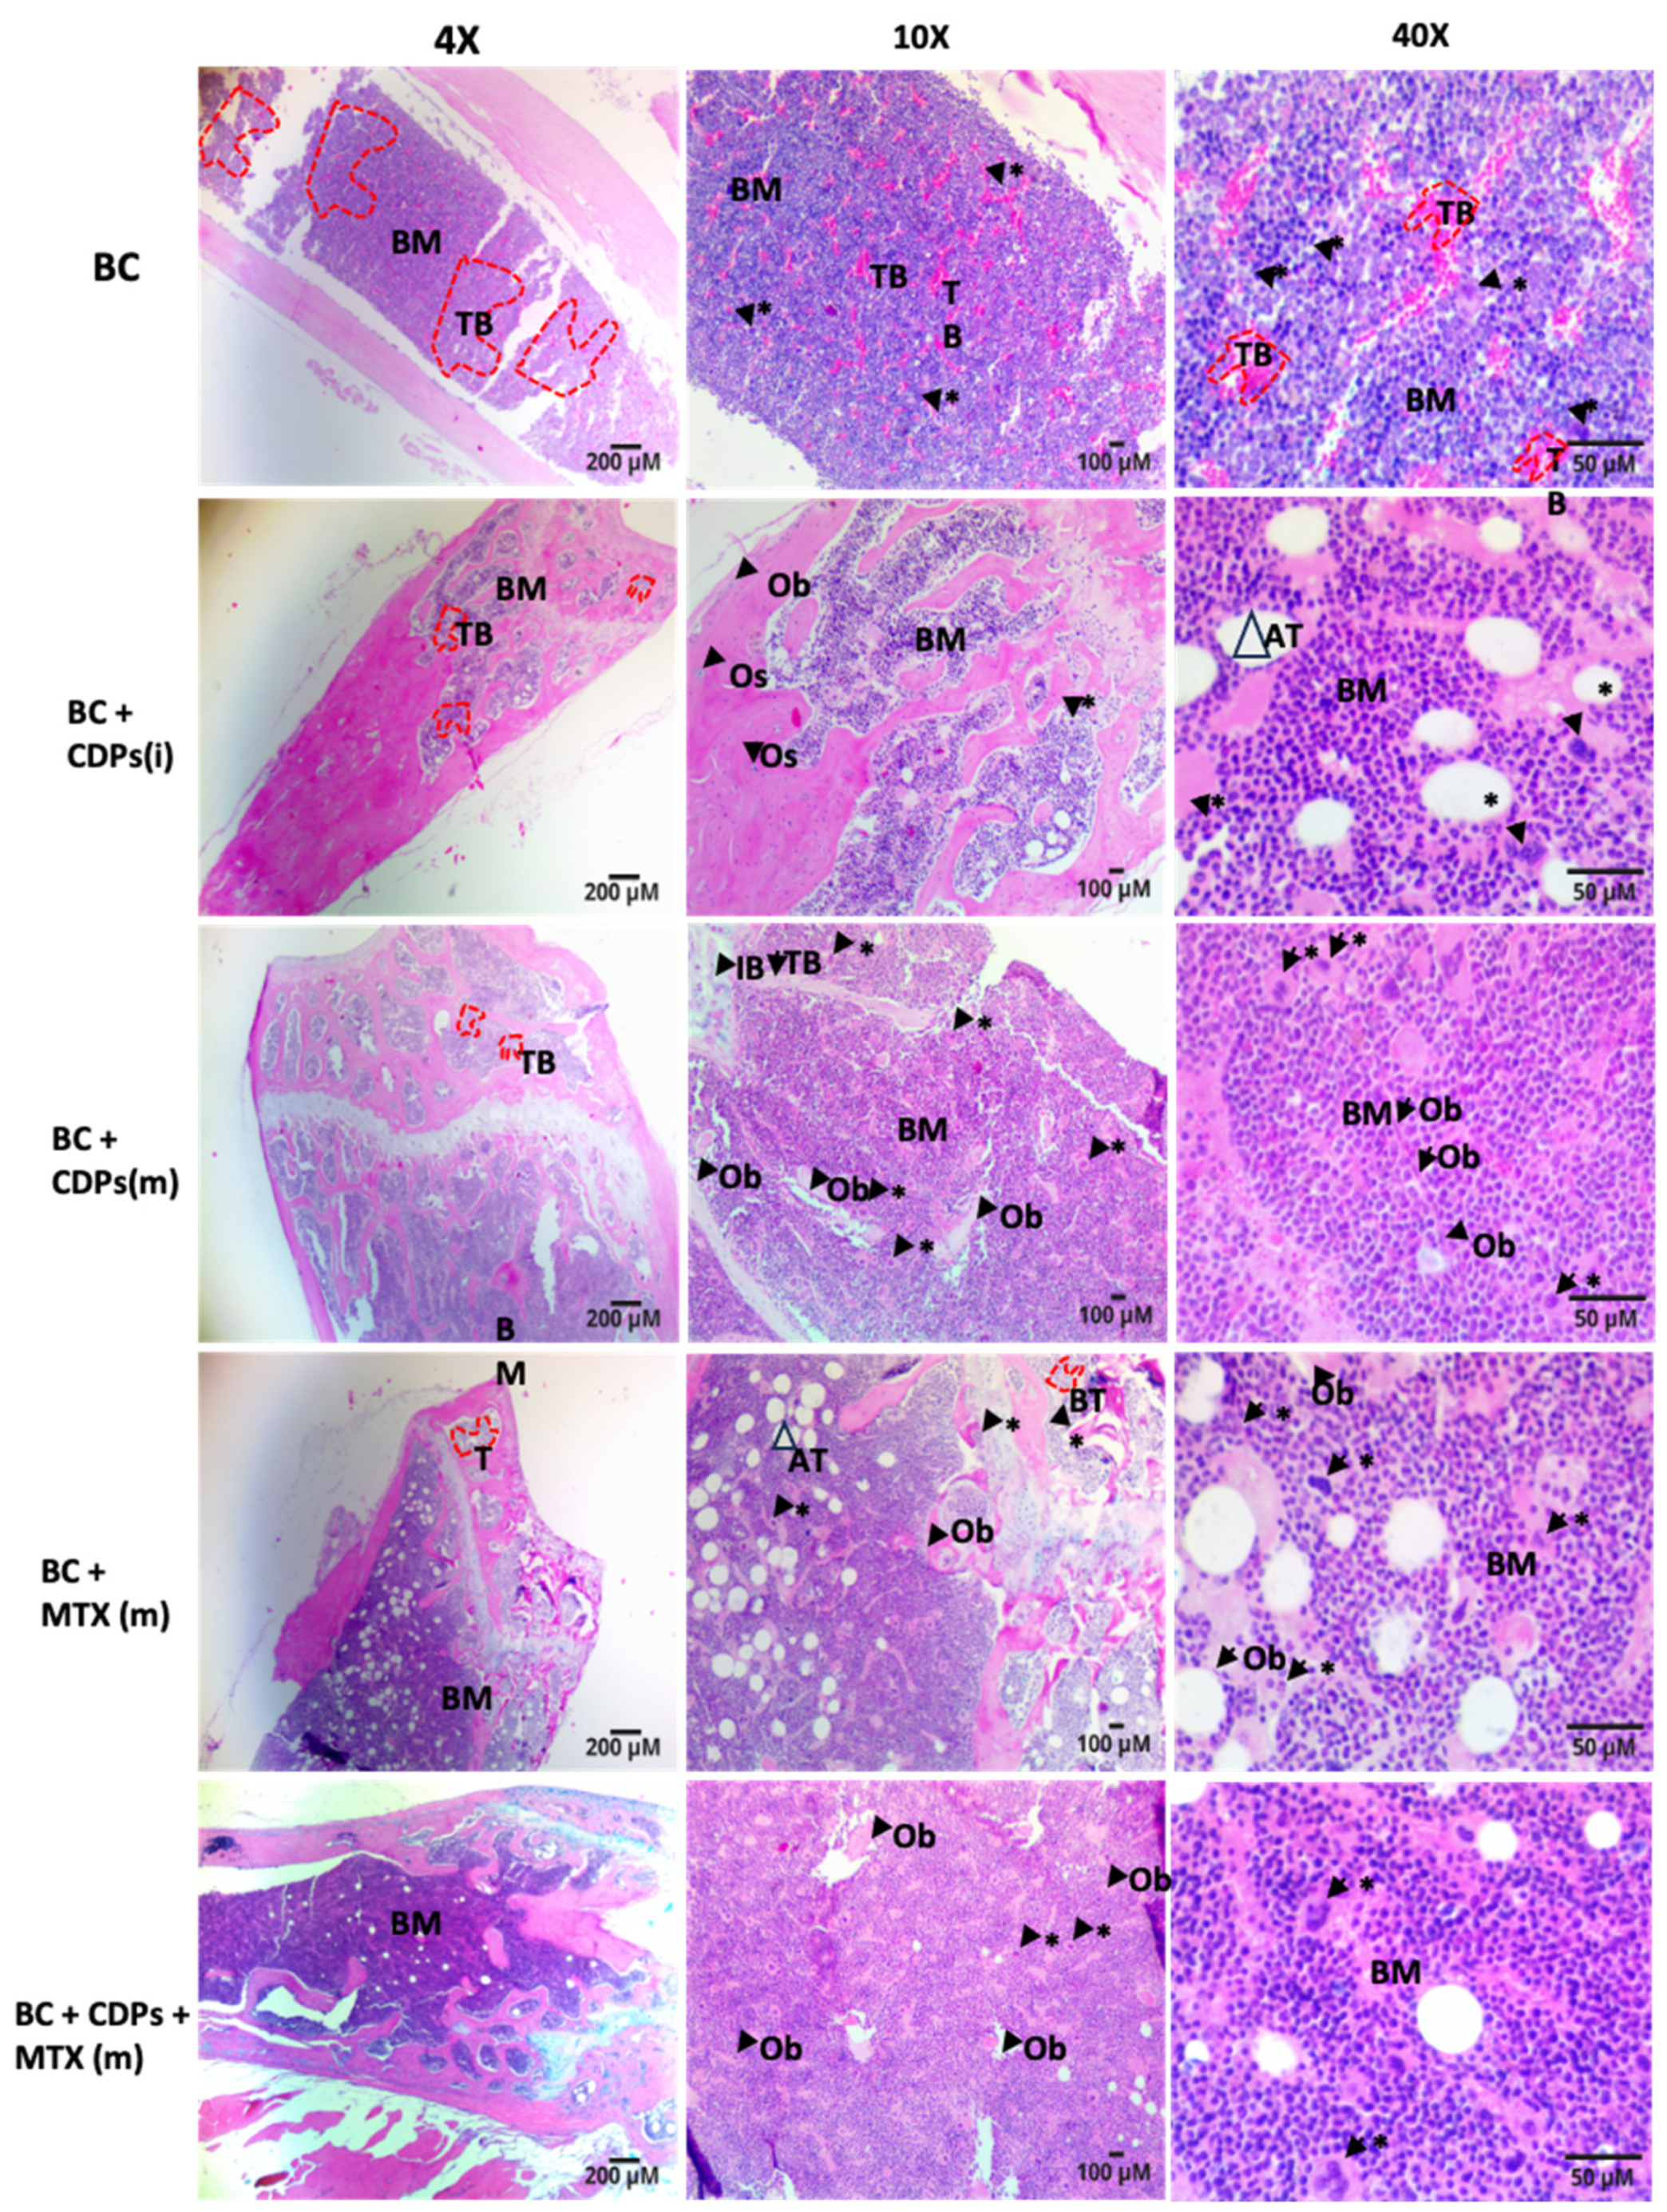
Figure 9.
Effect of CDPs on signaling proteins in tumor xenografted with MDA-MB-231 breast cancer cells in immunosuppressed mice treated with CDPs. Protein extracts obtained from the tumor dissected from the mice groups treated with CDPs (0.1 mg/ml) in function were subjected to immunodetection. Protein expression for the total Akt, phosphorylated Akt, total Gab1, phosphorylated p-Gab1, Total FOX01, and phosphorylates p-FOX01 are shown. Densitometric analyses of the protein immunodetection results are presented on the right. The bars represent the means ± SE, n=3 per group. Statistical analysis was performed using one-way ANOVA, followed by Dunnett's post hoc test; SE values are shown as bars, and significant differences are indicated with different letters (p <0.05).
Disclaimer/Publisher’s Note: The statements, opinions and data contained in all publications are solely those of the individual author(s) and contributor(s) and not of MDPI and/or the editor(s). MDPI and/or the editor(s) disclaim responsibility for any injury to people or property resulting from any ideas, methods, instructions or products referred to in the content. |
© 2025 by the authors. Licensee MDPI, Basel, Switzerland. This article is an open access article distributed under the terms and conditions of the Creative Commons Attribution (CC BY) license (http://creativecommons.org/licenses/by/4.0/).
Copyright: This open access article is published under a Creative Commons CC BY 4.0 license, which permit the free download, distribution, and reuse, provided that the author and preprint are cited in any reuse.


