
Submitted:
11 March 2025
Posted:
12 March 2025
You are already at the latest version
Abstract
Taking effective breaks during a study session is crucial for maintaining high levels of performance, especially in self-regulated learning settings in which students are required to plan their study tasks themselves. However, research on effective break-taking in self-regulated learning settings is limited. This study investigates the effect of Pomodoro, Flowtime, and Self-regulated breaks on subjective study experiences, task completion, and flow in a 2-hour study session. The sample consisted of 94 University students. The participants participated in an online intervention in which they were instructed on how to take breaks in an authentic study session. In the Self-regulated break condition (n=25) students decided for themselves when and how long to take a break. In the Pomodoro condition (n= 36) students took 5-minute breaks after every 25 minutes of studying. In the Flowtime group (n=33) participants decided themselves when to take a break however, the duration of the break was determined based on how long they studied. Results showed that Flowtime breaks led to a slower increase in fatigue compared to the other conditions. No difference between the break-taking techniques has been identified for motivation and productivity levels, task completion, and flow state. Future research should focus on investigating these break techniques further by including variables like personality and mental effort measures.
Keywords:
Pomodoro
; Flowtime
; Self-regulated break-taking
; Study experience
; Self-regulated learning
1. Introduction
Effective learning is a demanding and effortful process that can lead to feelings of stress and decreases in productivity levels and well-being (Fritz et al., 2013; Ginns et al., 2023). Recovery from the demands of study tasks is essential for maintaining high levels of performance during the day (Phan & Beck., 2023). Taking breaks from study tasks allows for the opportunity to recover personal resources (e.g., motivation and energy levels) which are necessary for an effective study session (Trougakos & Hideg, 2009). Taking breaks may therefore counteract the negative effects of prolonged task engagement and may help to complete tasks more efficiently (Li et al., 2020; Lyubykh et al., 2020; Phan & Beck, 2023). Specific timing and duration of breaks may have differential effects on the recovery of these resources (Lim & Kwok, 2016; Trougakos & Hideg, 2009). Moreover, taking effective breaks can enhance the study experience of students and may improve their well-being and mental health (Lee et al., 2021; Phan & Beck, 2023). Despite the benefits of effective break-taking, research on how students can effectively self-regulate and plan their breaks remains limited.
The challenge of self-regulating breaks is particularly relevant in contexts outside of the classroom, where students must independently manage their learning. Self-regulated learning (SRL) is defined by Pintrich (2000) as “an active, constructive process whereby learners set goals for their learning and then attempt to monitor, regulate, and control their cognition, motivation, and behavior, guided and constrained by their goals and the contextual features in the environment” (p. 453). SRL is thus an independent and self-directed process in which students are fully responsible for regulating their learning (Goetz et al., 2013). In these settings, students are therefore required to make decisions about when, where, and how to study. A lot of students struggle with self-regulating their learning because of difficulties in attention retention, motivation, and lack of metacognitive knowledge (Biwer et al., 2023; Schloemer & Brenan, 2006; Zimmerman, 2002; Zimmerman & Moylan, 2009).
Break-taking can be part of self-regulated learning as it can play an important role in the achievement of students learning goals. There are different techniques for regulating breaks during self-regulated learning. Some students may plan breaks in advance, using techniques that externally regulate breaks, while others rely on subjective cues such as fatigue, productivity, and perceived effort and progress productivity to decide when to disengage from learning tasks (Bjork & Bjork, 2020; de Bruin et al., 2023; Grahek et al., 2022).
Given the challenges students face while self-regulating their learning, it is important to understand how students can improve their study technique by effectively regulating their break-taking to enhance their study experience. Therefore, additional research on the effectiveness of different break-taking techniques in self-regulated learning settings is needed. In the following section different break regulation techniques are discussed.
2. Types of Break Regulation
2.1. Self-Regulated Breaks
The first break regulation technique discussed in this study is Self-regulated breaks. In this type of break-taking students take breaks whenever they want, or whenever they feel like it. Breaks are not pre-planned by something external since the decision to take a break is based on a feeling rather than pre-planned. Self-regulated breaks, in this paper, are used as a term for taking breaks whenever a student feels like it. Students then also determine for themselves when and how long to take a break. A commonly described disadvantage of Self-regulated breaks is that it can increase cognitive load by inducing additional self-monitoring load. The mental effort that is used for this cannot be used for studying which can make studying more cognitively demanding (Lee, 2022)
Besides this, deciding yourself when to take a break is a form of self-interruption. Self-interruptions are interruptions that are initiated internally (Katidioti et al., 2016). Contrary, external interruptions are interruptions that occur due to something outside of the self (Abad et al., 2018; Katidioti et al., 2016). In Self-regulated breaks, individuals interrupt their study tasks in response to an internally driven desire for a break. Research showed that self-interrupted tasks are finished more slowly than externally interrupted tasks (Katidioti et al., 2016). Because of these self-interruptions, Self-regulated breaks may result in a decrease in motivation and productivity which may result in study tasks taking longer to finish (Katidioti et al., 2016).
To minimize the additional mental load and self-interruptions there are different break-taking techniques developed that are thought to be more effective, but research on these techniques during self-regulated learning settings is lacking.
2.2. The Pomodoro Technique
The Pomodoro technique is one of the most known break-taking techniques. This technique is a systematic break-taking technique which means that study blocks and break times are pre-planned. Taking breaks is in this case not something self-regulated but break-taking is externally regulated by a timer (Dizon et al., 2021). Some internal interruptions are changed for external interruptions in this technique because someone does not have to decide for themselves when to take a break (Abad et al., 2018; Katidioti et al., 2016). In the Pomodoro technique, someone will study in blocks of 25 minutes with a five-minute break in between. These blocks are repeated 4 times before taking a longer break of fifteen to thirty minutes (Sheldon & Wigmore, 2022). Systematic breaks, like Pomodoro, are thought to postpone distractions and facilitate motivation and concentration. Besides this, it is thought to improve productivity and reduce mental fatigue. The Pomodoro technique specifically might diminish procrastination because it requires students to split big tasks into smaller sections which can lead to a higher degree of task completion (Almalki et al., 2020). Therefore, the Pomodoro technique is a popular choice among students.
Biwer et al. (2023) conducted a study about systematic break-taking and its effect on mental effort, task completion, and study experiences. In this study, there were 3 independent groups. One Self-regulated break-taking group and 2 systematic break-taking techniques. One condition was similar to Pomodoro and the other systematic break-taking group used even smaller study blocks of 12 minutes with a 3-minute break in between. They found that students in both systematic break conditions reported being more concentrated and perceived learning tasks as less difficult than in the self-regulated group. The students in systematic break conditions showed lower levels of concentration and motivation compared to the self-regulated condition (Biwer et al., 2023).
Even though the Pomodoro technique is thought to have a lot of advantages, one critique is that this technique can disrupt the so-called flow state. This is a state in which someone is highly focused and productive while working. In this state people usually do not feel time passing and feel absorbed in their tasks (Csikszentmihalyi, 1975). For a student to experience flow, complete involvement in the current task as well as the loss of awareness of everything outside of the task is necessary (Willekens, 2014). The flow state is a very fragile state, a distraction is noticed, and the flow can be disrupted (Willekes, 2014). A flow state can therefore already be interrupted by a thought about a grade or a small mistake (Zielke et al., 2023). Because Pomodoro uses a timer during study time and is very strict about when to take a break, this technique can disrupt the flow state (Thompson et al., 2021).
2.3. The Flowtime Technique
A break-taking technique that might overcome this problem is the Flowtime technique. The technique is also known as the Flowmodoro technique since it is a variation of the Pomodoro technique (Shen, 2023). In the Flowtime technique, students study for as long as they can focus and take a break whenever they feel the need. The duration of the break depends on how long they have worked on their study tasks. For example, if someone studies for 25 minutes or less, they will receive a 5-minute break like in the Pomodoro technique. However, if someone decides to study for a longer period of time, they will receive a longer break (Lau, 2023). This technique combines systematic elements of the Pomodoro method and self-regulatory elements of the Self-regulated breaks. This combination may on the one hand lead to a disadvantage compared to the Pomodoro technique since students still need to self-regulate when to take a break which may increase cognitive load which can make studying more demanding (Lee, 2020). However, since students do not have to determine the length of their breaks themselves, cognitive demands are still not as high as with completely Self-regulated breaks.
On the other hand, the self-regulated element in the Flowtime technique leads to a considerable advantage over the Pomodoro technique. Since the Flowtime technique does not use a timer during study time, the flow state will not be interrupted and therefore resolves the critique on the Pomodoro technique (Oliveira dos Santos et al., 2018).
3. The Present Study
This study aims to examine the difference between the Pomodoro, Flowtime, and Self-regulated break techniques and their effectiveness during self-regulated learning in higher educational settings. The relation between break-taking technique and task completion, motivation, fatigue, and productivity will be investigated during an authentic self-regulated learning session. Therefore, the present study is centered around the question: “What is the effect of the type of break-taking technique (Flowtime, Pomodoro, or Self-regulated breaks) on mental effort, motivation, fatigue, productivity, task completion, and flow state?”. To test this research question several hypotheses were formulated:
Hypothesis 1:
The Flowtime and Pomodoro conditions will show higher levels of motivation, productivity, and task completion compared to the Self-regulated break condition.
Hypothesis 2:
The Flowtime and Pomodoro conditions will show lower levels of fatigue compared to the Self-regulated break condition.
Hypothesis 3:
The flow state will be greater in the Flowtime and Self-regulated break conditions than in the Pomodoro condition.
Besides this, we exploratively investigated how the subjective experience measures, including motivation, productivity, and fatigue levels, change over time during the study session. We investigated if there was a difference between the break-taking techniques in the change of subjective experience and if individuals showed different trajectories in these measures over time.
4. Materials and Methods
4.1. Participants and Design
The sample of this study included 111 Psychology students from a Dutch University. A total of 111 participants was deemed necessary to reach a power of 80% with an expected effect size f of 0.3 and a significance level of 0.05 using G*power software (Faul et al., 2007). However, this calculation was based on the initially planned, less advanced analysis method, as the study was conducted for a bachelor’s thesis. Since a more advanced, better-suiting analysis method is used in the current paper, the required sample size for achieving the same power might have been higher.
Participation was voluntary and participants were given the possibility to withdraw their consent at any given time. Ethical approval for these participants was obtained from the ethical board of the university (The Ethical Review Committee of Psychology and Neuroscience, ERCPN) with the corresponding reference code ERCPN-274_120_11_2023. Participants were recruited online through the SONA system. The SONA system allows universities to create their participant pools and upload studies. Each SONA point is approximately one participation hour. Psychology bachelor students at the present University are required to collect a total of 20 SONA points to graduate. For this study, participants were rewarded with 2 SONA credits for their participation.
Participants were randomly assigned to one of three conditions: Self-regulated, Pomodoro, or Flowtime breaks. Students in the Self-regulated break group took Self-regulated breaks and were allowed to study and take breaks as they felt like doing. Participants in this group were instructed to study as long as they wanted and afterward to take a break as long as they needed. The second group used the Pomodoro technique for taking breaks and was instructed to study in blocks of 25 minutes with a 5-minute break in between. The last group received the instruction to study as long as they could focus, as in the Self-regulated break group, and were allowed to take a break if they could not focus any longer. The duration of the break these participants received was dependent on, just like in the Flowtime technique. Students received a five-minute break after studying for 25 minutes or less, and an eight-minute break if they studied between 25 and 50 minutes in one block. If students studied for more than 50 minutes after the last break they received a ten-minute break. The precise instructions that participants received per condition can be examined in Appendix B.
4.2. Measures
Data collection and survey distribution occurred via the Qualtrics survey software. Participants could access the Qualtrics survey via SONA. The full questionnaire with all measures described below is provided in Appendix A.
4.2.1. Subjective Study Experience
Fatigue, motivation, and productivity were measured in the same way as in the study by Biwer et al. (2023). This was done with questions like “How motivated do you feel right now?”. Participants answered this question on a 4-point Likert scale. Every participant answered one item per measure (i.e., fatigue, motivation, and productivity) before starting the study session, after every break, and after the two hours of study.
4.2.2. Task Completion
Task completion was measured in the same way as in the study by Biwer et al. (2023). Participants indicated at the beginning of the study session what tasks they were planning to work on. Participants had to at least indicate one task and could indicate a maximum of 8 tasks. After the 2-hour study session, the participants indicated for each task to which extent they had completed the task on a scale from 0 to 100 percent. To compute the total task completion, the mean of these completion percentages across all tasks was calculated.
4.2.3. Passed Time and Break Duration
Time was measured using the timing option in Qualtrics. The Qualtrics software automatically measured the time students spent studying and taking breaks.
4.2.4. Flow State
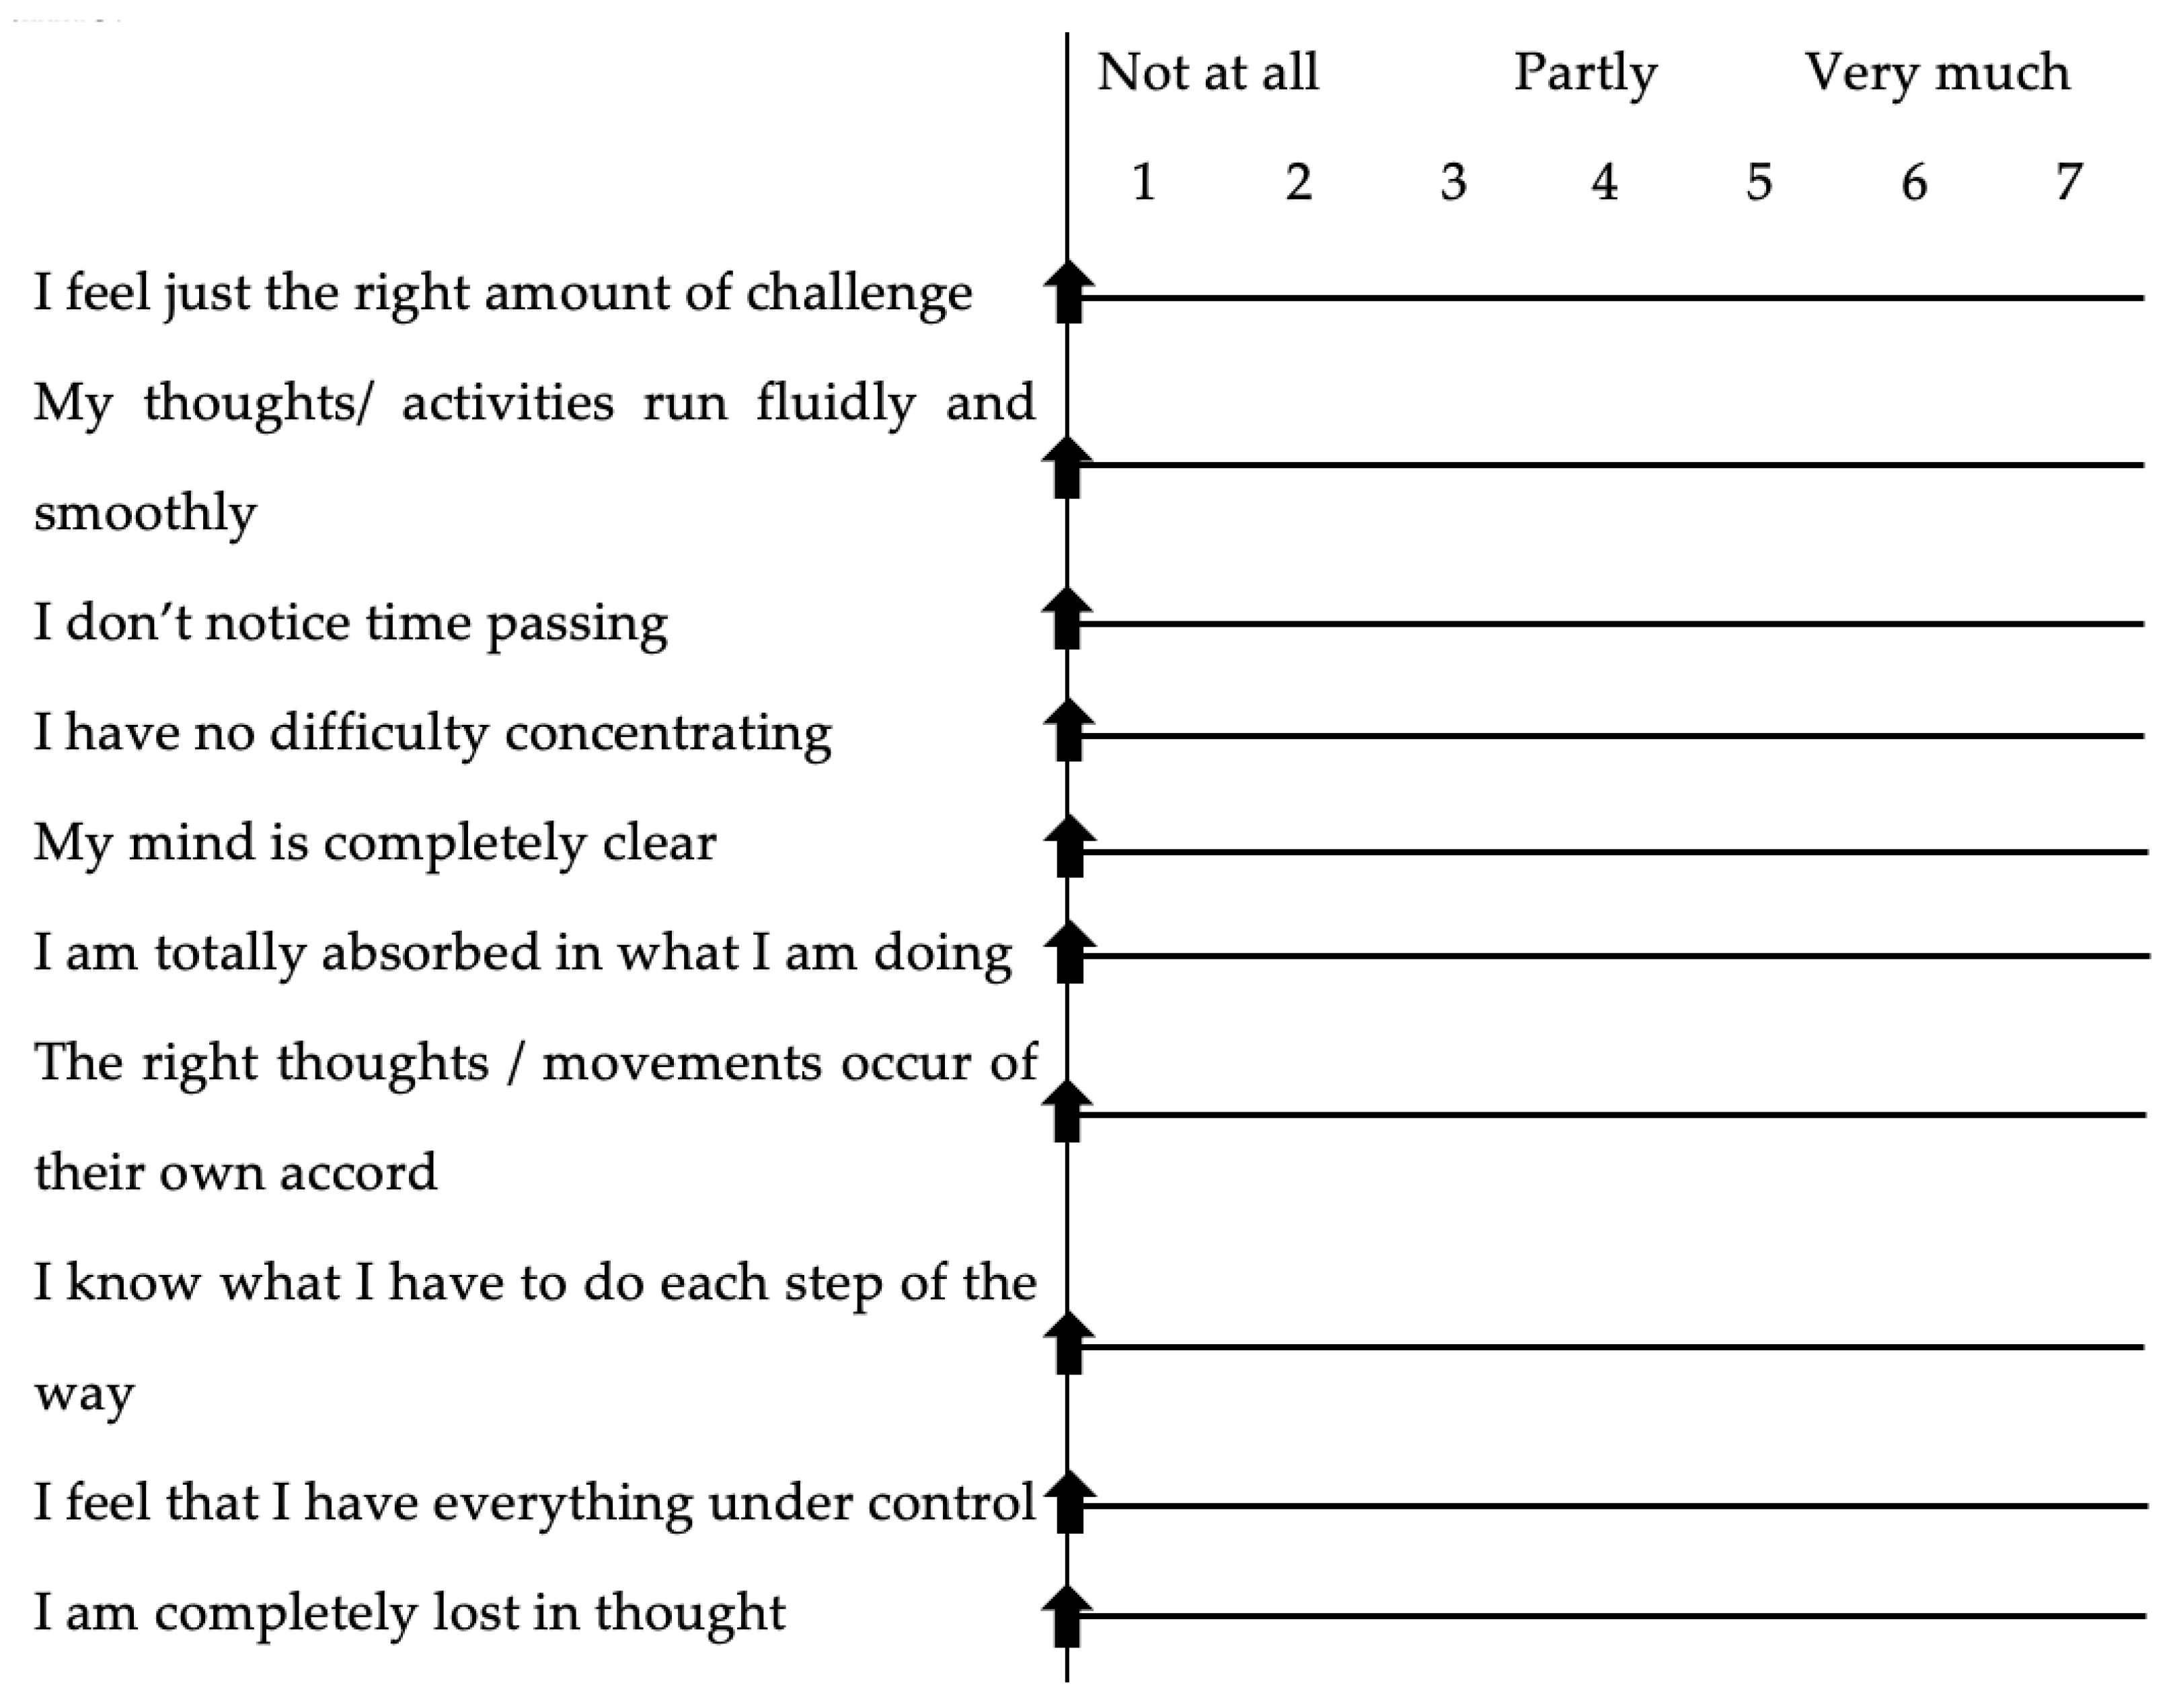
Lastly, a flow questionnaire was used to measure to what extent participants experienced they were in a flow state during the 2 study hours. For this, the Flow short scale (FSS) was used. This scale is designed in German and translated by Rheinberg et al. (2023) in English. This version of the questionnaire is a reliable and valid measure for flow state with a Cronbach’s alpha of 0.90 (Rheinberg et al., 2023). This English version was used for this study, which participants filled in after the study session. The total flow state was calculated by adding up the scores on all items.
4.3. Procedure
Data collection for the current study took place between January and March 2024. Figure 1 provides an overview of the procedure of the study. Participants were informed before signing up that the research was about break-taking among students and that the study would take approximately 120 minutes to complete. Participants were also informed that the study would be carried out online. After signing up they were given the opportunity to read the information letter with information about the research and procedure and gave informed consent before starting the study.
Participants first completed a short questionnaire about their current motivation, productivity and fatigue levels, planned tasks, and some demographic questions. After this, all participants were assigned to one of three conditions. In all three groups, participants were instructed to work on the study tasks that they described to work on in the following study block of two hours. Then, the three groups received distinct instructions about taking breaks, the precise instructions that the participants received are provided in Appendix A.
The self-regulated group was instructed to study and take breaks as they felt like doing. They were asked to press a button when they started and ended their break. The time students study between the last break and the next break is called “study block”. For the Pomodoro group, the questionnaire automatically switched between study time and break time. A sound was played to inform participants when it was time for a break and when they should continue studying. The Flowtime group was asked to press a button when starting their break, and a sound was played to inform them that they should start studying again.
Besides hearing a sound, every participant was instructed on the screen what they should be doing at that time. The screen all participants saw while studying stated “Start to study!” and the break screen stated, “Time for a break!”. In the Pomodoro and Flowtime groups, the break screen also indicated the duration of the current break.
After every break, participants in all conditions were asked to indicate how motivated, fatigued, and productive they felt. Furthermore, immediately after the two hours of self-regulated learning were completed the participants were directed to a last set of questions about their subjective study experiences, task completion, and flow state. For some participants the questionnaire failed to transfer to the last part of the questionnaire automatically, these participants were asked to click a link that would directly lead to the last set of questions after the two hours had passed.
4.4. Analysis
We tested three main sets of hypotheses regarding the effects of different break-taking techniques on motivation, productivity, fatigue, task completion, and flow. Outcome measures were collected at different time points. Motivation, productivity, and fatigue were assessed repeatedly on a 4-point Likert scale. For these outcome variables, we used cumulative link mixed effects models (CLMMs) to account for the ordinal nature of the data as well as the unbalanced repeated measures design. In contrast, task completion (calculated as a percentage of completed tasks) and flow (assessed using ten items on a 10-point Likert scale) were measured only once at the end of the study period. For these latter outcomes, we aggregated the repeated measures (using means for the motivational and productivity variables) and applied linear regression analysis.
4.4.1. Preparing the Analysis
Data cleaning and preparation were performed prior to the main analyses. In total, 17 participants were removed for the following reasons: one participant with an extreme age value (age 38), two participants who spent too little time studying (2 and 7 minutes), one participant who spent too much time studying, one participant with excessive break time (123 minutes), two participants who did not take breaks at all (precluding any analysis of break effects), two participants with incomplete repeated measures, and eight participants who exceeded our overall study cutoff of 130 minutes. Thus, our analysis sample was reduced from 111 to 94 participants.
The final sample’s characteristics were n = 94, with a mean age of 20.02 years (SD = 1.87) and 87 (93%) women. When broken down by group, the self-regulated group included 25 participants (mean age 19.84, SD = 1.60; women = 22), the Flow group consisted of 33 participants (mean age 20.20, SD = 1.98; women = 31), and the Pomodoro (Pomo) group had 36 participants (mean age = 20.00, SD = 1.97; women = 34). All variables were recoded and designated as the appropriate type within R (continuous, factor, etc.) before model estimation.
4.4.2. Analysis Methods
To test our hypotheses, we employed two main modelling strategies that corresponded to the distinct measurement structures in our study. As mentioned above, for the repeatedly measured outcomes (motivation, productivity, and fatigue, each assessed on a 4-point Likert scale), we used CLMMs. This choice was driven by the ordinal nature of the data and the need to account for unbalanced repeated measures within participants, which CLMMs can account for. Starting with fully saturated models that incorporated theoretically relevant predictors and random effects, we iteratively simplified these models based on likelihood ratio tests, information criteria (AIC), and theoretical considerations until arriving at the final, robust specifications. After the final model specification, the hypothesis was tested by testing nested models (with and without the predictor in question) using likelihood ratio tests and information criteria (AIC). All relevant assumptions were checked (see below).
For outcomes that were measured only once as post-measures (task completion and flow) – we aggregated repeated measures (using means) where needed and applied linear regression. In these analyses, standard assumptions (normality of residuals, linearity, homoscedasticity, independence, and multicollinearity) were evaluated using both visual and statistical measures (e.g., Q-Q plots, Shapiro–Wilk, Breusch–Pagan, and Durbin–Watson tests with a p > 0.05 threshold) to ensure model adequacy. Finally, we tested for potential influential cases by visually inspecting the residual Q-Q plots for each model and by using the interquartile range criteria for continuous variables. We then re-fitted the final models for each hypothesis with these potential influential cases removed. In most cases, this did not lead to a significant difference. The exception to this was the test for H2, where the removal of two cases at the extreme negative end of the Q-Q plot led to the amount of breaks predictor becoming significant.
This general modelling approach – CLMMs for ordinal repeated measures and linear regression for aggregated single-point outcomes – provided a structured and theoretically informed foundation for testing our hypotheses. Specific details regarding model specifications and assumption diagnostics are provided in the respective results sections.
4.4.3. Model Building and Assumption Checks
For the CLMM analyses, we began with the most complex models that were theoretically justified and then simplified the fixed and random effects structures step by step using likelihood ratio tests and information criteria (AIC). This process included three steps: 1) Determining the appropriate linking function (logit for H1a and H2; loglog for H1b), 2) Testing and refining the random effects structure (e.g., using a simple random intercept in H1a and H2, and a random slope for break in H1b). With too complex random effects structures we experienced convergence issues which were resolved by simplifying these structures. 3) Sequentially removing fixed effects, starting with higher-order interactions, where based on both statistical criteria and theoretical relevance.
We used several methods to test the relevant assumption for the CLMMs: Visual inspection of Q-Q plots to verify that the random effects approximated a normal distribution. The proportional odds assumption was evaluated via nominal test (using clm() and the nominal_test() function of the ordinal package (v2023.12-4.1; Christensen, 2023)) with p > 0.05 taken as evidence of no violation. This meant that we had to refit the final model without the random effects structure because the clmm() function was not supported by the nominal_test() function at the time of writing. Importantly, H1b showed a potential violation of the proportional hazards assumption. Visual checks using cumulative probability plots (cumulative probabilities for each level of a given predictor plotted against the outcome thresholds) indicated minor departures for the group and fatigue predictors at the lowest threshold of the outcome variable (productivity). Additionally, the lines of cumulative probabilities across the levels of each predictor tended to converge at the highest level of the outcome variable. Based on these evaluations we assume that the proportional hazards assumption is mostly intact but that the findings related to productivity as outcome should be treated with care. Finally, models without the random effects structure were fitted and compared (via likelihood ratio tests and AIC) to ensure that the inclusion of random effects improved model fit.
For the linear regression models, we conducted standard assumption checks: Normality of individual variables and of residuals was confirmed via visual Q-Q plots and the Shapiro–Wilk test (with p > 0.05 indicating acceptable normality). Linearity was checked through residual plots. Homoscedasticity was assessed with both a visual inspection of the residuals and the Breusch–Pagan test (again using p > 0.05 as supportive evidence). Independence of residuals was evaluated using the Durbin–Watson test. Multicollinearity was examined by calculating variance inflation factors (VIF) using the car package. None of these tests indicated any violation of assumptions for H1c (task completion) or H3 (flow). In addition, potential influential cases were identified via visual inspection of residuals and re-fitting the models. In neither case did this change the results significantly.
5. Results
The means and standard deviations of variables measured in the current study can be found in Table 1.
5.1. Motivation
Hypothesis 1a posited that the Flow and Pomodoro groups would report higher levels of motivation relative to the self-regulated group. To test this, we fitted a CLMM model predicting motivation scores (assessed on a 4-point Likert scale) with fixed effects for group membership, time since the start of the study (in minutes), the duration of the last break preceding the assessment, fatigue, and productivity. Participant-level random intercepts were included to account for repeated measures. Table 2 summarizes the fixed effects estimates.
Threshold coefficients defining the latent motivation levels were estimated as follows: 1|2: -3.69 (SE = 0.45), 2|3: -0.34 (SE = 0.38), 3|4: 3.46 (SE = 0.40).
The participant-level random intercept variance was 0.905 (SD = 0.9513), indicating notable variability in baseline motivation between participants.
A likelihood ratio test comparing the final model to a null model (with only the intercept and random effects) yielded a χ²(10) = 276.01, p < 0.0001, demonstrating that the full model provided a significantly better fit to the data.
In terms of hypothesis testing, the group comparisons did not reach statistical significance; neither the Flowtime (β = –0.35, p = 0.34) nor the Pomodoro group (β = 0.0047, p = 0.989) differed significantly on motivation levels from the self-regulated group. In contrast, time elapsed since the start of the study was significantly associated with motivation (β = –0.4794, p = 0.001), indicating that each additional minute was associated with a 0.80% reduction in the odds of reporting a higher level of motivation (exp(–0.4794) ≈ 0.992). Furthermore, the linear effect of fatigue was significant (β = –1.8209, p < 0.001; exp(–1.8209) ≈ 0.162), suggesting an 83.8% decrease in the chance of experiencing higher motivation with each unit increase in fatigue. Productivity exerted a strong positive association with motivation; the linear term was highly significant (β = 4.7179, p < 0.001) with an estimated odds increase that corresponds to an exp(β) of approximately 111.94, while the quadratic term was also significant (β = –1.0133, p = 0.005), indicating a curvilinear relationship.
Overall, while the anticipated group differences in motivation were not supported, significant effects emerged for time, fatigue, and productivity. These findings suggest that participants’ motivation decreased as the study progressed and in the context of greater fatigue, whereas higher productivity was strongly associated with increased motivation despite signs of a non-linear relationship.
5.2. Productivity
Hypothesis 1b posited that participants’ productivity would be positively influenced by lower fatigue and higher motivation, with potential differences among the three groups. To test this, we fitted a cumulative link mixed effects model with a loglog link function. The final model included fixed effects for group membership, duration of the last break preceding the productivity measurement, fatigue, and motivation. In addition, we incorporated participant-level random intercepts and allowed the effect of break duration to vary across participants with a random slope. Table 3 summarizes the key fixed effects estimates from the model.
Threshold coefficients that define the latent productivity categories were estimated as follows: 1|2: Estimate = -2.2519 (SE = 0.2798; z = -8.049), 2|3: Estimate = -0.4731 (SE = 0.2202; z = -2.149), and 3|4: Estimate = 1.9674 (SE = 0.2243; z = 8.770).
The participant-level random effects indicated a variance of 0.2960 (SD = 0.5441) for the intercept, and a small variance for the break slope (0.00027; SD = 0.01639) with a negligible correlation (r = –0.007) between them.
A likelihood ratio test comparing the final model with a null model (containing only the intercept and random effects) yielded an LR statistic of 237.28 (df = 11, p < 0.001), indicating that the model with predictors provided a significantly better fit to the data.
In terms of interpretation, the group variable was not significantly related to productivity scores. However, the linear effect of fatigue was significant (β = –1.268, p < 0.001), with an exponentiated coefficient (exp(–1.268) ≈ 0.281) indicating that a one-unit increase in the linear term of fatigue was associated with a 71.86% reduction in the odds of reporting a higher productivity level. In contrast, the linear component of motivation was also highly significant (β = 2.837, p < 0.001), with exp(2.837) ≈ 17.06 suggesting that a one-unit increase in motivation was associated with a 1,606.02% increase in the odds of reporting a higher productivity category. Other predictors, including the duration of the last break and the higher-order trends for fatigue and motivation, did not reach conventional levels of significance.
These results provide evidence that, while there were no significant group differences in productivity, both fatigue and motivation play critical and opposing roles in predicting productivity levels.
5.3. Task Completion
Hypothesis 1c predicted that differences in break-taking techniques and study-related behaviors would be reflected in the overall percentage of completed tasks. To test this hypothesis, we employed linear regression with task completion (the percent of overall completed tasks) as the outcome. The predictors included group, task amount (the number of planned tasks), total duration spent studying, and the aggregated measures of motivation and productivity. Table 4 presents the fixed effects estimates from the final model:
The overall model explained approximately 8.7% of the variance in task completion (Multiple R² = 0.087, Adjusted R² = 0.024), although the F-test (F(6, 87) = 1.381, p = 0.2314) indicated that the model did not reach overall statistical significance.
Among the predictors, productivity emerged as the only statistically significant predictor of task completion (β = 12.3090, t = 2.301, p = 0.0238). This result suggests that holding all other variables constant, a one-unit increase in the aggregated productivity measure is associated with an increase of approximately 12.31 percentage points in the overall task completion rate. In contrast, neither group membership nor the other predictors exhibited showed significant associations with task completion. These findings indicate that while break-taking techniques per se did not lead to significant group differences in task completion, higher integrated productivity appears to be an important factor in predicting the percentage of completed tasks.
5.4. Fatigue
Hypothesis 2 predicted that participants in the self-regulated group would report higher fatigue compared to those in the Flow and Pomodoro groups. To test this, we modelled fatigue, assessed on a 4-point Likert scale, using a cumulative link mixed effects model with a logit link function. The final model included fixed effects for group, time (the time in minutes since the start of the study), the duration of the last break before the measurement (break), and the aggregated measures of motivation and productivity. In addition, the model incorporated an interaction term between group and time to examine whether fatigue changed differently over time among the groups, and participant-level random intercepts were included to account for within-subject variability. Two influential cases were removed from this analysis, which resulted in a significant effect of time. Table 5 summarizes the fixed effects estimates.
The threshold coefficients that delineate the latent fatigue categories were estimated as 1|2: Estimate = -3.8567 (SE = 0.5239, z = -7.361), 2|3: Estimate = -0.3190 (SE = 0.4814, z = -0.663), and 3|4: Estimate = 4.1118 (SE = 0.5466, z = 7.522).
The participant-level random effects showed an intercept variance of 3.584 (SD = 1.893), denoting significant between-subject variability in baseline fatigue levels.
A likelihood ratio test comparing the final model to a null model (with only the intercept and random effects) yielded an LR statistic of 184.75 (df = 12, p < 0.001), confirming that the inclusion of our predictors significantly improved model fit.
The main effects of group were not statistically significant, indicating that overall fatigue did not differ markedly between the self-regulated, Flow, and Pomo groups. In contrast, time was significantly and positively associated with fatigue (β = 0.01723, p < 0.001). This suggests that each additional minute in the study was associated with an approximate 1.74% increase in the odds of reporting a higher fatigue level. Furthermore, the linear effect of motivation was highly significant and negative (β = -2.7103, p < 0.001), with an odds ratio of 0.0665 indicating a 93.35% decrease in the likelihood of higher fatigue for each unit increase in the motivation measure. Similarly, the linear effect of productivity was significant (β = -1.8974, p = 0.0005), with an odds ratio of 0.150, corresponding to an 85.00% reduction in the odds of elevated fatigue for each 1-level increase in productivity.
Importantly, the significant interaction between the Flow group and time (β = -0.01637, p = 0.0056) implies that, for the Flow group, the effect of time on fatigue is approximately 1.62% lower per minute relative to the self-regulated group. The interaction between the Pomodoro group and time was not statistically significant.
Overall, these results indicate that while direct group differences in fatigue were not evident, fatigue increased over time, and its progression was strongly influenced by the levels of motivation and productivity. Moreover, participants in the Flow group exhibited a slower increase of fatigue over time relative to those in the self-regulated group.
5.5. Flow State
Hypothesis 3 proposed that participants in the Flow and self-regulated groups would report higher levels of flow compared to those in the Pomodoro group. To test this, we conducted a linear regression analysis with the overall flow score as the outcome. The predictors included group, the number of planned tasks, total duration spent studying, and the aggregated measures of motivation and productivity. Table 6 summarizes the model’s fixed effects estimates.
The model demonstrated a Multiple R-squared of 0.3066 (Adjusted R-squared = 0.2588). An overall F-test indicated that the model was statistically significant (F(6, 87) = 6.412, p < 0.0001).
In this model, neither the Flowtime group (β = -0.11860, p = 0.47550) nor the self-regulated group (β = -0.06286, p = 0.72520) differed significantly from the reference group (Pomodoro group) in terms of reported flow. However, both task amount and productivity emerged as significant predictors. Specifically, a one-unit increase in task amount was associated with a 0.118 increase in the flow score (t = 2.720, p = 0.0079), while a one-unit increase in productivity was linked to a 0.558 increase in flow (t = 2.844, p = 0.0055). In contrast, neither total time spent studying (p = 0.297) nor motivation (p = 0.433) contributed significantly to explaining the variance in flow scores.
These findings suggest that while the hypothesized group differences in flow were not found, higher numbers of planned tasks and greater aggregated productivity significantly predicted increased flow levels. The overall model accounted for approximately 31% of the variance in flow, indicating a moderate explanatory power for these factors in relation to the flow experience.
6. Discussion
This study examined the effect of taking Pomodoro, Flowtime, or Self-regulated breaks during a self-regulated learning session on fatigue, productivity, motivation, task completion, and flow. The first hypothesis, which stated that the Flowtime and Pomodoro conditions would show higher levels of motivation, productivity, and task completion compared to the self-regulated condition was not supported by our findings. No significant difference in motivation, productivity, and task completion is found between the break-taking techniques. Furthermore, a positive relationship between time and fatigue was observed; when students studied longer, they had a higher chance of feeling more fatigued. It was found that in the Flowtime group, this effect is less pronounced. Students who take breaks according to the Flowtime technique show a slower increase in fatigue compared to the Self-regulated break group. This difference is not observed between the Pomodoro and self-regulated groups. These findings therefore partially support the second hypothesis, which stated that the Flowtime and Pomodoro conditions would show lower levels of fatigue compared to the Self-regulated breaks condition.
The current study findings suggest a minimal impact of different break-taking techniques on differences in subjective study experiences and task completion. Considerable variability among participants within each break condition was observed, likely influenced by several factors. First of all, break effectiveness depends highly on the nature of activities and experiences during the break (Kim et al., 2016; Melguizo-Ibáñez et al., 2024; Sammonds, et al., 2017). Prior research suggests that active breaks, such as engaging in brief physical activities, are found to enhance attention and task performance (Melguizo-Ibáñez et al., 2024; Sammonds, et al., 2017). Furthermore, relaxation and socialization during break time can also enhance break effectiveness (Ginns et al., 2023; Kim et al., 2016). In the current study, however the break content was not controlled for and no data was gathered on what participants did during the breaks. The variability in the effectiveness of the breaks may therefore be partly explained by the variability in break activities and experiences. The effects of different break activities across these break-taking techniques can be investigated by future research.
Besides this, individual differences may also influence the effectiveness of a certain break-taking technique (Fritz et al., 2013; Trougakos et al., 2009). Research shows that one’s level of respite self-efficacy, or one’s confidence in recovering during a break, has been linked to break effectiveness in occupational settings. Lower levels of respite self-efficacy are associated with poorer detachment from tasks and reduced break effectiveness (Fritz et al., 2013). Moreover, personality traits may influence personal resource depletion and therefore the need for breaks (Fostervold & Watten, 2024; Trougakos et al., 2009). Research suggests that people high in emotional stability experience a reduced need for recovery after work (Fostervold & Watten, 2024). Furthermore, extroverts may require fewer and/or shorter breaks than introverts when performing demanding tasks, as they experience lower personal resource depletion (Trougakos et al., 2009). These findings suggest that the effectiveness of different break-taking techniques may depend on or interact with individual characteristics. This might indicate that different break-taking strategies may work for different people, which may be investigated in future research.
Lastly, the small differences between the break-taking techniques may be explained by the fact that flow was experienced equally in different conditions. The flow state was thus not more disrupted in the Pomodoro condition compared to other break-taking conditions. In the entire sample of this study, flow is not experienced to a great extent. On a scale from 0 to 7, the average level of flow is 4.06 in this sample. A possible explanation for this is that it is important to create a balance between challenge and skill in order to reach a flow state (Willekens, 2014; Zielke et al., 2023). This is because when a task is too easy someone will feel bored, but if a task is too difficult people can get stressed, anxious, or feel overwhelmed. In both these cases a flow state will not be reached (Fong et al., 2015). It could be the case that this balance is not optimal when engaging in the current study tasks. University assignments are normally more challenging than the current skill level of students (Guadagnoli et al., 2012). This is done so that students’ skill levels will increase over time. This could explain why in this sample the flow state is experienced low in all conditions. The flow state was thus not more disrupted in the Pomodoro condition than in the other break-taking conditions. This may explain why flow is experienced low in the whole sample and why the Flowtime technique is not more effective than the other break-taking techniques.
6.1. Limitations and Future Research
This study comes with several limitations. Because of the authentic learning setting in which students can study in the environment and time of day of their choice, there is very little control. Students cannot be monitored, and therefore this study setup required the assumption that students will follow the instructions given to them. Another limitation of the authentic learning setting is that all students can choose their own study tasks. This way not every student works on a study task with the same difficulty which can influence the dependent variables. Future studies may aim for more control of the study design. This will overcome these drawbacks of the authentic study setting which can make it easier to compare break-taking techniques between participants.
The questionnaire is programmed in such a way that the questionnaire would continue automatically after 2 hours of study. However, this function did not work for every participant, probably due to different operating systems on students’ computers and tasks students did on their laptops during the study session. Some students therefore needed to manually click a button to the last questions of the survey. This may lead to some limitations such as that students need to check the time themselves, which can make them more aware of the time they study.
Furthermore, results regarding feelings of productivity should be treated with care because the proportional hazards assumption might be violated for low levels of productivity. However, given that relatively few participants scored low on productivity, the findings related to productivity levels still hold at higher productivity levels.
Lastly, the current sample introduces some limitations for this study. The final sample of the study, after the removal of outliers, consisted of 94 participants. Because of the shift in analysis approach, this may underpower the analysis, especially for the CLMM analysis. Future research should aim for a bigger sample size to ensure more stable model estimates. Furthermore, the sample of this study is very homogeneous with approximately 93 percent women and all psychology bachelor students. This sample is not representative of the whole student population and these results are therefore difficult to generalize to the population. Future studies should focus on measuring more homogenous samples so that they can be investigated if the same results are found in other genders and study areas.
Future studies are necessary to investigate the effectiveness of these break-taking techniques further. Future studies can focus on longer study times. By doing this it can be investigated if these techniques are efficient for longer sessions. This way it can be seen if the development in time on levels of motivation productivity and fatigue will continue in the same way or not.
Additionally, future studies might focus on mental effort and personal preferences as predictors for the effectiveness of different break-taking techniques to further investigate if these are significant contributors to the effectiveness of different techniques.
6.2. Conclusion
To conclude, the current findings suggest that when using Flowtime breaks, students’ fatigue increases at a slower rate compared to students who use Pomodoro or Self-regulated break techniques. However, on all other variables measured, no outstanding differences were found in the effectiveness of Pomodoro, Flowtime, and Self-regulated breaks. This means that the results of the current study suggest that not one of these break-taking techniques should be highly recommended over the others. Future research should be done to investigate the differences between these techniques further by including predictors like personality and mental effort.
Author Contributions
Conceptualization, E.J.C.S., N.W. and A.B.; Methodology E.J.C.S. and N.W.; Software E.J.C.S.; Validation E.J.C.S., and N.W.; Formal analysis N.W.; Investigation E.J.C.S.; Resources E.J.C.S. and N.W.; Data curation E.J.C.S. and N.W.; Writing – original draft preparation E.J.C.S. and N.W.; writing – review and editing N.W. and A.B.; visualization E.J.C.S.; supervision N.W. and A.B; project administration E.J.C.S. All authors have read and agreed to the published version of the manuscript.
Funding
This research received no external funding.
Institutional Review Board Statement
The study was conducted in accordance with the Declaration of Helsinki, and approved by the Ethics Review Committee Psychology and Neuroscience (ERCPN) Maastricht University (reference code: ERCPN-274_120_11_2023 on the sixth of December 2023).
Informed Consent Statement
Informed consent was obtained from all subjects involved in the study.
Data Availability Statement
The datasets presented in this article are not readily available because the data was collected as part of a bachelor thesis and therefore the ethical approval did not include availability of the data. Requests to access the datasets should be directed to the corresponding Author.
Conflicts of Interest
The authors declare no conflicts of interest.
Appendix A Full Questionnaire Measures
Appendix A.1 Assessment Fatigue, Motivation, and Productivity Levels
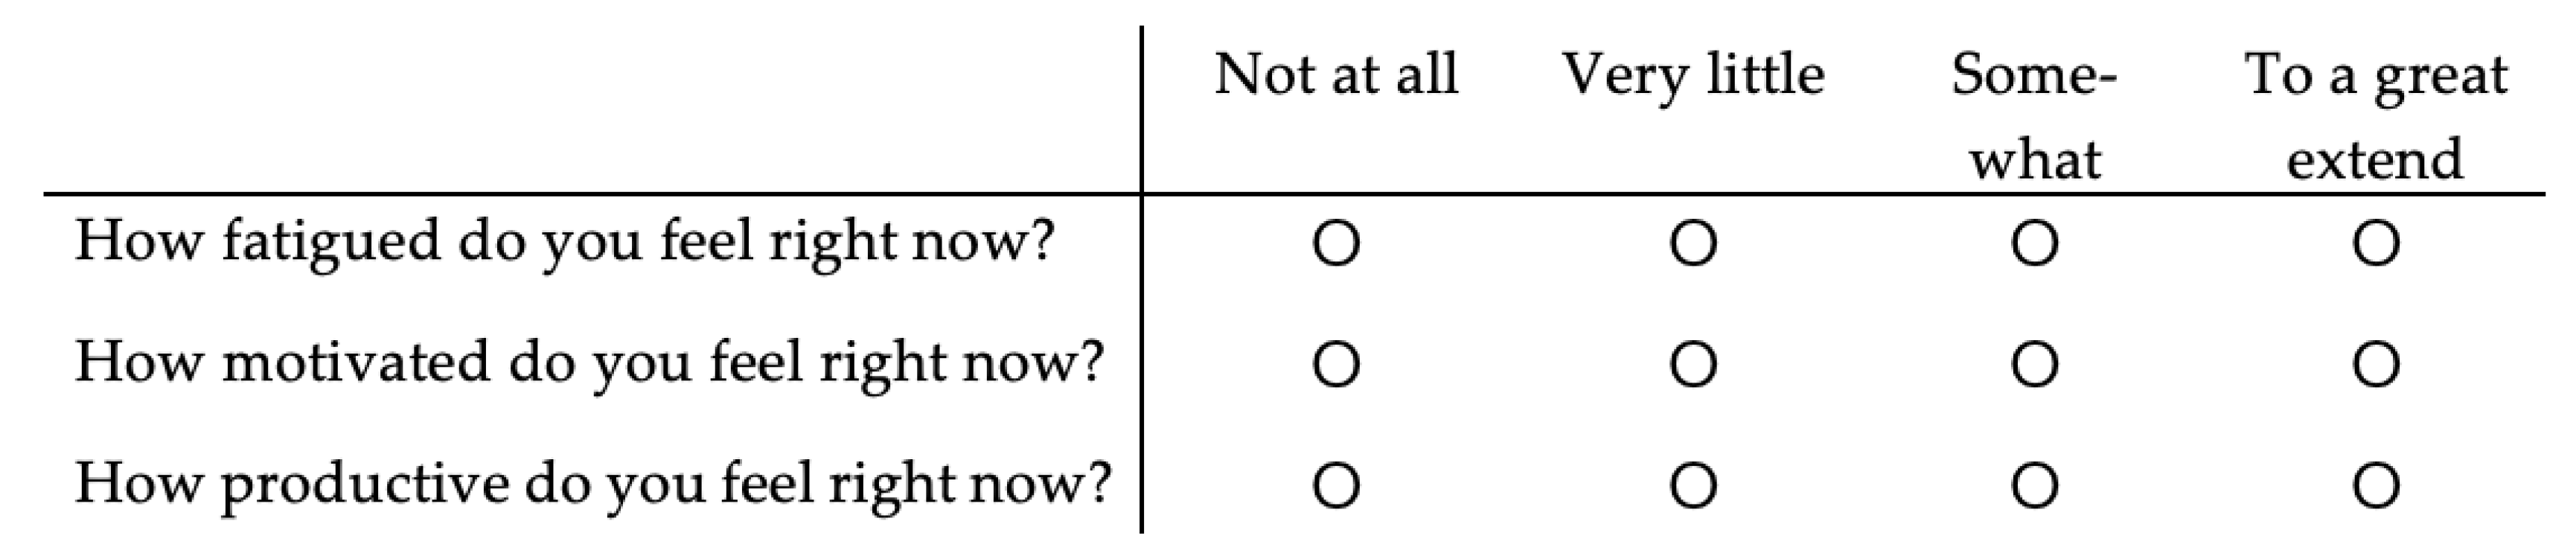
Fatigue, motivation and productivity levels were assessed using the format shown in Figure A1. These questions were asked before the start of the study period, every time students took a break and after the study period. The participants were asked to “Fill in the following statements about your state of mind at this moment”.
Figure A1.
Assessment of fatigue, motivation and productivity levels.
Appendix A.2 Assessment Task Completion
Appendix A.2.1 Assessment Task Completion Before Study Time
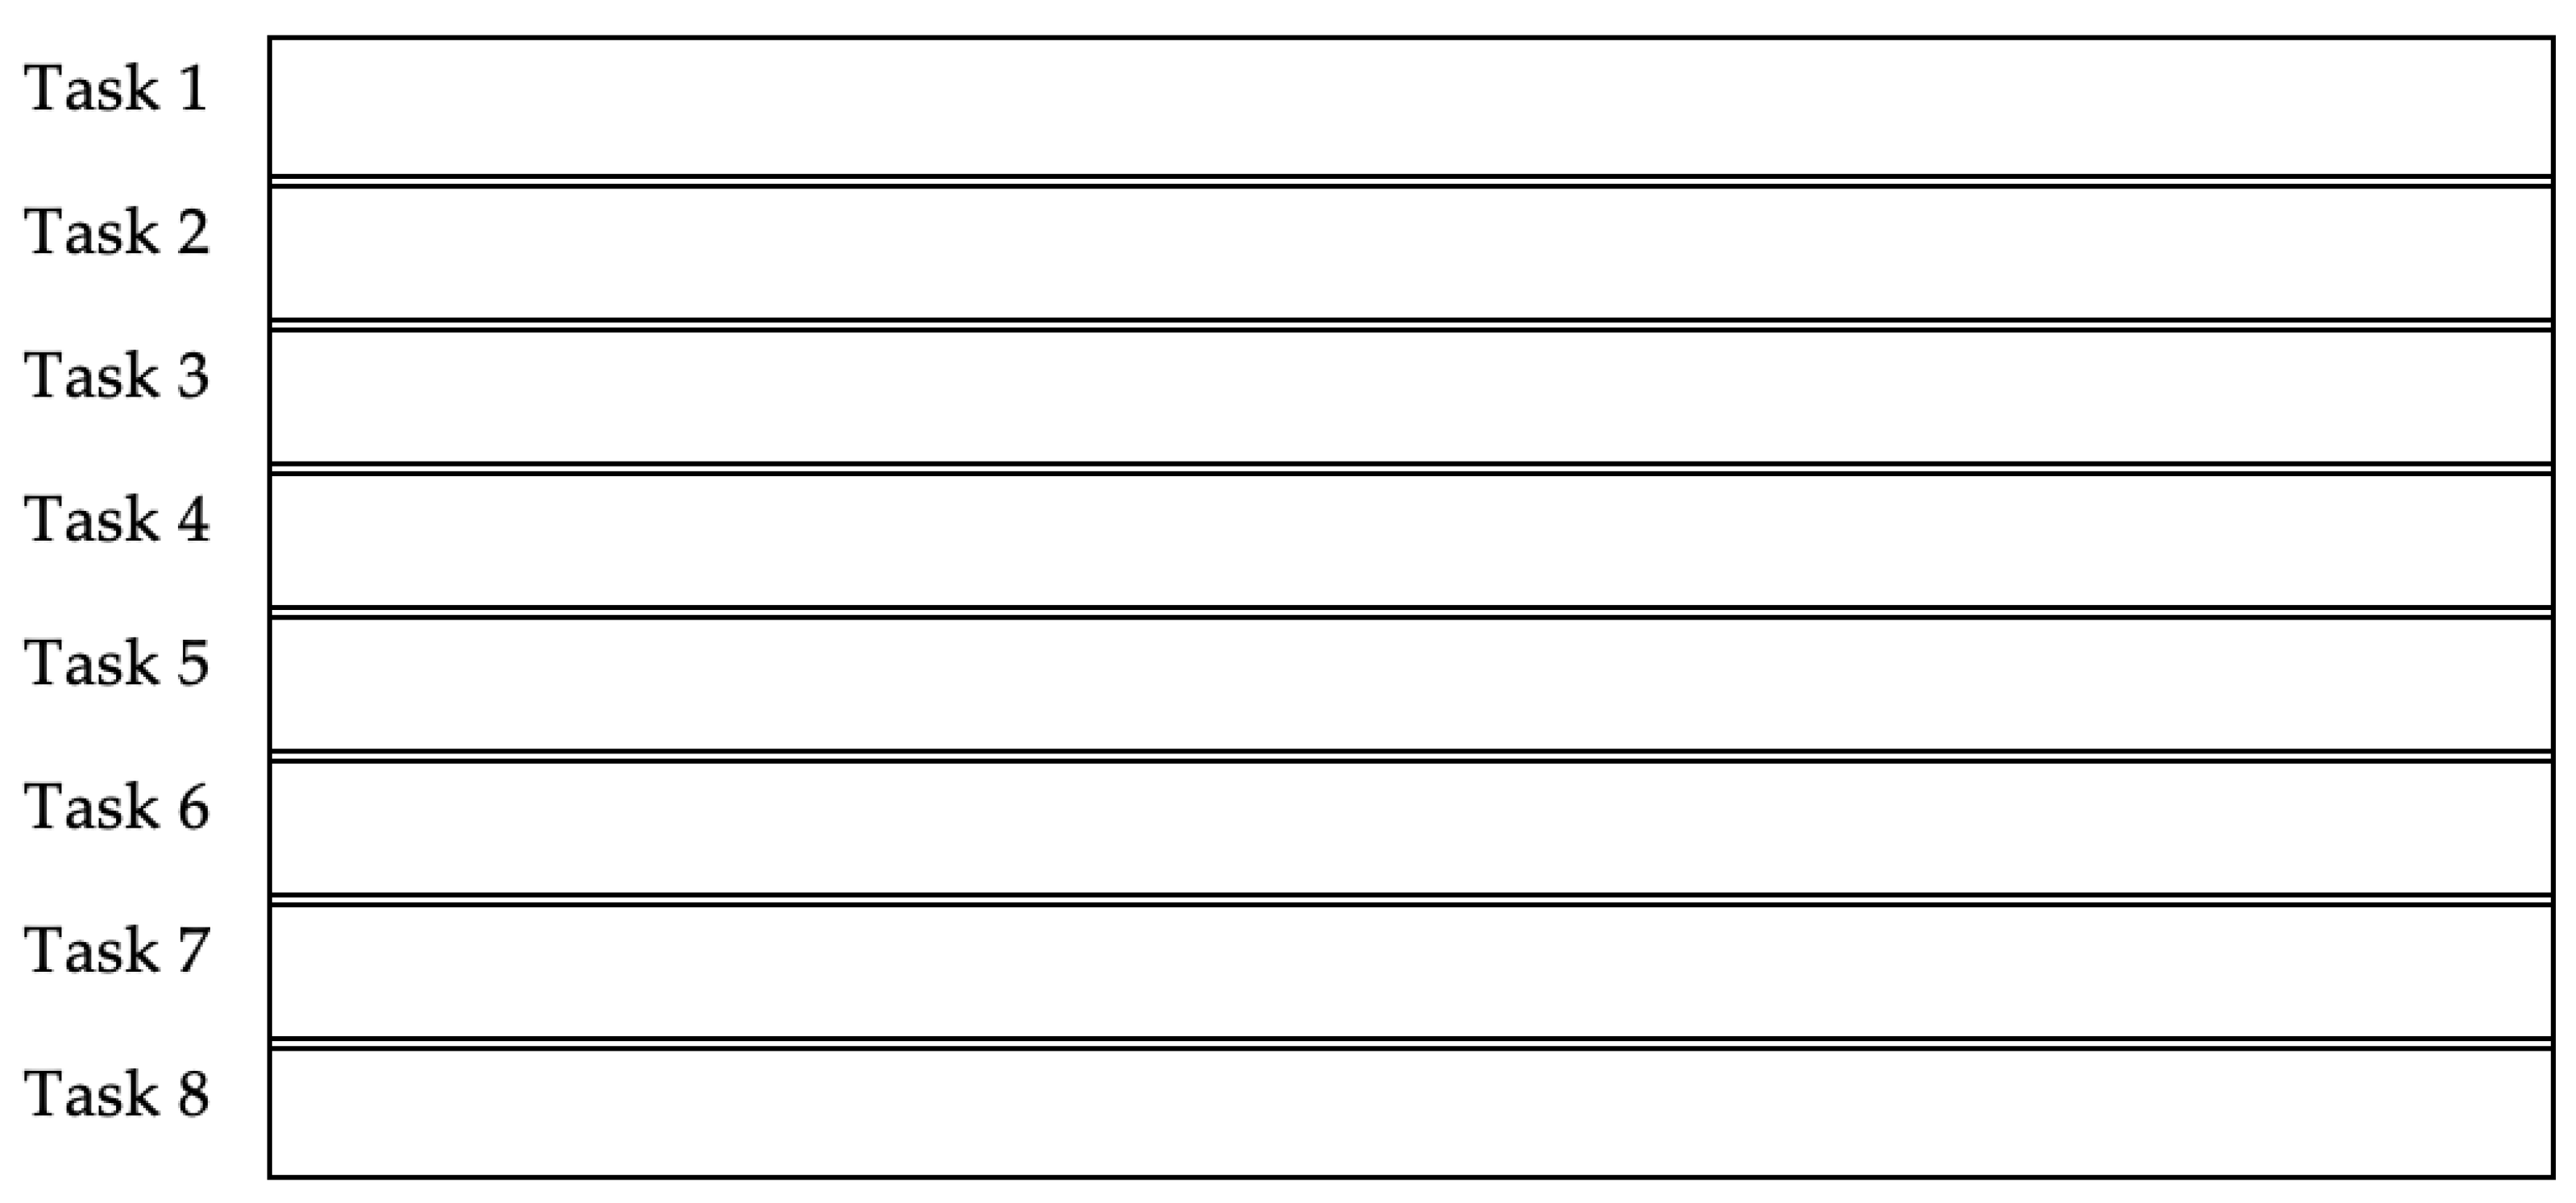
Task completion was assessed in the format shown in Figure A2. The participants were asked: “What tasks are you planning to do in the following hours of self-study? Please be specific. If you have planned less than 8 tasks only fill in the amount of tasks and a description of the task you have planned (you do not have to fill in all the 8 lines)”.
Figure A2.
Assessment of task completion before study time.
Appendix A.2.1.1 Assessment Task Completion after Study Period
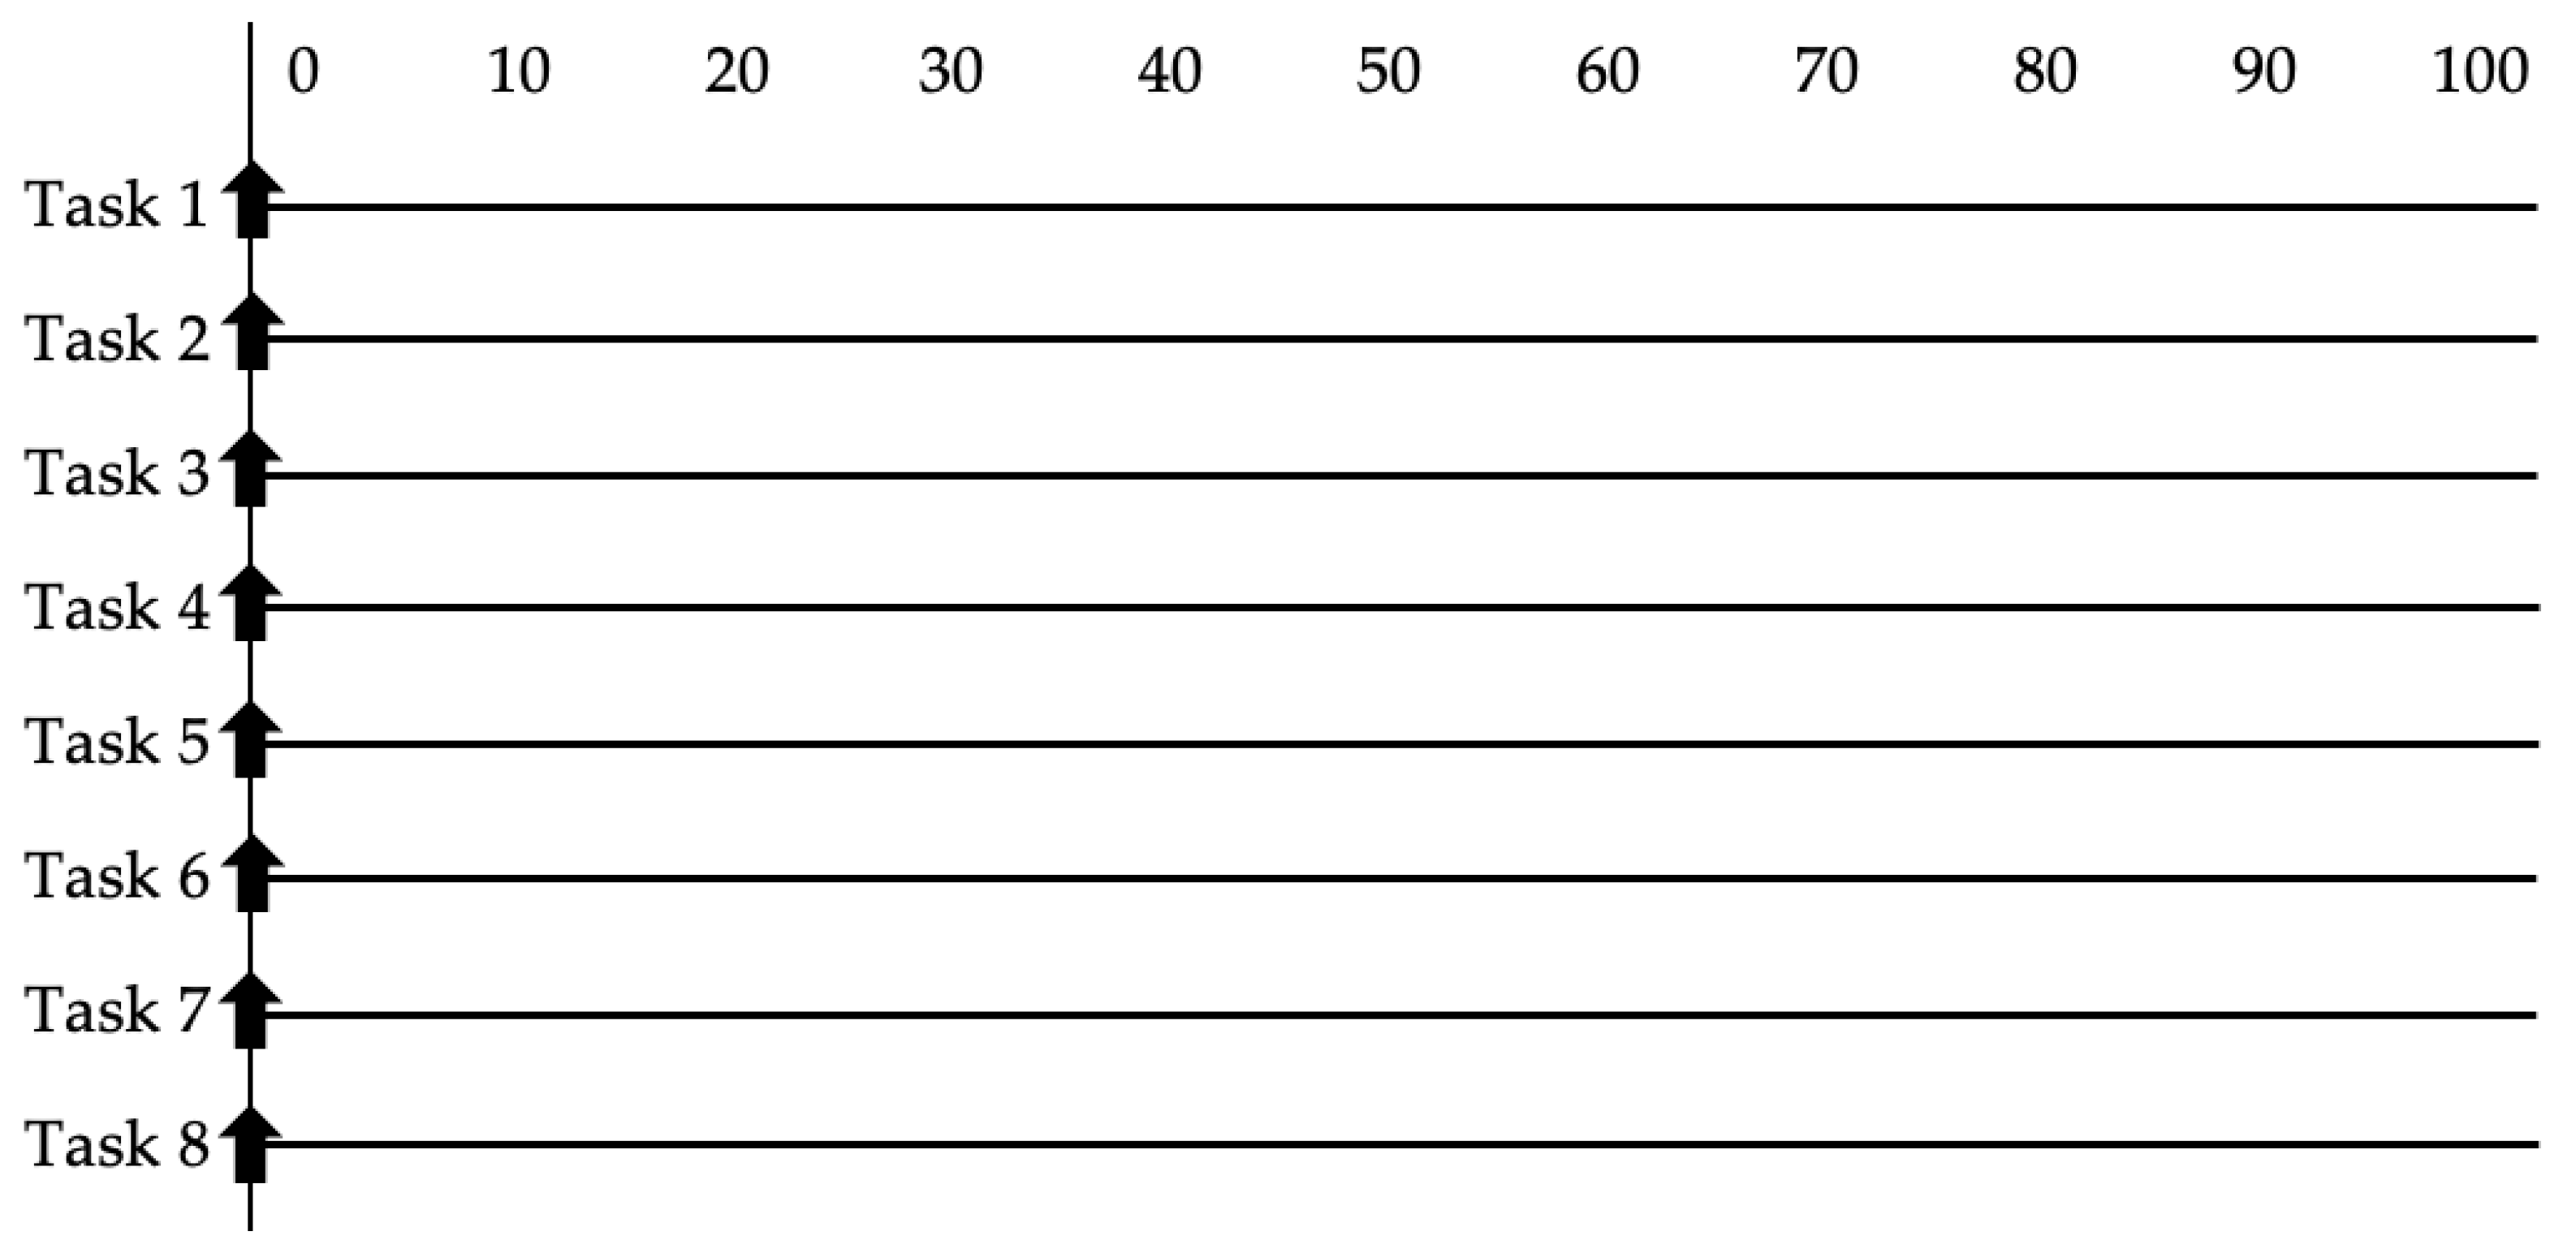
Task completion after the study session was assessed in the format shown in Figure A3. The participants were asked to “Fill in to which extent you completed the tasks you planned to do in this self-study time from 0% (did not do anything for this task) until 100% (this task is completely done)”.
The tasks that were filled in before the study time were forwarded to this question. The name “Task 1” till “Task 8” were therefore replaced with the planned tasks of the participant.
Figure A3.
Assessment of task completion after the study period.
Appendix A.3 Assessment Flow State: Flow Short Scale (FSS)
Flow state was assessed in the format shown in Figure A4. The participants were asked to “Fill in the following statements about your feeling in the last 2 hours during study time”.
Figure A4.
Assessment of Flow state.
Appendix B Instructions for Participants about Break-Taking Technique
Participants are randomly assigned to one of the following three blocks in which they got the instruction to study for two hours and they got the information about the break-taking technique they should use.
Appendix B.1. Pomodoro Break Instructions
In the following 2 hours you are going to do self-study. Please work on the tasks you have described in the previous question. In these 2 hours you will study in blocks of 25 minutes with a 5-minute break inbetween. This questionnaire will show you what to do at what time. The questionnaire will automatically transfer to the break after 25 minutes. Please take a break from your studies when it is said. After the break you will be asked to fill in some questions and press the arrow again. After this you will be instructed to start studying again. After two hours the questionnaire automatically moves to the last part of this questionnaire.
If you heard a sound when this page was shown, the same sound will play whenever you need to change your activity (so if you need to start studying after a break or if you need to take a break). If you did not hear the sound, please pay attention yourself when the page changes to break time or study time. Besides that, if you open another tab, the sound will also not play automatically, in that case please also pay attention yourself when the page changes.
Good luck with studying!
Appendix B.2. Flowtime Break Instructions
In the following 2 hours you are going to do self-study. Please work on the tasks you have described in the previous question. In these 2 hours you are asked to study for as long as you can focus. If you feel like you need a break you can press the arrow. The break you will get is predetermined; the page will automatically transfer to another page after your break time is over. After the break you will be asked to fill in some questions and then you will start to study again. After two hours the questionnaire automatically moves to the last part of this questionnaire.
If you heard a sound when this page was shown, the same sound will play whenever you need to change your activity (so if you need to start studying after a break). If you did not hear the sound, please pay attention yourself when the page changes to study time. Besides that, if you open another tab, the sound will also not play automatically, in that case please also pay attention yourself when the page changes.
Good luck with studying!
Appendix B.3. Self-Regulated Break Taking Instructions
In the following 2 hours you are going to do self-study. Please work on the tasks you have described in the previous question. In these 2 hours you are asked to study for as long as you can focus. If you feel like you need a break you can press the arrow. Take a break as long as you need. If you feel like you are ready to start studying again, please press the arrow again. After this you will be asked to fill in some questions and then, after you pressed the arrow again you will start to study again. After two hours the questionnaire automatically moves to the last part of this questionnaire.
If you heard a sound when this page was shown, the same sound will play if the two hours of self-study are over. If you did not hear the sound, please pay attention yourself when the page changes to the last part. Besides that, if you open another tab, the sound will also not play automatically, in that case please also pay attention yourself when the page changes.
Good luck with studying!
References
- Abad, Z. S. H. , Karras, O., Schneider, K., Barker, K., & Bauer, M. (2018). Task Interruption in Software Development Projects: What Makes some Interruptions More Disruptive than Others? arXiv (Cornell University). [CrossRef]
- Almalki, K. , Alharbi, O., Al-Ahmadi, W., & Aljohani, M. (2020). Anti-procrastination Online Tool for Graduate Students Based on the Pomodoro Technique. In Learning and collaboration technologies, 12206, 133-144. Springer, Cham. [CrossRef]
- Biwer, F., de Bruin, A., & Persky, A. (2023). Study smart – impact of a learning strategy training on students’ study behavior and academic performance. Advances in Health Sciences Education, 28(1), 147–167. [CrossRef]
- Biwer, F., Wiradhany, W., oude Egbrink, M. G. A., & de Bruin, A. B. H. (2023). Understanding effort regulation: Comparing ‘Pomodoro’ breaks and self-regulated breaks. British Journal of Educational Psychology, 93(S2), 353–367. [CrossRef]
- Bjork, R. A., & Bjork, E. L. (2020). Desirable difficulties in theory and practice. Journal of Applied Research in Memory and Cognition, 9(4), 475–479. [CrossRef]
- Christensen, R.H.B. (2023). Regression Models for Ordinal Data (v. 12-4.1). https://cran.r-project.org/web/packages/ordinal/index.html.
- Csikszentmihalyi, M. (1975). Play and intrinsic rewards. Journal of Humanistic Psychology, 15(41), 41-63. [CrossRef]
- de Bruin, A. B. H., Biwer, F., Hui, L., Onan, E., David, L., & Wiradhany, W. (2023). Worth the Effort: The Start and Stick to Desirable Difficulties (S2D2) Framework. Educational Psychology Review, 35(2), 41. [CrossRef]
- Dizon, R. J., Ermitanio, H. D., Estevez, D. M., Ferrer, J., Flores, S. J., Fontanilla, K. M., Frias, A., Galang, E., Guei, N. F., & Sugay, J. (2021). The effects of Pomodoro technique on academic-related tasks, procrastination behavior, and academic motivation among college students in a mixed online learning environment. Globus Journal of Progressive Education, 11(2).
- Faul, F., Erdfelder, E., Lang, A., & Buchner, A. (2007). G*Power 3: A flexible statistical power analysis program for the social, behavioral, and biomedical sciences. Behavior Research Methods, 39(2), 175–191. [CrossRef]
- Fong, C. J., Zaleski, D. J., & Leach, J. K. (2015). The challenge–skill balance and antecedents of flow: A meta-analytic investigation. The Journal of Positive Psychology, 10(5), 425–446. [CrossRef]
- Fostervold, K.I. & Watten, R.G. (2024) Put your feet up: The impact of personality traits, job pressure, and social support on the need for recovery after work. Curr Psychol, 43, 8485–8501. [CrossRef]
- Fritz, C., Ellis, A. M., Demsky, C. A., Lin, B. C., & Guros, F. (2013). Embracing work breaks: Recovering from work stress. Organizational Dynamics, 42(4), 274–280. [CrossRef]
- Ginns, P., Muscat, K., & Naylor, R. (2023). Rest breaks aid directed attention and learning. The educational And Developmental Psychologist, 40(2), 141-150. [CrossRef]
- Goetz,, T., Nett, U. E. & Hall, N.C. (2013). Self-Regulated Learning. In C.H. Hall, & T. Goutz (Eds.), Emotion, Motivation, and Self-Regulation: A Handbook for Teachers (pp. 123-166). Emerald Group Publishing.
- Grahek, I., Frömer, R., Prater Fahey, M., & Shenhav, A. (2022). Learning when effort matters: Neural dynamics underlying updating and adaptation to changes in performance efficacy. Cerebral Cortex, 33(5), 2395-2411. [CrossRef]
- Guadagnoli, M., Morin, M., & Dubrowski, A. (2012). The application of the challenge point framework in medical education. Medical Education, 46(5), 447–453. [CrossRef]
- Katidioti, I., Borst, J. P., van Vugt, M. K., & Taatgen, N. A. (2016). Interrupt me: External interruptions are less disruptive than self-interruptions. Computers in Human Behavior, 63, 906–915. [CrossRef]
- Kim, S., Park, Y., & Niu, Q. (2016). Micro-break activities at work to recover from daily work demands. Journal Of Organizational Behavior, 38(1), 28–44. [CrossRef]
- Lau, J. (2023, July 6). How to use the Flowtime Technique to boost your productivity. Zapier. https://zapier.com/blog/flowtime-technique/.
- Lee, J. Y. (2022). The Medical Pause in Simulation Training [Doctoral Thesis, Maastricht University]. Maastricht University. [CrossRef]
- Lee, J. Y., Szulewski, A., Young, J. Q., Donkers, J., Jarodzka, H., & van Merriënboer, J. J. G. (2021). The medical pause: Importance, processes and training. Medical Education, 55(10), 1152–1160. [CrossRef]
- Li, K., Xu, S., & Fu, H. (2020). Work-break scheduling with real-time fatigue effect and recovery. International Journal of Production Research, 58(3), 689–702. [CrossRef]
- Lim, J., & Kwok, K. (2016). The Effects of Varying Break Length on Attention and Time on Task. Human Factors, 58(3), 472-481. [CrossRef]
- Lyubykh, Z., Gulseren, D., Premji, Z., Wingate, T. G., Deng, C., Bélanger, L. J., & Turner, N. (2022). Role of work breaks in well-being and performance: A systematic review and future research agenda. Journal of Occupational Health Psychology, 27(5), 470–487. [CrossRef]
- Melguizo-Ibáñez, E., Zurita-Ortega, F., González-Valero, G., Puertas-Molero, P., Tadeu, P., Ubago-Jiménez, J. L., & Alonso-Vargas, J. M. (2024). Active break as a tool for improving attention in the educational context. A systematic review and meta-analysis. Revista de Psicodidáctica (English Ed), 29(2), 147- 157. [CrossRef]
- Oliveira dos Santos, W., Bittencourt, I. I., Isotani, S., Dermeval, D., Brandão Marques, L., & Frango Silveira, I. (2018). Flow Theory to Promote Learning in Educational Systems: Is it Really Relevant? Revista Brasileira de Informática Na Educação, 26(02), 29. [CrossRef]
- Phan, V. , & Beck, J. W. (2023). Why Do People (Not) Take Breaks? An Investigation of Individuals’ Reasons for Taking and for Not Taking Breaks at Work. Journal of Business and Psychology, 38(2), 259–282. [CrossRef]
- Pintrich, P. R. (2000). Chapter 14—The Role of Goal Orientation in Self-Regulated Learning. In M. Boekaerts, P. R. Pintrich, & M. Zeidner (Eds.), Handbook of Self-Regulation (pp. 451–502). Academic Press. [CrossRef]
- Rheinberg, F. , Vollmeyer, R., Engster, S., & Sreeeramoju, R.R. (2023). FSS - Flow Short Scale (English Version).
- Sammonds, G. M., Mansfield, N. J., & Fray, M. (2017). Improving long term driving comfort by taking breaks – How break activity affects effectiveness. Applied Ergonomics, 65, 81–89. [CrossRef]
- Schloemer, P., & Brenan, K. (2006). From Students to Learners: Developing Self-Regulated Learning. Journal of Education for Business, 82(2), 81–87. [CrossRef]
- Sheldon, R., & Wigmore, I. (2022). What is Pomodoro Technique time management? https://www.techtarget.com/whatis/definition/pomodoro-technique.
- Shen, M. (2023, December 31). Flowtime Technique - the best Pomodoro alternative for time management. Flowmodor. https://flowmodor.com/blog/flowtime-technique-the-best-pomodoro-alternative-for-time-management.
- Thompson, M. A., Tan, L., Soto, C., Dixit, J., & Ziat, M. (2021). Tomato Dice. Proceedings of the 2021 International Conference on Multimodal Interaction, 628–635. [CrossRef]
- Trougakos, J. P. , & Hideg, I. (2009). Momentary work recovery: The role of within-day work breaks. In S. Sonnentag, P. L. Perrewé, & D. C. Ganster (Eds.), Current perspectives on job-stress recovery (pp. 37–84). JAI Press/Emerald Group Publishing. [CrossRef]
- Willekes, N. (2014). “Disrupting the Flow: The Detrimental Effects of Accelerated Reader on Student Motivation,” Language Arts Journal of Michigan. 29 (2). [CrossRef]
- Zielke, J., Anglada-Tort, M., & Berger., J. (2023), Inducing and disrupting flow during music performance. Frontiers in Psychology, 14. [CrossRef]
- Zimmerman, B. J. (2002). Becoming a Self-Regulated Learner: An Overview. Theory Into Practice, 41(2), 64–70. [CrossRef]
- Zimmerman, B. J. , & Moylan, A. R. (2009). Self-regulation: Where metacognition and motivation intersect. In Handbook of metacognition in education (pp. 299–315). Routledge/Taylor & Francis Group.
Figure 1.
Study Procedure for all Conditions (Self-regulated breaks, Pomodoro, and Flowtime). SEM is the Subjective Experience measure, SB is study block.
Figure 1.
Study Procedure for all Conditions (Self-regulated breaks, Pomodoro, and Flowtime). SEM is the Subjective Experience measure, SB is study block.
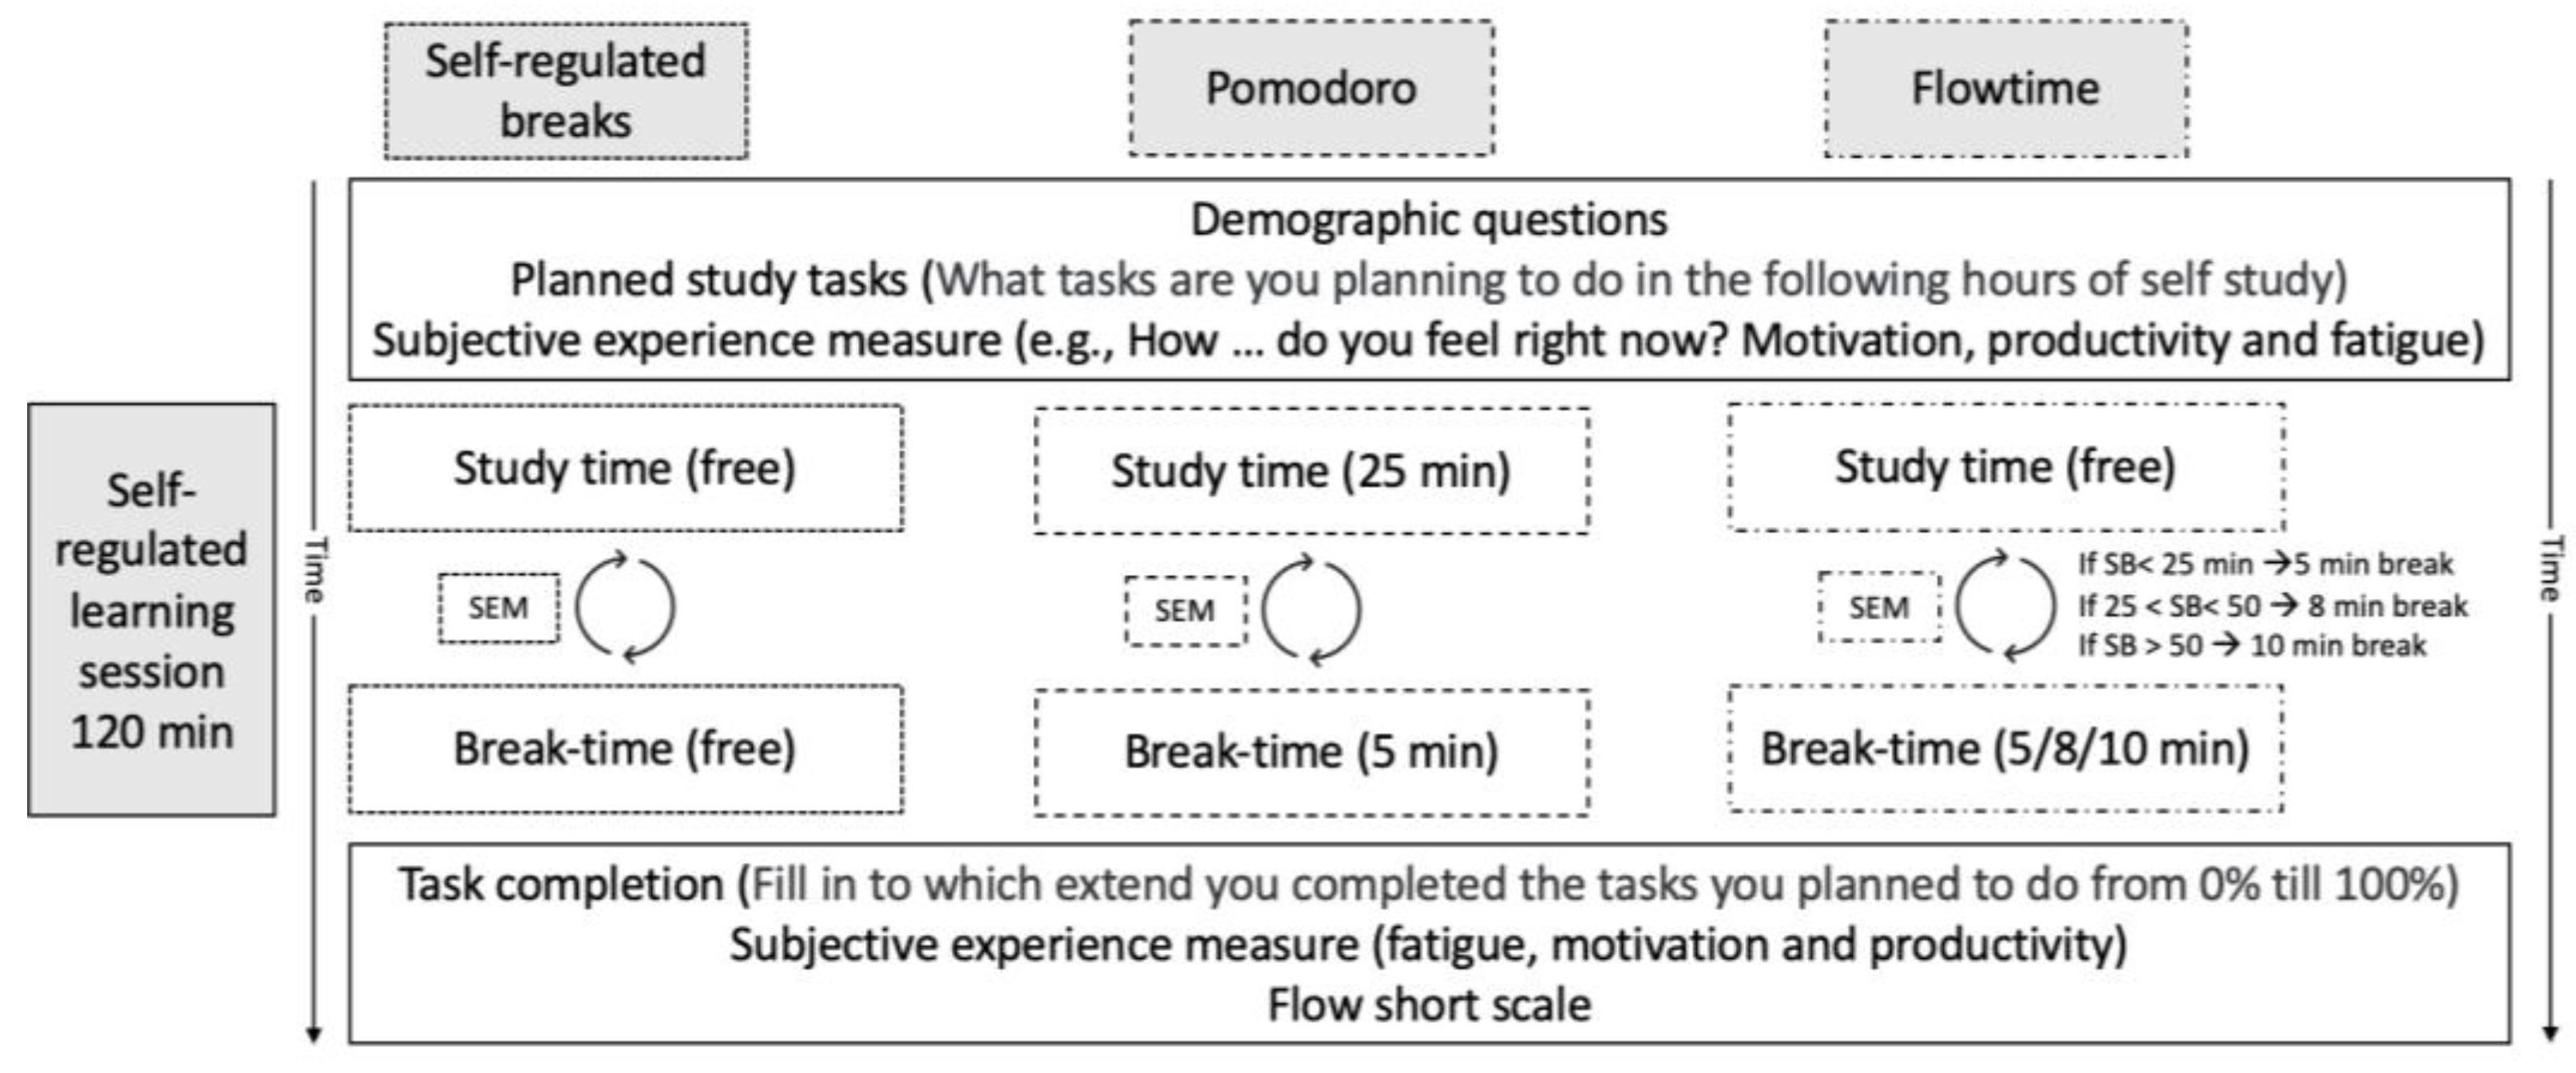

Table 1.
Mean and standard deviation of total study and break time, number of breaks, average motivation, productivity, and fatigue levels, number of planned tasks, percentage of total task completion, and flow state in the study for all break-taking conditions separately.
Table 1.
Mean and standard deviation of total study and break time, number of breaks, average motivation, productivity, and fatigue levels, number of planned tasks, percentage of total task completion, and flow state in the study for all break-taking conditions separately.
| Variable | Self-regulated breaks | Pomodoro | Flowtime | |||
|---|---|---|---|---|---|---|
| M | SD | M | SD | M | SD | |
| Total study time | 1.71 | 0.26 | 1.69 | 0.03 | 1.72 | 0.14 |
| Total break time | 0.30 | 0.26 | 0.34 | 0.02 | 0.30 | 0.14 |
| Number of breaks | 3.04 | 1.06 | 4.00 | 0 | 2.82 | 1.65 |
| Average motivation | 2.86 | 0.41 | 2.73 | 0.63 | 2.59 | 0.57 |
| Average productivity | 3.03 | 0.48 | 2.86 | 0.61 | 2.75 | 0.61 |
| Average fatigue | 2.56 | 0.50 | 2.59 | 0.63 | 2.64 | 0.61 |
| Number of planned tasks | 3.68 | 1.93 | 3.1 | 1.28 | 3.73 | 1.74 |
| Task completion | 70.32 | 20.12 | 69.4 | 18.70 | 67.09 | 17.50 |
| Flow state | 4.22 | 0.83 | 4.10 | 0.74 | 3.98 | 0.79 |
Table 2.
Overview of coefficients for motivation levels compared to Self-regulated break-taking.
| Predictor | Estimate | Std. Error | z value | p-value |
|---|---|---|---|---|
| Flowtime group | -0.35 | 0.37 | -0.96 | 0.339 |
| Pomodoro group | 0.01 | 0.35 | 0.01 | 0.989 |
| Passed time | -0.48 | 0.15 | -3.27 | 0.001** |
| Duration of previous break | 0.04 | 0.03 | 1.24 | 0.217 |
| fatigue (linear) | -1.82 | 0.43 | -4.24 | < 0.001*** |
| fatigue (quadratic) | -0.48 | 0.29 | -1.62 | 0.106 |
| fatigue (cubic) | 0.37 | 0.20 | 1.81 | 0.070 |
| productivity (linear) | 4.72 | 0.50 | 9.47 | < 0.001*** |
| productivity (quadratic) | -1.01 | 0.36 | -2.84 | 0.005** |
| productivity (cubic) | 0.26 | 0.23 | 1.14 | 0.255 |
*p <0.05. **p <0.01. ***p <0.001.
Table 3.
Overview of coefficients for productivity levels compared to Self-regulated break-taking.
| Predictor | Estimate | Std. Error | z value | p-value |
|---|---|---|---|---|
| Flowtime group | -0.37 | 0.22 | -1.64 | 0.100 |
| Pomodoro group | -0.28 | 0.22 | -1.30 | 0.195 |
| Duration of previous break | 0.02 | 0.02 | 0.75 | 0.454 |
| fatigue (linear) | -1.27 | 0.26 | -4.91 | < 0.001*** |
| fatigue (quadratic) | 0.34 | 0.19 | 1.80 | 0.072 |
| fatigue (cubic) | -0.03 | 0.13 | -0.24 | 0.811 |
| motivation (linear) | 2.84 | 0.31 | 9.24 | < 0.001*** |
| motivation (quadratic) | -0.36 | 0.19 | -1.89 | 0.059 |
| motivation (cubic) | 0.23 | 0.12 | 1.89 | 0.059 |
*p <0.05. **p <0.01. ***p <0.001.
Table 4.
Overview of coefficients for task completion levels compared to Self-regulated break-taking.
Table 4.
Overview of coefficients for task completion levels compared to Self-regulated break-taking.
| Predictor | Estimate | Std. Error | t value | p-value |
|---|---|---|---|---|
| (Intercept) | 25.26 | 24.70 | 1.02 | 0.309 |
| Flowtime group | -2.16 | 4.96 | -0.44 | 0.664 |
| Pomodoro group | 0.18 | 4.860 | 0.04 | 0.970 |
| Task amount | -0.39 | 1.19 | -0.33 | 0.746 |
| Total study time | 18.52 | 12.46 | 1.49 | 0.141 |
| Average motivation | -7.82 | 5.53 | -1.41 | 0.161 |
| Average productivity | 12.31 | 5.35 | 2.30 | 0.024 * |
*p <0.05. **p <0.01. ***p <0.001.
Table 5.
Overview of coefficients for fatigue levels compared to Self-regulated break-taking.
| Predictor | Estimate | Std. Error | z value | p-value |
|---|---|---|---|---|
| Flowtime group | 0.99 | 0.60 | 1.65 | 0.100 |
| Pomodoro group | -0.25 | 0.58 | -0.44 | 0.658 |
| Passed time | 0.02 | 0.01 | 3.84 | <0.001 *** |
| Duration of previous break | 0.01 | 0.03 | 0.28 | 0.784 |
| motivation (linear) | -2.71 | 0.51 | -5.30 | <0.001 *** |
| motivation (quadratic) | 0.09 | 0.35 | 0.26 | 0.794 |
| motivation (cubic) | -0.06 | 0.23 | -0.24 | 0.808 |
| productivity (linear) | -1.90 | 0.54 | -3.49 | <0.001 *** |
| Productivity (quadratic) | -0.33 | 0.40 | -0.83 | 0.404 |
| Productivity (cubic) | 0.01 | 0.25 | 0.03 | 0.978 |
| Flowtime:Passed time | -0.02 | 0.01 | -2.77 | 0.006 ** |
| Pomodoro:Passed time | >0.01 | 0.01 | 0.05 | 0.959 |
*p <0.05. **p <0.01. ***p <0.001.
Table 6.
Overview of coefficients for flow state compared to Pomodoro.
| Predictor | Estimate | Std. Error | t value | Pr(>|t|) |
|---|---|---|---|---|
| (Intercept) | 0.89 | 0.88 | 1.01 | 0.317 |
| Self-regulated group | -0.06 | 0.18 | -0.35 | 0.725 |
| Flowtime group | -0.12 | 0.17 | -0.72 | 0.476 |
| Task amount | 0.12 | 0.04 | 2.72 | 0.008 ** |
| Total study time | 0.48 | 0.46 | 1.05 | 0.297 |
| Average motivation | 0.16 | 0.20 | 0.79 | 0.433 |
| Average productivity | 0.56 | 0.20 | 2.84 | 0.006 ** |
*p <0.05. **p <0.01. ***p <0.001.
Disclaimer/Publisher’s Note: The statements, opinions and data contained in all publications are solely those of the individual author(s) and contributor(s) and not of MDPI and/or the editor(s). MDPI and/or the editor(s) disclaim responsibility for any injury to people or property resulting from any ideas, methods, instructions or products referred to in the content. |
© 2025 by the authors. Licensee MDPI, Basel, Switzerland. This article is an open access article distributed under the terms and conditions of the Creative Commons Attribution (CC BY) license (http://creativecommons.org/licenses/by/4.0/).
Copyright: This open access article is published under a Creative Commons CC BY 4.0 license, which permit the free download, distribution, and reuse, provided that the author and preprint are cited in any reuse.


