Submitted:
10 March 2025
Posted:
11 March 2025
You are already at the latest version
Abstract
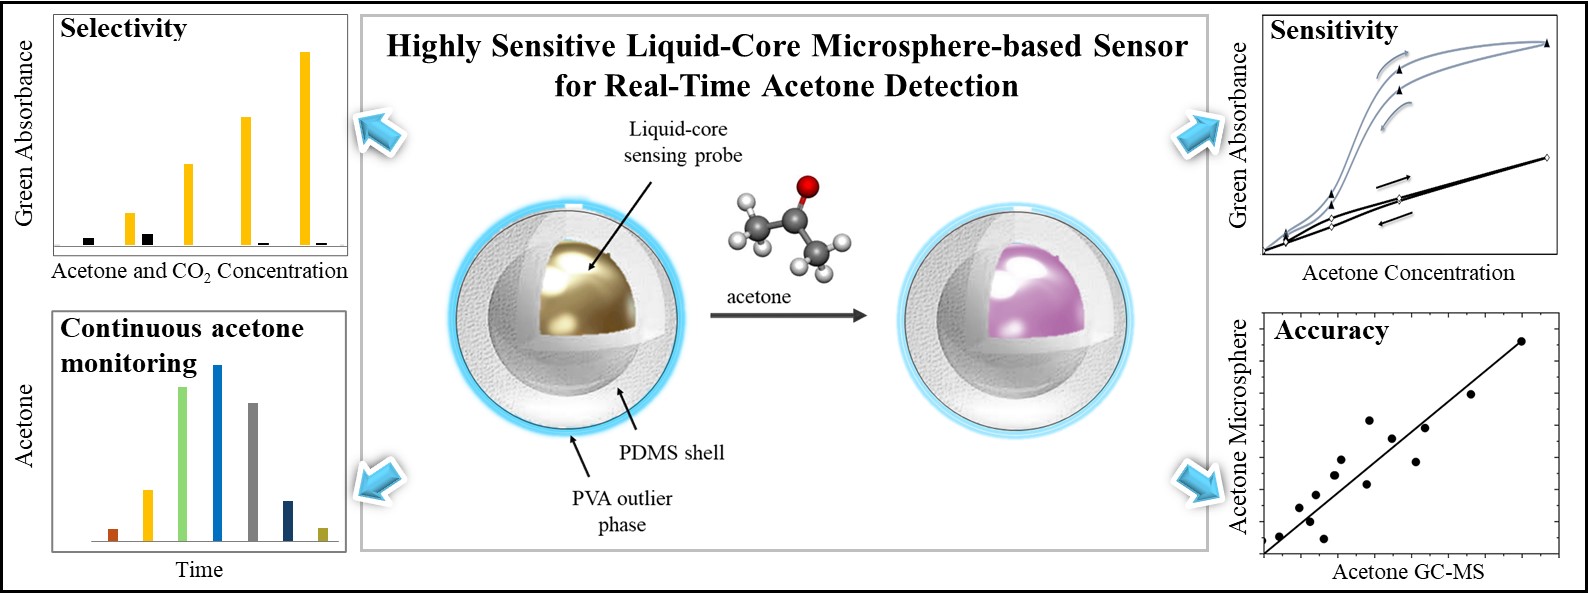
Ketones, key biomarkers of fat oxidation, are clinically relevant for metabolic health maintenance and disease development, making continuous monitoring crucial. Here, we present a novel colorimetric sensor for non-invasive, continuous acetone detection in breath and skin for point-of-care applications. The sensor comprises a polydimethylsiloxane (PDMS) shell encapsulating a highly sensitive and specific liquid-core acetone-sensing probe. Microsphere sensors were characterized by analyzing their size, PDMS shell thickness, colorimetric response, and sensitivity under realistic conditions (100% relative humidity and CO₂ interference). The microsphere size and sensor sensitivity can be controlled by modifying the fabrication parameters. Critically, the sensor showed high selectivity for acetone detection, with negligible interference from CO₂ concentrations up to 4%. Furthermore, the sensor enabled real-time, continuous, non-invasive monitoring. In addition, the sensor displayed excellent reproducibility (CV < 5%) and stability under realistic storage conditions (over two weeks at 4°C). Finally, the accuracy of the microsphere sensor was validated against a gold standard gas chromatography-mass spectrometry (GC-MS) method using simulated and real breath samples from Type 1 diabetic patients. The correlation between the microsphere sensor and GC-MS rendered a linear fit of slope equal to 0.94 and an R-squared adjustment of 0.9527. Thus, the liquid-core microsphere-based sensor offers a promising platform for continuous, non-invasive, and cost-effective acetone monitoring, potentially revolutionizing point-of-care diagnostics for metabolic disorders and health management.
Keywords:
acetone sensor
; liquid-core microspheres
; colorimetric detection
; non-invasive monitoring
; point-of-care diagnostics
; breath and skin acetone
; metabolic health
; ketosis
; obesity
; type 1 diabetes
1. Introduction
Metabolic health, crucial to overall well-being, is increasingly recognized as a key factor in health maintenance and disease development. [1] While traditional disease diagnosis often focuses on treating symptoms, a more holistic approach recognizes that metabolic imbalances often precede and contribute to disease. [2] Understanding the underlying metabolic changes is fundamental for effective prevention and treatment. An emerging view is that optimal cellular homeostasis is essential for maintaining health. This balance involves not only the right amounts of nutrients but also the efficient processing of energy from diverse sources. Disruptions in these delicate metabolic processes, whether due to deficiencies, excesses, or imbalances in energy flow, as well as its diversity and energy density in cellular metabolism, can lead to metabolic diseases. [3]
Fat metabolism, intrinsically related to energy needs, plays a central role in human physiology. Fat represents a variable portion of adult body mass (3 to 42 %), [4] and it works alongside carbohydrate metabolism to fuel the body. As described by Randle and colleagues in the 1960s, the "glucose-fatty acid cycle" elegantly illustrates the reciprocal relationship between fat and carbohydrate oxidation in muscle. [5] These two key metabolic pathways are maintained in a delicate biochemical and functional balance, and they are dynamically regulated by factors such as diet, physical activity, hormones, and even mood. [4] Therefore, continuous monitoring of our metabolic status is not only important but necessary to evaluate, prevent, and treat disorders or diseases. Advancements in science and technology need the development of robust detection methods for continuous, non-invasive metabolic monitoring using reliable biomarkers, enabling timely, point-of-care interventions for improved health outcomes.
Ketone bodies, specifically β-hydroxybutyrate (BHB), acetoacetate (AcAc), and acetone, are produced during fatty acid breakdown and serve as key indicators of a ketogenic state, where the body does not use glucose for energy but instead uses fatty acids. [6] Acetone, primarily formed through the enzymatic decarboxylation of AcAc, has emerged as a promising biomarker for monitoring ketosis. Tracking ketone levels is clinically relevant for managing various health conditions. These include eating disorders such as anorexia and obesity, [7] diabetic ketoacidosis (a complication of type 1 diabetes), epilepsy, [8] cardiovascular diseases and cholesterol disorders, [9] cancer, [10] kidney diseases, [11] and Parkinson's disease, [12] among others.
Current ketone detection methods range from highly precise laboratory-based techniques like gas chromatography-mass spectrometry (GC-MS), high-performance liquid chromatography (HPLC), and selected ion flow tube-mass spectrometry (SIFT-MS) [6,13,14] to point-of-care tests such as enzymatic assays and colorimetric urine reactions. [15,16] While laboratory methods offer high accuracy, their non-portability, requirement for trained personnel, and high cost limit their applicability for continuous or personal monitoring. [6] Point-of-care methods, while more accessible, often suffer from limited dynamic range and susceptibility to interference from hydration status and food consumption, and they are invasive. [15,16] Thus, the measurement of ketones, particularly acetone, which is a non-invasive biomarker, has not been achieved as a basic practice for health care through monitoring the metabolic state of fat oxidation. Therefore, it is desirable to have a method and device to measure the degree of ketosis accurately, passively, simply, and at a reasonable cost that favors the metabolic monitoring of individuals.
Breath acetone detection devices, typically employing metal oxide sensors, have become commercially available for point-of-care use. [6] These devices can detect acetone in the parts-per-million (ppm) range, providing users with an estimate of their breath acetone levels. However, concerns remain regarding sensor sensitivity decay, humidity interference, and power consumption. [17] Furthermore, the lack of rigorous clinical validation for many of these devices raises questions about their reliability and accuracy. [6] Wearable skin acetone sensors offer a potentially attractive non-invasive monitoring approach but are still in the early stages of development. Current research efforts often involve sample pre-concentration techniques, which complicate real-time monitoring. Critically, the long-term stability of these sensors, essential for practical, widespread use, has not been adequately addressed. [18,19]
Therefore, a significant need remains for a reliable, non-invasive, cost-effective method for continuous acetone monitoring. Such a method would enable individuals to easily track their metabolic state, facilitating proactive health management and potentially improving the diagnosis and management of various diseases. This work focuses on optimizing the analytical performance of a colorimetric acetone sensor for non-invasive breath and skin detection using a liquid-core microsphere platform. Our goal is to develop a stable, selective, and sensitive sensor suitable for real-world applications. Two critical challenges were addressed: preventing sensing probe degradation over time and establishing a reproducible fabrication process. We overcame these challenges by developing a novel acetone sensor based on liquid-core microspheres. The liquid core design mitigates sensing probe degradation, while the microsphere fabrication method enables reproducible liquid encapsulation for mass production.
2. Materials and Methods
2.1. Materials
The liquid sensing probe used hydroxylamine sulfate (Fluka, Buchs, Switzerland) and thymol blue (Acros Organics, Geel, Belgium). Polyvinyl alcohol, glycerol, methanol, and sodium hydroxide were purchased from Sigma Aldrich. For acetone, a precision gas mixture with a concentration of 1000 ppm v/v and balanced with nitrogen was used (GASCO™, USA). An ELGA Purelab Ultra RO system produced ultrapure water.
2.2. Colorimetric Acetone Detection
Acetone detection occurred within an aqueous sensing probe containing hydroxylamine sulfate (HA) and thymol blue (TB, a pH indicator). Acetone reacted with HA in the presence of TB to form a stable oxime derivative and sulfuric acid. The resulting acid generation caused a localized pH decrease, which was quantified by the colorimetric change of TB (yellow to pink at its first pKa of 2.0). [20] Because tiny amounts of acid induce significant color change in TB, this method has been used for environmental acetone detection in exposure assessments.[21] Figure S.1 illustrates the chemical reaction of the colorimetric acetone sensor.
2.3. Microspheres Fabrication
As reported by Utada (2005) and DoNascimento (2017), a glass capillary device was designed and fabricated for liquid-core microsphere production. [22,23] The microsphere fabrication setup consisted of two cylindrical glass capillary tubes (VitroCom™), one ending in a conical tip and the other with a flat tip, coaxially aligned within a square glass capillary tube (VitroCom™). The conical tip was molded using a micropipette puller (Sutter™) for precise flow control (Figure 1a). To inject the different solutions into the device, a three-phase flow system controlled by three independent pumps (Chemyx™) was used, each configured to regulate different liquid flow rates for the inner, middle, and outer phases. The inner phase, a sensing solution for acetone detection, was prepared by mixing water, glycerol, and methanol, adjusting the pH to 5.5, and then dissolving HA and TB. The middle phase used polydimethylsiloxane (PDMS, Sylgard® 184), prepared with a polymer/crosslinker ratio ranging from 10:1. The outer phase comprised a 10% w/v solution of polyvinyl alcohol (PVA), which ensured controlled flow of the medium along the walls of the device. This solution was stored at 4°C until use.
The sensing probe solution (HA-TB) was pumped through the lumen of the conical tip capillary (Figure 1a, left side). Simultaneously, a hydrophilic PVA solution (outer phase) was pumped in the opposite direction through the annular space surrounding the flat-tipped capillary (Figure 1a, right side). The device was also supplied with a third hydrophobic middle phase solution of PDMS, which was co-injected alongside the conical capillary, flowing in the same direction as the HA-TB solution. (Figure 1a, left side). The interaction of these three fluids, driven by differences in hydrophobicity, resulted in the formation of three-phase microspheres: a hydrophilic core of HA-TB, a PDMS shell, and an outer layer of PVA. The PVA layer was removed by repeated washing with distilled water and dried under an inert atmosphere at 4°C until use. Figure 1b shows a bright-field micrograph of the microspheres during production (left) and the final stage (right). This optimized fabrication method allowed for precise control of microsphere formation and its structural characteristics. Additional details of the microfluidic device, experimental setup, and fabrication procedure are shown in Figures S.2 – S.4.
2.4. Microsphere Characterization
Optical microscopy (Keyence™ BZ-X810) was employed to characterize the microspheres. Image acquisition and dimensional analysis were performed using BZ-X800 Viewer® and BZ-X800 Analyzer® software. Microsphere size distributions were analyzed by plotting microsphere counts versus radius, from which the mean radius and standard deviation were calculated. This same approach was applied to determine the PDMS shell thickness of the liquid-core microspheres.
2.5. Sensors Design
Microsphere Sensor Fabrication
The produced liquid-core microspheres were deposited onto a transparent, micro-structured well made of polyethylene terephthalate (PET) with dimensions of 4.00 mm × 4.00 mm. The microspheres were stabilized by the residual PVA outer layer from the fabrication process. After drying in an acetone-free environment, the sensors were stored in sealed, aluminized Mylar bags at 4°C. Figure 2a shows the assembled microsphere-based sensor before and after exposure to acetone. The experimental setup for acetone detection is described in our previous work. [24]
Planar Sensor Fabrication
Planar sensors were used for comparative time-response evaluation before and after acetone exposure. They were fabricated using a liquid sensing probe within a 4.00 mm × 4.00 mm square structure made of polydimethylsiloxane (PDMS). A square piece of Rayon paper (4.00 mm × 4.00 mm) was incorporated within the structure to hold the liquid securely. The PDMS housing was created from two identical parts bonded together using PDMS, which were cast from a 3D-printed mold. The internal mold walls measured 0.75 mm in height, while the square wells had a height of 0.47 mm. This design produced wells with a liquid capacity of 7.5 μL, of which ~3 μL contained the liquid sensing probe, including the embedded Rayon paper. [24] Figure 2b displays images of the planar sensor before and after acetone exposure. Three of the four wells contained the HA-TB sensing probe, which changed color from yellow to pink upon acetone exposure. The remaining well contained only TB, serving as a control, and showed no color change upon exposure to acetone due to the absence of hydroxylamine.
2.6. Detection Setup
A custom sensing device was designed to study the colorimetric response of the sensors and to deconvolute the observed color changes into red (R), green (G), and blue (B) components. The setup consisted of a complementary metal oxide semiconductor (CMOS) chip integrated with a white light emitting diode (LED) source in an optical transmittance mode configuration. The device components were housed within a polytetrafluoroethylene (PTFE) structure to ensure stability and alignment.
The CMOS camera was connected to a Raspberry Pi microcontroller (Raspberry Pi Foundation, UK) to capture time-lapse images of the sensors during exposure to analytes. The captured images were processed using a custom algorithm written in Python™ v.3.1.2 (Wilmington, DE, USA), which deconvoluted the color data into the R, G, and B intensity values. [24]
The sensor's R, G, and B intensity values (I) were recorded concurrently as a function of exposure time and processed according to Equation (1), as follows:
where IS is the intensity of the R, G, or B components within the sensing area of interest (e.g., HA-TB or TB area) at a given time, and IR is the intensity of the same R, G, or B component in a reference area (e.g., the center of the sensor without the sensing probe) captured at the same time.
The changes in the sensor signal were analyzed as a function of different concentrations of acetone and carbon dioxide, enabling the evaluation of sensor performance under different analyte conditions.
2.7. Human Subjects
An informed consent form approved by the Institutional Review Board at Arizona State (IRB protocol number: STUDY00016374) was obtained from each subject before the study (n=4). Breath samples were collected in Tedlar® bags from the recruited participants; breath acetone concentrations were quantified using the microsphere-based sensor and compared with simultaneous GC-MS analysis of the same samples.
2.8. Samples
2.8.1. Simulated Samples
To evaluate the sensor's performance, simulated breath samples were prepared, incorporating gas mixtures with 100% relative humidity. Acetone samples were created by injecting a known standard gas volume into 40L Tedlar® bags. The acetone gas was sourced from a certified calibration gas cylinder (GASCO™, 1000 acetone ppm v/v, nitrogen balance gas). The humidity in the samples was achieved by introducing a controlled amount of water (0.84 mL at 23.3°C) to replicate realistic 100% breath relative humidity conditions.
2.8.2. Carbon Dioxide Samples
To reproduce realistic breath-sensing environments accurately, carbon dioxide gas samples were also prepared under 100% relative humidity conditions. The CO₂ samples were prepared in aluminum Tedlar® bags using a certified gas mixture containing 4.02% CO₂ and 16.10% O₂ in a nitrogen balance (Matheson™ 1545 Watkins St. Phoenix, AZ). Known amounts of water were introduced to achieve humidity saturation. The gas mixture was systematically diluted to obtain final CO₂ concentrations of 0.5%, 1%, 2%, 3%, and 4%, reflecting physiologically relevant levels.
2.8.3. Human Subject Breath Samples
To collect human breath samples, subjects (n=4) were instructed to continuously exhale into a mouthpiece-adapted 28” diameter aluminum balloon for 10 minutes. This method ensured sufficient breath volume for acetone sensor evaluation and GC-MS.
2.9. Solid-Phase Microextraction (SPME) Coupled with GC-MS
2.9.1. Modification of SPME Fibers
Solid-phase microextraction (SPME) fiber assemblies (Supelco, Sigma-Aldrich™, USA) with a 65 μm polydimethylsiloxane/divinylbenzene (PDMS/DVB) coating on 24 Ga fused silica and a manual holder assembly were used. To enhance acetone detection sensitivity, the fibers were modified with o-2,3,4,5,6-(pentafluorobenzyl)hydroxylamine hydrochloride (PFBHA, Sigma-Aldrich™), see this chemical reaction in Figure S.7. Specifically, this derivatization process involved immersing the fibers in a septum-sealed vial containing 1 mL of PFBHA solution (prepared in HPLC-grade deionized water, Sigma-Aldrich™). The solution was stirred at room temperature for 10 minutes to allow PFBHA adsorption onto the fibers.
2.9.2. Measurement of Acetone in Breath and Simulated Samples
Acetone concentrations in breath and simulated samples were measured by GC-MS (Agilent 6890N Network GC System coupled with a 5973 Network Mass Selective Detector, USA). GC separation was performed using a 30 m × 0.25 mm i.d. with a 0.25 μm film of an HP-5MS UI capillary column (Agilent Technologies, USA), using helium carrier gas at 60 kPa head pressure and 50 mL/min flow rate. The injector temperature was maintained at 250°C, and the detector temperature was 230°C. The column temperature was started at 70°C for 2 min and then programmed to 270°C at the rate of 20°C/min. With these settings, acetone and its oxime derivative had retention times of 6.62 and 5.54 minutes, respectively, within the 13-minute chromatographic run. The mass spectrometer was operated in selected ion monitoring mode (SIM) at m/zs of 100 and 340. The data collection was performed with MSD Chem Station Data Analysis Application Software (Agilent Technologies Inc., USA) running on a personal computer. The GC-MS was calibrated by on-column injections of gaseous acetone standards.
3. Results
3.1. Comparative Sensor Response
A comparative analysis of the response time-resolved signal behavior, derived from deconvoluted red, green, and blue absorbance components, of both microsphere-based and planar sensors was performed and shown in Figure 3a. In this experiment, both sensor designs were exposed to 300-ppm gas acetone, delivered at a controlled flow rate of 0.75 L/min for 40 minutes. The 300-ppm acetone exposure lasted 40 minutes (the starting point is indicated by a black arrow in Figure 3a). Before the acetone exposure, a 10-minute background reading was recorded while the sensors were exposed to nitrogen.
The green absorbance component exhibited the most significant signal changes for both the microsphere-based and planar sensors, with a noticeably larger response and greater sensitivity observed for the microsphere-based sensor. The red and blue absorbance components showed smaller changes (lower slopes), with less distinction in response between the two sensor types. In both sensor designs, green and red absorbance increased, while blue absorbance decreased, consistent with previously reported spectral response observations for HA-TB sensing probes. [21,24]
Notably, the microsphere-based sensor demonstrated a significantly faster response time than the planar sensor. This improved performance is due to the 3D geometry of the microsphere-based sensor, which facilitates efficient spherical diffusion of the analyte. In contrast, the planar sensor performance is limited by slower planar diffusion, resulting in reduced analyte transport and interaction with the sensor surface (Figure 3c and Figure 3d). These findings suggest that the microsphere design leads to faster and more sensitive detection of acetone due to its larger surface area and increased analyte interaction, making it a promising candidate for gas-phase sensing applications.
3.2. Microsphere Characterization
Figure 4a and Table 1 show the effect of fabrication parameters on microsphere size distribution. Size distribution curves (microsphere counts vs. radius) are presented for two sets of fabrication parameters, which resulted in different microsphere sizes. Condition I, using a 202 µm tapered tip and liquid flow rates of 300 µL/min (PVA), 100 µL/min (PDMS), and 70 µL/min (HA-TB sensing probe), produced microspheres with a radius of 170 ± 23.3 µm. Condition II, with a 40 µm tapered tip and flow rates of 1000 µL/min (PVA), 250 µL/min (PDMS), and 60 µL/min (sensing probe), yielded smaller microspheres measuring 121 ± 11.6 µm in radius. Both sets of microspheres had a PDMS shell thickness of 3 µm (Figure 4b). The resulting average microsphere densities in the PET sensor wells were 122 and 145 counts/well for conditions I and II, respectively.
The sensitivity of the microsphere sensors produced under both conditions was evaluated using known acetone concentration samples and monitoring the green absorbance (Figure 4c). Sensors fabricated under Condition I exhibited a wider dynamic range (5 – 300 ppm v/v) than those fabricated under Condition II (5 - 40 ppm v/v), with higher sensitivity. This enhanced sensitivity can be attributed to two factors: First, the higher area/volume ratio of Condition I that may have produced an increased diffusion of acetone. Second, the ratio of the outer PVA-to-sensing probe was lower for Condition II (250:70) than for Condition I (1000:60). The higher PVA content in Condition I likely contributed to a thicker PVA layer, which reduced the interaction efficiency between the sensing probe and analyte.
3.3. Microsphere Sensor Response to Acetone and Carbon Dioxide
Our previous studies have identified that carbon dioxide (CO₂) can interfere with acetone detection using the HA-TB sensing probe in a planar sensor and real samples. This is due to CO₂'s ability to dissolve into the liquid probe (aqueous media), altering the local pH and affecting the sensor's response. To address this, we systematically evaluated the response of both HA-TB and TB microsphere sensors to varying concentrations of acetone and CO₂ under controlled conditions, but now in our microsphere sensor. These experiments were conducted at 100% relative humidity, simulating realistic breath/skin headspace conditions. Figure 5b demonstrates that the green absorbance response of the HA-TB microsphere sensor remained unaffected by CO₂ concentrations up to 4%, representing the upper limit typically found in human breath. [24]
These results confirm the selectivity of the HA-TB microsphere sensor’s green absorbance response for acetone detection, with negligible interference from CO₂. The significant differences in CO₂ responsiveness between the HA-TB liquid sensing probe in planar sensors and the lack of responsiveness in microsphere-based sensors may be due to interactions or chemical reactions with the paper substrate of the planar sensor. Therefore, the green absorbance response of the microsphere-based sensor to acetone is optimal for minimizing CO₂ interference, making it a more desirable option. Consequently, the signal processing algorithm for this sensor was further optimized (Section 3.4).
3.4. Continuous and Non-Invasive Acetone Monitoring with a Microsphere-Based Sensor
We investigated the feasibility of non-invasive skin acetone detection and continuous ketone monitoring (CKM) applications using the HA-TB microsphere-based sensor. Figure 6a (red line) presents the green absorbance response of the HA-TB microsphere sensor when exposed to acetone concentrations that were increased from 0 to 250 ppm and then decreased from 250 to 0 ppm to assess its performance across a relevant range of concentrations. Building on the previous work of Wang et al., [25] who modeled the response of colorimetric sensors, we analyzed the relationship between the absorbance change of the microsphere sensor as a function of gas concentration over time (Figure 6a, gray line), as described by the following equation:
where ΔA is the absorbance change, ΔAmax represents the maximum absorbance change, and k is the reaction rate coefficient. According to equation 2, the derivative of the sensor's absorbance with respect to time is directly proportional to the analyte concentration. Based on this relationship, we calculated the first derivative of the microsphere sensor's green absorbance response and compared it to the acetone concentration values used during exposure. Figure 6a (blue line) illustrates the sensor's first derivative during exposure to increasing and decreasing acetone concentrations. Notably, the derivative closely follows the changes in concentration, confirming the predictive accuracy of equation 2. This observation demonstrates that the first derivative of the sensor signal can provide real-time, instantaneous acetone concentration readings, making it suitable for applications requiring continuous monitoring. Such applications may include non-invasive and needle-free methods for detecting acetone levels.
Moreover, our data indicate that the amount of sensing probe stored within the microspheres is sufficient to sustain prolonged exposure to acetone. The minimal hysteresis, which shows that the first derivative values for the same acetone concentrations during the experiment's ascending and descending portions matched, is proof of this. The lack of hysteresis confirms the sensor's reliability and stability for continuous acetone monitoring. These findings suggest that this microsphere-based sensor, combined with equation 2, offers a robust solution for real-time, non-invasive acetone monitoring in applications such as breath analysis or skin detection.
3.5. Microsphere Sensor Performance Evaluation: Reproducibility, Stability, and Accuracy
We evaluated the sensor responses to assess the reproducibility within and between the sensor batches. We stored the prepared sensors in a clean-air environment before testing and tested the response of a fresh sensor. The coefficient of variability (CV), defined as the ratio between the sensor response average and sensor response standard deviation for the same batch of sensors was <5% on average, as shown in the error bars in Figure 5. This CV within the batch was acceptable for analytical standards.
The acetone microsphere sensor showed stability toward the sensitive detection of acetone for extended periods when stored at appropriate temperatures. Similar to our previously published sensor, [24] we found the new liquid sensing microsphere sensor could maintain stability for at least 2 weeks when stored at 4°C in an enclosed, clean, and humid environment with 100% relative humidity.
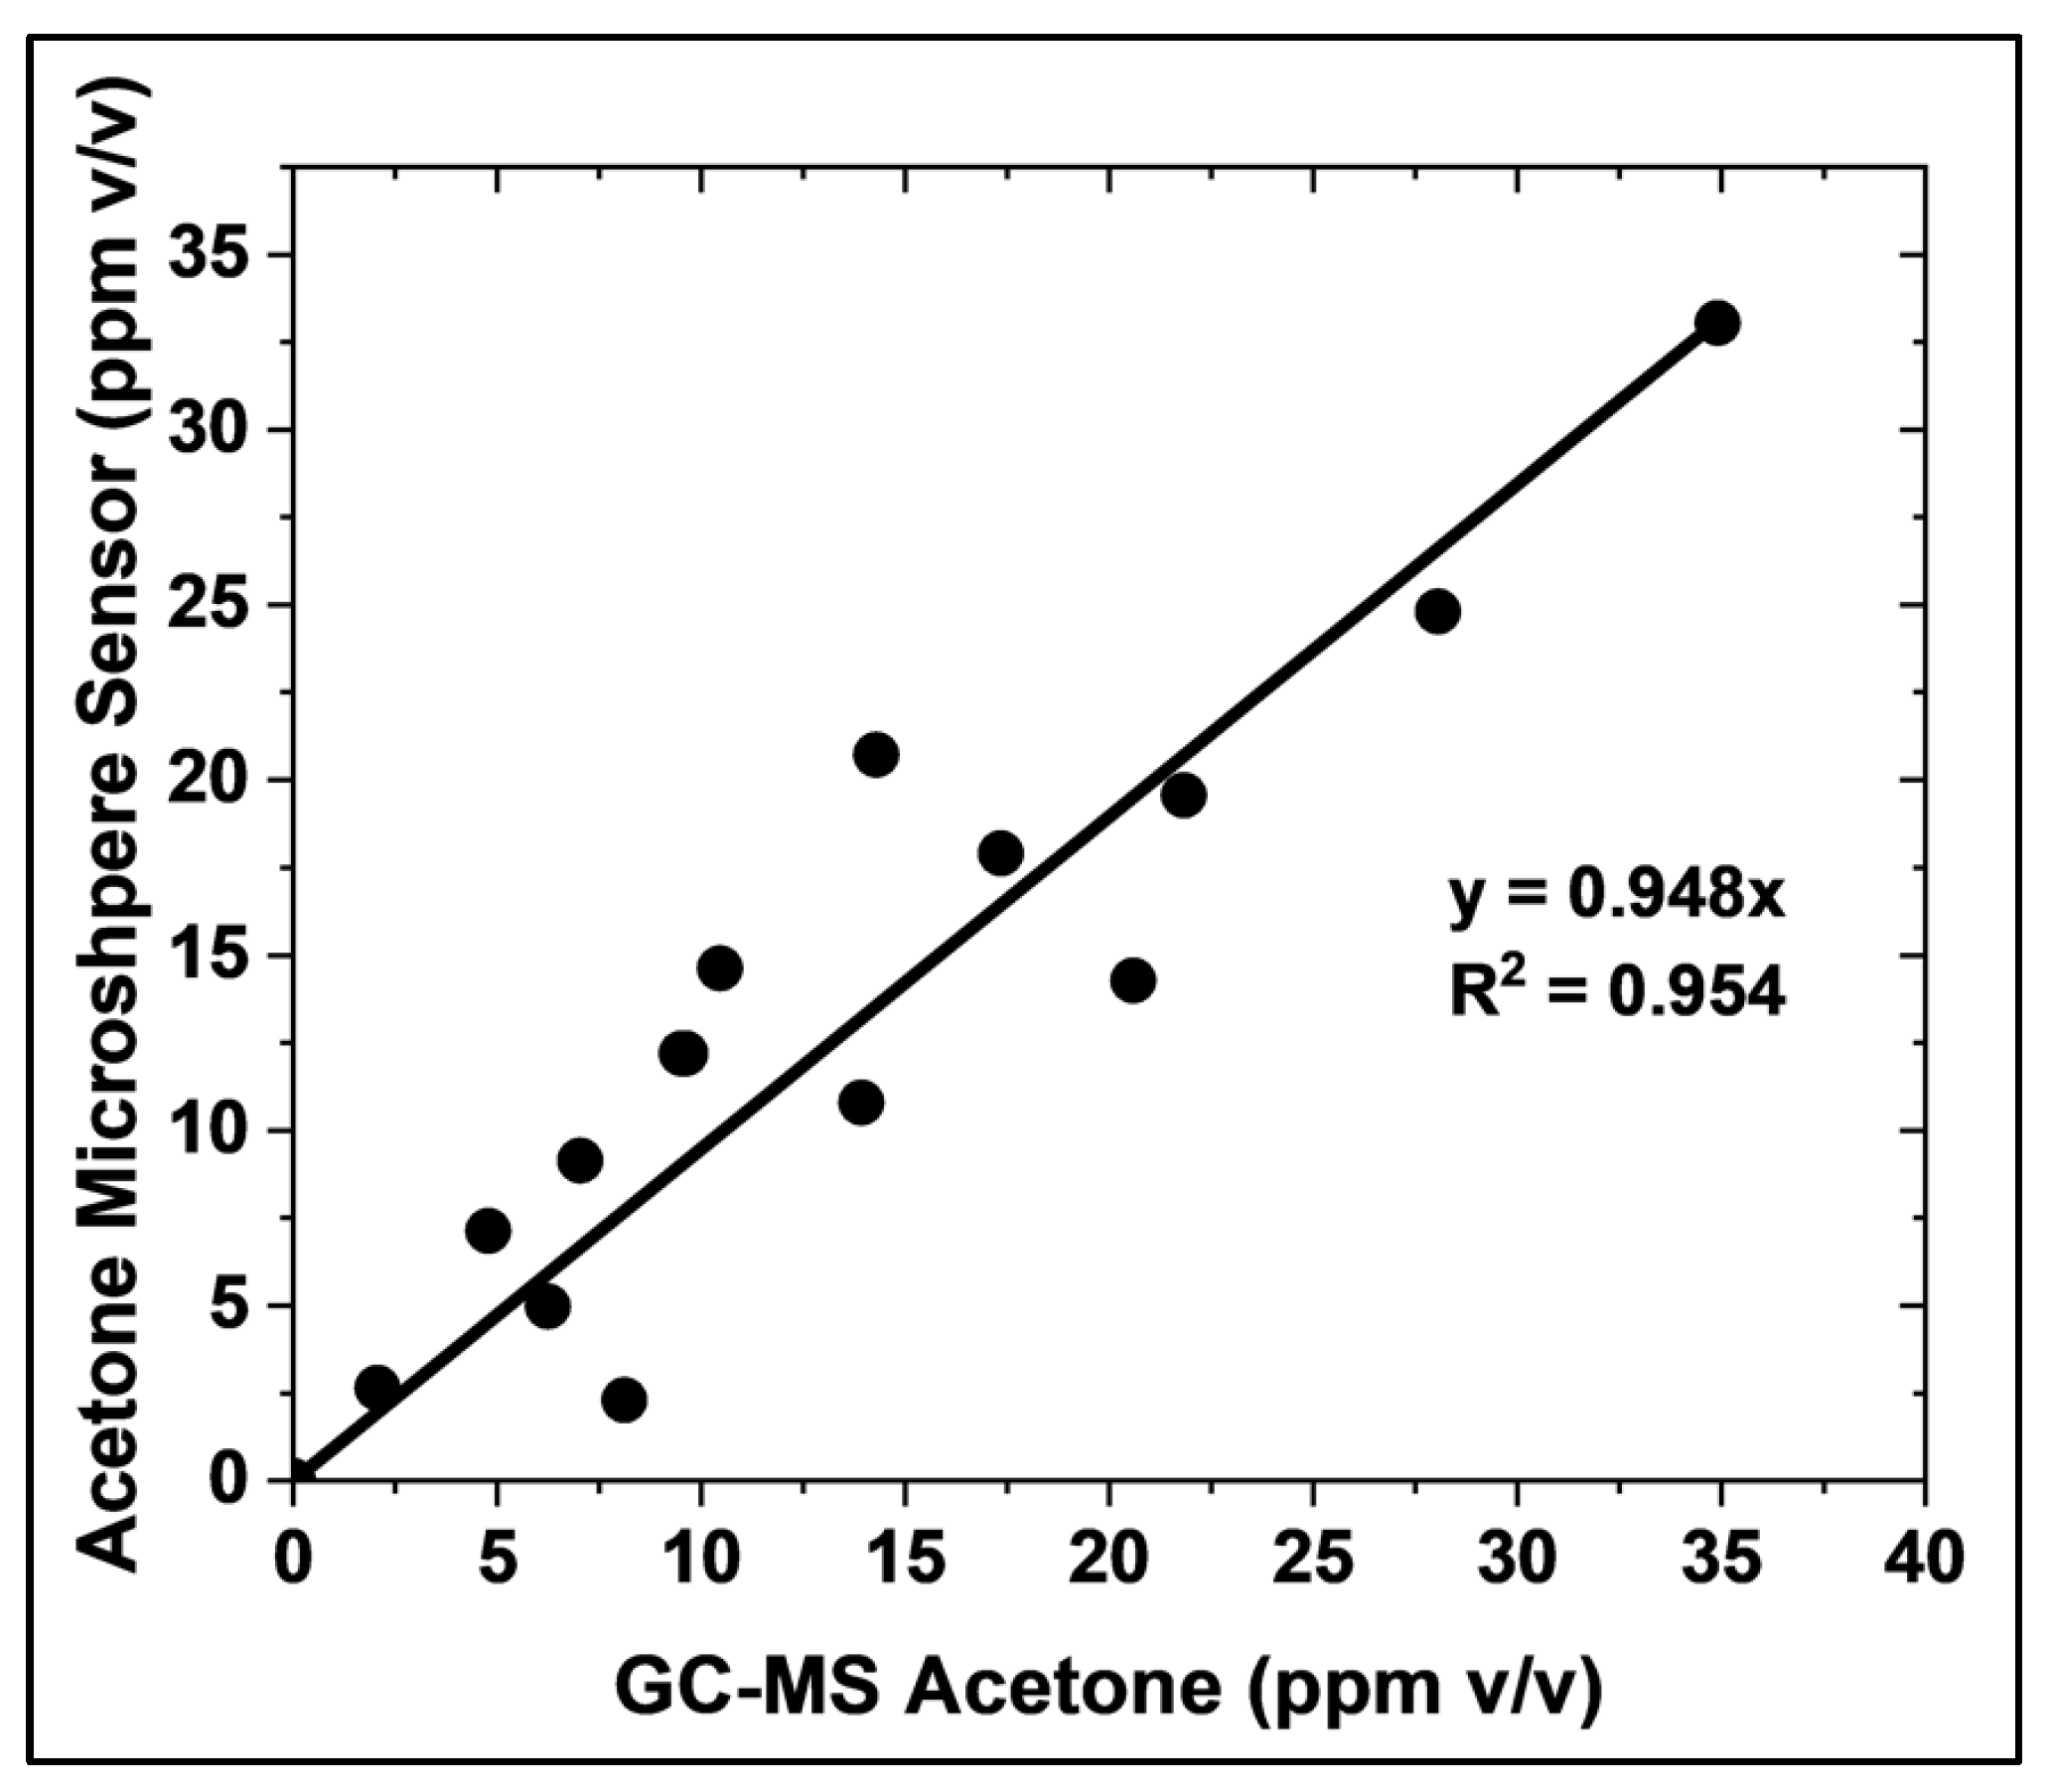
The accuracy of the microsphere-based acetone sensor was evaluated by comparing its measurements with those obtained using GC-MS, the gold standard method, under realistic conditions (Figure 7). A strong correlation was observed between 1 and 35 ppm v/v acetone, with a linear fit of slope equal to 0.94, exhibiting an R-squared adjustment of 0.9527. This correlation was established using 15 samples prepared with known acetone concentrations, 4% v/v CO₂, and 100% relative humidity. The presence of CO₂ and high humidity in these samples confirms the suitability of the microsphere sensor for point-of-care and non-invasive acetone measurement in gas-phase biological fluids. This finding demonstrates the strong agreement between the microsphere-based sensor and the established GC-MS method
Figure 6.
(a) Simulation of continuous acetone monitoring, including the sensor signal processing of microsphere sensor (180 µm radius, for green absorbance acquisition, black line), continuous HA-TB microsphere-based sensor response to increasing and decreasing acetone concentrations (red line), and the first derivative of the sensor response (blue line). (b) Equation 2 allows for real-time acetone concentration determination during continuous monitoring.
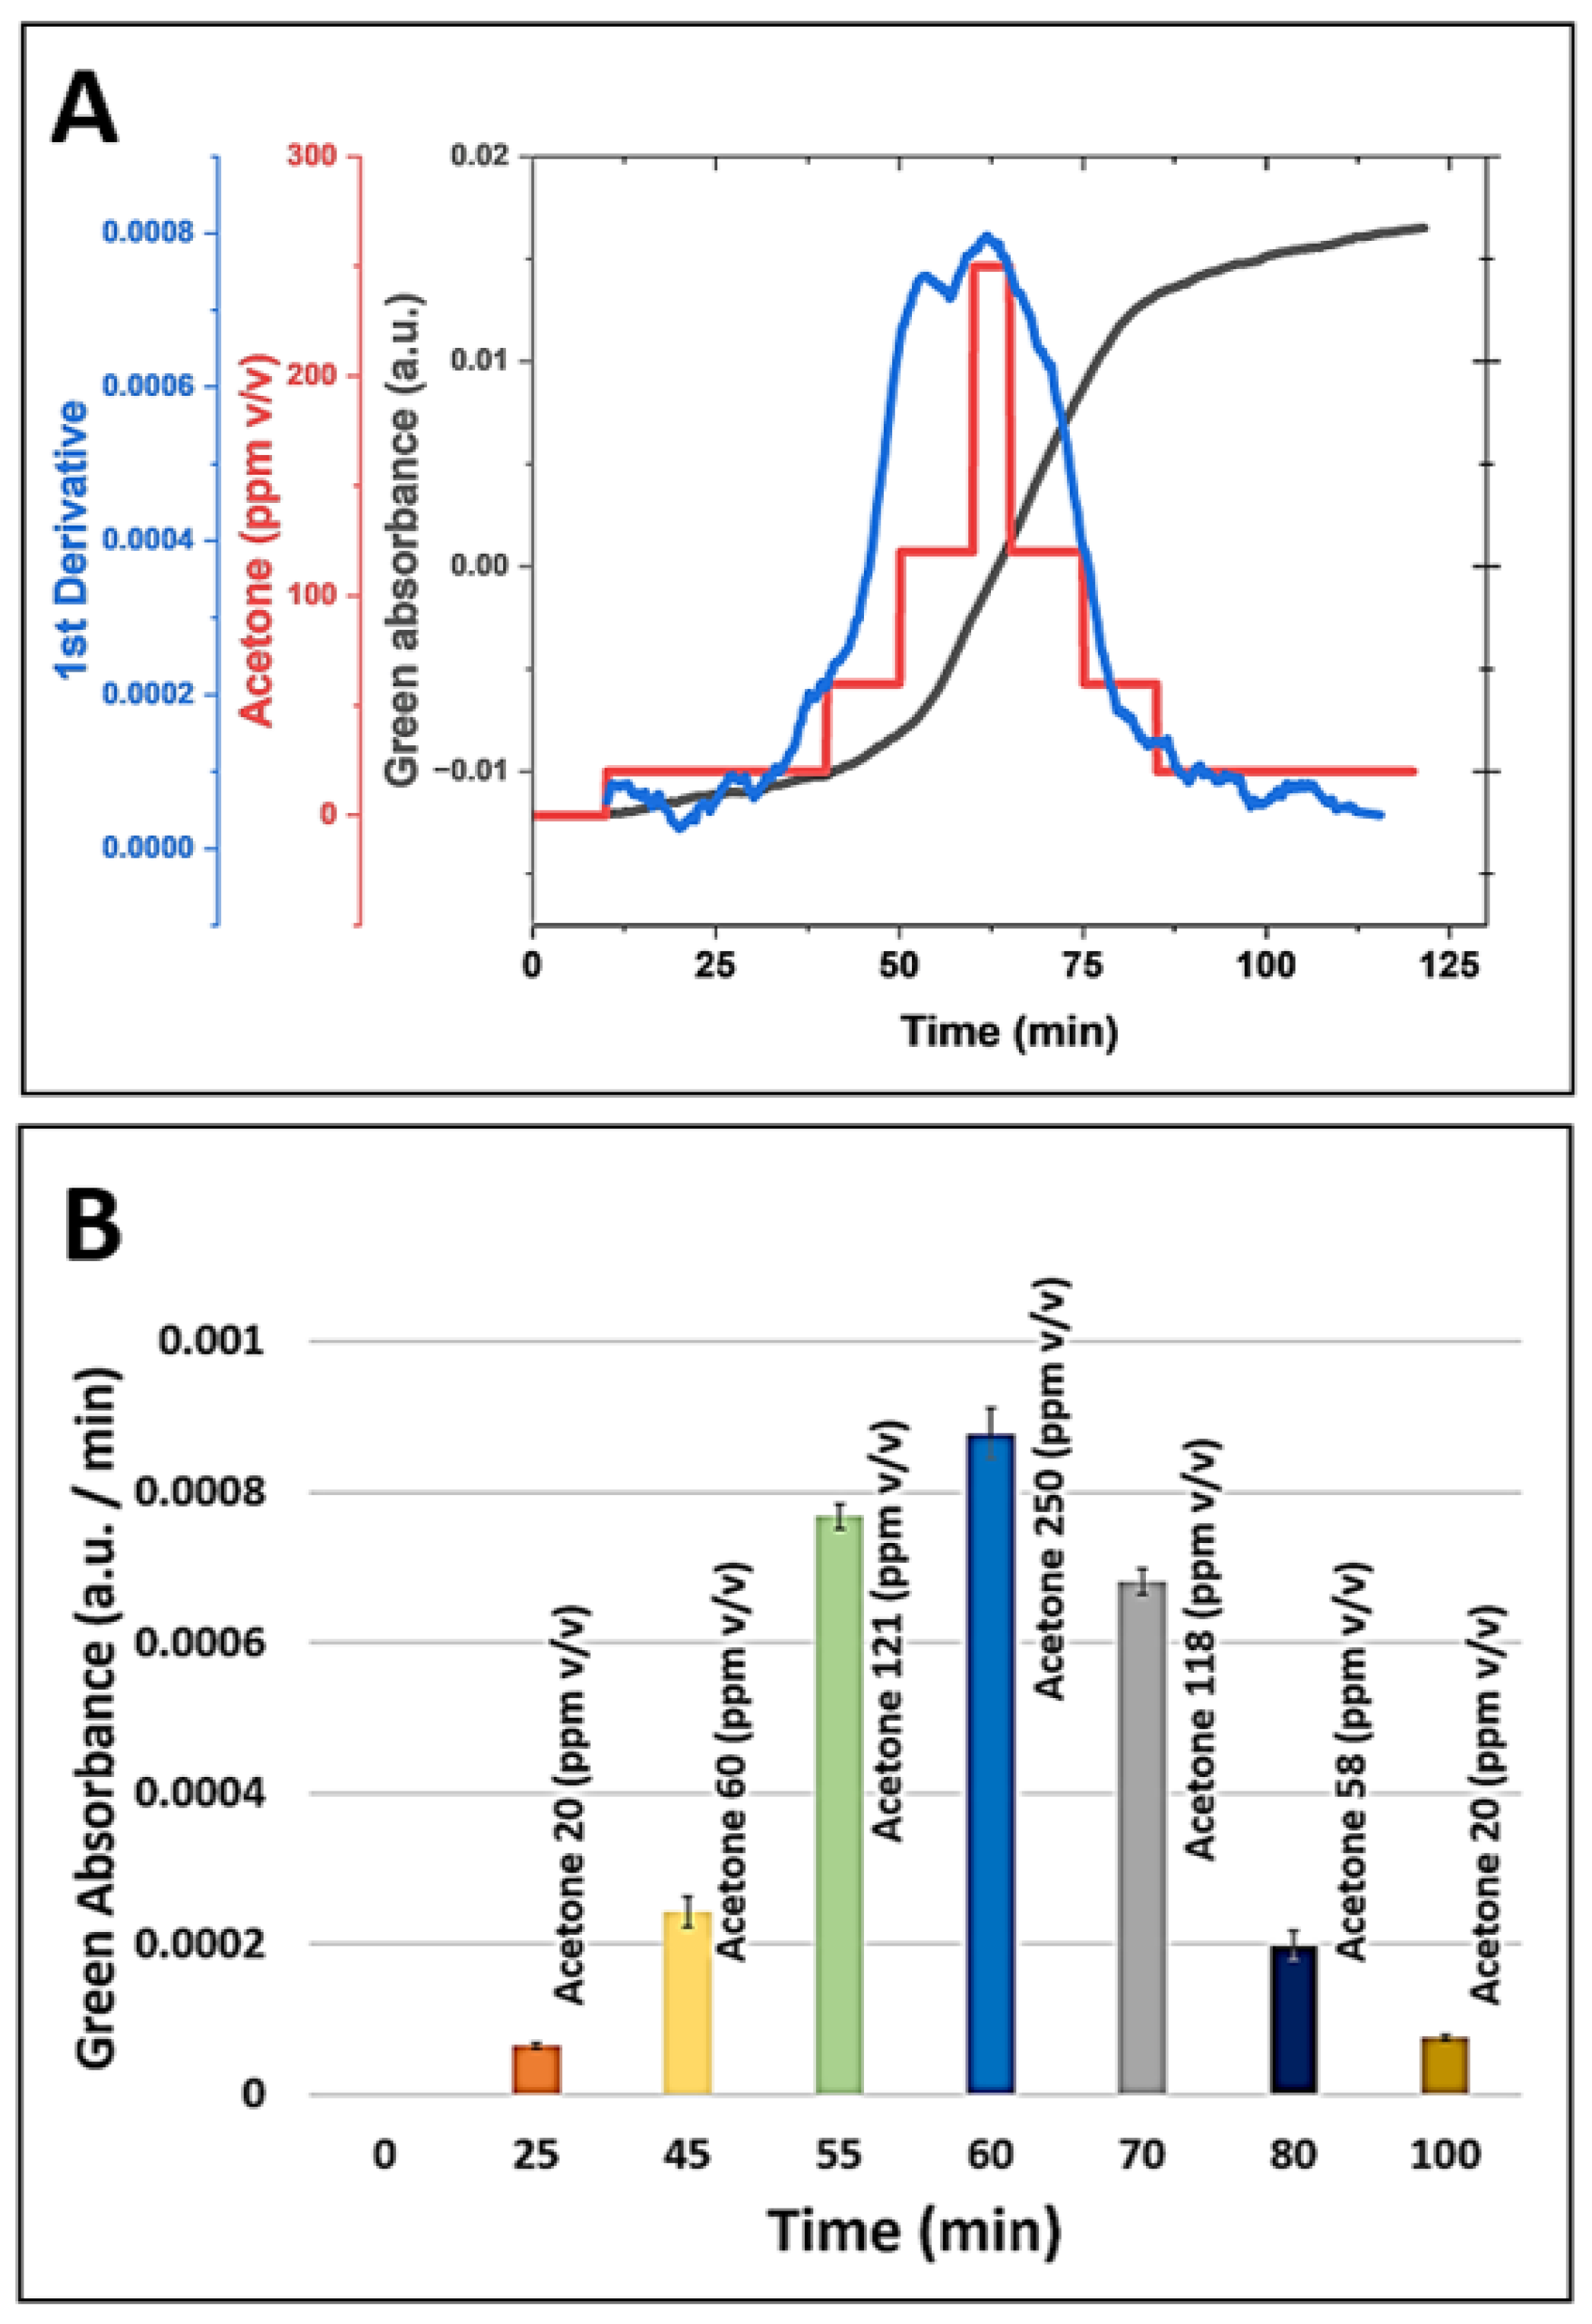
Figure 7.
Comparison of acetone concentration measurements obtained using the HA-TB microsphere-based sensor and GC-MS (gold standard method). Measurements were performed in 4% v/v CO₂ and 100% relative humidity. The solid line depicts the linear regression.
Figure 7.
Comparison of acetone concentration measurements obtained using the HA-TB microsphere-based sensor and GC-MS (gold standard method). Measurements were performed in 4% v/v CO₂ and 100% relative humidity. The solid line depicts the linear regression.
3.6. Microsphere Sensor for Continuous Acetone Monitoring in Type 1 Diabetes Patients
Finally, we evaluated the microsphere-based sensor in human subjects, including healthy (n=2) and diabetic (n=2) individuals. Figure 8 shows continuous acetone monitoring (green absorbance) in type 1 diabetic patients (green line) and healthy subjects (orange line) over time. The sensor registered a greater change in absorbance over time for the diabetic patient compared to the healthy subject. This preliminary study demonstrates the sensor's ability to discriminate acetone concentrations in type 1 diabetic patients. Further studies are underway to improve sensor sensitivity and perform a quantitative evaluation.
4. Discussion
This study introduced a novel colorimetric sensor for detecting acetone in breath and skin based on liquid-core microspheres embedded with hydroxylamine and thymol blue. We fabricated the sensors with microspheres of a mean radius of 190 ± 20 μm, polydimethylsiloxane (PDMS) shell thickness of 3 μm, and PVA coating. The sensor demonstrated high sensitivity and specificity for acetone detection, utilizing changes in the green absorbance signal. We confirmed the sensor's robust colorimetric response under realistic conditions, including exposure to 100% relative humidity and various acetone concentrations with minimal influence from other analytes, such as carbon dioxide, further underscoring the sensor’s specificity.
Using Wang et al.’s equation to model the sensor’s response, [25] we demonstrated its capability for real-time, continuous monitoring of acetone concentrations. This is particularly relevant for applications requiring non-invasive and needle-free approaches, such as skin acetone detection and breath analysis.
Moreover, a high correlation between the microsphere sensor and the established GC-MS method highlights its accuracy and reliability for breath acetone quantification. Statistical analysis showed no significant differences between the two methods, further validating the sensor's performance.
The microsphere sensor offers several distinct advantages, including lower cost, portability, and potential suitability for real-time, point-of-care applications. In conclusion, the results of this study underscore the potential of the liquid-core microsphere-based sensor as a practical, accurate, and non-invasive tool for real-time acetone detection, with significant implications for healthcare and personalized medicine.
Supplementary Materials
The following supporting information can be downloaded at www.mdpi.com/xxx/s1, Figure S1: Colorimetric acetone sensor mechanism. Figure S2: Fabrication of a capillary glass microfluidic device. Figure S3: Experimental setup for microsphere fabrication. Figure S4: Microsphere production visualized by microscopy. Figure S5: Planar sensor design. Figure S6: Sensor stability. Figure S7: Acetone derivatization reaction for GC-MS analysis.
Author Contributions
Conceptualization, O.O.P. and E.F.; methodology, O.O.P., A.H., N.A.N., M.S.C., M.L., L.D., R.E.D., E.J.J, J.E., B.S., N.Y., S.W. and E.F.; hardware and software, O.O.P., M.S.C., M.L., L.D. and E.F.; validation, O.O.P., N.A.N., R.E.D. and E.F.; formal data analysis, O.O.P., N.A.N., and R.E.D.; investigation of literature and data discussion, O.O.P., N.A.N., A.H., L.D., N.Y., S.W., D.K., and E.F.; funding resources, E.F. and D.K.; manuscript preparation, O.O.P., N.A.N., A.H., R.E.D. and E.F.; project supervision and administration, E.F. All authors have read and agreed to the published version of the manuscript.
Funding
The authors are deeply thankful to the institutions that supported this work: N.I.H.—NIBIB (R03 EB027336), A.J. and Sigismunda Palumbo Charitable Trust, Arizona WearTech Center award via Arizona Commerce Authority and Partnership for Economic Innovation (State of Arizona). Neither institution was actively involved in the study execution, planning, or publication of this article.
Institutional Review Board Statement
The study was conducted following the Declaration of Helsinki and was approved by the Institutional Review Board (or Ethics Committee) of Arizona State University: STUDY00016374.
Informed Consent Statement
Informed consent was obtained from all subjects involved in the study.
Data Availability Statement
Data are contained within the article.
Acknowledgments
The authors thank the Funding Institutions and the test participants.
Conflicts of Interest
Arizona State University owns intellectual property related to the measurement technology: U.S. Patent Application No. 20210048206. T.F. Health Corporation has an exclusive license for this patent. Erica Forzani is co-founder of T.F. Health Corporation.
Abbreviations
The following abbreviations are used in this manuscript:
| AcAc | Acetoacetate |
| B | Blue |
| BHB | Β-Hydroxybutyrate |
| CMOS | Complementary Metal Oxide Semiconductor |
| CV | Coefficient Of Variation |
| G | Green |
| GC-MS | Gas Chromatography-Mass Spectrometry |
| HA | Hydroxylamine Sulfate |
| HPLC | High-Performance Liquid Chromatography |
| LED | Light-Emitting Diode |
| PDMS | Polydimethylsiloxane |
| PET | Polyethylene Terephthalate |
| PFBHA | O-2,3,4,5,6-(Pentafluorobenzyl)Hydroxylamine Hydrochloride |
| PTFE | Polytetrafluoroethylene |
| PVA | Polyvinyl Alcohol |
| R | Red |
| SIFT -MS | Selected Ion Flow Tube Mass Spectrometry |
| TB | Thymol Blue |
References
- Zhang, K.; Ma, Y.; Luo, Y.; Song, Y.; Xiong, G.; Ma, Y.; Sun, X.; Kan, C. Metabolic diseases and healthy aging: identifying environmental and behavioral risk factors and promoting public health. Frontiers in Public Health 2023, 11, 1253506. [Google Scholar] [CrossRef] [PubMed]
- Bovolini, A.; Garcia, J.; Andrade, M.A.; Duarte, J.A. Metabolic syndrome pathophysiology and predisposing factors. International Journal of Sports Medicine 2021, 42, 199–214. [Google Scholar] [CrossRef] [PubMed]
- Chen, Y.; Michalak, M.; Agellon, L.B. Importance of Nutrients and Nutrient Metabolism on Human Health. The Yale Journal of Biology and Medicine 2018, 91, 95–103. [Google Scholar]
- Agrawal, R.; Ansari, M.A.; Anand, R.S.; Sneha, S.; Mehrotra, R. (Eds.) Computational Intelligence in Healthcare Applications; Academic Press, 2022. [Google Scholar]
- Spriet, L.L. New insights into the interaction of carbohydrate and fat metabolism during exercise. Sports Medicine 2014, 44, 87–96. [Google Scholar] [CrossRef]
- Alkedeh, O.; Priefer, R. The Ketogenic Diet: Breath Acetone Sensing Technology. Biosensors 2021, 11, 26–36. [Google Scholar] [CrossRef]
- Smink, F.R.; Van Hoeken, D.; Hoek, H.W. Epidemiology of Eating Disorders: Incidence, Prevalence and Mortality Rates. Current Psychiatry Reports 2012, 14, 406–414. [Google Scholar] [CrossRef]
- Dressler, A.; Reithofer, E.; Trimmel-Schwahofer, P.; Klebermasz, K.; Prayer, D.; Kasprian, G.; Rami, B.; Schober, E.; Feucht, M. Type 1 diabetes and epilepsy: efficacy and safety of the ketogenic diet. Epilepsia 2010, 51, 1086–1089. [Google Scholar] [CrossRef]
- LeCheminant, J.D.; Smith, B.K.; Westman, E.C.; Vernon, M.C.; Donnelly, J.E. Comparison of a reduced carbohydrate and reduced fat diet for LDL, HDL, and VLDL subclasses during 9-months of weight maintenance subsequent to weight loss. Lipids in Health and Disease 2010, 9, 54. [Google Scholar] [CrossRef] [PubMed]
- Schmidt, M.; Pfetzer, N.; Schwab, M.; Strauss, I.; Kämmerer, U. Effects of a ketogenic diet on the quality of life in 16 patients with advanced cancer: A pilot trial. Nutrition & Metabolism 2011, 8, 1–13. [Google Scholar] [CrossRef]
- Poplawski, M.M.; Mastaitis, J.W.; Isoda, F.; Grosjean, F.; Zheng, F.; Mobbs, C.V. Reversal of diabetic nephropathy by a ketogenic diet. PloS one 2011, 6, e18604. [Google Scholar] [CrossRef]
- Henderson, S.T. Ketone bodies as a therapeutic for Alzheimer’s disease. Neurotherapeutics 2008, 5, 470–480. [Google Scholar] [CrossRef]
- Brega, A.; Villa, P.; Quadrini, G.; Quadri, A.; Lucarelli, C. High-performance liquid chromatographic determination of acetone in blood and urine in the clinical diagnostic laboratory. Journal of Chromatography A 1991, 553, 249–254. [Google Scholar] [CrossRef]
- Storer, M.; Dummer, J.; Lunt, H.; Scotter, J.; McCartin, F.; Cook, J.; Swanney, M.; Kendall, D.; Logan, F.; Epton, M. Measurement of breath acetone concentrations by selected ion flow tube mass spectrometry in type 2 diabetes. Journal of Breath Research 2011, 5, 046011. [Google Scholar] [CrossRef]
- Gibson, A.A.; Eroglu, E.I.; Rooney, K.; Harper, C.; McClintock, S.; Franklin, J.; Markovic, T.P.; Seimon, R.V.; Sainsbury, A. Urine dipsticks are not accurate for detecting mild ketosis during a severely energy restricted diet. Obesity Science & Practice 2020, 6, 544–551. [Google Scholar] [CrossRef]
- Brooke, J.; Stiell, M.; Ojo, O. Evaluation of the accuracy of capillary hydroxybutyrate measurement compared with other measurements in the diagnosis of diabetic ketoacidosis: a systematic review. International Journal of Environmental Research and Public Health 2016, 13, 837. [Google Scholar] [CrossRef] [PubMed]
- Amiri, V.; Roshan, H.; Mirzaei, A.; Neri, G.; Ayesh, A.I. Nanostructured metal oxide-based acetone gas sensors: A review. Sensors 2020, 20, 3096. [Google Scholar] [CrossRef] [PubMed]
- Ito, K.; Kawamura, N.; Suzuki, Y.; Maruo, Y.Y. Colorimetric detection of gaseous acetone based on a reaction between acetone and 4-nitrophenylhydrazine in porous glass. Microchemical Journal 2020, 159, 105428. [Google Scholar] [CrossRef]
- Yu, J.; Wang, D.; Tipparaju, V.V.; Jung, W.; Xian, X. Detection of transdermal biomarkers using gradient-based colorimetric array sensor. Biosensors and Bioelectronics 2022, 195, 113650. [Google Scholar] [CrossRef]
- Wang, D.I.; Zhang, F.; Prabhakar, A.; Qin, X.; Forzani, E.S.; Tao, N. Colorimetric Sensor for Online Accurate Detection of Breath Acetone. ACS Sensors 2021, 6, 450–453. [Google Scholar] [CrossRef]
- Park, J.J.; Lee, J.; Kim, G.H.; Kim, J.H.; Lee, H.S.; Lee, W. Breath visualization: Colorimetric detection of acetone gas using ion-pairing dyes based on hollow silica particles. Sensors and Actuators B: Chemical 2024, 135373. [Google Scholar] [CrossRef]
- Utada, A.S.; Lorenceau, E.; Link, D.R.; Kaplan, P.D.; Stone, H.A.; Weitz, D.A. Monodisperse Double Emulsions Generated from a Microcapillary Device. Science 2005, 308, 537–541. [Google Scholar] [CrossRef] [PubMed]
- Do Nascimento, D.F.; Avendaño, J.A.; Mehl, A.; Moura, M.J.; Carvalho, M.S.; Duncanson, W.J. Flow of tunable elastic microcapsules through constrictions. Scientific Reports 2017, 7, 11898. [Google Scholar] [CrossRef] [PubMed]
- Osorio Perez, O.; Nguyen, N.A.; Hendricks, A.; Victor, S.; Mora, S.J.; Yu, N.; Xian, X.; Wang, S.; Kulick, D.; Forzani, E. A Novel Acetone Sensor for Body Fluids. Biosensors 2024, 14, 1–4. [Google Scholar] [CrossRef] [PubMed]
- Wang, R.; Prabhakar, A.; Iglesias, R.A.; Xian, X.; Shan, X.; Tsow, F.; Forzani, E.S.; Tao, N. A microfluidic-colorimetric sensor for continuous monitoring of reactive environmental chemicals. IEEE Sensors Journal 2011, 12, 1529–1535. [Google Scholar] [CrossRef]
Figure 1.
Fabrication of liquid-core microspheres, visualized through: (a) Schematic representation of the process, showing encapsulation of the liquid sensing probe within a PDMS shell; and (b) Bright-field micrographs of microsphere during production (left) and at the final stage (right). .
Figure 1.
Fabrication of liquid-core microspheres, visualized through: (a) Schematic representation of the process, showing encapsulation of the liquid sensing probe within a PDMS shell; and (b) Bright-field micrographs of microsphere during production (left) and at the final stage (right). .
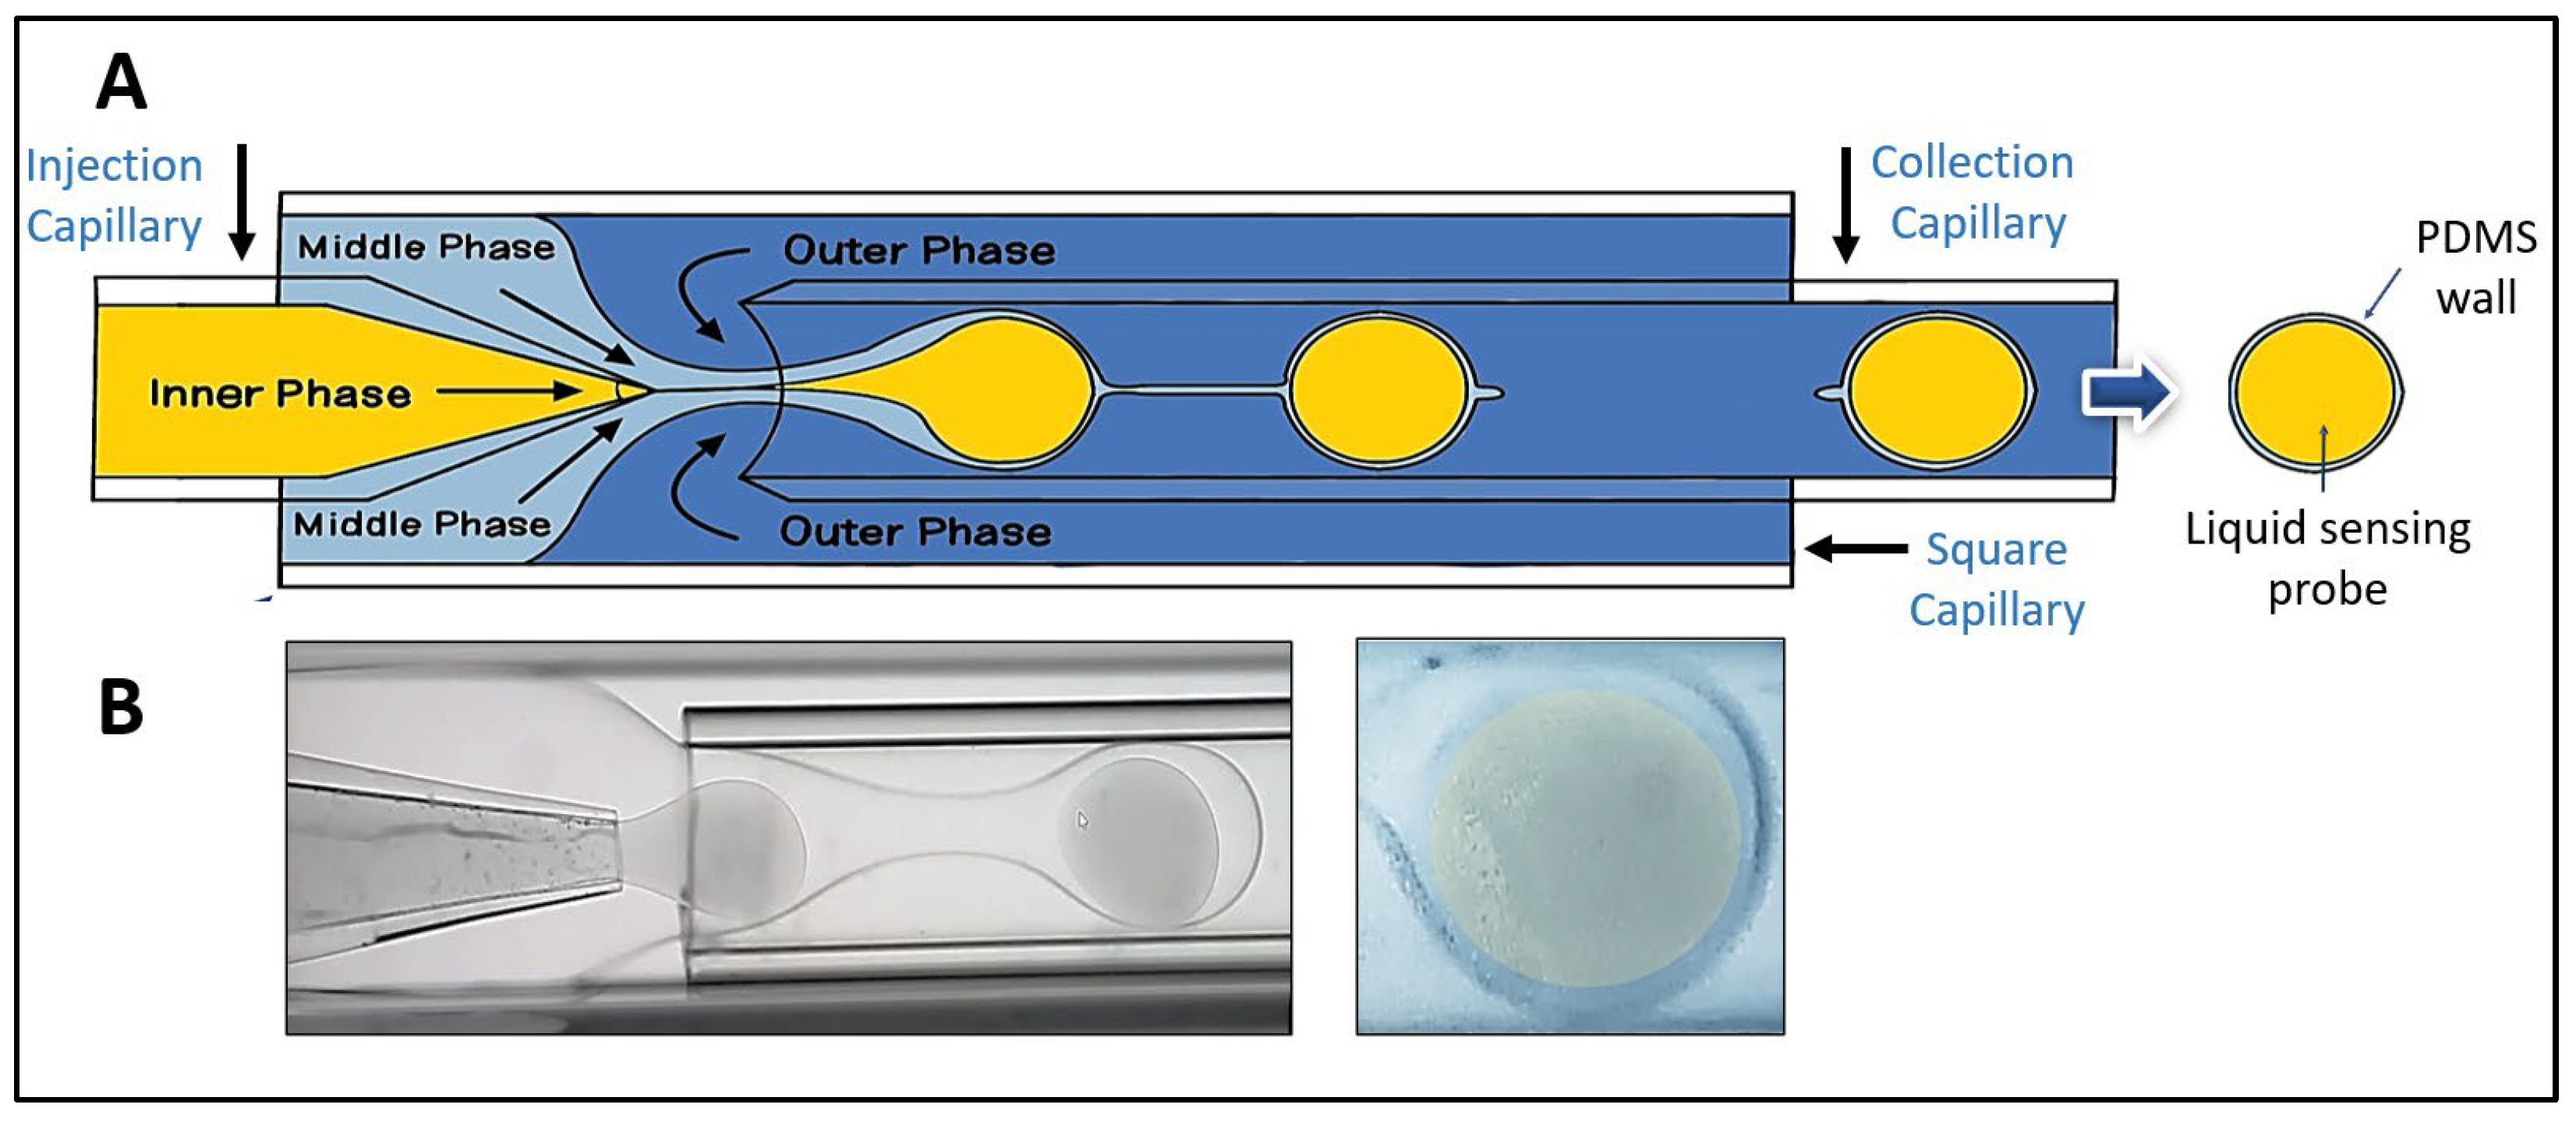
Figure 2.
Sensors design: (a) Microsphere-based sensors were deposited onto a 4.00 mm × 4.00 mm transparent, micro-structured PET well and stabilized by a residual PVA layer. (b) A planar sensor was used for comparative time-response evaluation before and after acetone exposure. The planar sensor was made of a 3-D printed mold and PDMS to produce squared wells. Squared Rayon paper was placed in each well, and the liquid sensing probe solution (HA-TB) was added to three wells, with TB solution added to the bottom left well as a control.
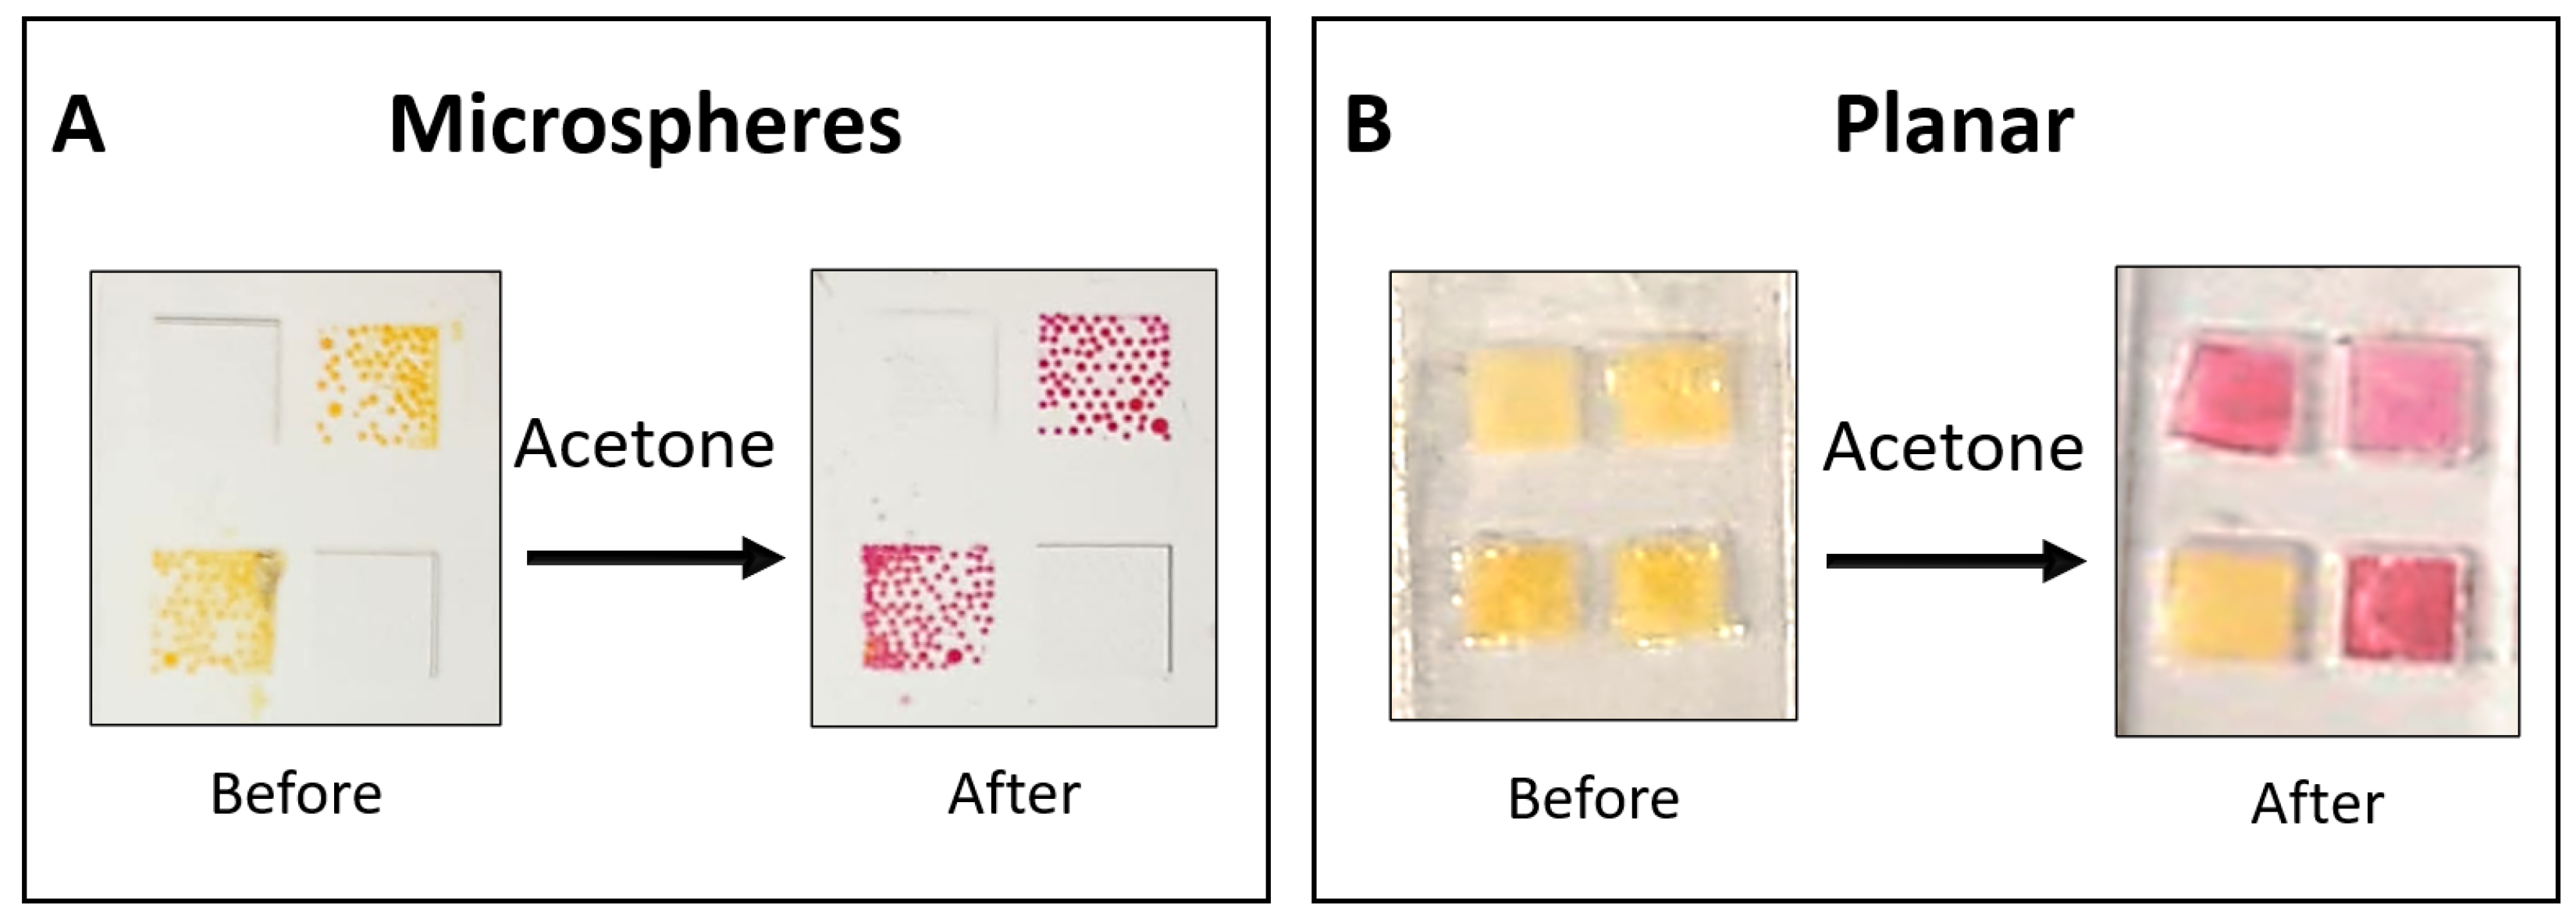
Figure 3.
(a) Comparative response of microsphere and planar sensors to acetone. Changes in red, green, and blue absorbance were monitored upon exposure to ultra-pure nitrogen followed by injection of 300 ppm acetone (indicated by the black arrow). Data were obtained using a white LED, CMOS detector, and Python imaging acquisition software, performing deconvolution of the red, green, and blue light components. (b) Molecular structure of acetone. (c, d) Schematic representation of the interaction (black wavy arrows) between gas acetone molecules and the microsphere-based sensor (c) and the planar sensor (d). The larger surface area of the microsphere-based sensor results in a greater number of interactions with acetone molecules.
imaging acquisition software, performing deconvolution of the red, green, and blue light components. (b) Molecular structure of acetone. (c, d) Schematic representation of the interaction (black wavy arrows) between gas acetone molecules and the microsphere-based sensor (c) and the planar sensor (d). The larger surface area of the microsphere-based sensor results in a greater number of interactions with acetone molecules.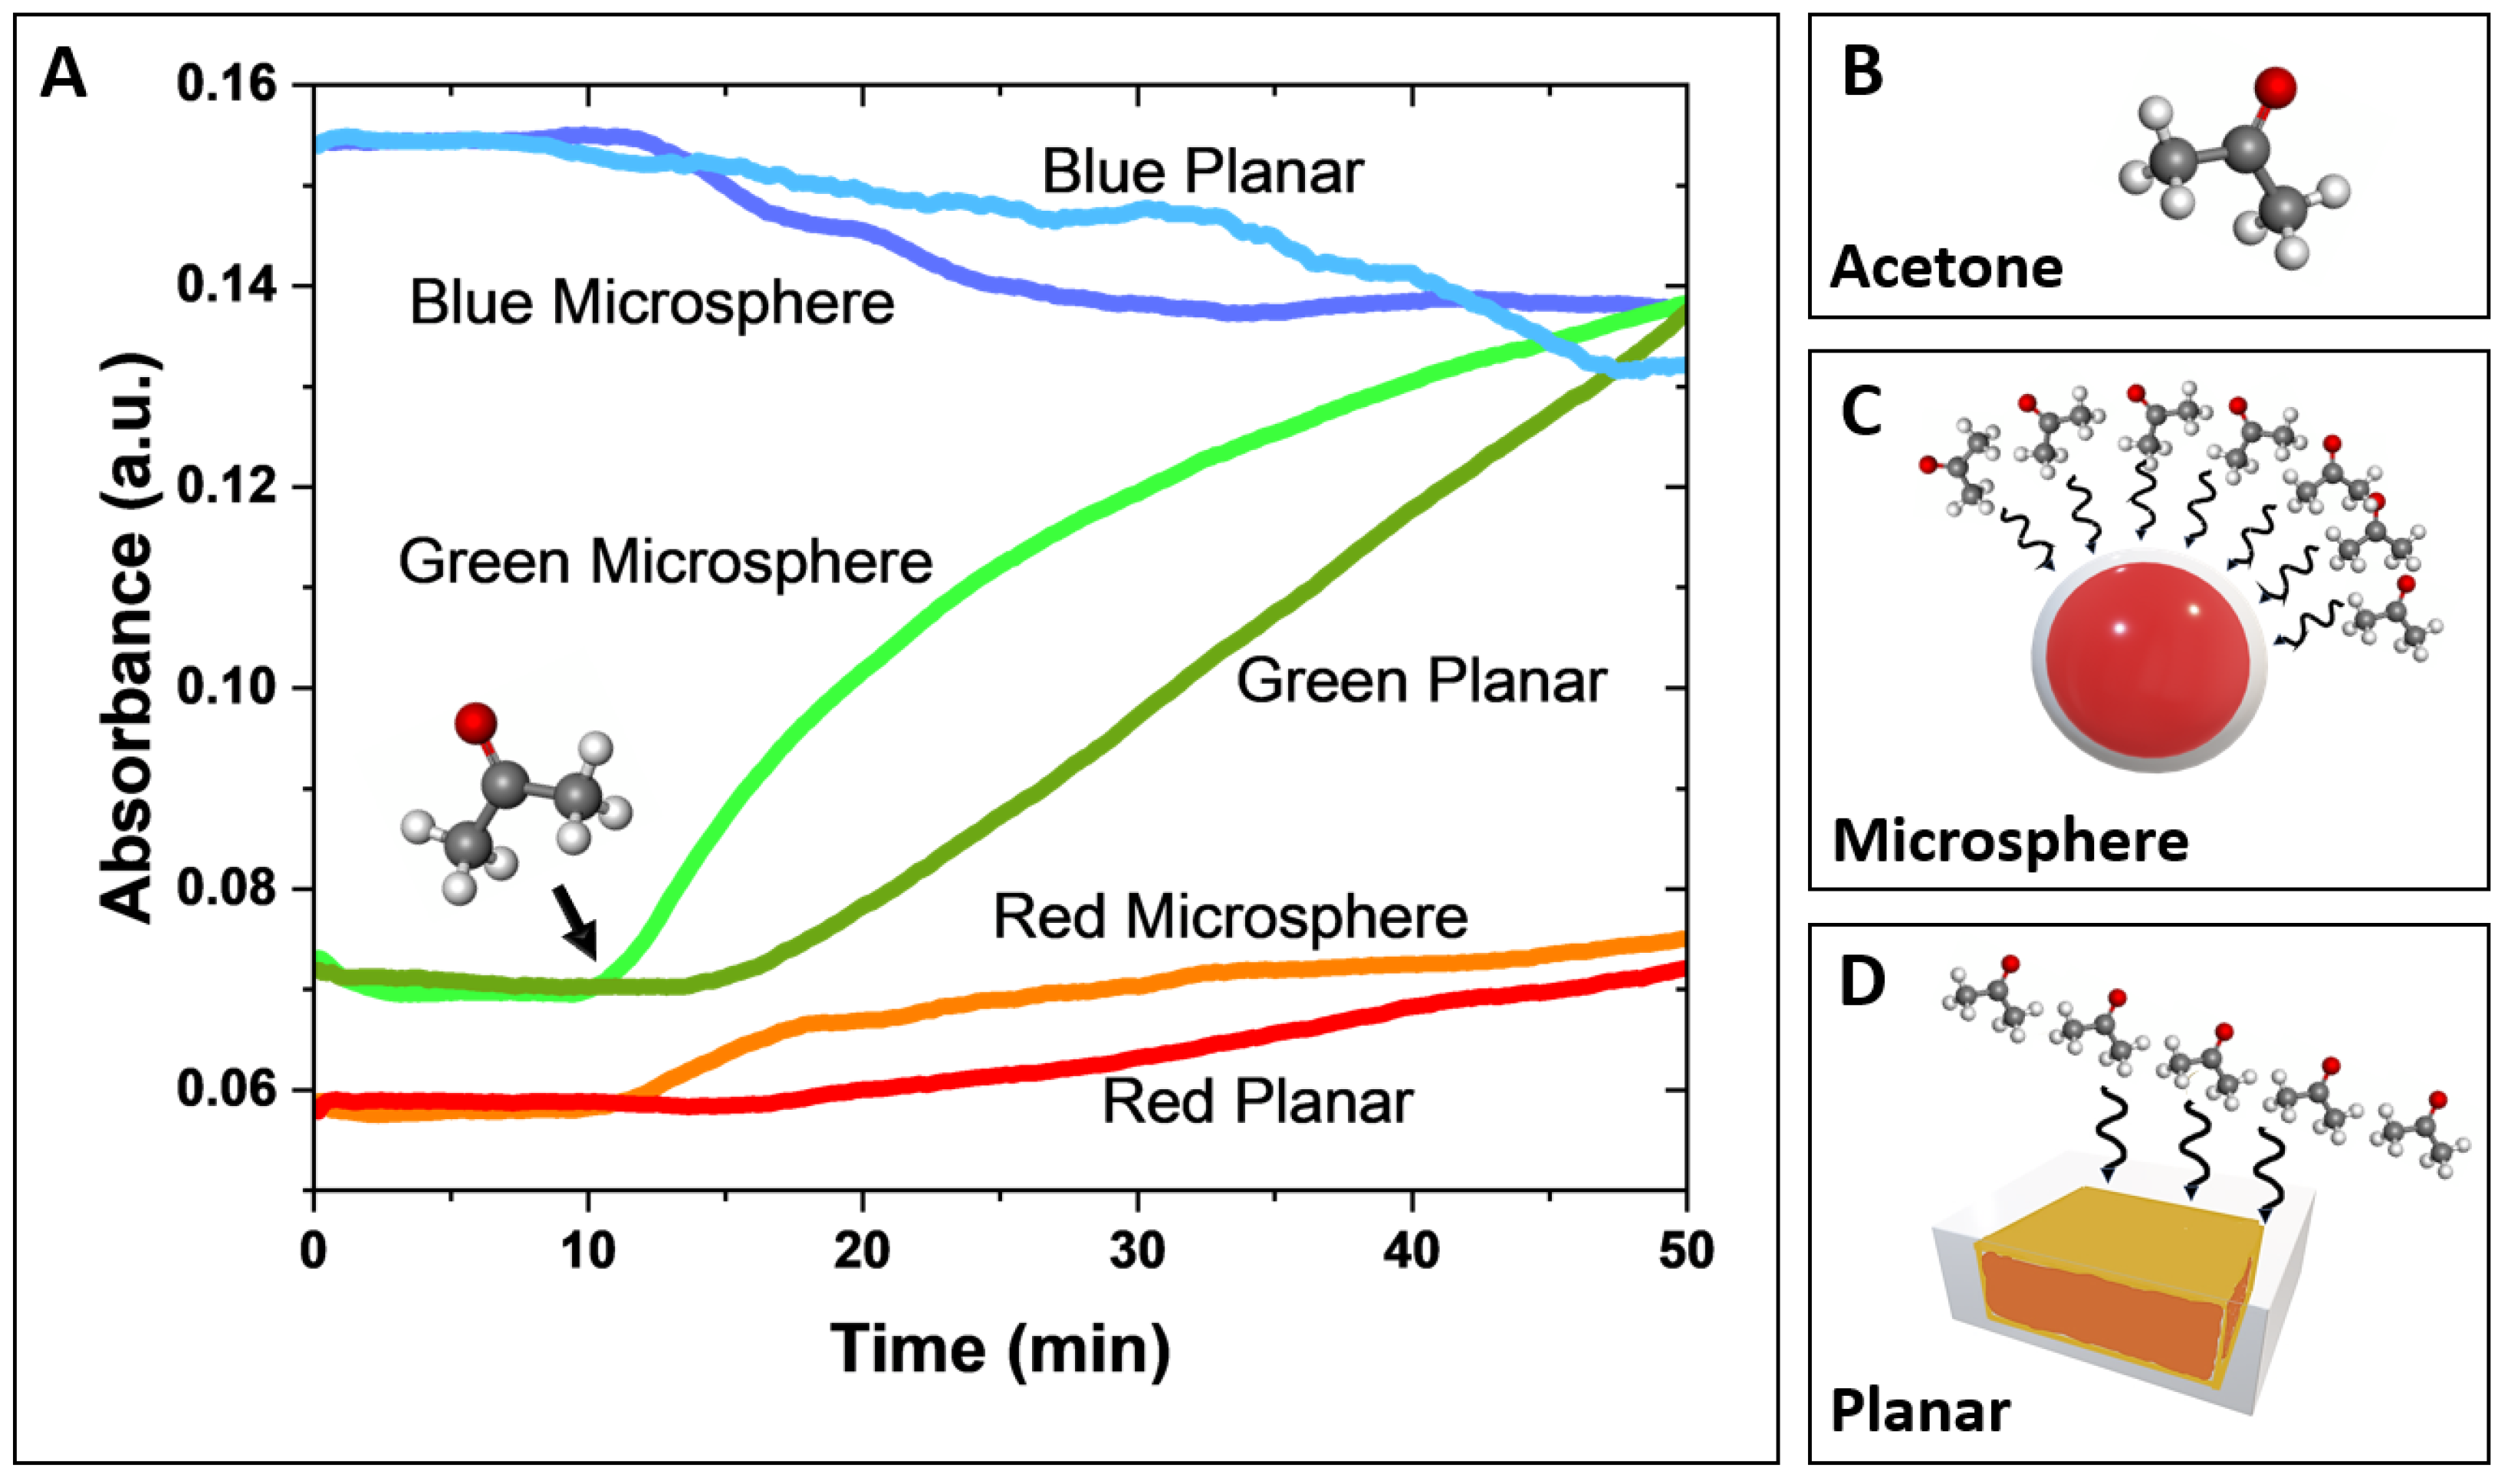
Figure 4.
(a) Size distribution (microsphere count vs. radius) for microspheres fabricated under conditions II and I (see Table 1). (b) Micrograph of representative microspheres, highlighting the encapsulated liquid sensing probe. Inset: Magnified view showing the average PDMS membrane thickness. (c) Comparison of green absorbance sensitivity for microsphere sensors fabricated under conditions I and II. .
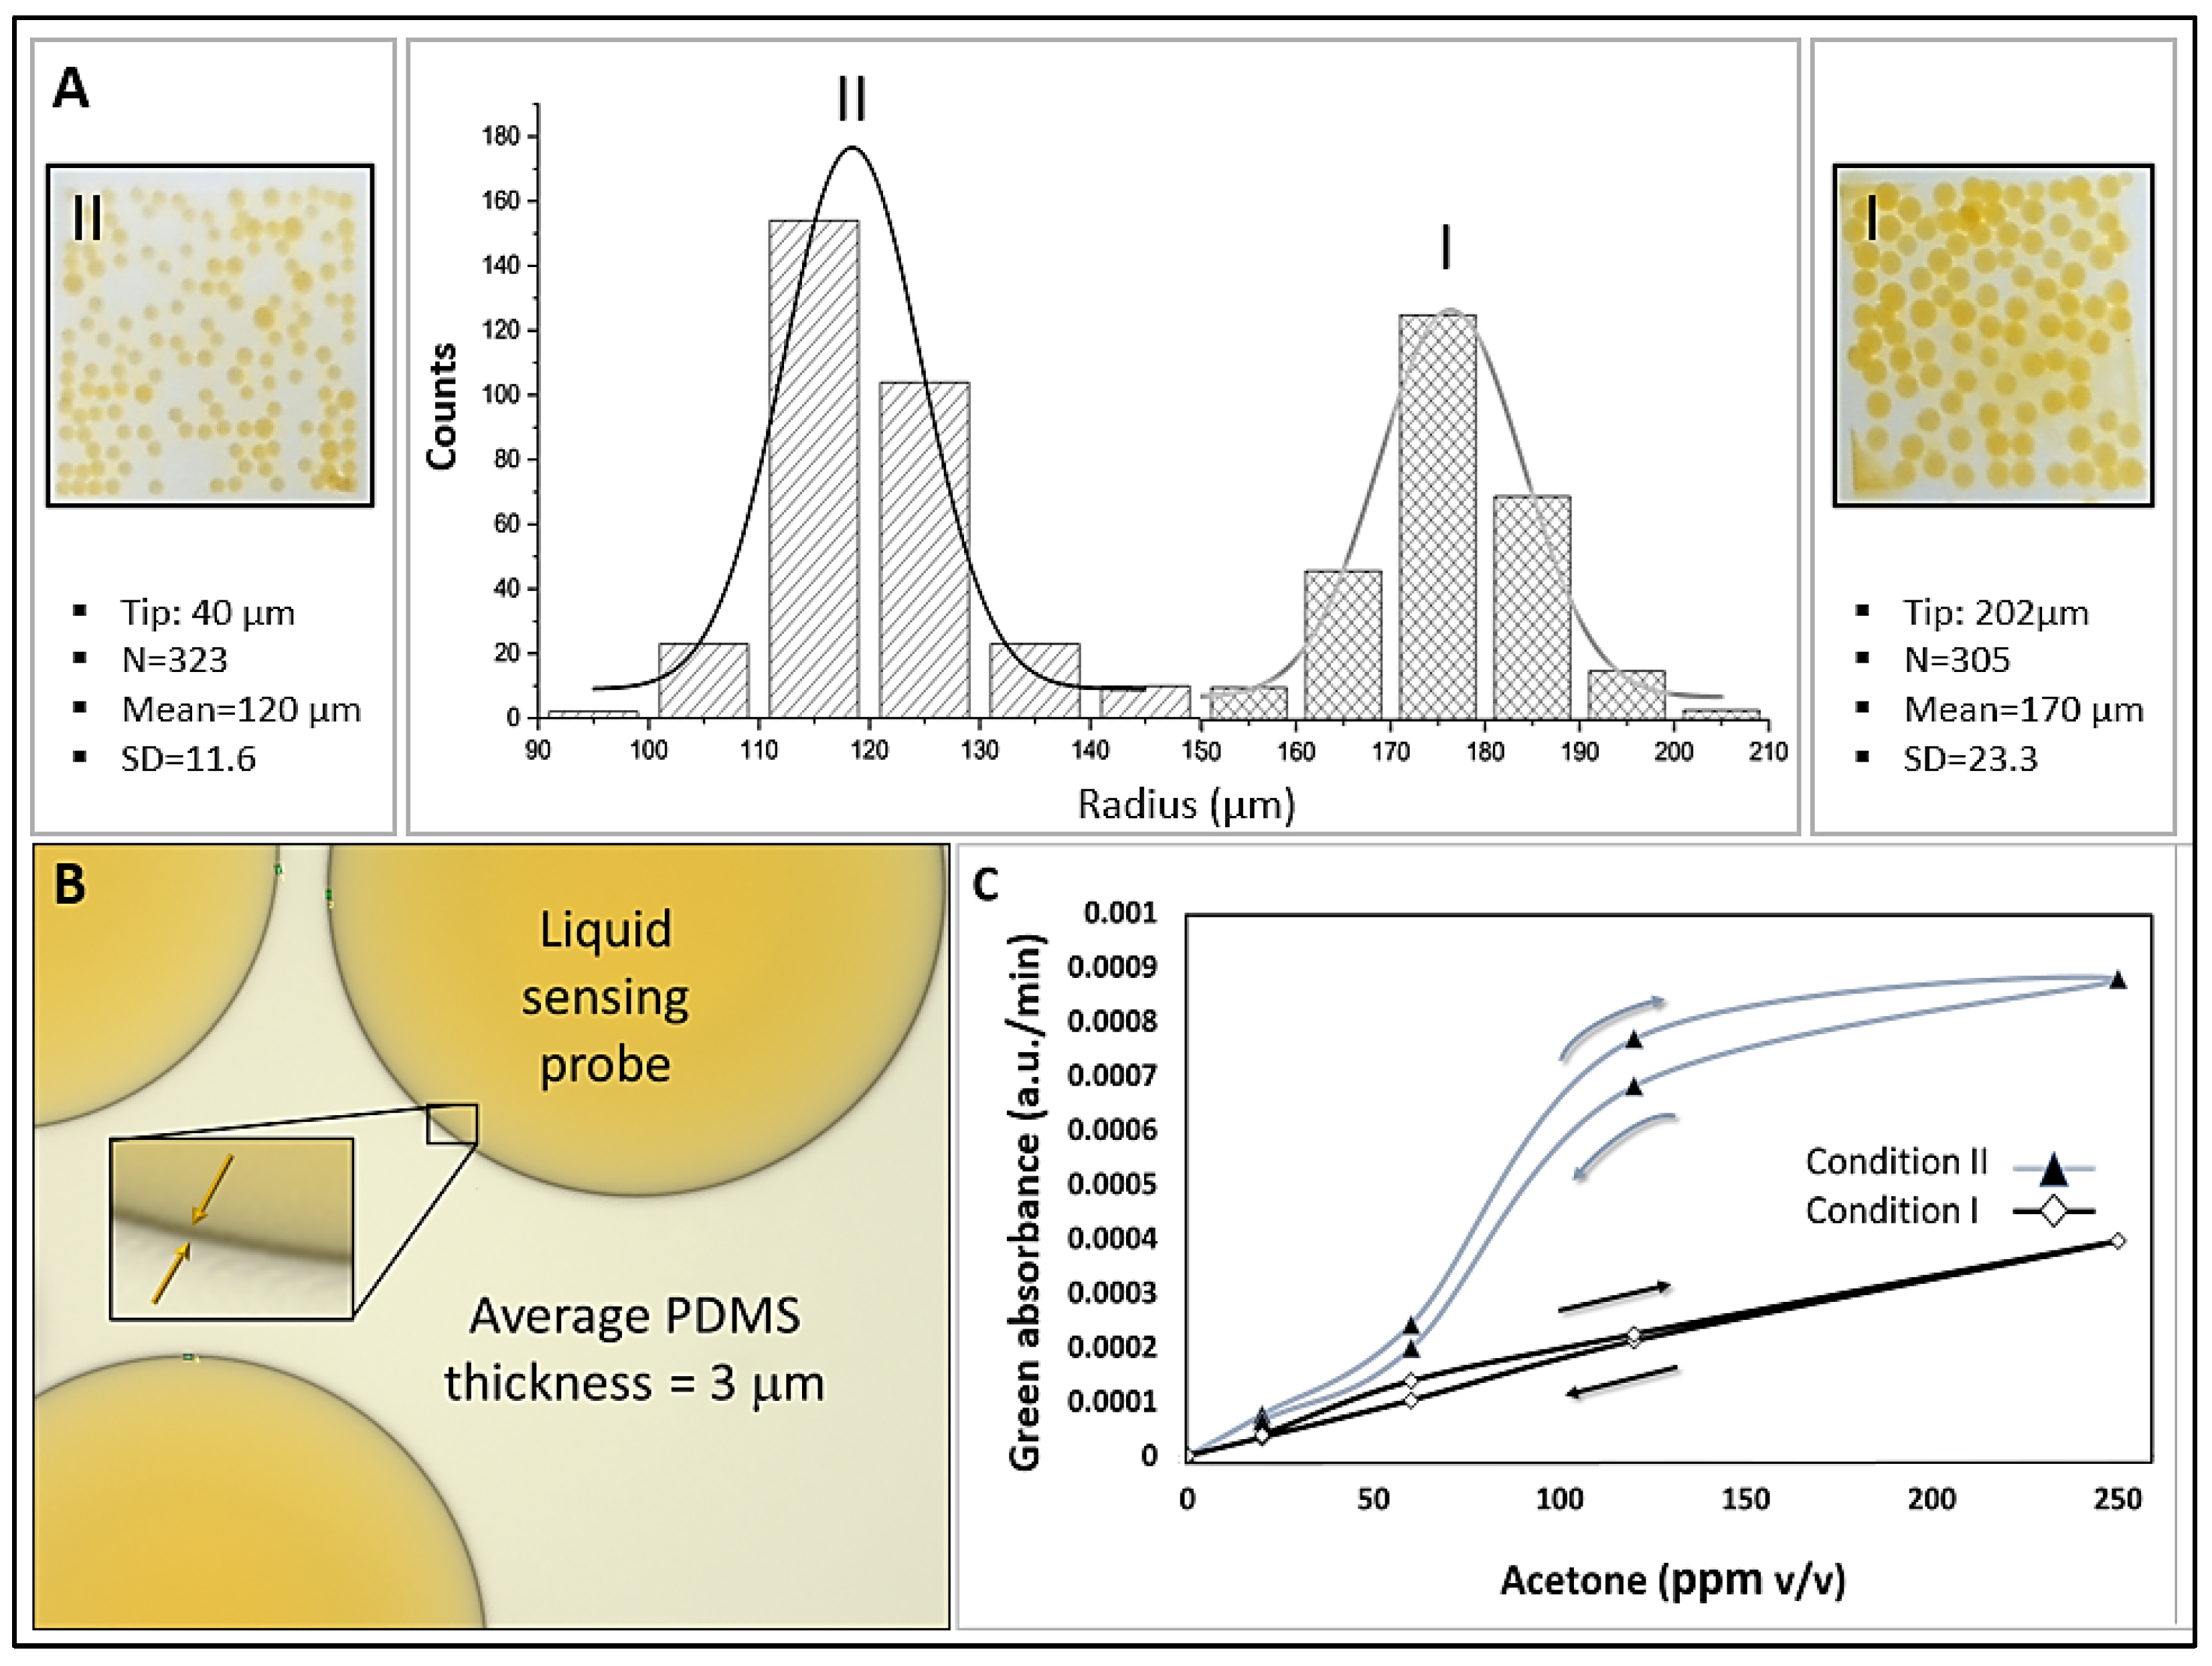
Figure 5.
(a) Schematic representation of the PTE sensor cartridge, detailing the precise location of the HA-TB and TB microsphere-based sensors within the cartridge. (b) Comparative response of HA-TB and TB microsphere sensors (n=2). Green absorbance changes (a.u./min) were measured for varying concentrations of acetone (C3H6O) (0–40 ppm v/v) and carbon dioxide (CO2) (0–4% v/v) in a controlled environment of 100% relative humidity. The data are presented as the rate of change in green absorbance (a.u./min), which corresponds to the slope of the raw sensor signal. .
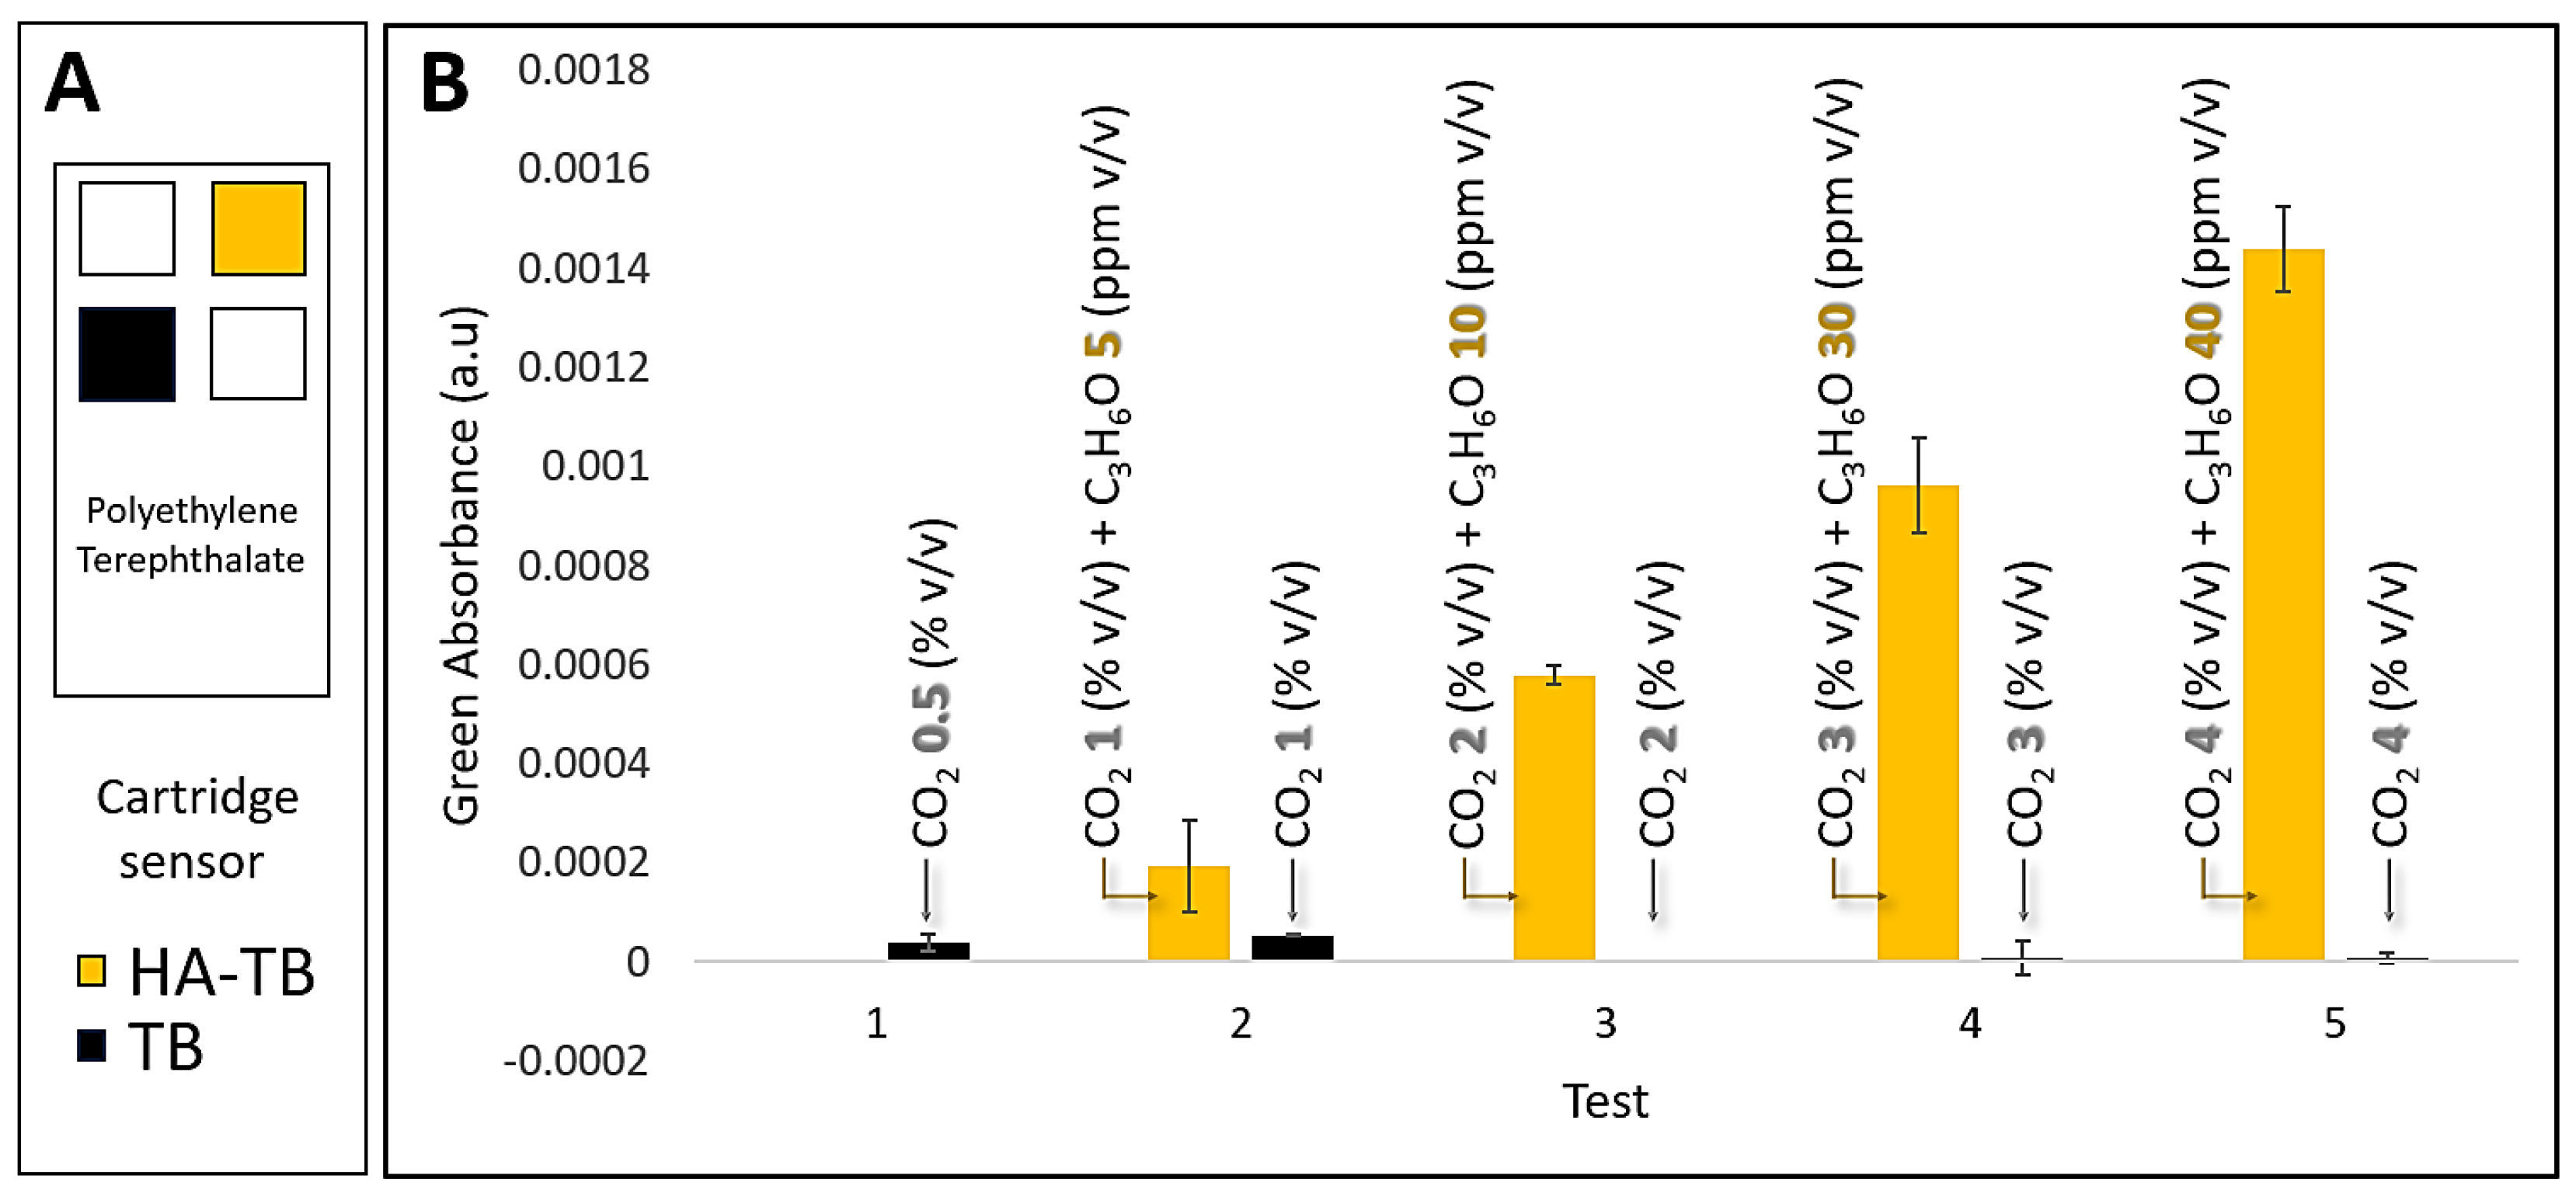
Figure 8.
Continuous acetone monitoring (green absorbance acquisition) in a type 1 diabetic patient (green line) and a healthy patient (orange line) over time.
Figure 8.
Continuous acetone monitoring (green absorbance acquisition) in a type 1 diabetic patient (green line) and a healthy patient (orange line) over time.
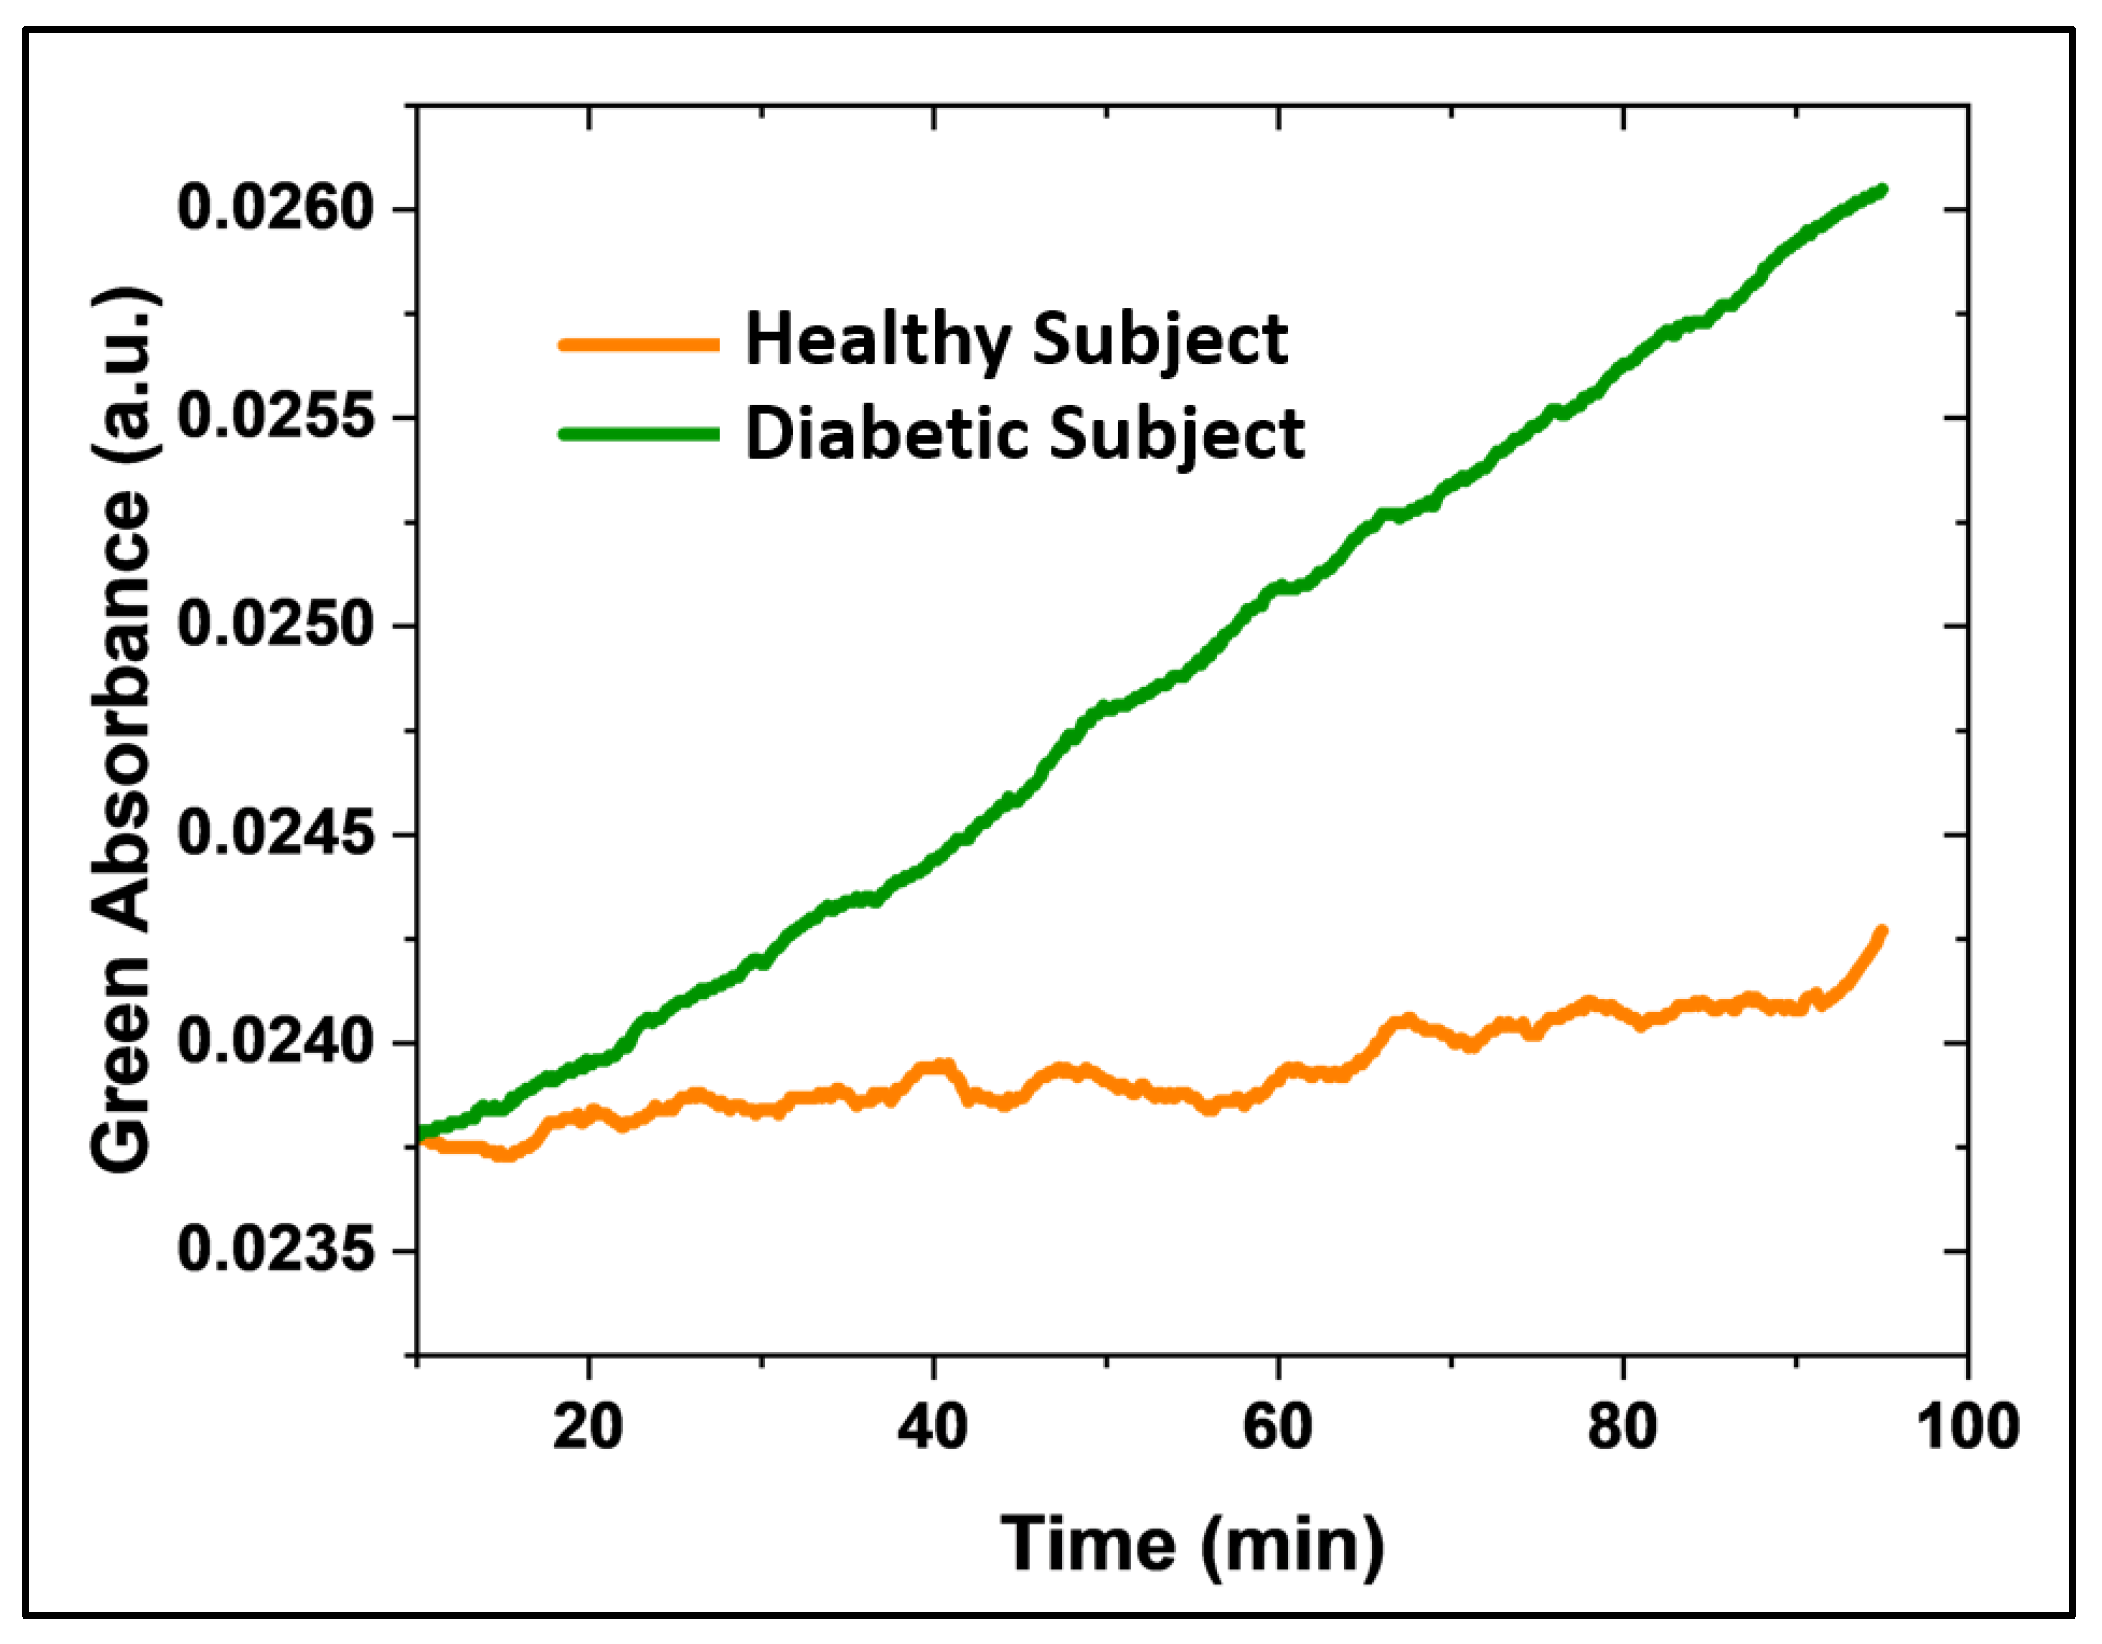

Table 1.
Capsule Dimensions under Varying Fabrication Conditions.
| Condition |
Tapered tip diameter (µm) |
Liquid phase flowrate (µL h-1) |
Capsule diameter (µm) |
Capsule membrane thickness (µm) |
||
| Outer | Middle | Inner | ||||
| I | 202 | 300 | 100 | 70 | 340.8 | 3 |
| II | 40 | 1000 | 250 | 60 | 241.8 | 3 |
Disclaimer/Publisher’s Note: The statements, opinions and data contained in all publications are solely those of the individual author(s) and contributor(s) and not of MDPI and/or the editor(s). MDPI and/or the editor(s) disclaim responsibility for any injury to people or property resulting from any ideas, methods, instructions or products referred to in the content. |
© 2025 by the authors. Licensee MDPI, Basel, Switzerland. This article is an open access article distributed under the terms and conditions of the Creative Commons Attribution (CC BY) license (http://creativecommons.org/licenses/by/4.0/).
Copyright: This open access article is published under a Creative Commons CC BY 4.0 license, which permit the free download, distribution, and reuse, provided that the author and preprint are cited in any reuse.


