
Submitted:
10 March 2025
Posted:
10 March 2025
You are already at the latest version
Abstract
Background: Upper tract urothelial carcinoma (UTUC) often presents with aggressive behaviour, challenging early diagnosis and precise risk stratification. This study explores whether radiomic features extracted from perirenal fat (PRF) around the tumour provide complementary diagnostic and prognostic value beyond conventional tumour-based radiomics. Methods: A retrospective cohort of 103 UTUC patients undergoing radical nephroureterectomy was analysed. Tumour re-gions of interest (ROIs) and concentric PRF expansions (10–30 mm) were segmented from arteri-al-phase CT scans. Radiomic features were extracted using PyRadiomics, filtered by correlation and intraclass correlation coefficients, and integrated with clinical variables (e.g., age, BMI, mul-tifocality). Multiple machines learning models, including MLPClassifier and CatBoost, were evaluated via repeated cross-validation; performance was assessed using area under the ROC curve (AUC), sensitivity, specificity, F1-score, and DeLong tests. Results: The best tumour-grade model (AUC = 0.961) combined tumour and 10 mm PRF features, outperforming PRF-only (AUC = 0.900) and tumour-only (AUC = 0.934) approaches. For tumour stage, a combined model (tumour + 15 mm PRF) achieved AUC = 0.852, surpassing PRF-only configurations (AUC range, 0.711–0.778). DeLong tests indicated that tumour + PRF significantly exceeds PRF-only models, but differences from strong tumour-only baselines were not always significant. Conclusion: PRF ra-diomics contributes complementary predictive information for UTUC grade and stage. These findings underscore the potential of combining tumour and PRF features to refine prognostic models, ultimately supporting more tailored clinical management in UTUC.
Keywords:
CT urogram
; machine learning
; radiomics
; texture analysis
; Perirenal Fat
1. Introduction
Upper tract urothelial carcinoma (UTUC) is a rare but aggressive malignancy that accounts for approximately 5-10% of all urothelial cancers [1]. Despite its low incidence, UTUC has a high potential for recurrence and progression, with a 5-year survival rate of less than 50% for advanced-stage disease [2,3]. The clinical management of UTUC remains challenging due to the difficulties in early diagnosis, accurate staging, and predicting treatment response [4,5].
Current diagnostic methods for UTUC, such as urine cytology and ureteroscopic biopsy, have limitations in terms of sensitivity and specificity [6,7]. Imaging techniques, particularly computed tomography (CT) and magnetic resonance imaging (MRI), play a crucial role in the evaluation of UTUC [8]. However, conventional imaging analysis relies on subjective interpretation and may not fully capture the complex tumour characteristics and microenvironment [9,10].
A previous study by our group (Alqahtani et al., 2024) demonstrated the potential of radiomics-based machine learning approaches in predicting tumour histological grade and Tumour, Node, Metastases (TNM) stage in UTUC using features extracted from the tumour region of interest (ROI) itself. The study achieved high accuracy in predicting tumour grade (AUC 0.94) and moderate accuracy for tumour stage (AUC 0.75) [11]. Building upon these findings, the current study aims to explore the diagnostic and prognostic value of the PRF surrounding the tumour. This approach could potentially provide complementary information to direct tumour analysis, offering a more comprehensive assessment of UTUC.
In recent years, there has been growing interest in the role of the tumour microenvironment (TME) in cancer progression and treatment response [12]. The TME, which includes the surrounding blood vessels, immune cells, fibroblasts, and adipose tissue, has been shown to influence tumour growth, invasion, and metastasis [13,14]. In particular, the PRF has emerged as a critical component, particularly in diagnosing and prognosticating UTUC [15]. Studies indicate that the characteristics of PRF, such as thickness and infiltration by the tumour, can provide valuable prognostic and diagnostic information in upper urinary tract cancer [15,16,17,18,19].
Radiomics, an emerging field that involves the extraction of quantitative features from medical images, has shown promise in capturing the heterogeneity and complexity of the TME [20,21,22]. By applying advanced image analysis techniques and machine learning algorithms, radiomics has the potential to provide non-invasive biomarkers for diagnosis, prognosis, and treatment response prediction [9].
Given the similarities between RCC and UTUC in terms of their anatomical location and the potential influence of the PRF on tumour behaviour, the study hypothesizes that radiomics analysis of the PRF could provide valuable diagnostic and prognostic information in UTUC. This study aims to investigate the relationship between PRF radiomics features and key clinical outcomes in UTUC, including tumour stage and grade. By leveraging advanced imaging analytics and machine learning techniques, we seek to develop a novel, non-invasive approach to improve risk stratification and personalized treatment planning for patients with UTUC.
2. Materials and Methods
2.1. Adherence to Guidelines and Ethical Considerations
This study adheres to the CheckList for EvaluAtion of Radiomics Research (CLEAR) guidelines and has received ethical approval from NHS Tayside (ref IGTCAL12931) (Supplementary 1) [23]. A waiver for consent was granted due to the retrospective nature of the study, ensuring that all the data handling processes adhered to the approved guidelines for patient data confidentiality and integrity.
2.2. Patient Selection and Data Collection
CT urogram and clinicopathological data were obtained from the Tayside Urological Cancers Database for patients diagnosed with UTUC who underwent radical nephroureterectomy at a tertiary hospital between January 2000 and December 2022. Inclusion criteria were: availability of CT urogram images following a standardized protocol, pathological confirmation of UTUC post-surgery, undergoing ureteroscopy biopsy before surgery without prior endoscopic treatment before the CT examination. Out of 256 patients reviewed, 106 were eligible. The dataset classified tumours into low-grade (I-II, n=31) and high-grade (III-IV, n=75), with staging divided into early (Ta-T1, n=59) and advanced (T2-T4, n=47). Each case was verified by an experienced uropathologist and discussed during tumour board meetings.
2.3. CT Imaging Protocol
All CT scans were conducted following a standardized protocol on a 64-slice multidetector CT scanner (Somatom Definition AS, Siemens Healthineers, Erlangen, Germany). The protocol included acquisitions in the non-contrast phase, nephrographic phase (approximately 100 seconds post-contrast), and excretory phase (around 10 minutes post-contrast). An intravenous injection of 100 mL Omnipaque 300 was administered at a rate of 3 mL/s. Images were reconstructed with a 1 mm slice thickness and a 0.7 mm overlap.
2.4. Image Segmentation
Tumour segmentation was performed using 3D Slicer software (version 5.2.2) on DICOM images using the "grow-from-seeds" tool by two experts, a radiologist and a urosurgical oncologist. The Dice Similarity Coefficient (DSC) with a threshold of 0.8 was applied to ensure at least 80% overlap accuracy. Cases not meeting this threshold were discussed for refinement or exclusion if consensus was unachievable. Nephroureterectomy results served as the histopathological gold standard.
For PRF segmentation, a semi-automated method was developed, expanding the tumour segmentation by 5, 10, 15, 20, 25, and 30 mm around the tumour and both kidneys to encompass peritumoral fat. A total of six regions of interest (ROIs) were generated. A threshold range of -30 to -200 Hounsfield units (HU) was applied to segment only fat and exclude adjacent organs. Morphological operations were performed on each segmentation to remove small dots and fill small holes.
2.5. Pre-Processing
The arterial phase was selected for further processing due to its high contrast between kidneys and PRF. Images were cropped to include only kidneys and PRF and converted from DICOM to NIfTI using Python and 3D Slicer. Resampling was performed using linear interpolation to achieve isotropic voxel dimensions of 1x1x1 mm. For hand-crafted radiomic feature extraction, a fixed bin width discretization method with a bin width of 25 HU was employed. Radiomic features were extracted from both original and wavelet-transformed images.
2.6. Feature Extraction and Analysis
Radiomic features were extracted using the PyRadiomics library in Python, adhering to the Image Biomarker Standardization Initiative (IBSI) guidelines. First-order statistics, texture, and shape features were extracted, resulting in a total of 1,409 features per ROI. All other feature extraction parameters remained as default. The Synthetic Minority Over-sampling Technique (SMOTE) was employed for the low-grade class to mitigate class imbalance. An in-house algorithm integrated radiomic data with clinical variables to construct predictive models, with statistical significance set at p<0.05.
2.7. Feature Stability and Selection
Numerical variables were normalised, and non-numeric variables were excluded. Highly correlated features (>0.9) were removed to ensure statistical independence. Features with an intraclass correlation coefficient (ICC) <0.75 were excluded, leaving 163 features. Recursive feature elimination combined with cross-validation (RFECV) guided by SHapley Additive exPlanations (SHAP) was used for feature selection.
2.8. Model Evaluation and Statistical Analysis
Predictive models were evaluated using multiple machine learning algorithms and five-fold repeated cross-validation. Metrics such as ROC AUC, sensitivity, specificity and F1-score were used to assess model efficacy. Visualization of feature importance through SHAP values and Beeswarm plots were also analysed. Delong test was used to evaluate the difference in corelated AUC curves. All statistical analyses were performed using Python version 3.7 and Microsoft Excel.
3. Results
3.1. Patient Characteristics
A total of 103 patients were included in the final analysis. Table 1 provides the demographic and clinical features for this cohort, including age, sex, BMI category, Tumour location, grade, stage, and recurrence. The prevalence of advanced stages (T2-T4) and high-grade tumours (III-IV) reflects the aggressive nature of UTUC.
3.2. Segmentation Results
Although an initial 5 mm margin was proposed, inconsistent Tumour-to-fat boundaries rendered that approach impractical. A 15 mm thickness frequently produced the highest AUC across the three targets, although 10 mm and 20 mm PRF margins also showed competitive performance in some analyses.
3.3. Radiomic Feature Selection
From each ROI, we initially extracted 1,409 radiomic features spanning intensity, shape, and texture. For the PRF ROIs, Pearson correlation eliminated 376 to 895 features per ROI due to redundancy or low informative value. Subsequently, RFE with cross-validation and SHAP retained between 3 and 12 features per ROI, optimising the AUC. For the tumour ROI, an ICC threshold of 0.7 further reduced correlated features to 163. Then the SHAP analysis and LASSO regression were applied.
3.4. Comparative Evaluation
A total of seven radiomic configurations were tested for Tumour grade, each incorporating clinical variables with one of the following feature sets: Tumour features only, Perirenal fat (PRF) features at varying radial margins (10 mm, 15 mm, 20 mm, 25 mm, 30 mm), Combined (Tumour + PRF) features
The highest mean AUC for tumour grade emerged from a combined (Tumour + 10 mm PRF) model using an MLPClassifier, achieving 0.961 (95% CI: 0.920–1.00). The Tumour-only model reached an AUC of 0.934 (95% CI: 0.891–0.977), while the best PRF-only approach (CatBoost at 10 mm margin) yielded 0.900 (95% CI: 0.814–0.986). Figure 1a illustrates the mean AUC values for all configurations.
Tumour Stage Performance. For stage (early vs. advanced), combining tumour and 15 mm PRF features (MLPClassifier) produced the top AUC of 0.852 (95% CI: 0.790–0.914). The Tumour-only model recorded 0.831 (95% CI: 0.750–0.911; F1 = 0.765). PRF-only configurations exhibited lower AUCs (0.711–0.778) but moderate sensitivity and specificity. These findings are summarised in Figure 1b and Table 2.
3.5. Tumour Grade Prediction
Focusing on Tumour grade in more detail, the PRF-only CatBoost model at a 10 mm margin reached an AUC of 0.900 (95% CI: 0.814–0.986). By contrast, the Tumour-only Random Forest Classifier attained 0.934 (95% CI: 0.891–0.977). When PRF and Tumour features were combined at the 10 mm PRF margin (MLPClassifier), the AUC rose to 0.961 (95% CI: 0.920–1.000), with corresponding sensitivity and specificity both at 0.889 (Figure 2a).
Thus, integrating PRF features with tumour radiomics enhances discriminative power over PRF alone, though the DeLong test (Table 3) showed no statistically significant difference (p = 0.2252) between the Tumour-only and Tumour + PRF models. However, the Tumour + PRF configuration did outperform the PRF-only model (p = 0.0157).
3.6. Tumour Stage Prediction
For the Tumour stage, the best AUC of 0.852 (95% CI: 0.790–0.914) was achieved by an MLPClassifier that combined Tumour and 15 mm PRF features. The Tumour-only counterpart recorded 0.831 (95% CI: 0.750–0.911) with an F1 score of 0.765, while PRF-only approaches delivered AUCs ranging from 0.711 (95% CI: 0.641–0.781) to 0.778 (95% CI: 0.704–0.851). Despite the combined approach’s slight improvement over the Tumour-only model, the DeLong test (Table 3) indicated no statistically significant difference (p > 0.05). Figure 2b depict ROC curves for the top classifiers, and Figure 5 and Figure 6 show the associated SHAP interpretations.
4. Discussion
These findings underscore the value of integrating PRF radiomic features with Tumour-based radiomics in UTUC assessment. While Tumour-only radiomics already provides a robust foundation—reflected in high AUCs for grade prediction (up to 0.934)—the combined (Tumour + PRF) models offer incremental improvements in both grade (up to 0.961) and stage (up to 0.852) prediction. Notably, PRF-only models demonstrated moderate to strong discriminatory power (AUCs up to 0.900 for grade and 0.778 for stage), highlighting that PRF harbours distinct textural cues related to tumour aggressiveness.
The DeLong tests revealed that adding PRF features significantly boosts performance over PRF-only configurations (p < 0.05) but does not always confer a statistically significant edge over an already strong Tumour-only baseline. Nonetheless, the elevated mean AUCs (especially for grade) suggest that PRF radiomics contributes important complementary information about tumour biology and the local peritumoral environment.
Quantitative radiomic analysis highlights the prognostic value of PRF in oncology. Research such as that of Khene et al.[24] and Gill et al. [25]. showcases how CT texture analysis can predict renal tumour characteristics and differentiate renal cell carcinoma grades using metrics such as entropy. Kang Ning et al.[26] and Chung et al.[17] further demonstrated the importance of PRF thickness and stranding as independent predictors of survival in patients with metastatic renal cancer and ureteral urothelial carcinoma and proposed the inclusion of these parameters in prognostic models to improve clinical assessments and treatment strategies. These findings underscore the potential of integrating peripheral fat measurements into clinical practice to refine diagnostic and prognostic accuracy in oncology.
The research conducted by Gill et al[25]., who focused on juxtatumoural fat in renal cell carcinoma (RCC) and achieved an ROC AUC of 0.75 for predicting tumour histological grade, was extended in a study examining perirenal fat (PRF) surrounding UTUC. An automated technique for segmenting PRF, combined with clinical variables, significantly boosted model performance, achieving an ROC AUC of over 0.9 for tumour grade. The precision of this automated segmentation, alongside variables such as tumour stage and BMI, provided a more comprehensive view of the disease and enhanced predictive accuracy. Moreover, the inherently aggressive and invasive nature of UTUC, compared to RCC, likely heightens the usefulness of PRF radiomic analysis. This distinct pathology of UTUC may account for its especially strong capacity to capture key radiomic features, as reflected in the high ROC AUC values observed in the study.
The present study's findings on PRF radiomics can be viewed as complementary to our previous work focusing on the tumour ROI [11]. While the tumour ROI analysis achieved high accuracy in predicting tumour grade (AUC 0.94) and moderate accuracy for tumour stage (AUC 0.75), our current PRF radiomics approach demonstrated comparable performance for grade prediction (AUC 0. 0.961) and slightly lower accuracy for stage prediction (AUC 0.85). These findings suggest that PRF radiomics may provide additional prognostic information beyond what can be gleaned from the tumour itself. The combination of tumour ROI and PRF radiomics could potentially offer a more comprehensive assessment of UTUC, enhancing both diagnostic accuracy and prognostic capabilities. Future research should explore integrated models that leverage both tumour and PRF features to optimize UTUC characterization and management.
Furthermore, the study by Chung et al.[17] highlights that PRF stranding (PRFS) is a secondary predictor of poor prognosis in patients with ureteral urothelial carcinoma, indicating that worse oncologic outcomes are associated with PRFS. Building on these findings, the present study applied a quantitative radiomic approach to analyses PRF textures and patterns in CT images. This strategy underscores the potential of radiomics to identify subtle imaging features such as PRF stranding, thereby enhancing the accuracy and reliability of prognostic assessments in UTUC. It not only corroborates but also extends the insights from Chung et al., supporting a more sophisticated application of PRF analysis in UTUC management.
In addition to validating and expanding on Chung et al.’s observations, our research introduces a new hypothesis regarding the role of PRF surrounding the tumour. Specifically, we propose that PRF has a distinct ability to predict key tumour characteristics, including tumour grade and stage. Preliminary data suggest that radiomic signatures of PRF correlate with the biological behaviour of UTUC. By systematically integrating these features with various clinical variables, our models aim to provide oncologists with a powerful tool for personalized treatment planning, ultimately improving patient prognosis and overall disease management. This integration of radiomic and clinical data represents a significant step forward in leveraging diagnostic imaging for refined cancer prognostication and further highlights the transformative potential of radiomics within oncology.
One of the key strengths of this study is its adherence to rigorous standards and the use of advanced statistical and machine learning techniques, which ensure the accuracy and reliability of the findings. However, the single-centre design, manual segmentation of ROIs (requiring expert time), and relatively small sample size (n=103) may affect the generalizability of these findings. Additionally, grade and stage imbalances could influence model training. Future investigations should include multi-centre data, automated or semi-automated segmentation, and larger cohorts to validate and refine these radiomic predictors.
Future research should focus on expanding the dataset and incorporating data from multiple centres to validate and refine the predictive models. Prospective studies could provide higher-quality data and might reveal additional insights into the relationships between radiomic features and clinical outcomes. Furthermore, integrating radiomic analysis with genetic and molecular data could offer a more comprehensive understanding of tumour behaviour and response to treatment.
5. Conclusions
In conclusion, PRF radiomics contributes independent and complementary prognostic information in UTUC, particularly for tumour grade. The demonstrated performance gains highlight the potential for combined Tumour + PRF models to improve predictive accuracy and guide clinical decision-making in UTUC management. With further validation in multi-centre cohorts, this approach could refine risk stratification, enabling more tailored therapeutic strategies and potentially improving patient outcomes.
Supplementary Materials
The following supporting information can be downloaded at the website of this paper posted on Preprints.org. The CLEAR checklist is provided as the supplementary material for this study.
Author Contributions
Conceptualization, A.A.M. and G.N.; methodology, A.A.M., A.A.; software, A.A.; validation, A.A., C.L. and G.N.; formal analysis, A.A.M. , A.A., C.L. and G.N.; investigation, A.A.M., A.A., C.L. and G.N.; resources, A.A.M. and G.N.; data curation, A.A. , and G.N.; writing—original draft preparation, A.A.M.; writing—review and editing, A.A.M. , A.A., C.L., G.N. and A.H.D.A. ; revision of the first draft, A.H.D.A. ; visualization, A.A.M., A.A.; supervision, C.L. and G.N.; project administration, C.L. and G.N.; funding acquisition, A.A.M. All authors have read and agreed to the published version of the manuscript.
Funding
This research was conducted as part of a PhD scholarship funded by the Government of Saudi Arabia and Najran University.
Institutional Review Board Statement
This study adhered to the Declaration of Helsinki and received approval from the East of Scotland Research Ethical Service Ethics Committee (Approval No. IGTCAL12931) on 8 August 2023.
Informed Consent Statement
Due to the retrospective nature of this study under Caldicott Approval, patient consent was waived.
Data Availability Statement
All relevant data are included within the manuscript. For further details, the corresponding author (A.A.M.) may be contacted upon reasonable request.
Acknowledgments
A.A.M. express his sincere gratitude to the Saudi Arabian Cultural Bureau in London and the University of Dundee for their invaluable support.
Conflicts of Interest
The authors declare no conflicts of interest. The funders had no involvement in the design, data collection, analysis, interpretation, writing, or decision to publish the results.
References
- Rouprêt, M.; Babjuk, M.; Burger, M.; Capoun, O.; Cohen, D.; Compérat, E.M.; Cowan, N.C.; Dominguez-Escrig, J.L.; Gontero, P.; Hugh Mostafid, A.; et al. European Association of Urology Guidelines on Upper Urinary Tract Urothelial Carcinoma: 2020 Update. Eur Urol 2021, 79, 62–79. [Google Scholar] [CrossRef]
- Mbeutcha, A.; Rouprêt, M.; Kamat, A.M.; Karakiewicz, P.I.; Lawrentschuk, N.; Novara, G.; Raman, J.D.; Seitz, C.; Xylinas, E.; Shariat, S.F. Prognostic Factors and Predictive Tools for Upper Tract Urothelial Carcinoma: A Systematic Review. World J Urol 2017, 35, 337–353. [Google Scholar] [CrossRef] [PubMed]
- Seisen, T.; Peyronnet, B.; Dominguez-Escrig, J.L.; Bruins, H.M.; Yuan, C.Y.; Babjuk, M.; Böhle, A.; Burger, M.; Compérat, E.M.; Cowan, N.C.; et al. Oncologic Outcomes of Kidney-Sparing Surgery Versus Radical Nephroureterectomy for Upper Tract Urothelial Carcinoma: A Systematic Review by the EAU Non-Muscle Invasive Bladder Cancer Guidelines Panel. Eur Urol 2016, 70, 1052–1068. [Google Scholar] [CrossRef]
- Leow, J.J.; Orsola, A.; Chang, S.L.; Bellmunt, J. A Contemporary Review of Management and Prognostic Factors of Upper Tract Urothelial Carcinoma. Cancer Treat Rev 2015, 41, 310–319. [Google Scholar] [CrossRef]
- Favaretto, R.L.; Shariat, S.F.; Savage, C.; Godoy, G.; Chade, D.C.; Kaag, M.; Bochner, B.H.; Coleman, J.; Dalbagni, G. Combining Imaging and Ureteroscopy Variables in a Preoperative Multivariable Model for Prediction of Muscle-Invasive and Non-Organ Confined Disease in Patients with Upper Tract Urothelial Carcinoma. BJU Int 2012, 109, 77–82. [Google Scholar] [CrossRef]
- Wojcik, E.M.; Kurtycz, D.F.I.; Rosenthal, D.L. We’ll Always Have Paris The Paris System for Reporting Urinary Cytology 2022. J Am Soc Cytopathol 2022, 11, 62–66. [Google Scholar] [CrossRef]
- Brimo, F.; Vollmer, R.T.; Case, B.; Aprikian, A.; Kassouf, W.; Auger, M. Accuracy of Urine Cytology and the Significance of an Atypical Category. Am J Clin Pathol 2009, 132, 785–793. [Google Scholar] [CrossRef]
- Yates, D.R.; Hupertan, V.; Colin, P.; Ouzzane, A.; Descazeaud, A.; Long, J.A.; Pignot, G.; Crouzet, S.; Rozet, F.; Neuzillet, Y.; et al. Cancer-Specific Survival after Radical Nephroureterectomy for Upper Urinary Tract Urothelial Carcinoma: Proposal and Multi-Institutional Validation of a Post-Operative Nomogram. Br J Cancer 2012, 106, 1083–1088. [Google Scholar] [CrossRef]
- Lambin, P.; Leijenaar, R.T.H.; Deist, T.M.; Peerlings, J.; De Jong, E.E.C.; Van Timmeren, J.; Sanduleanu, S.; Larue, R.T.H.M.; Even, A.J.G.; Jochems, A.; et al. Radiomics: The Bridge between Medical Imaging and Personalized Medicine. Nat Rev Clin Oncol 2017, 14, 749–762. [Google Scholar] [CrossRef] [PubMed]
- Lambin, P.; Rios-Velazquez, E.; …, R.L.-E. journal of; 2012, undefined Radiomics: Extracting More Information from Medical Images Using Advanced Feature Analysis. Elsevier.
- Alqahtani, A.; Bhattacharjee, S.; Almopti, A.; Li, C.; Nabi, G. Radiomics-Based Machine Learning Approach for the Prediction of Grade and Stage in Upper Urinary Tract Urothelial Carcinoma: A Step towards Virtual Biopsy. Int J Surg 2024, 110, 3258–3268. [Google Scholar] [CrossRef] [PubMed]
- Hanahan, D.; Weinberg, R.A. Hallmarks of Cancer: The next Generation. Cell 2011, 144, 646–674. [Google Scholar] [CrossRef] [PubMed]
- Quail, D.F.; Joyce, J.A. Microenvironmental Regulation of Tumor Progression and Metastasis. Nat Med 2013, 19, 1423–1437. [Google Scholar] [CrossRef] [PubMed]
- Pottier, C.; Wheatherspoon, A.; Roncarati, P.; Longuespée, R.; Herfs, M.; Duray, A.; Delvenne, P.; Quatresooz, P. The Importance of the Tumor Microenvironment in the Therapeutic Management of Cancer. Expert Rev Anticancer Ther 2015, 15, 943–954. [Google Scholar] [CrossRef]
- Yanagi, M.; Terasaki, M.; Kiriyama, T.; Terasaki, Y.; Akatsuka, J.; Endo, Y.; Nishimura, T.; Shimizu, A.; Kondo, Y. Perirenal Fat Stranding as a Predictor of Disease Progression after Radical Nephroureterectomy for Renal Pelvic Urothelial Carcinoma: A Retrospective Study. Discover oncology 2023, 14. [Google Scholar] [CrossRef]
- Ceyhan, E.; Ileri, F.; Aki, F.T.; Yazici, M.S.; Karcaaltincaba, M.; Ertoy Baydar, D.; Bilen, C.Y. Pathology Associated with Adherent Perirenal Fat and Its Clinical Effect. Int J Clin Pract 2021, 75. [Google Scholar] [CrossRef]
- Chung, J.W.; Lee, J.N.; Park, K.M.; Byeon, K.H.; Cheon, H.; Ha, Y.S.; Choi, S.H.; Kim, B.S.; Kim, T.H.; Yoo, E.S.; et al. Prognostic Impact of Perirenal Fat Stranding on Oncologic Outcomes in Ureteral Urothelial Carcinoma. Investig Clin Urol 2021, 62, 23. [Google Scholar] [CrossRef]
- Tsili, A.C.; Goussia, A.C.; Baltogiannis, D.; Astrakas, L.; Sofikitis, N.; Malamou-Mitsi, V.; Argyropoulou, M.I. Perirenal Fat Invasion on Renal Cell Carcinoma: Evaluation with Multidetector Computed Tomography-Multivariate Analysis. J Comput Assist Tomogr 2013, 37. [Google Scholar] [CrossRef]
- Ning, K.; Li, Z.; Liu, H.; Tian, X.; Wang, J.; Wu, Y.; Xiong, L.; Zou, X.; Peng, Y.; Zhou, Z.; et al. Perirenal Fat Thickness Significantly Associated with Prognosis of Metastatic Renal Cell Cancer Patients Receiving Anti-VEGF Therapy. Nutrients 2022, 14. [Google Scholar] [CrossRef]
- Aerts, H.J.W.L.; Velazquez, E.R.; Leijenaar, R.T.H.; Parmar, C.; Grossmann, P.; Cavalho, S.; Bussink, J.; Monshouwer, R.; Haibe-Kains, B.; Rietveld, D.; et al. Decoding Tumour Phenotype by Noninvasive Imaging Using a Quantitative Radiomics Approach. Nat Commun 2014, 5. [Google Scholar] [CrossRef]
- Suarez-Ibarrola, R.; Basulto-Martinez, M.; Heinze, A.; Gratzke, C.; Miernik, A. Cancers Radiomics Applications in Renal Tumor Assessment: A Comprehensive Review of the Literature. Cancers 2020, 12, 1387. [Google Scholar] [CrossRef]
- Lambin, P.; Leijenaar, R.T.H.; Deist, T.M.; Peerlings, J.; De Jong, E.E.C.; Van Timmeren, J.; Sanduleanu, S.; Larue, R.T.H.M.; Even, A.J.G.; Jochems, A.; et al. Radiomics: The Bridge between Medical Imaging and Personalized Medicine. Nat Rev Clin Oncol 2017, 14, 749–762. [Google Scholar] [CrossRef] [PubMed]
- Kocak, B.; Baessler, B.; Bakas, S.; Cuocolo, R.; Fedorov, A.; Maier-Hein, L.; Mercaldo, N.; Müller, H.; Orlhac, F.; Pinto dos Santos, D.; et al. CheckList for EvaluAtion of Radiomics Research (CLEAR): A Step-by-Step Reporting Guideline for Authors and Reviewers Endorsed by ESR and EuSoMII. Insights Imaging 2023, 14, 1–13. [Google Scholar] [CrossRef] [PubMed]
- Khene, Z.E.; Bensalah, K.; Largent, A.; Shariat, S.; Verhoest, G.; Peyronnet, B.; Acosta, O.; DeCrevoisier, R.; Mathieu, R. Role of Quantitative Computed Tomography Texture Analysis in the Prediction of Adherent Perinephric Fat. World J Urol 2018, 36, 1635–1642. [Google Scholar] [CrossRef] [PubMed]
- Gill, T.S.; Varghese, B.A.; Hwang, D.H.; Cen, S.Y.; Aron, M.; Aron, M.; Duddalwar, V.A. Juxtatumoral Perinephric Fat Analysis in Clear Cell Renal Cell Carcinoma. Abdominal Radiology 2019, 44, 1470–1480. [Google Scholar] [CrossRef]
- Ning, K.; Li, Z.; Liu, H.; Tian, X.; Wang, J.; Wu, Y.; Xiong, L.; Zou, X.; Peng, Y.; Zhou, Z.; et al. Perirenal Fat Thickness Significantly Associated with Prognosis of Metastatic Renal Cell Cancer Patients Receiving Anti-VEGF Therapy. Nutrients 2022, 14, 3388. [Google Scholar] [CrossRef]
Figure 1.
(a) Mean AUC (Grade) – Bar plot of mean ROC AUC (with 95% CI) for predicting tumour grade across different configurations (Tumour alone, PRF alone at 10–30 mm, and Tumour + PRF). (b) Mean AUC (Stage) – Bar plot of mean ROC AUC (with 95% CI) for predicting tumour stage (early vs. advanced) using the same configurations.
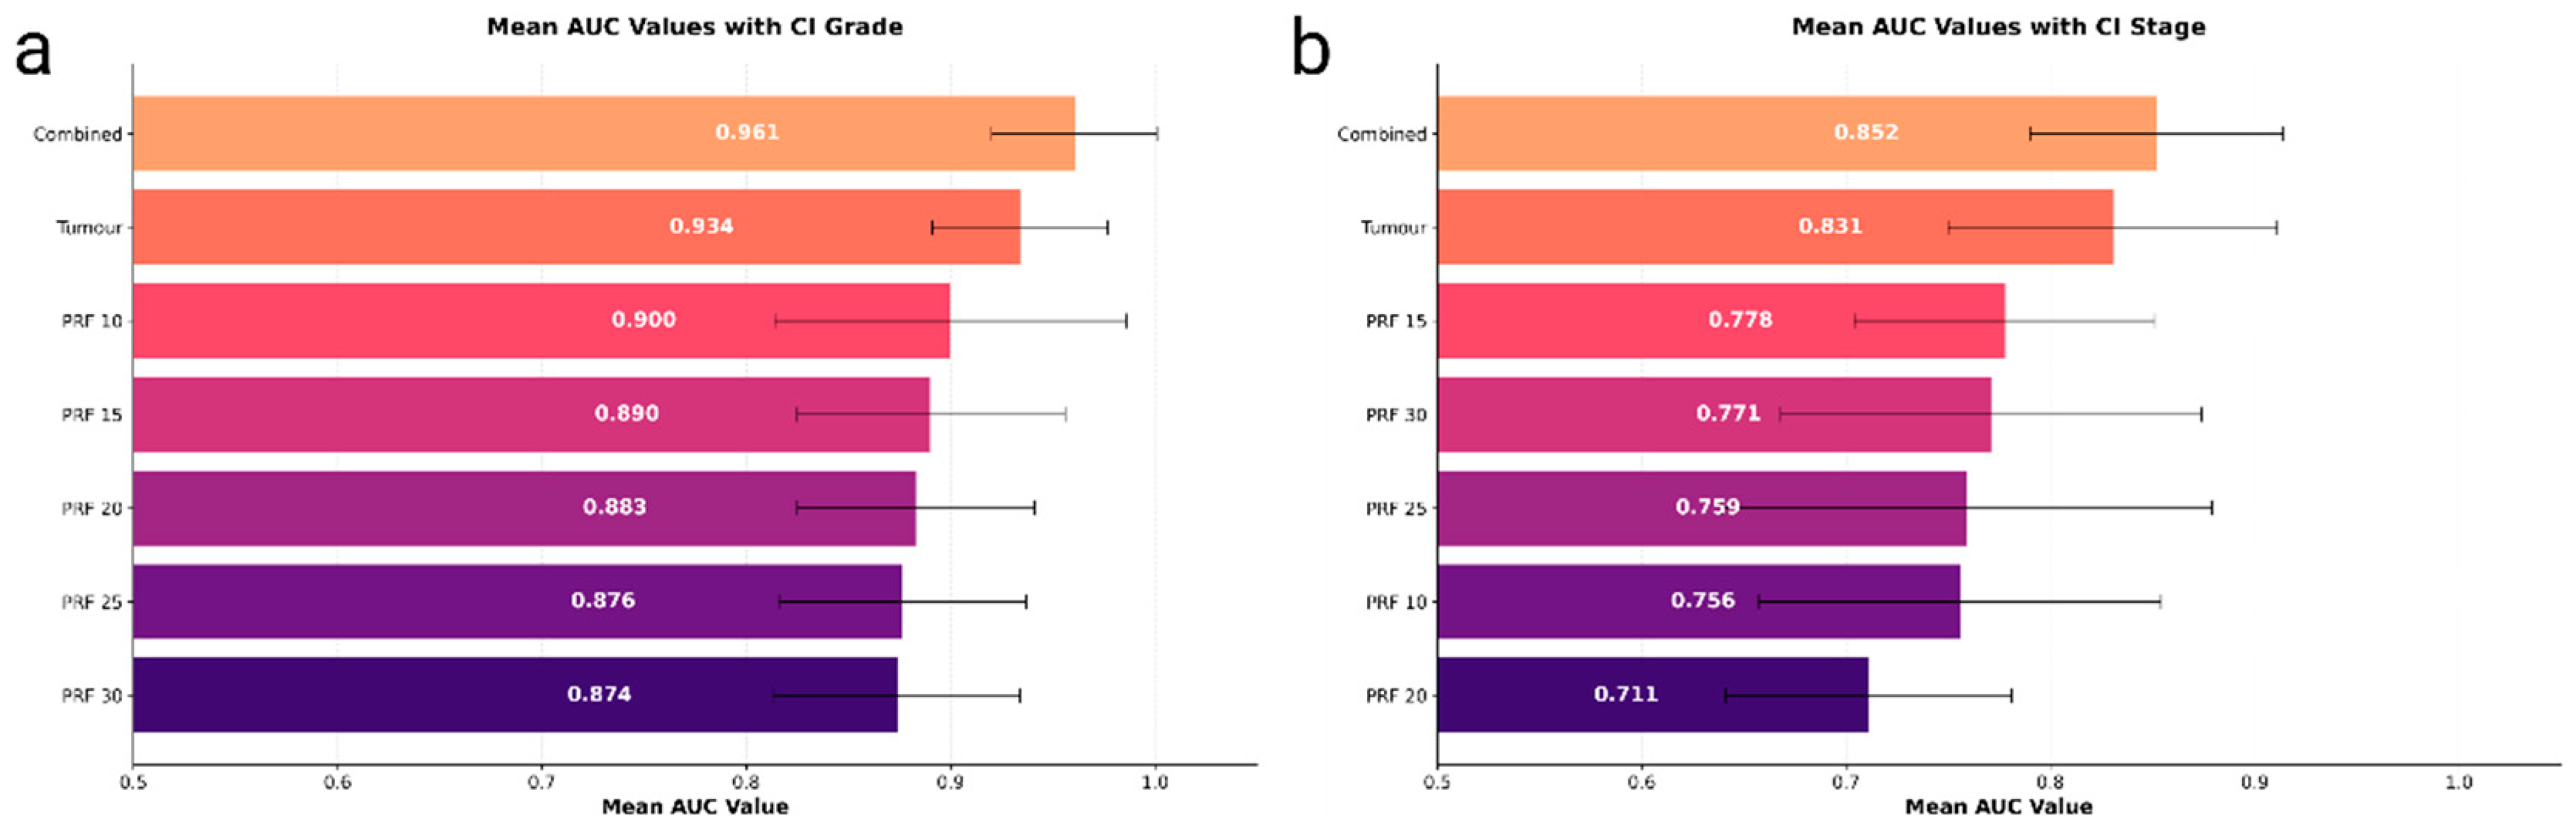
Figure 2.
(a) ROC curves for histological grade prediction models, showing Tumour + 10 mm PRF, Tumour-only, and PRF-only approaches. (b) ROC curves for TNM staging prediction models, comparing Tumour + 15 mm PRF, Tumour-only, and PRF-only methods.
Figure 2.
(a) ROC curves for histological grade prediction models, showing Tumour + 10 mm PRF, Tumour-only, and PRF-only approaches. (b) ROC curves for TNM staging prediction models, comparing Tumour + 15 mm PRF, Tumour-only, and PRF-only methods.
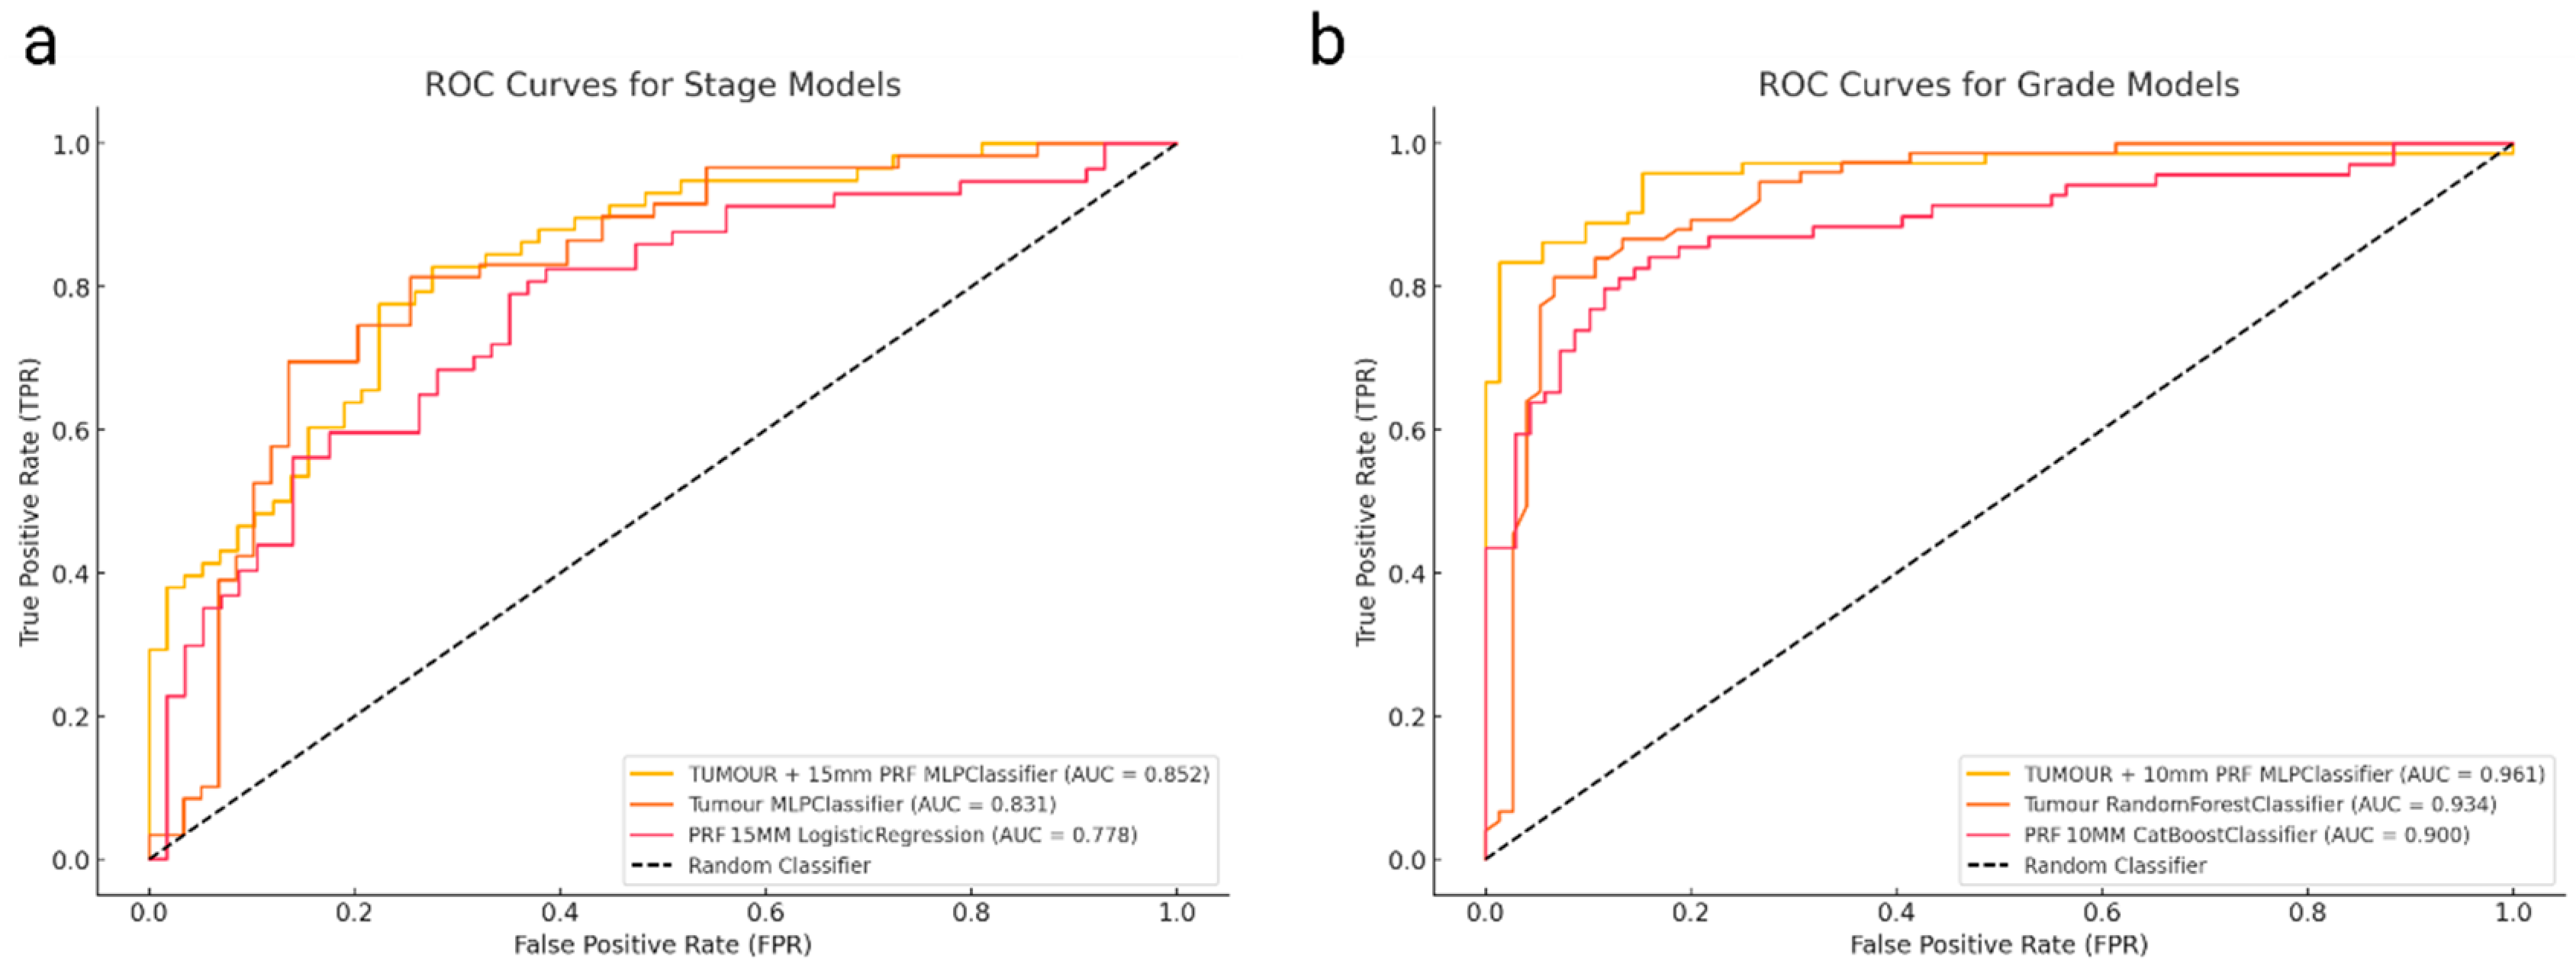
Figure 3.
SHAP mean importance plot highlighting the most influential features in the MLPClassifier for histological grading.
Figure 3.
SHAP mean importance plot highlighting the most influential features in the MLPClassifier for histological grading.
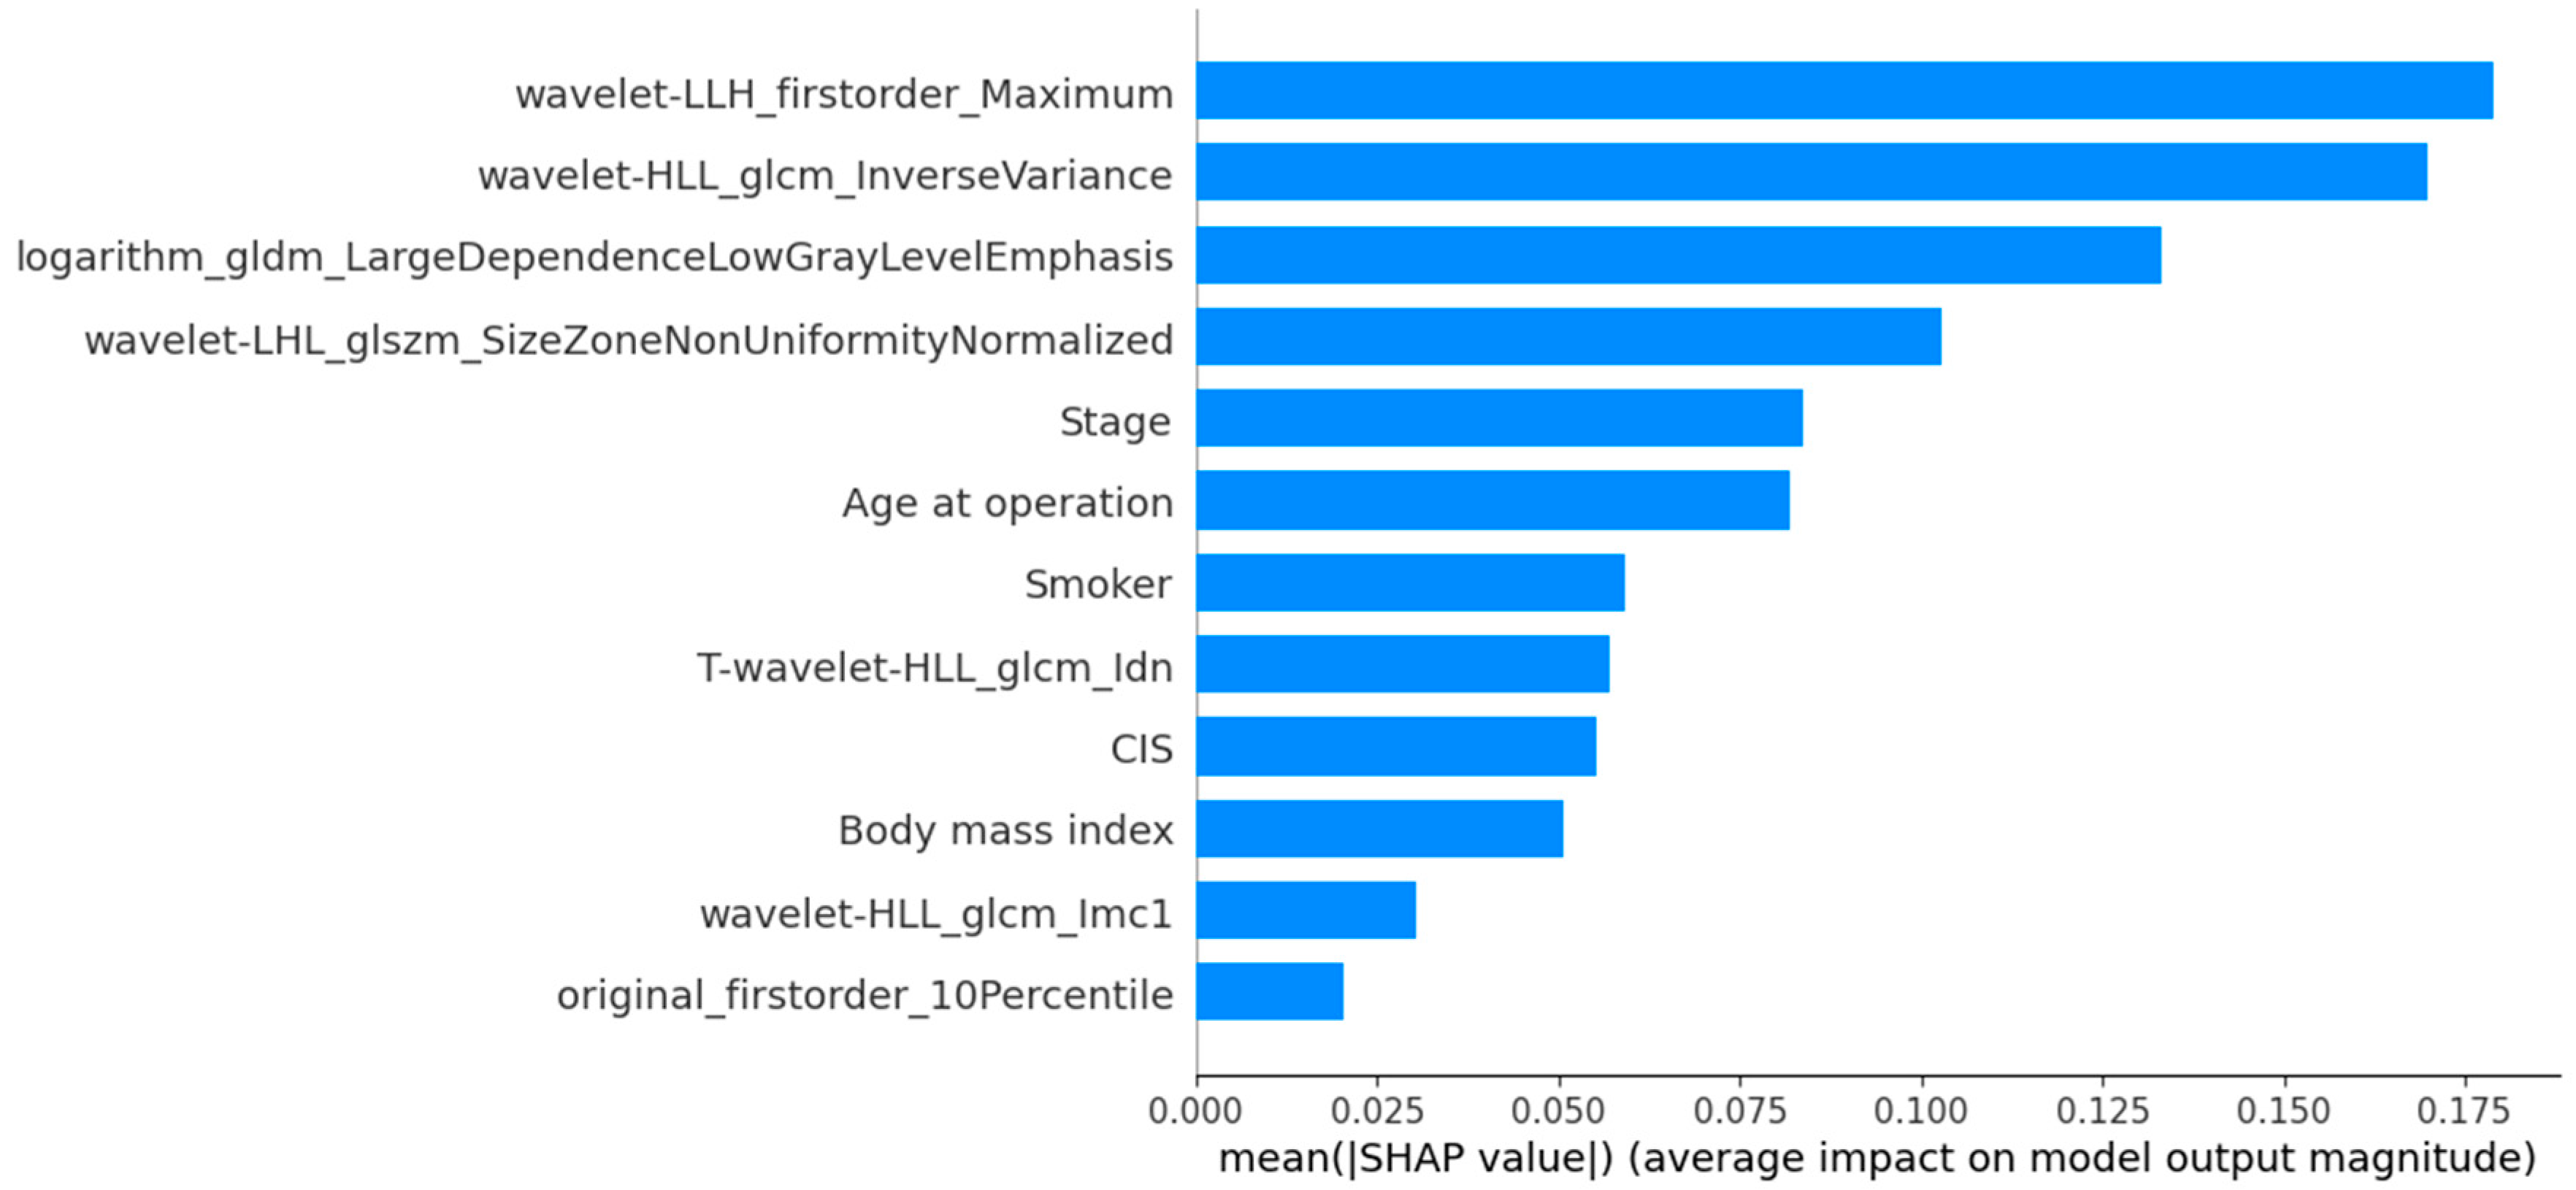
Figure 4.
SHAP values plot to highlight the feature's impact on model output in the MLPClassifier for histological grading.
Figure 4.
SHAP values plot to highlight the feature's impact on model output in the MLPClassifier for histological grading.
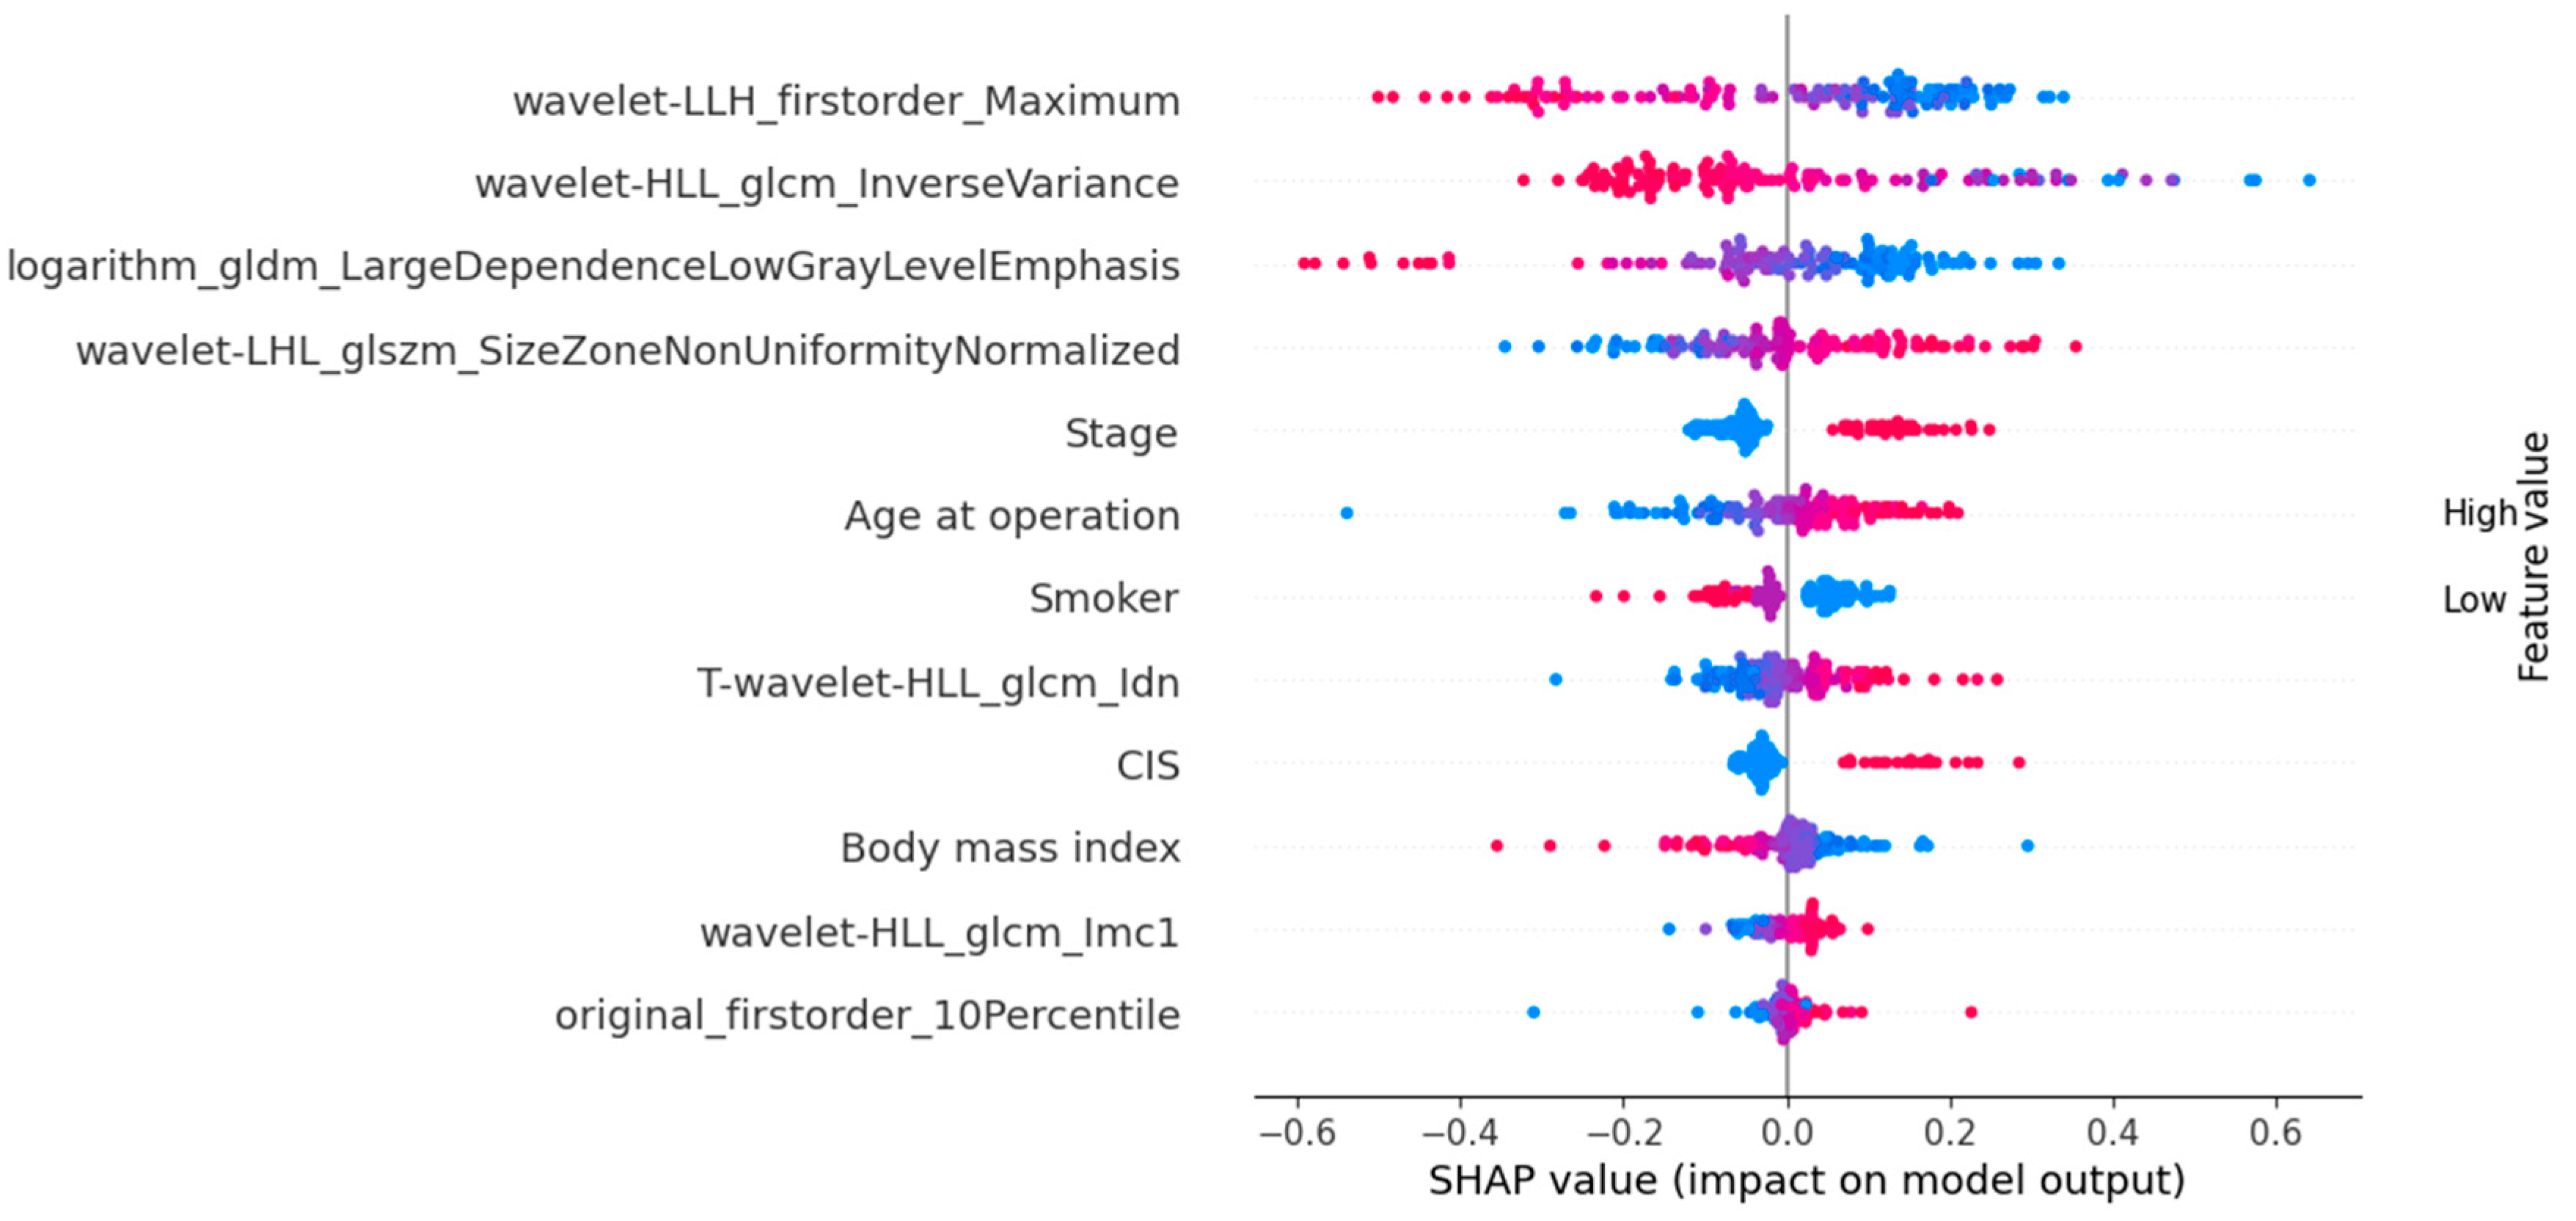
Figure 5.
Mean SHAP importance plot highlighting the most influential features in the MLPClassifier for TNM staging.
Figure 5.
Mean SHAP importance plot highlighting the most influential features in the MLPClassifier for TNM staging.
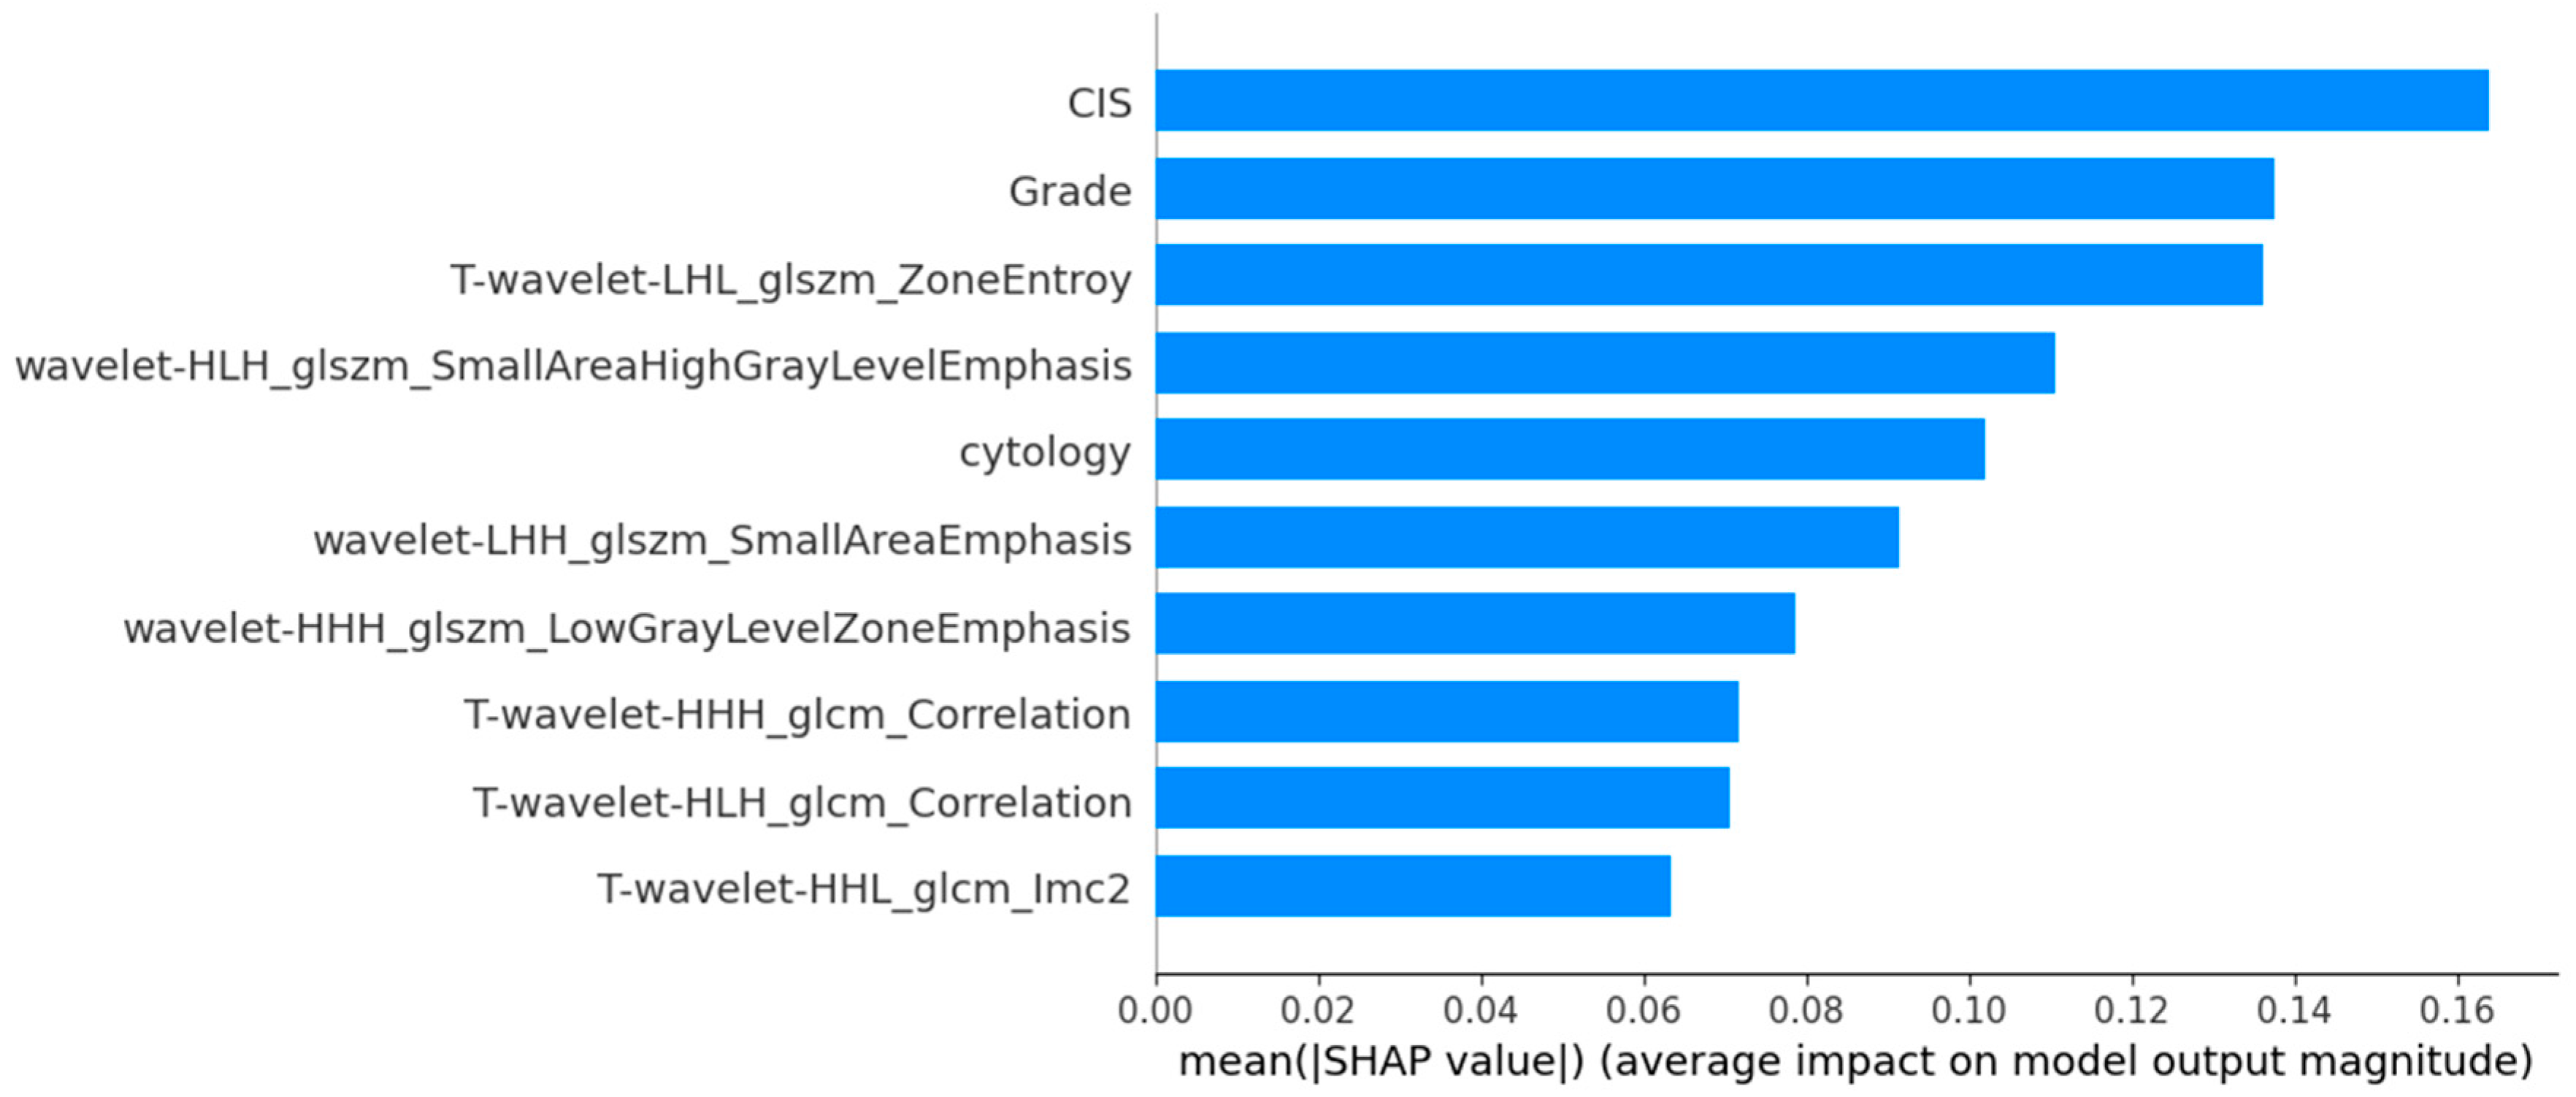
Figure 6.
SHAP values plot to highlight the feature's impact on model output in the MLPClassifier for TNM staging.
Figure 6.
SHAP values plot to highlight the feature's impact on model output in the MLPClassifier for TNM staging.
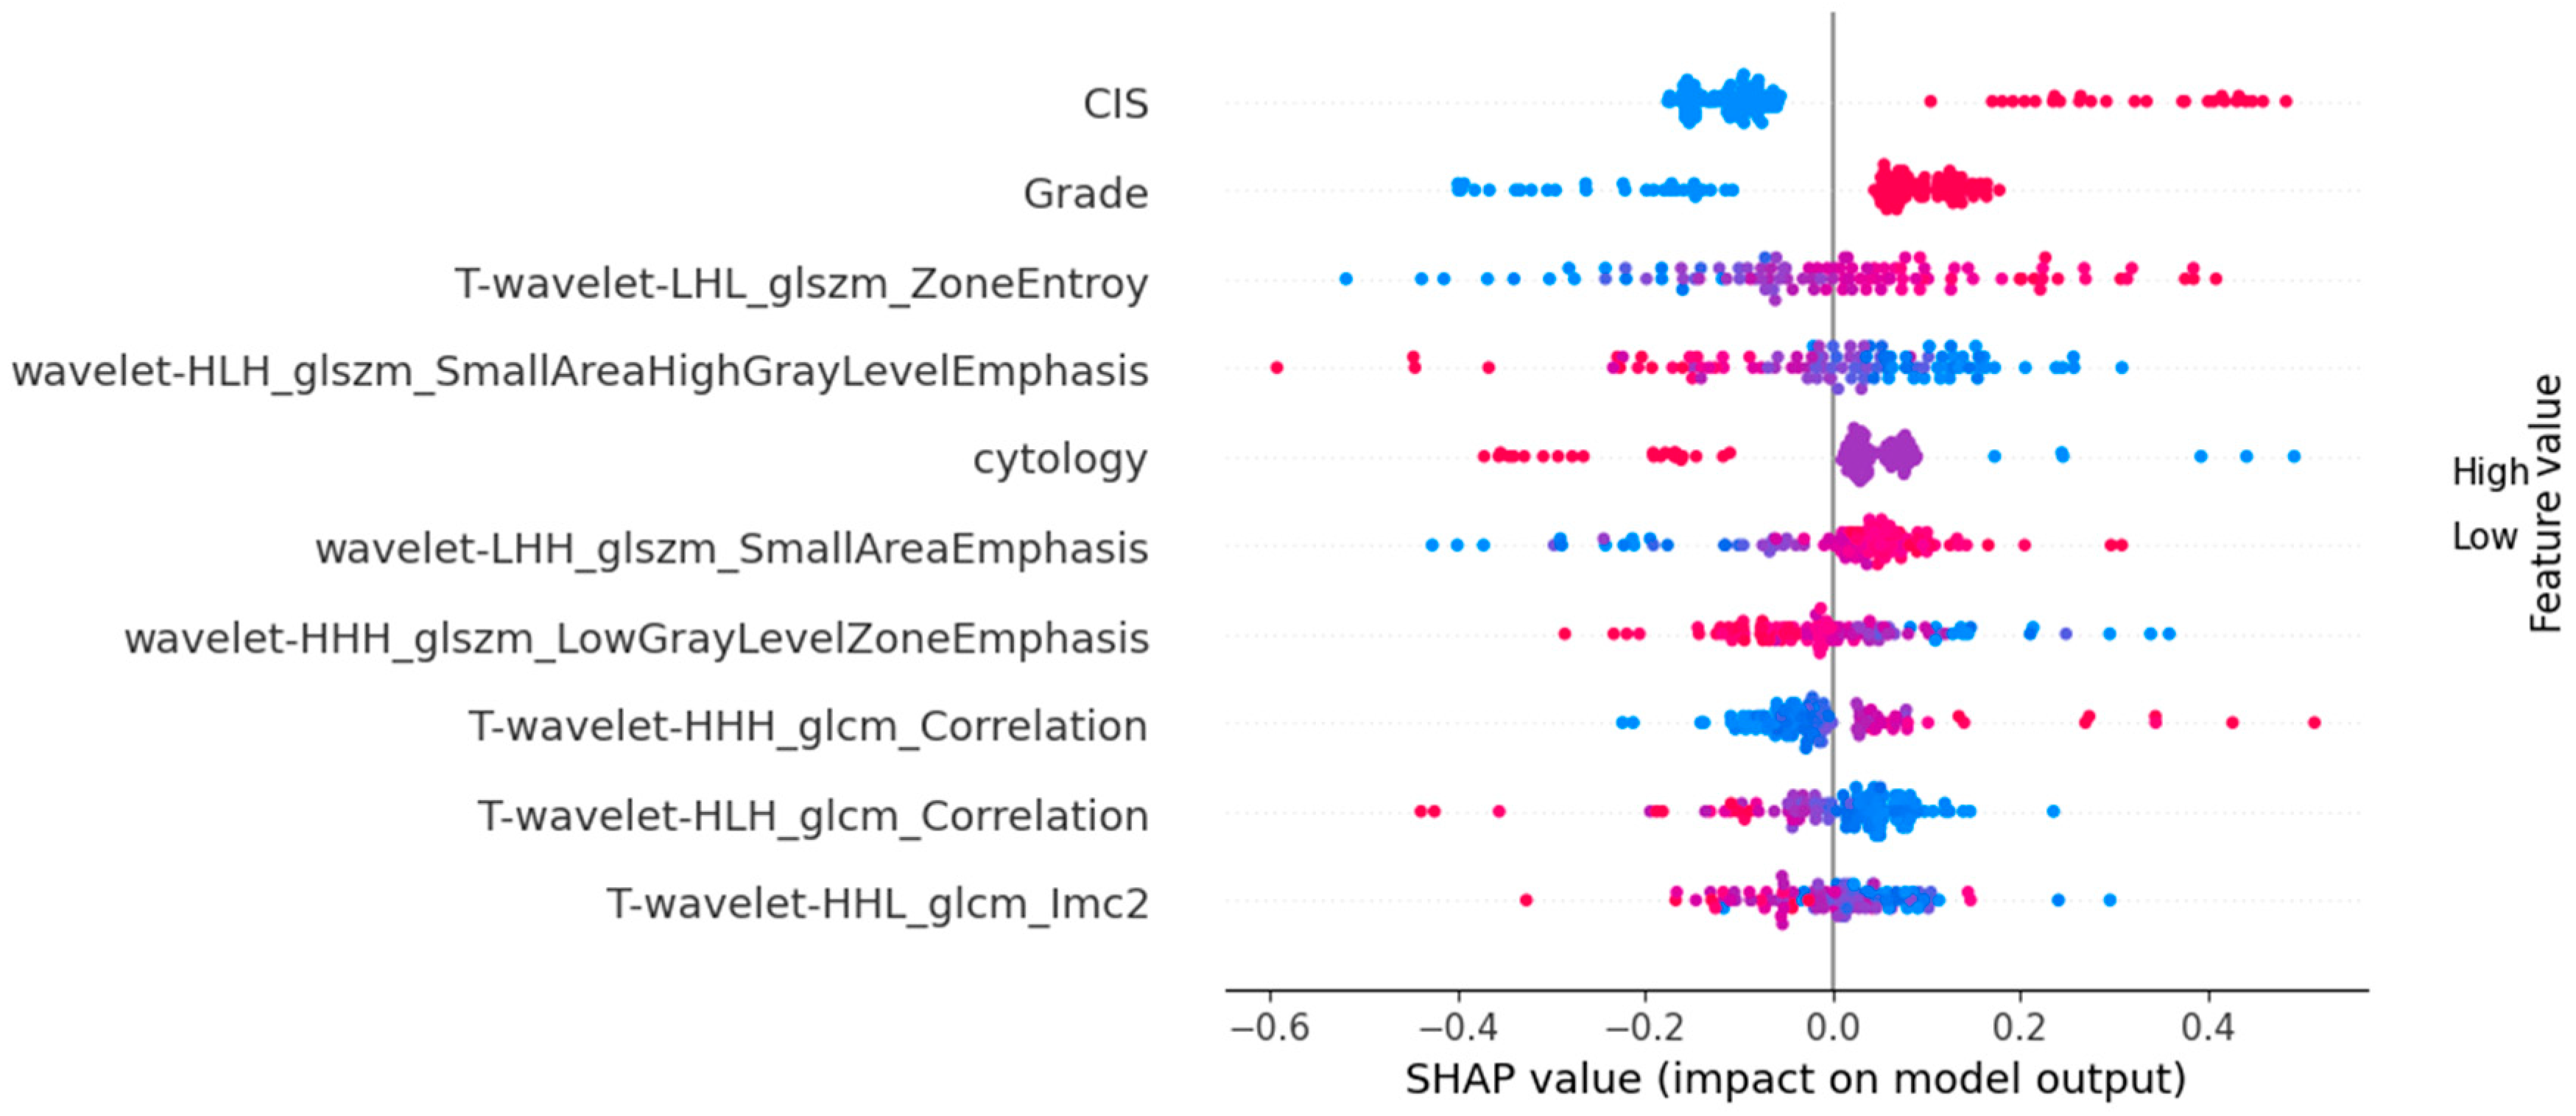

Table 1.
Overview of patient characteristics and Tumour features in the entire cohort (n=103).
| Characteristic | Value |
|---|---|
| Age, median (range) | 74 years (49–93) |
| Gender, n (%) | |
| Male | 61 (59%) |
| Female | 42 (41%) |
| Smoking Status, n (%) | |
| Current/Former | 80 (78%) |
| Never | 23 (22%) |
| BMI Category, n (%) | |
| Normal | 34 (33%) |
| Overweight | 35 (34%) |
| Obese | 34 (33%) |
| Tumour Location, n (%) | |
| Renal Pelvis | 49 (48%) |
| Ureter | 54 (52%) |
| Histological Grade, n (%) | |
| High grade | 73 (71%) |
| Low grade | 30 (29%) |
| T Stage, n (%) | |
| T1 | 58 (56%) |
| T2 | 18 (18%) |
| T3 or T4 | 27 (26%) |
| Carcinoma in situ, n (%) | 25 (23%) |
| Hydronephrosis, n (%) | 25 (23%) |
| Multifocal, n (%) | 38 (35%) |
| Tumour size, mean ± SD (cm) | 1.97 ± 0.83 |
| Deceased, n (%) | 58 (56%) |
| Recurrence, n (%) | 31 (29%) |
Table 2.
Best-performing Models for Tumour Grade AND Tumour Stage Prediction.
| Target | Data | Classifier | AUC Mean | AUC 95% CI | Sensitivity | Specificity | F1 Score |
|---|---|---|---|---|---|---|---|
| Grade | TUMOUR + 10mm PRF | MLPClassifier | 0.961 | [0.920, 1.001] | 0.889 | 0.889 | 0.889 |
| Tumour | RandomForestClassifier | 0.934 | [0.891, 0.977] | 0.867 | 0.867 | 0.863 | |
| PRF 10mm | CatBoostClassifier | 0.900 | [0.814, 0.986] | 0.783 | 0.884 | 0.841 | |
| PRF 15mm | MLPClassifier | 0.890 | [0.825, 0.956] | 0.806 | 0.806 | 0.802 | |
| PRF 20mm | LGBMClassifier | 0.883 | [0.825, 0.941] | 0.764 | 0.819 | 0.798 | |
| PRF 25mm | RandomForestClassifier | 0.876 | [0.816, 0.937] | 0.778 | 0.792 | 0.784 | |
| PRF 30mm | CatBoostClassifier | 0.874 | [0.813, 0.934] | 0.806 | 0.847 | 0.827 | |
| STAGE | TUMOUR + 15mm PRF | MLPClassifier | 0.852 | [0.790, 0.914] | 0.776 | 0.776 | 0.772 |
| Tumour | MLPClassifier | 0.831 | [0.750, 0.911] | 0.780 | 0.746 | 0.765 | |
| PRF 15mm | LogisticRegression | 0.778 | [0.704, 0.851] | 0.702 | 0.667 | 0.682 | |
| PRF 30mm | ExtraTreesClassifier | 0.771 | [0.668, 0.874] | 0.638 | 0.690 | 0.669 | |
| PRF 25mm | AdaBoostClassifier | 0.759 | [0.639, 0.879] | 0.672 | 0.707 | 0.680 | |
| PRF 10mm | MLPClassifier | 0.756 | [0.657, 0.854] | 0.679 | 0.643 | 0.654 | |
| PRF 20mm | MLPClassifier | 0.711 | [0.641, 0.781] | 0.724 | 0.500 | 0.642 |
Table 3.
Delong test for the best models in top-performing datasets.
| Model 1 | Model 2 | AUC 1 | AUC 2 | Z-score | P-value |
|---|---|---|---|---|---|
| TUMOUR + 15mm PRF MLPClassifier | Tumour MLPClassifier | 0.852 | 0.831 | 0.575251 | 0.565122 |
| TUMOUR + 15mm PRF MLPClassifier | PRF¯15mm Logistic Regression | 0.852 | 0.778 | 1.914466 | 0.055561 |
| Tumour MLPClassifier | PRF¯15mm Logistic Regression | 0.831 | 0.778 | 1.339403 | 0.18044 |
| TUMOUR + 10mm PRF MLPClassifier | Tumour Random Forest Classifier | 0.961 | 0.934 | 1.212807 | 0.225204 |
| TUMOUR + 10mm PRF MLPClassifier | PRF¯10mm Cat Boost Classifier | 0.961 | 0.9 | 2.416159 | 0.015685 |
| Tumour Random Forest Classifier | PRF¯10mm Cat Boost Classifier | 0.934 | 0.9 | 1.234756 | 0.216921 |
Disclaimer/Publisher’s Note: The statements, opinions and data contained in all publications are solely those of the individual author(s) and contributor(s) and not of MDPI and/or the editor(s). MDPI and/or the editor(s) disclaim responsibility for any injury to people or property resulting from any ideas, methods, instructions or products referred to in the content. |
© 2025 by the authors. Licensee MDPI, Basel, Switzerland. This article is an open access article distributed under the terms and conditions of the Creative Commons Attribution (CC BY) license (http://creativecommons.org/licenses/by/4.0/).
Copyright: This open access article is published under a Creative Commons CC BY 4.0 license, which permit the free download, distribution, and reuse, provided that the author and preprint are cited in any reuse.


