1. Introduction
The cumulative demand for renewable energy in agricultural machinery is driven by the heavy reliance on fossil fuels, which accelerates climate change [
1]. For example, maize and wheat production in South Africa is projected to decrease by 35% and 45%, respectively, due to rising temperatures and shifts in rainfall patterns. [
2]. The country requires annual fossil fuel investments ranging from R638 million and R12 690 million, funds that could be allocated for cost-effective renewable alternatives [
3]. Despite the environmental and economic drawbacks of fossil fuels, South Africa has faced persistent load-shedding since 2007 [
4]. For instance, the canola process experienced a 40 million loss due to a 5% reduction in operations caused by power outages [
5]. These challenges highlight the urgent need for investment in renewable energy to enhance agricultural sustainability.
Biomass energy is a renewable energy source generated through the thermochemical or biochemical degradation of biomass, producing biofuels such as biogas, bio-oil, biochar, and biodiesel that can be utilized for heat, electricity generation, transport fuel, and chemical feedstock [
6,
7]. It is considered a valuable energy source due to its accessibility, affordability, reliability, and cost-effectiveness, with lower carbon emissions while supporting the principles of a circular bioeconomy [
8]. Bio-oil is a dark brown liquid derived from pyrolysis, it can be upgraded as a diesel substitute in tractors, used in broilers to heat the greenhouse, biochar as soil amendments, and applied as an eco-friendly pesticide [
7]. Despite the various applications of biofuels, less than 0.01% of biofuel contributes to the South African energy mix, creating a niche area for research and development [
9,
10]. The challenge for minimal exploration of biofuels as energy sources is due to food security concerns, investment and infrastructure to support feedstock supply, and limited tasks force in characterizing existing biomass for specific biofuel production [
9,
11].
To address land use and food security challenges, IAPs have been considered alternative energy substrates. These plants, which invade a certain habitat and negatively impact biodiversity, livelihood, and the economy [
12], infest over 10 million hectares in South Africa [
13]. For instance, Parthhenium hysterophorus reduces crop yield by 40% and poses health risks to livestock and humans by causing allergic reactions, anemia, eczema, and swelling around the eyes [
14]. Additionally, dense infestation destructs field operations, increasing fuel consumption and mechanical failures. Current control methods such as mowing, and herbicides application contribute to soil hydrophobicity, which inhibits water infiltration and exacerbates soil erosion, ultimately depleting soil nutrients [
15]. Despite an investment of R45 million to clear 17,000 ha of IAPs, the effort was inadequate [
16]. Although often viewed negatively, IAPs have been reported to have a moisture content of 3.78% and an ash content of 0.24%, indicating their potential for bio-oil production [
17]. Compared with food crops and municipal waste, IAPs generate fewer greenhouse gas (GHG) emissions and require minimal inputs such as water or fertilizers, making them affordable, accessible, and eco-friendly energy resources [
18].
Biomass varies in characteristics due to different growth conditions, making feedstock characterization crucial for targeted biofuel production [
11]. Characterization enables the selection of high-performing and sustainable feedstocks ensuring optimal conversion efficiency while minimizing processing cost. Characterizing techniques include proximate, elemental, structural, and thermal compositions. The proximate composition includes moisture content, volatile content, fixed carbon content, and ash content, which affect the efficiency of degradation [
19]. Elemental compositions such as carbon, nitrogen, oxygen, hydrogen, and sulfur influence the energy density of biomass. The structural composition includes cellulose, hemicellulose, and lignin, which provide energy-rich compounds and determine the efficiency of degradation [
20]. The thermal composition includes the higher heating value (HHV), which is the amount of thermal energy produced in the form of heat when biomass is combusted in the presence of oxygen [
21].
In this study, approximately 117 major invaders were mapped via the Conservation of Agricultural Resources Act [
13]. Among the major invaders, three nonwoody IAPs (
Lantana Camara,
Chromoleana Odorata, and
Solanum mauritianum) and three woody IAPs
(Acacia Mearnsii,
Eucalyptus Grandis, and
Pinus Patula) were selected. This study aims to investigate the physiochemical characteristics of IAPs for bio-oil production. The structure of this work is as follows: (1) structural analysis via the Van Soest fiber analysis method; (2) elemental analysis via the Flash 2000 elemental analyzer; (3) proximate analysis via the American Society for Testing Materials (ASTM); (4) atomic ratios, which compare IAPs with other South African energy substrates; (5) thermal analysis via HHV equations from structural, elemental, and proximate compositions; and (6) thermogravimetric analysis (TGA). Furthermore, statistical analysis methods compare these characteristics between nonwoody and woody plants. This study contributes towards promoting a waste-to-energy approach using IAPs, providing bio-oil as a renewable fuel for farm operations, and enhancing land productivity by managing IAPs sustainably.
2. Materials and Methods
Three woody IAPs, namely, Acacia mearnsii, Eucalyptus grandis, and Pinus patula, and three nonwoody IAPs, namely, Lantana camara, Chromoleana odorata, and Solanum mauritianum, were selected and evaluated for bio-oil production. Woody IAPs and nonwoody IAPs were sourced from the Institute of Commercial Forestry Research and Athlone region, respectively, both of which are in Pietermaritzburg, South Africa. Pietermaritzburg is located at 29°37′S, 30°23′E, and has an average rainfall of 832 mm. The typical maximum and lowest temperatures are 26 °C and 11 °C, respectively.
2.1. Materials
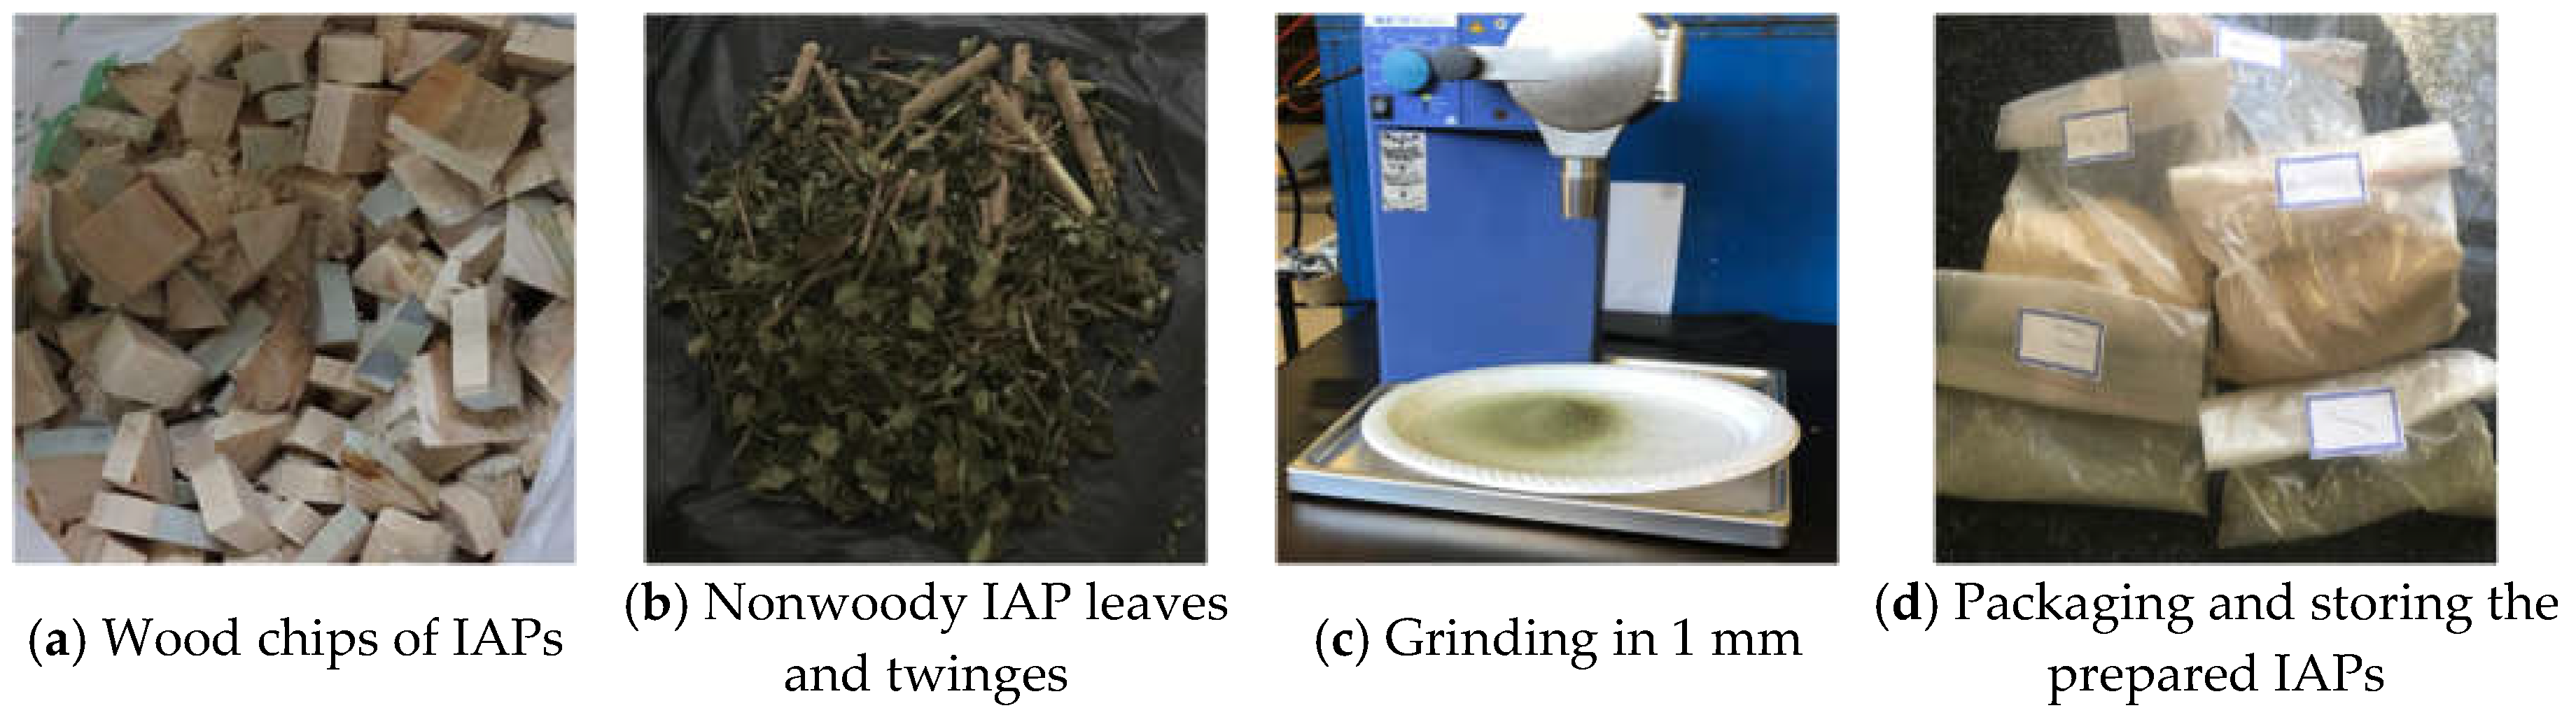
The woody part of the biomass (stem) aged 10 years was used as a working sample for woody IAPs, as proposed by Cichy et al. [
22]. The stems were chopped into cubes of approximately 20 mm for drying and grinding [
23]. The nonwoody biomass consisted of wood twigs and leaves that had been cut into 20 mm long pieces for drying and grinding [
24]. An identical preparation protocol was used for both woody and nonwoody biomass samples, which involved setting an oven air dryer to 60 °C for 24 hours [
25]. After drying, a 1 mm sieve was fitted to a grinding machine to grind the dry materials. After being ground, the samples were wrapped in plastic bags with labels and kept in a desiccator to keep moisture out [
8].
Figure 1 illustrates the stages of preparing woody and nonwoody IAPs for characterization.
2.2. Methods
An experimental investigation was conducted to assess the potential of woody and nonwoody IAPs as energy substrates for bio-oil production via pyrolysis. The biomass was characterized via the structural, elemental, proximate, atomic ratio, heating value, and combustion behavior analyses. Each analysis was performed via standardized protocols and instruments, as outlined in the subsequent sections. To ensure the reliability of the findings, all the experiments were conducted in triplicate, and the results are presented as the means.
2.2.1. Structural Analysis
Biomass contains cellulose, hemicellulose, and lignin in its structural makeup. The van Soest fiber analysis by Singh et al. [
26] was used to determine the structural composition. The experiment was conducted at Cedara College of Agriculture, Pietermaritzburg, South Africa. Van Soest fiber analysis uses neutral detergent fiber (NDF), which removes all nonstructural extracts and leaves hemicellulose, cellulose, and lignin, and acid detergent fiber (ADF), which removes hemicellulose, leaving cellulose and lignin. The acid detergent lignin (ADL) leaves lignin only.
For NDF, approximately 1 g of the powdered sample was placed in a crucible, and approximately 100 ml of a neutral detergent solution (sodium borate decahydrate) with 0.5 g of sodium sulfate and some drops of n-octanol were added at room temperature [
26]. The solution was boiled at
and refluxed for 60 minutes from the onset of boiling. The crucible was dried at
for 8 h and weighed. Equation (1), where Wt is the weight (g), was used to determine the total fiber content of the plant [
26].
For analysis of ADF, the same procedure was used but with the acid detergent (sulphuric acid 1 N). Equation (2) was used to calculate the cellulose and lignin contents in the fiber.
The acid detergent lignin (ADL) content was determined by adding 72% sulfuric acid and constantly stirring for 3 hours. The mixture was then filtered, washed with water twice, and placed in a hot air oven at
for 8 h, after which weight loss was recorded. Equation (3) was used to calculate the lignin content in the fibers.
Equations (4)–(6) were used to calculate the amount of hemicellulose, cellulose, and lignin in a substrate [
8].
2.2.2. Elemental Analysis
The elemental composition of biomass includes major organic elements, namely, carbon (C), sulphur (S), hydrogen (H), oxygen (O), and nitrogen (N) [
26]. The elemental analysis was performed at the University of Kwa-Zulu Natal (UKZN) Physics and Chemistry Laboratory in Pietermaritzburg via a Thermo Scientific Flash 2000 CHNS analyzer. This elemental analysis method was used by Singh et al. [
26], where approximately 1 mg of each powdered sample was placed in a tin capsule. The tin capsule with biomass was weighed and heated at
with a constant flow of helium enriched with oxygen. The mass percentages of C, H, N, and S were determined via Eager 300 software. Equation (7) was used to calculate the mass percentage of oxygen by subtracting the amount of CHNS from 100, as proposed by Reza et al. [
23].
2.2.3. Proximate Analysis
The percentage weights of the moisture content, ash content, volatile content, and fixed carbon are referred to as the proximate composition. The proximate properties were determined according to the standards of the ASTM.
The moisture content (MC) was determined according to the ASTM D 2974-8 standard, as referenced by Mishra and Mohanty [
27]. Approximately 5 g of the solid sample was placed in a crucible and weighed at room temperature. The crucible was placed in an oven air dryer at
for
After 24 hours, the sample was placed in a desiccator to cool. Once the sample reached room temperature, it was weighed again, and the MC was calculated via Equation (8), where
represents the initial weight of the sample before heating (g) and where (
) represents the final weight of the sample after heating (g).
The ash content (AC) was determined following the ASTM 3173--87 standard, as referenced by Mishra and Mohanty [
27]. A dried sample of 5 g was stored in a crucible and placed in a preheated muffle furnace at
for 3 hours for combustion. After the sample had cooled, it was weighed, and Equation (9) was used, where (
) is the weight of the sample after combustion (g).
The volatile content (VC) was determined following the ASTM D4559-99 standard, as referenced by Mishra and Mohanty [
27]. A dried sample of 5 g with a particle size of 1 mm obtained via the MC determination technique was placed in a furnace for 7 minutes at
, the sample was removed and allowed to cool to room temperature, and the final mass was weighed. Equation (10) was used to calculate VC, where (
) is the weight of the content remaining after volatile compounds were released (g).
The fixed carbon (FC) content was determined via Equation (11) via the values of ash content and volatile content obtained via Equations (9) and (10) [
28].
2.2.4. Van Krevelen Diagram
The van Krevelen diagram was employed to assess the energy density of IAPs compared with other biomass substrates in South Africa, such as cow manure, fruit and vegetable waste, and cassava tubers. The atomic ratios of hydrogen to carbon (H:C) and oxygen to carbon (O:C) were calculated via Equations (12) and (13), respectively. The values were then used to plot the van Krevelen diagram [
29].
2.2.5. Higher Heating Value (HHV)
The HHV was obtained via formulas derived from the literature based on structural, elemental, and proximate compositions of woody and nonwoody biomasses. This approach provides a comprehensive understanding of how each characteristic impacts the thermal stability, energy content, and combustion behavior of IAP species. Three equations were adopted from each composition to increase the reliability of the results, as depicted in
Table 1. These equations have also been utilized by other researchers for similar species, such as
A. mearnsii,
C. odorata, and
A. donax [
29,
30].
2.2.6. Thermogravimetric Analysis
Thermogravimetric analysis (TGA) was used to analyze the thermal degradation of the sample to better understand the pyrolysis process and temperature ranges for pyrolysis feeding for bio-oil production. For this analysis, a DTG–60H simultaneous analyzer was used, with approximately 10 mg of the sample carefully placed in an aluminum pan within a well-balanced holder [
37]. Mishra and Mohanty [
27] used TGA, where the sample underwent analysis at various temperatures; initially, at 30 °C, the temperature was increased to 10 °C/min, and the sample was held for 2 min under a
nitrogen atmosphere. The sample was subsequently subjected to 600 °C at 10 °C/min and held for 2 min under a
nitrogen atmosphere for further degradation. Throughout the experiment, the sample mass loss was continually recorded and displayed via TGA and differential thermogravimetry (DTG) curves. TGA measures the change in mass of a sample, whereas DTG provides information on the rate of mass loss, which aids in understanding the heat breakdown behavior of a material [
38].
2.2.7. Statistical Analysis
Statistical analysis was performed via SPSS software version 11 to evaluate variations and trends in the physicochemical composition of woody and nonwoody IAPs for bio-oil production. Descriptive statistics, including means, were used to summarize the data. Furthermore, t-tests at the 5% significance level and two-way ANOVA were conducted to determine significant differences between the groups.
3. Results and Discussion
3.1. Structural Analysis
The percentages of cellulose, hemicellulose, and lignin in the IAPs were 47.5, 22.6 and 22.8%, respectively, for woody IAPs and 23.7, 15.9 and 8.7%, for nonwoody IAPs, as shown in
Table 2. Compared with nonwoody IAPs, woody IAPs had a significantly greater (p < 0.05) structural composition. This difference is attributed to the maturity of woody species, which develop stronger tissues over their longer lifespan (10 years) than do the flexible, less structured tissues of perennial nonwoody species [
39]. This is also validated by [
40], who reported a greater structural composition in sapwood (31%) than in herbaceous species (10%). In terms of bio-oil production, woody IAPs, particularly
P. patula, presented greater potential for higher yields than nonwoody IAPs did. This is due to their relatively high contents of cellulose (30 to 60%) and hemicellulose (20 to 40%), both of which fall within acceptable thresholds and contain volatile compounds that readily condense to bio-oil [
41,
42]. The higher yield of bio-oil derived from woody IAPs can be blended with diesel to power direct injection engines in agricultural tractors. This approach enhances the ignition quality while reducing NOx and CO emissions, making it a cleaner and more efficient alternative [
43].
Although higher bio-oil yields are expected, the stable and resistant structure of lignin favors biochar over bio-oil production, requiring higher temperatures for optimal pyrolysis [
44]. However, the resulting biochar can be applied to the soil to improve water infiltration, pH, and microbial biomass, ultimately enhancing the growth of plants [
45]. Ayaa, Lubwama, Kirabira and Jiang [
11] noted similar trends for
Acacia mearnsii which contained 40.2% cellulose, 21.3% hemicellulose, and 14.7% lignin. Variations in lignin content are attributed to differences in growing conditions, such as high rainfall promoting faster growth with less lignin.
This section provides a holistic understanding of how structural composition influences bio-oil yield and the feasibility of woody IAPs as a bio-oil energy source for agricultural tractors. Utilizing bio-oil can reduce dependence on fossil fuels while improving soil fertility. Further research is needed on identifying energy sources for effective pyrolysis processes along with subsequent bio-oil upgrading techniques.
3.2. Elemental Analysis
The yield and quality of bio-oil produced by IAPs can be influenced by the elemental composition; hence, these factors require investigation. According to
Table 2, there were no significant variations (P > 0.05) in the elemental compositions of woody (48.6% carbon and 6.0% hydrogen) and nonwoody (47.6% carbon and 6.2% hydrogen) IAPs. This is because the IAPs have similar compounds, such as cellulose, hemicellulose, and lignin, that have the same element profile with the same synthesis process. Both woody and nonwoody IAPs have carbon contents between 30% and 60% and hydrogen contents between 5% and 6%, which are optimal for HHV, increasing the efficiency of combustion. The bio-oil derived from both woody and non-woody IAPs can be blended with ethanol and used in gas turbine combustors providing power in irrigation systems or heating greenhouses. Bio-oil tested in gas turbine resulted in electric power output of 75 kW, bio-oil tested in gas turbine resulted in electric power output of 75 kW, adequate for farm lighting or grain drying [
43].
The oxygen content of the woody IAPs was 45.1%, whereas that of the nonwoody IAPs was 43.0%, as shown in
Table 2. Other researchers have obtained similar values that tend to range between 30 and 45%, and such low concentrations reduce the HHV of bio-oil, resulting in poor flame stability [
42]. A lower HHV causes heat output fluctuations and incomplete combustion; therefore, upgrading techniques such as deoxygenation is essential [
46]. The oxygen content leads to the formation of fatty acids, long-chain fatty acids, esters, and phenolic derivatives known as biopesticide compounds for crop protection [
47]. This offers an eco-friendly alternative to synthetic chemicals, managing pests without harming the environment and non-target organism
Woody IAPs contained approximately 3.2% nitrogen with no detectable sulphur, whereas nonwoody IAPs contained no nitrogen or sulphur. The reason for the lack of detection was that elements present at lower concentrations (less than 1%) could not be detected by the CHNS element analyzer [
48]. The absence of detectable nitrogen and sulphur in IAPs suggests that bio-oil production can have a minimal environmental impact and reduce health risks, as it limits the formation of NOx and SOx emissions. The elemental composition of woody and nonwoody biomass in a study by Shrivastava et al. [
8] was comparable to that of carbon (44.9 to 47.6%), hydrogen (5.9 to 6.2%), oxygen (45.9 to 46.3%), nitrogen (0.3 to 1.5%), and sulphur (0.03 to 1.5%).
Overall, both woody and nonwoody IAPs exhibit favorable characteristics for supplying high energy efficiency and reducing GHG emissions while protecting agricultural production. This section provides a comprehensive understanding of how the elemental composition influences bio-oil quality and may affect pyrolysis efficiency.
3.3. Proximate Analysis
The pyrolysis process as well as the yield and quality of the bio-oil produced from IAPs are influenced by the proximate composition. Hence, investigating these factors is mandatory. According to
Table 2, there were no significant differences (P > 0.05) in moisture content or volatile content between woody and nonwoody IAPs. The proximate analysis yielded 2.9% moisture content and 87.3% volatile content for woody IAPs, 3.7% moisture content, and 84.1% volatile content for nonwoody IAPs. The results of this study indicate that both woody and nonwoody IAPs have greater potential for increasing yields of bio-oil. This is attributed to an MC below 10%, which enables more energy for pyrolysis than energy for moisture evaporation thus more energy efficient for agricultural tractors and machinery [
49]. Furthermore, the higher concentrations of volatile compounds (between 65% and 85%) indicate that greater amounts of volatile compounds can be condensed into bio-oil during pyrolysis [
28,
50]. The MCs of the other nonwoody and woody biomasses were between 6.48% and 7.13%, which differed from what was obtained in this work [
8]. This may be attributed to the lack of standardized methods for determining proximate analysis, as shown in studies by [
23], who conducted their analysis at 105 °C for only 3 hours, and by [
51] at 105 °C for 24 hours.
The results in
Table 2 show that there were significant variations (P < 0.05) in ash and fixed carbon contents between woody and nonwoody IAPs. The analysis yielded 2.2% ash content and 7.6% fixed carbon for woody IAPs 8.8% ash content and 3.5% fixed carbon content for nonwoody IAPs. This difference is related to a study conducted by Bakker and Elbersen [
52] on the accumulation of ash in nonwoody plants because higher silica uptake strengthens the cell walls of plants to protect them against harsh environmental conditions. For this work, the ash content in woody IAPs is ideal for bio-oil production, as it is within the acceptable threshold of 0.1 to 5%. However, for nonwoody IAPs, the ash content concentrations are higher than the acceptable threshold, which may lead to toxic components such as silica, slagging, and corroding pyrolysis reactors [
53].
Woody IAPs are more suitable for bio-oil production due to lower levels of moisture and ash content, ensuring efficient combustion. Standardized testing methods for proximate analysis are crucial for reliable and comparable results.
3.4. Van Krevelen Diagram
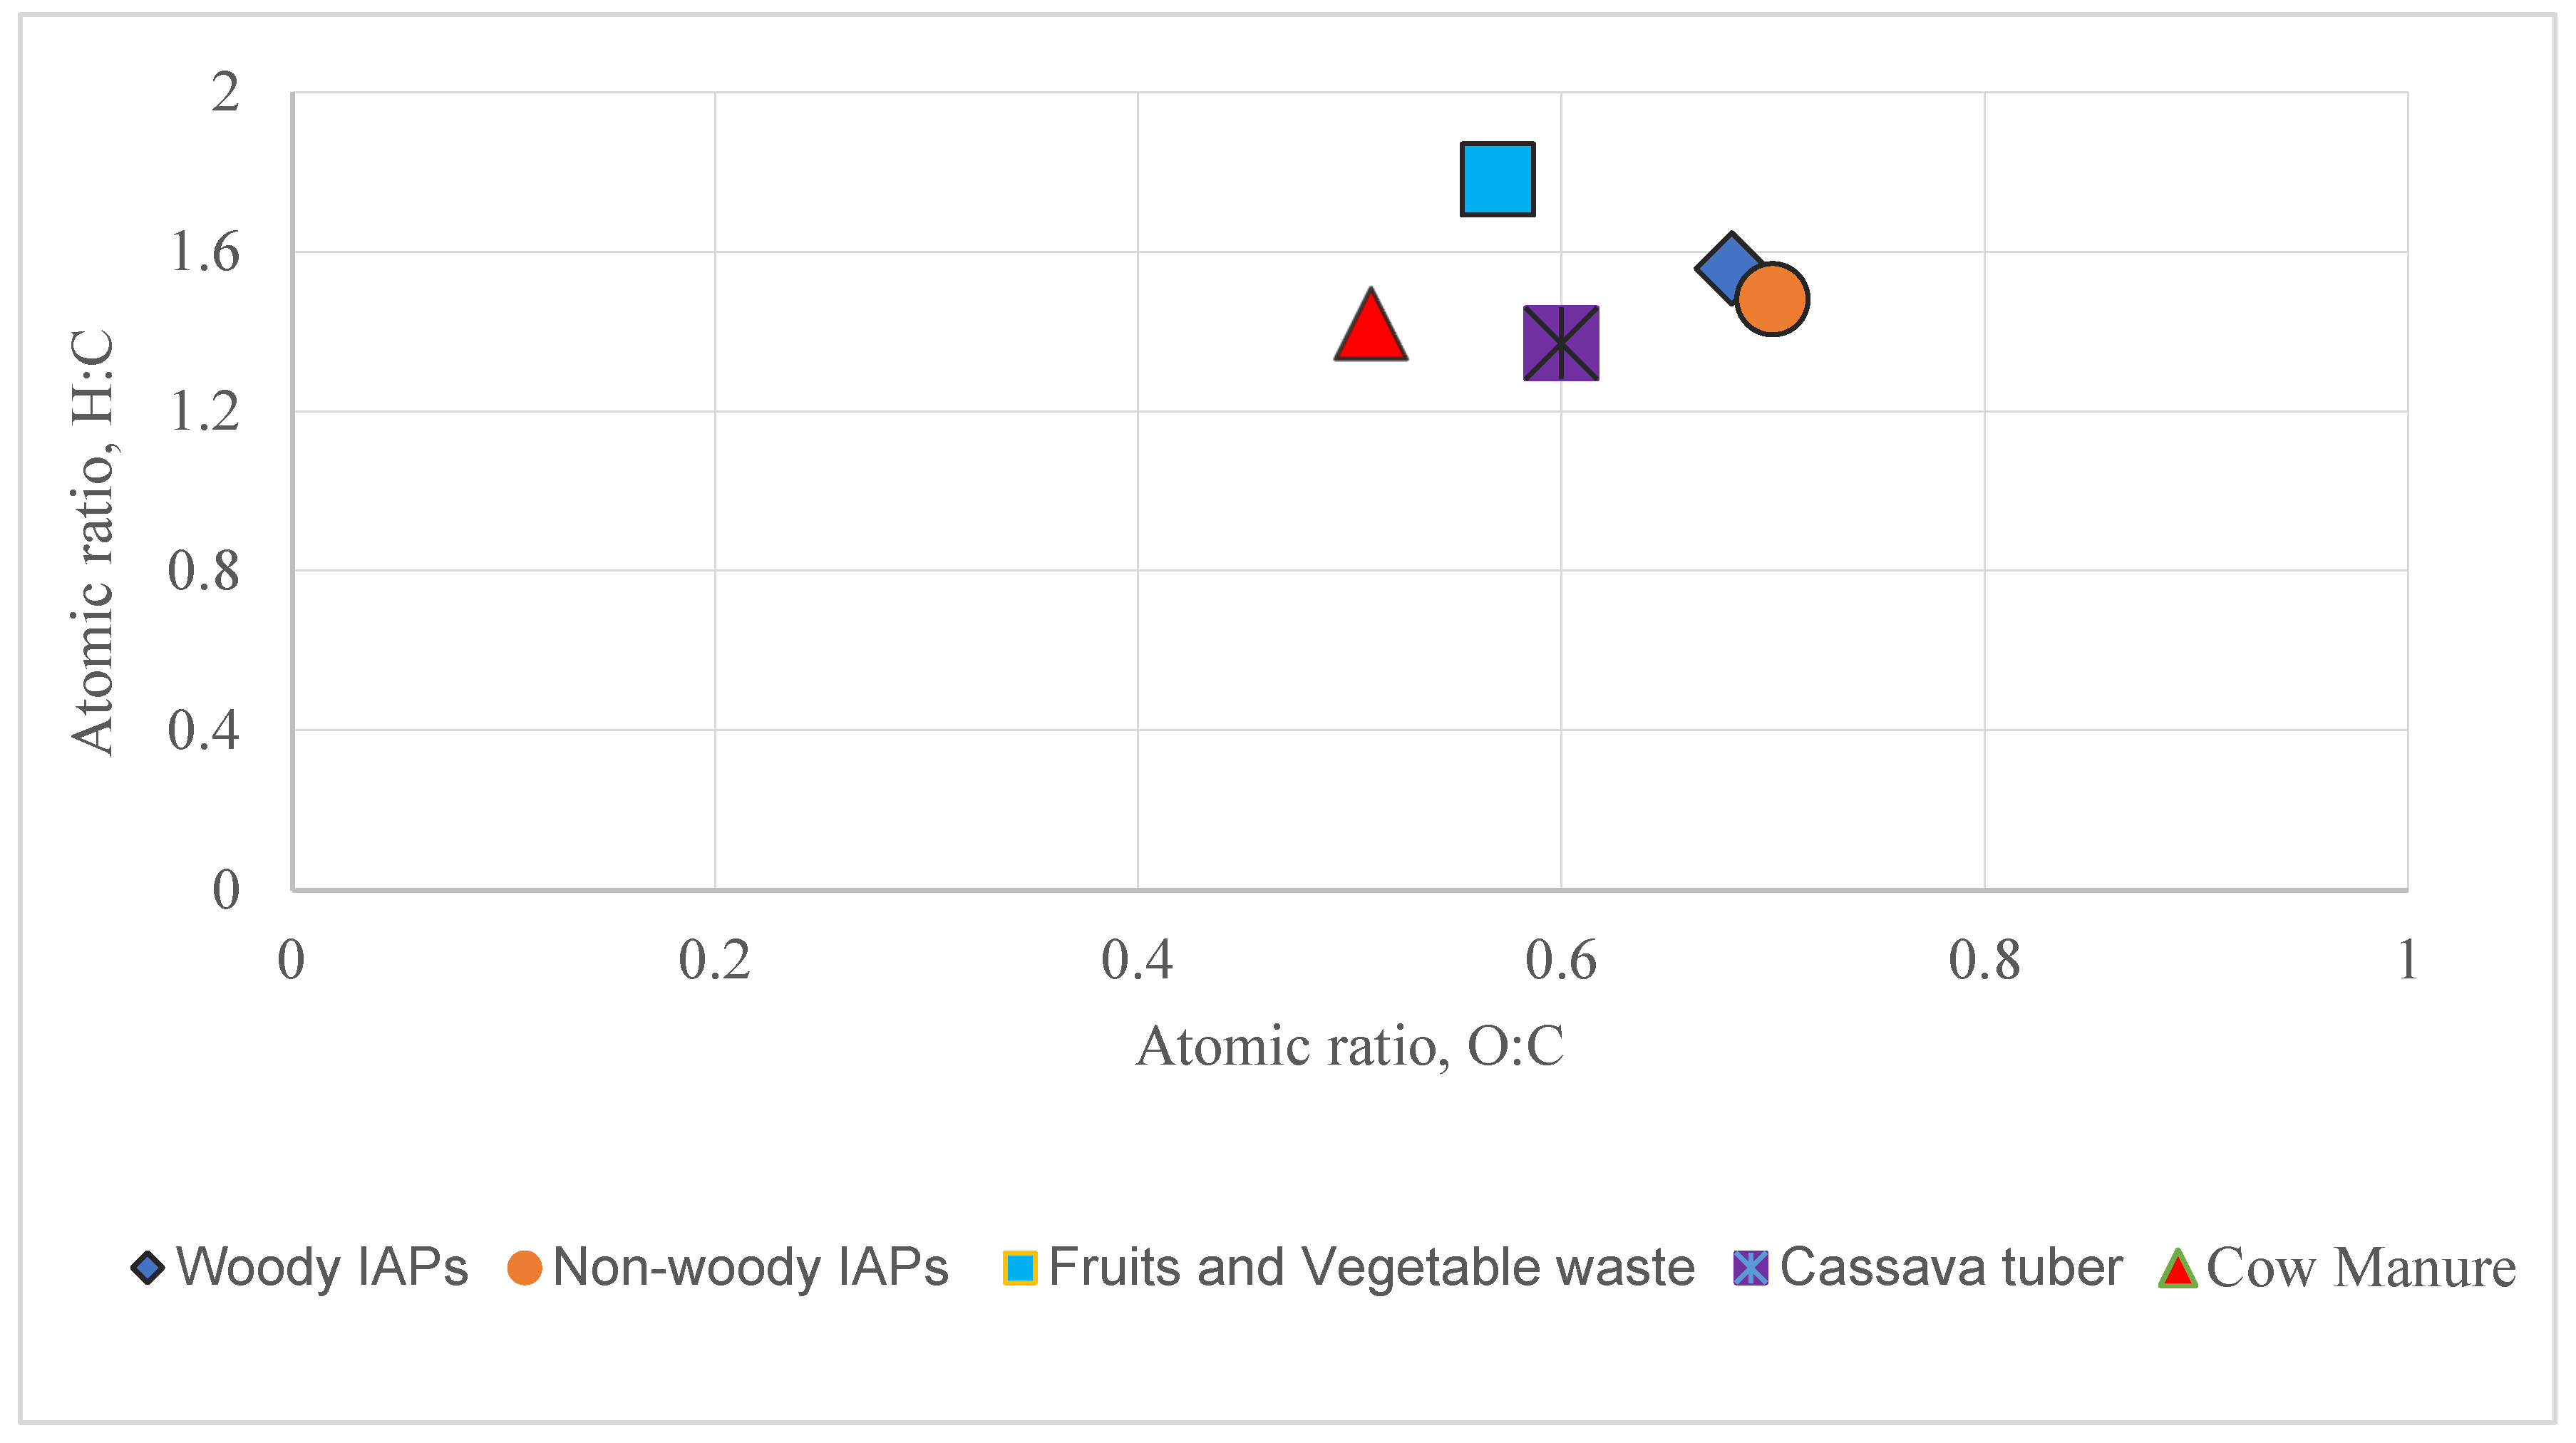
The hydrogen-to-carbon (H: C) and oxygen-to-carbon (O: C) atomic ratios of woody and nonwoody IAPs with other South African biomasses, such as cow manure, fruit and vegetable waste, and cassava tubers, are shown in
Table 3. This comparison highlights the potential of IAPs as competitive feedstocks for bio-oil production relative to alternative energy substrates, as presented in
Figure 2. The results indicate that fruit and vegetable wastes had the highest H: C ratio with a lower O: C ratio than woody and nonwoody IAPs, making them the most viable substrate for bio-oil production. This occurred because the H: C ratio was within the range of 1.5 to 2.5, and such levels increase the HHV. The O: C ratio of fruits and vegetables was within the range of 0.1 to 0.6, suggesting an increase in C–C bonds, and such a scenario lowers the number of oxygen-containing compounds [
27,
54,
55]. For woody and nonwoody IAPs, the H: C ratio is within the acceptable threshold indicating better fuel quality, whereas the O: C ratio is greater than the acceptable threshold, making IAPs less viable for bio-oil yield than fruits and vegetable wastes. Even though fruit and vegetable waste has good carbon and hydrogen contents, they have the disadvantage of higher MCs (58.4%), which translates to higher transport costs and lower energy conversion efficiency [
49]. Compared with bio-oil, cow manure, and cassava tubers, which have lower H: C ratios, are more likely to favor biochar production.
For the quality of bio-oil, the van Krevelen diagram in
Figure 2 classified bio-oil compounds in this manner: lipids (0 ≤ O/C ≤ 0.2, 1.7 ≤ H/C ≤ 2.25), unsaturated hydrocarbons (UHs, 0 ≤ O/C ≤ 0.1, 0.7 ≤ H/C < 1.7), condensed aromatic hydrocarbons (CAHs, 0 ≤ O/C ≤ 1.0, 0.3 ≤ H/C ≤ 0.7), phenolic-like species (0 ≤ O/C ≤ 0.6, 0.6 ≤ H/C ≤ 1.3) and saccharides (sugars, 0.5 ≤ O/C ≤ 0.9, 1.2 ≤ H/C ≤ 2.25) [
56]. The results suggested that all the substrates predominantly produce saccharide-derived sugars. These sugars, such as levoglucosan and cellobiosan, are produced during the degradation of cellulose and hemicellulose and reduce the hydrogen content, promote coke formation, and deactivate catalysts [
57]. This means that bio-oil remains highly oxygenated and can cause potential corrosion in pyrolysis reactors.
Overall, both woody and nonwoody IAPs show promising characteristics for bio-oil production but not as fruit or vegetable waste. The saccharide-derived sugars in bio-oil could be extracted through a water-washing procedure before the refining process.
Table 3.
Atomic ratios of woody and nonwoody IAPs to other South African substrates.
Table 3.
Atomic ratios of woody and nonwoody IAPs to other South African substrates.
| Biomass |
O: C |
H: C |
References |
| Woody IAPs |
0.68 |
1.56 |
Present study |
| Nonwoody IAPs |
0.7 |
1.48 |
Present study |
| Cow manure |
0.51 |
1.42 |
[58] |
| Fruits and vegetable waste |
0.57 |
1.78 |
[59] |
| Cassava Tuber |
0.6 |
1.37 |
[59] |
3.5. Higher Heating Values
The HHV of biomass influences the HHV of bio-oil; hence, a comprehensive investigation is essential.
Table 4 shows that the HHV of woody IAPs based on structural composition was 18.4 MJ/kg, whereas that of nonwoody IAPs was 17.2 MJ/kg. The HHV of woody IAPs is greater than that of nonwoody IAPs, which may be attributed to greater amounts of cellulose, hemicellulose, and lignin, as discussed in
section 3.1. These results suggest that prioritizing woody IAPs could improve bio-oil quality, which could translate into an efficient combustion process. Although woody IAPs exhibit HHVs, pretreatment methods with higher energy inputs are essential during pyrolysis to depolymerize the complex structure of lignin.
Furthermore, from
Table 4, the HHV of woody IAPs based on elemental composition was 19.5 MJ/kg, whereas that of nonwoody IAPs was 19.1 MJ/kg. The HHVs for woody and nonwoody IAPs were almost the same due to the similarity in their elemental compositions, with carbon (48.6 and 47.6) % and hydrogen (6.00 and 6.2) %, respectively. This indicates that the HHV in bio-oil is derived from both feedstocks; however, the higher content of oxygen-containing compounds can hinder the thermal stability of bio-oil, as discussed in
section 3.2. Notably, the HHV from the elemental composition was the highest among all the HHV derived from the proximate and structural compositions because of the combustible elements such as carbon and hydrogen [
60,
61]. A study by Sheng and Azevedo [
21] revealed that the proximate composition indirectly estimates the heating value, as it accounts for noncombustible components such as moisture and ash, whereas the structural composition may be affected by the complex lignin structure, leading to incomplete combustion. HHVs ranging from 17 to 20
and 15 to 19
, respectively, from other researchers were reported for both woody and nonwoody samples, which is in accordance with the results obtained in this study [
62].
Table 4 further presents different South Africa energy coal, both woody and non-woody IAPs resemble peat coal, which is low low-energy fuel that could be utilized for heating in agriculture. Overall, this section highlighted the influence of each composition with elemental composition production of higher calorific value to increase combustion efficiency.
Table 4.
HHV of woody and nonwoody IAPs derived from structural, elemental, and proximate compositions.
Table 4.
HHV of woody and nonwoody IAPs derived from structural, elemental, and proximate compositions.
| Species |
|
|
|
| Woody IAPs |
| A. mearnsii |
18.3 |
17.9 |
18.9 |
| E. grandis |
18.1 |
20.4 |
18.5 |
| P. patula |
18.8 |
20.2 |
18.8 |
| Nonwoody IAPs |
| L. camara |
17.3 |
19.5 |
16.4 |
| C. odorata |
17.2 |
18.9 |
16.7 |
| S. mauritianum |
17.0 |
19.1 |
16.2 |
| South African Coal |
| Coal |
Higher heating value (MJ/kg) [63] |
| Peat |
17.4 to 22.4 |
|
|
| Lignite |
26.5 to 31.7 |
|
|
| Bituminous |
19.9 to 36.4 |
|
|
| Anthracite |
30.6–36.2 |
|
|
3.6. Thermogravimetric Analysis
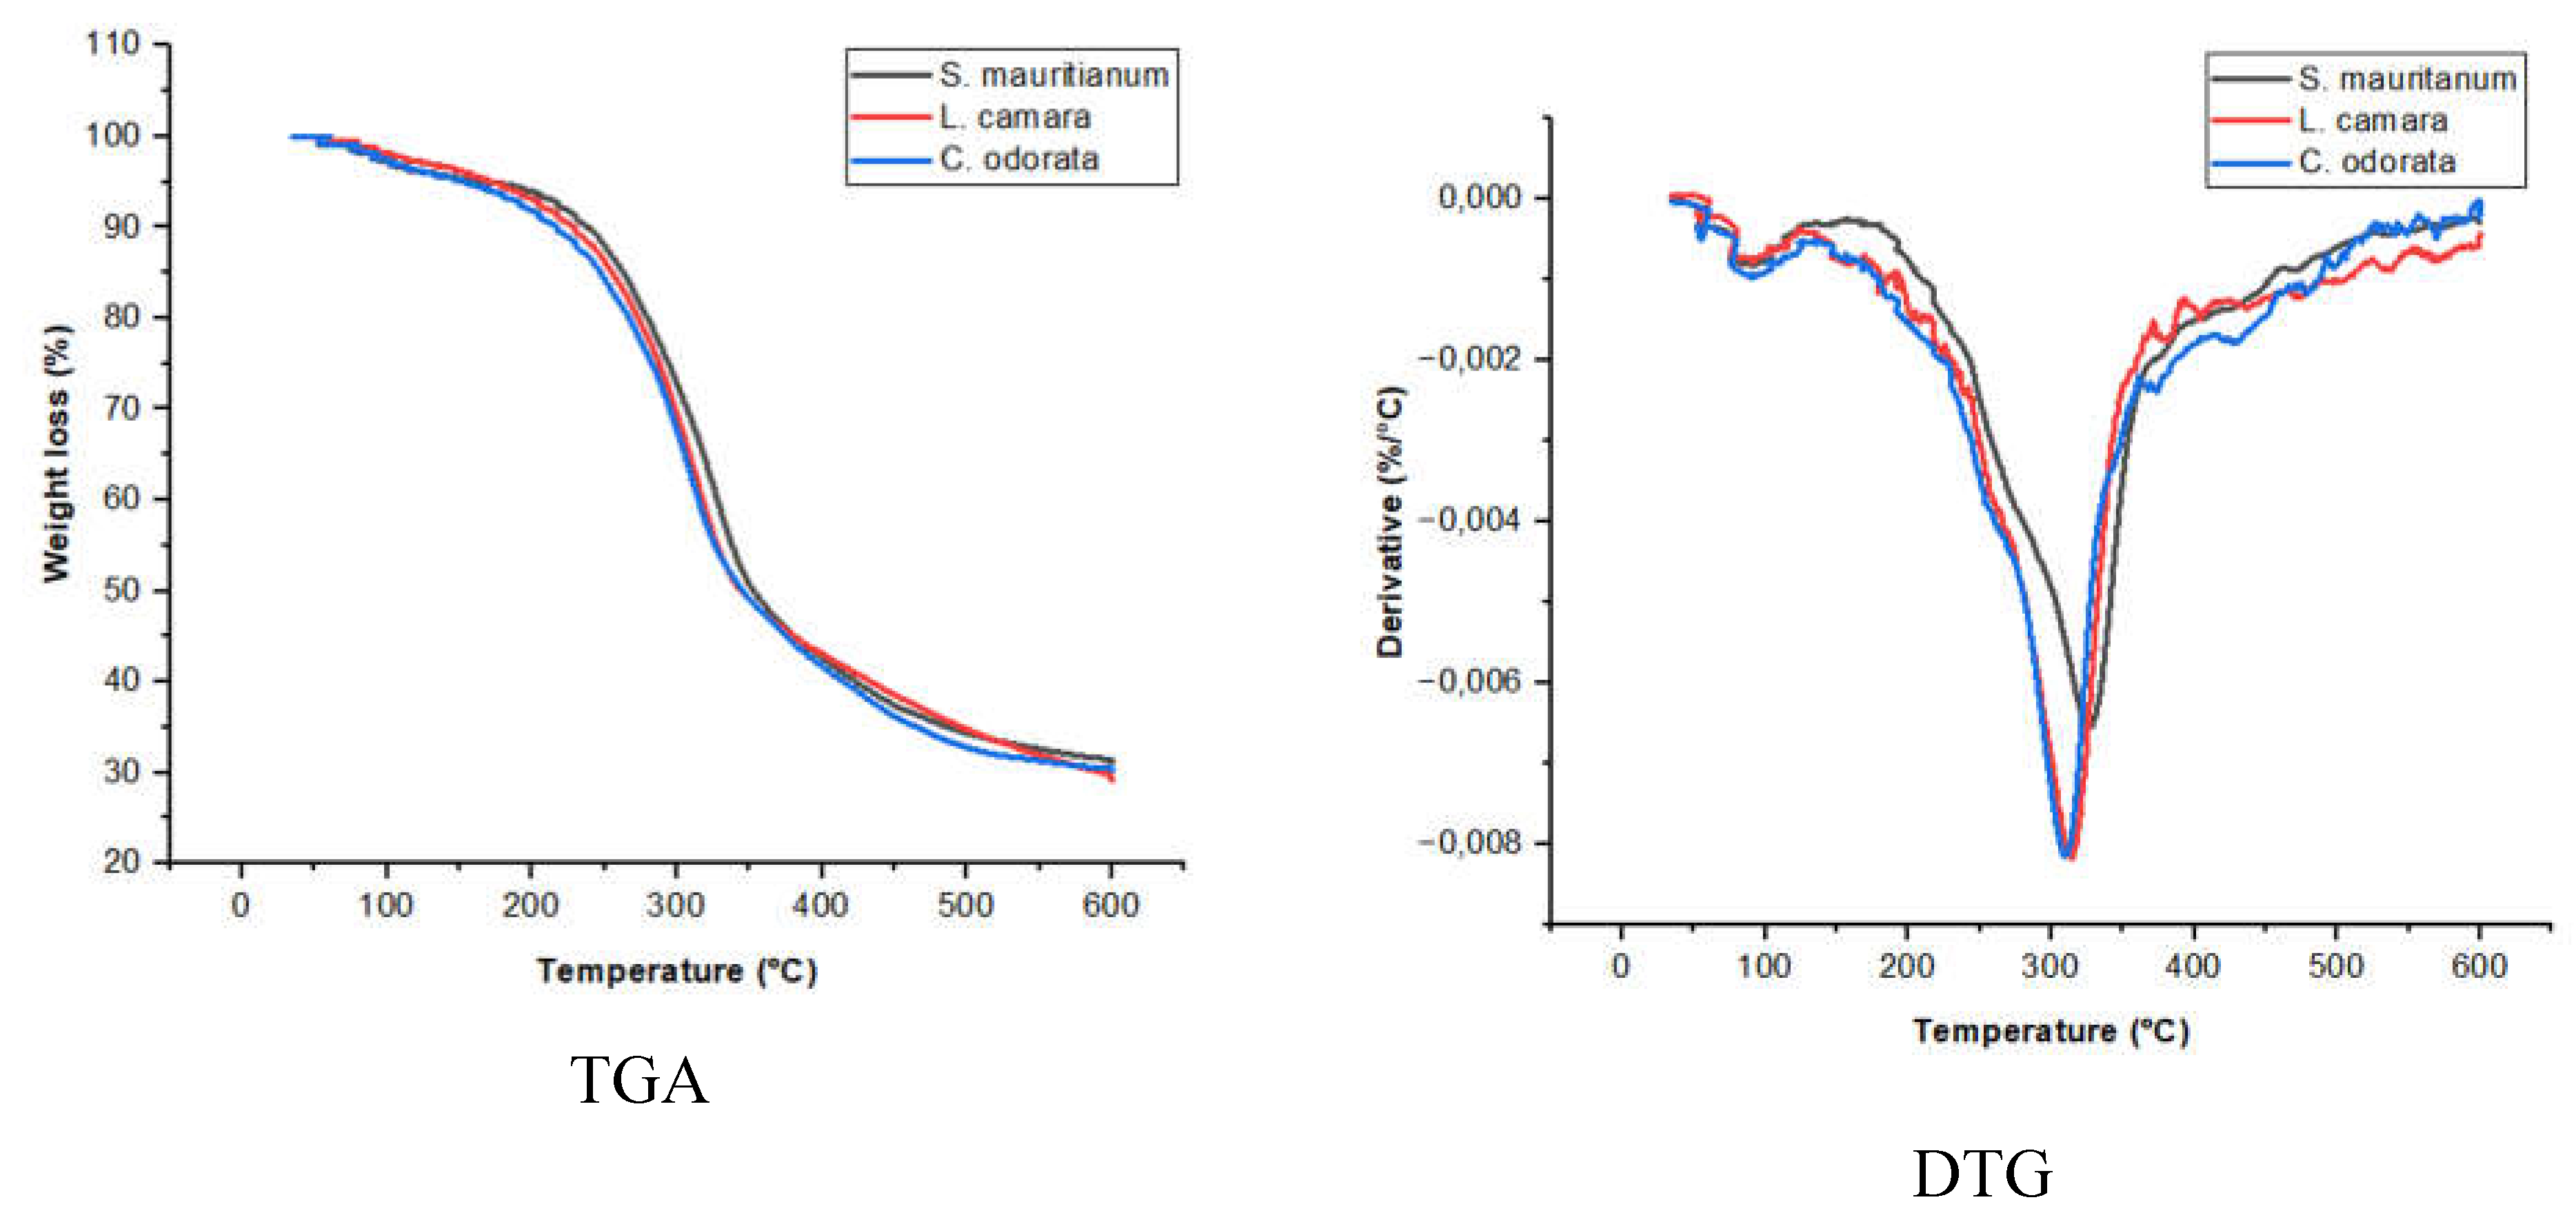
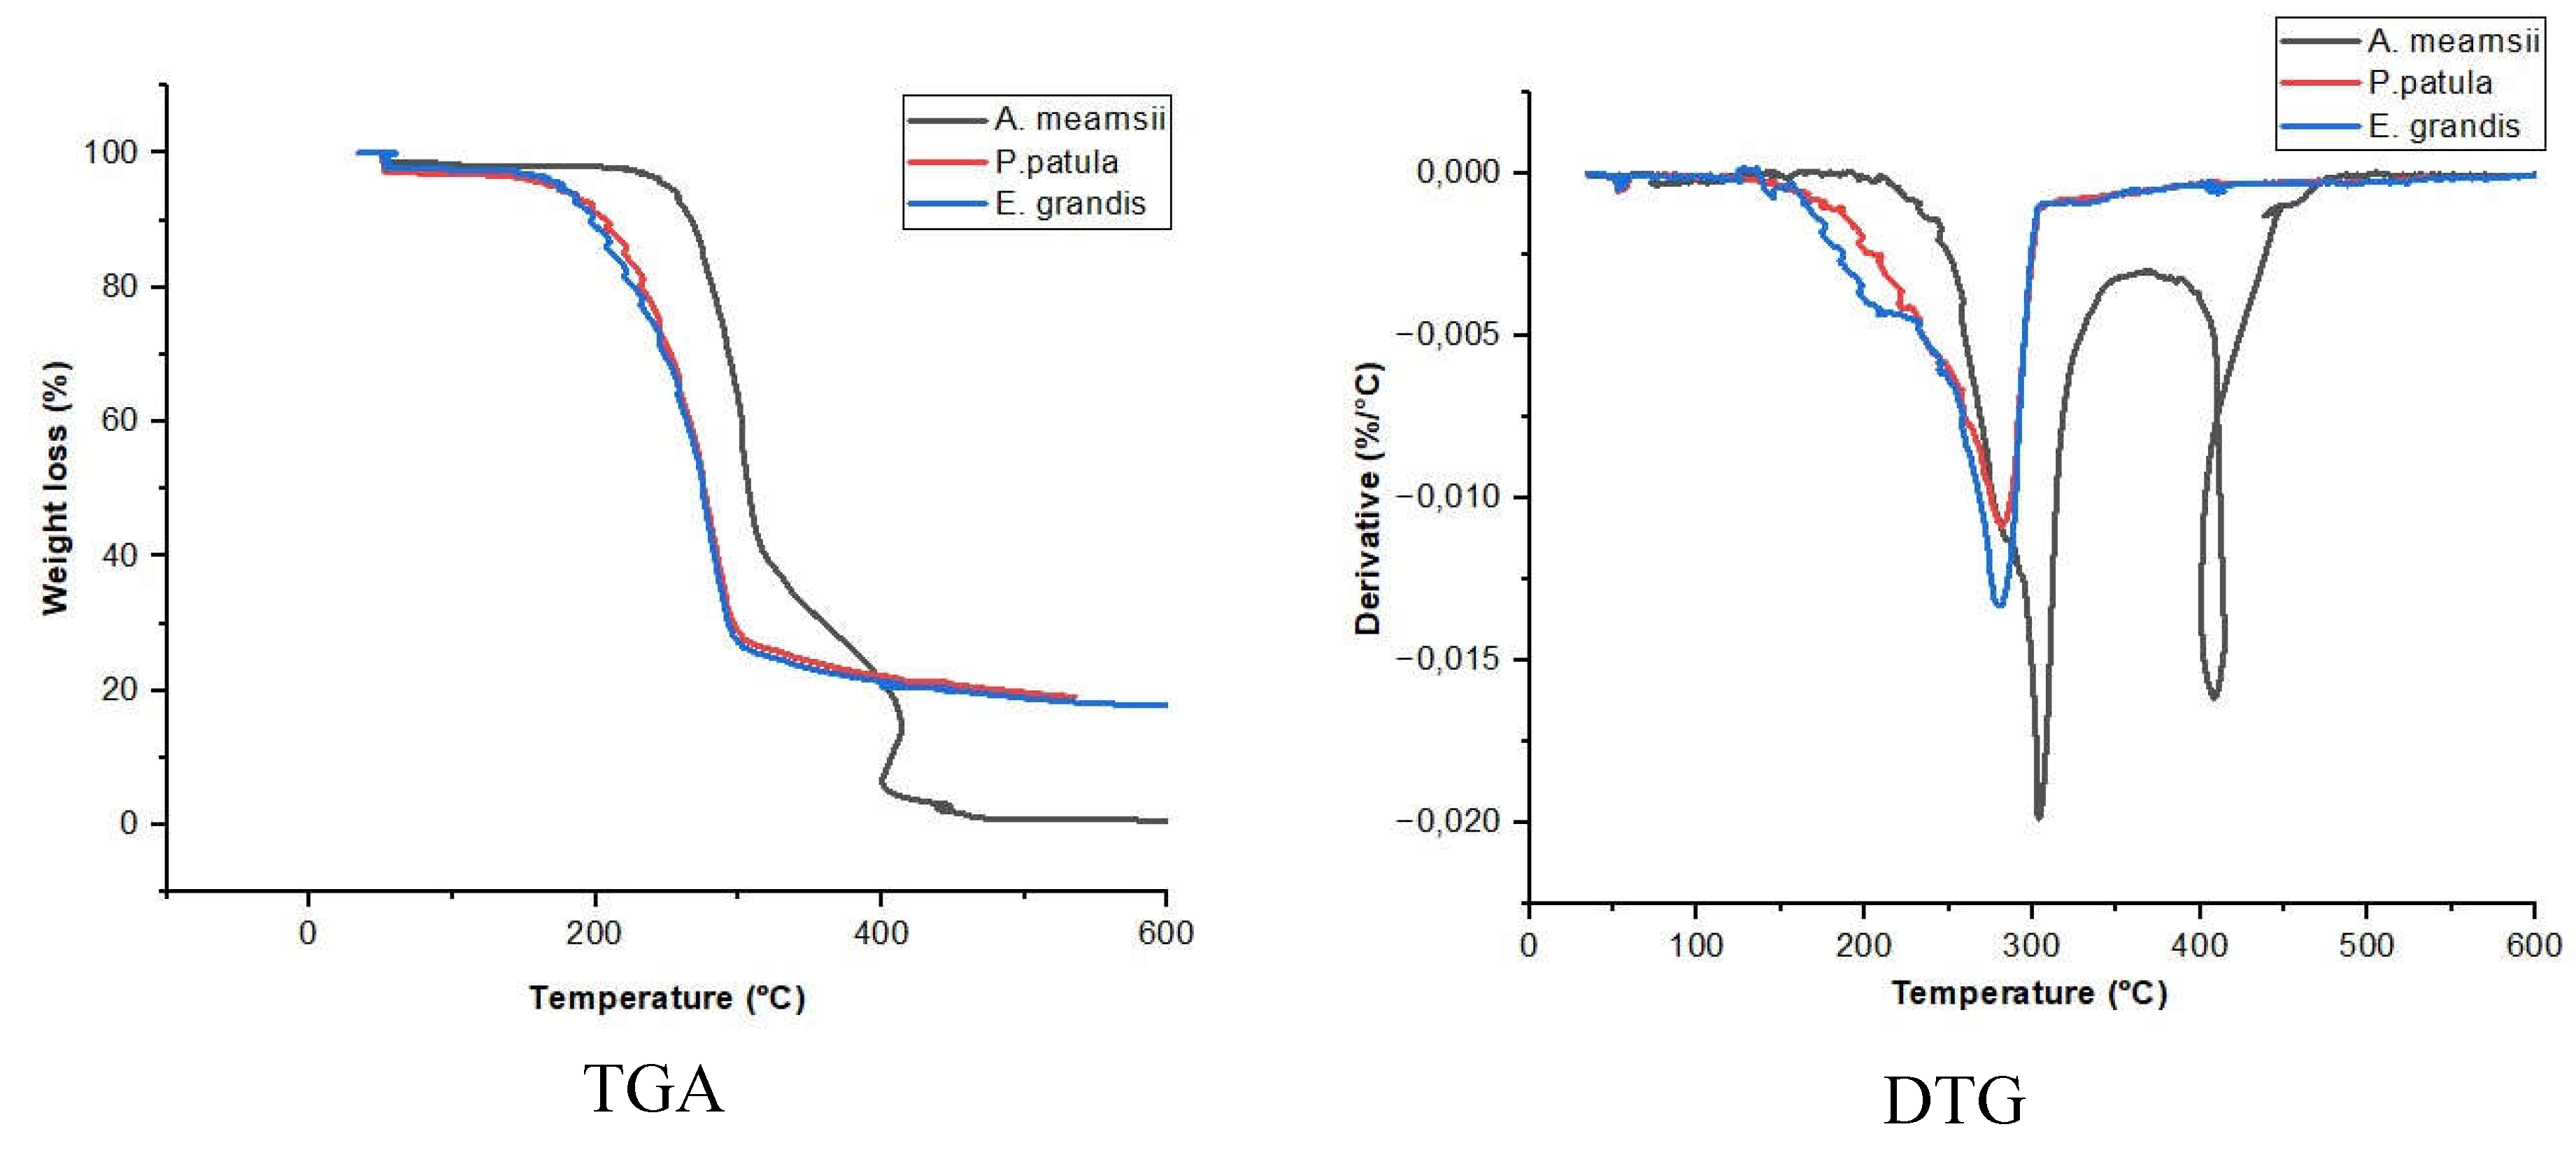
The objective of performing thermal analysis was to examine the thermal behavior of IAPs and determine the optimal stages and temperature ranges for pyrolysis to achieve the maximum bio-oil yield.
Figure 3 and
Figure 4 show the thermogravimetric analysis (TGA) and differential thermogravimetry (DTG) curves produced for nonwoody and woody IAPs after thermal analysis, respectively. A summary of the data extracted via TGA and DTG is shown in
Table 5, with
representing weight loss,
representing the initial temperature,
representing the final temperature and
representing the peak temperature. The results in
Table 5 show three stages of pyrolysis. The first stage is the dehydration region at temperatures ranging from 33 to
for nonwoody IAPs and 33 to 205 °C for woody IAPs, with a negative peak observed at 110 °C in DTG (
Figure 4). This stage is not designed for bio-oil production but primarily involves the released moisture with no volatile compound emissions. The second stage, referred to as active pyrolysis, occurs between 180 and 480
°C for nonwoody IAPs and between 205 and 470 °C for woody IAPs. This stage is crucial for the optimal yield of bio-oil because of the degradation of cellulose and hemicellulose, which release volatile compounds that readily condense to bio-oil. The final stage, termed passive pyrolysis, occurs between 480 and 600 °C for nonwoody IAPs and between 470 and 600 °C for woody IAPs. This stage is attributed to lignin decomposition and the formation of char at relatively high temperatures [
64]. The results obtained in this work are supported by a study by Shafiq and Capareda [
65], in which no bio-oil was obtained at 300 °C, and the bio-oil yield was 6.2% at 450 °C, which decreased to 5.7% at 600 °C.
These findings imply that the active pyrolysis stage is the most important stage for maximum bio-oil. Performing TGA allows informed decisions on reactor design and better control of the temperature and reaction rate. The limitation observed was an inability to show temperature ranges for cellulose and hemicellulose separately, as this would assist in understanding thermal stability and improving material characterization and processing.
4. Conclusions
This study aims to evaluate the physiochemical composition of nonwoody and woody IAPs as potential energy sources for bio-oil production and assess the feasibility of bio-oil utilization in agricultural systems and productions. The findings of the structural analysis highlight that woody IAPs are more suitable for bio-oil production because of their higher cellulose and hemicellulose contents, which increase yield, whereas lignin contributes to energy density. The resulting bio-oil can be blended with diesel and used as a fuel in agricultural machinery or tractors to enforce sustainable farming practices, while the lignin-rich biochar byproducts can be utilized as soil amendments to enforce crop growth. To obtain greater energy from lignin, higher energy inputs are required to thermally degrade its complex and rigid structure. This analysis provides a holistic understanding of how biomass traits influence bio-oil productions and enforces the need for further research on lignin pretreatment and alternative energy sources to optimize bio-oil production for efficient and sustainable agricultural applications.
The presence of carbon and hydrogen in IAPs indicates a higher HHV and thus improved combustion efficiency. This makes bio-oil a viable fuel for gas turbines, enabling electricity generation to power irrigation systems or operations in a greenhouse. The elevated oxygen levels could hinder pyrolysis efficiency, opening a gap for further research on bio-oil upgrading techniques to enhance its energy potential. However, these oxygen-rich compounds also contain bioactive components with potential biopesticidal properties, presenting a sustainable alternative to chemical pesticides for crop protection. This analysis provides an overview of which biomass traits influence combustion efficiency that need to be evaluated to enable sustainable heat and electricity generation in agricultural systems. The atomic ratio indicated that both IAPs are promising feedstocks for bio-oil production but not as fruit or vegetable wastes, which have relatively high H: C ratios and low O: C ratios. However, the relatively high moisture and ash contents of fruits and vegetables limit their suitability for pyrolysis. The atomic ratio used to compare IAPs with other South African biomasses provides a novel perspective on why IAPs should be considered for bio-oil production.
Woody IAPs had higher HHVs than nonwoody IAPs, which were derived from elemental composition equations. Comparatively, the IAPs resemble the HHV of peat coal which is a low-energy fuel that can be useful in heating and drying agricultural systems. Employing HHV estimation equations provides a comprehensive understanding of which biomass composition influences the HHV of bio-oil. Finally, TGA revealed the optimal temperature conditions for bio-oil yield at temperatures between 450 and 600 °C. Overall, this study has contributed to expanding alternative energy substrates in South Africa for bio-oil production, offering the dual benefits of energy generation and ecological management. Further research could focus on optimizing IAP collection processes and the potential implementation of biomass plant units in South Africa.
Author Contributions
All the authors contributed to the study’s conception and design. Material preparation, data collection, and analysis were performed by [Bongiwe Mtshali]. The first draft of the manuscript was written by [Bongiwe Mtshali], and all the authors commented on the previous versions of the manuscript. All the authors read and approved the final manuscript.
Funding
This work was supported by the University of Kwa-Zulu Natal” and scholarships for master’s by the Agricultural Research Council.
Conflicts of Interest
The authors declare that they have no competing interests.
Data availability
Not applicable to this work.
Acknowledgments
The authors express their gratitude to the University of KwaZulu-Natal (Departments of Agricultural and Chemical Engineering, Physics, and Chemistry), the Agricultural Research Council for facilitating the experiments, the Institute of Commercial Forestry for their support, and Dr. Zivanai Tsvuura for assisting with the sampling of IAPs.
References
- Chel, A.; Kaushik, G. Renewable energy for sustainable agriculture. Agronomy for sustainable development 2011, 31, 91–118. [Google Scholar] [CrossRef]
- Anekwe, I.M.S.; Zhou, H.; Mkhize, M.M.; Akpasi, S.O. Effects of Climate Change on Agricultural Production in South Africa. International Journal of Climate Change: Impacts & Responses 2023, 15. [Google Scholar]
- Mugido, W.; Blignaut, J.; Joubert, M.; De Wet, J.; Knipe, A.; Joubert, S.; Cobbing, B.; Jansen, J.; Le Maitre, D.; Van der Vyfer, M. Determining the feasibility of harvesting invasive alien plant species for energy. South African Journal of Science 2014, 110, 01–06. [Google Scholar] [CrossRef]
- Inglesi, R.; Pouris, A. Forecasting electricity demand in South Africa: A critique of Eskom’s projections. South African Journal of Science 2010, 106, 50–53. [Google Scholar] [CrossRef]
- Cloete, K.; Pienaar, L.; Van der Merwe, M. Is persistent “loadshedding” pulling the plug on agriculture in the Western Cape, South Africa? Agrekon 2023, 62, 228–240. [Google Scholar] [CrossRef]
- McKendry, P. Energy production from biomass (part 2): conversion technologies. Bioresource technology 2002, 83, 47–54. [Google Scholar] [CrossRef]
- Hu, X.; Gholizadeh, M. Progress of the applications of bio-oil. Renewable and Sustainable Energy Reviews 2020, 134, 110124. [Google Scholar] [CrossRef]
- Shrivastava, P.; Kumar, A.; Tekasakul, P.; Lam, S.S.; Palamanit, A. Comparative investigation of yield and quality of bio-oil and biochar from pyrolysis of woody and non-woody biomasses. Energies 2021, 14, 1092. [Google Scholar] [CrossRef]
- Akinbami, O.M.; Oke, S.R.; Bodunrin, M.O. The state of renewable energy development in South Africa: An overview. Alexandria Engineering Journal 2021, 60, 5077–5093. [Google Scholar] [CrossRef]
- Pradhan, A.; Mbohwa, C. Development of biofuels in South Africa: Challenges and opportunities. Renewable and Sustainable Energy Reviews 2014, 39, 1089–1100. [Google Scholar] [CrossRef]
- Ayaa, F.; Lubwama, M.; Kirabira, J.B.; Jiang, X. Potential of invasive shrubs for energy applications in Uganda. Energy, Ecology and Environment 2022, 7, 563–576. [Google Scholar]
- Pejchar, L.; Mooney, H.A. Invasive species, ecosystem services and human well-being. Trends in ecology & evolution 2009, 24, 497–504. [Google Scholar]
- Nel, J.; Richardson, D.; Rouget, M.; Mgidi, T.; Mdzeke, N.; Le Maitre, D.C.; Van Wilgen, B.; Schonegevel, L.; Henderson, L.; Neser, S. A proposed classification of invasive alien plant species in South Africa: towards prioritizing species and areas for management action: working for water. South African Journal of Science 2004, 100, 53–64. [Google Scholar]
- Bashar, H.K.; Juraimi, A.S.; Ahmad-Hamdani, M.S.; Uddin, M.K.; Asib, N.; Anwar, M.P.; Rahaman, F. A mystic weed, Parthenium hysterophorus: threats, potentials and management. Agronomy 2021, 11, 1514. [Google Scholar] [CrossRef]
- Witt, A.B. Biofuels and invasive species from an African perspective–a review. Gcb Bioenergy 2010, 2, 321–329. [Google Scholar]
- Nkambule, N.; Blignaut, J.; Vundla, T.; Morokong, T.; Mudavanhu, S. The benefits and costs of clearing invasive alien plants in northern Zululand, South Africa. Ecosystem Services 2017, 27, 203–223. [Google Scholar]
- Ahmed, A.; Bakar, M.S.A.; Azad, A.K.; Sukri, R.S.; Mahlia, T.M.I. Potential thermochemical conversion of bioenergy from Acacia species in Brunei Darussalam: A review. Renewable and Sustainable Energy Reviews 2018, 82, 3060–3076. [Google Scholar]
- Kadiyala, A.; Kommalapati, R.; Huque, Z. Evaluation of the life cycle greenhouse gas emissions from different biomass feedstock electricity generation systems. Sustainability 2016, 8, 1181. [Google Scholar] [CrossRef]
- Vassilev, S.V.; Baxter, D.; Andersen, L.K.; Vassileva, C.G. An overview of the chemical composition of biomass. Fuel 2010, 89, 913–933. [Google Scholar] [CrossRef]
- Srivastava, N.; Shrivastav, A.; Singh, R.; Abohashrh, M.; Srivastava, K.; Irfan, S.; Srivastava, M.; Mishra, P.; Gupta, V.K.; Thakur, V.K. Advances in the structural composition of biomass: fundamental and bioenergy applications. Journal of Renewable Materials 2021, 9, 615–636. [Google Scholar]
- Sheng, C.; Azevedo, J. Estimating the higher heating value of biomass fuels from basic analysis data. Biomass and bioenergy 2005, 28, 499–507. [Google Scholar] [CrossRef]
- Cichy, W.; Witczak, M.; Walkowiak, M. Fuel properties of woody biomass from pruning operations in fruit orchards. BioResources 2017, 12, 6458–6470. [Google Scholar]
- Reza, M.S.; Ahmed, A.; Caesarendra, W.; Abu Bakar, M.S.; Shams, S.; Saidur, R.; Aslfattahi, N.; Azad, A.K. Acacia holosericea: an invasive species for bio-char, bio-oil, and biogas production. Bioengineering 2019, 6, 33. [Google Scholar] [CrossRef] [PubMed]
- Borah, A.J.; Singh, S.; Goyal, A.; Moholkar, V.S. An assessment of the potential of invasive weeds as multiple feedstocks for biofuel production. RSC advances 2016, 6, 47151–47163. [Google Scholar]
- Eke, J.; Onwudili, J.A.; Bridgwater, A.V. Influence of moisture contents on the fast pyrolysis of trommel fines in a bubbling fluidized bed reactor. Waste and Biomass Valorization 2020, 11, 3711–3722. [Google Scholar]
- Singh, Y.D.; Mahanta, P.; Bora, U. Comprehensive characterization of lignocellulosic biomass through proximate, ultimate and compositional analysis for bioenergy production. Renewable energy 2017, 103, 490–500. [Google Scholar]
- Mishra, R.K.; Mohanty, K. Characterization of non-edible lignocellulosic biomass in terms of their candidacy towards alternative renewable fuels. Biomass Conversion and Biorefinery 2018, 8, 799–812. [Google Scholar]
- Da Silva Ignacio, L.H.; de Almeida Santos, P.E.; Duarte, C.A.R. An experimental assessment of Eucalyptus urosemente energy potential for biomass production in Brazil. Renewable and Sustainable Energy Reviews 2019, 103, 361–369. [Google Scholar]
- Fajobi, M.; Lasode, O.; Adeleke, A.; Ikubanni, P.; Balogun, A. Investigation of physicochemical characteristics of selected lignocellulose biomass. Scientific Reports 2022, 12, 2918. [Google Scholar]
- Vargas-Moreno, J.M.; Callejón-Ferre, A.; Pérez-Alonso, J.; Velázquez-Martí, B. A review of the mathematical models for predicting the heating value of biomass materials. Renewable and sustainable energy reviews 2012, 16, 3065–3083. [Google Scholar]
- Álvarez, A.; Pizarro, C.; García, R.; Bueno, J.L. Spanish biofuels heating value estimation based on structural analysis. Industrial Crops and Products 2015, 77, 983–991. [Google Scholar]
- Demirbaş, A. Relationships between lignin contents and heating values of biomass. Energy conversion and management 2001, 42, 183–188. [Google Scholar]
- Acar, Ş.; Ayanoğlu, A. Determination of higher heating values (HHVs) of biomass fuels. Energy Education Science and Technology Part A-Energy Science and Research 2012. [Google Scholar]
- Jenkins, B.M.; Ebeling, J.M. Correlation of physical and chemical properties of terrestrial biomass with conversion. 1985. [Google Scholar]
- Annamalai, K.; Sweeten, J.; Ramalingam, S. Technical Notes: Estimation of gross heating values of biomass fuels. Transactions of the ASAE 1987, 30, 1205–1208. [Google Scholar]
- Jiménez, L.; González, F. Study of the physical and chemical properties of lignocellulosic residues with a view to the production of fuels. Fuel 1991, 70, 947–950. [Google Scholar]
- Havilah, P.R.; Sharma, P.K.; Gopinath, M. Combustion characteristics and kinetic parameter estimation of Lantana camara by thermogravimetric analysis. Biofuels 2019, 10, 365–372. [Google Scholar]
- Bevis, J.; Bottom, R.; Duncan, J.; Farhat, I.; Forrest, M.; Furniss, D.; MacNaughton, B.; Nazhat, S.; Saunders, M.; Seddon, A. Principles and applications of thermal analysis; Wiley Online Library, 2008. [Google Scholar]
- Shen, W.; Zhang, C.; Wang, G.; Li, Y.; Zhang, X.; Cui, Y.; Hu, Z.; Shen, S.; Xu, X.; Cao, Y. Variation pattern in the macromolecular (cellulose, hemicelluloses, lignin) composition of cell walls in Pinus tabulaeformis tree trunks at different ages as revealed using multiple techniques. International Journal of Biological Macromolecules 2024, 268, 131619. [Google Scholar]
- Schädel, C.; Blöchl, A.; Richter, A.; Hoch, G. Quantification and monosaccharide composition of hemicelluloses from different plant functional types. Plant physiology and Biochemistry 2010, 48, 1–8. [Google Scholar]
- Balat, M. Production of bioethanol from lignocellulosic materials via the biochemical pathway: a review. Energy conversion and management 2011, 52, 858–875. [Google Scholar]
- Guedes, R.E.; Luna, A.S.; Torres, A.R. Operating parameters for bio-oil production in biomass pyrolysis: A review. Journal of analytical and applied pyrolysis 2018, 129, 134–149. [Google Scholar] [CrossRef]
- No, S.-Y. Application of bio-oils from lignocellulosic biomass to transportation, heat and power generation—A review. Renewable and Sustainable Energy Reviews 2014, 40, 1108–1125. [Google Scholar] [CrossRef]
- Qu, T.; Guo, W.; Shen, L.; Xiao, J.; Zhao, K. Experimental study of biomass pyrolysis based on three major components: hemicellulose, cellulose, and lignin. Industrial & engineering chemistry research 2011, 50, 10424–10433. [Google Scholar]
- Das, S.K.; Ghosh, G.K.; Avasthe, R. Application of biochar in agriculture and environment, and its safety issues. Biomass Conversion and Biorefinery 2020, 1–11. [Google Scholar]
- Lian, X.; Xue, Y.; Zhao, Z.; Xu, G.; Han, S.; Yu, H. Progress on upgrading methods of bio-oil: a review. International Journal of Energy Research 2017, 41, 1798–1816. [Google Scholar] [CrossRef]
- Abd-Elnabi, A.D.; El-sawy, E.A.F.; El-Adawy, E.M. Insecticidal effects of the fast pyrolysis bio-oil against Spodoptera littoralis and Aphis gossypii insect pests. Journal of Asia-Pacific Entomology 2024, 27, 102237. [Google Scholar] [CrossRef]
- Darvell, L.I.; Brindley, C.; Baxter, X.C.; Jones, J.M.; Williams, A. Nitrogen in biomass char and its fate during combustion: a model compound approach. Energy & fuels 2012, 26, 6482–6491. [Google Scholar]
- Melane, M.; Ham, C.; Meincken, M. Characteristics of selected non-woody invasive alien plants in South Africa and an evaluation of their potential for electricity generation. Journal of Energy in Southern Africa 2017, 28, 92–98. [Google Scholar] [CrossRef]
- Asadullah, M.; Rahman, M.A.; Ali, M.M.; Rahman, M.; Motin, M.; Sultan, M.; Alam, M. Production of bio-oil from fixed bed pyrolysis of bagasse. Fuel 2007, 86, 2514–2520. [Google Scholar]
- Bhavsar, P.; Jagadale, M.; Khandetod, Y.; Mohod, A. Proximate analysis of selected non woody biomass. International Journal of Current Microbiology and Applied Sciences 2018, 7, 2846–2849. [Google Scholar] [CrossRef]
- Bakker, R.R.; Elbersen, H. Managing ash content and quality in herbaceous biomass: an analysis from plant to product. Proceedings of 14th European biomass conference; p. 21.
- Vassilev, S.V.; Vassileva, C.G.; Song, Y.-C.; Li, W.-Y.; Feng, J. Ash contents and ash-forming elements of biomass and their significance for solid biofuel combustion. Fuel 2017, 208, 377–409. [Google Scholar]
- Paulo, I.; Costa, L.; Rodrigues, A.; Orišková, S.; Matos, S.; Gonçalves, D.; Gonçalves, A.R.; Silva, L.; Vieira, S.; Bordado, J.C. Acid-catalyzed liquefaction of Biomasses from Poplar clones for short rotation coppice cultivations. Molecules 2022, 27, 304. [Google Scholar] [CrossRef] [PubMed]
- Isahak, W.N.R.W.; Hisham, M.W.; Yarmo, M.A.; Hin, T.-y.Y. A review on bio-oil production from biomass by using pyrolysis method. Renewable and sustainable energy reviews 2012, 16, 5910–5923. [Google Scholar]
- Zhong, D.; Zeng, K.; Li, J.; Qiu, Y.; Flamant, G.; Nzihou, A.; Vladimirovich, V.S.; Yang, H.; Chen, H. Characteristics and evolution of heavy components in bio-oil from the pyrolysis of cellulose, hemicellulose and lignin. Renewable and Sustainable Energy Reviews 2022, 157, 111989. [Google Scholar]
- Yu, Y.; Chua, Y.W.; Wu, H. Characterization of pyrolytic sugars in bio-oil produced from biomass fast pyrolysis. Energy & Fuels 2016, 30, 4145–4149. [Google Scholar]
- Sawyerr, N.; Trois, C.; Workneh, T.; Okudoh, V. Co-Digestion of Animal Manure and Cassava Peel for Biogas Production in South Africa. In Proceedings of Proceedings of the 9th Int’l Conference on Advances in Science, Engineering, Technology & Waste Management (ASETWM-17), Parys, South Africa; pp. 27–28.
- Sawyerr, N.; Trois, C.; Workneh, T. Identification and characterization of potential feedstock for biogas production in South Africa. Journal of Ecological Engineering 2019, 20. [Google Scholar]
- Krička, T.; Matin, A.; Bilandžija, N.; Jurišić, V.; Antonović, A.; Voćal, N.; Grubor, M. Biomass valorisation of Arundo donax L., Miscanthus× giganteus and Sida hermaphrodita for biofuel production. International agrophysics 2017, 31. [Google Scholar]
- Wang, J.; Wang, S.; Lu, J.; Yang, M.; Wu, Y. Improved Bio-Oil Quality from Pyrolysis of Pine Biomass in Pressurized Hydrogen. Applied Sciences 2021, 12, 46. [Google Scholar] [CrossRef]
- Kutlu, O.; Kocar, G. Upgrading lignocellulosic waste to fuel by torrefaction: Characterisation and process optimization by response surface methodology. International journal of energy research 2018, 42, 4746–4760. [Google Scholar]
- Gouws, S.M.; Carrier, M.; Bunt, J.R.; Neomagus, H.W. Co-pyrolysis of coal and raw/torrefied biomass: A review on chemistry, kinetics and implementation. Renewable and Sustainable Energy Reviews 2021, 135, 110189. [Google Scholar]
- Argyropoulos, D.S.; Menachem, S.B. Lignin; Springer, 1997. [Google Scholar]
- Shafiq, M.; Capareda, S.C. Effect of different temperatures on the properties of pyrolysis products of Parthenium hysterophorus. Journal of Saudi Chemical Society 2021, 25, 101197. [Google Scholar]
|
Disclaimer/Publisher’s Note: The statements, opinions and data contained in all publications are solely those of the individual author(s) and contributor(s) and not of MDPI and/or the editor(s). MDPI and/or the editor(s) disclaim responsibility for any injury to people or property resulting from any ideas, methods, instructions or products referred to in the content. |
© 2025 by the authors. Licensee MDPI, Basel, Switzerland. This article is an open access article distributed under the terms and conditions of the Creative Commons Attribution (CC BY) license (http://creativecommons.org/licenses/by/4.0/).