Submitted:
07 March 2025
Posted:
10 March 2025
You are already at the latest version
Abstract
This paper develops a Model for Educational Technology Adoption for Developing Countries (ETADC). Existing models lack education-specific factors and fail to consider local contexts which limits their applicability in Developing Countries (DCs). The ETADC model addresses gaps by integrating foundational theories with local and educational factors within the Technological Pedagogical Content Knowledge (TPACK) framework that empowers educators to create meaningful teaching-learning experiences that prepare students for a tech-driven world. The study aims to create a model tailored for DCs and validate the model’s superiority, and generalizability across varied educational settings. The ETADC framework includes six components—four sourced from established theories and two based on research into the experiences of in-service and pre-service teachers in DCs regarding educational technology adoption. These components formulate an appropriate model for evaluating, identifying, and implementing educational technologies within DCs educational context. Validation through meta-analysis and Two-Stage Structural Equation Modeling applied in R studio using data from 30 high-impact studies (N = 8934) confirmed the model’s effectiveness with a strong statistical fit, high explanatory power, and significant path coefficients. ETADC offers a practical guide for adopting educational technology worldwide, particularly in resource-restricted environments. Using the model, some educational technologies have been evaluated for further adoption.
Keywords:
Educational technologies
; adoption model
; adoption process
; developing countries
; Meta-analysis
; Two-Stage structural equation modeling
1. Introduction
1.1. Background
Educational technology is one of the latest developments and is receiving ever-increasing attention. Educational Technology, in terms of terminology and structural composition, may carry out two basic components: education and technology. We are focusing here more on the second component, i.e., technology, as a subject is concerned with identifying the most suitable, appropriate (both hardware and software) for serving the educational needs and purposes of the students, teachers, and societies for developing countries. There is a variety of fundamental characteristics of educational technology, including users, contexts, and settings. Educational Technology (EdTech) is a dynamic and evolving field that uses technological processes and resources to facilitate learning, improve performance, and enhance the educational experience. Educational technology has progressed from visual instruction and audiovisual aids to more advanced digital technologies. The field now includes a wide range of tools and approaches, from multimedia learning and online environments to data-driven smart technologies and learning analytics [1]. Educational technology is not solely focused on efficiency but aims to address the needs of the whole person in education. Educational technologies are crucial in enhancing student engagement and learning outcomes in education. However, there are some contradictions in the perception and implementation of educational technology. It is seen as a potential solution for improving education quality, especially in high-poverty populations [2]. The relationship between educational technology and Teacher Education has been conflicted, particularly in contexts where teachers are not adequately trained to incorporate new technologies effectively.
In the current era of digitization, referred to as the 4th industrial revolution, professionals such as teachers, engineers, developers, and clinicians depend on technological resources to collaborate, interact, and achieve their enterprises.
Within the scope of this study, educational technology is considered an ethical practice of facilitating learning and improving performance through the creation, use, and management of appropriate technological processes and resources in developing countries’ education settings. As the field continues to evolve, it is increasingly recognized as a crucial component of the digital economy, with significant potential to transform traditional education models and improve access to quality learning.
A model for the adoption of educational technology is critical for understanding market dynamics, guiding policy decisions, and shaping business strategies. Accurate forecasting methods are essential, yet they require continuous refinement and validation to address diverse adoption patterns across technologies and contexts. Although predominant models such as the Technology Acceptance Model (TAM), Unified Theory of Acceptance and Use of Technology (UTAUT), Task-Technology Fit (TTF), and Diffusion of Innovations Theory (IDT) have been widely applied, their suitability for developing countries remains limited. These models were predominantly developed in advanced countries, which fail to fully capture the unique constraints and opportunities of developing nations [3]. Factors such as limited infrastructure, resource scarcity, and cultural nuances necessitate adaptations to these frameworks [4].The socioeconomic and technological landscapes of developing countries demand a tailored approach to educational technology adoption. Challenges like cost-effectiveness, infrastructure limitations, and skill gaps complicate the direct application of existing models. Extensions of TAM and integrations with other theories have been proposed, yet these efforts often overlook the complex interplay of pedagogical goals, teacher competencies, and contextual factors specific to low- and middle-income countries. For example, leveraging augmented and virtual reality in less-developed nations has demonstrated the potential to overcome key educational barriers [4]. However, gaps persist in understanding and effectively using technology resources in such [5]. A more context-specific framework for educational technology adoption in developing countries is essential. This framework should integrate pedagogical and socioeconomic considerations, focusing on factors such as cost-effectiveness, teacher readiness, and localized challenges. Previous models like the Concerns-Based Adoption Model (CBAM) and later iterations of TAM (e.g., TAM2, TAM3) have highlighted the evolution of adoption theories but fall short in addressing education-specific dynamics. Similarly, broader models such as the Technology-Organization-Environment (TOE) framework and UTAUT have provided valuable insights yet require further customization for developing nations.
1.2. Research Problem Statement
Developing countries often seek to adopt educational technologies without adequate knowledge of their features or contextual suitability [6]. Earlier models were largely built in isolated contexts with small sample sizes, primarily focused on advanced economies. For instance, TAM was introduced in 1989, and UTAUT in 2003, and their derivatives have aged while technology and its educational applications continue to evolve rapidly. Moreover, these models originated in sectors like banking and information systems before being adapted to education, leaving critical gaps in their predictive capabilities for educational contexts. Specific adoption models tailored for identifying educational technologies in developing countries are in need. The rapid development of advanced technologies, such as artificial intelligence and gamification, underscores the need for a new conceptual framework. This framework must address the distinctive constraints of developing countries and better support sustainable educational progress.
1.3. Research Questions
Three primary research questions guide this study:
RQ1: What is the general process of educational technology adoption in developing countries?
RQ2: How can an Educational Technology Adoption in Developing Countries (ETADC) model be developed to identify suitable educational technologies?
RQ3: How can the developed model's validity, superiority, and generalizability be demonstrated?
1.4. Research Contributions
The study makes the following contributions: Model Development—Proposes a tailored ETADC model to identify, evaluate, and adopt educational technologies effectively in developing countries; Model Validation—Uses meta-analysis and two-stage structural equation modeling to synthesize insights from 30 studies and validate the hypothesized model; Process Framework—Outlines the requirements and processes for effective educational technology adoption in resource-constrained settings.
1.5. Paper Organization
The paper is organized as follows: Section 1 involves Background, problem statement, research questions, and contributions; Section 2 embraces the need for a new model tailored to developing countries; The details of the ETADC model's design, foundations, and hypotheses are elaborated in Section 3; Section 4 presents methods and results for testing model's validity and finally, the Section 5 summarizes findings and Highlights research implications.
2. Need for an Educational Technology Adoption Model in Developing Countries
This section highlights the importance of creating a framework to help developing countries effectively use technology in education. It emphasizes that to improve teaching-learning experiences and outcomes, DCs require a clear plan or model to evaluate, adopt, and integrate educational technology in schools. By doing so, they can enhance teaching-learning methods, make learning more accessible, and prepare students for a better future in a digital world.
2.1. Current Research Status on Educational Technologies Adoption Models for Developing Countries
Current research on technology adoption models in education for developing countries focuses on various emerging technologies and their implementation challenges. Several studies have explored factors influencing the adoption of these technologies in higher education institutions (HEIs) in developing nations.
The Internet of Things (IoT) adoption for e-learning in HEIs has been examined, with researchers proposing a model categorizing influencing factors into individual, organizational, environmental, and technological groups [7]. The Technology Acceptance Model (TAM) has been widely used to study e-learning adoption, with constructs such as perceived usefulness (PU) and perceived ease of use (PEOU) playing significant roles [8]. Other factors include system quality, service quality, quality of life, and behavioral intention to use. Additionally, factors like usability, accessibility, technical support, and individual proficiencies have been found to contribute to the rate of ICT adoption in higher education institutions [9].
In addition, Key factors identified include privacy concerns, infrastructure readiness, financial constraints, ease of use, faculty support, and network security. Similarly, research on blockchain technology adoption in education has utilized an expanded Technology Acceptance Model (TAM) integrated with the diffusion of innovation theory [10]. Hence, research has revealed contradictions in technology adoption across different regions. For instance, a comparative study on mobile technology adoption for library services in Hong Kong and Japan showed that cultural factors affect the formation of adoption intentions [11]. While performance expectancy was the main focus in Japan, Hong Kong emphasized facilitating conditions, performance expectancy, and perceived usefulness collectively.
Overall, current research on technology adoption models in education for developing countries encompasses various technologies such as IoT, blockchain, and mobile learning. These studies often adapt existing models like TAM or the Unified Theory of Acceptance and Use of Technology (UTAUT) to fit the specific context of developing nations. Factors such as cultural dimensions, infrastructure readiness, and financial constraints play crucial roles in shaping technology adoption in these educational settings.
2.2. Difference Between Advanced and Developing Countries in the Adoption of Educational Technology
Technology adoption in developing countries encounters distinct challenges compared to advanced nations, despite the potential benefits. Key factors influencing this process include government policies, infrastructure, training, and cultural aspects, which often impede technology transfer in developing regions. While stakeholders in both contexts recognize the importance of internal and external factors for successful implementation, managers in advanced countries emphasize these elements more, contributing to higher success rates. This indicates that, although the understanding of technology adoption is similar, the execution and supporting environments differ significantly. Advanced nations benefit from established infrastructure and a culture of innovation, making technology adoption more straightforward, whereas developing countries face considerable obstacles, particularly in teacher training and integration. The differences hinge on these two main factors.
- Investment in Infrastructure and Resources [6]: Advanced countries invest heavily in educational technology, providing modern tools like computers, projectors, internet connection, and others while developing countries often rely on traditional methods due to a lack of infrastructure;
- Teacher Training and Support [6]: Advanced nations have established programs for integrating technology into education, ensuring teachers are trained in using these tools effectively. In contrast, developing countries face foundational challenges that hinder teacher training and technology adoption;
2.3. Challenges Facing Developing Countries in the Adoption of Education Technologies
The adoption of education technologies in developing countries faces several challenges:
- Limited access to resources [6] : The lack of technical support, electricity, internet, devices, and financial resources significantly hampers technology adoption, especially in rural areas and emerging economies;
- Lack of training and skills [6]: Teachers in developing countries often receive inadequate training and support, resulting in low technology adoption rates. Many lack the professional readiness to effectively utilize emerging technologies in education;
- Cultural and social factors [12]: These factors heavily influence technology adoption, particularly in mobile learning within Arab Gulf countries, affecting acceptance among students and instructors.
- Resistance to technology [13]: Teachers' attitudes toward technology create challenges in the classroom. Their willingness to integrate technology depends on perceived benefits versus concerns, complicating adoption efforts;
- Overemphasis on technology and underemphasis on pedagogy: Many programs prioritize acquiring technology over its integration into educational frameworks and pedagogy.
This disparity has led to failed technology adoption projects, particularly in developing countries, highlighting the need for strategies tailored to local contexts.
3. Construction of ETADC Model
3.1. Selection of Base Models for Constructing ETADC
3.1.1. The Scope of Searching Base Models
Prominent models like the TAM, UTAUT, and their extensions (UTAUT2, TAM2, TAM3) have been widely used in educational technology adoption. They focus on key factors such as perceived usefulness (Performance Expectancy), perceived ease of use (Effort Expectancy), and Social Influence. The UTAUT and UTAUT2 combine elements from various theories to create a comprehensive framework for understanding technology acceptance.
3.1.2. The Properties of Base Models
According to the literature, previous models were developed by modification or extensions of primary models according to the context of their application:
- The Technology Acceptance Model (TAM) developed by Davis [14] highlights Perceived Usefulness (PU) and Perceived Ease of Use (PEU) in adopting new technology, originating from the Theory of Reasoned Action (TRA). However, it does not account for subjective norms or guides on enhancing technology's usability;
- TAM2 and TAM3 developed by Venkatesh and Davis [15] expand on TAM's core constructs by including components like Subjective Norms (SN), Image (IM), Job Relevance (JR), and additional factors in TAM3 such as Results Demonstrability (RD) and Computer Self-efficacy (CSE). Both models are complex and focus on technology adoption within organizational settings;
- UTAUT2 developed by Venkatesh [18] adapts this framework for consumer contexts but similarly suffers from increased complexity due to multiple moderators. Overall, these models reflect a shift from individual perceptions to broader factors influencing technology adoption.
This reflects the shift from basic models centered on individual perceptions to more comprehensive frameworks that include organizational, social, and contextual factors in technology adoption in education, particularly in developing countries. The current study integrates variables related to adoption processes, contexts, and technology features to create a suitable framework for educational settings in these regions.
3.2. Identifying Components for the ETADC Model from the Base Models
This study develops the Educational Technology Adoption Model in Developing Countries (ETADC), based on existing literature and studies focused on in-service and pre-service teachers' technology adoption. The ETADC model includes six components and specific cause-effect links, integrating context-specific, technological, organizational, and sociocultural factors to enhance its relevance in developing countries. It omits less impactful variables and moderator factors from previous models, such as Gender, Age, and Experience, to reduce complexity and improve interpretation across different contexts, as they did not significantly influence the relationships within the model.
3.2.1. The Sharing Cause-Effect Links of Dominant Technologies’ Adoption Models and Hypotheses Development
Five primary technology adoption models have been more popular models than others. These models share the main components and cause-effect Links:
- PE→ BIU
Performance expectancy synonym of Perceived Usefulness (PU) is a core component in all five popular technology adoption models (Error! Reference source not found.) and PU → BIU or PE→ BIU was shared by both five models TAM. TAM2, TAM2, UTAUT, and UTAUT2.

Table 1.
Popular technology adoption models and their core constructs.
| Model | Core components | Cause-Effect Links | ||
|
TAM [14] |
PU, PEU, AT, BIU, UB | 1) PU → BIU 2) PEU → AT |
3) PEU → PU 4) PU → AT |
5)AT → BIU 6)BI →UB |
|
TAM2 [15] |
PU, PEU, BIU, UB, SN, IM, JR, RD, OPQ | 1) PEU → PU 2) PU → BIU 3) PEU→BIU 4)BI→UB |
5)SN→ PU 6)SN→ BIU 7)SN→IM 8)IM→ PU |
9)JR→ PU 10)RD→ PU 11)OPQ→ PU |
|
TAM3: [19] |
PU, PEU, BIU, UB, SN, IM, JR, RD, OPQ, CSE, PEC, CA, PENJ, OU, CPF, moderators (Voluntariness, Experience) | 1)PEU → PU 2)PU → BIU 3)PEU→BIU 4)BI → UB 5)SN→ PU 6)SN→ IU |
7)SN→IM 8)IM→ PU 9)JR→ PU 10)RD→ PU 11)OPQ→ PU 12)CSE→PEU |
13)PEC→ PEU 14)CANX→PEU 15)CPF→ PEU 16)PENJ→PEU 17)OU→ PEU |
|
UTAUT: [16] |
PE, EE, SI, FC, BIU, Moderator variables (gender, age, experience, and voluntariness) | 1)PE→ BIU 2)EE → BIU |
3)SI → BIU 4) FC→ BIU |
5)FC→ UB 6)B →UB |
|
UTAUT2: [18] |
PE, EE, SI, FC, HM, H, PV, BIU, Moderator variables (gender, age, experience, and voluntariness) | 1)PE→ BIU 2)EE → BIU 3)SI → BIU 4)FC→ BIU |
5)FC → UB 6)HM→ BIU 7)PV→ BIU |
8)H→BIU 9)H→ UB 10)BIU→UB |
* Note: Actual System Use(UB), Attitude Toward Using (AT), Behavior Intention (BIU), Computer Anxiety (CA), Computer Playfulness (CPF), Computer self-efficacy (CSE), Effort Expectancy (EE), Experience, Facilitating condition (FC), Habit (H), Hedonic Motivation (HM), Image (IM), Intention to Use a Technology (IU), Job Relevance (JR), Objective Usability (OU), Output Quality (OPQ), Perceived ease of use (PEU), Perceived Enjoyment (PENJ), Perceived usefulness (PU), Perception of external control (PEC), Performance Expectancy (PE), Price Value (PV), Results Demonstrability (RD), Social influence (SI), Subjective Norms (SN), Use Behavior (UB).
- EE → BIU
Effort Expectancy synonym for Perceived Ease of Use (PEOU) is a core construct of all five popular technology adoption models (Error! Reference source not found.) and PEU→BIU or EE → BIU are shared by four popular models TAM2, TAM2, UTAUT, and UTAUT2
- SI → BIU
Social Influence or subjective norm is the core component of four popular technology adoption models (Error! Reference source not found.) and SI → BIU or SN→ IU are shared by four popular models TAM2, TAM2, UTAUT, and UTAUT2.
3.2. The Sharing Components of Many Educational Technology Adoption Models
Many studies have applied previous popular models with modifications to investigate educational technology adoption in many developing countries (Error! Reference source not found.). Common cause-effect Links shared by Popular Technology adoption models were applied to investigate in-service and pre-service teachers’ adoption of educational technologies in education in many developing countries.
Table 2.
Popular Technology adoption models were applied to investigate in-service and pre-service teachers’ adoption of educational technologies in education in many developing countries.
Table 2.
Popular Technology adoption models were applied to investigate in-service and pre-service teachers’ adoption of educational technologies in education in many developing countries.
| Studies | Base models | components | Cause-Effect Links | |||
| [20] | UTAUT2 | PE, EE, SI, FC, HM, PV, BIU, PI | 1)PE→BIU 2)EE→BIU 3)SI→BIU |
4)FC→BIU 5)HM→BIU |
6)PV→BIU 7)PI→BIU |
8) PI→PE 9)PI→EE |
| [21] | UTAUT2 | PE, EE, SI, FC, HM, H, BIU, CS, TR | 1)PE→BIU 2)EE→BIU |
3)SI→BIU 4)FC→BIU |
5)HM→BIU 6)H→BIU |
7)CS→BIU 8)TR→BIU |
| [22] | TAM |
PEU, PU, SE, PEN, PCR, PI, PV, BIU |
1)PI →SE 2)PI→PU 3)PI →PEU 4)PI→BIU |
5)SE→PU 6)SE→PEU 7)PCR→PU |
8)PCR→BIU 9)PEU→PU 10)PEU→PENJ |
11)PEU→BIU 12)PU→BIU 13)PENJ→BIU |
| [23] | TAM and UTAUT | PU, PEU, AT, FC, PENJ, PRA, MSE, IU | 1)PENJ→PU 2)PENJ→AT 3)PU→IU |
4)PU→AT 5)AT→IU 6)FC →IU |
7)FC→PEU 8)PEU→PU 9)PEU→AT |
10)MSE→PEU 11)PRA→PU |
| [24] | UTAUT | PE, EE, FC, BIU, PR, AT, AAHE | 1)PR→AT 2)PE→AT |
3)EE →AT 4)FC→EE |
5)FC→BIU 6)AT→BIU |
7)BIU→AAHE |
| [25] | TAM | PE, EE, BIU |
1)AT→BIU 2)PEU→AT |
3)PEU→PU 4)BIU →AT |
5)ST→PU 6)ST→PEU |
7)ST→A |
| [26] | UTAUT2 | PE, EE, SI, FC, HM, PV, BIU, UB | 1)PE→BIU 2)EE→BIU |
3)SI→BIU 4) FC→BIU |
5)FC→UB 6)HM→BIU |
7)PV→BIU 8)BIU→UB |
| [27] | UTAUT2 | PE, EE, SI, FC, HM, H, PV, BIU, UB, PI | 1) PE→BIU 2)EE→BIU 3)SI →BIU |
4)FC→BIU 5)FC→UB 6)HM→BIU |
7)PV→BIU 8)H→BIU 9)H→UB |
10)BIU→UB 11)PI→BIU |
| [28] | IOD | WTU, PT, RA or PE, CP, CM, EX or EE | 1) CP→WTU 2)CM→WTU 3) EE→WTU |
4) RA→WTU 5) PT→WTU |
||
| [29] | UTAUT2 | PE, EE, SI, FC, HM, H, BIU, PI | 1)PE→ BIU 2)EE → BIU 3)SI →BIU |
4) FC→BIU 5)FC →UB 6)HM→BIU |
7)H→BIU 8)H→UB |
9)BIU→UB 10)PI→ BIU |
| [30] | UTAUT2 | PE, EE, SI, FC, HM, PV, BIU, |
1) PE→BIU 2)EE →BIU |
3)SI → BIU 4) FC→BIU |
5)HM→BIU 6)PV→BIU |
|
| [31] | UTAUT2 | PE, EE, SI, FC, HM, PV, WU |
1) PE→ WTU 2)EE → WTU |
3)SI → WTU 4) FC→ WTU |
5)HM→ WTU 6)PV→ WTU |
|
| [32] | TAM, TAM2 and TAM3 | PU, PEU, AT, SN or SI, IU, SE, JR, OPQ, PEC |
1) PU→IU 2) PU→AT 3) PEU→AT 4) PEU→PU |
5)AT→IU 6)SN→ PU 7)OPQ→PU |
8)PEC→ PEU 9)PENJ →PEU 10)SE→ PEU |
|
| [33] | UTAUT | PE, EE, SI, BIU, UB | 1)PE→BIU 2)EE→BIU |
3)SI → BIU 4)BI → UB |
||
| [34] | UTAUT | PE, EE, SI, FC, BIU, U | 1)PE→BIU 2)EE→BIU 3)SI→BIU |
4)FC→ UB 5)BIU → UB |
||
| [35] | TAM | PEU, PU, BIU, PEN | 1)PEN→PEU 2)PEU→BIU |
3)PEU → PU 4)PU →BIU |
||
| [36] | TAM | PEU, PU, SI, PT, PA, AN, BIA | 1)PEU→BIA 2)PU→BIA |
3)SI→BIA 4)PT → BIA |
5)PA → BIA 6)AN →BIA |
|
| [37] | TAM | PEU, PU, U, AT, BIU, EF, PL, SA | 1)AT→BIU 2)PU→AT 3)PU→BIU 4)PEU→AT |
5)PEU→PU 6)SA→PU 7)SA→AT 8)SA→BIU |
9)SA →U 10)PEU→SA 11)EF→PU 12)EF→PEU |
13)EF→SA 14)PL→PU 15)PL→PEU 16)PL→SA |
| [38] | TAM | PU, PEU, IU, INTR, IMRN, IMGN | 1)PU→IU 2)PEU→IU |
3)INTR→PU 4)INTR→PEU |
5)IMGN→PU 6)IMGN→PEU |
7)IMRN→ PU 8)IMRN→PEU |
| [39] | UTAUT | PE, EE, SI, FC, BIU, IV | 1)PE→BIU 2)EE→BIU |
3)SI→BIU 4) FC→BIU |
5)FC → UB 6)BIU → UB |
7) IV→ BIU 8)IV → UB |
| [40] | UTAUT2 | PE, EE, SI, FC, H, HM, PV, BIU, GD, AG, EX | 1)PE→BIU 2)EE→BIU 3)SI →BIU |
4) FC→BIU 5)HM→BIU 6)PV→ BIU |
7)H→ BIU 8)GD→ BIU |
9) AG→ BIU 10)EX → BIU |
| [41] | TAM | PEU, IU, AW or SI, OA or FC, TC | 1)SI→ FC 2)TC →FC 3)SI→ PEU |
4)FC→PEU 5) PEU→IU |
||
* Note: Adoption of AI(AAHE), Age (AG), Age (AG), Anthropomorphism (AN), Anxiety (A), Attitude (AT), Awareness (AW), Behavior Intention (BIU), Behavior Intention to Adopt (BIA)Behavior Intention to Use (BIU)Compatibility (CP), Complexity (CM), Cyber Security (CS), Efficiency (EF), Effort Expectancy (EE), Experience (EX), Facilitating condition (FC), Gender (GD), Habit (H), Hedonic Motivation (HM), Imagination (IMGN)Immersion (IMRN), Intention of Use (IU), Interaction (INTR), Intrinsic Value (IV), Job Relevance (JR), Mobile Self-Efficacy (MSE), Operational ability (OA)or Usefulness, Output Quality (OPQ),Perceived Autonomy (PA), Perceived cyber risk (PCR), Perceived Ease of Use (PEU), Perceived Enjoyment (PEN)Perceived Informativeness (PI)Perceived relative advantage (PRA), Perceived risk (PR), Perceived Trust (PT), Perceived usefulness (PU), Perception of external control (PEC), Performance expectancy (PE), Personal Innovativeness (PI)Playfulness (PL), Price Value (PV), Relative advantage (RA)or Performance expectancy, Satisfaction (SA)Self-Efficacy (SE), Social influence (SI), social isolation (SIS), Stress(ST)Subjective Norms (SN), Technology challenges (TC)Trust (TR)Use (U), Use Behavior (UB)Use of OLE (U), Willingness to Use (WTU).
According to the literature above, the TAM and UTAUT2 components constitute the core constructs for most extended educational technology adoption models (Error! Reference source not found.). Applying TAM and UTAUT components and their extensionsTAM2, TAM3, and UTAUT to the ETADC assumes that the greater perception of educational technologies’ usefulness (performance expectancy) and ease of use (effort expectancy) by pre-service and in-service teachers impact more to their positive attitudes toward using educational technology in their teaching-leaning. In addition, the availability of devices, infrastructures, and training is a core determinant influencing the acceptance and effective adoption of educational technology. The positive social influence from peers or pioneering users (competitive pressure) and the price value of educational technology are more impacting its acceptance and effective adoption.
3.2.1. Performance Expectancy
Performance expectancy synonym of Perceived Usefulness (PU) is a core component in all five popular technology adoption models (Error! Reference source not found.) and was applied by twenty-one studies or 95.4% of studies on education technology adoption in developing countries (Error! Reference source not found.). However, PE→BIU or PU→BIU was used in twenty studies or 90.9% of studies;
Performance expectancy encompasses technology curriculum relevance, trust, and relative advantages, it reflects users' beliefs about how a technology will enhance their performance or productivity in the classroom. In educational settings, this translates to students' expectations of improved learning outcomes or efficiency through the use of technology [42,43,44]. Performance Expectancy (PE) consistently emerges as a significant factor of educational technology adoption across multiple studies such as Canvas adoption among Nigerian students and cloud-based collaborative learning technology in Malaysian universities [45,46]. Accordingly, the current study has postulated that:
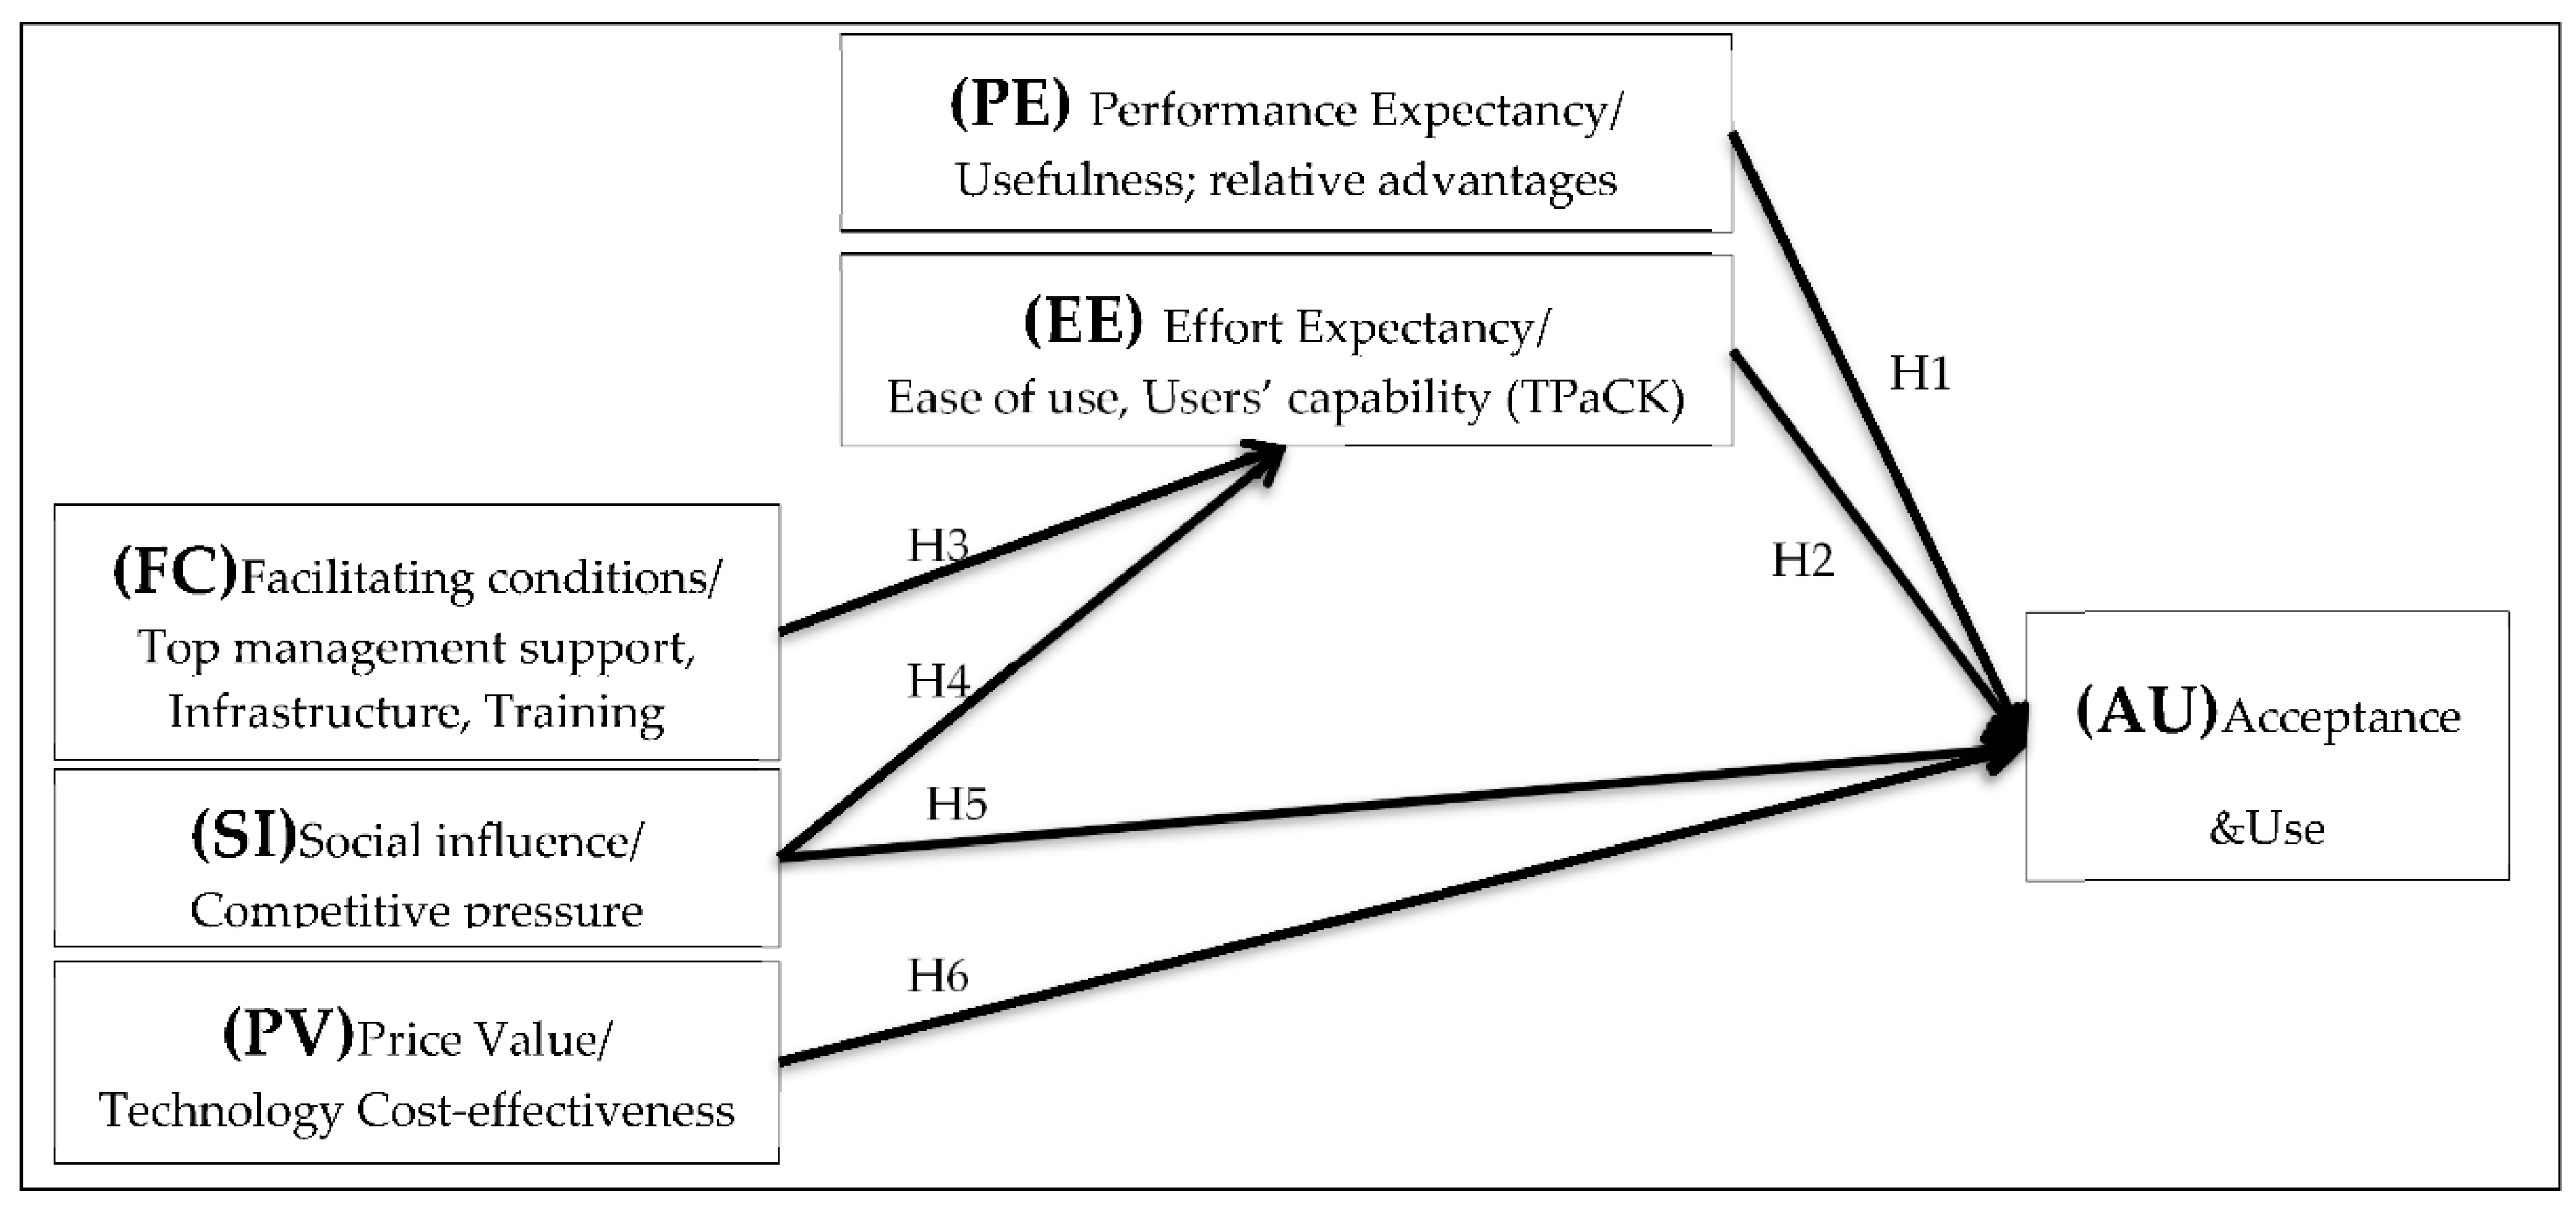
H1: Performance Expectancy (PE) or Perceived Usefulness (PU) will significantly impact the identification and adoption of potential educational technologies in developing countries' education settings.
3.2.2. Effort Expectancy
Effort Expectancy synonym for Perceived Ease of Use (PEOU) is a core construct of all five popular technology adoption models (Error! Reference source not found.) and was applied by all twenty-two studies or 100% of studies on education technology adoption in developing countries (Error! Reference source not found.) however, EE→BIU or PEU→BIU was used in seventeen studies or 77.27 % of studies.
Effort expectancy relates to the perceived ease of use, another critical factor in technology adoption. For students and educators, the ease of learning and using new technology can significantly impact their willingness to adopt it. [43,44]. Overall, the majority of the studies support the hypothesis that Effort Expectancy impacts the adoption of education technology: online learning adoption among university students in Bangladesh, ChatGPT adoption in higher education, educational metaverse platform adoption, Canvas adoption in a Nigerian higher education institution, and Augmented Reality (AR) in education [42,45,47,48]. Accordingly, the current study has postulated that:
H2: The effort expectancy (EE) or Perceived Ease of Use (PEOU) will significantly impact the identification and adoption of potential educational technologies in developing countries' education settings.
3.2.3. Social Influence
Social Influence or subjective norm is the core component of four popular technology adoption models (Error! Reference source not found.) was applied in only fourteen studies or 63.63% of studies on education technology adoption in developing countries (Error! Reference source not found.) and SI → BIU was used in only twelve studies or 54.5 % of studies.
Social influence and Institutional pressures play a significant role in shaping users' intentions to adopt technology in educational settings, the opinions and behaviors of peers, instructors, and institutions can influence individual adoption decisions [42,43,49,50]. Additionally, socio-cultural factors, such as social networks, hierarchical structures, tribal affiliations, and language impact the adoption of technology among Maasai people in rural Tanzania, emphasizing the importance of considering cultural implications for successful technology adoption; Furthermore, the research underscores the need to address cultural variables in technology adoption models, as cultural characteristics are key influencers in the acceptance and use of technology in non-Western countries [18].
H5: The Cultural and societal factors, Social Influence, and Competitive pressures will significantly impact the identification and adoption of potential educational technologies in developing countries' education settings.
3.2.4. Facilitating Conditions
Facilitating Conditions which is the availability of required devices, infrastructures, and training is a core construct of two popular technology adoption models (UTAUT and UTAUT2) (Error! Reference source not found.) and was applied by thirteen studies or 59% of studies on education technology adoption in developing countries (Error! Reference source not found.) and FC→BIU was used in eleven studies or 50 % of studies. However, they were not considered in the current ETADC model building because it has been postulated that the FC is not directly impacting the adoption of education technology but is impacting it through EE.
3.2.5. Special Links of ETADC for Considering the Context of Developing Countries' Education Settings
While various technology adoption models exist (Error! Reference source not found.), they often fail to address the complexities of educational technology adoption, especially in developing countries. These models typically overlook the unique challenges and the broader socio-organizational and cultural factors that influence the acceptance of educational technology. To address these shortcomings, we propose the ETADC model, which emphasizes two key aspects: first, it should include cause-effect relationships relevant to the technology selection process; and second, it should focus on the effective implementation of technology in developing countries. This approach considers the specific context of education in these regions.
First, Facilitating Conditions (FC), which includes access to necessary devices, infrastructure, and training, is a key element in technology adoption models like UTAUT and UTAUT2 (Error! Reference source not found.), While thirteen studies, or 59% of studies on educational technology adoption in developing countries focus on FC, and all twenty-two studies or 100% of studies focused on EE; only two studies or 9% examine the direct effects of FC on EE (Error! Reference source not found.). This study proposes that FC influences effort expectancy and ease of use, ultimately affecting the acceptance and adoption of educational technology (FC→EE; EE→BIU).
In this study, we have integrated new link pivoting on the TPACK framework. Teachers’ proficiency in the Technological Pedagogical Content Knowledge (TPACK) framework (Error! Reference source not found.) is essential for successful technology integration, as it enhances their lesson planning and teaching [51].
Thus, while effort expectancy is vital for educational technology adoption, facilitating conditions provide necessary support for the effective implementation of new technologies [43,44]. Adequate infrastructure, resources, institutional support, and training are critical for successfully teaching with technology which encompasses the TPACK framework.
Figure 1.
The Technological, pedagogical, and content knowledge— TPACK developed by Mishra, P., & Koehler [51].
Figure 1.
The Technological, pedagogical, and content knowledge— TPACK developed by Mishra, P., & Koehler [51].
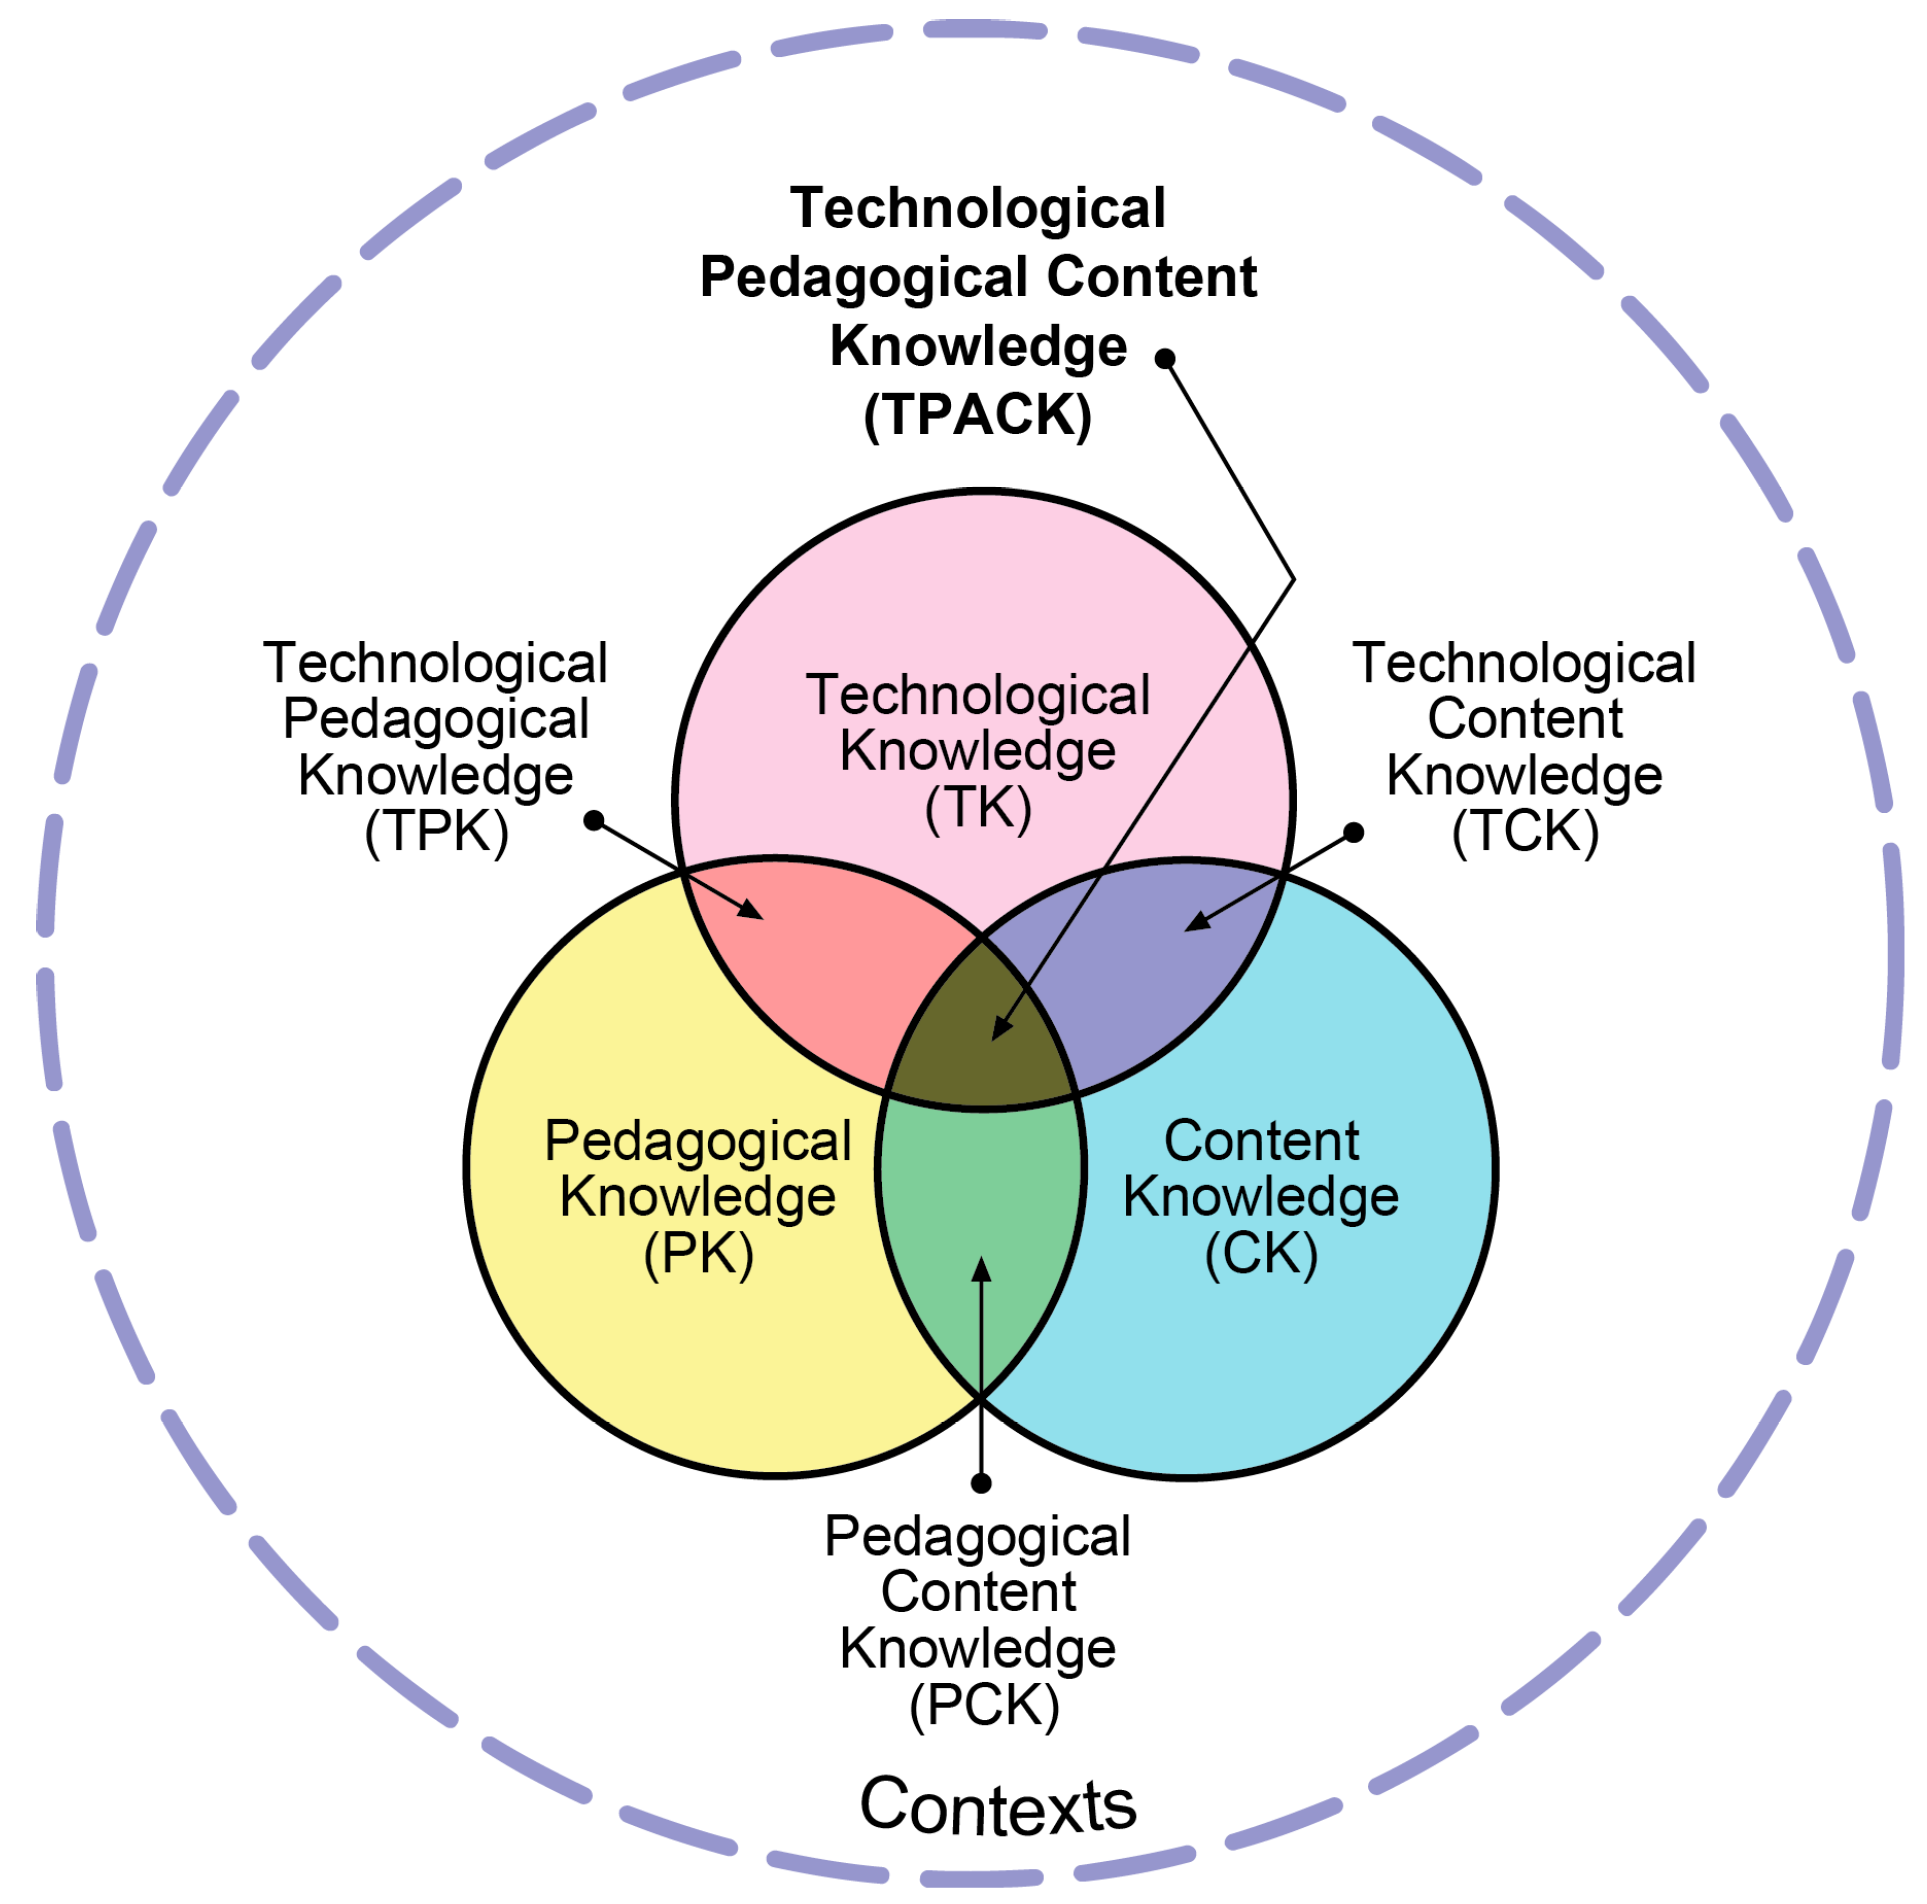
TPACK describes the knowledge that teachers need to effectively teach with technology. It aims to articulate the essential knowledge that educators must possess to effectively integrate technology into their teaching practices. The concept of Technological, Pedagogical, and Content Knowledge, commonly known as TPACK, is a comprehensive framework developed by educators Punya Mishra and Matthew Koehler [51].
TPACK encompasses three primary components that together support teachers in delivering engaging and effective teaching-learning experiences that leverage technology to enhance student understanding and achievement.
1. **Content Knowledge (CK)** refers to the specific subject matter that teachers must be well-versed in. This involves a deep understanding of the concepts, inquiries, and skills related to the discipline being taught, whether it be mathematics, science, literature, or any other field.
2. **Pedagogical Knowledge (PK)** pertains to the instructional methods and strategies that teachers use to facilitate learning. This includes knowledge about how students learn, understanding various teaching approaches, and the ability to adapt their methods to meet diverse student needs.
3. **Technological Knowledge (TK)** involves an understanding of how to use various technologies effectively in educational settings. This includes familiarity with digital tools, applications, and resources that can enhance teaching and learning experiences.
The interplay among these three types of knowledge is crucial. TPACK highlightsthe importance of not only understanding each domain individually but also recognizing how they intersect. For example, a teacher must know how to use a specific technology (TK) to teach a particular concept (CK) while also applying effective pedagogical strategies (PK) to engage students and maximize their learning outcomes. This holistic approach empowers educators to create enriched and meaningful learning experiences that prepare students for a technology-driven world.
Accordingly, the current study has postulated that:
H3: Facilitating Conditions (FC) has a positive and significant impact on Effort Expectancy (EE) by improving teachers ‘TPACK, and teachers ‘capability leading to the acceptance and use of educational technologies in developing countries' education settings.
Second, Social Influence or subjective norm is the core component of four popular technology adoptions (Error! Reference source not found.) and was applied by fourteen studies or 63.6% of studies on education technology adoption in developing countries (Error! Reference source not found.) and was EE applied by all twenty-two studies or 100% of studies however, SI→PEU or SI→EE was used in only 1 study or 4.5 % of studies. By the way, many previous studies have postulated that SI → BIU. In this study, we have added this new link (SI→EE) postulating that cultural, societal factors and competitive pressure strongly impact Effort expectance and perceived ease of use of new educational technology. According to Al-Rahmi and his coworkers, Social Influence (SI) often interacts with Effort Expectancy (EE) to influence users' behavioral intentions in various studies such as the adoption of social media as educational technology among university students in Malaysia cloud classroom acceptance [52]. Accordingly, the current study has postulated that:
H4: Cultural and societal factors, social influence, and competitive pressures will impact the expected effort when using educational technologies in developing countries' education settings.
Third, Price Value is a recent core concept in the UTAUT2 technology adoption model, previously overlooked in older models (Error! Reference source not found.), It has been applied in only 27.3% of studies on education technology adoption in developing countries (Error! Reference source not found.). This study highlights the importance of price value in the ETADC model, as cost-effectiveness heavily influences technology acceptance in these regions. Understanding price value is essential for assessing whether technology benefits justify its costs, impacting adoption intentions. For educational institutions and policymakers, addressing price value can improve technology adoption through subsidies or clear value propositions [18]. High equipment costs and additional expenses, such as internet subscriptions, are significant barriers to e-learning in South African public schools, emphasizing the critical role of affordability in technology adoption [53,54,55]. Hence, the current study has postulated that:
H6: Price value impacts technology acceptance and adoption in Developing Countries' Education settings.
3.2.6. ETADC Structure
After the model components and cause-effect Links identification in the above sections, we have built an Educational Technology Adoption in Developing Countries (ETADC) model (Error! Reference source not found.)
Figure 2.
Proposed Theoretical Educational Technology Adoption in Developing Countries (ETADC) model.
Figure 2.
Proposed Theoretical Educational Technology Adoption in Developing Countries (ETADC) model.
In addition, the model has been validated through empirical studies in the target countries to ensure its applicability and effectiveness, this is why the meta-analytic and Two-stage structural equation modeling were applied in the following sections to validate the developed ETADC model.
4. Validation of the Developed Educational Technology Adoption in Developing Countries (ETADC) Model Through Meta-Analytic and Structural Equation Modeling (MASEM)
To evaluate the validity and generalizability of the Educational Technology Adoption in Developing Countries (ETADC) model (Error! Reference source not found.), this study used meta-analytic structural equation modeling (MASEM). This method synthesizes data from multiple studies, accounts for measurement error, and assesses overall model fit. MASEM combines meta-analysis and structural equation modeling, similar to the work of Cheung & Hong, to test hypothesized models effectively [56].
4.1. Meta-Analytic Dataset Preparation
The minimum data required for MASEM are correlation or covariance matrices with sample sizes for each study; missing variables are allowed [56]. A systematic search identified studies from January 2019 to June 2024 in nine education technology journals on SCOPUS, including Education and Information Technologies, the British Journal of Educational Technology, and Computers and Education. Keywords included educational technology, EduTech, Technology adoption, and related factors. The Error! Reference source not found. shows a flowchart describing the selection process of the studies.
Figure 3.
Flowchart of the Selection Process of Studies for the Present Meta-analysis.
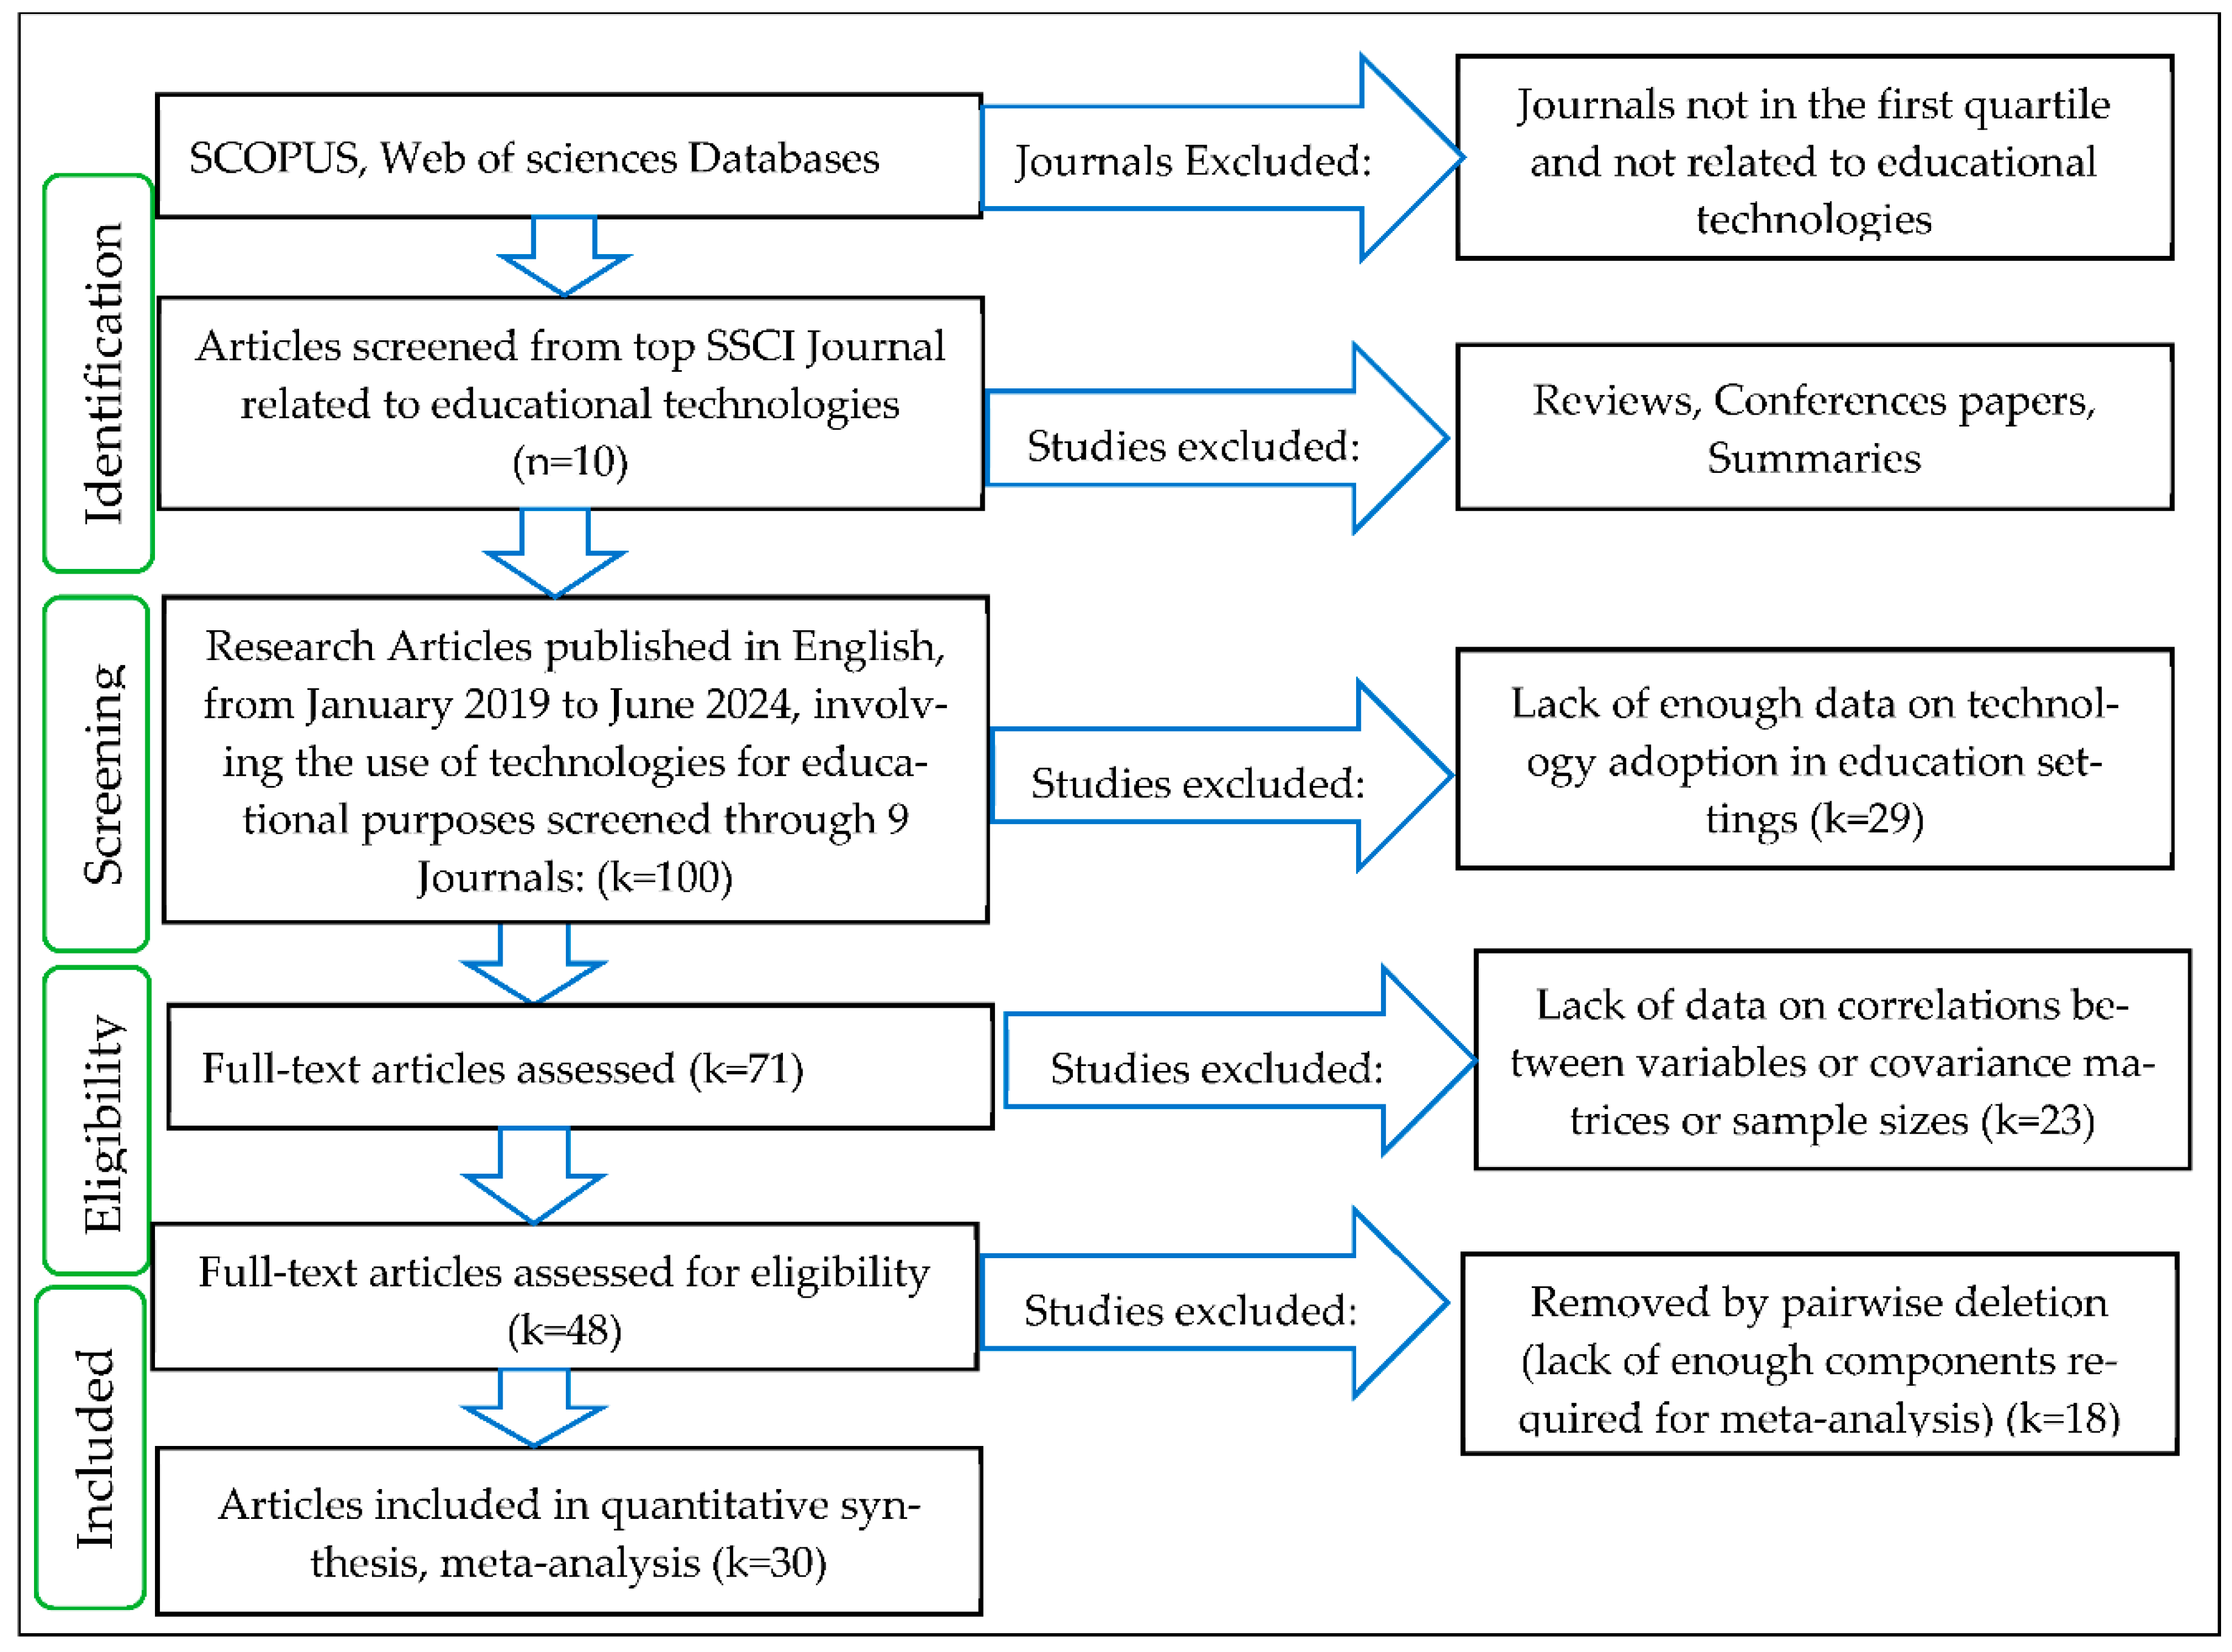
A hundred publications were reviewed, of which 71 focused on technology adoption in education, and 48 provided correlation or covariance matrices. Ultimately, 30 publications were deemed eligible for this study. The synthesis of correlation matrices can be challenging due to varying numbers of variables across studies. Two common methods for handling missing data are listwise deletion, which includes only studies with all variables, and pairwise deletion, which allows for the inclusion of all available studies [56]. This study utilized pairwise deletion, focusing on studies with at least 3 correlations across variables. Following this process, 30 studies (Error! Reference source not found.) were eligible for Correlation-Based Meta-Analytic Structural Equation Modeling.
Table 3.
Raw correlations considered for the meta-analytic procedures of 30 studies.
| References | N | PE→EE | PE→SI | PE→AU | PE→FC | PE→PV | EE→SI | EE→AU | EE→FC | EE→PV | FC→SI | FC→AU | FC→PV | SI→PV | SI→AU | PV→AU |
| [26] | 161 | 0.34 | 0.54 | 0.7 | 0.52 | 0.62 | 0.31 | 0.36 | 0.54 | 0.45 | 0.43 | 0.57 | 0.55 | 0.44 | 0.65 | 0.59 |
| [40] | 152 | 0.53 | 0.48 | 0.55 | 0.37 | 0.47 | 0.34 | 0.62 | 0.6 | 0.53 | 0.36 | 0.51 | 0.49 | 0.22 | 0.47 | 0.62 |
| [27] | 629 | 0.351 | 0.565 | 0.809 | 0.341 | 0.415 | 0.213 | 0.39 | 0.71 | 0.339 | 0.302 | 0.431 | 0.462 | 0.335 | 0.601 | 0.479 |
| [57] | 605 | 0.62 | 0.31 | 0.35 | NA | NA | 0.39 | 0.3 | NA | NA | NA | NA | NA | NA | 0.39 | NA |
| [58] | 418 | 0.561 | NA | 0.412 | NA | NA | NA | 0.353 | NA | NA | NA | NA | NA | NA | NA | NA |
| [41] | 54 | NA | NA | NA | NA | NA | 0.529 | 0.658 | 0.658 | NA | 0.366 | 0.573 | NA | NA | 0.526 | NA |
| [28] | 178 | 0.341 | NA | 0.404 | 0.213 | NA | NA | 0.396 | 0.413 | NA | NA | 0.334 | NA | NA | NA | NA |
| [21] | 365 | 0.804 | 0.648 | 0.637 | 0.654 | NA | 0.638 | 0.57 | 0.653 | NA | 0.539 | 0.436 | NA | NA | 0.66 | NA |
| [59] | 534 | 0.596 | 0.583 | 0.841 | 0.595 | NA | 0.42 | 0.636 | 0.798 | NA | 0.489 | 0.629 | NA | NA | 0.612 | NA |
| [30] | 141 | 0.508 | 0.478 | 0.41 | 0.552 | 0.64 | 0.477 | 0.324 | 0.574 | 0.327 | 0.638 | 0.507 | 0.548 | 0.6 | 0.416 | 0.508 |
| [31] | 352 | 0.734 | 0.65 | 0.618 | 0.653 | 0.491 | 0.699 | 0.588 | 0.693 | 0.491 | 0.781 | 0.672 | 0.669 | 0.676 | 0.742 | 0.586 |
| [20] | 537 | 0.632 | 0.528 | 0.637 | 0.635 | 0.606 | 0.507 | 0.637 | 0.609 | 0.577 | 0.501 | 0.605 | 0.564 | 0.484 | 0.474 | 0.585 |
| [32] | 218 | 0.711 | 0.552 | 0.676 | NA | NA | 0.428 | 0.565 | NA | NA | NA | NA | NA | NA | 0.498 | NA |
| [33] | 186 | 0.74 | 0.62 | 0.68 | NA | NA | 0.58 | 0.6 | NA | NA | NA | NA | NA | NA | 0.69 | NA |
| [25] | 156 | 0.468 | NA | 0.123 | NA | NA | NA | 0.132 | NA | NA | NA | NA | NA | NA | NA | NA |
| [39] | 99 | 0.687 | 0.742 | 0.666 | 0.771 | NA | 0.642 | 0.463 | 0.735 | NA | 0.712 | 0.68 | NA | NA | 0.651 | NA |
| [24] | 329 | 0.544 | NA | 0.511 | 0.561 | NA | NA | 0.499 | 0.556 | NA | NA | 0.506 | NA | NA | NA | NA |
| [60] | 462 | 0.73 | 0.61 | 0.7 | NA | NA | 0.55 | 0.64 | NA | NA | NA | NA | NA | NA | 0.64 | NA |
| [23] | 306 | 0.517 | NA | 0.673 | 0.528 | NA | NA | 0.535 | 0.676 | NA | NA | 0.601 | NA | NA | NA | NA |
| [34] | 194 | 0.748 | 0.584 | 0.701 | 0.584 | NA | 0.493 | 0.642 | 0.715 | NA | 0.425 | 0.519 | NA | NA | 0.645 | NA |
| [61] | 546 | 0.595 | 0.577 | NA | 0.559 | NA | 0.701 | NA | 0.525 | NA | 0.63 | NA | NA | NA | NA | NA |
| [62] | 233 | 0.452 | 0.478 | 0.671 | NA | NA | 0.381 | 0.454 | NA | NA | NA | NA | NA | NA | 0.583 | NA |
| [63] | 450 | 0.613 | 0.626 | 0.796 | NA | NA | 0.338 | 0.573 | NA | NA | NA | NA | NA | NA | 0.629 | NA |
| [22] | 574 | 0.529 | NA | 0.741 | NA | NA | NA | 0.51 | NA | NA | NA | NA | NA | NA | NA | NA |
| [35] | 58 | 0.7 | NA | 0.758 | NA | NA | NA | 0.641 | NA | NA | NA | NA | NA | NA | NA | NA |
| [36] | 207 | 0.613 | 0.433 | 0.56 | NA | NA | 0.333 | 0.502 | NA | NA | NA | NA | NA | NA | 0.672 | NA |
| [64] | 89 | 0.649 | 0.48 | 0.752 | NA | NA | 0.524 | 0.699 | NA | NA | NA | NA | NA | NA | 0.562 | NA |
| [37] | 223 | 0.507 | NA | 0.579 | NA | NA | NA | 0.589 | NA | NA | NA | NA | NA | NA | NA | NA |
| [38] | 134 | 0.396 | NA | 0.765 | NA | NA | NA | 0.366 | NA | NA | NA | NA | NA | NA | NA | NA |
| [65] | 344 | 0.829 | NA | 0.745 | NA | NA | NA | 0.81 | NA | NA | NA | NA | NA | NA | NA | NA |
* Note: sample size of each study; NA: Not available; →: path between variables; PE: Performance expectancy; EE: Effort expectancy; SI: Social influence; FC: Facilitating conditions; PV: Price value; AU: Acceptance and Use (Adoption decision. It is BI or, BIU, or use Behavior, actual use). In some primary studies, terms were substituted as follows: “performance expectancy” became “perceived usefulness” or “relative advantages”; “effort expectancy” was replaced by “perceived ease of use” or “self-efficacy”; “facilitating conditions” turned into “top management support” or “infrastructure”; and “social influence” was rephrased as “subjective norms” or “competitive pressure.” Additionally, “price value” was often referred to as “cost-effectiveness.” Lastly, several studies used “behavior intention to use” or “continuance of using” instead of “acceptance and use.”.
4.2. Data Analysis Using Two-Stage Structural Equation Modeling
In this study, the model was analyzed in R Studio using the METASEM package with Two-Stage Structural Equation Modeling (TSSEM). By combining data from multiple previous studies(Error! Reference source not found.).
MASEM enhances sample size and provides robust estimates of variable relationships, accounting for variations in effect sizes. The two-stage approach offers greater flexibility and superior performance over univariate methods [66].TSSEM integrates meta-analytic techniques and SEM, allowing for more reliable inferences from complex datasets. A pooled correlation matrix is used to incorporate study heterogeneity, especially with random-effects models [56]. In the first stage, correlations from 30 primary studies were combined into a pooled correlation matrix, enhancing statistical power and the generalizability of results. This matrix (Error! Reference source not found.) is vital as it consolidates information from independent studies for a more comprehensive analysis [67].
Table 4.
Pooled Correlation Matrix from Meta-analysis Result.
| PE | FC | SI | EE | PV | AU | |
| PE | 1 | 8880 (29) |
6160 (19) |
8334 (28) |
4523 (14) |
1972 (6) |
| FC | 0.588*** | 1 | 6214 (20) |
8388 (29) |
4577 (15) |
1972 (6) |
| SI | 0.545 *** |
0.466*** |
1 | 3764 (12) |
4031 (14) |
1972 (6) |
| EE | 0.623 *** | 0.517 *** | 0.507 *** |
1 | 1972 (6) |
5668 (19) |
| PV | 0.536 *** | 0.629 *** | 0.536 *** | 0.465 *** |
1 | 1972 (6) |
| AU | 0.542** | 0.458 *** | 0.547*** | 0.581 *** | 0.551*** | 1 |
Note. rc in a lower triangle and N (k) in an upper triangle; *** p < 0.001; ** p < 0.01. rc=Pooled correlation values; N= Number of participants for each correlation; k= Number of studies for each correlation.
Pooled correlation matrices (Error! Reference source not found.) address small sample size issues in individual studies, enhancing statistical power and generalizability. Serving as a crucial input for the second stage of MASEM, the pooled matrix synthesizes relationships across 30 studies(Error! Reference source not found.) enabling analysis of overall patterns and testing of theoretical models as described by Jak & Cheung [56]. Following the theoretical framework, a regression model was run using the Lavaan package for model fitting and hypothesis testing.
The structural equation model (SEM) was fitted to the pooled data using weighted least squares estimation, with the pooled correlation matrix as the observed covariance matrix. The model featured 6 paths aligned with the hypotheses, and the β coefficients along with standard errors were derived from this analysis (Figure A1. Plotted ETADC Model by R studio during TSSEM analysis in Appendix A). MASEM provided model fit estimates and regression coefficients with confidence intervals through the metaSEM package. Results, including z-statistic approximations and corresponding p-values, are detailed in the Appendix A Error! Reference source not found.A1 .
4.3. Results Interpretation and ETADEC Model Validation
To validate the structural equation model, it is required to follow these steps:
- First, check Model Fit: Evaluate overall model fit using indices like RMSEA (Root Mean Square Error of Approximation), SRMR (Standardized Root Mean Squared Residual), CFI (Comparative Fit Index), TLI (Tucker-Lewis’s index);
- Second, assess the explanatory power of the model(R²);
- Third, assess Path Coefficients(β): Ensure the significance and strength of path coefficients align with theoretical expectations.
4.3.1. ETADEC Model Fit Assessment
After fitting a linear regression model, it must determine how well it fits the data. In this study, goodness-of-fit indices including RMSEA, SRMR, TLI, and CFI which are four common fit measures were rigorously calculated (Error! Reference source not found. in appendix A). Goodness-of-fit indices (GOFI) are essential in Meta-analytic Structural Equation Modeling (MASEM) for several reasons: Firstly, they help assess how well a proposed structural equation model fits the meta-analytic data. They provide a quantitative measure of the model's ability to explain the observed relationships between variables across multiple studies. The GOEI results were crucial for evaluating model validity and conformity, validating the theoretical model, and ensuring that the MASEM results accurately represent the synthesized data from various studies on adopting education technologies. SEM (Structural Equation Modelling) data were interpreted and reported using the evaluation of the overall appropriateness of the model and summarizing the model fit indices such as RMSEA, SRMR, CFI, and TLI presented in Error! Reference source not found..A good model fit is considered adequate if the root mean square error of approximation (RMSEA) is < .05, with zero indicating a perfect fit. In our Educational Technology Adoption in Developing Countries (ETADC) model, RMSEA is 0.0387, indicating a good fit. The standardized root mean square residual (SRMR) also supports this with a value of 0.0476, suggesting a good model. The comparative fit index (CFI), which ranges from 0 to 1 with a good fit being CFI ≥ 0.95, shows a value of 0.9916 for our model, indicating a good fit as well. Finally, the Tucker-Lewis index (TLI) is 0.9578, meeting the threshold for a good fit.
Overall, the ETADC model has been found well fit with the data which describes its appropriateness and validity. In conclusion, all model fit indices such as RMSEA, SRMR, CFI, and TLI were found appropriate which indicates good model fit.
Table 5.
Summary model fit indices of the most important parameters and their accepted values according to the literature.
Table 5.
Summary model fit indices of the most important parameters and their accepted values according to the literature.
| Indices | Recommended values [68] | ETADC Testing values | Conclusion |
| Root Mean Square Error of Approximation (RMSEA) |
≤ 0.05; reasonable fit > 0.1; poor fit. |
0.0387 | Good model fit |
| Standardized Root Mean Squared Residual (SRMR) |
≤ 0.08 = acceptable fit | 0.0476 | Good model fit |
| Comparative Fit Index (CFI) |
= 1; perfect fit | 0.9916 | Good model fit |
| ≥ 0.95; excellent fit | |||
| Tucker-Lewis’s index (TLI) | ≥0.9; good fit; | 0.9578 | Good model fit |
4.3.2. Assessment of the ETADC Model’s Explanatory Power (R²)
R-squared (R²) measures the strength of the relationship between a model and the dependent variable on a scale of 0 to 100%. It indicates the percentage of variance in the dependent variable explained by the independent variables. In this model, “acceptance and use” is the dependent variable influenced by performance expectancy (PE), effort expectancy (EE), social influence (SI), and price value (PV). Conversely, EE acts as a dependent variable influenced by facilitating conditions (FC) and SI. The coefficients of determination (R²) on arrows connecting independent variables represent how much variance in the dependent variable is explained by the independent variables. An R² between 0.10 and 0.50 is acceptable if most explanatory variables are significant, while an R² of 0.50 to 0.99 is preferable. An R² below 0.10 is deemed unacceptable, and if R² equals 0, the dependent variable cannot be predicted from the independent variables [69]. In this model, the result in Error! Reference source not found. and Figure A1. Plotted ETADC Model by R studio during TSSEM analysis in the Appendix A shows performance expectancy, social influence, facilitating conditions, and price value which are independent variables, whereas effort expectancy and acceptance and use are dependent variables; The R² for EE is 0.53, indicating that FC and SI explain 53% of the variance in EE, while R² for acceptance and use is 0.52, meaning that EE, PE, SI, and PV explain 52% of the variance in acceptance and use of education technologies.
In conclusion, according to the results of the coefficient of determination of the model's dependent variables, the ETADC shows high explanatory power. The ETADC explains 53% of the variance in Effort expectancy and 52% of the variance in Acceptance and Use of education technologies.
Table 6.
The coefficient of determination (R2) for the dependent variables.
| Independent variables | Dependent variable | Coefficient of determination (R2) | Conclusion | |
| Social Influence (SI), Facilitating Conditions (FC) |
Effort Expectancy (EE) | 53% or 0.53 | Acceptable | |
| Performance Expectancy (PE), Social influence (SI), Price Value (PV), Effort Expectancy (EE) |
Acceptance and Use (AU) | 52% or 0.52 | Acceptable | |
4.3.3. Assessment of the ETADC Model’s Path Coefficients(β)
Path coefficients (β) and p-values are used to assess the relationships between variables, highlighting significant paths. A predictor and response variable have a statistically significant relationship if the p-value is below α = 0.05 (95% confidence). Path coefficients range from -1 to +1, with values closer to ±1 indicating stronger relationships. Generally, coefficients above 0.1 indicate small effects, above 0.3 medium effects, and 0.5 large effects, although these thresholds can vary by field. This study proposes several hypotheses: H1 suggests that Performance Expectancy (PE) significantly impacts the adoption of educational technologies, confirmed by β = 0.17; p < 0.01. H2 posits that Effort Expectancy (EE) significantly influences this adoption, supported by β = 0.29; p < 0.001. H3 argues that Facilitating Conditions (FC) positively affect EE, confirmed by β = 0.37; p < 0.001. H4 indicates that Social Influence (SI) significantly impacts EE, with results showing β = 0.44; p < 0.001. H5 states that SI significantly affects the adoption, supported by β = 0.15; p < 0.001. Lastly, H6 suggests that Price Value (PV) also considerably affects the adoption of educational technologies, confirmed by β = 0.24; p < 0.001. Accordingly, the effects of 6 paths of the model which represent its 6 hypotheses, were found to be significant (Error! Reference source not found. and Error! Reference source not found.).
Table 7.
Hypotheses Testing results.
| Hypotheses |
Paths (Connections between variables) |
Path Coefficients (β) |
Std. Error |
z value | p-values | Statistical Significance | Conclusion |
| H2 | Effort Expectancy → Acceptance and Use | 0.29 | 0.040 | 7.28 | <0.001 | Significant | supported |
| H1 | Performance Expectancy→ Acceptance and Use |
0.17 | 0.061 | 2.77 | <0.01 | Significant | supported |
| H6 | Price Value → Acceptance and Use | 0.24 | 0.032 | 7.41 | <0.001 | Significant | supported |
| H5 | Social Influence → Acceptance and Use | 0.15 | 0.044 | 3.38 |
<0.001 | Significant | supported |
| H3 | Facilitating Conditions → Effort Expectancy | 0.37 | 0.035 | 10.62 |
<0.001 | Significant | supported |
| H4 | Social Influence → Effort Expectancy | 0.44 | 0.042 | 10.33 | <0.001 | Significant | supported |
The following Error! Reference source not found. is the validated Educational Technology Adoption in Developing Countries (ETADC) model after hypotheses testing results.
Figure 4.
Validated ETADC model.
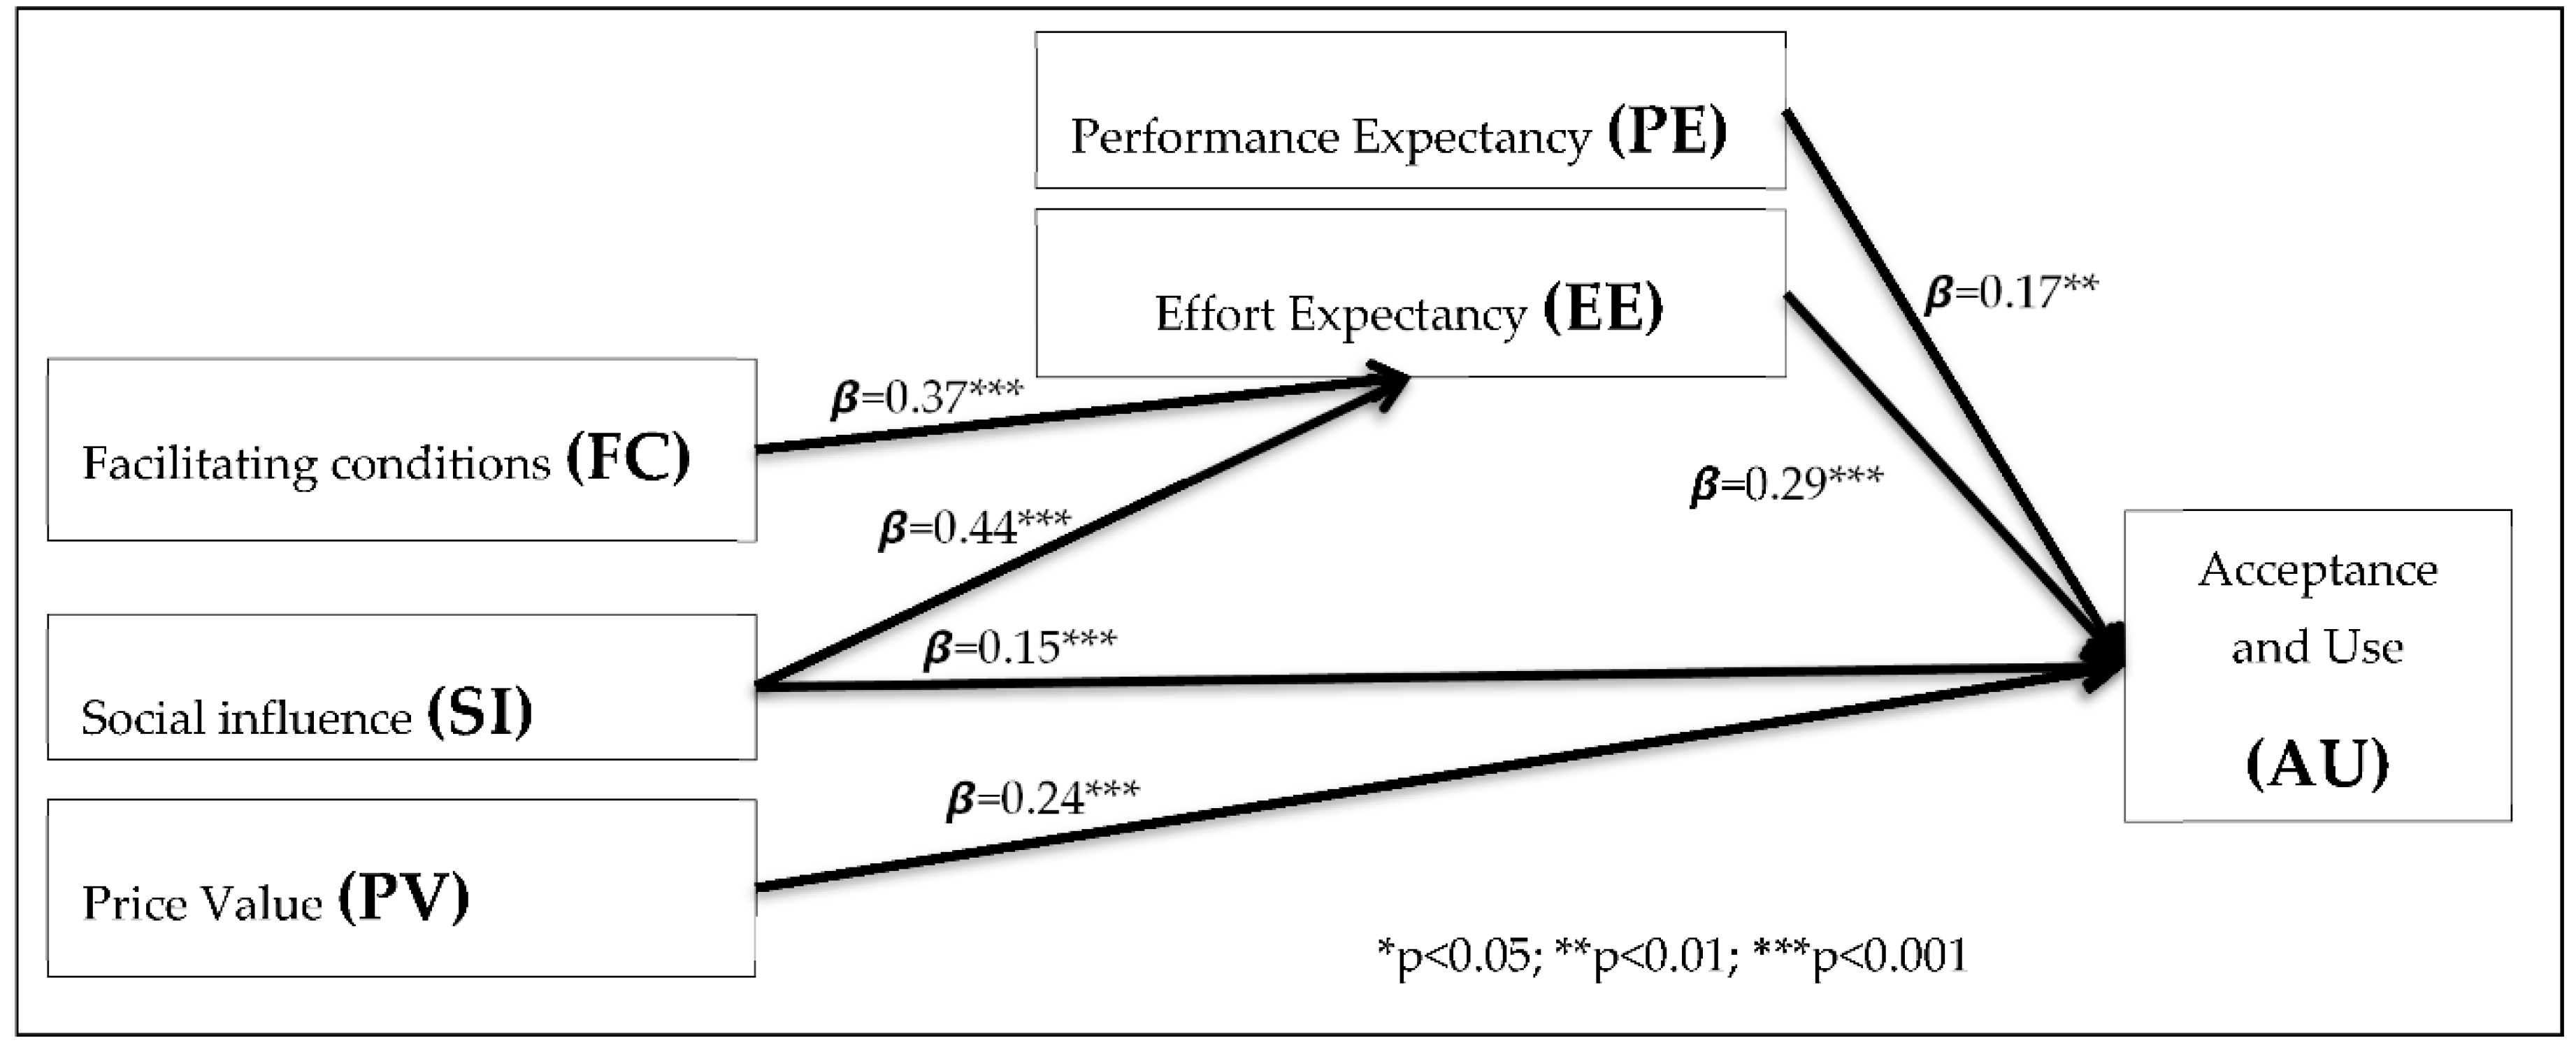
Statistical significance levels are indicated by asterisks: one asterisk (*) for p<0.05, two asterisks (**) for p<0.01, and three asterisks (***) for p<0.001. A p-value of 0.05 or lower indicates statistical significance, with lower values suggesting stronger results. For this study, hypotheses H2, H3, H4, H5, and H6 showed p-values less than 0.001, while H1 had a p-value less than 0.01, indicating significant and supported results for both.
4.3.4. Practical Application of the ETADC Model
The ETADC model was applied to evaluate some educational technologies, the ETADC components categorized as technological, individual, and organizational factors are used in this study to evaluate educational technologies for developing countries. The stages include:
- Performance expectancy (PE): A technological factor similar to perceived usefulness, helps identify suitable education technology by analyzing features;
- Price value (PV): A technological factor essential when considering technology purchases;
- Facilitating conditions (FC): A factor that pivots on the availability of devices, resources, and infrastructure including top management support, and expertise, is crucial for successful technology adoption through Effort expectancy (EE);
- Effort expectancy (EE): A factor that pivots on users' capability impacted by FC and SI;
- Social Influence (SI): A significant socio-cultural factor impacting both technology identification and adoption processes.
The data have been extracted from the Google Play Store, App Store, and Huawei Store, which are key markets for educational technologies. These technologies, recognized as mature according to the Gartner hype cycle 2023, align with educational needs to effectively achieve academic goals. They enhance engagement and promote personalized learning, creativity, critical thinking, and problem-solving skills through interactive and immersive experiences. Additionally, they reduce costs associated with traditional methods, improve accessibility to resources, support student-centered and inclusive education, and ultimately lead to better learning outcomes and preparation for a technology-driven future. Using the data above in Error! Reference source not found., the evaluation was conducted following the guide below (created in this study):
Table 8.
Example of Educational technologies extracted for evaluation using 5 stages of the ETADC model.
Table 8.
Example of Educational technologies extracted for evaluation using 5 stages of the ETADC model.
| Type of Educational technology | PE |
PV Pricing |
FC |
EE Users (Downloads) |
SI | |||||
| PE1 Features |
PE2 Category |
FC1 Required devices |
FC2 Download Size |
SI1 Technology maturity |
SI2 Teacher Approved |
SI3 reviews |
SI4 Ratings on market |
|||
| 1. Real-time engagement technologies (Quizlet) | Promote engagement, personalized learning, creativity, critical thinking, problem-solving skills |
Education | $1.99 - $35.99 | computers, iPads, iPhones, iTouches, Android tablets, and smartphones | 39 MB | 10M+ | Yes | Yes | 712K | 4.7
|
| 2. Design and creativity technologies (Canva) | Education | $1.49 - $300 | 27 MB | 100M+ | Yes | Yes | 19.3M | 4.8
|
||
| 3. Interactive learning labs (PhET Simulations) | Education | 0.99$ | 123MB | 50K+ | Yes | Yes | 531 | 4.7
|
||
| 4. Language learning technology (Duolingo) | Education | $0.99 - $239.9 | 81MB | 500M+ | Yes | Yes | 30.5M | 4.7
|
||
| 5. Virtual Reality and Augmented reality (CamToPlan) | Business and Education | Free – $17.99 | 20M | 100K+ | Yes | Yes | 7.38K | 4.5
|
||
| 6. Robotics (Mio, the Robot) | Education | FREE | 48 MB | 100K+ | Yes | Yes | 1.25K | 3.1
|
||
| 7. Game-based learning platforms (Kahoot) | Education | FREE | 93 MB | 50M+ | Yes | Yes | 751K | 4.7
|
||
| 8. Learning Management Systems (Google Classroom) | Education | FREE | 21.65 MB | 100M+ | Yes | Yes | 2.04M | 4.1
|
||
| 9. Interactive learning platforms (Nearpod) | Education | FREE | 3 MB | 1M+ | Yes | Yes | 7.04K | 2.2
|
||
| 10. Open Education Resources (Khan Academy) | Education | FREE | 28MB | 10M+ | Yes | Yes | 167K |
4.2
|
||
| 11. Three-dimensional printing (Tinkercad) | Education | FREE | 100K+ | Yes | Yes | 825 |
2.5
|
|||
The scores range from 1 to 5 stars: 
Step 1: Performance Expectancy (PE)
PE1: Is this technology Developed for educational Purposes?
There are 33 types of categories of technologies; by the way, we are interested in educational technologies. However, some tools or business technologies can be used for education purposes; hence, scores are given regarding this guide:
- 5 stars if the technology is designed for Education purposes;
- 4 stars if the technology is developed as a tool that can be applied for Education purposes;
- 3 stars if the technology is designed for Business purposes and can be applied in Education;
- 2 stars if the technology is designed for Entertainment but can be applied for Education purposes;
- 1 star if the technology is designed for Lifestyle or others but can be applied for Education purposes.
PE2: What are the key features offered by these educational technologies?
Through interactive and immersive experiences educational technologies can:
- Enhance engagement,
- Promote personalized learning,
- Promote creativity,
- Promote critical thinking,
- Promote problem-solving skills.
Hence, scores are given regarding this guide:
- 5 stars if the educational technology can offer at least five or more features;
- 4 stars if the educational technology can offer at least four features;
- 3 stars if the educational technology can offer at least three features;
- 2 stars if the educational technology can offer at least two features;
- 1 star if the educational technology can offer at least one feature.
Step2: Price Value (PV)
Is this Technology affordable?
Technology is more accepted in developing countries regarding its affordability; hence, scores are given regarding this guide:
- 5 stars if the educational technology is accessible for FREE or 0$ (pricing per item);
- 4 stars if the educational technology is accessible between 1 $ -20 $ (pricing per item);
- 3 stars if the educational technology is accessible between 20 $ -50$ (pricing per item);
- 2 stars if the educational technology is accessible between 50$ -100 $ (pricing per item);
- 1 star if the educational technology is accessible from 100 $ and above (pricing per item).
Step3: Facilitating conditions (FC)
FC1: What Kinds of devices are supported by this technology?
Some technologies are supported by smartphones, computers, Android tablets, iPads, iPhones, iTouches, and other devices; Hence, scores are given following this guide (created by the author):
- 5 stars if the educational technology is available for five or more types of devices;
- 4 stars if the educational technology is available for four types of devices;
- 3 stars if the educational technology is available for three types of devices;
- 2 stars if the educational technology is available for two types of devices;
- 1 star if the educational technology is available for one type of device.
FC2: What is the Size of this technology?
The size of educational technology impacts its acceptance, technology with the lowest size is more preferred. Hence, scores are given regarding this guide:
- 5 stars if the Download Size of educational technology is below 50 MB;
- 4 stars if the Download Size of educational technology is above 50 MB to 100 MB;
- 3 stars if the Download Size of educational technology is above 100 MB to 150 MB;
- 2 stars if the Download Size of educational technology is above 150 MB to 199 MB;
- 1 star if the Download Size of educational technology is 200 MB or above.
Step4: Effort Expectancy (EE)
Is this educational easy to use? How many users already using this educational technology?
Numbers of users(download) indicating that technology has been selected for use or purchased, users have required devices to use it, and its ease of use; hence, scores are given regarding this guide:
- 5 stars if the educational technology has above 100M downloads;
- 4 stars if the educational technology has 10M+ to 100M downloads;
- 3 stars if the educational technology has 100K+ to 10M downloads;
- 2 stars if the educational technology has 50K to 100K downloads;
- 1 star if the educational technology has below 50K downloads.
Step3: Social Influence (SI1)
SI1: How mature is this educational technology?
Technology maturity is evaluated according to the Gartner cycle's stages; Hence, scores are given regarding this guide:
- 5 stars if the educational technology has reached the Plateau of productivity (the technology becomes widely accepted and integrated into regular use);
- 4 stars if the educational technology has reached the slope of enlightenment (gradual understanding and practical applications of the technology begin to crystallize as more success stories emerge);
- 3 stars if the educational technology has reached the trough of disillusionment (realization of the technology’s limitations leading to disappointment and reduced interest);
- 2 stars if the educational technology has reached the peak of inflated expectations (high expectations are fueled by hype and speculative success stories);
- 1 star if the educational technology is still on the Technology trigger (the initial emergence of the technology, generating interest and media buzz).
SI2: Is this Technology approved by Teachers?
Some technologies available on the market are not yet approved by teachers; hence, cores are given regarding this guide:
- 5 stars if Teachers have approved the educational technology;
- 0 star if Teachers have not yet approved the educational technology.
SI3: How many people have reviewed this technology?
A large number of people who have revised an educational technology indicates its dynamic consideration by users.
Accordingly, scores are given regarding this guide:
- 5 stars if the educational technology has above 1M reviews;
- 4 stars if the educational technology has 100K+ to 1M reviews;
- 3 stars if the educational technology has 50k+ to 100k reviews;
- 2 stars if the educational technology has 10k to 50k reviews;
- 1 star if the educational technology has below 10k reviews.
SI4: How is the educational technology rating on the technology store market?
On the Educational Technologies market store, users review technologies and provide ratings, Hence, scores are given regarding their ratings.
- 5 stars if the educational technology is rated 4.5 stars and above;
- 4 stars if the educational technology is rated 3.5 to 4.4 stars;
- 3 stars if the educational technology is rated 2.5 to 3.4 stars;
- 2 stars if the educational technology is rated 1.5 to 2.4 stars;
- 1 star if the educational technology is rated 1.4 stars and below.
The summary of the results is given in the Error! Reference source not found.; all eleven educational technologies have a good score between 3.8 stars and 4.8 stars while the maximum score is 5 stars. The evaluated educational technologies were found to be suitable for further adoption in developing countries.
Table 9.
The adoption rate of eleven evaluated educational technologies.
| Type of Educational technology | PE=(PE1+PE2)/2 | PV | FC=(FC1+FC2)/2 | EE | SI=(SI1+SI2+SI3+SI4) /4 | Adoption rate =(PE+PV+FC+EE+SI) /5 | |||||||||
| PE1 | PE2 | PE | FC1 | FC2 | FC | SI1 | SI2 | SI3 | SI4 | SI | |||||
| 1. Real-time engagement technologies (Quizlet) | 4 | 4 | 4 | 5 | 5 | 5 | 5 | 4 | 5 | 5 | 4 | 5 | 4.7 |
4.5
|
|
| 2. Design and creativity technologies (Canva) | 5 | 5 | 5 | 4 | 5 | 5 | 5 | 5 | 5 | 5 | 5 | 5 | 5 |
4.8
|
|
| 3. Interactive learning labs (PhET Simulations) | 5 | 5 | 5 | 4 | 5 | 3 | 4 | 2 | 5 | 5 | 1 | 5 | 4 |
3.8
|
|
| 4. Language learning technology (Duolingo) | 5 | 4 | 4.5 | 4 | 5 | 4 | 4.5 | 5 | 5 | 5 | 5 | 5 | 5 |
4.6
|
|
| 5. Virtual Reality and Augmented reality (CamToPlan) | 5 | 5 | 5 | 5 | 4 | 5 | 4.5 | 3 | 5 | 5 | 1 | 5 | 4 |
4.3
|
|
| 6. Robotics (Mio, the Robot) | 5 | 5 | 5 | 5 | 5 | 5 | 5 | 3 | 5 | 5 | 2 | 3 | 3.7 |
4.3
|
|
| 7. Game-based learning platforms (Kahoot) | 5 | 4 | 4.5 | 5 | 5 | 4 | 4.5 | 4 | 5 | 5 | 4 | 5 | 4.7 |
4.5
|
|
| 8. Learning Management Systems (Google Classroom) | 5 | 4 | 4.5 | 5 | 5 | 5 | 5 | 5 | 5 | 5 | 5 | 4 | 4.7 |
4.8
|
|
| 9. Interactive learning platforms (Nearpod) | 5 | 4 | 4.5 | 5 | 5 | 5 | 5 | 3 | 5 | 5 | 1 | 2 | 3.2 |
4.1
|
|
| 10. Open Education Resources (Khan Academy) | 5 | 4 | 4.5 | 5 | 5 | 5 | 5 | 4 | 5 | 5 | 4 | 4 | 4.5 |
4.6
|
|
| 11. Three-dimensional printing (Tinkercad) | 5 | 4 | 4.5 | 5 | 5 | 4 | 4.5 | 3 | 5 | 5 | 1 | 3 | 3.5 |
4.1
|
|
5. Research Implications and Conclusion
This study applied a Meta-analysis combined with structural equation modeling (MASEM) using the two-stage structural equation modeling (TSSEM) approach to synthesize data from 30 studies on educational technology adoption in global educational settings. It tested a model for Educational Technology Adoption in Developing Countries (ETADC) and addressed missing correlations in some studies. The main outcome was a robust framework for understanding the adoption of educational technologies in developing countries, helping researchers and practitioners identify suitable technologies and enhance their adoption processes.
5.1. Theoretical Contributions: Model’s Superiority
The Educational Technology Adoption in Developing Countries (ETADC) model is superior for educational technology adoption due to several key factors:
- It was specifically developed for the unique challenges of developing countries, whereas most primary models focus on advanced countries, making them less effective in this context.
- The ETADC model is tailored for education and validated with data exclusively from the education sector, unlike previous models that were adapted from other fields.
- Unlike primary models that target specific technologies, the ETADC addresses educational technology adoption in general.
- It uses a large sample size (8934) from various countries, enhancing its validity, while primary models often rely on small, localized samples.
- The ETADC model considers a crucial pedagogical variable: TPACK articulates the essential knowledge that educators must possess to effectively integrate technology into their teaching practices.
- The ETADC model considers crucial variables such as cost-effectiveness, customization, alignment with academic goals, and the unique cultural, infrastructural, and economic factors in developing countries.
5.2. Practical Implications
The developed model may assist educational institutions in developing countries in identifying and adopting effective educational technologies.
- Performance Expectancy: Institutions should meticulously assess a technology's features and its relevance to curriculum goals to ensure it enhances teaching-learning outcomes before adoption.
- Facilitating Conditions and Effort Expectancy: Successful technology adoption requires strong organizational support, adequate resources, training, and teachers who can effectively integrate technology into their teaching practices.
- Price Value: The benefits of adopting a new technology must outweigh its costs; otherwise, it is not worth the investment.
- Effort Expectancy: Through TPACK, aims to articulate the essential knowledge that educators must possess to effectively integrate technology into their teaching practices.
- Social Influence: Developing countries can enhance their educational standards by learning from successful technology integration in advanced countries, such as China’s community-based professional development strategies.
5.3. Conclusion
Despite numerous studies on educational technology adoption, few focus on developing countries where existing models, primarily tested in advanced nations, often fail to address unique challenges. These challenges include limited resources, infrastructure, and skills. This study contributes by: 1) developing the Educational Technology Adoption in Developing Countries (ETADC) model to identify appropriate technologies; 2) validating the ETADC model's effectiveness and generalizability; and 3) outlining the requirements and steps for successful technology adoption in these educational settings. The Educational Technology Adoption in Developing Countries (ETADC) model aims to guide the selection and adoption of suitable technologies in educational settings. It hypothesizes that performance expectancy (PE), effort expectancy (EE), social influence (SI), and price value (PV) positively affect technology acceptance and adoption in education. Additionally, facilitating conditions (FC) and social influence (SI) enhance users’ effort expectancy (EE). Identifying the right educational technology requires alignment between its features and users' goals, as users are more likely to adopt technology that improves their performance. Thus, performance expectancy is central to the model. Technology adoption is a multidimensional process influenced not only by the technology itself but also by the users and their context. The model emphasizes the need for compatibility between technology features and performance expectancy, particularly in developing countries facing unique challenges like limited resources and infrastructure. It incorporates user capabilities (effort expectancy) and top management support (facilitating conditions) as crucial factors. Success in educational technology interventions relies not just on the technology itself but on its customization to local contexts and policy constraints. Key constructs of the Educational Technology Adoption in Developing Countries (ETADC) model include technology affordability, accessibility, and cost-effectiveness, along with social influence, which affects decision-making and adoption processes by drawing from the experiences of pioneering countries. Using correlation matrices from 30 studies on technology adoption in education, meta-analytic structural equation modeling (MASEM) was applied to fit a model known as the Educational Technology Adoption in Developing Countries (ETADC). This model includes 6 hypotheses, all found significant, and demonstrates a good fit with the data, validating its appropriateness. Using the developed ETADC model and a guide created in this study, eleven educational technologies have been evaluated for further adoption.
Future research would focus on adopting suitable educational technologies for developing countries using the ETADC model. Additionally, studies are needed to explore factors considered by developers and EduTech companies when developing educational technology, as well as how they incorporate user reviews to enhance EduTech functionalities.
Author Contributions
The authors contributed meaningfully and equally to this study for research topic; data acquisition and analysis; methodology support; original draft preparation; writing review and editing. All authors have read and agreed to the published version of the manuscript.
Funding
This work was supported by the National Natural Science Foundation of China under Grant 62177025.
Institutional Review Board Statement
Not applicable.
Informed Consent Statement
Not applicable.
Data Availability Statement
Data are contained within the article, and supplementary datasets generated and/or analyzed during this study are available from the corresponding author upon request.
Conflicts of Interest
Regarding the research, writing, and/or publication of this article, the authors have declared that they have no potential conflicts of interest.
Abbreviations
The following abbreviations are used in this manuscript:
| % | Percent | JR | Job Relevance |
| A | Anxiety | MASEM | Meta-analytic Structural Equation Modeling |
| AG | Age | MSE | Mobile Self-Efficacy |
| AI | Artificial Intelligence | N | Number of the studies |
| AN | Anthropomorphism | OA | Operational ability |
| AT | Attitude Toward Using | OPQ | Output Quality |
| AT | Attitude | OU | Objective Usability |
| AU | Acceptance and Use | PA | Perceived Autonomy |
| AW | Awareness | PCR | Perceived cyber risk |
| BIA | Behavior Intention to Adopt | PE | Performance Expectancy |
| BIU | Behavior Intention | PEC | Perception of external control |
| BIU | Behavior Intention to Use | PENJ | Perceived Enjoyment |
| CA | Computer Anxiety | PEU | Perceived Ease of Use |
| CBAM | Concerns-Based Adoption Model | PI | Personal Innovativeness |
| CFI | Comparative Fit Index | PL | Playfulness |
| CM | Complexity | PR | Perceived risk |
| CP | Compatibility | PRA | Perceived relative advantage |
| CPF | Computer Playfulness | PT | Perceived Trust |
| CS | Cyber Security | PU | Perceived usefulness |
| CSE | Computer self-efficacy | PV | Price Value |
| DCs | Developing Countries | R2 | The coefficient of determination |
| DF | Degree of freedom | RA | Relative advantage |
| DOI | Diffusion of Innovations Theory | RD | Results Demonstrability |
| EdTech | Educational Technology | RMSEA | Root Mean Square Error of Approximation |
| EE | Effort Expectancy | SA | Satisfaction |
| EF | Efficiency | SE | Self-Efficacy |
| ETADC | Educational Technology Adoption in Developing Countries | SEM | Structural Equation Modelling |
| EX | Experience | SI | Social influence |
| FC | Facilitating Conditions | SIS | social isolation |
| GD | Gender | SN | Subjective Norms |
| GOFI | Goodness-of-fit indices | SRMR | Standardized Root Mean Squared Residual |
| H | Hypothesis | ST | Stress |
| H | Habit | TAM | Technology Acceptance Model, |
| HEIs | Higher education institutions | TC | Technology challenges |
| HM | Hedonic Motivation | TLI | Tucker-Lewis’s index |
| ICT | Information and Communication Technologies | TOE | Technology-Organization-Environment |
| IM | Image | TPACK | Technological Pedagogical Content Knowledge |
| IMGN | Imagination | TR | Trust |
| IMRN | Immersion | TSSEM | Two-Stage Structural Equation Modeling |
| INTR | Interaction | TTF | Task-Technology Fit |
| IoT | Internet of Things | UB | Use Behavior |
| IU | Intention to Use a Technology | UTAUT | Unified Theory of Acceptance and Use of Technology |
| IU | The Intention of Use | WTU | Willingness to Use |
| IV | Intrinsic Value | β | Path coefficients |
Appendix A
Table A1.
z statistic approximation Coefficients at 95% confidence intervals.
| Estimate | Std. Error | Lowbound | Upbound | z value | Pr(>|z|) | |
| AU on EE | 0.293149 | 0.040248 | 0.214265 | 0.372033 | 7.2837 | 3.249e-13 *** |
| AU on PE | 0.169997 | 0.061223 | 0.050002 | 0.289992 | 2.7767 | 0.0054917 ** |
| AU on PV | 0.242560 | 0.032734 | 0.178403 | 0.306717 | 7.4101 | 1.263e-13 *** |
| AU on SI | 0.150857 | 0.044516 | 0.063607 | 0.238107 | 3.3888 | 0.0007019 *** |
| EE on FC | 0.374236 | 0.035246 | 0.305156 | 0.443316 | 10.6180 | < 2.2e-16 *** |
| EE on SI | 0.437334 | 0.042322 | 0.354385 | 0.520283 | 10.3336 | < 2.2e-16 *** |
| PE with FC | 0.618127 | 0.021354 | 0.576273 | 0.659981 | 28.9461 | < 2.2e-16 *** |
| PV with FC | 0.629135 | 0.022312 | 0.585404 | 0.672866 | 28.1970 | < 2.2e-16 *** |
| PE with PV | 0.543783 | 0.027304 | 0.490268 | 0.597299 | 19.9156 | < 2.2e-16 *** |
| SI with PV | 0.540050 | 0.020028 | 0.500796 | 0.579304 | 26.9647 | < 2.2e-16 *** |
| SI with FC | 0.425293 | 0.026239 | 0.373867 | 0.476720 | 16.2087 | < 2.2e-16 *** |
| PE with SI | 0.574790 | 0.018721 | 0.538098 | 0.611482 | 30.7036 | < 2.2e-16 *** |
Table A2.
Overall Goodness-of-fit.
| Goodness-of-fit indices: | Value |
| Sample size | 8934.0000 |
| Chi-square of the target model | 43.2121 |
| DF of the target model | 3.0000 |
| p-value of the target model | 0.0000 |
| Number of constraints imposed on "Smatrix" | 0.0000 |
| DF manually adjusted | 0.0000 |
| Chi-square of the independence model | 4776.8168 |
| DF of the independence model | 15.0000 |
| RMSEA | 0.0387 |
| RMSEA lower 95% CI | 0.0290 |
| RMSEA upper 95% CI | 0.0494 |
| SRMR | 0.0476 |
| TLI | 0.9578 |
| CFI | 0.9916 |
| AIC | 37.2121 |
| BIC | 15.9192 |
Figure A1.
Plotted ETADC Model by R studio during TSSEM analysis.
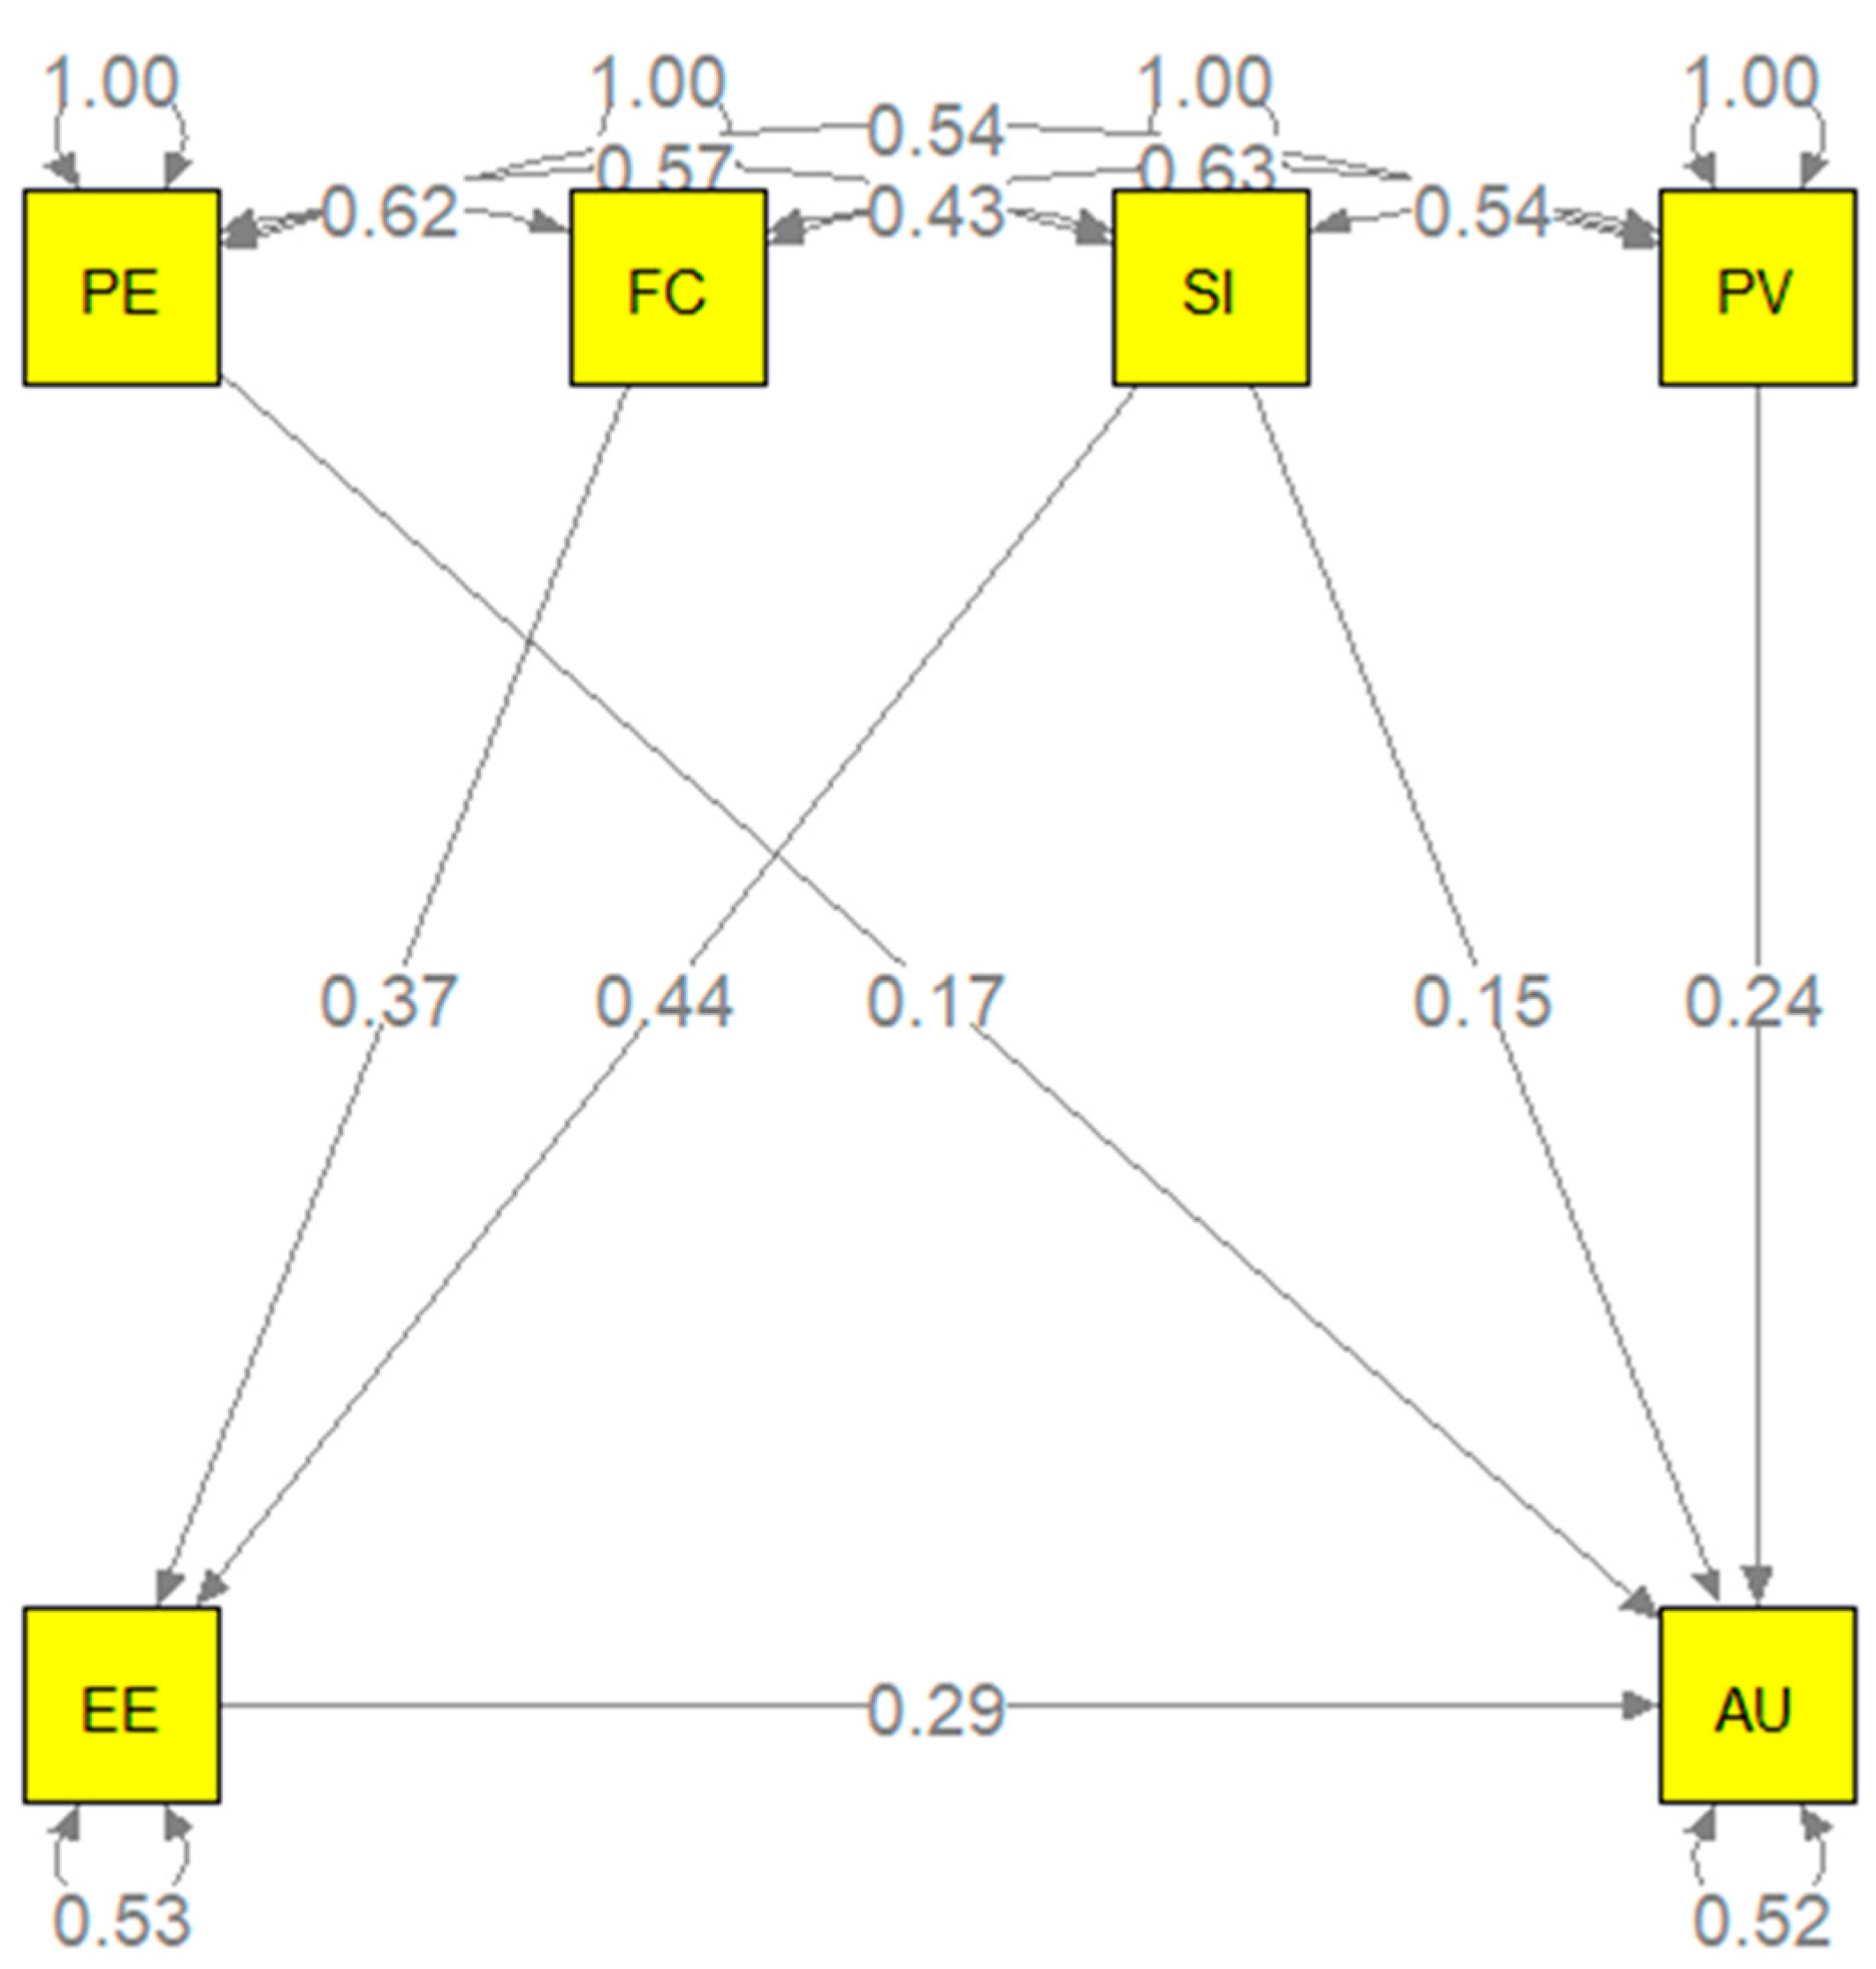
References
- Bozkurt, A., Educational Technology Research Patterns in the Realm of the Digital Knowledge Age. Journal of Interactive Media in Education, 2020. 2020: p. 1-17. [CrossRef]
- Burch, P. and N. Miglani, Technocentrism and social fields in the Indian EdTech movement: formation, reproduction and resistance. Journal of Education Policy, 2018. 33(5): p. 590-616. [CrossRef]
- Buabeng-Andoh, C., Exploring University students’ intention to use mobile learning: A research model approach. Education and Information Technologies, 2021. 26. [CrossRef]
- Almaiah, D. and O. Alismaiel, Examination of factors influencing the use of mobile learning system: An empirical study. Education and Information Technologies, 2019. 23: p. 1-25.
- Silva, A. and D. Garzón, Identifying the Cognitive and Digital Gap in Educational Institutions Using a Technology Characterization Software. International Journal of Virtual and Personal Learning Environments, 2023. 13: p. 1-12.
- Hennessy, S., et al., Technology Use for Teacher Professional Development in Low- and Middle-Income Countries: A Systematic Review. Computers and Education Open, 2022. 3: p. 100080. [CrossRef]
- Madni, H., et al., Factors Influencing the Adoption of IoT for E-Learning in Higher Educational Institutes in Developing Countries. Frontiers in Psychology, 2022. 13: p. 915596.
- Saleh, S., M. Nat, and M. Aqel, Sustainable Adoption of E-Learning from the TAM Perspective. Sustainability, 2022. 14: p. 3690. [CrossRef]
- Ali, J., et al., IoT Adoption Model for E-Learning in Higher Education Institutes: A Case Study in Saudi Arabia. Sustainability, 2023. 15: p. 9748. [CrossRef]
- Ullah, N., et al., Blockchain Technology Adoption in Smart Learning Environments. Sustainability, 2021. 13. [CrossRef]
- Yip, K., et al., Adoption of mobile library apps as learning tools in higher education: a tale between Hong Kong and Japan. Online Information Review, 2020. ahead-of-print. [CrossRef]
- Alsswey, A., et al., M-learning technology in Arab Gulf countries: A systematic review of progress and recommendations. Education and Information Technologies, 2020. 25(4): p. 2919-2931. [CrossRef]
- Bice, H. and H. Tang, Teachers’ beliefs and practices of technology integration at a school for students with dyslexia: A mixed methods study. Education and Information Technologies, 2022. 27(7): p. 10179-10205. [CrossRef]
- Zaineldeen, S., et al., Technology Acceptance Model' Concepts, Contribution, Limitation, and Adoption in Education. Universal Journal of Educational Research, 2020. 8: p. 5061-5071.
- Venkatesh, V. and F. Davis, A Theoretical Extension of the Technology Acceptance Model: Four Longitudinal Field Studies. Management Science, 2000. 46: p. 186-204. [CrossRef]
- Venkatesh, V., et al., User Acceptance of Information Technology: Toward a Unified View. MIS Quarterly, 2003. 27: p. 425-478.
- Blut, M., et al., Meta-Analysis of the Unified Theory of Acceptance and Use of Technology (UTAUT): Challenging its Validity and Charting a Research Agenda in the Red Ocean. Journal of the Association for Information Systems, 2022. 23: p. 13-95. [CrossRef]
- Tamilmani, K., et al., The extended Unified Theory of Acceptance and Use of Technology (UTAUT2): A systematic literature review and theory evaluation. International Journal of Information Management, 2020. 57: p. 102269. [CrossRef]
- Venkatesh, V. and H. Bala, Technology Acceptance Model 3 and a Research Agenda on Interventions. Decision Sciences - DECISION SCI, 2008. 39: p. 273-315. [CrossRef]
- Al-Adwan, A.S. and M.M. Al-Debei, The determinants of Gen Z's metaverse adoption decisions in higher education: Integrating UTAUT2 with personal innovativeness in IT. Education and Information Technologies, 2024. 29(6): p. 7413-7445. [CrossRef]
- Wiangkham, A. and R. Vongvit, Exploring the Drivers for the Adoption of Metaverse Technology in Engineering Education using PLS-SEM and ANFIS. Education and Information Technologies, 2023. 29. [CrossRef]
- Al-Adwan, A., et al., Extending the Technology Acceptance Model (TAM) to Predict University Students’ Intentions to Use Metaverse-Based Learning Platforms. Education and Information Technologies, 2023. 28. [CrossRef]
- Koutromanos, G., et al., The mobile augmented reality acceptance model for teachers and future teachers. Education and Information Technologies, 2023. 29: p. 1-39.
- Chatterjee, S. and K. Bhattacharjee, Adoption of artificial intelligence in higher education: a quantitative analysis using structural equation modelling. Education and Information Technologies, 2020. 25. [CrossRef]
- Saif, N., et al., Chat-GPT; validating Technology Acceptance Model (TAM) in education sector via ubiquitous learning mechanism. Computers in Human Behavior, 2024. 154: p. 108097. [CrossRef]
- Tseng, T., et al., Investigating teachers’ adoption of MOOCs: the perspective of UTAUT2. Interactive Learning Environments, 2019. 30: p. 1-16. 30: p. 1-16. [CrossRef]
- Strzelecki, A., et al., Acceptance and use of ChatGPT in the academic community. Education and Information Technologies, 2024. 29(17): p. 22943-22968. [CrossRef]
- Wang, S., et al., Participant or spectator? Comprehending the willingness of faculty to use intelligent tutoring systems in the artificial intelligence era. British Journal of Educational Technology, 2020. 51. [CrossRef]
- Strzelecki, A., To use or not to use ChatGPT in higher education? A study of students' acceptance and use of technology. Interactive Learning Environments, 2024. 32: p. 5142-5155. [CrossRef]
- Wang, Y.-Y., Y.-S. Wang, and S.-E. Jian, Investigating the Determinants of Students’ Intention to Use Business Simulation Games. Journal of Educational Computing Research, 2019. 58: p. 073563311986504. [CrossRef]
- Wang, Y.-Y. and Y.-W. Chuang, Investigating the potential adverse effects of virtual reality-based learning system usage: from UTAUT2 and PPVITU perspectives. Interactive Learning Environments, 2023. 32: p. 1-20. [CrossRef]
- Unal, E. and A. Uzun, Understanding university students’ behavioral intention to use Edmodo through the lens of an extended technology acceptance model. British Journal of Educational Technology, 2020. 52. [CrossRef]
- Lin, J.-W. and Y.-C. Lai, User acceptance model of computer-based assessment: moderating effect and intention-behavior effect. Australasian Journal of Educational Technology, 2019. 35. [CrossRef]
- Bazelais, P., G. Binner, and T. Doleck, Examining the key drivers of student acceptance of online labs. Interactive Learning Environments, 2022. 32: p. 1-16. [CrossRef]
- Chen, H.-L., G. Widarso, and H. Sutrisno, A ChatBot for Learning Chinese: Learning Achievement and Technology Acceptance. Journal of Educational Computing Research, 2020. 58: p. 073563312092962. [CrossRef]
- Bilquise, G., S. Ibrahim, and S.E. Salhieh, Investigating student acceptance of an academic advising chatbot in higher education institutions. Education and Information Technologies, 2023. 29: p. 1-26. [CrossRef]
- Estriégana, R., J. Medina, and R. Barchino, Student acceptance of virtual laboratory and practical work: An extension of the technology acceptance model. Computers & Education, 2019. 135. [CrossRef]
- Barrett, A., A. Pack, and E. Quaid, Understanding learners’ acceptance of high-immersion virtual reality systems: Insights from confirmatory and exploratory PLS-SEM analyses. Computers & Education, 2021. 169: p. 104214. [CrossRef]
- Khechine, H., B. Raymond, and M. Augier, The adoption of a social learning system: Intrinsic value in the UTAUT model. British Journal of Educational Technology, 2020. 51. [CrossRef]
- Jung, I. and J. Lee, A cross-cultural approach to the adoption of open educational resources in higher education. British Journal of Educational Technology, 2019. 51. [CrossRef]
- Saidu, M.K. and M.A. Al Mamun, Exploring the Factors Affecting Behavioural Intention to Use Google Classroom: University Teachers’ Perspectives in Bangladesh and Nigeria. TechTrends, 2022. 66(4): p. 681-696.
- Teng, Z., et al., Factors Affecting Learners’ Adoption of an Educational Metaverse Platform: An Empirical Study Based on an Extended UTAUT Model. Mobile Information Systems, 2022. 2022: p. 1-15. [CrossRef]
- Abbad, M., Using the UTAUT model to understand students’ usage of e-learning systems in developing countries. Education and Information Technologies, 2021. 26. [CrossRef]
- Zhu, Z. and W. Huang, A meta-analysis of mobile learning adoption using extended UTAUT. Information Development, 2023: p. 026666692311764. [CrossRef]
- Yakubu, N. and S. Dasuki, Factors affecting the adoption of e-learning technologies among higher education students in Nigeria: A structural equation modelling approach. Information Development, 2018. 35: p. 026666691876590.
- Yadegaridehkordi, E., et al., Predicting the Adoption of Cloud-Based Technology Using Fuzzy Analytic Hierarchy Process and Structural Equation Modeling Approaches. Applied Soft Computing, 2018. 66. [CrossRef]
- Miah, M., J. Singh, and M. Rahman, Factors Influencing Technology Adoption in Online Learning among Private University Students in Bangladesh Post COVID-19 Pandemic. Sustainability, 2023. 15: p. 3543. [CrossRef]
- Duong, D., How effort expectancy and performance expectancy interact to trigger higher education students’ uses of ChatGPT for learning. Interactive Technology and Smart Education, 2023. 21.
- Amrozi, Y., et al., Adoption of Information Technology as a Mediator Between Institutional Pressure and Change Performance. Journal of Namibian Studies : History Politics Culture, 2023. 34. [CrossRef]
- He, L. and C. Li, Students’ Adoption of ICT Tools for Learning English Based on Unified Theory of Acceptance and Use of Technology. Asian Journal of Education and Social Studies, 2023. 44: p. 26-38. [CrossRef]
- Sofwan, M., A. Habibi, and M. Yaakob, TPACK’s Roles in Predicting Technology Integration during Teaching Practicum: Structural Equation Modeling. Education Sciences, 2023. 13: p. 448. [CrossRef]
- Al-Rahmi, A., et al., Social media usage and acceptance in higher education: A structural equation model. Frontiers in Education, 2022. 7. [CrossRef]
- Dwivedi, Y.K., et al., Re-examining the Unified Theory of Acceptance and Use of Technology (UTAUT): Towards a Revised Theoretical Model. Information Systems Frontiers, 2019. 21(3): p. 719-734. [CrossRef]
- Meet, R.K., D. Kala, and A.S. Al-Adwan, Exploring factors affecting the adoption of MOOC in Generation Z using extended UTAUT2 model. Education and Information Technologies, 2022. 27(7): p. 10261-10283. [CrossRef]
- Chomunorwa, S. and V. Mugobo, Challenges of e-learning adoption in South African public schools: Learners’ perspectives. Journal of Education and e-Learning Research, 2023. 10: p. 80-85. [CrossRef]
- Jak, S. and M. Cheung, Meta-Analytic Structural Equation Modeling With Moderating Effects on SEM Parameters. Psychological Methods, 2019. 25. [CrossRef]
- Ateş, H. and C. Gündüzalp, A unified framework for understanding teachers’ adoption of robotics in STEM education. Education and Information Technologies, 2023. 29: p. 1-27. [CrossRef]
- Singh, H., P. Singh, and D. Sharma, Faculty acceptance of virtual teaching platforms for online teaching: Moderating role of resistance to change. Australasian Journal of Educational Technology, 2023: p. 33-50. [CrossRef]
- Strzelecki, A., To use or not to use ChatGPT in higher education? A study of students' acceptance and use of technology. Interactive Learning Environments, 2023: p. 1-14. [CrossRef]
- Guggemos, J., S. Seufert, and S. Sonderegger, Humanoid robots in higher education: Evaluating the acceptance of Pepper in the context of an academic writing course using the UTAUT. British Journal of Educational Technology, 2020. 51. [CrossRef]
- Ustun, A.B., et al., Development of UTAUT-based augmented reality acceptance scale: a validity and reliability study. Education and Information Technologies, 2024. 29(9): p. 11533-11554. [CrossRef]
- Kashive, N. and D. Phanshikar, Understanding the antecedents of intention for using mobile learning. Smart Learning Environments, 2023. 10. [CrossRef]
- Liu, Y., J.C.-Y. Sun, and S.-K. Chen, Comparing technology acceptance of AR-based and 3D map-based mobile library applications: a multigroup SEM analysis. Interactive Learning Environments, 2023. 31(7): p. 4156-4170. [CrossRef]
- Nikou, S., Factors influencing student teachers’ intention to use mobile augmented reality in primary science teaching. Education and Information Technologies, 2024. 29: p. 15353-15374. [CrossRef]
- Rahman, M.S., et al., Examining students' intention to use ChatGPT: Does trust matter? Australasian Journal of Educational Technology, 2023. 39: p. 51-71.
- Cheung, M. and S.F. Cheung, Random-effects models for meta-analytic structural equation modeling: review, issues, and illustrations. Research Synthesis Methods, 2016. 7: p. 140-155.
- Cheung, M., Fixed- and random-effects meta-analytic structural equation modeling: Examples and analyses in R. Behavior research methods, 2013. 46. [CrossRef]
- Goretzko, D., K. Siemund, and P. Sterner, Evaluating Model Fit of Measurement Models in Confirmatory Factor Analysis. Educational and Psychological Measurement, 2023. 84: p. 001316442311638. [CrossRef]
- Sova, R., C. Tudor, and C. Tartavulea, Artificial Intelligence Tool Adoption in Higher Education: A Structural Equation Modeling Approach to Understanding Impact Factors among Economics Students. Electronics, 2024. 13: p. 3632. [CrossRef]
Disclaimer/Publisher’s Note: The statements, opinions and data contained in all publications are solely those of the individual author(s) and contributor(s) and not of MDPI and/or the editor(s). MDPI and/or the editor(s) disclaim responsibility for any injury to people or property resulting from any ideas, methods, instructions or products referred to in the content. |
© 2025 by the authors. Licensee MDPI, Basel, Switzerland. This article is an open access article distributed under the terms and conditions of the Creative Commons Attribution (CC BY) license (http://creativecommons.org/licenses/by/4.0/).
Copyright: This open access article is published under a Creative Commons CC BY 4.0 license, which permit the free download, distribution, and reuse, provided that the author and preprint are cited in any reuse.


