
Submitted:
06 March 2025
Posted:
07 March 2025
You are already at the latest version
Abstract
Raman micro-spectroscopy is a powerful, label-free technique for biochemical characterization of cells, but its complex spectral data require advanced computational methods for meaningful interpretation. Clustering analysis is widely used in spectroscopic imaging to extract meaningful biochemical information. Traditional methods, such as K-means clustering with Euclidean distance, often struggle to capture subtle spectral variations, leading to suboptimal segmentation. Alternative distance metrics, including cosine and Mahalanobis distances, have been explored to enhance cluster separability, yet challenges remain in distinguishing chemically relevant features while minimizing redundancy and noise. In this study, we introduce an asymmetric metric distance matrix with a tunable eccentricity parameter to improve clustering performance in Raman hyperspectral imaging. Our results demonstrate that suitable eccentricity values enhance the identification of subcellular structures while requiring fewer clusters than Euclidean-based approaches. Compared to polar metrics, the proposed asymmetric metric achieves better stability and reduced noise, leading to more accurate segmentation. Future research could explore its application in other clustering techniques and machine learning frameworks, as well as its application in broader spectral imaging techniques where distance metric plays a fundamental role.
Keywords:
Raman imaging
; biochemical micro-spectroscopy
; asymmetric metric matrix
; K-means clustering analysis
; cellular spectral imaging
1. Introduction
Raman spectroscopy is a powerful, non-invasive analytical technique that provides detailed molecular information about biological samples, making it particularly valuable in biomedical research. By measuring the inelastic scattering of monochromatic light, Raman spectroscopy generates spectral fingerprints that reflect the biochemical composition of cells, tissues, and biofluids. This capability has led to its widespread application in, among the others, cellular biology [1,2], disease diagnosis [3,4], and drug development [5,6].
However, the complexity and high dimensionality of Raman spectral data pose significant challenges in data interpretation. Spectra often contain overlapping peaks, autofluorescence and noise background, along with an intrinsic variability due to heterogeneity of biological samples. Primarily, raw data require to be pre-processed with background reduction (such as polynomial subtraction or similar techniques) and somehow normalized in intensity, to reduce as much as possible the presence of non-Raman signals and signal differences due to different optical parameters (laser power, integration time, variations in focusing on the sample). However, also after the most efficient preprocessing and in the presence of clean Raman signals, the extraction of meaningful insights from Raman imaging datasets of complex biological samples requires the use of computational approaches such as machine learning and more recently deep learning techniques. Among machine learning approaches, K-means clustering analysis (KCA) can be still considered as an effective unsupervised method for analyzing Raman hyper-spectral images.
K-means clustering is a widely used partitioning algorithm that groups data points into clusters based on spectral similarity. By minimizing intra-cluster variance, it allows for the identification of distinct biochemical regions within a Raman image, facilitating the differentiation of cellular components, disease states, or metabolic processes. Compared to other clustering techniques such as hierarchical clustering or Gaussian mixture models, K-means offers computational efficiency and scalability, making it suitable for large Raman imaging datasets.
However, the choice of distance metric in K-means clustering has a crucial importance for achieving a meaningful segmentation of Raman data. Different metrics, such as Euclidean distance or polar distance (cosine function), can significantly impact the clustering outcome by influencing how spectral similarities and differences are measured. Selecting an appropriate metric ensures that biologically relevant spectral variations are effectively captured, leading to improved cluster separability and more accurate identification of biochemical structures within the sample.
In the last two decades several efforts have been made to introduce non-Euclidean metrics in the framework of clustering analysis, and limiting the view to angular-based metrics several works have been proposed, like polar coordinates for circular clustering [7] and for density peaks clustering [8], polar transforms with k-means segmentation [9], and clustering by polar self-organizing maps [10]. Also, efforts for exploring and exploiting asymmetries have been proposed, like asymmetric self-organizing maps [11], unsupervised anisotropic clustering [12], asymmetric K-means algorithm [13], and K-means clustering on asymmetric data [14]. However, in these latter works on asymmetric clustering, all the proposed methods develop a non-metric use of data asymmetry, by introducing gaussian kernels or dissimilarities measures.
In this study, we develop an asymmetric metric distance to improve clustering performance, and an ad-hoc introduced parameter called eccentricity will move from Euclidean to polar distance through different asymmetry degrees. By applying K-means clustering to Raman imaging of cell samples, we explore the optimization of two clustering parameters, the eccentricity and the number of clusters. We will show that an appropriate choice of the eccentricity parameter significantly enhances the quality of image segmentation, compared to both Euclidean and polar metrics, and could improve the ability to distinguish subtle biochemical variations inside the cells. These results could contribute to the advancement of computational Raman micro-spectroscopy for biomedical applications.
2. Materials and Methods
2.1. Cell Culturing and Fixation
Two cell lines were used for this work, and specifically human hepatocarcinoma cells HepG2 and human hepatic stellate cells LX-2.
HepG2 cell line was purchased from the American Type Culture Collection (ATCC, Manassas, VA, USA) and were grown in a humidified incubator (95% O2, 5% CO2) at 37°C in Minimum Essential Medium (MEM, Corning 10-009-CV), supplemented with 10% FBS (SIAL) and 1% penicillin/streptomycin (100 μg/ml) (SIAL).
LX-2 cells were grown at 37 °C in a humidified atmosphere containing 5% CO2 in complete Dulbecco’s Modified Eagle Medium (DMEM, 4.5 g/L glucose, phenol red, no L-glutamine, no sodium pyruvate) supplemented with 1% v/v penicillin/streptomycin mixture (penicillin: 10,000 U/mL, streptomycin: 10,000 µg/mL), 1% v/v of L-glutamine (200 nM), and 2% v/v fetal bovine serum (FBS) (LX-2 cells, DMEM, FBS penicillin, streptomycin and L-glutamine are all from Merck Millipore, Darmstadt, Germany).
For all cell cultures, sterilized CaF2 slides (from Crystran Ltd, Dorset, UK) are used as substrates inside the culturing wells, because of the negligible Raman signal of CaF2. Moreover, all cell media were replaced with serum-free and phenol-red-free DMEM (from HyClone, Logan, UT, USA) supplemented with 1% v/v penicillin/streptomycin and 1% v/v L-glutamine before Raman experiments, to reduce possible interfering signals from the media.
2.2. Raman Measurements
Raman micro-spectroscopy was carried out by means of an Alpha 300-R instrument (Witec GmbH, Germany), using a 532 nm laser. A laser power of 10 mW/cm² was set over the sample, with a typical integration time of 1 s per single spectrum. During Raman experiments, the fixed cells were maintained in a PBS (1X) solution. A 60X/0.90 NA water immersion objective was used to focus the incident laser on the sample. According to diffraction laws, the minimum achievable spot size under optimal conditions with this optical setup was approximately 0.35 µm. Raman maps were acquired by scanning the sample under the laser focus, according to a measurement grid with a pixel size of 0.40 µm and collecting one Raman spectrum per pixel.
2.3. Raman Pre-Processing
Raman images were obtained from hyperspectral datasets using multivariate analysis applied to pre-processed spectra. The same pre-processing steps were applied to all spectra. Initially, the water background signal was subtracted from all spectra, followed by polynomial baseline subtraction to account for potential autofluorescence effects. Subsequently, the spectra of each map were normalized to the maximum spectral area, ensuring comparability between Raman datasets acquired at different times. All data pre-processing as well as KCA are performed with Raman-Tool-Set software, freely available [15].
3. Anisotropic Distance Metric
In vibrational spectroscopy, each spectrum can be represented as a point in an N-dimensional space, where N is the number of acquired intensities. Thus, each spectrum can be expressed as an array, denoted as r. Since vibrational intensities are strictly positive, all components of r are positive.
When applying clustering or other machine learning techniques, a distance metric is required to compare spectra. Incorporating prior knowledge of the data structure can be beneficial in defining an appropriate metric. Two spectra, r0 and r1, convey the same chemical information if they exhibit the same relative peak ratios, even if their absolute intensities differ (Figure 1). Mathematically, such spectra can be expressed as:
where c is a scalar greater than 1. In this case, both spectra originate from the same molecular species, with the only difference being concentration (higher for r1 if c>1), which affects the overall intensity. Representing r0 and r1 as vectors in a coordinate system, they share the same direction and lie on the same straight line originating from the origin. Conversely, a spectrum r2 that deviates significantly in angle from r0 represents a different chemical composition. Therefore, an ideal distance metric should reflect this data structure.
r1=c⋅r0 with c>1,
For simplicity, we consider a three-dimensional (3D) case. Given a reference spectrum r₀ in a 3D space, the distance to another spectrum r is computed using a metric matrix. The displacement vector is:
Δr=r−r0,
The Euclidean distance d is typically given by:
which can be rewritten as the dot product:
d2=|Δr|2=Δx2+Δy2+Δz2,
d2=Δr⋅Δr,
Introducing a metric matrix M, the generalized distance is:
where the Euclidean metric matrix MEU is simply the identity matrix:
d2=ΔrTMΔr,
MEU=I,
This defines an isotropic distance, meaning all points equidistant from r0 form a sphere centered at r0 (Figure 2A). However, this standard distance metric does not account for the underlying data structure. To incorporate anisotropy, we define an asymmetric metric matrix MAS, which produces ellipsoidal isodistance surfaces instead of spherical ones.
The desired anisotropic distance metric forms a prolate ellipsoid with its major axis aligned with r0. To control elongation, we introduce an eccentricity parameter, ecc, which defines the ratio between minor and major axes. Figure 2 illustrates the effect of varying ecc, with panels B, C, and D corresponding to ecc=0.50, 0.25, and 0.10, respectively. The most elongated ellipsoid is represented by ecc=0.10.
These surfaces indicate that all blue points in Figure 2 have the same computed distance d from r0, based on the chosen metric. When using the Euclidean matrix (Figure 2A), the isodistance surface remains a sphere (indicating isotropic distance), whereas with the asymmetric matrix (Figure 2B–D), the sphere deforms into an ellipsoid (indicating an anisotropic distance). In this formulation, points aligned with r0 along the major axis are assigned smaller distances, while points deviating from r0 along the minor axes are assigned larger distances. This ensures that the metric prioritizes spectral similarity based on relative peak ratios rather than absolute intensity differences.
If r0 lies on the x axis, the asymmetric metric matrix that produces the desired result in 3D is given by:
where 1/eccx determines the elongation along the x axis (such that a smaller eccx results in a larger the elongation) and eccx corresponds to the eccentricity parameter ecc introduced earlier, i.e. eccx=ecc. For the other axes we set eccy=eccz to obtain a prolate ellipsoid shape. These parameters can be collectively denoted as ecc⊥. Moreover, since a metric matrix must be unitary, the following condition must hold:
which simplifies to
Solving for ecc⊥, we obtain:
This result implies that only a single eccentricity parameter, ecc, needs to be specified along the axis of r0, while the others are uniquely determined.
To compute distances from r0 using the metric matrix T, we apply:
yielding isodistance surfaces in the form of prolate ellipsoids with the major axis aligned to x axis. However, this formulation is only valid when r0 lies on the x axis. To extend the approach for a generic r0, we first apply a rotation matrix R which aligns r0 with the x axis:
d2=ΔrTTΔr,
r0’=Rr0
Δr’=RΔr=R(r-r0)
Then, the asymmetric matrix T is used to compute distances between the rotated vectors:
d2=Δr’TTΔr’
Substituting Δr’=RΔr yields:
d2=(RΔr)TT (RΔr)
d2=ΔrT(RTTR)Δr
Thus, the desired asymmetric metric matrix, MAS, applicable to any arbitrary r0, is given by:
MAS=RTTR
Since both R and T are unitary metric matrices, the resulting MAS is also unitary and a valid metric matrix.
Extending this approach to N-dimensions is straightforward. The matrix T in N-dimensions is given by:
where the unitary condition results in:
Instead, the N-dimensional rotation matrix R is computed using the general method proposed in ref. [16].
4. Results and Discussion
4.1. Asymmetric Metric Matrix Benchmark, Compared with Eculidean and Polar Metrics
We performed K-means clustering analysis on Raman hyperspectra of cells using the asymmetric metric matrix MAS to compute distances between spectra. First, we compared Euclidean and pure polar distances with asymmetric distances, varying the eccentricity parameter ecc. A Raman dataset recorded over a HepG2 cell was used for this test.
Figure 3 presents the results obtained with the different metrics for some cluster numbers (6, 7 and 8 clusters). For all cluster numbers, we observe that Euclidean distance and the asymmetric distance with ecc=0.50 (first two columns of Figure 3) produce remarkably similar results. This indicates that KCA algorithm does not perform significantly differently when using these two metrics. The reason becomes clear when observing the isodistance surfaces (Figure 2A-B), with ecc=1.00 corresponding to Euclidean distance, and ecc=0.50 which still results in a near-spherical shape. Indeed, with ecc=0.50 the ratio between major and minor axis of the prolate ellipsoid is not so pronounced and the isodistance surface is not so far from the sphere of Euclidean metric.
Results change significantly when decreasing to ecc=0.25 and even more to ecc=0.10. Even with 6 clusters, the asymmetric metric with ecc=0.25 highlights subcellular regions (yellow areas in the picture of Figure 3) that are not detected with Euclidean and ecc=0.50 metrics, while preserving the general structure of other regions (blue, reddish and green areas). It is important to note that all images in the first row of Figure 3 correspond to clustering with 6 clusters. But for Euclidean and ecc=0.50 metrics we have 4 different reddish colors (dark red, purple, red and magenta), while in the case of ecc=0.25 we have only 3 reddish colors (purple, red and magenta) along with one additional yellow cluster. This means that ecc=0.25 improves segmentation by reducing redundant clusters (the 4 reddish tones in the Euclidean and ecc=0.50 metrics) and enhancing the detection of biochemical differences due to spectral vectors orientation. This capability is even more pronounced at ecc=0.10 (again with 6 clusters): the corresponding image shows well delimited and clean subcellular regions, where blue and reddish areas are better defined within a more extended yellow region (see below in the text for color assignment).
The pure polar metric can be regarded as an extreme case of the asymmetric metric, where the ellipsoid becomes highly elongated, approaching a straight-line form. This is just a point of view for comparison with the asymmetric metric. Mathematically, pure polar distance is a cosine-based metric that considers only angular deviations between spectral vectors. In the last image of first row (Figure 3), the pure polar result appears excessively noisy: while the reddish and blue areas are enough defined, the yellow and green regions are mixed. Moreover, only two reddish colors (red and purple) remain, and a light green cluster is added. This evident deterioration in segmentation is likely due to the exclusive reliance of the polar metric on vector orientation, without consideration of spectral intensity (i.e., vector magnitude).
When moving to 7 clusters (second row of Figure 3), we first note that the additional cluster outcomes in a yellow area, like that mentioned above, in the case of Euclidean and ecc=0.50 asymmetric metrics. While in the case of ecc=0.25 and ecc=0.10 asymmetric metrics, the additional cluster is found as a 4th reddish tone. The conclusion is that adding one cluster allows Euclidean and ecc=0.50 metrics to recover one chemical information missing with 6 clusters (the yellow area), while the ecc=0.25 and ecc=0.10 are forced to add a redundant cluster among the reddish tones. Further, we can note that all these metrics produce similar results with 7 clusters (first 4 images of second row), but again the ecc=0.25 and ecc=0.10 metrics lead to better defined subcellular regions. The image of pure polar metric with 7 clusters is still noisy, and the blue area is divided into two sub-regions.
4.2. Biohemical Assignment of Clustered Regions
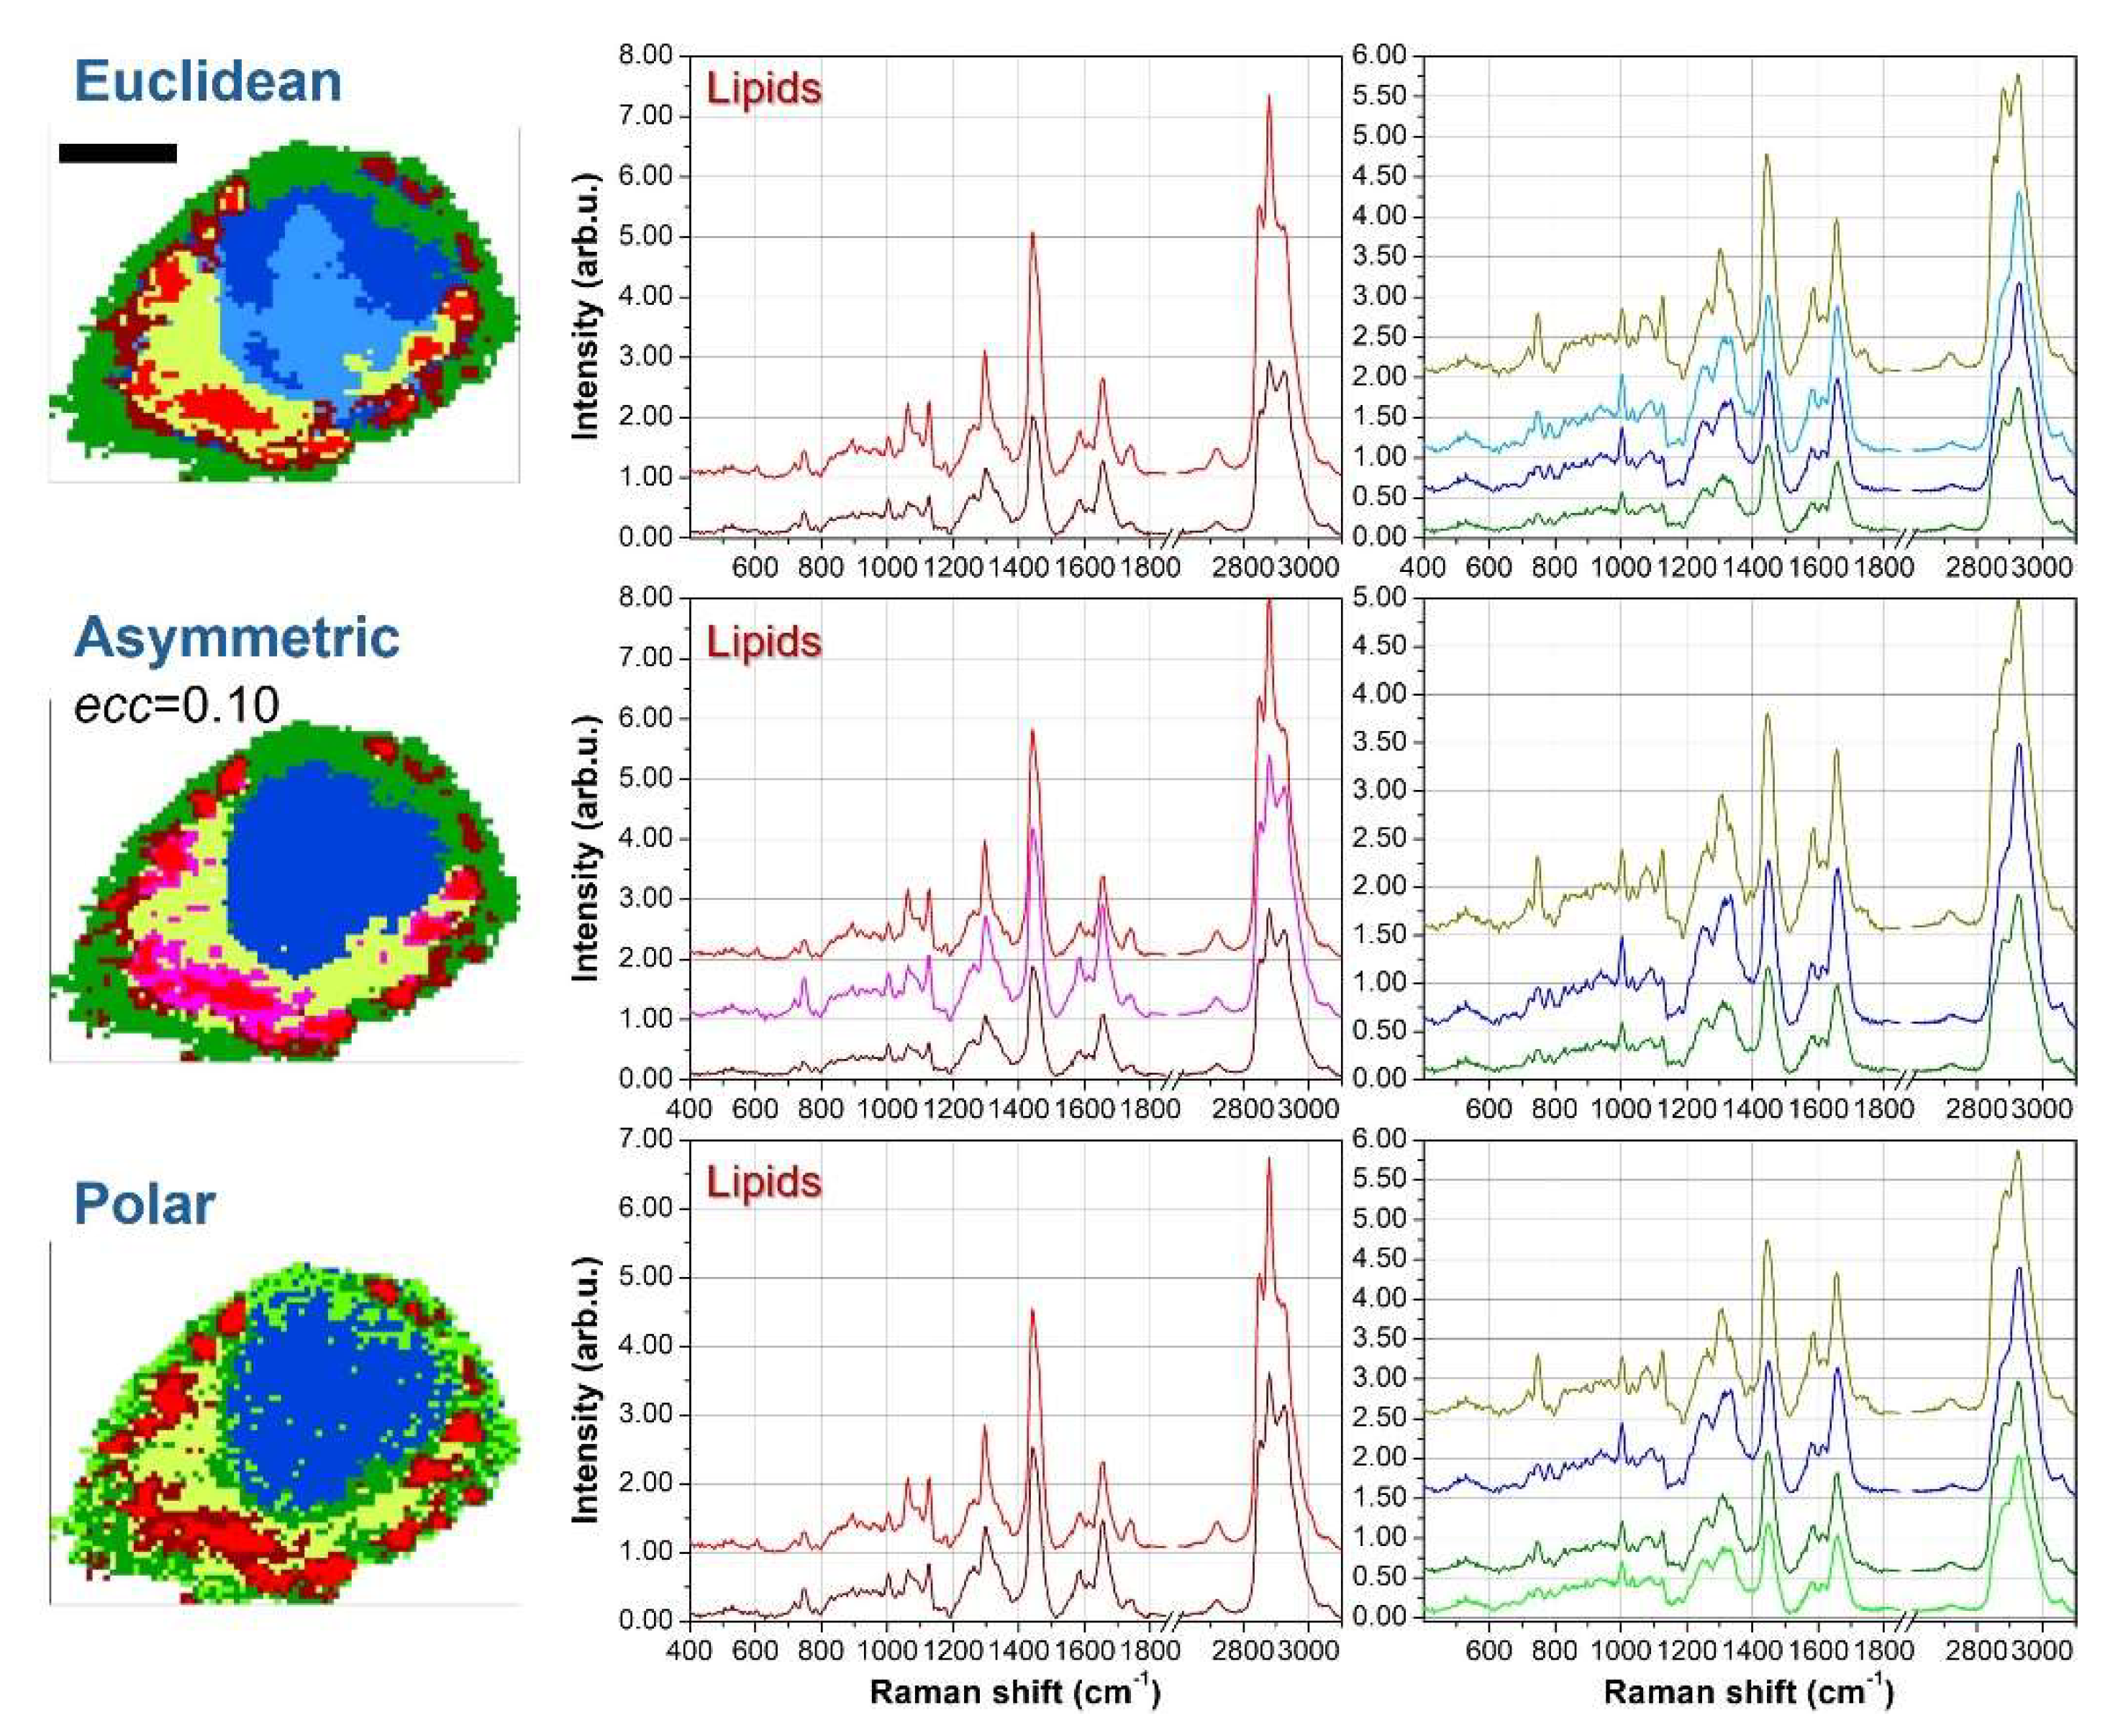
To elucidate the chemical meaning of the different clusters and to check redundant segmentation, Figure 4 shows the average spectra for the 7 clusters case. Since some clustering results are similar each other, we examine the average curves outcoming from Euclidean, asymmetric with ecc=0.10 and polar metrics. Further, for clarity’s sake we divide the lipid-originated spectra (reddish tones) from other biological contributions.
For all reddish spectra, we can notice the presence of clear peaks at 2850 and 2880cm-1, which are well-known spectral markers for lipid molecules [17,18]. Moreover, the peaks at 1265 and 1300cm-1 are also related to lipids vibrations, and their intensity ratio I1265/I1300 correlates directly with the unsaturation degree [19]. Another indicator for the presence of C=C double bonds in lipids is the intensity of the 1660cm-1 peak compared with the intensity at 1445cm-1 [19]. However, this marker is more useful in the context of pure molecules analysis than in cellular datasets, because in cellular and tissue samples also proteins vibrations contribute to the 1660cm-1 intensity. Among the other average spectra, the yellow curve is characterized by peaks at 750, 1130 and 1582cm-1 which are typical vibrations of Cytochrome C and can be ascribed to mitochondria [20-22], both in perinuclear regions (endoplasmic reticulum) and in cytoplasmatic regions (branched to cytoskeleton). The blue spectrum exhibits characteristic peaks of DNA bases at 785, 1340 and 1575cm-1 [23,24], and therefore blue clusters can be assigned to nuclear regions. Finally, the green curve resembles the average Raman signal of the overall cell, but with a significantly smaller intensity. These features, along with the outer location of green clusters, suggest that this signal is originated by the thinner parts of the external cell membrane. The just described spectral features are shared among the average spectra obtained with the different metrics.
In Figure 4, the lipids spectra for Euclidean and ecc=0.10 asymmetric metrics can be considered redundant. As an example, if we consider the I1265/I1300 ratio and the 2850 and 2880cm-1 intensities, the red and magenta curves (the first two from the top) are quite overlapping each other, while the dark red curve (the bottom one) is significantly different from the others. The purple curve is a kind of hybridization between the red-magenta curves and the dark-red one, thus representing a kind of transition curve, but does not bring any new chemical information. Instead, the other curves (yellow, blue and green) are strictly necessary to properly address nuclear, mitochondria and outer membrane regions. Conversely, the polar metric with 7 clusters addresses correctly the lipidic compartment, assigning only two curves ascribable to different unsaturation degrees. But two redundant curves are introduced, one in the nuclear region and another in the outer membrane. The nuclear region is divided into two parts, but the corresponding average spectra (blue and dark cyan curves) do not exhibit significant differences. A similar argumentation holds for the division of the outer membrane and the corresponding green and light green curves.
4.3. Concluding Remarks on Asymmetric Metric Benchamrk
In summary, 7 clusters are needed for Euclidean and ecc=0.50 asymmetric metrics to detect the presence of mitochondria signals, but at the expense of redundant segmentation in the lipidic regions with 4 clusters assigned to lipids. On the other hand, ecc=0.25 and even more ecc=0.10 asymmetric metrics properly address mitochondria signals already with 6 clusters, and only a slight redundancy is present in the lipidic region with 3 clusters. Passing to 7 clusters for ecc=0.25 and 0.10 is not helpful, and only increases the redundancy in the lipidic segmentation. Polar metric with 6 and 7 clusters reveals the presence of mitochondria and works fine in the segmentation of lipidic signals, assigning only 2 clusters to lipids. But redundancy is produced in the other regions: in the case of 7 clusters, nearly overlapping average spectra are assigned in both nuclear and outer membrane regions, while in the case of 6 clusters this redundancy is present in the outer membrane. However, the main disadvantage of polar clustering is the excessive noise of the produced images, with mixing clusters and not well-defined subcellular regions.
Finally, the test performed with 8 clusters (last row of Figure 3) produces redundancy with all metrics, but at different extents. Compared to the 7 clusters attempt, Euclidean and asymmetric metrics introduces a new redundancy in the outer membrane, where an unnecessary division in two regions (green and light green) can be observed. The polar metric, while preserving the lipidic segmentation to two clusters, produces an excessive redundancy in the outer membrane (where 3 clusters are assigned) and consequently a higher degree of noise affects the resulting cell image.
4.4. Further Validation by Analysing LX-2 Cell Upon Treatment
Here we propose a further example of K-means clustering with asymmetric metric, still in the field of cellular spectral analysis. The cell under study is an LX-2 cell after proper treatment with Retinol and Palmitic acid (ROL+PA) [25]. LX-2 cells are human hepatic stellate cells (HSCs). HSCs are usually in a quiescent state, characterized by high expression of lipid droplets (LDs) for storing vitamin A. Upon liver injury, HSCs transdifferentiate towards a so-called active state, characterized by both high fibrogenesis and loss of LDs. In this active state, HSCs are a crucial player in originating and sustaining liver fibrosis. Upon specific treatments, or as the liver injury subsides, active HSCs could be reverted to a quiescent-like state, restoring a high expression of LDs. LX-2 cells are partly active HSCs, and treated with a combination of Retinol and Palmitic acid are reverted to a quiescent-like state.
Figure 5 shows the results achieved by KCA with 6 clusters performed on the Raman hyperspectra recorded over an LX-2 cells after ROL+PA treatment. Euclidean, ecc=0.10 asymmetric, and polar metrics have been used for KCA. As in the former case, by comparing the image obtained for Euclidean and asymmetric metrics, we can notice that subcellular regions are better defined in the case to asymmetric distance. Euclidean metric leads to two subregions in the nuclear area, but with neatly overlapping average spectra (dark cyan and blue curves). Instead, the asymmetric metric correctly assigns a single cluster to the nuclear region, surrounded by a yellow area ascribable to the presence of CytC (mitochondria). The yellow average spectrum obtained with asymmetric metric has a spectral behavior which better resembles the pure CytC spectrum, while yellow curve for Euclidean metric is partly a mixture of CytC and lipid spectra, as denoted by large intensities at 2850 and 2880cm-1. This is likely due to an overlap of yellow cluster with lipid regions. This issue is better solved by asymmetric distance, which introduces a transition region (the magenta cluster in the second row of Figure 5) between LDs and mitochondria.
The last row of the figure shows the results attained by polar metric. We find again a noisy image, as observed above, with some mixing regions in the outer part of the cell where two redundant clusters (green and light green) are assigned. Correctly, a single cluster is assigned to the nuclear region, but its border is rough and irregular. A similar conclusion holds for the CytC area, whose average spectrum is as clean as that of asymmetric distance, but whose shape is fragmented and intermixed with the green clusters.
5. Conclusions
In this study, we demonstrated that the incorporation of an asymmetric metric matrix into K-means clustering significantly enhances the segmentation quality of Raman imaging data from cells. By systematically varying the eccentricity parameter (ecc) we evaluated the impact of this novel distance metric on the clustering performance compared to conventional Euclidean and polar metrics.
Our results indicate that the asymmetric metric provides a more refined and biologically meaningful segmentation of cellular regions, particularly at intermediate values of eccentricity (ecc=0.25 and ecc=0.10). At these settings, the algorithm effectively distinguishes subcellular structures, such as lipidic compartments, mitochondria, and nuclear regions, while minimizing redundant segmentation. Furthermore, this improved segmentation is achieved with a lower number of clusters compared to the Euclidean metric, which requires additional clusters to resolve the same biochemical features. This highlights the efficiency of the asymmetric metric in capturing relevant spectral variations without excessive cluster fragmentation. In contrast, the polar metric, although effective in distinguishing lipid compartments, introduced excessive noise and instability in clustering results.
Moreover, we observed that increasing the number of clusters beyond an optimal threshold does not necessarily improve segmentation accuracy. Instead, excessive clustering introduces redundancy, particularly in lipid-rich regions and the outer membrane. This finding suggests that the choice of both an appropriate distance metric and an optimal cluster number is crucial for obtaining biologically interpretable results in Raman-based cell imaging.
Overall, the implementation of asymmetric metric distances in K-means clustering represents a promising approach for cellular analysis through Raman micro-imaging. By providing a flexible and tunable metric, this method enhances spectral biochemical differentiation while preserving a more regular shape of cellular subregions. Future work may explore the extension of this approach to other spectral imaging techniques and its potential integration with advanced machine learning techniques for automated biochemical characterization of cells. Additionally, further research could investigate the application of asymmetric metrics in other clustering techniques or mathematical frameworks where distance metrics play a critical role, such as hierarchical clustering, graph-based segmentation, or manifold learning.
Author Contributions
Conceptualization, Patrizio Candeloro; Data curation, Bernadette Scopacasa; Formal analysis, Bernadette Scopacasa and Patrizio Candeloro; Investigation, Bernadette Scopacasa and Patrizio Candeloro; Methodology, Bernadette Scopacasa and Patrizio Candeloro; Software, Patrizio Candeloro; Supervision, Patrizio Candeloro; Validation, Bernadette Scopacasa and Patrizio Candeloro; Visualization, Bernadette Scopacasa and Patrizio Candeloro; Writing – original draft, Patrizio Candeloro; Writing – review & editing, Bernadette Scopacasa and Patrizio Candeloro. All authors have read and agreed to the published version of the manuscript.
Funding
This research received no external funding
Institutional Review Board Statement
Not applicable.
Informed Consent Statement
Not applicable.
Data Availability Statement
Dataset available on request from the authors.
Conflicts of Interest
The authors declare no conflicts of interest.
Abbreviations
The following abbreviations are used in this manuscript:
| KCA | K-means clustering analysis |
| 3D | Three dimensional |
| CytC | Cytochrome C |
| HSC | Hepatic stellate cell |
| ROL+PA | Retinol + Palmitic acid |
References
- Palonpon, A.F.; Sodeoka, M.; Fujita, K. Molecular imaging of live cells by Raman microscopy. Curr Opin Chem Biol 2013, 17, 708–715. [Google Scholar] [CrossRef] [PubMed]
- Kallepitis, C.; Bergholt, M.S.; Mazo, M.M.; Leonardo, V.; Skaalure, S.C.; Maynard, S.A.; Stevens, M.M. Quantitative volumetric Raman imaging of three dimensional cell cultures. Nature communications 2017, 8, 14843. [Google Scholar] [PubMed]
- Abramczyk, H.; Brozek-Pluska, B. Raman imaging in biochemical and biomedical applications. Diagnosis and treatment of breast cancer. Chem Rev 2013, 113, 5766–5781. [Google Scholar] [PubMed]
- Krafft, C.; Steiner, G.; Beleites, C.; Salzer, R. Disease recognition by infrared and Raman spectroscopy. Journal of biophotonics 2009, 2, 13–28. [Google Scholar] [PubMed]
- Ren, J.; Mao, S.; Lin, J.; Xu, Y.; Zhu, Q.; Xu, N. Research progress of Raman spectroscopy and Raman imaging in pharmaceutical analysis. Curr Pharm Des 2022, 28, 1445–1456. [Google Scholar] [PubMed]
- El-Mashtoly, S.F.; Petersen, D.; Yosef, H.K.; Mosig, A.; Reinacher-Schick, A.; Kötting, C.; Gerwert, K. Label-free imaging of drug distribution and metabolism in colon cancer cells by Raman microscopy. Analyst 2014, 139, 1155–1161. [Google Scholar] [PubMed]
- Sun, X.; Sajda, P. Circular Clustering With Polar Coordinate Reconstruction. IEEE/ACM transactions on computational biology and bioinformatics.
- Li, C.; Ding, S.; Xu, X.; Du, S.; Shi, T. Fast density peaks clustering algorithm in polar coordinate system. Appl Intell 2022, 52, 14478–14490. [Google Scholar]
- Neghina, M.; Rasche, C.; Ciuc, M.; Sultana, A.; Tiganesteanu, C. Automatic detection of cervical cells in Pap-smear images using polar transform and k-means segmentation, 2016 Sixth International Conference on Image Processing Theory, Tools and Applications (IPTA), IEEE: 2016;, pp. 1–6.
- Xu, L.; Chow, T.W.; Ma, E.W. Topology-based clustering using polar self-organizing map. IEEE Transactions on Neural Networks and Learning Systems 2014, 26, 798–808. [Google Scholar]
- Olszewski, D. Asymmetric k-Means clustering of the asymmetric self-organizing map. Neural Process Letters 2016, 43, 231–253. [Google Scholar]
- Hanwell, D.; Mirmehdi, M. QUAC: Quick unsupervised anisotropic clustering. Pattern Recognit 2014, 47, 427–440. [Google Scholar] [CrossRef]
- Olszewski, D. Asymmetric k-means algorithm, Adaptive and Natural Computing Algorithms: 10th International Conference, ICANNGA 2011, Ljubljana, Slovenia, -16, 2011, Proceedings, Part II 10, Springer: 2011;, pp. 1–10. 14 April.
- Olszewski, D. K-means clustering of asymmetric data, Hybrid Artificial Intelligent Systems: 7th International Conference, HAIS 2012, Salamanca, Spain, -30th, 2012. Proceedings, Part I 7, Springer: 2012;, pp. 243–254. 28 March.
- Candeloro, P.; Grande, E.; Raimondo, R.; Di Mascolo, D.; Gentile, F.; Coluccio, M.L.; Perozziello, G.; Malara, N.; Francardi, M.; Di Fabrizio, E. Raman database of amino acids solutions: A critical study of Extended Multiplicative Signal Correction. Analyst 2013, 138, 7331–7340. [Google Scholar] [CrossRef] [PubMed]
- Aguilera, A.; Pérez-Aguila, R. General n-dimensional rotations, WSCG '2004: Short Communications: the 12-th International Conference in Central Europe on Computer Graphics, Visualization and Computer Vision 2004, 2.-6. 04 Plzeň, p. 1-8. Václav Skala-UNION Agency: 2004; 20 February.
- Krafft, C.; Knetschke, T.; Funk, R.H.; Salzer, R. Identification of organelles and vesicles in single cells by Raman microspectroscopic mapping. Vibrational spectroscopy 2005, 38, 85–93. [Google Scholar] [CrossRef]
- Czamara, K.; Majzner, K.; Pacia, M.Z.; Kochan, K.; Kaczor, A.; Baranska, e.M. Raman spectroscopy of lipids: a review. J Raman Spectrosc 2015, 46, 4–20. [Google Scholar]
- Wu, H.; Volponi, J.V.; Oliver, A.E.; Parikh, A.N.; Simmons, B.A.; Singh, S. In vivo lipidomics using single-cell Raman spectroscopy. Proceedings of the National Academy of Sciences 2011, 108, 3809–3814. [Google Scholar]
- Parrotta, E.; De Angelis, M.T.; Scalise, S.; Candeloro, P.; Santamaria, G.; Paonessa, M.; Coluccio, M.L.; Perozziello, G.; De Vitis, S.; Sgura, A. Two sides of the same coin? Unraveling subtle differences between human embryonic and induced pluripotent stem cells by Raman spectroscopy. Stem cell research & therapy.
- Johannessen, C.; White, P.C.; Abdali, S. Resonance Raman optical activity and surface enhanced resonance Raman optical activity analysis of cytochrome c. The Journal of Physical Chemistry A 2007, 111, 7771–7776. [Google Scholar] [PubMed]
- Read, D.S.; Woodcock, D.J.; Strachan, N.J.; Forbes, K.J.; Colles, F.M.; Maiden, M.C.; Clifton-Hadley, F.; Ridley, A.; Vidal, A.; Rodgers, J. Evidence for phenotypic plasticity among multihost Campylobacter jejuni and C. coli lineages, obtained using ribosomal multilocus sequence typing and Raman spectroscopy. Appl Environ Microbiol.
- van Manen, H.; Kraan, Y.M.; Roos, D.; Otto, C. Single-cell Raman and fluorescence microscopy reveal the association of lipid bodies with phagosomes in leukocytes. Proceedings of the National Academy of Sciences 2005, 102, 10159–10164. [Google Scholar]
- Krafft, C.; Knetschke, T.; Siegner, A.; Funk, R.H.; Salzer, R. Mapping of single cells by near infrared Raman microspectroscopy. Vibrational Spectroscopy 2003, 32, 75–83. [Google Scholar] [CrossRef]
- Valentino, G.; Zivko, C.; Weber, F.; Brülisauer, L.; Luciani, P. Synergy of phospholipid—Drug formulations significantly deactivates profibrogenic human hepatic stellate cells. Pharmaceutics 2019, 11, 676. [Google Scholar] [CrossRef] [PubMed]
Figure 1.
Spectrum similarities and dissimilarities. (A) The red curve represents a typical Raman spectrum recorded on cells, while the black curve corresponds to the same spectrum scaled by a factor c > 1. These spectra convey identical chemical information. (B) Representing the spectra as vectors in 3D space, r₀ and r₁ share the same direction, while r₂ deviates, indicating different chemical composition. This highlights that spectra aligned in the same direction should have smaller distances compared to those that are not aligned.
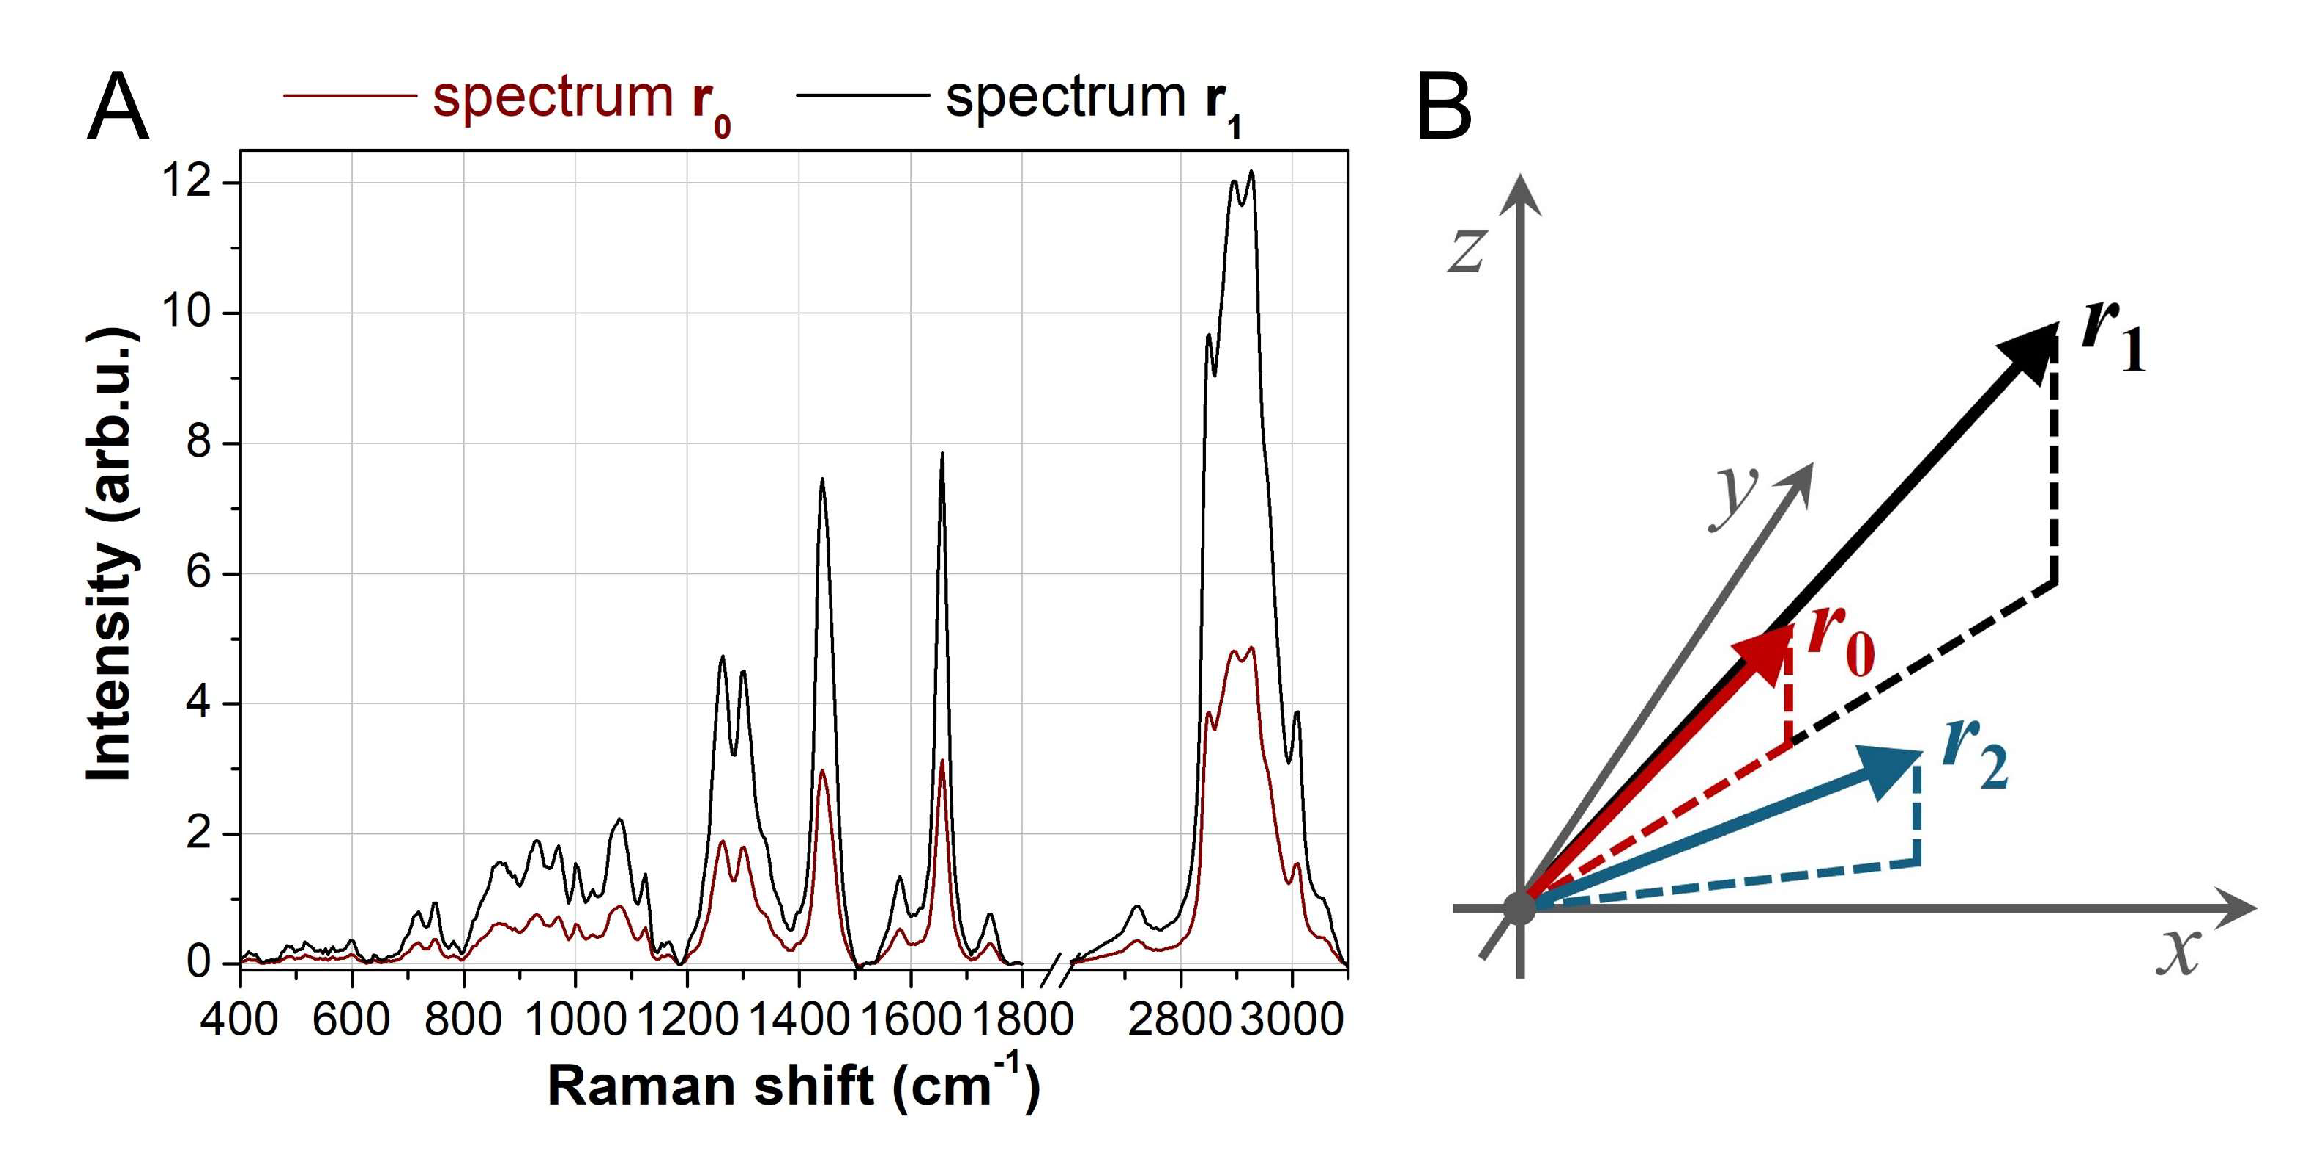
Figure 2.
Isodistance surfaces calculated using an asymmetric metric matrix for different values of the eccentricity parameter ecc. The red circle indicates the point r₀, starting from which distances are computed. (A) Isotropic Euclidean distance corresponding to ecc=1.00. (B-D) Anisotropic distances with ecc=0.50, 0.25, and 0.10, respectively.
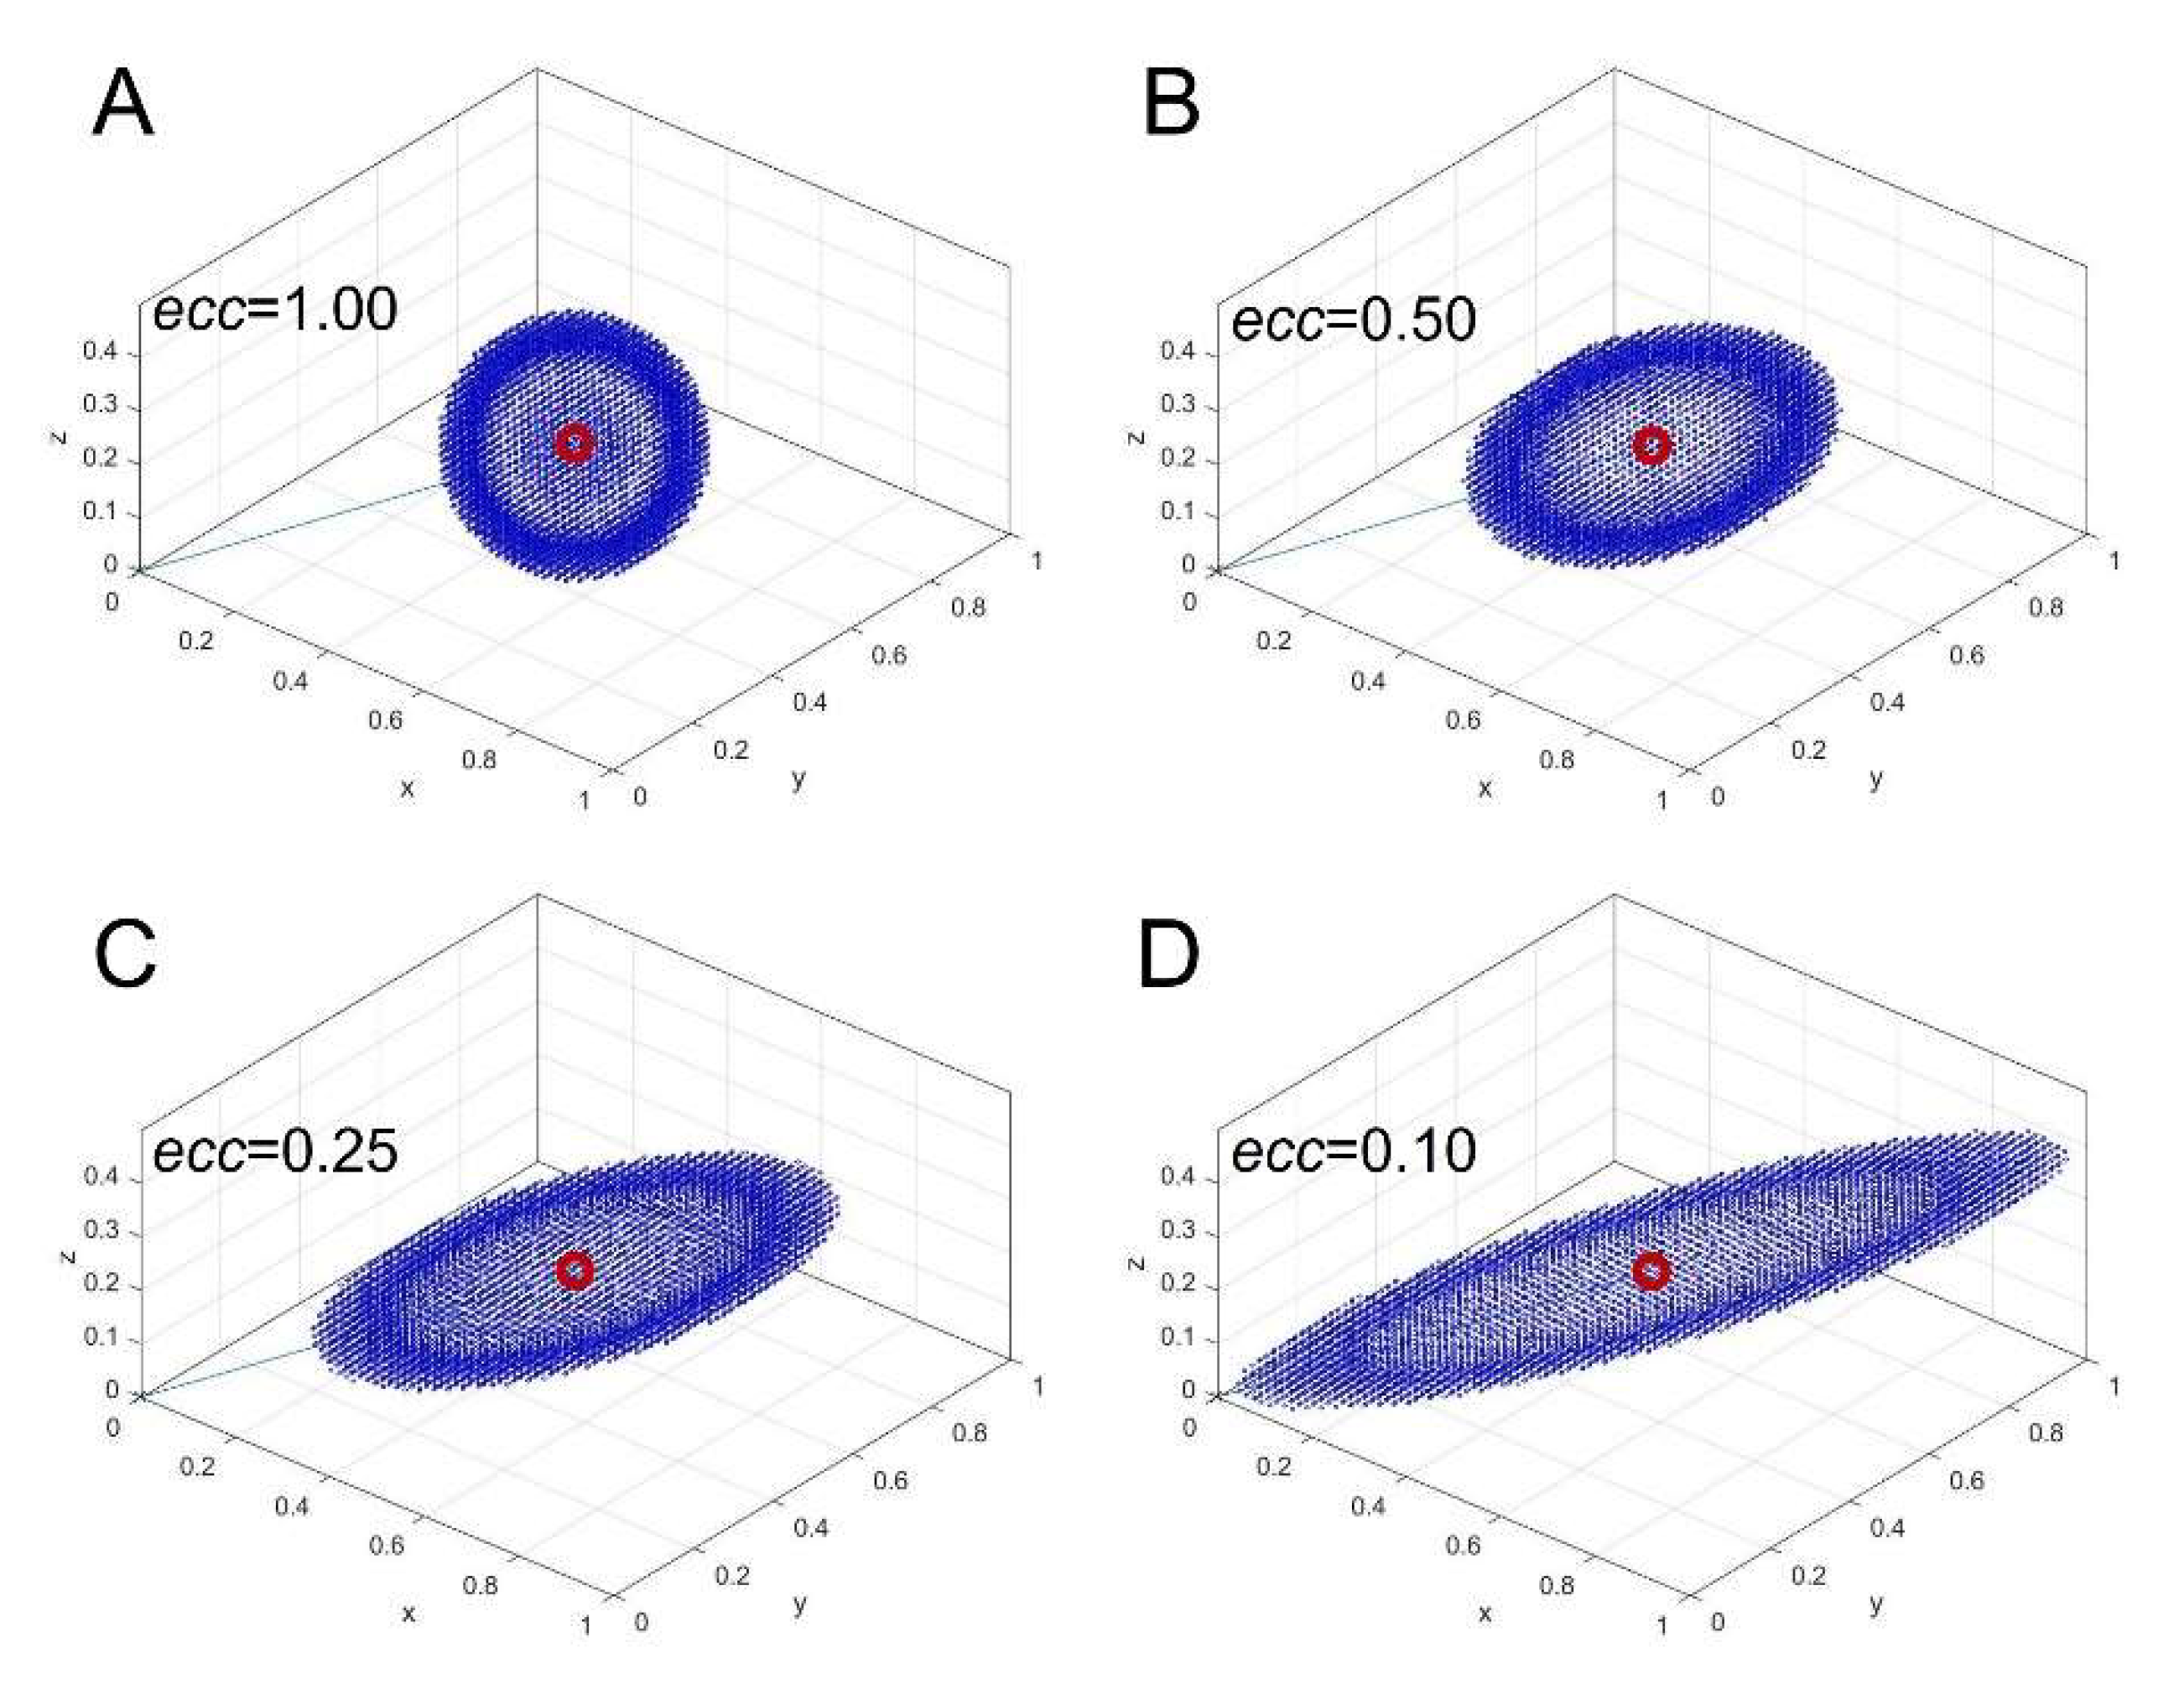
Figure 3.
Evaluation of KCA using asymmetric metric distances on a Raman dataset acquired from a HepG2 cell. Different numbers of clusters (6, 7, and 8) and various distance metrics were tested. The first row presents images computed with 6 clusters using the Euclidean metric (first column), asymmetric metrics with eccentricities of 0.50 (second column), 0.25 (third column), and 0.10 (fourth column), as well as the polar metric (fifth column). The second and third rows display the corresponding images obtained with 7 and 8 clusters, respectively. The scale bar (black line in the first image) represents 10 µm for all images. .
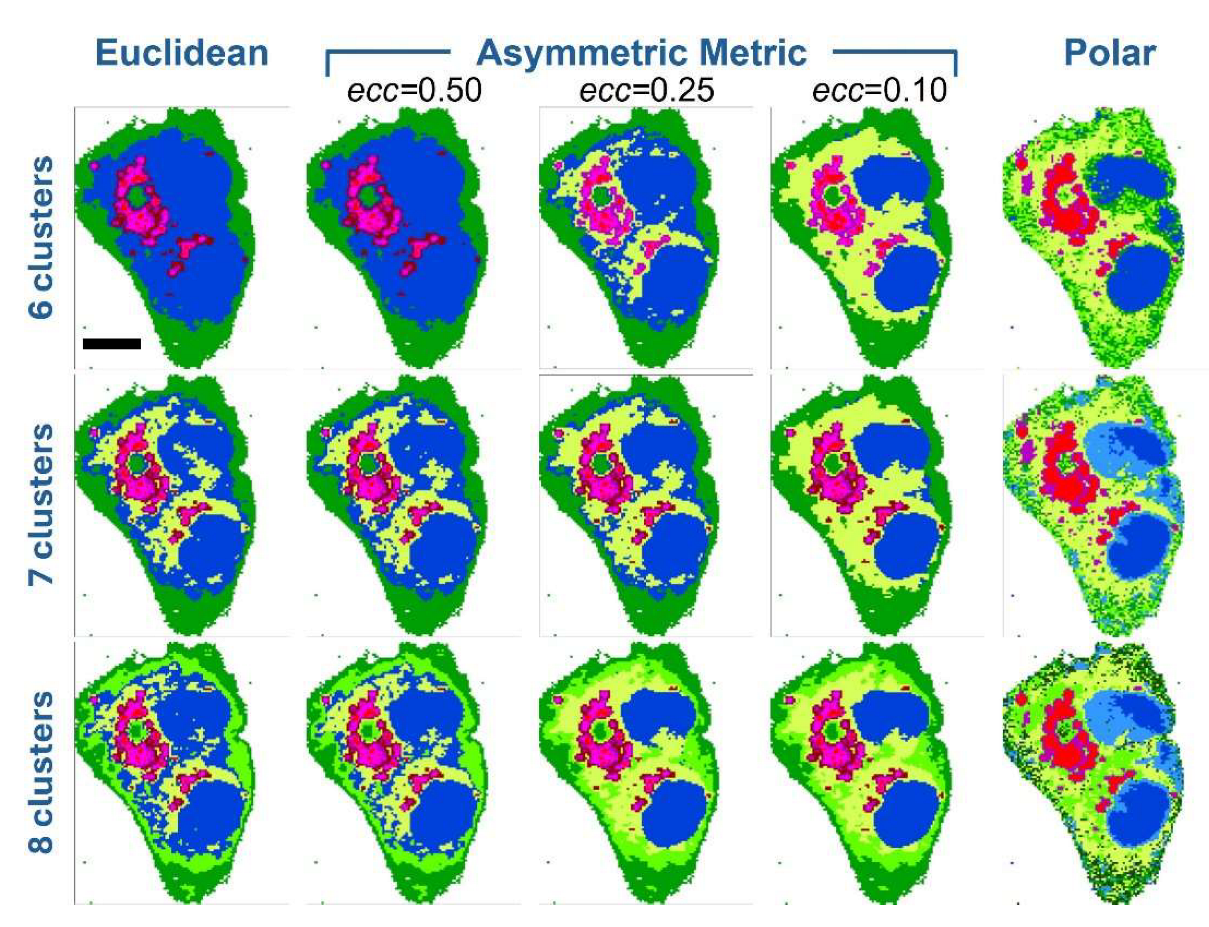
Figure 4.
Average spectra for the seven-cluster segmentation. The spectra on the left correspond to lipid-associated clusters, while those on the right are assigned to mitochondria (yellow), nuclei (blue), and the outer membrane (green). The average spectra are displayed for three different metrics: Euclidean (first row), asymmetric with ecc=0.10 (second row), and polar (third row). The clustering images in each row correspond to those in Figure 3 and are included here for reference.
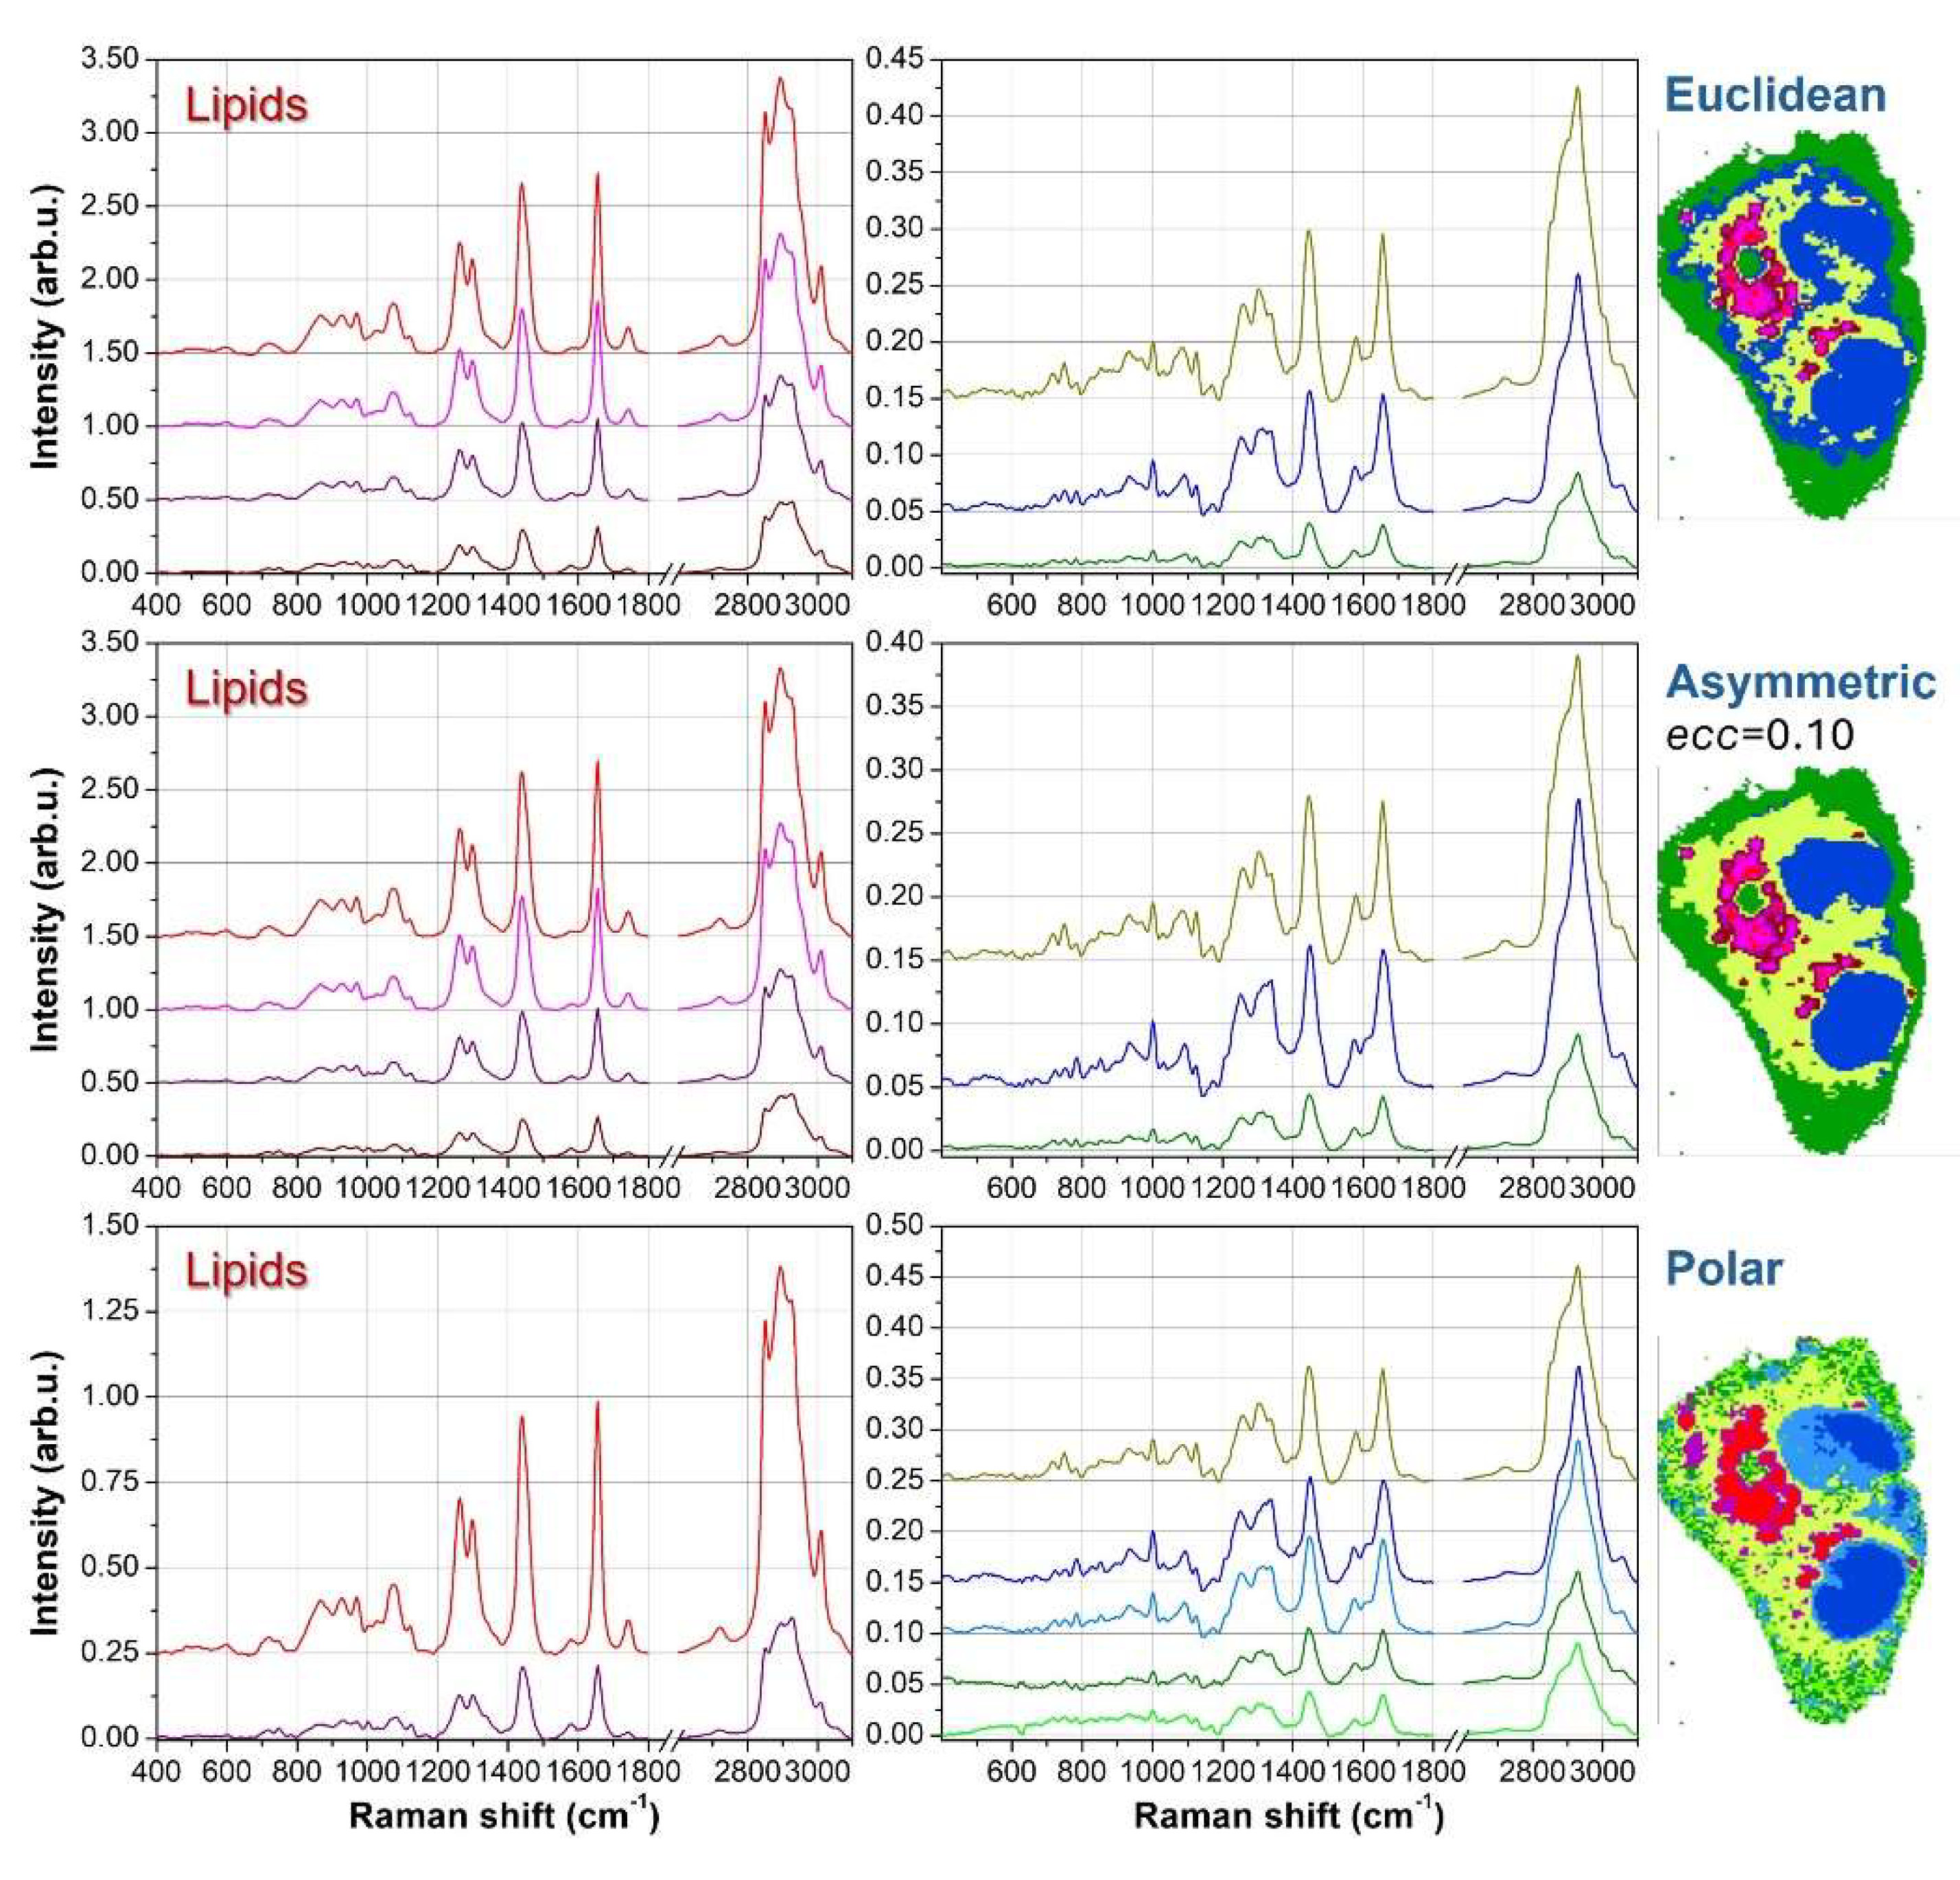
Figure 5.
K-means clustering analysis of an LX-2 cell after treatment with Retinol and Palmitic acid. Euclidean (top row), ecc=0.10 asymmetric (middle row) and polar (bottom row) metrics are used with KCA. For each metric, image segmentation is presented along with cluster average spectra. The scale bar (black line in the top image) is 10 μm.
Disclaimer/Publisher’s Note: The statements, opinions and data contained in all publications are solely those of the individual author(s) and contributor(s) and not of MDPI and/or the editor(s). MDPI and/or the editor(s) disclaim responsibility for any injury to people or property resulting from any ideas, methods, instructions or products referred to in the content. |
© 2025 by the authors. Licensee MDPI, Basel, Switzerland. This article is an open access article distributed under the terms and conditions of the Creative Commons Attribution (CC BY) license (http://creativecommons.org/licenses/by/4.0/).
Copyright: This open access article is published under a Creative Commons CC BY 4.0 license, which permit the free download, distribution, and reuse, provided that the author and preprint are cited in any reuse.


