
Submitted:
07 March 2025
Posted:
07 March 2025
You are already at the latest version
Abstract
This study examines factors affecting the thermal expansion behavior of continuous welded rails (CWRs) in urban rail systems and investigates conditions that lead to rail weld fractures. Parameters affecting CWR fractures near ventilation shafts in urban rail systems are identified through field investigations and machine learning analysis. Further, a computational fluid dynamics analysis is employed to evaluate the range of temperature variation around tunnel ventilation shafts that affects the CWR fractures. Load conditions that incorporate temperature variations are applied using a validated numerical model to analyze changes in the axial force on the CWRs. The results confirm that increased localized temperature fluctuations around tunnel ventilation shafts lead to a higher frequency of CWR fractures.
Keywords:
thermal expansion behavior
; continuous welded rails
; urban rail systems
; rail weld fractures
; temperature variation
; CWR fractures
1. Introduction
The increasing occurrence of damage and fractures in continuous welded rails (CWRs) in urban rail systems can be attributed to the characteristics of urban rail systems such as the frequent operation of trains, cumulative tonnage, and environmental factors including climate change. Fractures in CWRs that directly affect operational safety can be classified as a risk factor with an unpredictable occurrence [1]. Risks associated with CWR fractures can range from minor disruptions such as simple signal failures to major defects that can cause train delays and derailments. Previous studies and analyses of CWR fracture occurrences have indicated that fractures most frequently occur in surface ventilation shaft sections, which are directly affected by seasonal temperature variations among various factor-specific correlations. The thermal expansion and contraction of CWRs attributed to temperature fluctuations in winter and summer result in concentrated axial forces, which lead to fractures at vulnerable welded joints. However, most existing studies on winter-specific localized CWR fractures focused on qualitative trends and correlations based on cumulative fracture data. Therefore, research on the quantitative impact of temperature variations on CWR fractures remains lacking.
Jung [1] analyzed statistical data on mainline rail defects in South Korea from 1995–2014 in a study on correlations between factors affecting rail defects in urban rail concrete tracks and mitigation measures. They identified correlations between different rail defect factors and proposed mitigation strategies. Seasonal rail defects were found to be affected by temperature fluctuations and seasonal temperature differences. Significant temperature-related effects were observed in locations where the installation and fracture temperatures differed by more than 10 °C and in areas where temperature variations were severe, such as within 100 m of the ventilation shafts. Nam [2] analyzed the causes of rail damage in Seoul Metro by examining track infrastructure (Lines 1–4) and ten years of rail damage data and categorizing the causes into nine major factors. Analyzing the causes of rail damages, particularly rail fractures near ventilation shafts and those caused by temperature variations, confirmed that brittle fractures occur because of rapid drops in temperature. In underground urban railway systems, rail fractures occurred within 200 m of the ventilation shafts. Bong [3] conducted a statistical analysis of key factors affecting CWR fractures in a study on the causes of CWR fractures in the Seoul urban rail system. The correlation analysis of CWR fracture factors and proposed countermeasures emphasized quality control in rail welding and defect management. Lee [4] estimated the natural ventilation volume generated by train-induced wind in subway tunnels to quantify the magnitude of train-induced airflow (e.g., air displacement) when a train travels through a tunnel. To this end, they performed field measurements in tunnel tracks and natural ventilation shafts, and conducted a numerical analysis to compare, analyze, and validate the measurement results. Their study confirmed the characteristics of airflow movement inside tunnels and natural ventilation shafts caused by train entry and exit. Further, Song [5] investigated the effect of train-induced wind on ventilation in subway tunnels and station environments, focusing on minimizing airflow disturbances during train entry and exit at platforms. They estimated the train-induced airflow through field measurements and employed computational fluid dynamics (CFD) analysis to verify train-induced airflow variations. Their study examined the effects of train-induced wind on station and tunnel ventilation using numerical analysis and scaled models. Zheng et al. [6] conducted an experimental study on the effects of particle shape and size on ballast degradation. They conducted experiments using both single particles and uniform aggregates, considering both size and shape factors. Their findings revealed the effect of particle shape and size on railway ballast degradation. Zhu et al. [7] investigated the effects of vibration and thermal fatigue cracking on railway vehicle brake discs, and Xu et al. [8] reviewed studies focused on rail corrosion, including corrosion types, protection methods, and detection technologies.
These studies primarily conducted statistical analyses of CWR fracture occurrences over specific periods to identify correlations between factors and propose mitigation strategies. Further, prior research related to CFD focused on estimating natural ventilation volumes in urban rail tunnels and quantifying airflow changes attributed to train entry and exit at platforms. However, research on the effects of temperature variations on CWR fractures is lacking.
This study analyzes the causes of CWR fractures in urban railway systems, identifies factors that affect the thermal expansion behavior of CWRs, and determines the extent of the impact of a fracture for analyzing the primary causes of CWR fractures. In addition, the effects of winter-season temperature variations around ventilation shafts on CWR are also analyzed.
2. Materials and Methods
2.1. Overview
One study focused on the background of CWR implementation in the Seoul urban rail system, status of track improvement projects, and the cumulative tonnage passing through the tracks. Figure 1 illustrates the installation status of a subway CWR.
Standard-length rails were used when Seoul Metro Line 1 opened on August 15, 1974. However, in 1995, CWRs were introduced as part of a track improvement project to address the aging infrastructure. The first implementation of CWR in the Seoul urban rail system began with the construction of Line 2. Subsequently, ~60% of all track sections were built using CWR on Lines 3 and 4. Among the total 277 km of the mainline track across Seoul Metro Lines 1–4, 42% (120.3 km) included curved sections, with 65% (78.5 km) having a sharp curvature radius of 600 m or less (R ≤ 600 m).
Table 1 lists the cumulative rail tonnage, which indicates that the annual cumulative tonnage for Seoul Metro Lines 1–8 reached a maximum of 37 million tons (with an average of 24 million tons), indicating a high frequency of train operations.
2.2. Rail Fracture Status
2.2.1. CWR Welding and Fracture Status
As indicated in Table 2, gas pressure welding accounts for the largest proportion of rail welding methods used in major rail replacement projects conducted in 2015. Gas pressure welding (18.6%) was applied during on-site rail welding for track extension to ensure weld strength and quality.
Figure 2 indicates that 74% of rail fractures occurred between October and February, when temperature drops resulted in significant temperature differences.
The CWR fractures were caused by an increase in axial force during extreme cold periods with significant temperature variations. Most CWR fractures occurred near ventilation shafts and U-type sections, and the recorded temperatures at the time of rail fractures ranged from −3.4–−13 °C. A case study on CWR fractures in urban rail systems revealed that ensuring weld strength and quality was challenging when two rail segments of 80–160 m or more were welded on-site using gas pressure welding during transportation and track extension.
2.2.2. Effect of Tunnel Temperature Variations on Urban Rail CWR
Nighttime temperature measurements conducted from 2011–2018 in urban rail tunnels revealed the optimal median temperature to be 13 °C. Table 3 presents temperature measurements taken in tunnel sections of South Korea’s urban rail Lines 5–8.
Analysis of the temperature variations in tunnels when CWR fractures occur revealed that underestimating temperature differences (△t) in underground sections increased localized temperature fluctuations, thereby resulting in a higher frequency of rail fractures. Figure 3 shows the trend of CWR fracture occurrences in 2023, which reveals that most fractures occurred in winter (November–February) at locations where on-site welding was conducted near ventilation shafts. Thus, temperature fluctuations between day and night, combined with underground temperature changes near ventilation shafts, caused stress and axial force variations in the rail welds, leading to fractures. In 2023, at least 13 rail fractures were recorded when temperature fluctuations were more extreme. These findings highlight the need for a reassessment considering tunnel temperature variations and the effect of ventilation shafts.
3. Analysis of CWR Fracture Parameters Near Ventilation Shafts Using Machine Learning
3.1. Overview
This study identifies parameters influencing CWR weld fractures caused by temperature variations attributed to the inflow of cold external air into underground tunnel ventilation shafts and analyzes correlations between these parameters. Field measurement data and records of 84 CWR fracture cases from 1999–2023 were used as the foundational dataset. A total of 27 parameters, which include ambient temperature differences (△t) and curve radius, were collected and applied as independent variables for the machine learning analysis. Supervised machine learning techniques were employed for analyzing correlations between parameters affecting CWR weld fractures near ventilation shafts. Further, regression analysis was performed on classified training data for a quantitative analysis of correlations. The Pandas library, a data manipulation and analysis tool for Python, was used for the machine learning analysis. In addition, Matplotlib, a plotting library utilizing Python and the NumPy mathematical extension, was used for visualization.
3.2. Analysis of Parameter Influence Factors
3.2.1. Classification of Training Datasets
Field investigations of rail fractures near ventilation shafts in urban rail systems were conducted to collect data on minimum and maximum temperatures, temperature variations over time (△t), curve radius, season, track inclination, rail upper/lower, inner/outer, fracture locations, and distance from ventilation shafts. The compiled parameters were classified into independent and dependent variables, as indicated in Table 4. The training dataset for the machine learning analysis was constructed based on CWR fracture cases near ventilation shafts, as indicated in Table 5.
3.2.2. Machine Learning Analysis Using All Parameters
Multicollinearity among the independent variables listed in Table 4 and Table 5 was analyzed, and the heatmap illustrating the correlations is shown in Figure 4. The scatter plot showing correlations between parameters based on the full training dataset is presented in Figure 5.
The heatmap and scatter plot analysis shown in Figure 4 and Figure 5 reveal ambient temperature (minimum, maximum, △t), curve radius, rail type, track structure, ventilation shaft position, inclination, fracture location, welding method, ventilation function, and airflow volume as the primary factors influencing rail fractures near ventilation shafts.
Machine learning analysis using the full training dataset revealed that the R2
value was 1, indicating extremely high accuracy, as shown in Figure 6. Variables with high multicollinearity were excluded from the analysis. After identifying variables without significant multicollinearity, the variance inflation factor (VIF) was recalculated, and eight additional variables with low correlations were removed.
3.2.3. Machine Learning Analysis using Proposed Parameters
Figure 7 shows the correlation heatmap based on the final training dataset, which includes newly selected independent variables. Correlations between influencing factors were analyzed as shown in Figure 8. All learning factors were included to verify the adequacy of multicollinearity, and VIF was analyzed based on independent variables (parameters). The results are shown in Figure 9.
As shown in Figure 7 and Figure 8, the heatmap and scatter plot analysis indicate that rail fractures near ventilation shafts are highly correlated with temperature variations, particularly ambient temperature (minimum, maximum) and the distance from the ventilation shaft to the fracture location. In addition, track geometry conditions, including curve radius and inclination, were found to have a strong correlation with rail fractures. Machine learning analysis using the proposed training dataset revealed that the R2 value was 1, indicating extremely high accuracy, as shown in Figure 9. The VIF was analyzed based on variables with strong correlations and without multicollinearity; the results are summarized in Table 6.
4. Numerical Analysis
4.1. Overview
The findings from the analysis of CWR fractures and machine learning-based parameter evaluation indicated that the primary causes of CWR weld fractures were temperature fluctuations and the distance between the fracture location and ventilation shaft. Numerical analysis was conducted based on the data from Section 2 and Section 3 to assess the range of temperature variation around ventilation shafts that affect CWR fractures in tunnels.
To this end, finite element analysis (FEA) was performed using Ansys Workbench (Ver. 2023 R1) [9], employing both CFD and structural analysis techniques. The numerical model of the ventilation shaft is illustrated in Figure 10. Boundary conditions for the ventilation shaft were defined by setting temperature as a load condition at the inlet section; these boundary conditions are presented in Figure 11.
Figure 12 shows that temperature variations recorded during CWR fractures were applied as thermal load conditions in the CFD analysis. The maximum temperature variation (Δt) was determined using a Gaussian probability density function and set as a load condition.
The wind speed generated by passing trains, as measured at the ventilation shaft, was applied. The wind speed during train operation, along with airflow from the ventilation system, was incorporated into the numerical analysis as a load condition. These conditions are summarized in Table 7.
4.2. Analysis Results
The numerical analysis results showed that the temperature influence range on track structures extended within ±10 m from the center of the ventilation shaft, which was consistent with field survey findings. The temperature influence range on track structures, considering temperature and fluid flow conditions inside the ventilation shaft, is illustrated in Figure 13.
The analysis of the temperature influence range near ventilation shafts using CFD showed that temperature variations within the upper and lower tunnel tracks were most pronounced within a 40 m distance from the ventilation shaft, which is consistent with field survey results and machine learning analysis. In addition, the area where cold air from outside was most retained was within 20 m of the ventilation shaft.
4.3. Axial Force Analysis of CWR Fractures Using FEA
The temperature variation range that affects CWR fractures was evaluated based on the machine learning analysis that incorporated field survey data (△t during CWR fractures). The simulation of the CWR welded joint was conducted using a nonlinear boundary spring model with axial tensile force for analyzing rail axial force.
4.3.1. Numerical Analysis Modeling
Displacement boundary elements were set to allow the axial expansion and contraction of the rail, whereas the welded joints between rails were modeled using nonlinear boundary spring elements with axial tensile force. Figure 14 shows that spring elements were set with boundary conditions that considered stiffness, assuming rail fracture occurred when the displacement exceeded 0.05 mm. Further, as shown in Figure 15, the load conditions were set based on axial force variations because of temperature changes.
4.3.2. CWR Axial Force Analysis Results
The displacement of the welded joint caused by rail axial force was analyzed using temperature influence ranges derived from CFD analysis, as shown in Figure 16.
The numerical analysis results are shown in Figure 17. The fracture was simulated by considering relative displacement differences, and a clearance of ~0.08 mm was observed, indicating that the rail had fractured.
As illustrated in Figure 18, numerical analysis results considering rail axial force caused by temperature variations showed that a rail displacement of ~0.05 mm occurred at the welded joint when an axial force of about 535 kN was applied.
The welded rails are highly sensitive to temperature variations. Increased axial force in the rail can lead to fractures if temperature management is inadequate near ventilation shafts. Therefore, proper temperature management at tunnel ventilation shafts is crucial for the maintenance and safety of CWRs [10].
5. Analysis and Discussion
5.1. Correlation Analysis Between CWR Fractures and Parameter Analysis
This study identified parameters affecting CWR weld fractures caused by temperature variations around tunnel ventilation shafts and analyzed correlations between these variables. The analysis of tunnel temperature variations during CWR fractures indicated that the temperature difference (△t) in underground sections was underestimated. Further, increased localized temperature fluctuations near tunnel ventilation shafts led to a considerably higher frequency of CWR fractures. Temperature variations during CWR fractures predominantly occurred around 35 °C, reaching a maximum value of 50 °C. The average temperature variation (Δt) was calculated using a Gaussian probability density function and applied as a load condition for analysis and numerical simulations [10].
The analysis of CWR fracture occurrences showed that more than 40% (20 cases) occurred within 0–20 m (40 m) of the ventilation shaft center. In addition, fractures were concentrated within ±10 m (20 m) of the ventilation shaft, with the frequency increasing with a decrease in the distance from the ventilation shaft. Field investigations and machine learning analysis indicated a strong correlation between temperature variations and distance from ventilation shafts.
This study used machine learning to analyze the correlation and priority ranking of parameters affecting CWR fractures near ventilation shafts. Machine learning analysis using the final set of parameters yielded results consistent with the actual CWR fracture data, particularly regarding temperature variations and distance from ventilation shafts to the CWR fracture when CWR fractures occurred. The most influential independent variables were temperature variations (minimum, maximum, Δt), distance from the ventilation shaft in the longitudinal direction (x-direction, train length direction), and track geometry conditions (curve radius, inclination).
5.2. Analysis of Temperature Variation Influence Range Near Ventilation Shafts
A CFD analysis was conducted to determine the temperature variation range around tunnel ventilation shafts that affects CWR fractures. Wind speed was found to have a minimal effect on the temperature variation range in tunnels. The temperature variation influence on track structures was observed within ±10 m (20 m) from the ventilation shaft center. The maximum influence range extended up to ±20 m (40 m), aligning with field investigation results. The temperature variation influence range around ventilation shafts is illustrated in Figure 19.
5.3. Analysis of Axial Force During CWR Fractures Caused by Temperature Variations
The axial force analysis of CWR fractures caused by temperature variations was conducted by examining rail fracture displacement under axial load and rail temperature changes attributed to axial stress. A numerical simulation was performed to model CWR fractures under maximum temperature variation (maximum load). At a maximum load of 1,192 kN, a relative displacement difference (left/right) of 0.346–0.429 mm occurred, resulting in a clearance of ~0.08 mm at the fractured CWR. Relative displacement differences among the four fracture points remained relatively uniform with temperature variations, which indicate that fractures occurred perpendicular to the rail cross-section. The analysis results closely resembled actual CWR weld fractures observed near ventilation shafts, as indicated in Figure 20.
The displacement analysis of CWR fractures under axial load considered relative displacement differences, and the results indicate that at ~535 kN of axial load, the rail weld experienced a displacement of ~0.05mm, leading to fracture. The numerical analysis confirmed that thermal expansion and contraction caused by temperature variations cause minor deformations in rails, which can exceed material strength limits and result in CWR weld fractures. The analysis results of rail axial force and weld displacement under temperature variations are shown in Figure 21.
The correlation between axial stress and rail temperature variations showed that axial stress at the CWR weld fracture point was ~71 MPa, which was ~23% lower than the additional axial stress threshold (92 MPa) for the CWR base material. This implies that CWR fractures can occur at stress levels lower than that at the standard axial stress limit. In actual field conditions, rail installation status, welding quality, and fastening conditions can directly affect CWR weld fractures. The analysis results of temperature variations leading to CWR weld fractures and corresponding axial stresses are shown in Figure 22.
The analysis demonstrated that CWR weld fractures can occur at temperature variations of ~25 °C in locations with large localized temperature fluctuations, such as near ventilation shafts. This finding is consistent with field investigation results on rail fractures.
6. Conclusion
This study analyzed rail fracture data based on the status of urban rail track infrastructure, applied machine learning, and conducted CFD analysis to investigate the track installation conditions contributing to rail fractures near ventilation shafts. Key parameters influencing CWR weld fractures were identified, and the temperature influence range from ventilation shafts was analyzed. In addition, a validated numerical analysis model incorporating temperature variation as a load condition was used for analyzing axial force during CWR fractures. The CWR fractures predominantly occurred in winter, from October to March, and the tunnel temperature analysis determined the optimal median temperature for urban rail systems to be 13 °C. Gaussian probability density analysis showed that the rapid increase in CWR axial tensile force could lead to weld fractures when temperatures dropped sharply by 35°C in extreme cold conditions near ventilation shafts.
Machine learning analysis of parameters influencing CWR weld fractures near urban rail ventilation shafts confirmed that the model appropriately reflected actual CWR fracture site conditions, verifying the validity of the machine learning model. The final key parameters (temperature variation at fracture occurrence, distance from ventilation shaft, track geometry conditions, etc.) were identified and used in CFD and FEA. The CFD analysis results showed that temperature influence on the track structure was most significant within ±10 m (20 m) of the ventilation shaft center. The maximum influence range extended up to ± 20 m (40 m), aligning with field investigation findings. The axial force analysis of rail fractures caused by temperature variations around urban rail ventilation shafts indicated that axial stress at the CWR weld fracture point was ~71 MPa, which is 23% lower than the CWR base material threshold (92 MPa).
Author Contributions
Conceptualization, J.Y. and J.S.; methodology, S.Y.; formal analysis, J.Y. and S.H.; investigation, S.Y. and J.S.; data curation, S.Y. and S.H; writing—original draft preparation, J.Y. and S.H.; writing—review and editing, S.H.
Funding
This research received no external funding.
Institutional Review Board Statement
Not applicable.
Informed Consent Statement
Not applicable.
Data Availability Statement
Not applicable.
Conflicts of Interest
The authors declare no conflicts of interest.
References
- Jung, C.M. A study on influencing factors of urban railway concrete ballast rail defect and its reduction measures. Master Thesis, Seoul National University of Science and Technology, Seoul, 2015 February.
- Nam, J.G. The influence factors of rail damage in Seoul Metro Lines. Master Thesis, Seoul National University of Science and Technology, Seoul, 2015 February.
- Bong, J.K. A study on analyze the cause of Seoul urban railway continuous welded rail broken. Master Thesis, Dong-yang University, Yeongju-si, 2018 August.
- Lee, K.B. A study on the estimation of natural ventilation by train-induced wind in a subway tunnel. Master Thesis, University of Seoul, Seoul, 2010 August.
- Song, J.H. A study on train-induced wind control and its influence on the ventilation in subway tunnel and station environments. Ph.D. dissertation, University of Incheon, Incheon, 2012 February.
- Zheng, S.; Liu, Y.; Zhang, N.; Li, X.; Gao, L. Experimental studies on shape and size effects on particle breakage of railway ballast. Transportation Geotechnics 2022, 37, 100883. [CrossRef]
- Zhu,H.; Lian,S.; Jin, M.; Wang, Y.; Yang, S.; Lu, Q.; Tao, Z.; Xiao, Q. Review of research on the influence of vibration and thermal fatigue crack of brake disc on rail vehicles. Engineering Failure Analysis 2023, 153, 107603. [CrossRef]
- Xu, W.; Zhang, B.; Deng, Y.; Wang, Z.; Jiang, Q.; Yang, L. Zhang, J. Corrosion of rail tracks and their protection. Corros. Rev. 2021, 39(1), 1-13. [CrossRef]
- Ansys Inc. ANSYS® 2007 ANSYS Workbench 2023 R1; ANSYS Inc.; Cannonsberg, PA, USA, 2023.
- Park, S.Y. Evaluation of fracture of continuous welded rails according to temperature changes around urban railway ventilations. Ph.D. dissertation, , Dong-yang University, Yeongju-si, 2025 February.
Figure 1.
Installation status of subway CWR: (a) rail continuous welding; (b) area around underground ventilation shafts; (c) CWR weld fracture.
Figure 1.
Installation status of subway CWR: (a) rail continuous welding; (b) area around underground ventilation shafts; (c) CWR weld fracture.
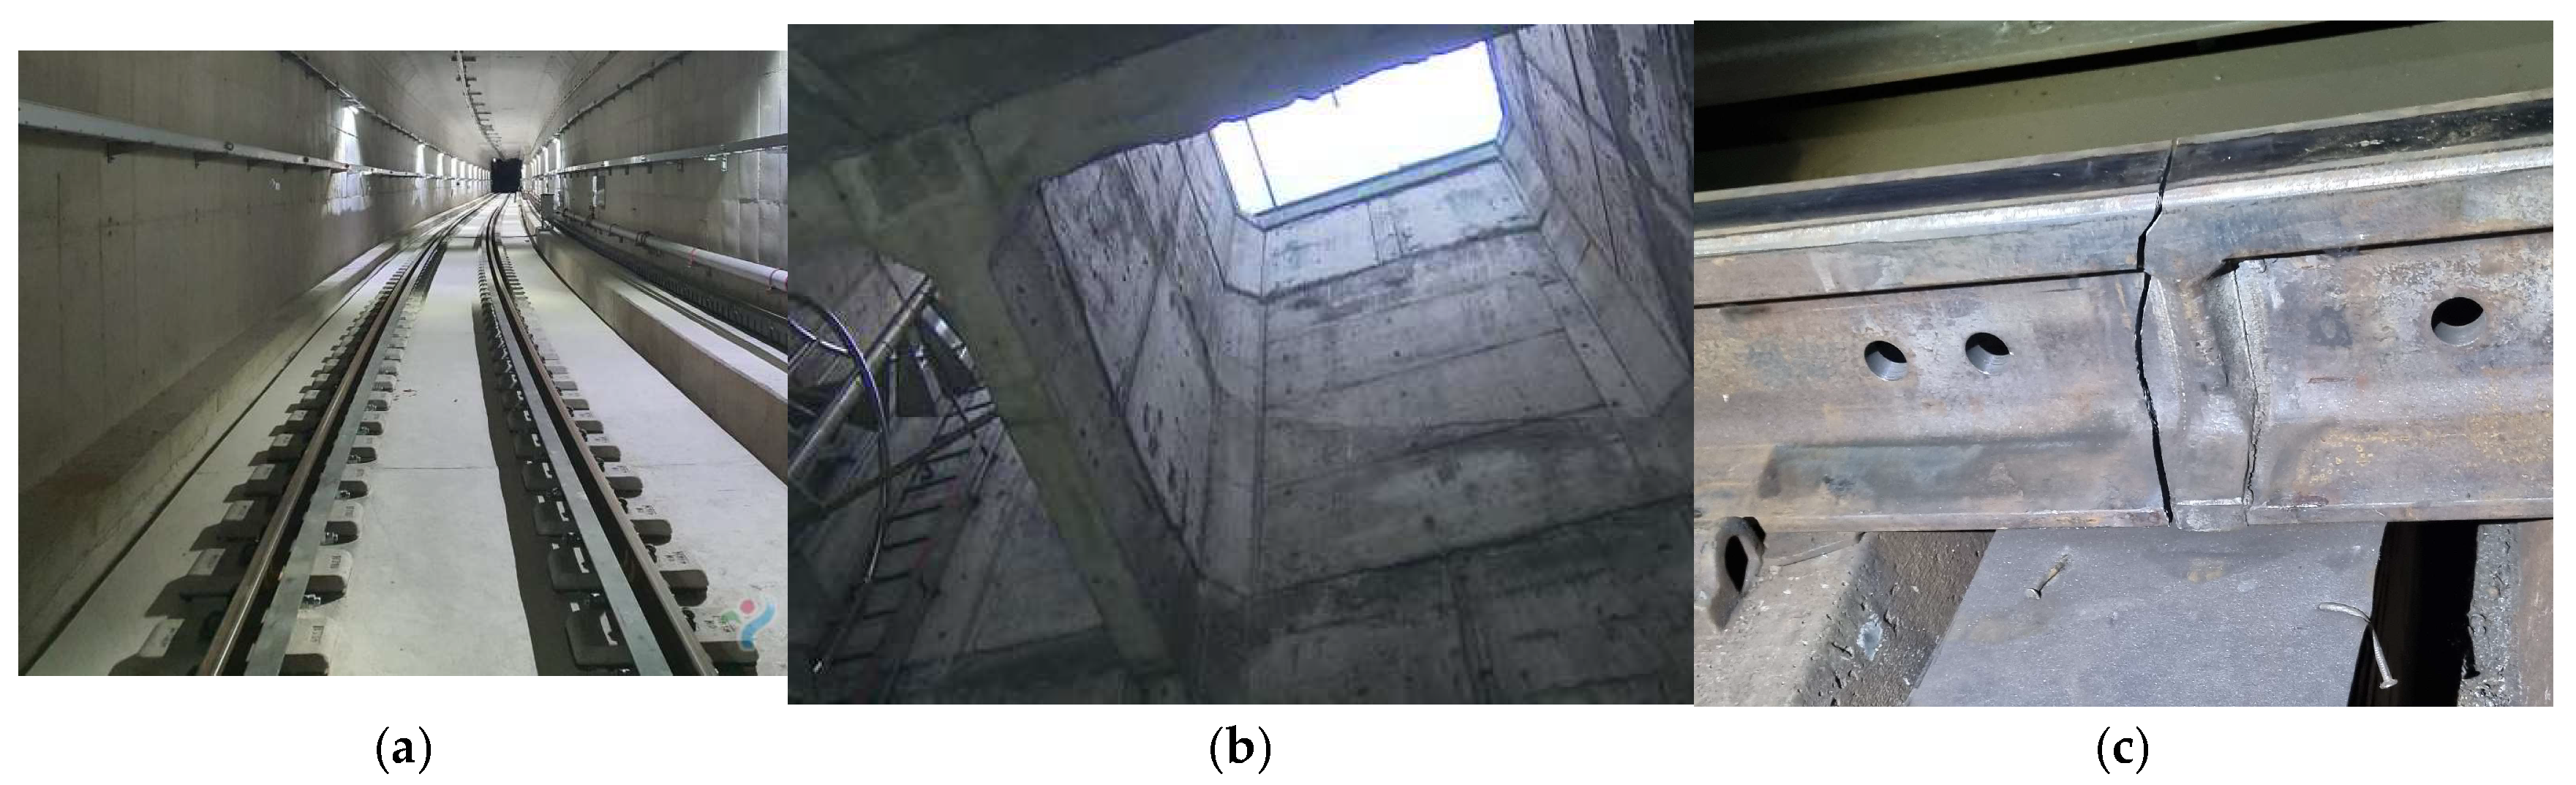
Figure 2.
Rail fracture status: (a) overview of rail fracture; (b) gauge corner fracture.
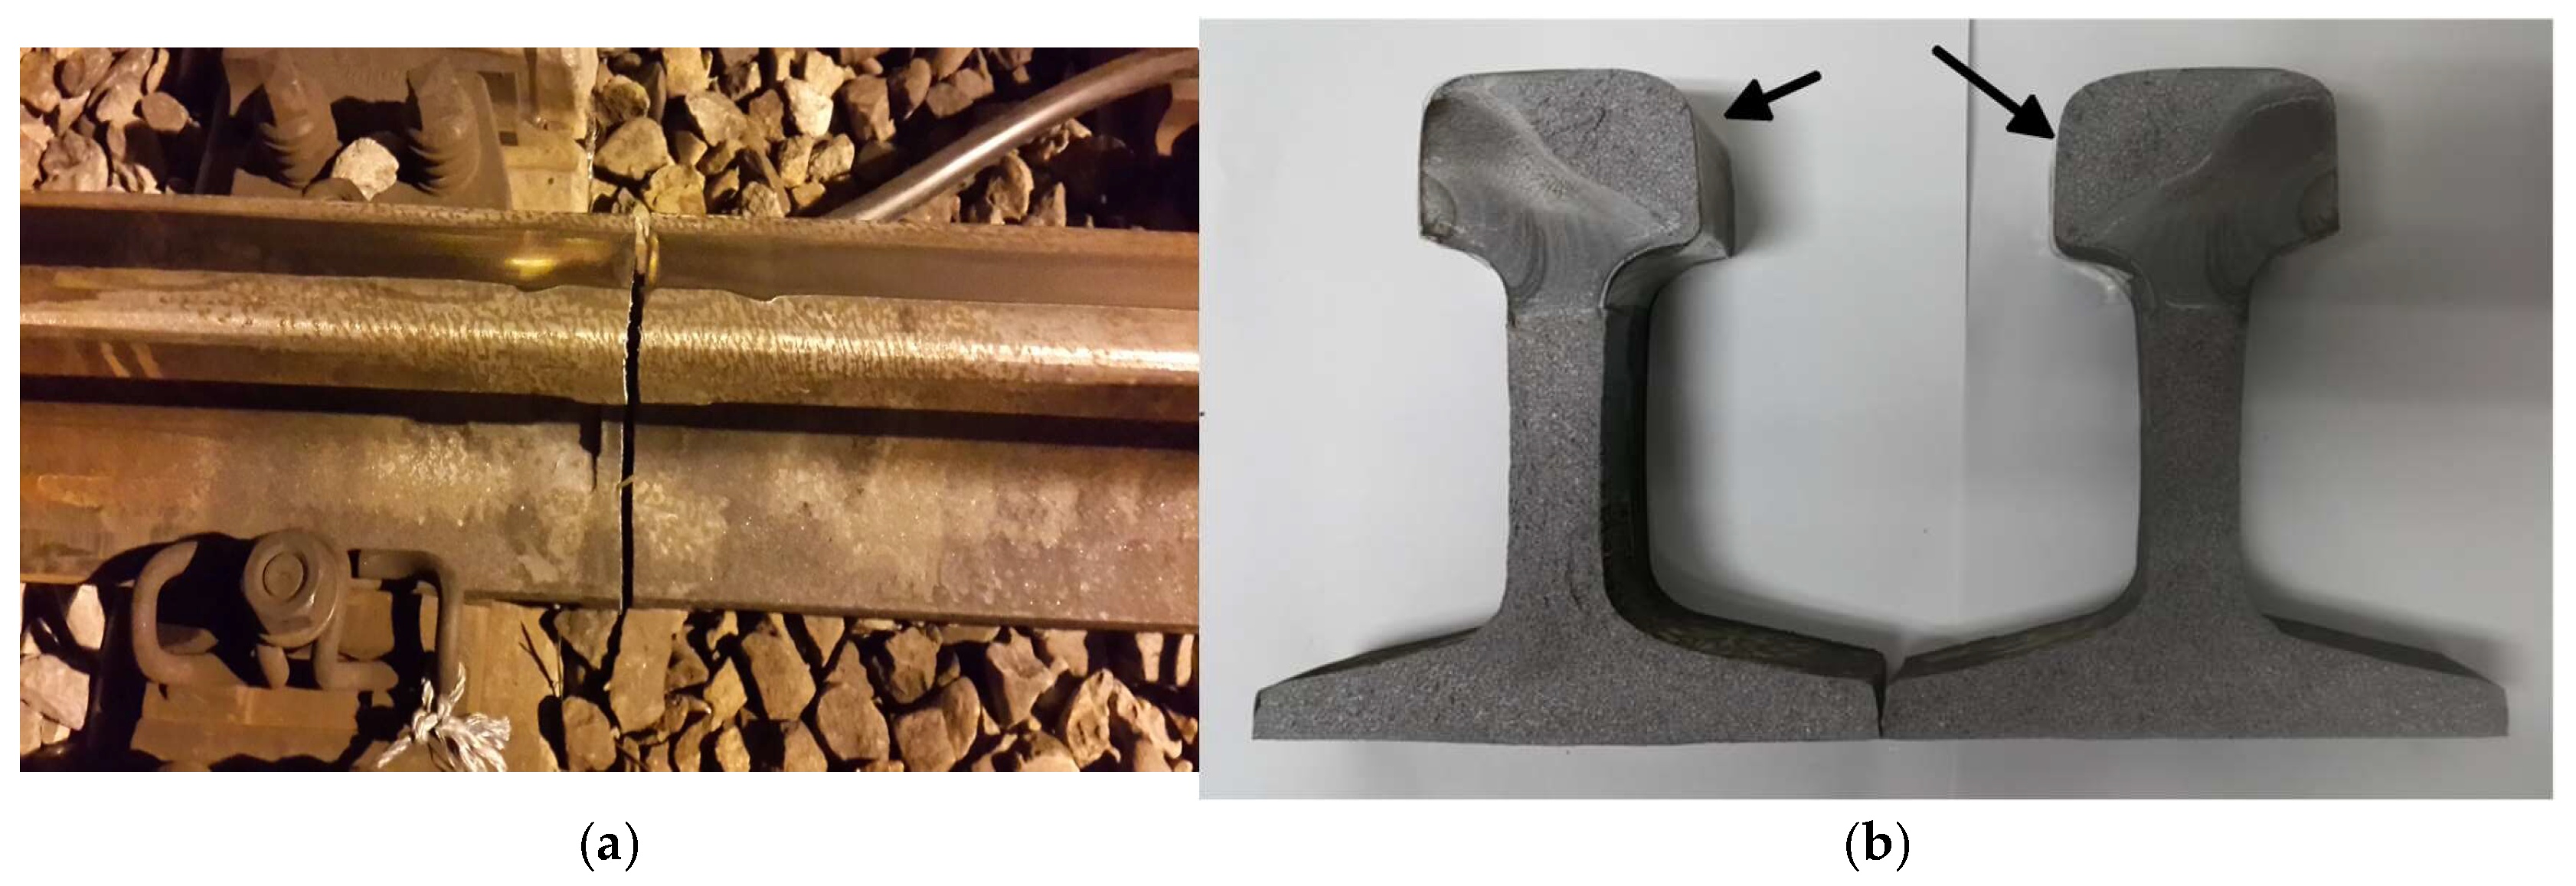
Figure 3.
CWR fracture occurrences in 2023 (13 cases/year).
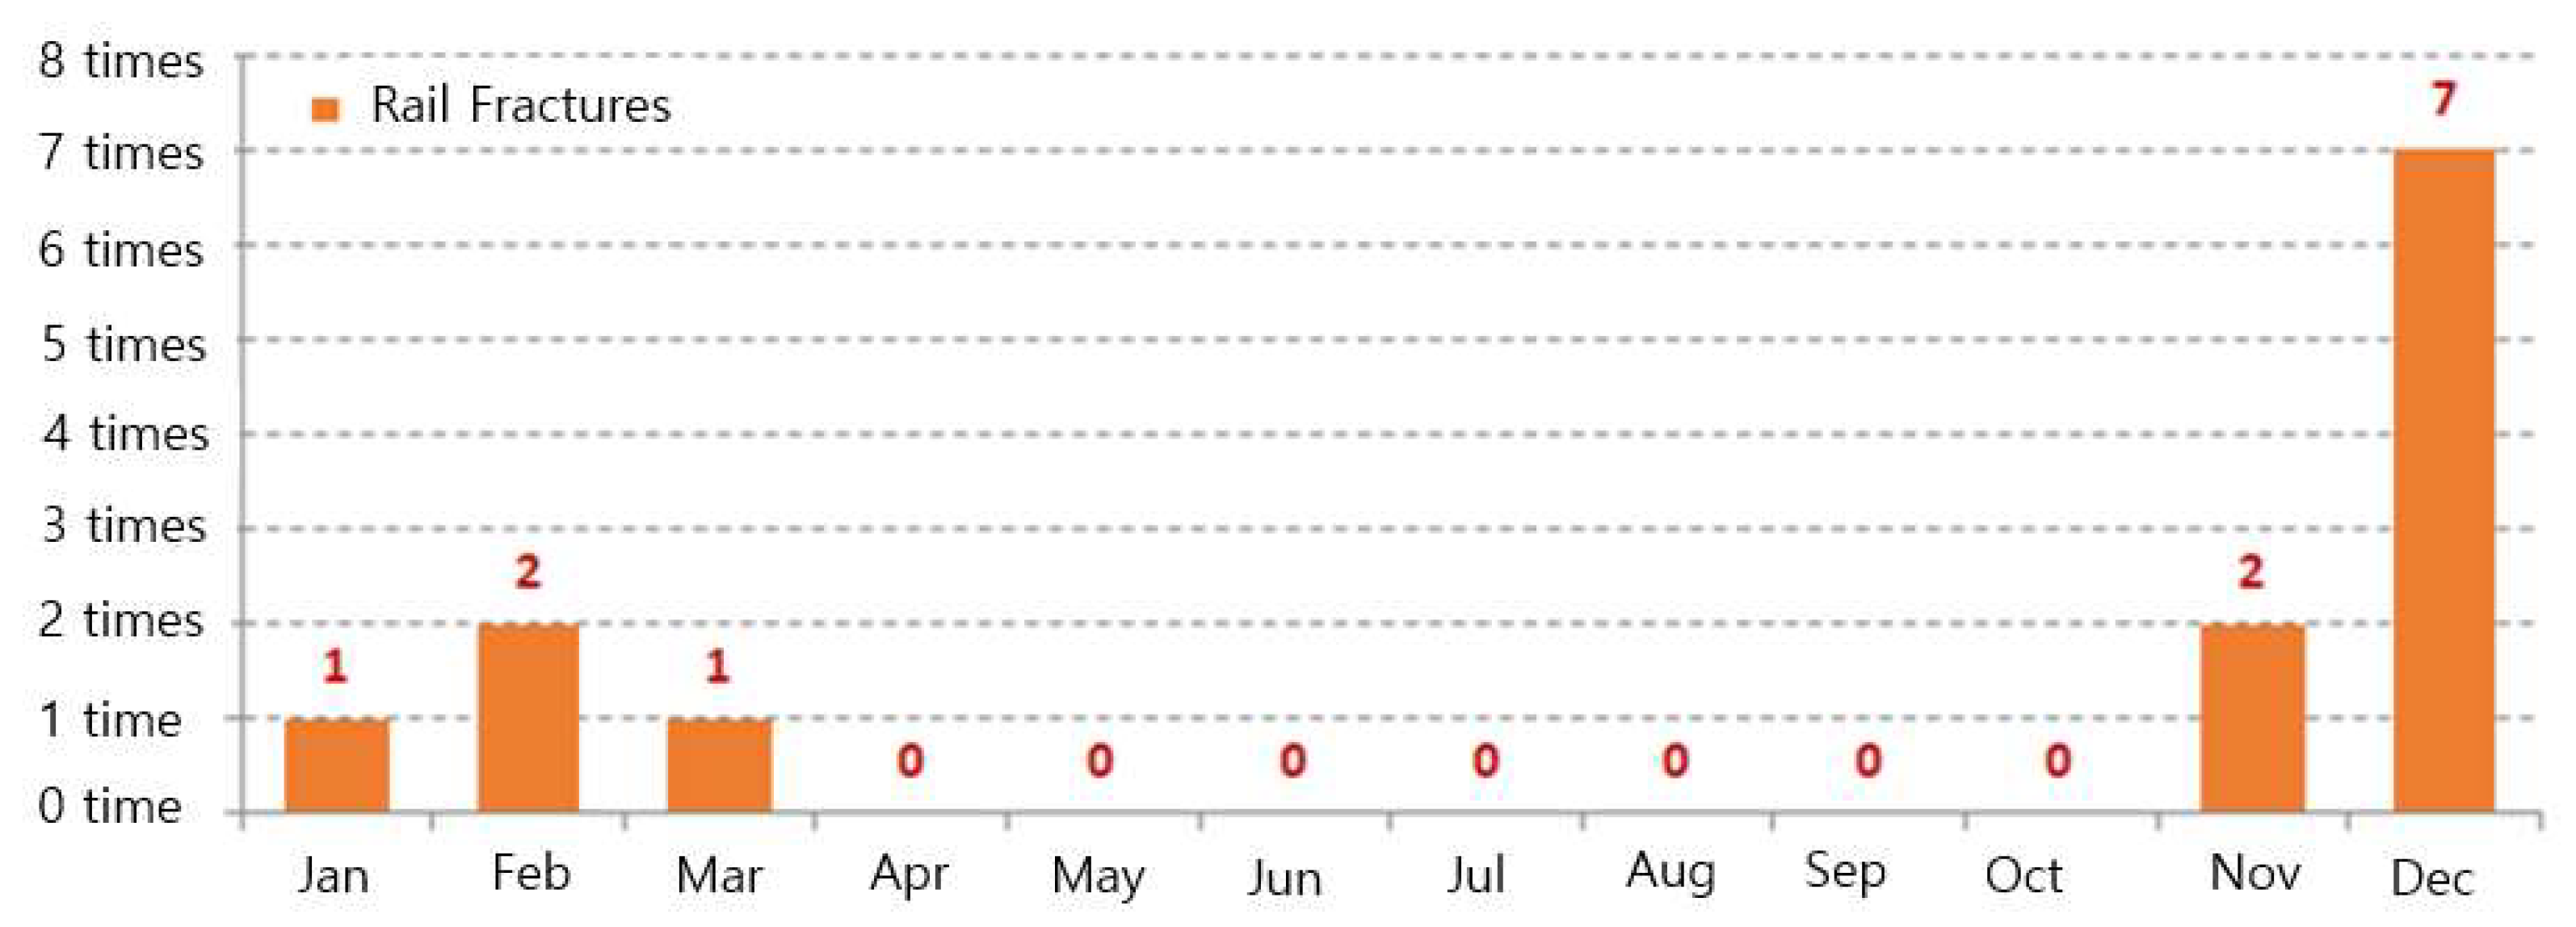
Figure 4.
Heatmap of correlations between parameters (Full training dataset).
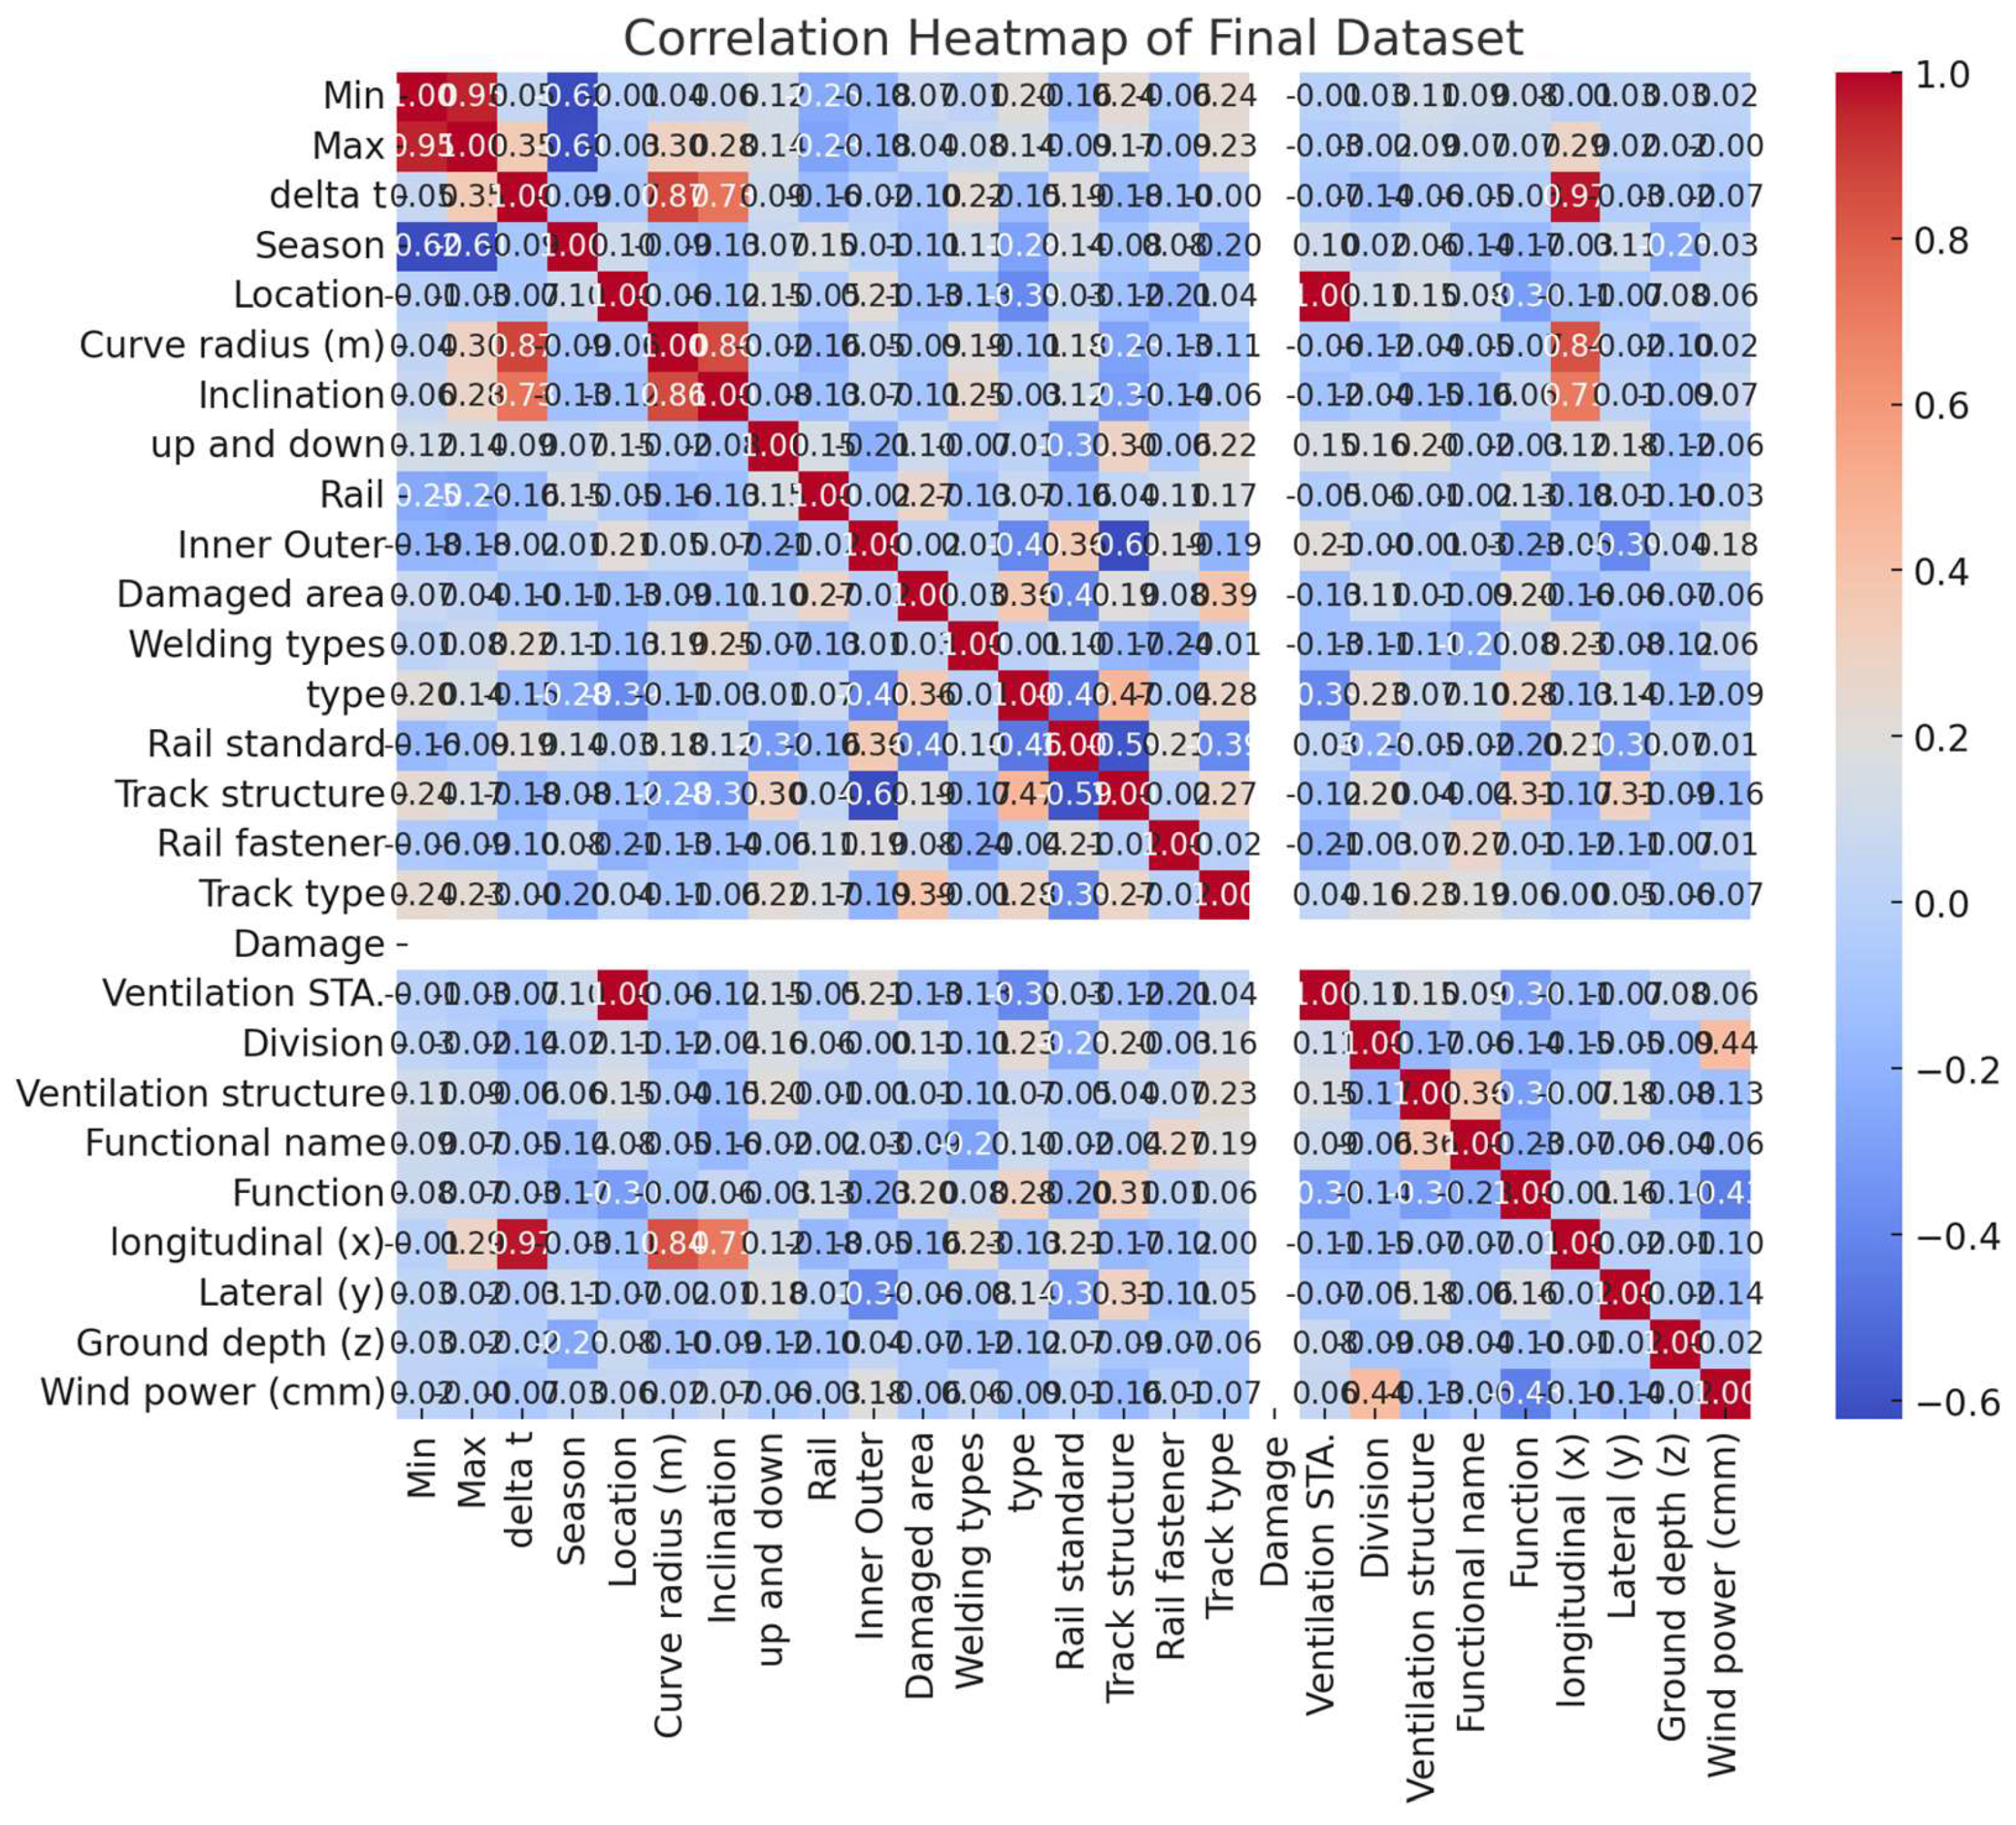
Figure 5.
Scatter plot of correlations between parameters (Full training dataset).
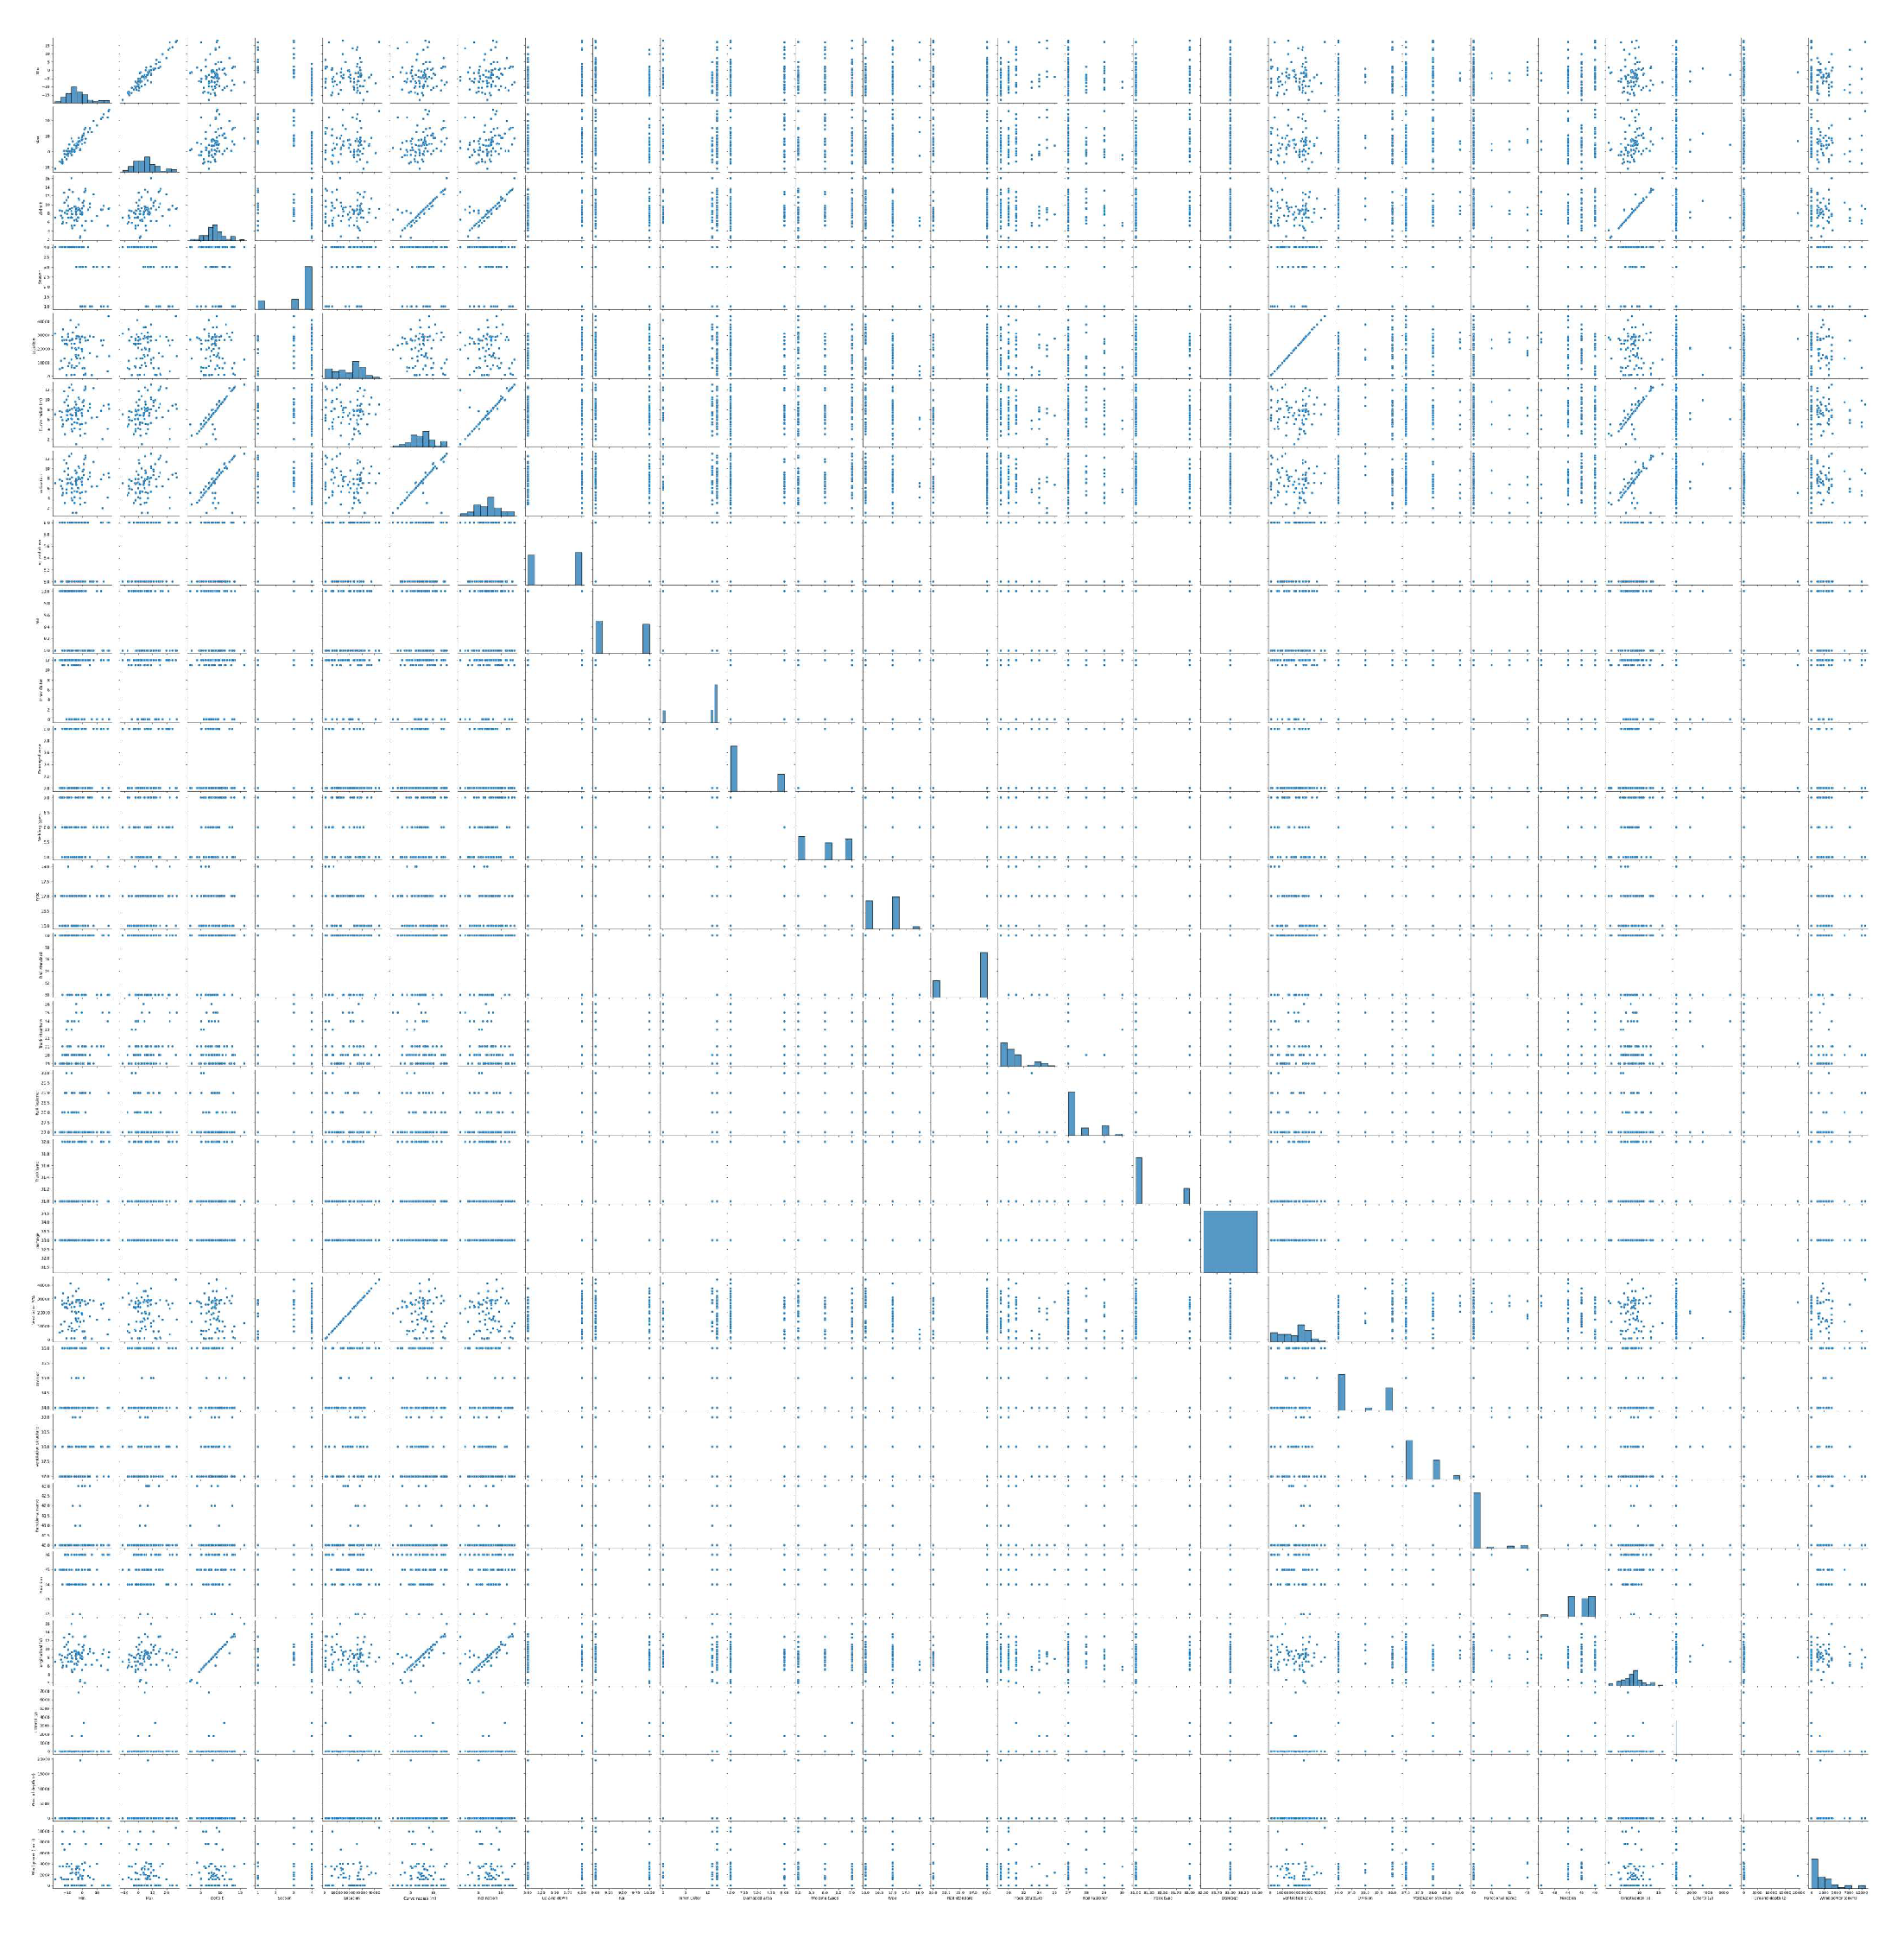
Figure 6.
Regression analysis results for the full training dataset.
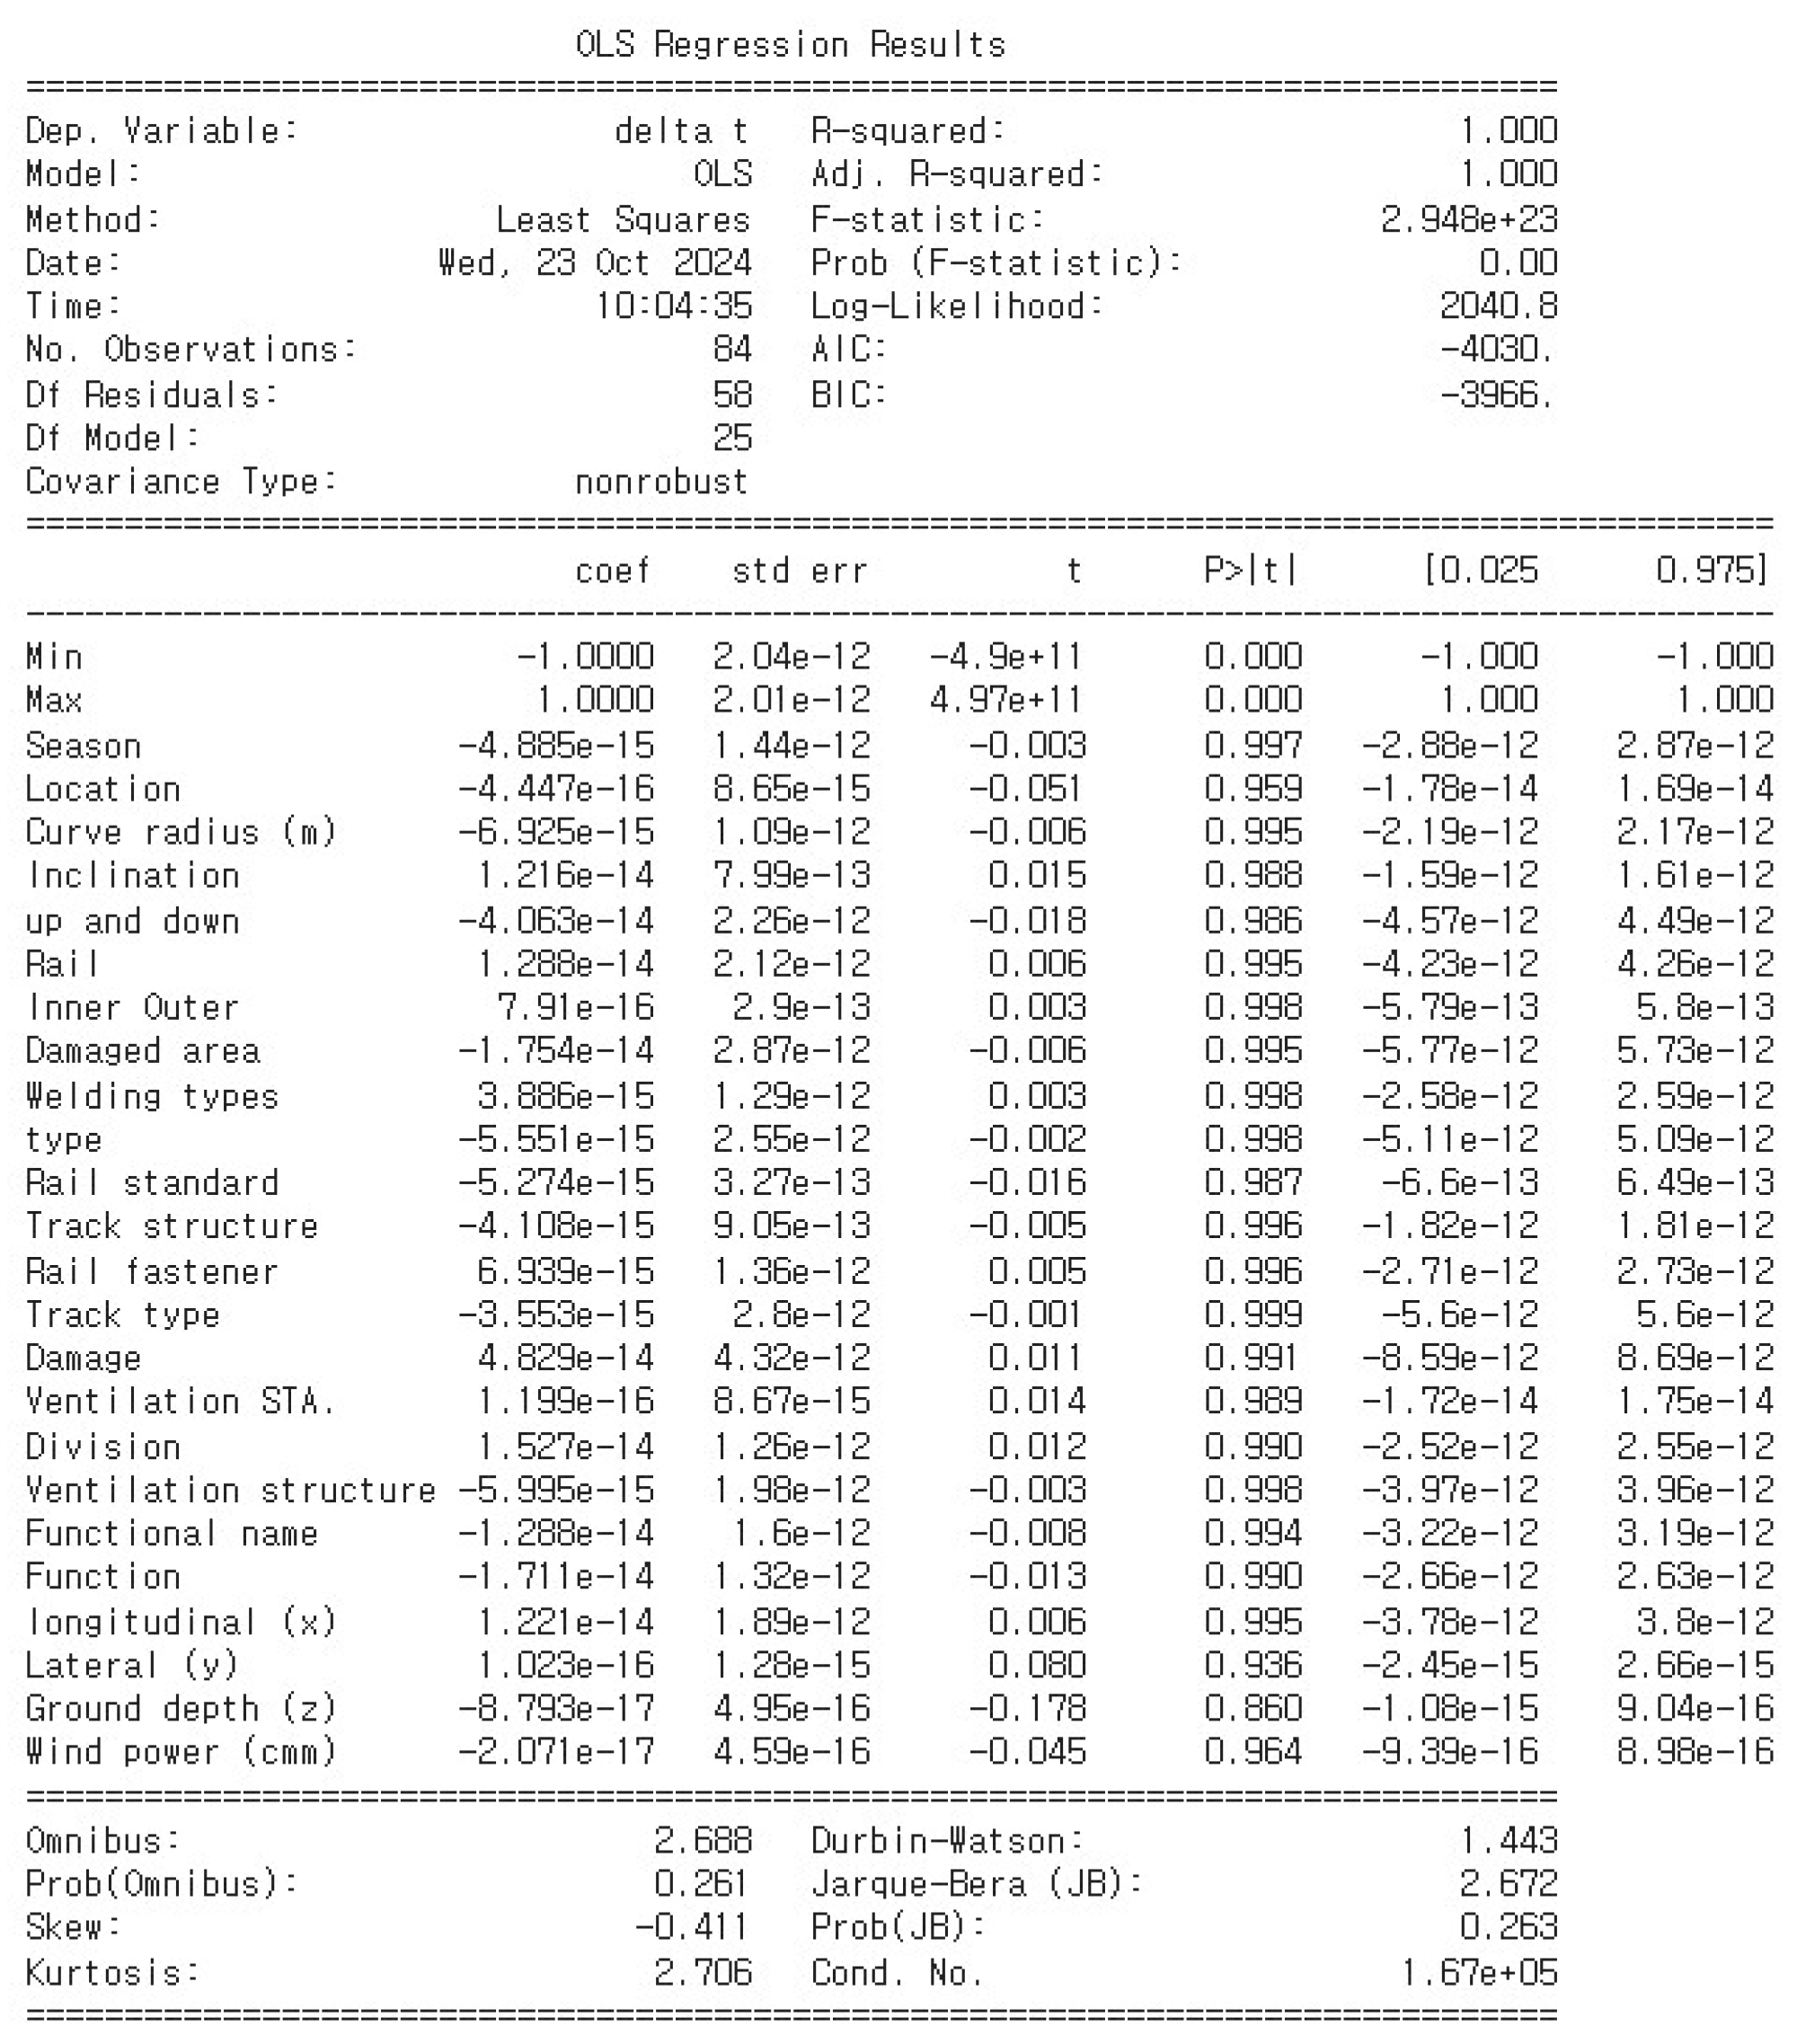
Figure 7.
Heatmap of correlations between parameters (Proposed training dataset).
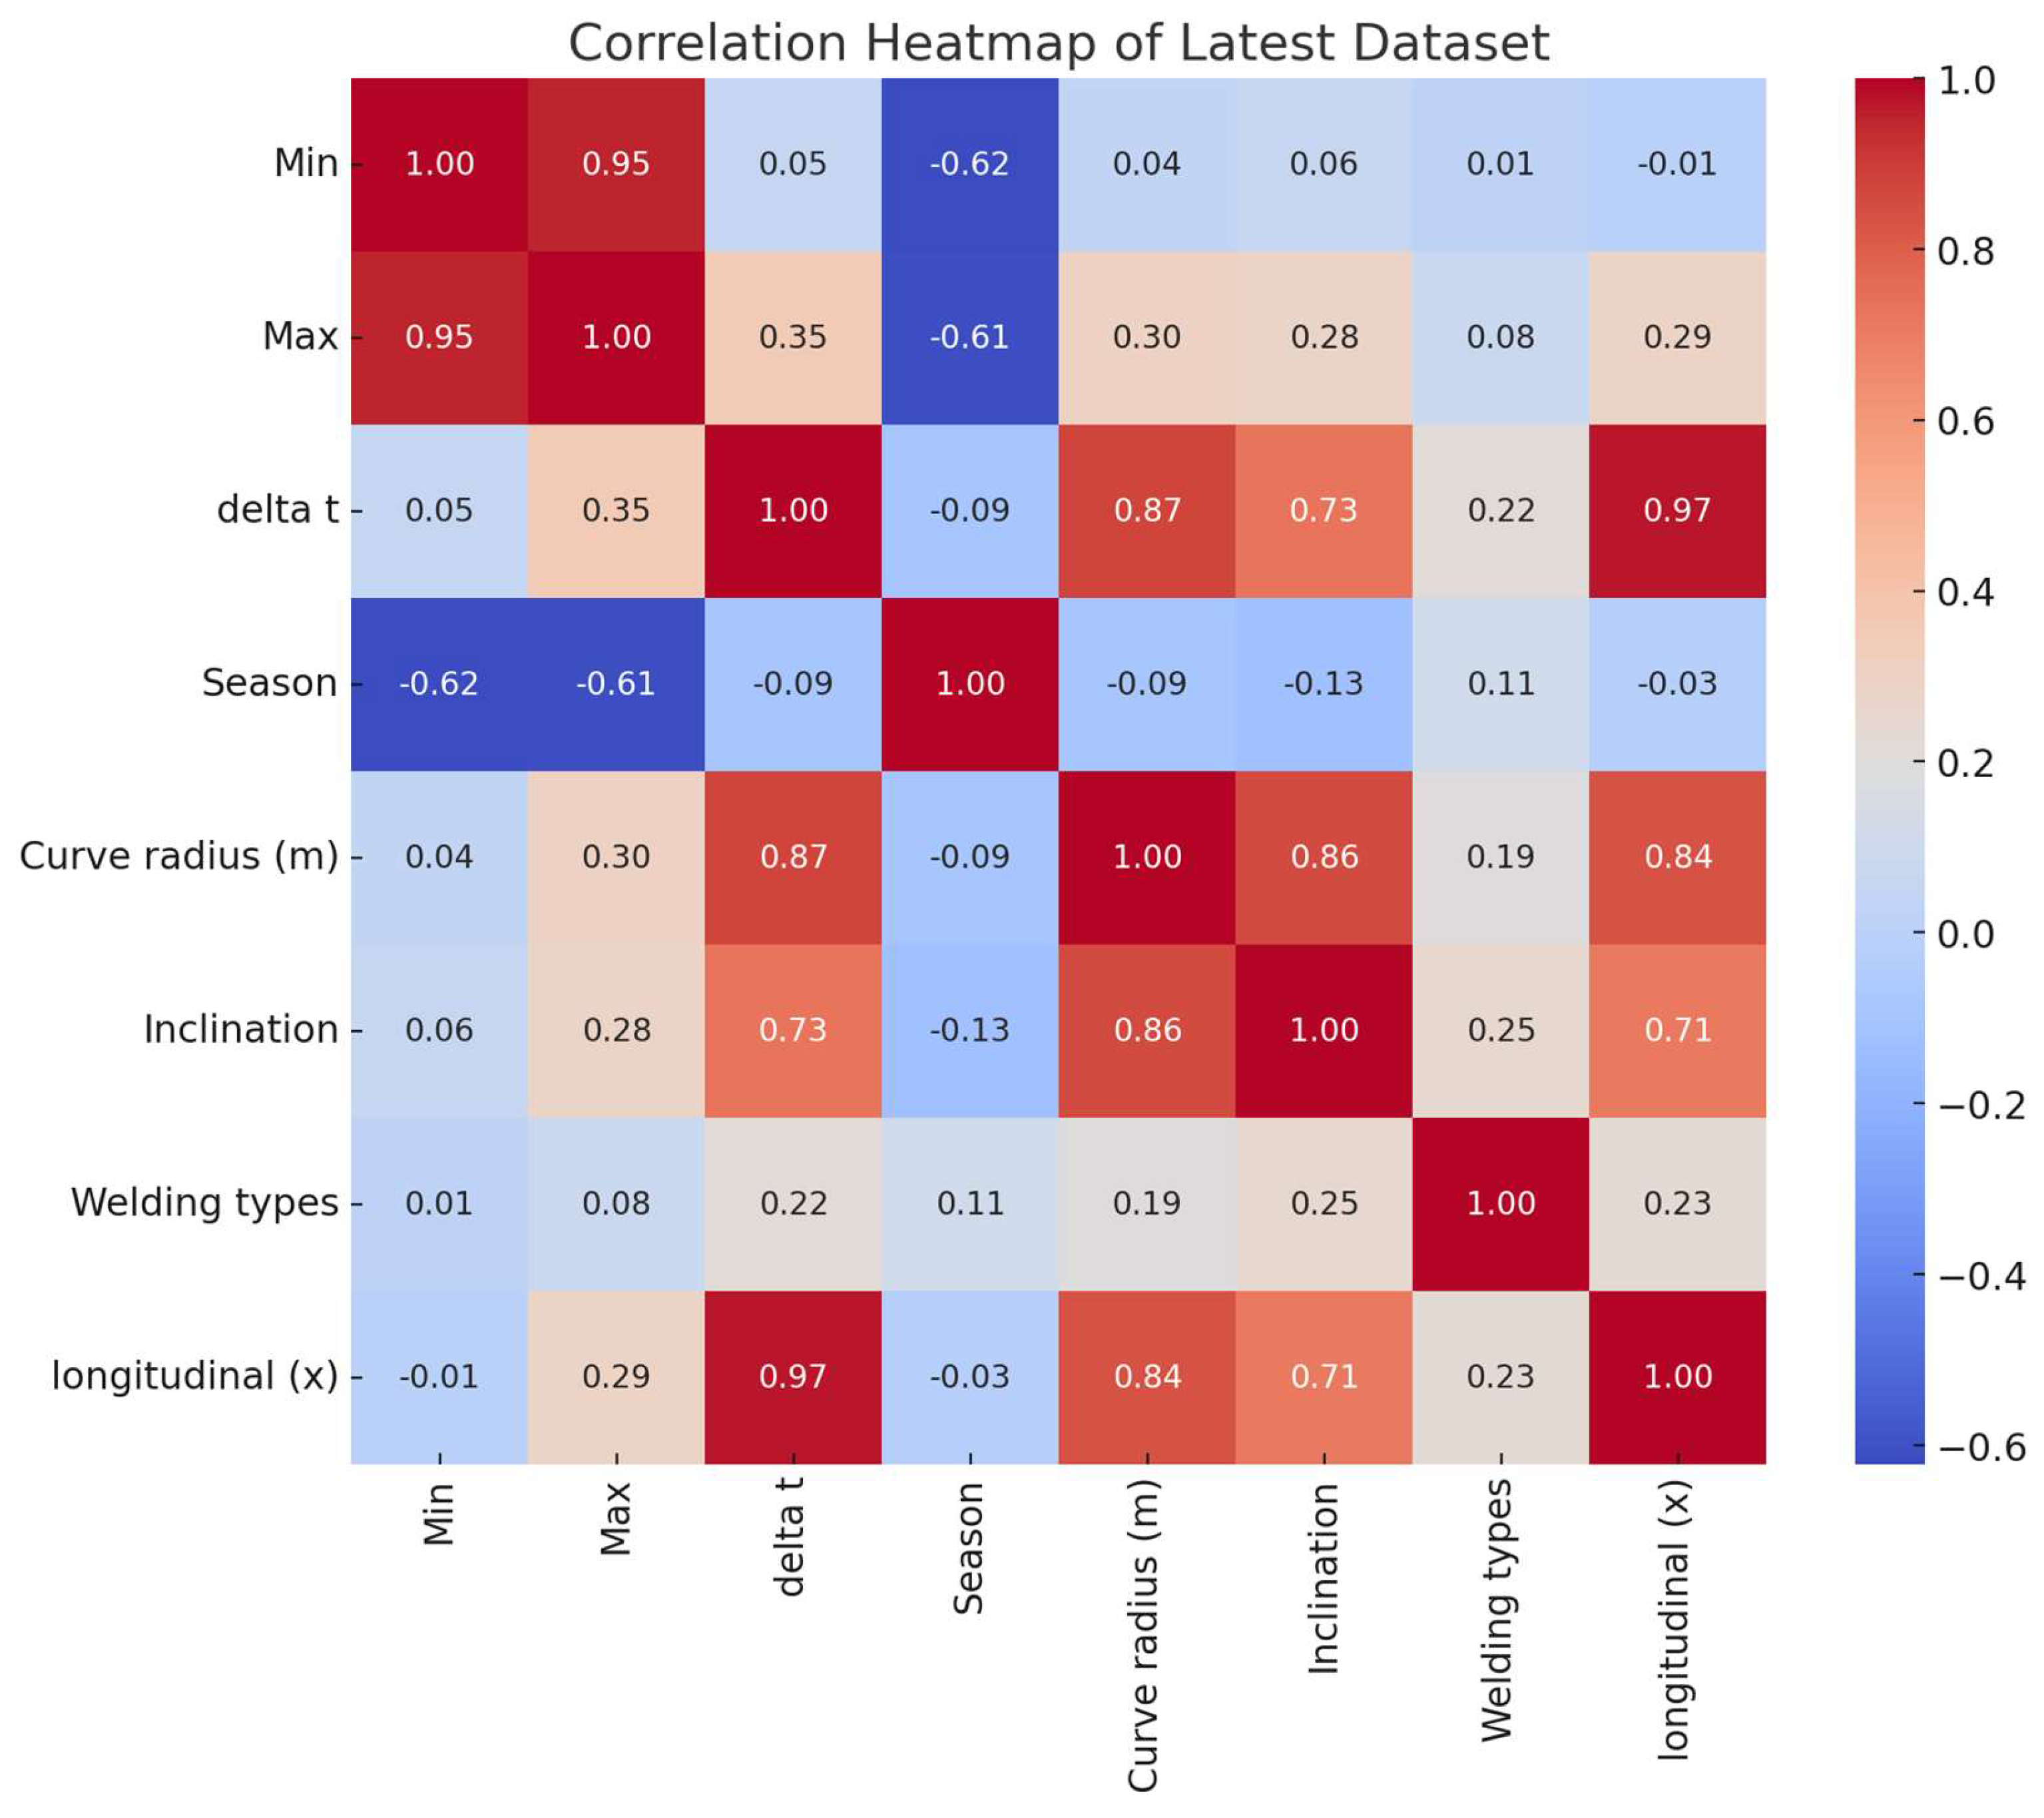
Figure 8.
Scatter plot of correlations between parameters (Proposed training dataset).
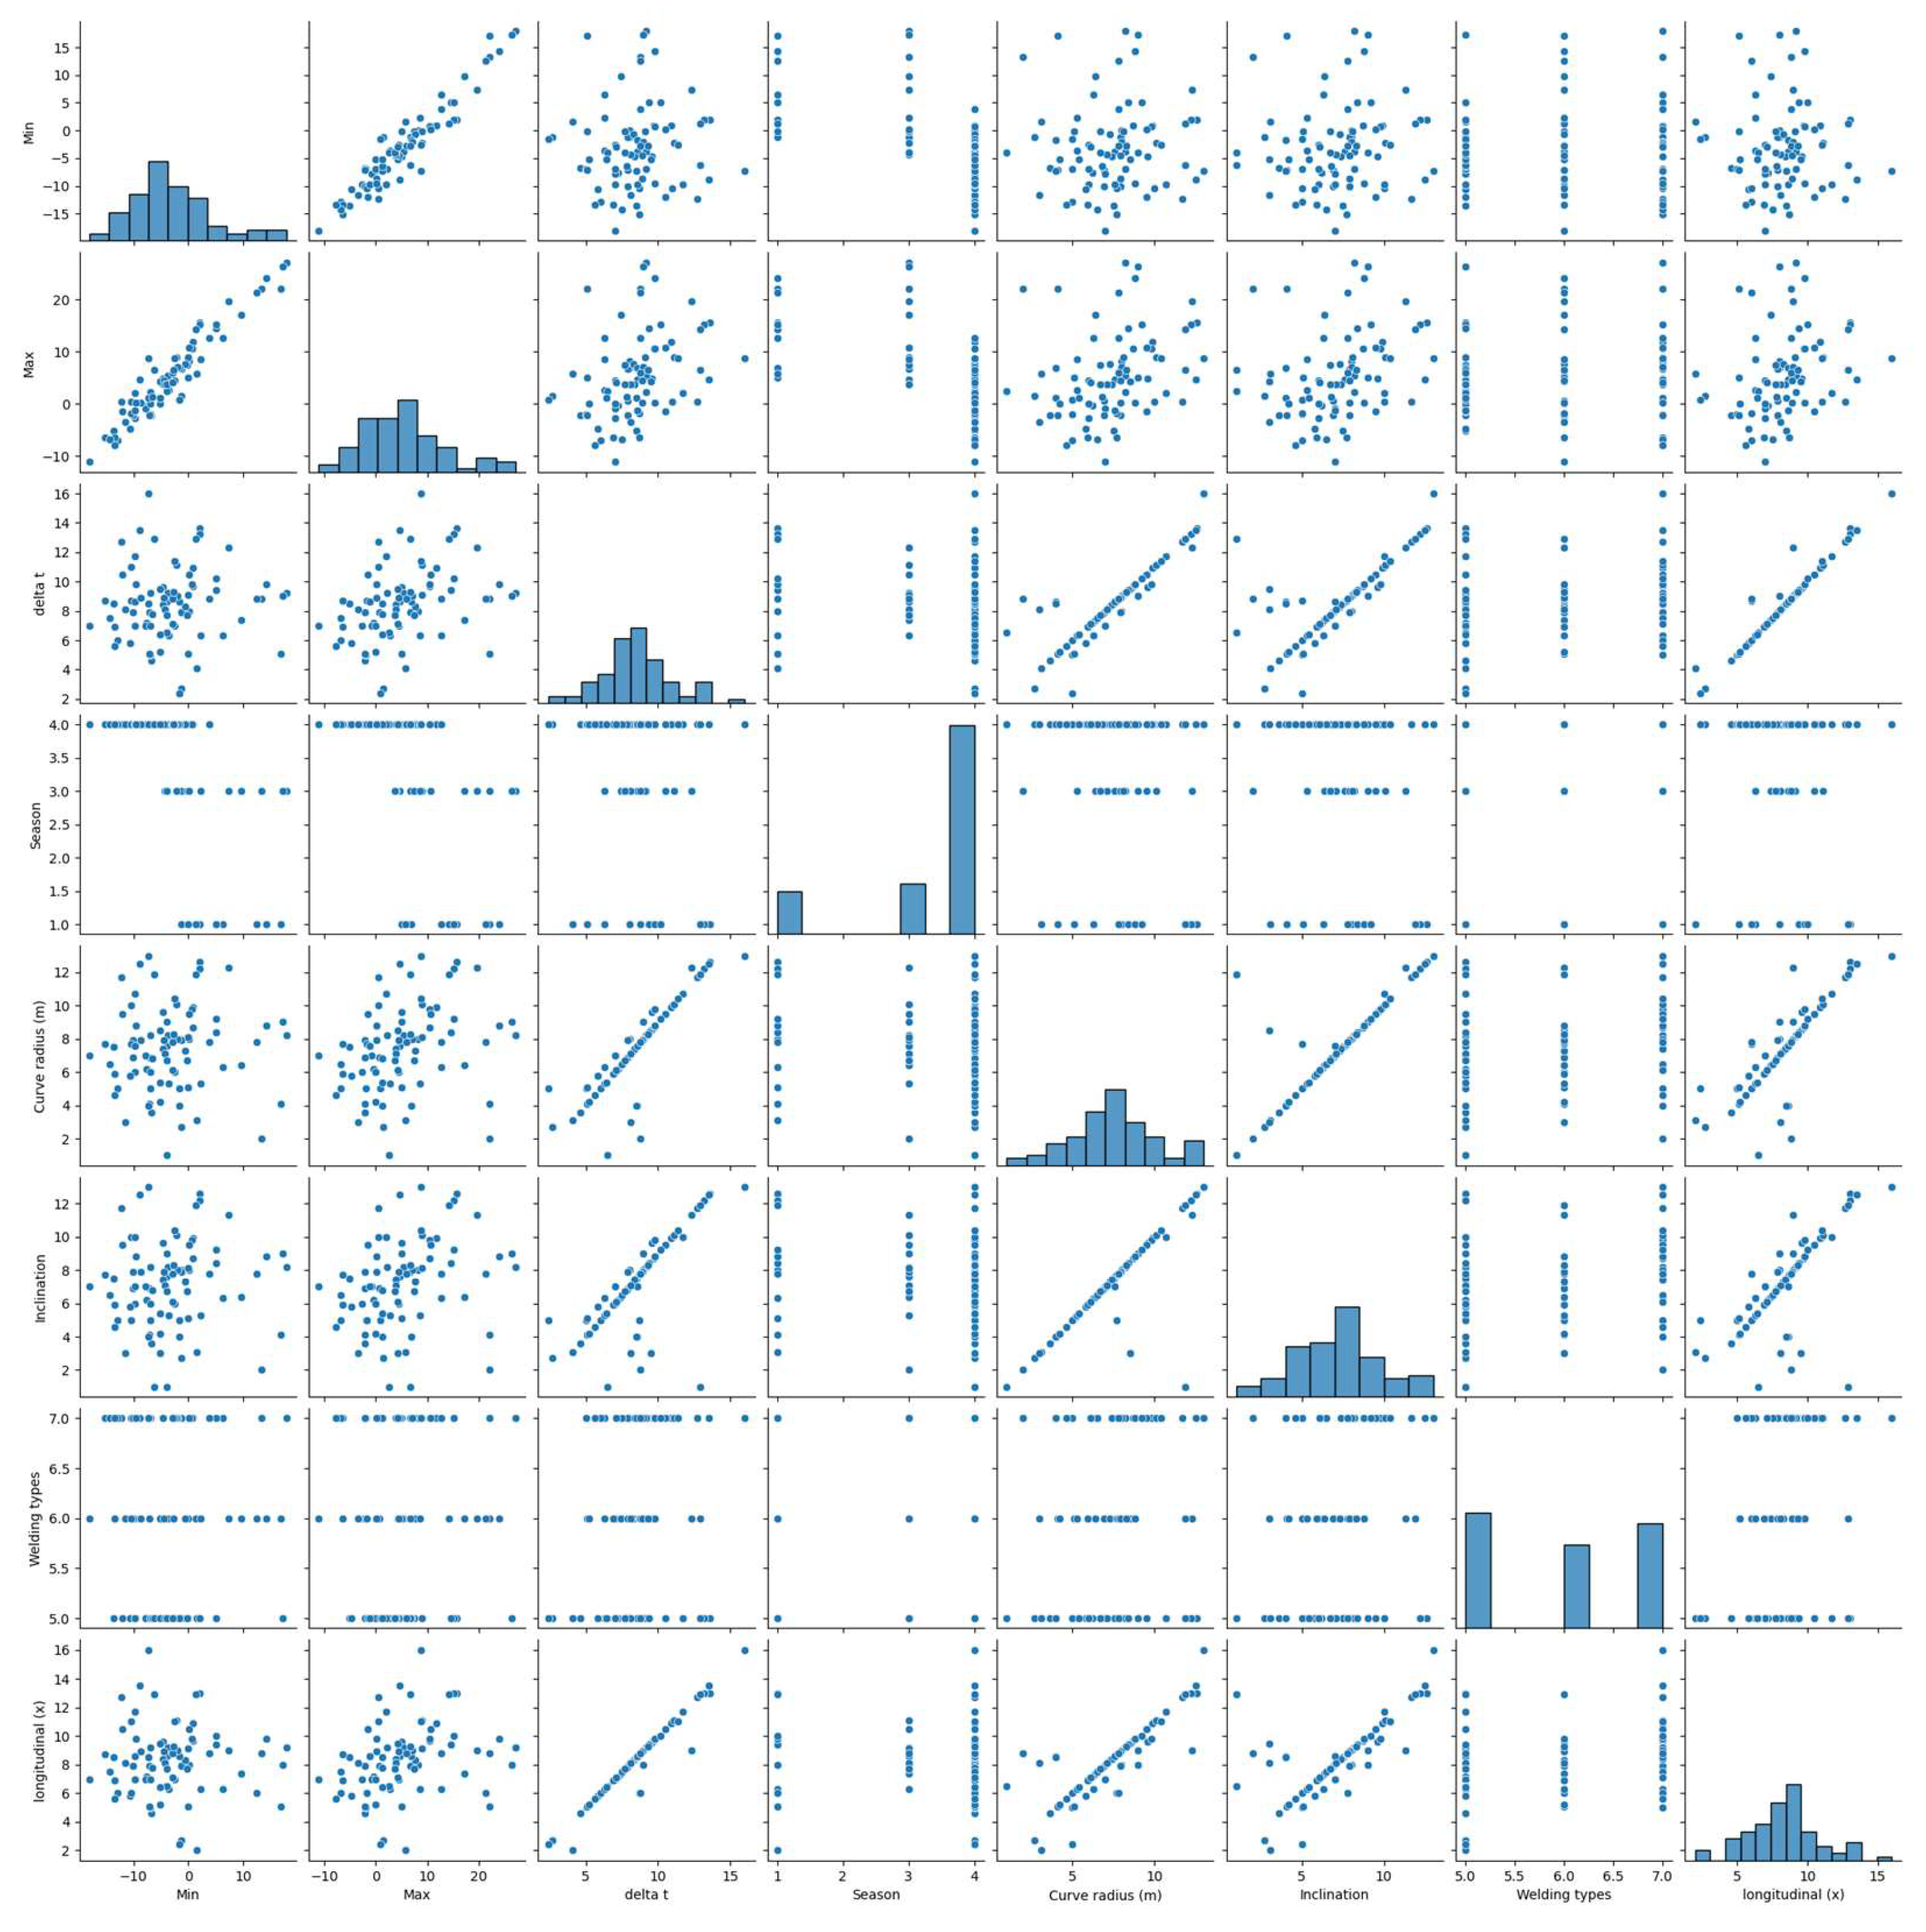
Figure 9.
Regression analysis results for the proposed training dataset.
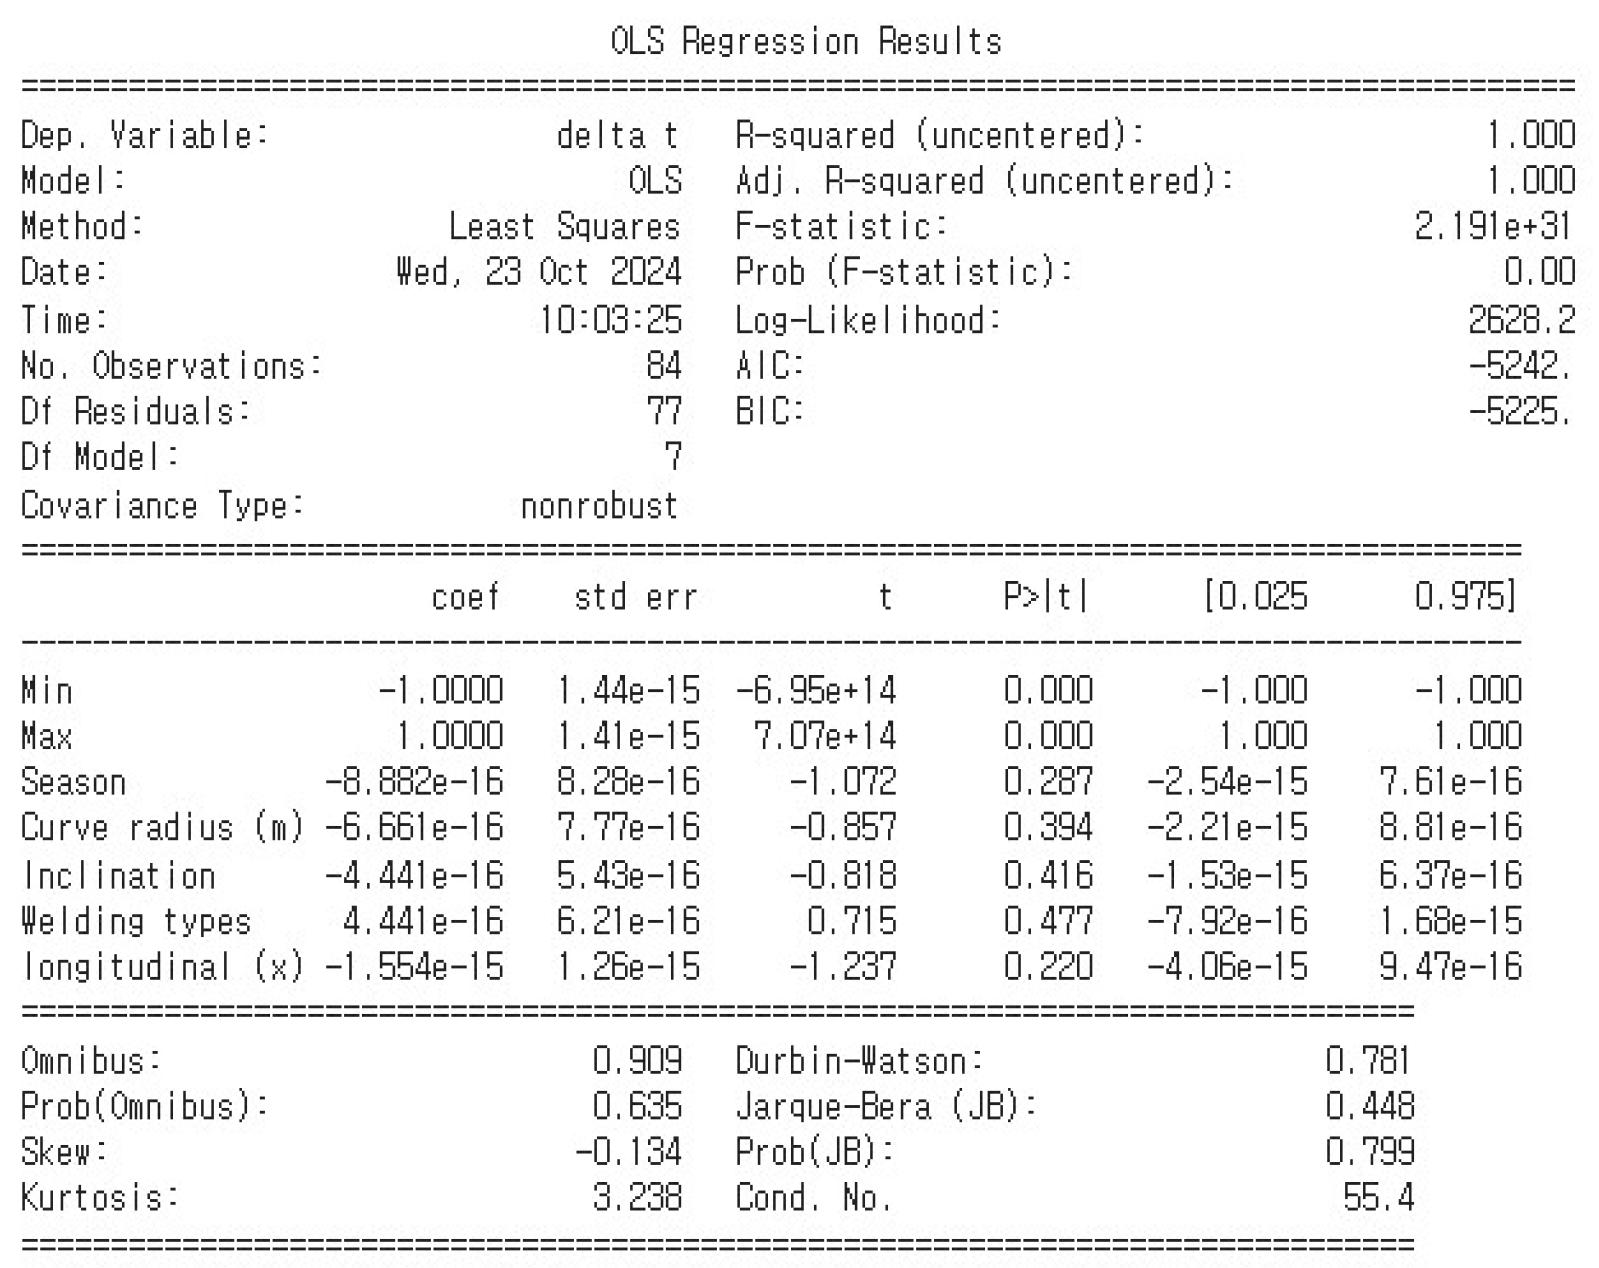
Figure 10.
Ventilation shaft numerical model.
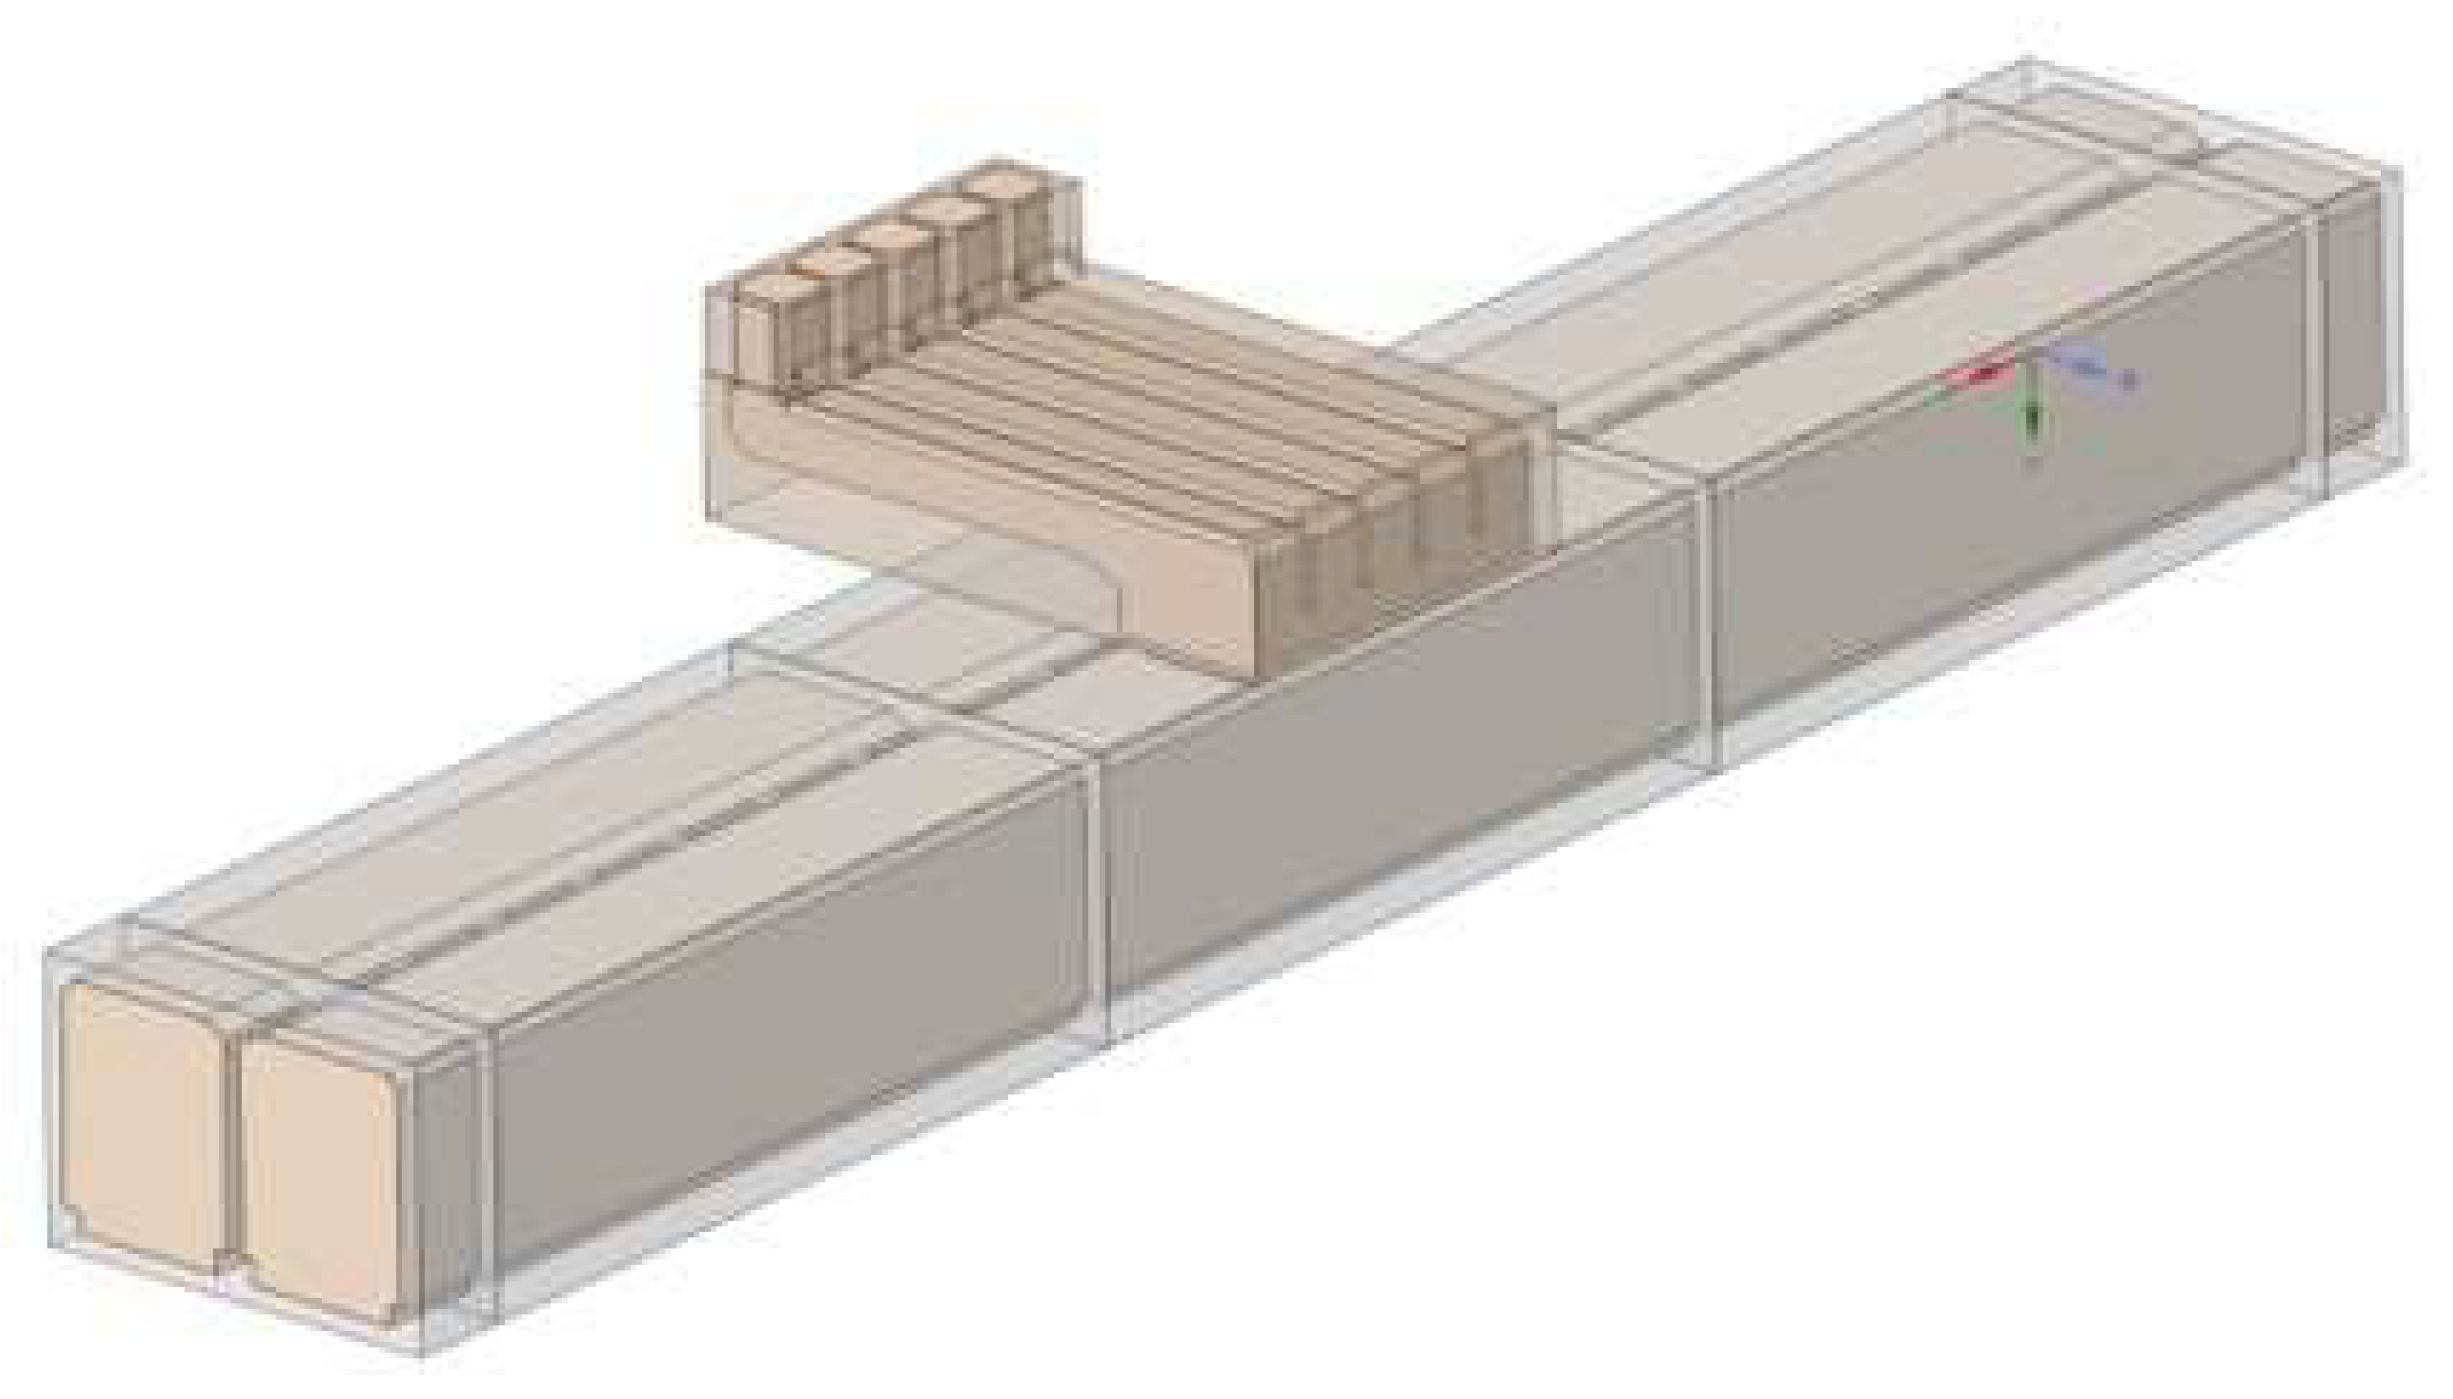
Figure 11.
Ventilation shaft boundary conditions.
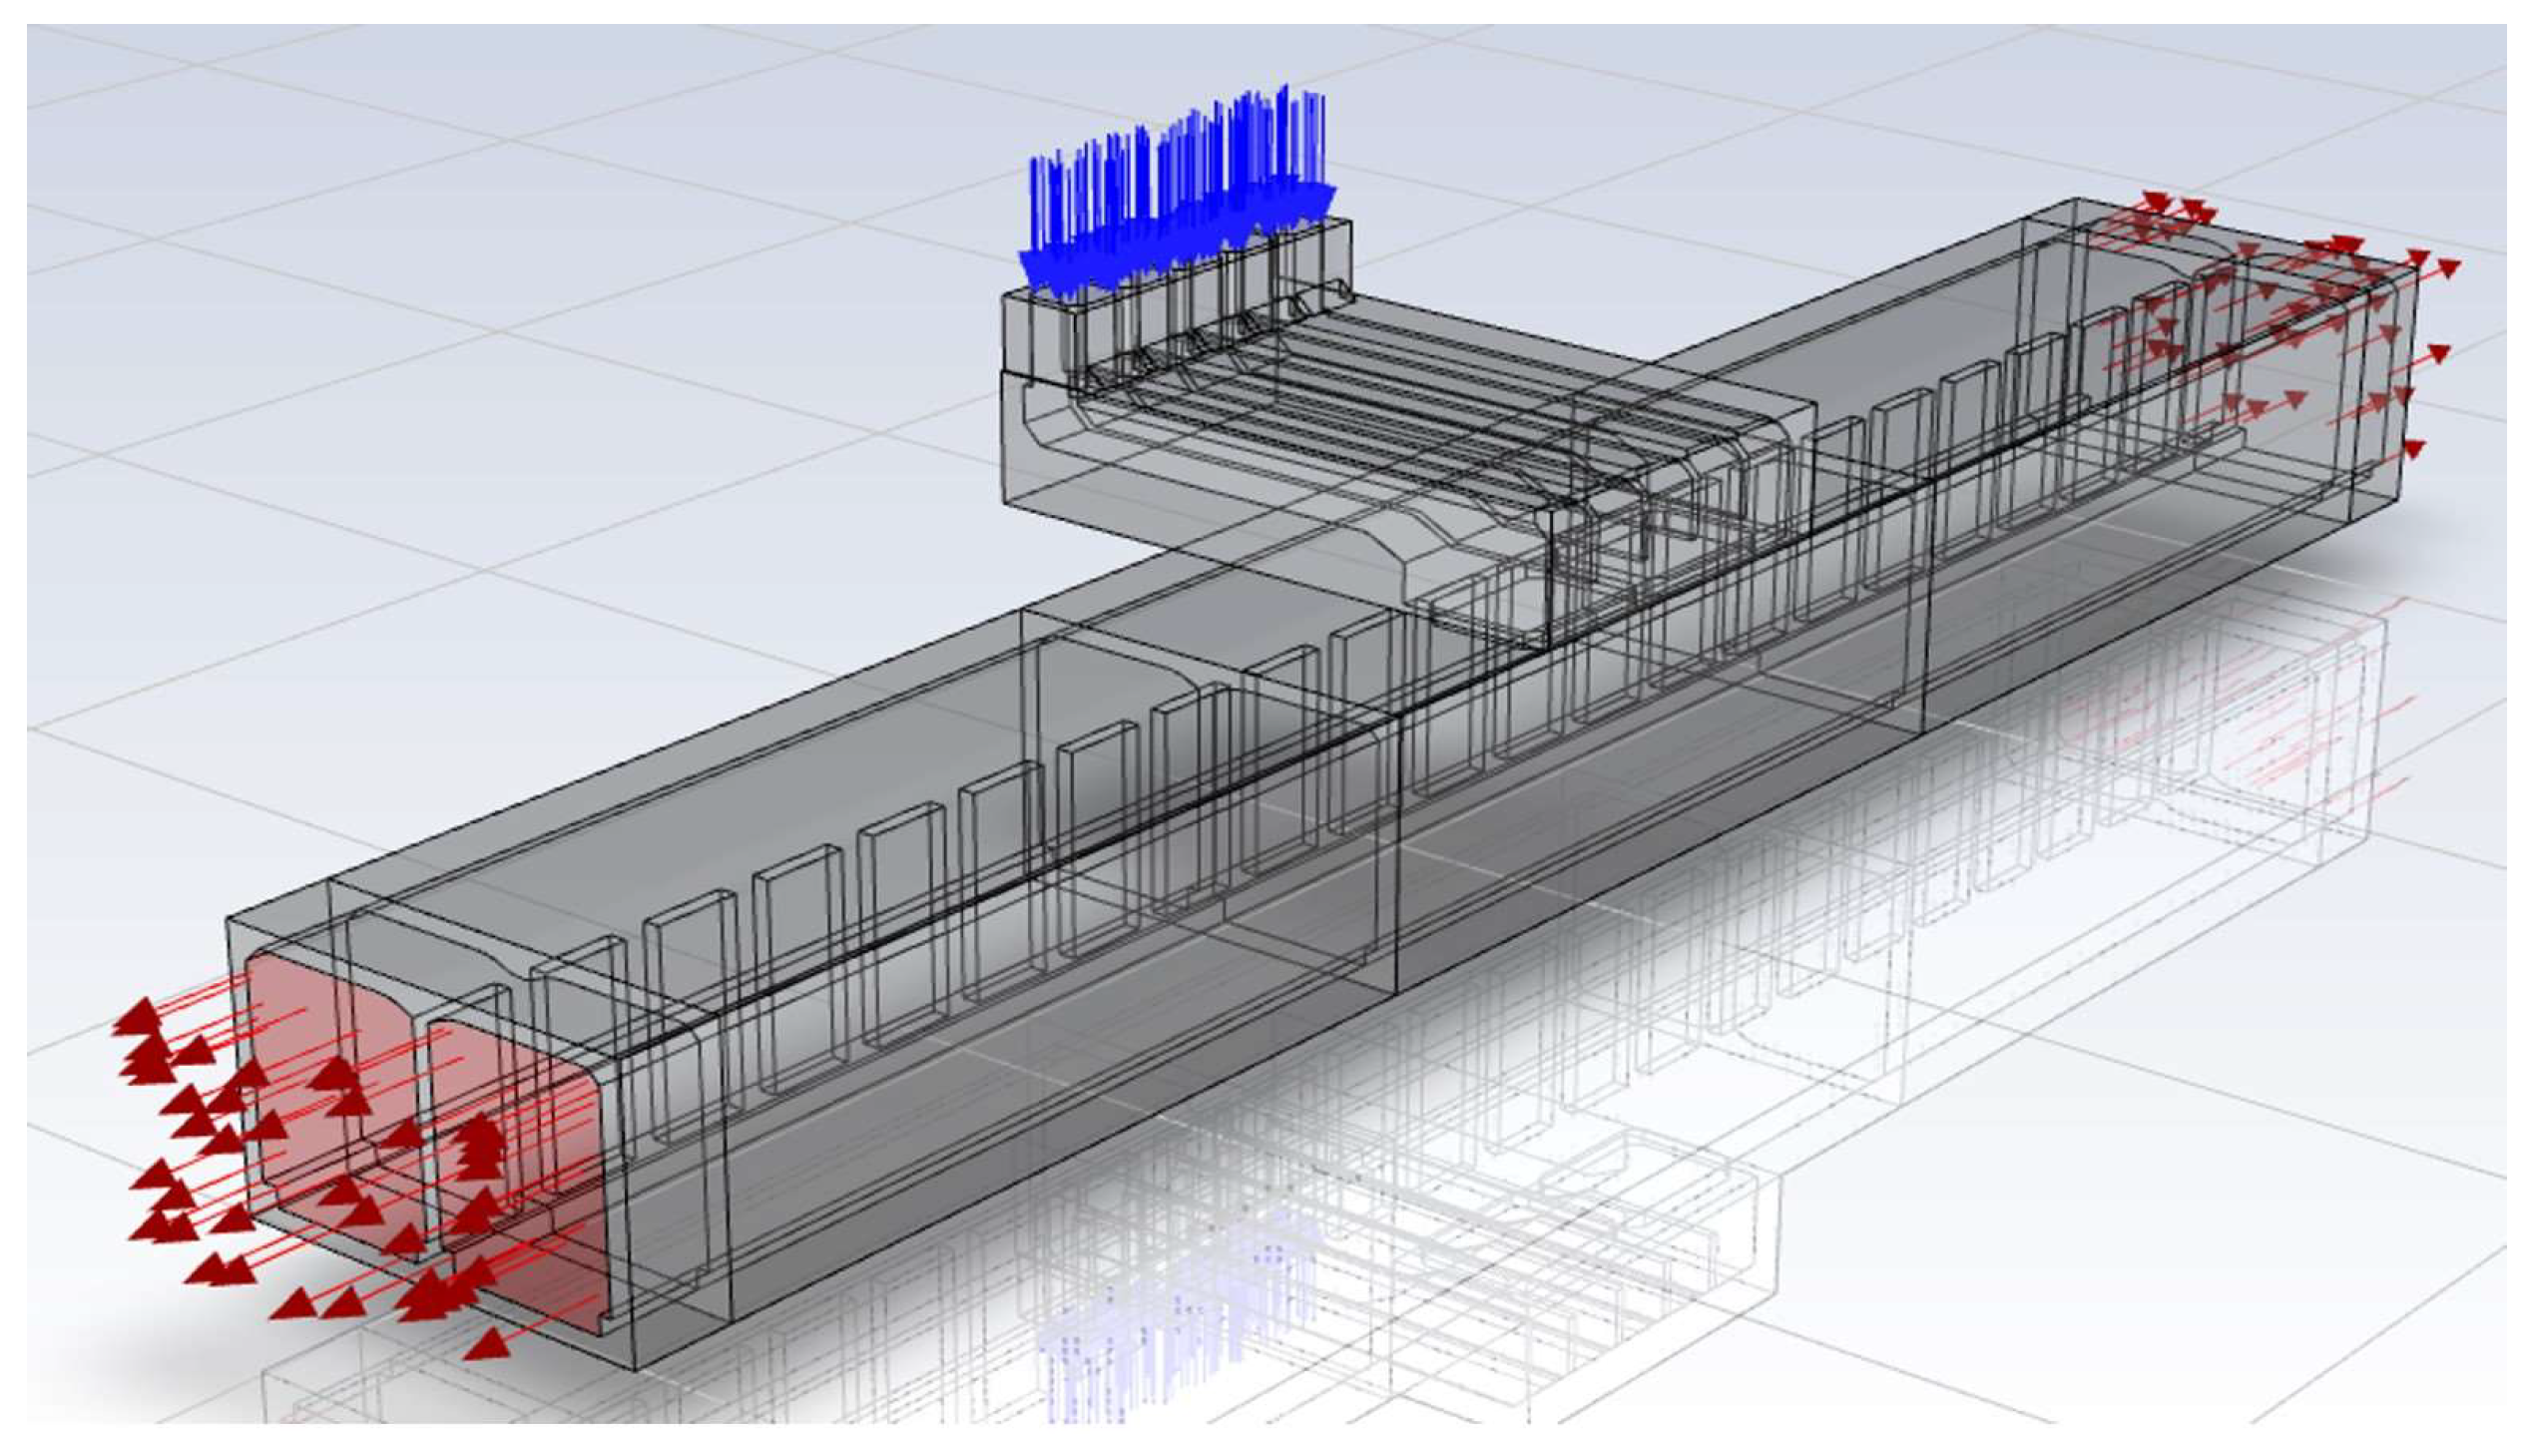
Figure 12.
Thermal load conditions based on tunnel temperature variations during CWR fractures: (a) Temperature variation at fracture locations; (b) Gaussian probability density analysis results.
Figure 12.
Thermal load conditions based on tunnel temperature variations during CWR fractures: (a) Temperature variation at fracture locations; (b) Gaussian probability density analysis results.
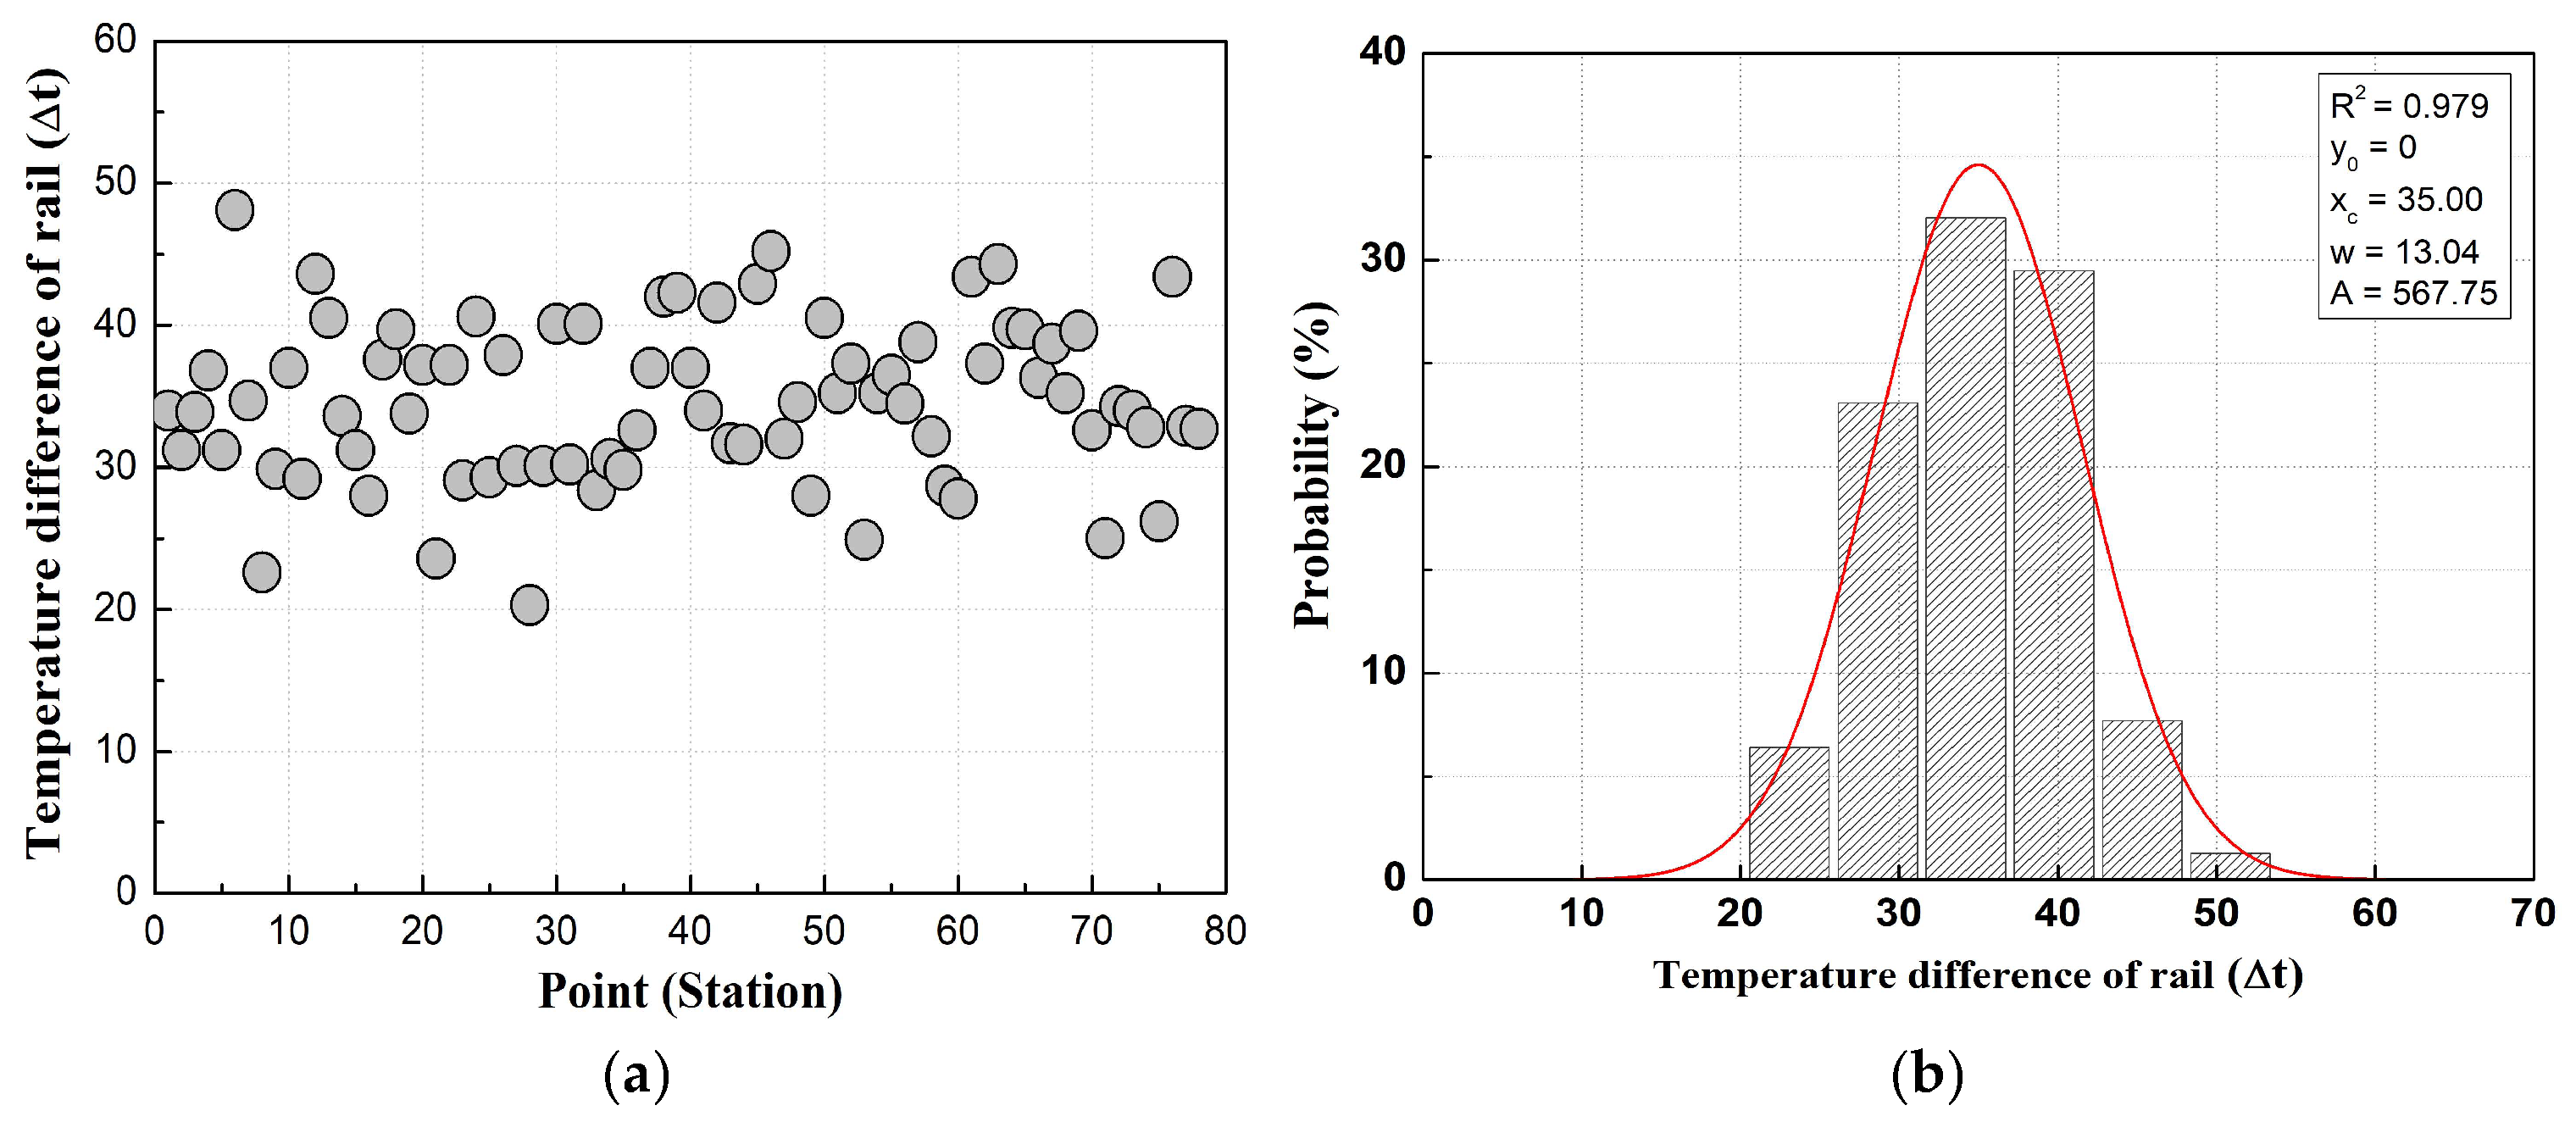
Figure 13.
Numerical analysis results under fluid flow speeds of: (a) 0.5 m/s; (b) 1.0 m/s; (c) 2.0 m/s; and (d) 4.0 m/s.
Figure 13.
Numerical analysis results under fluid flow speeds of: (a) 0.5 m/s; (b) 1.0 m/s; (c) 2.0 m/s; and (d) 4.0 m/s.
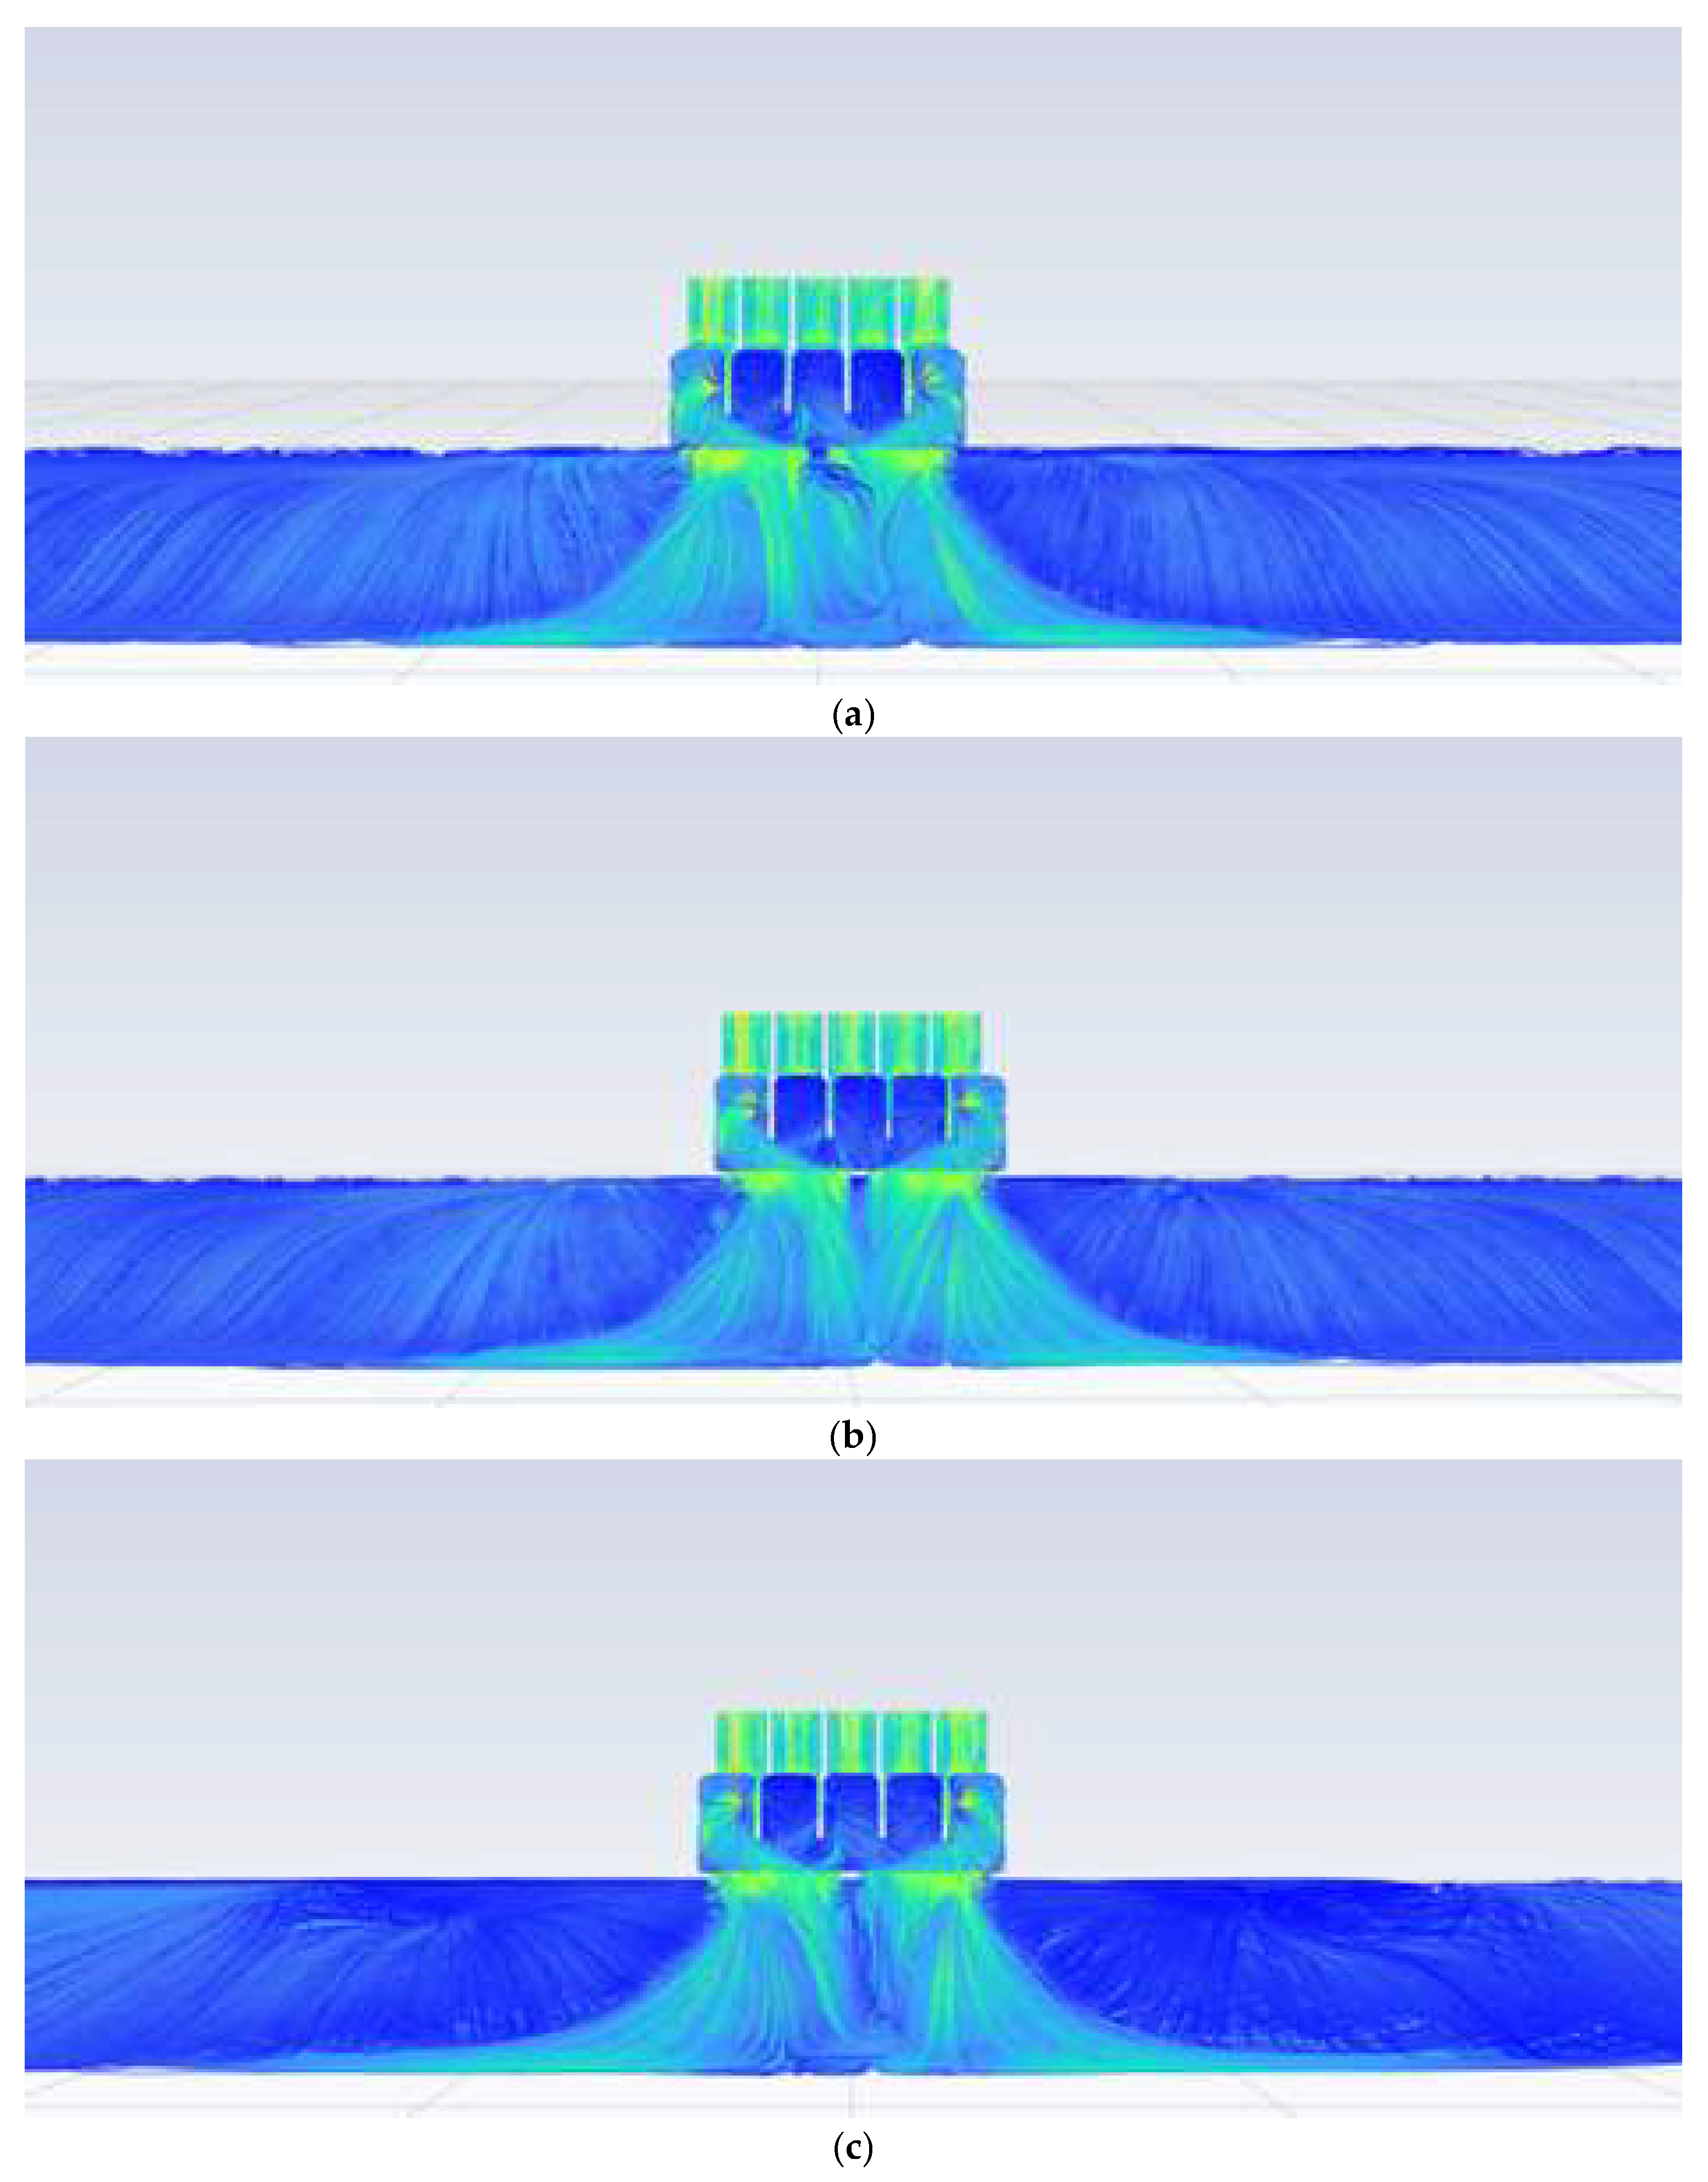
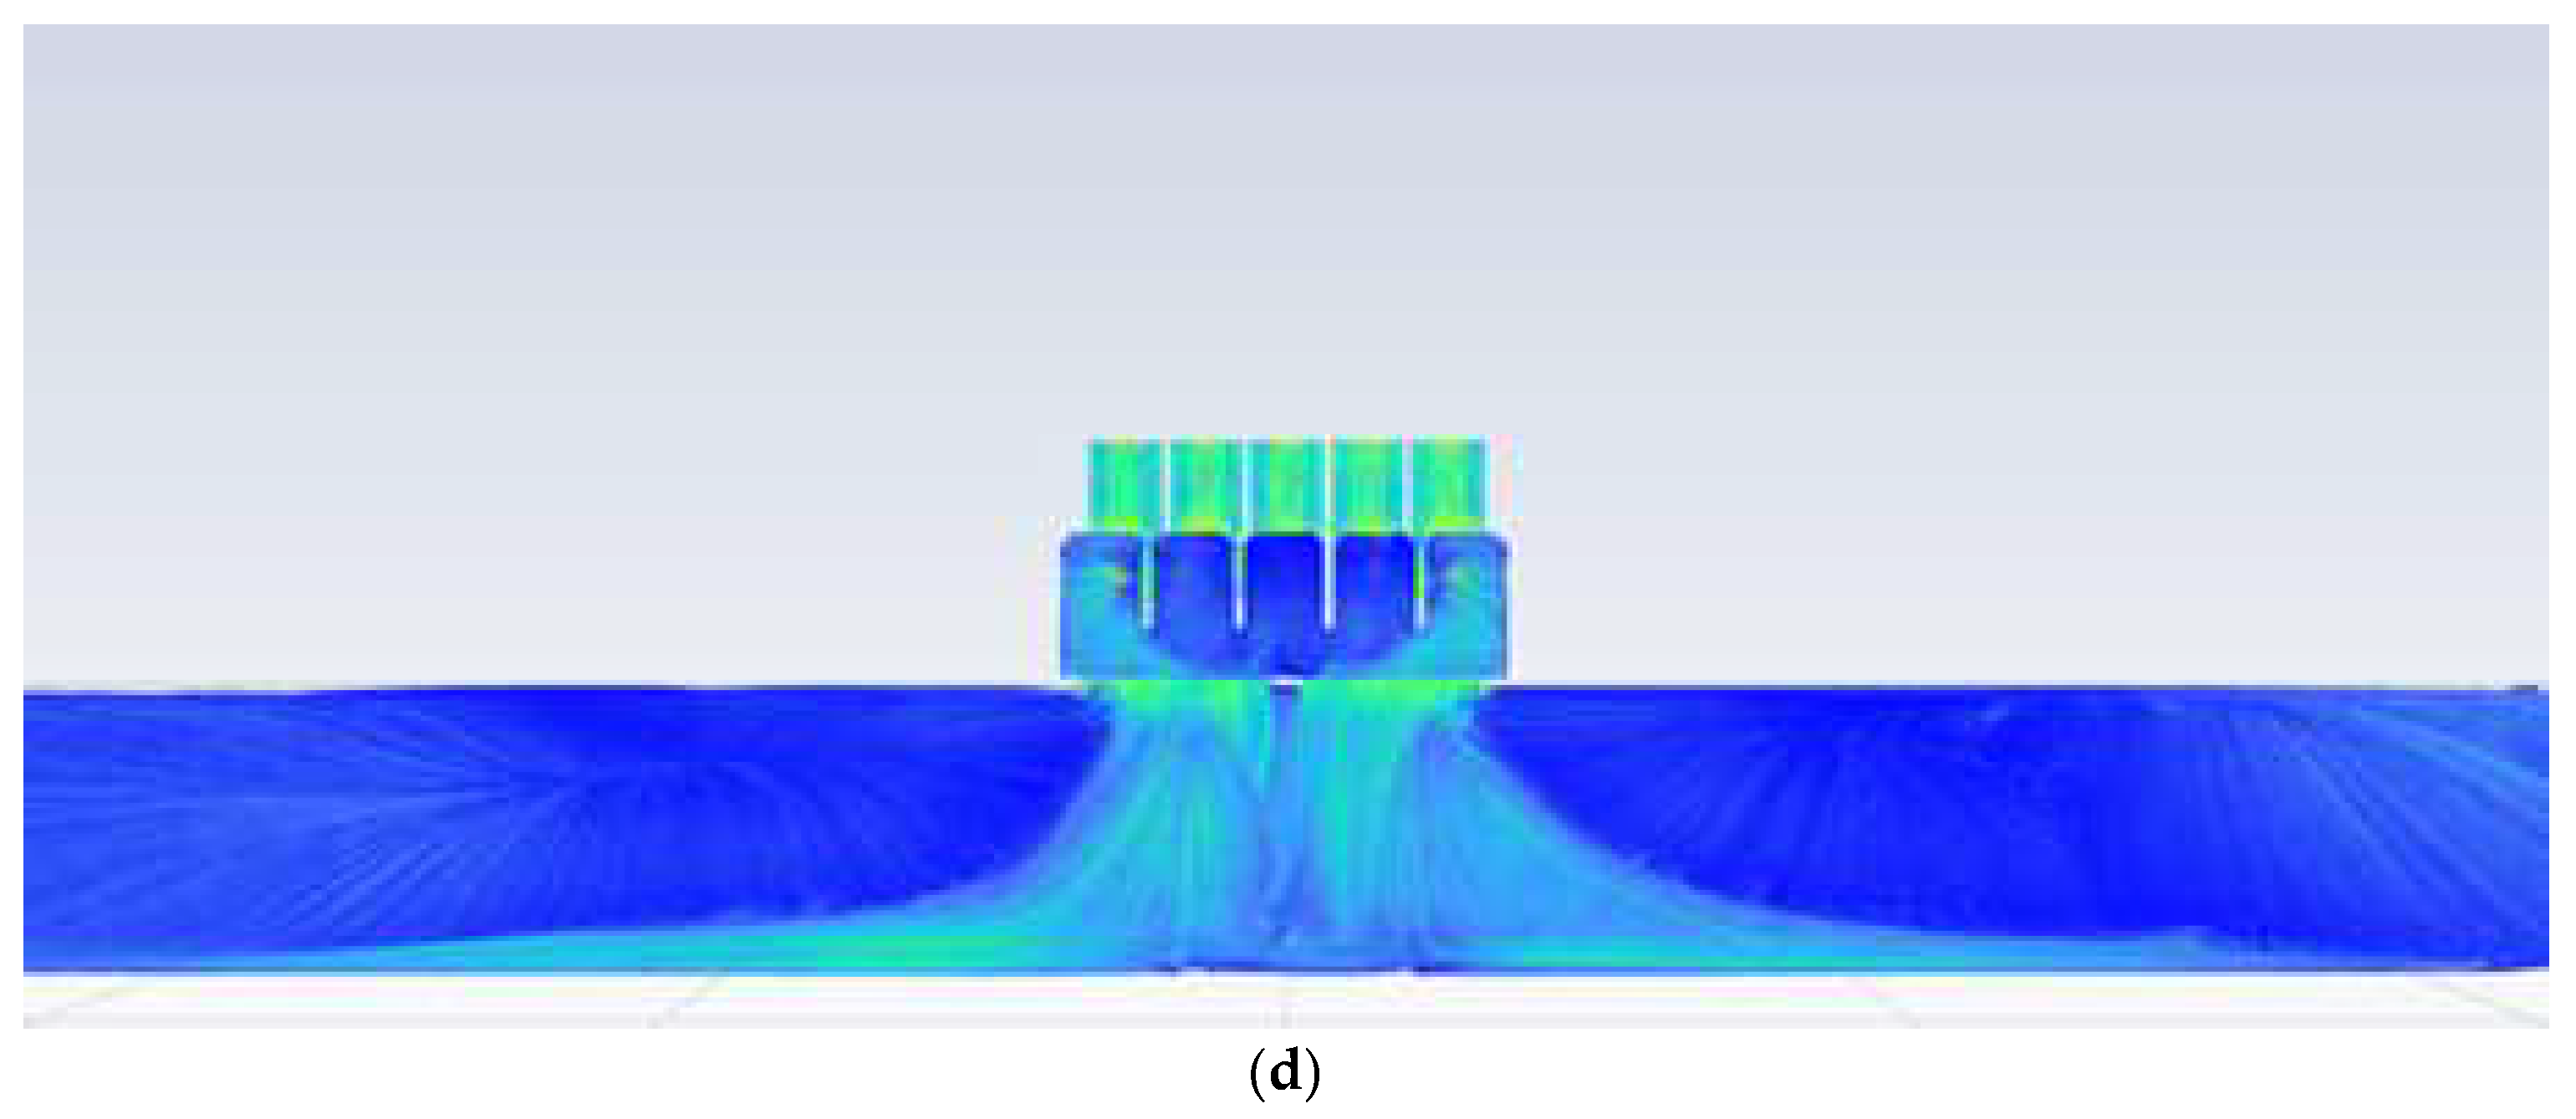
Figure 14.
Numerical analysis modeling.
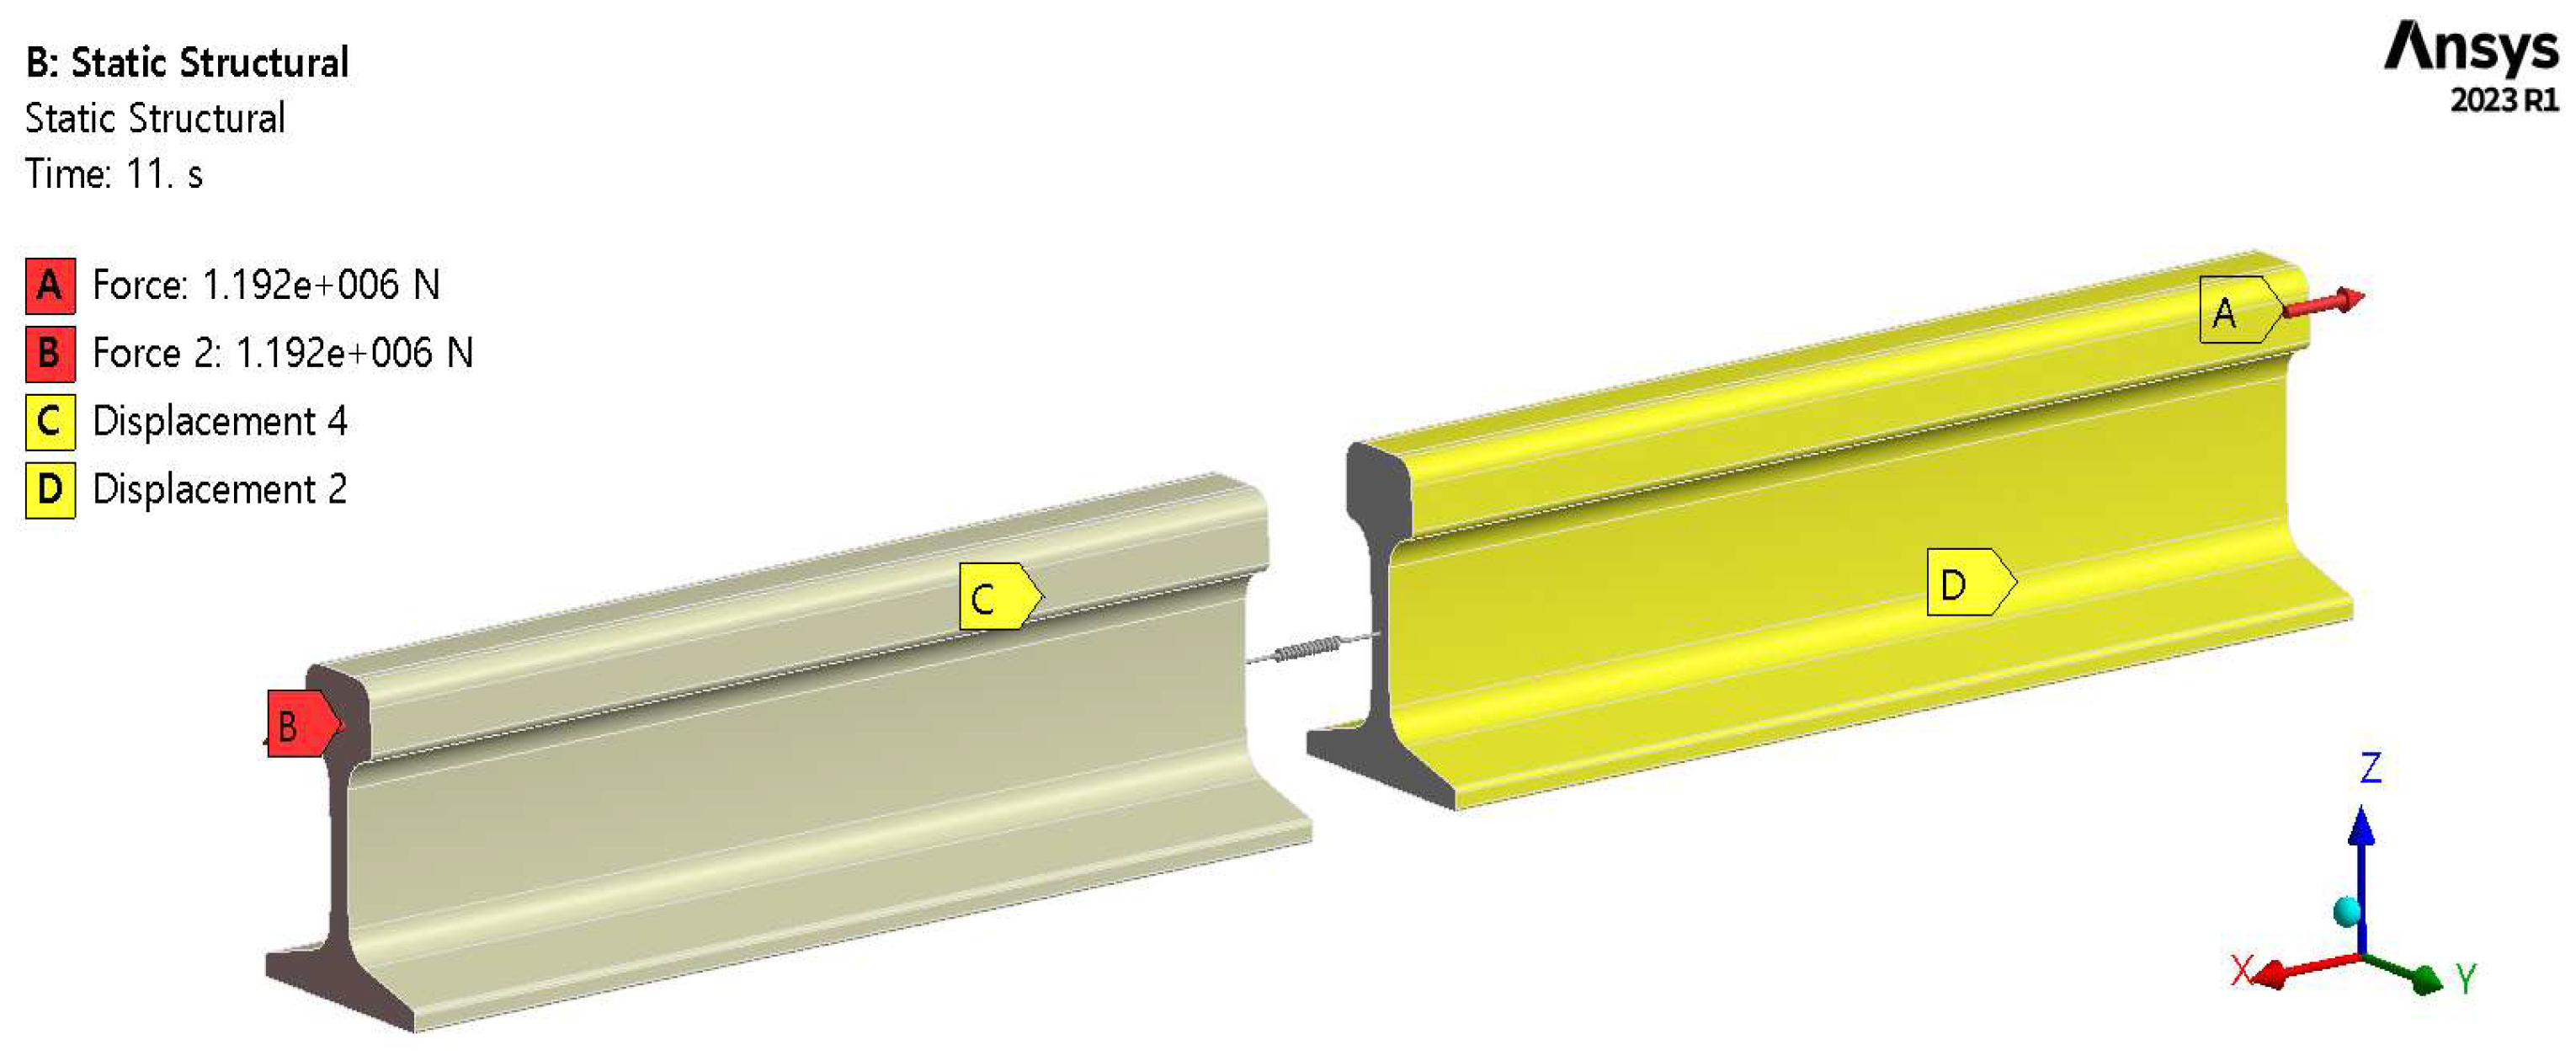
Figure 15.
Numerical analysis load conditions.
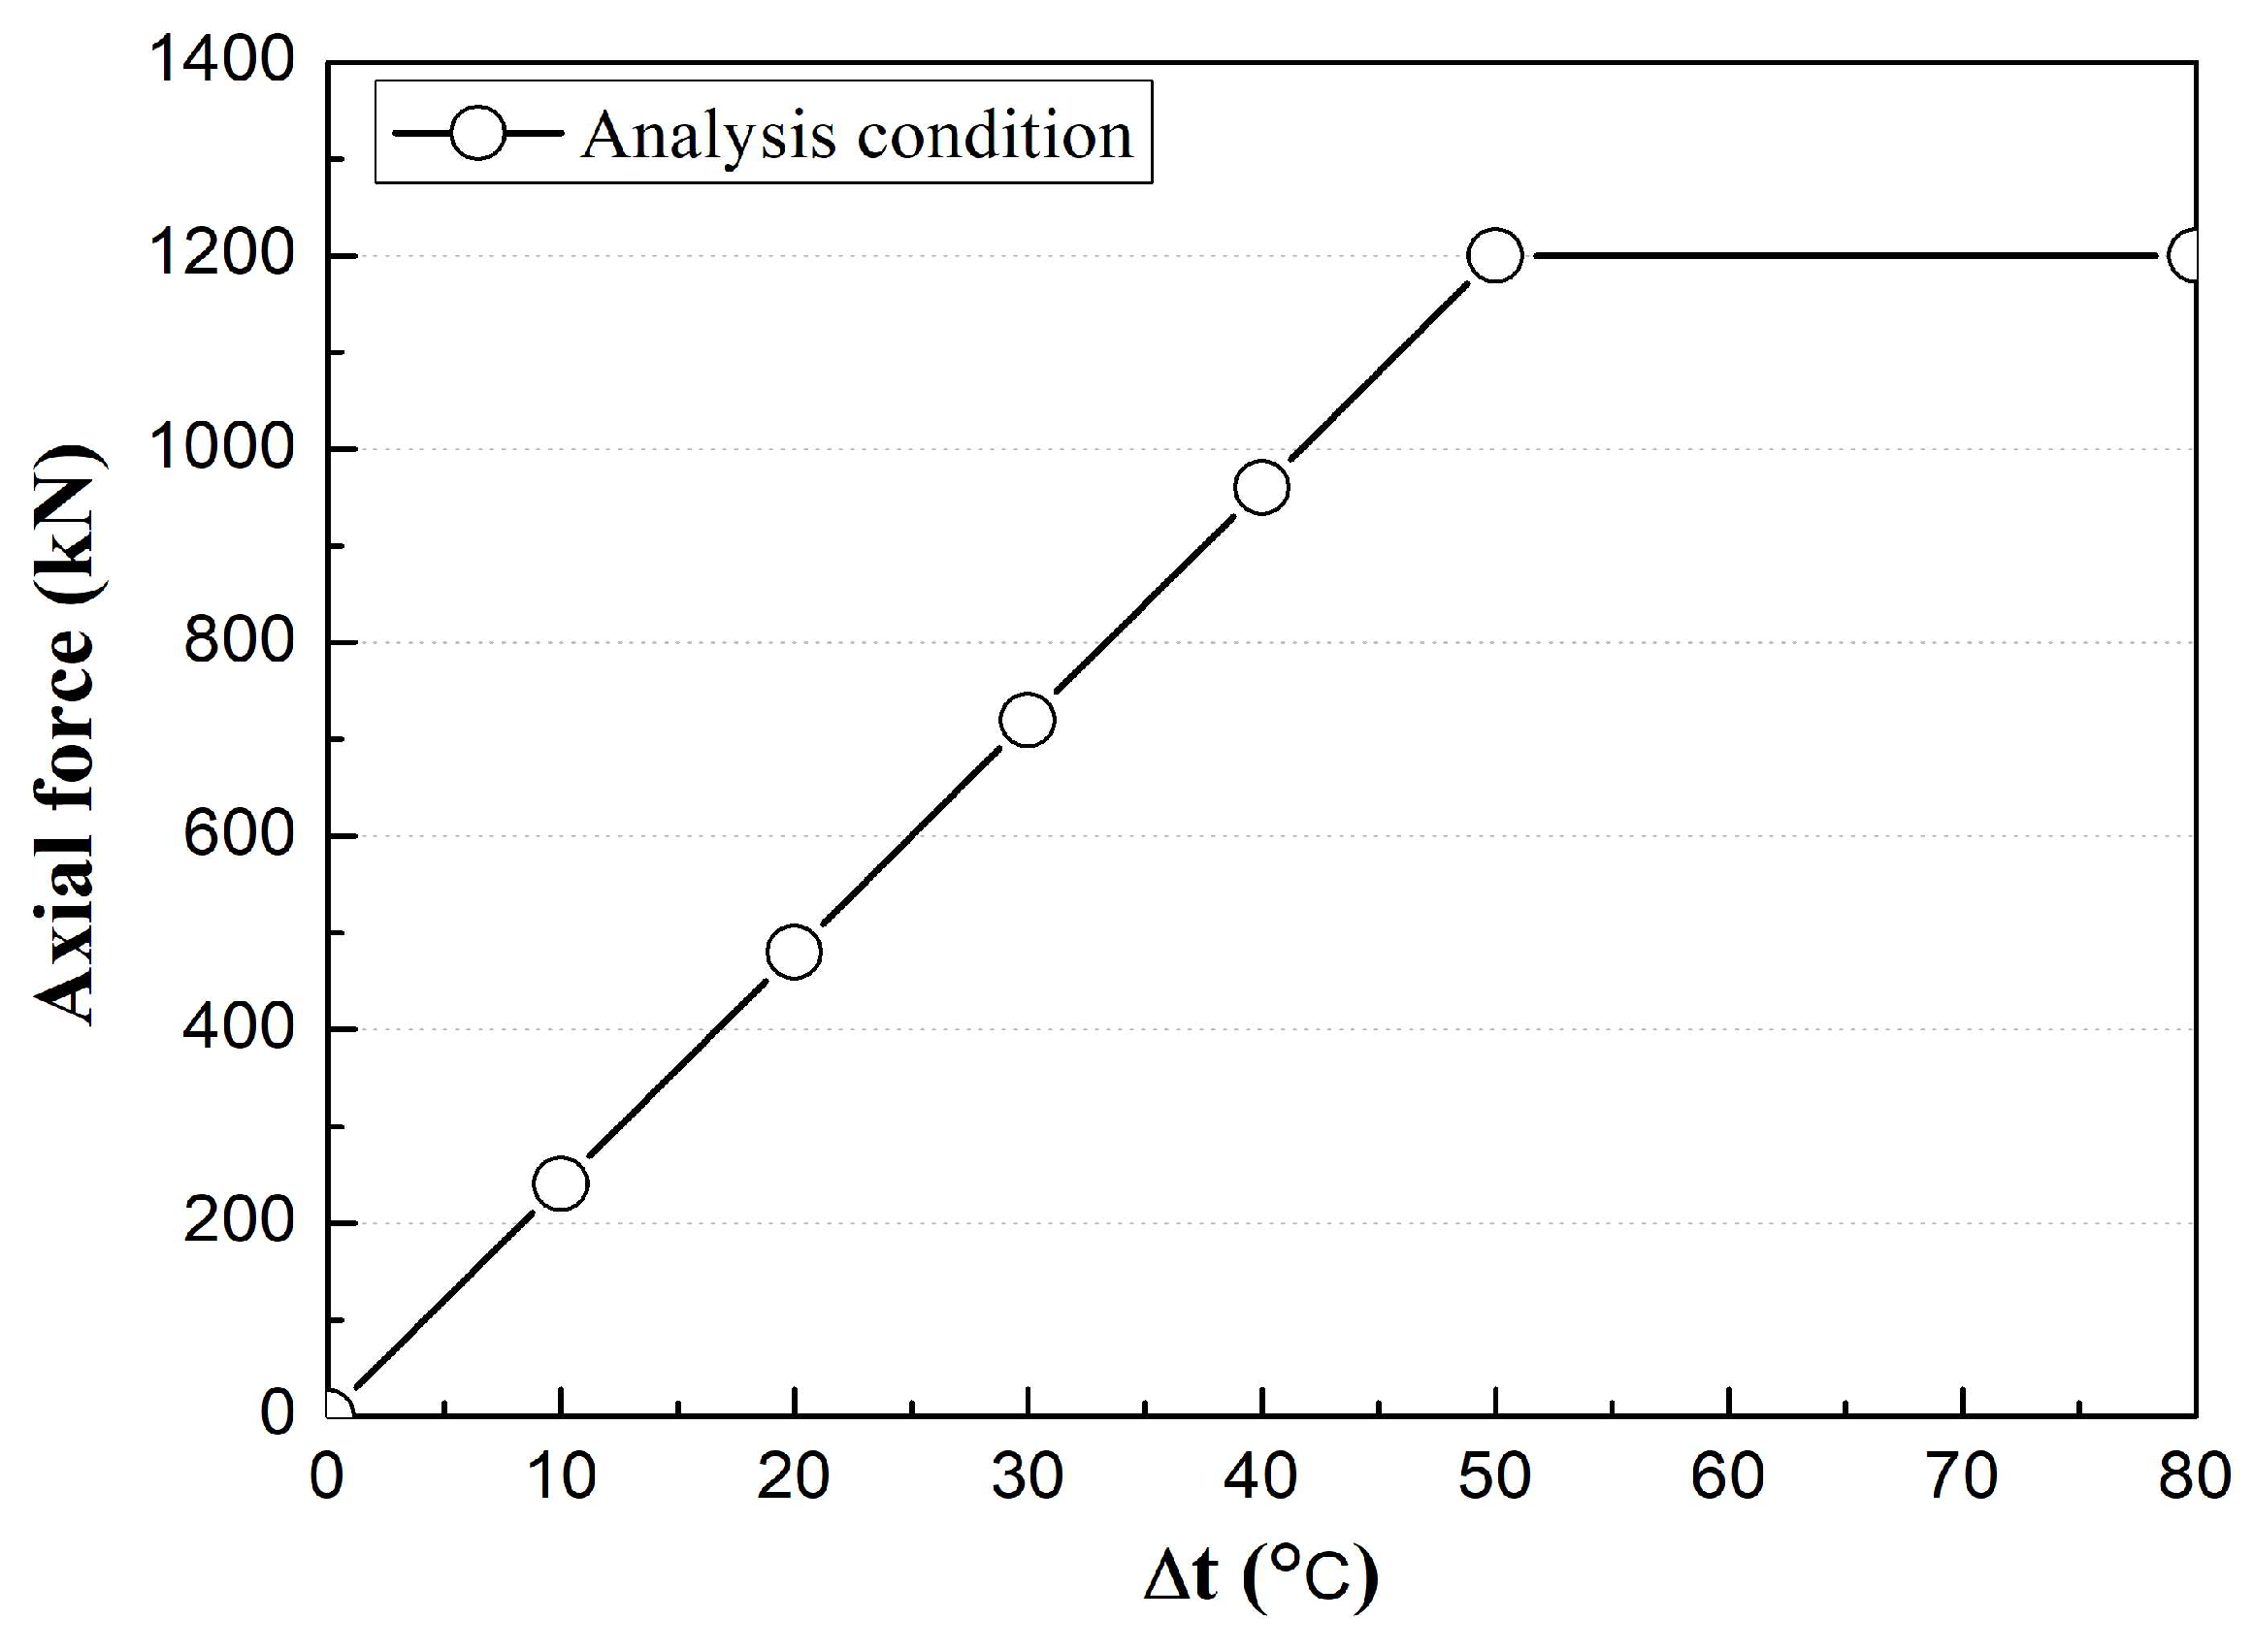
Figure 16.
Displacement analysis of the welded joint attributed to the rail axial force: (a) Left-side displacement of the welded joint; (b) right-side displacement of the welded joint.
Figure 16.
Displacement analysis of the welded joint attributed to the rail axial force: (a) Left-side displacement of the welded joint; (b) right-side displacement of the welded joint.
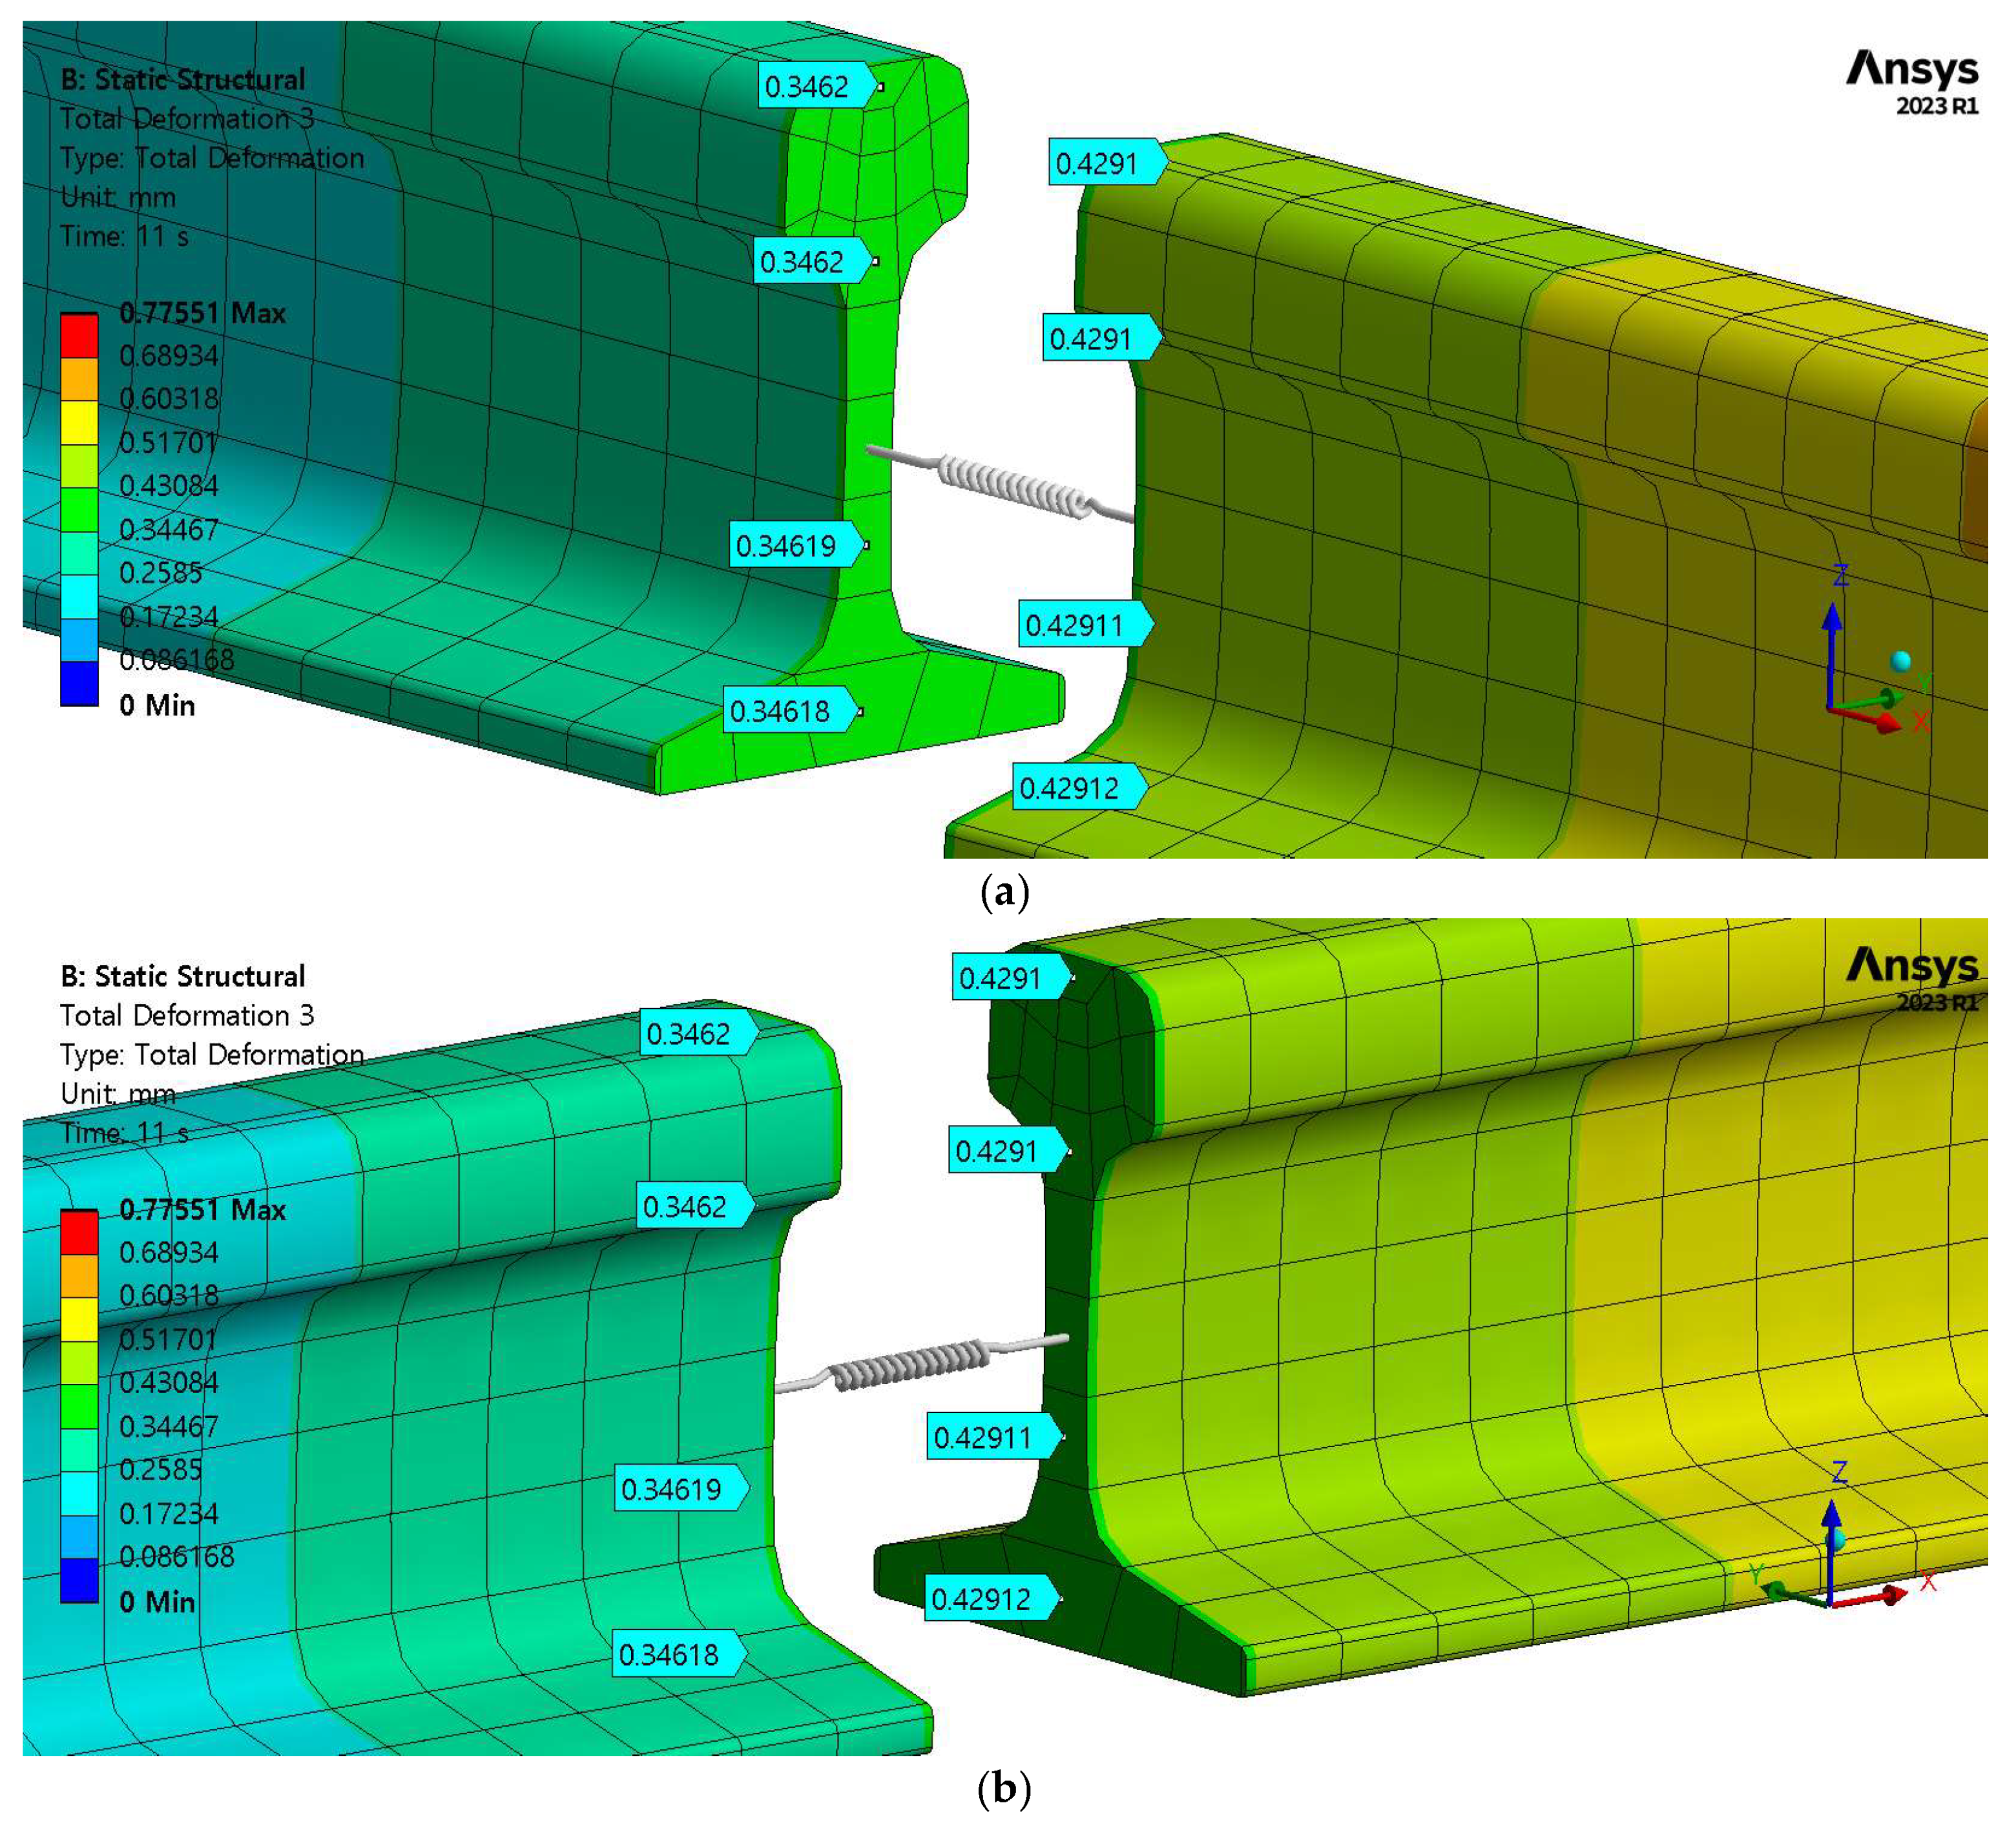
Figure 17.
Displacement analysis of rail fracture under axial load.
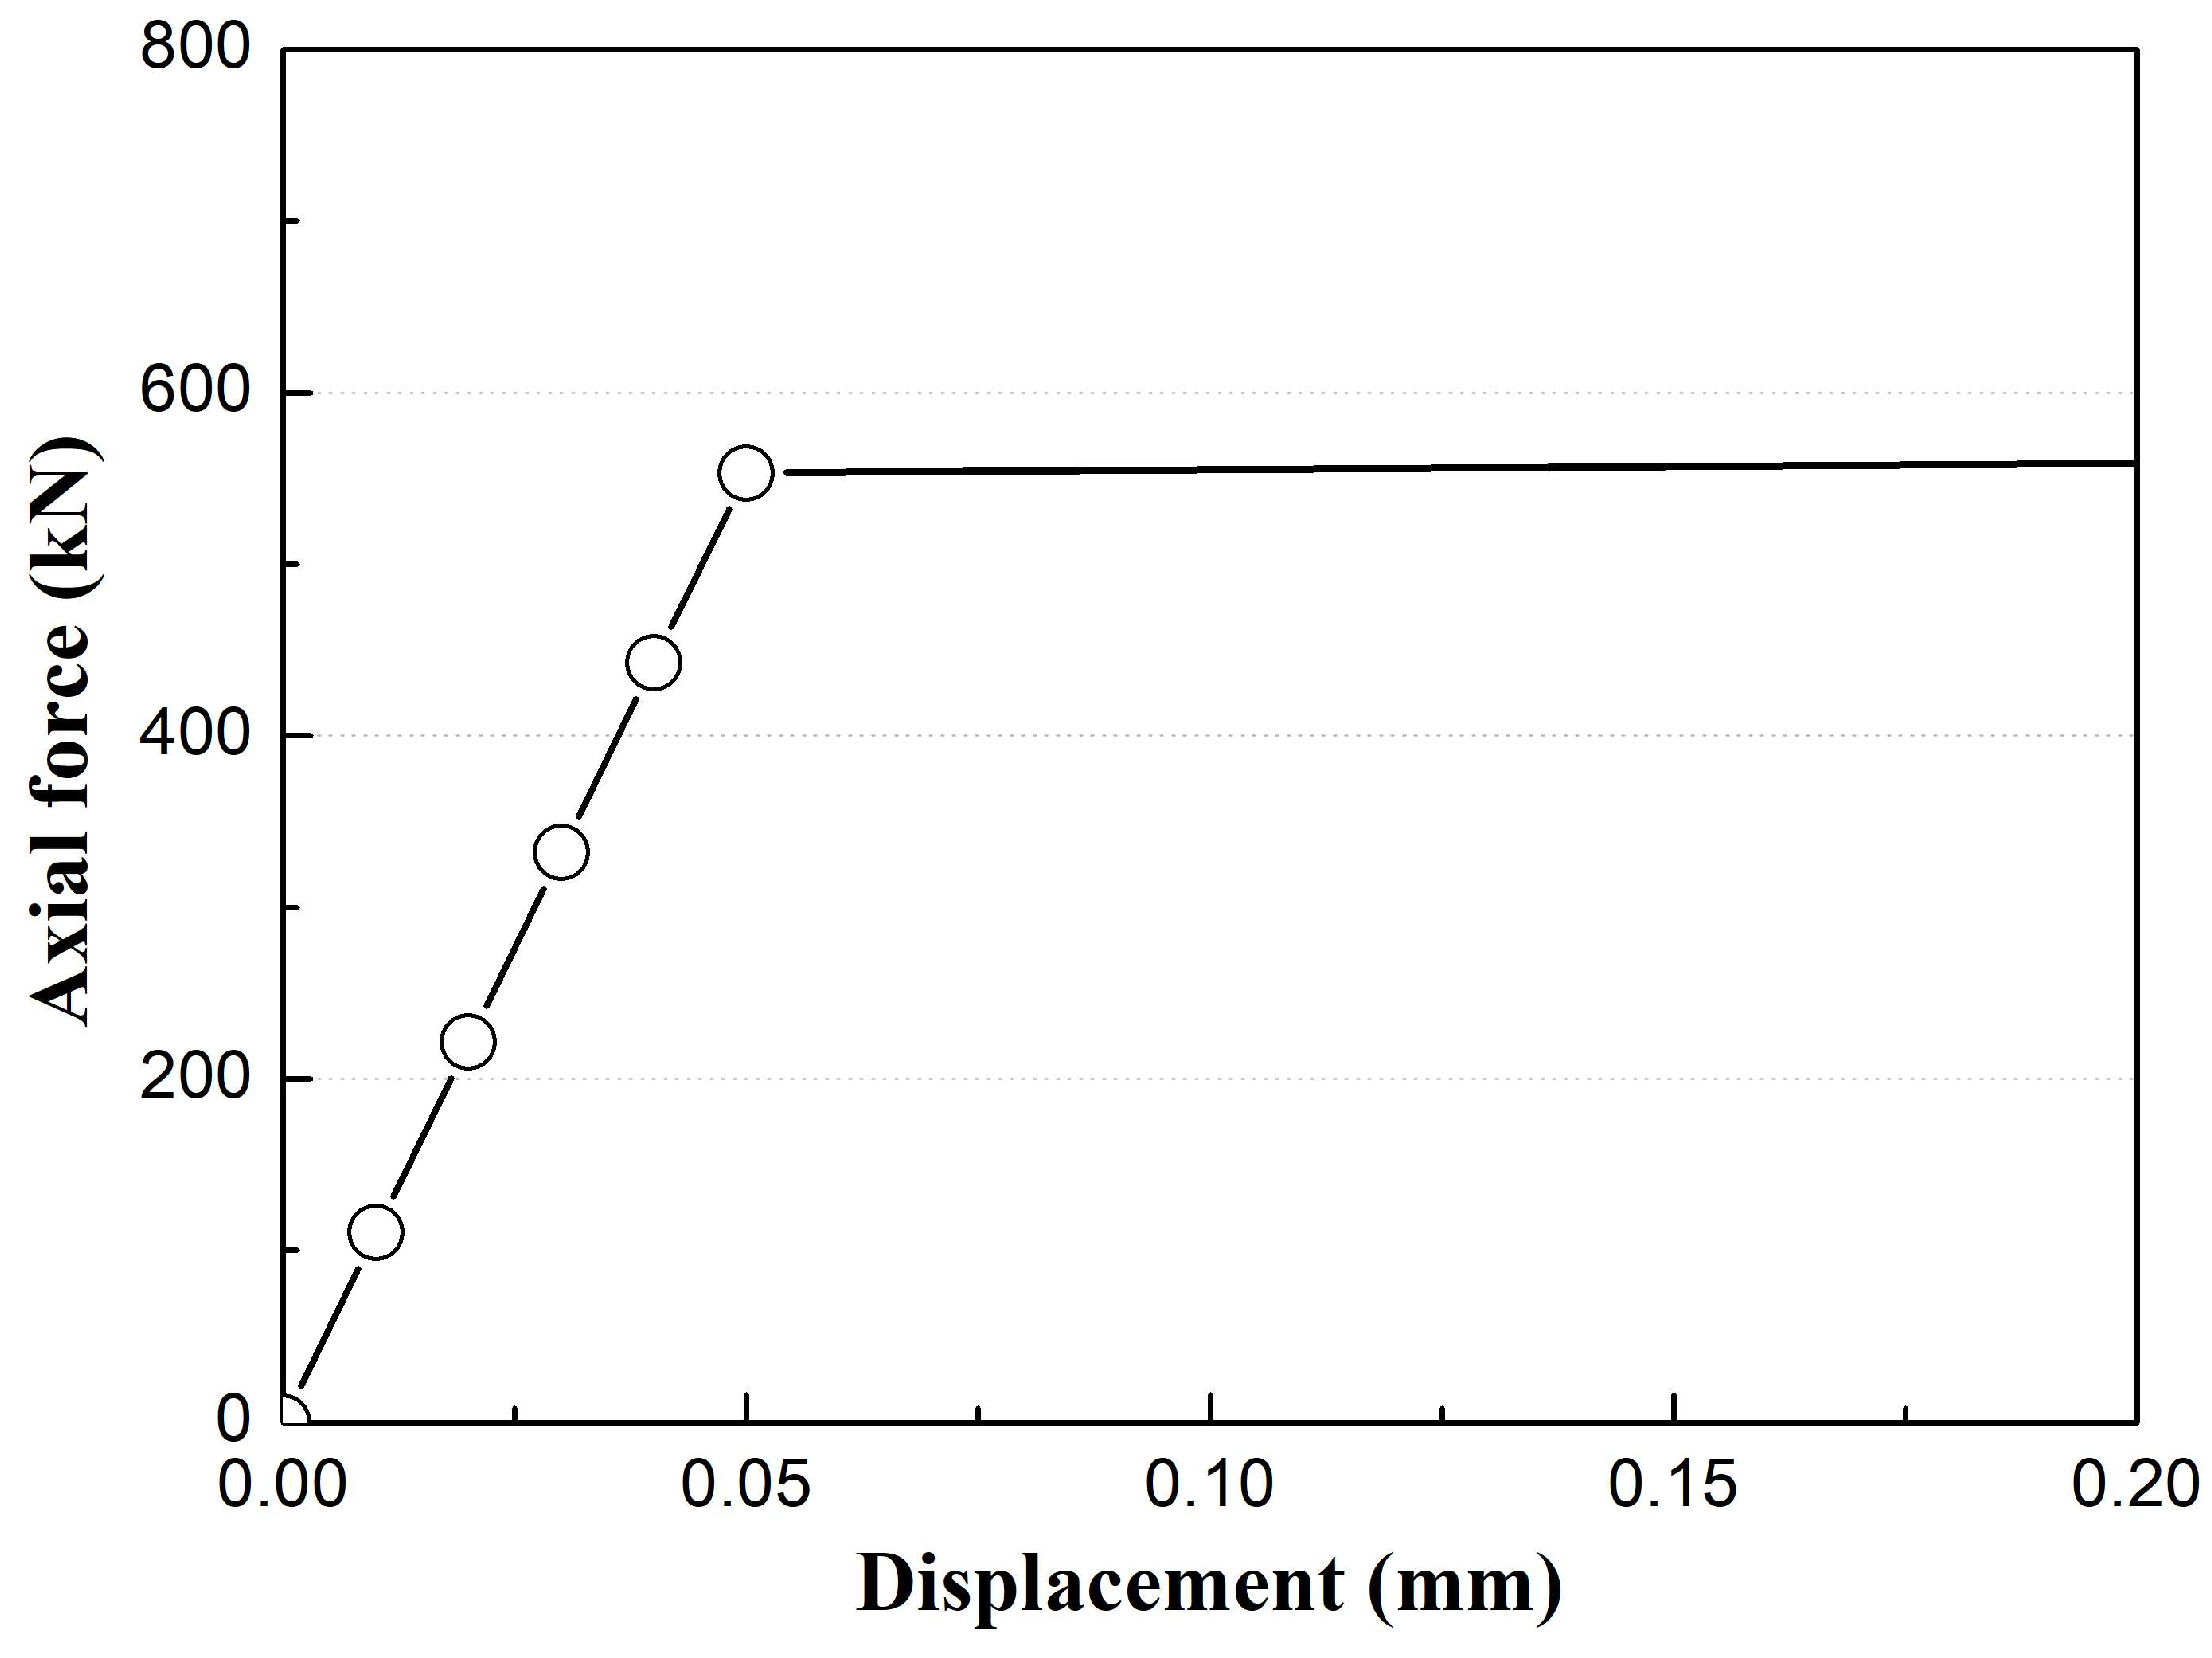
Figure 18.
Analysis of rail temperature variations caused by axial load.
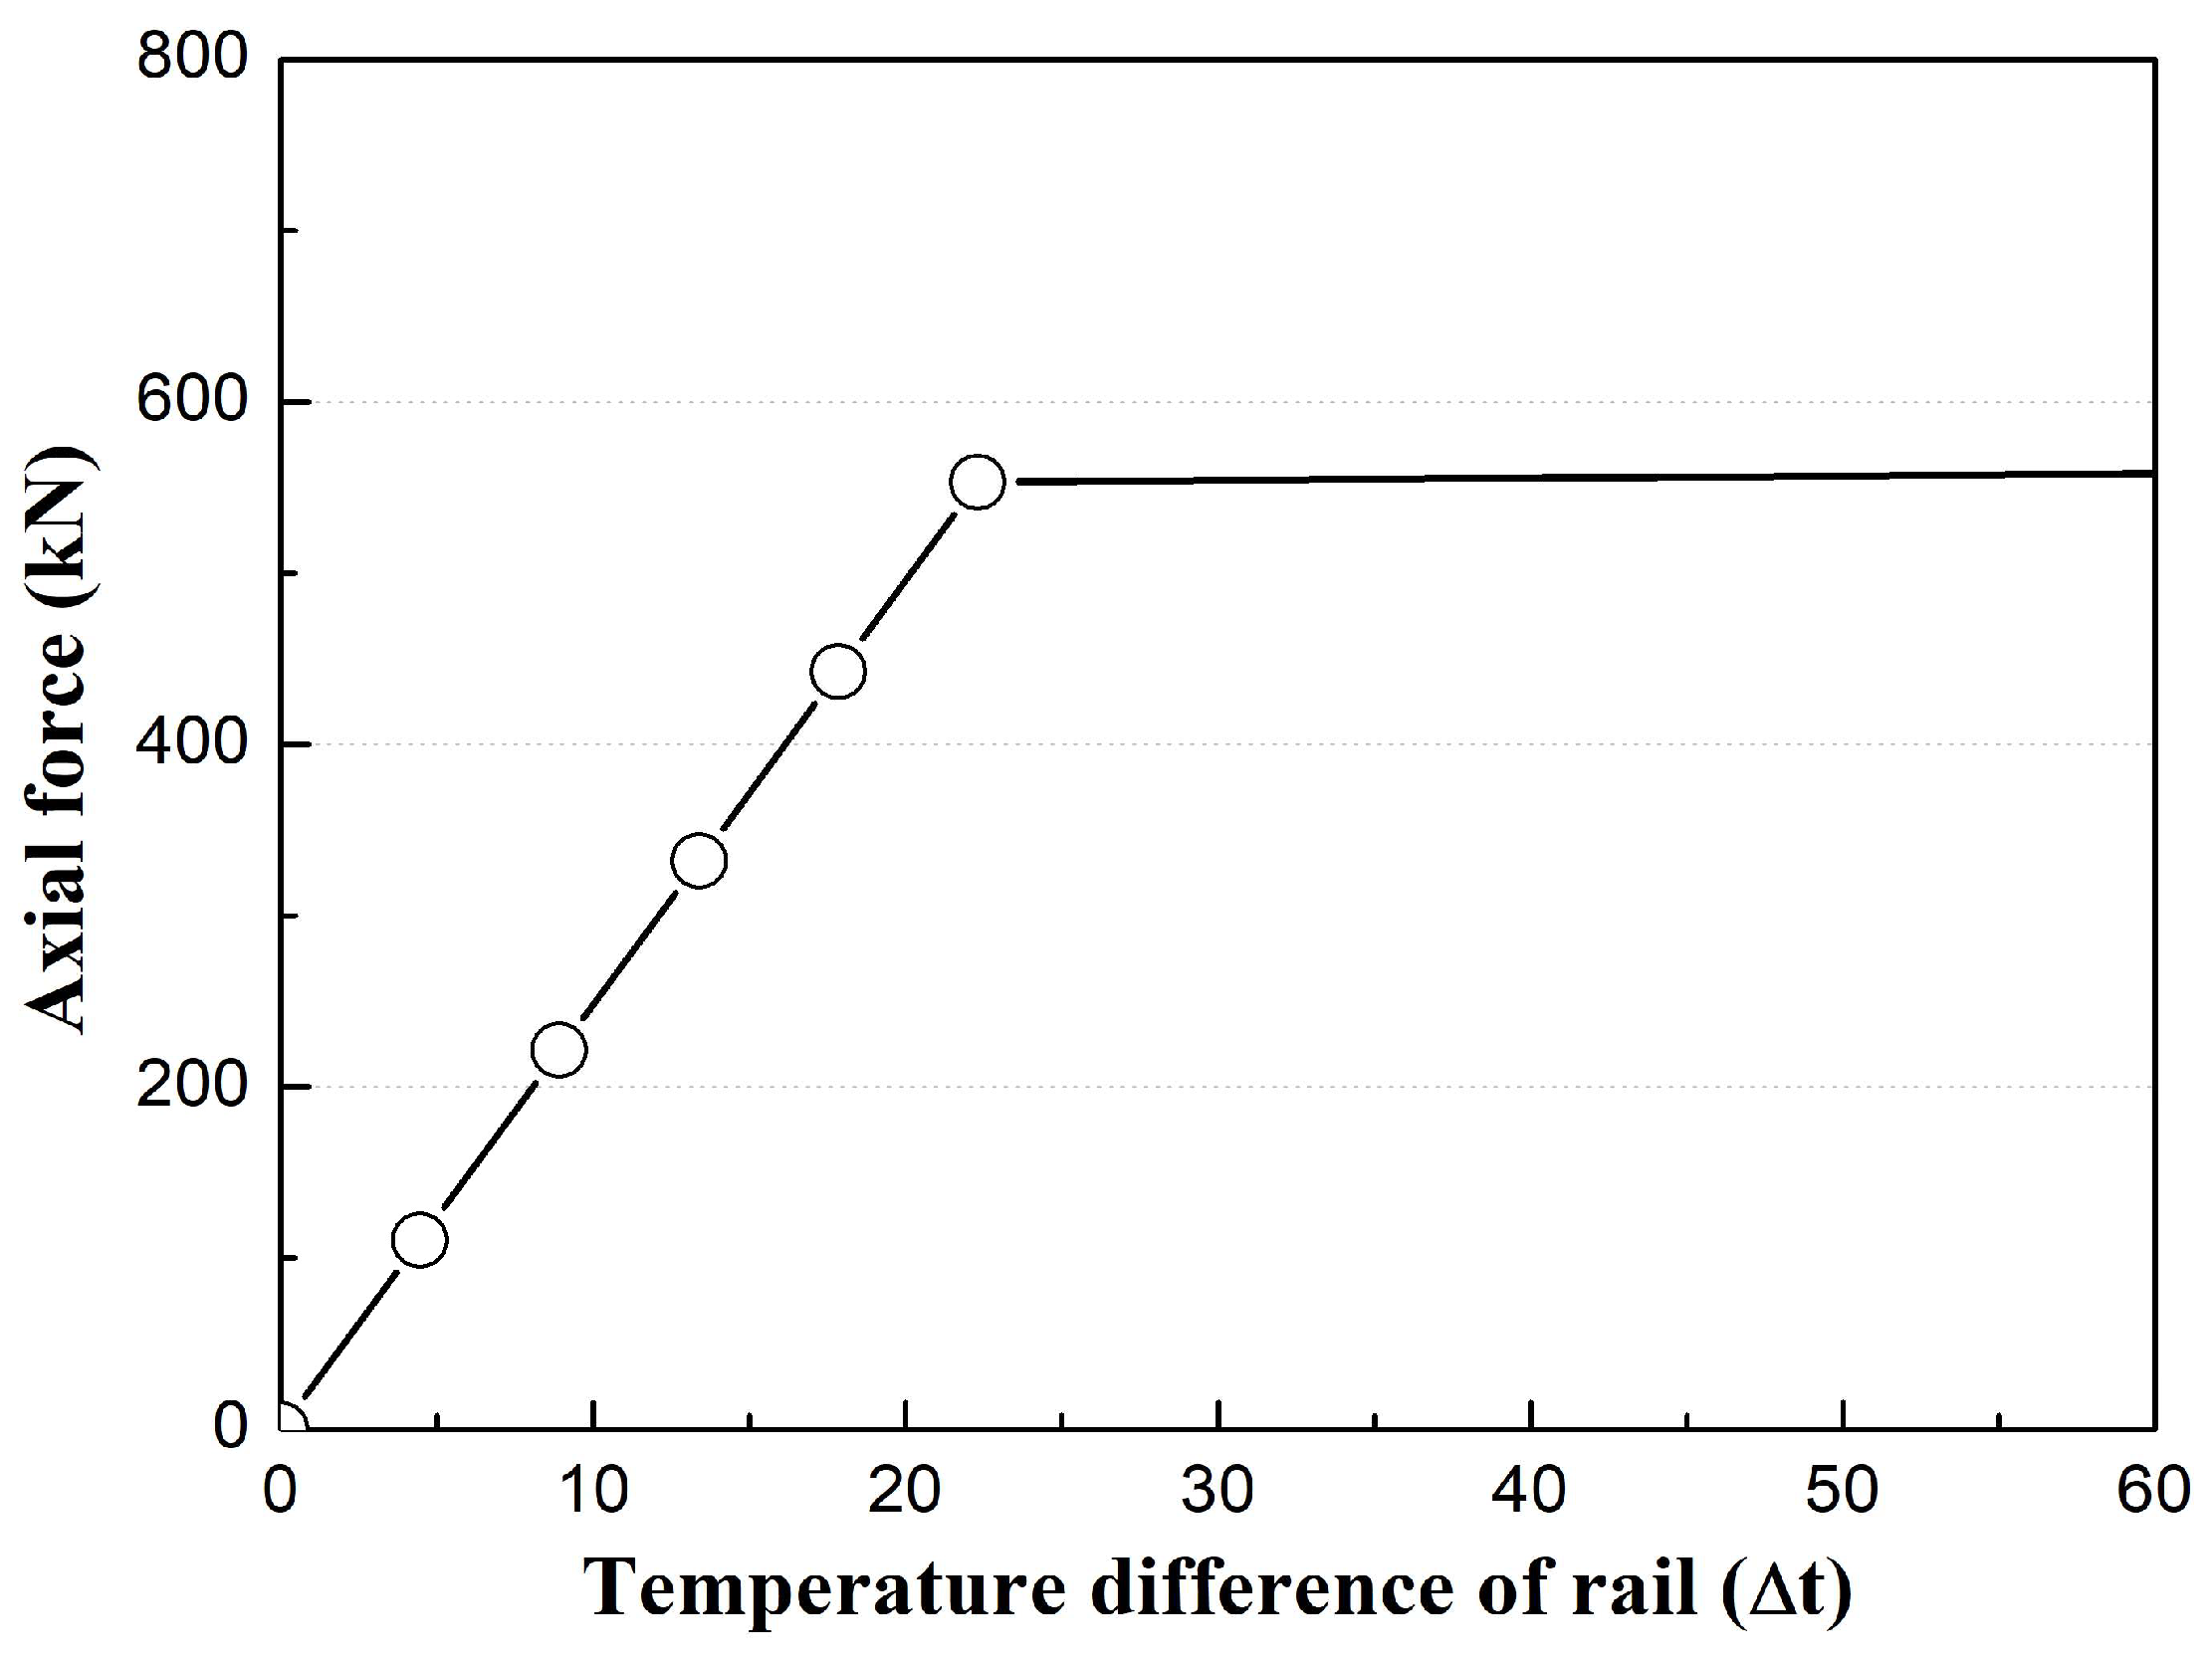
Figure 19.
Temperature influence range near ventilation shafts.
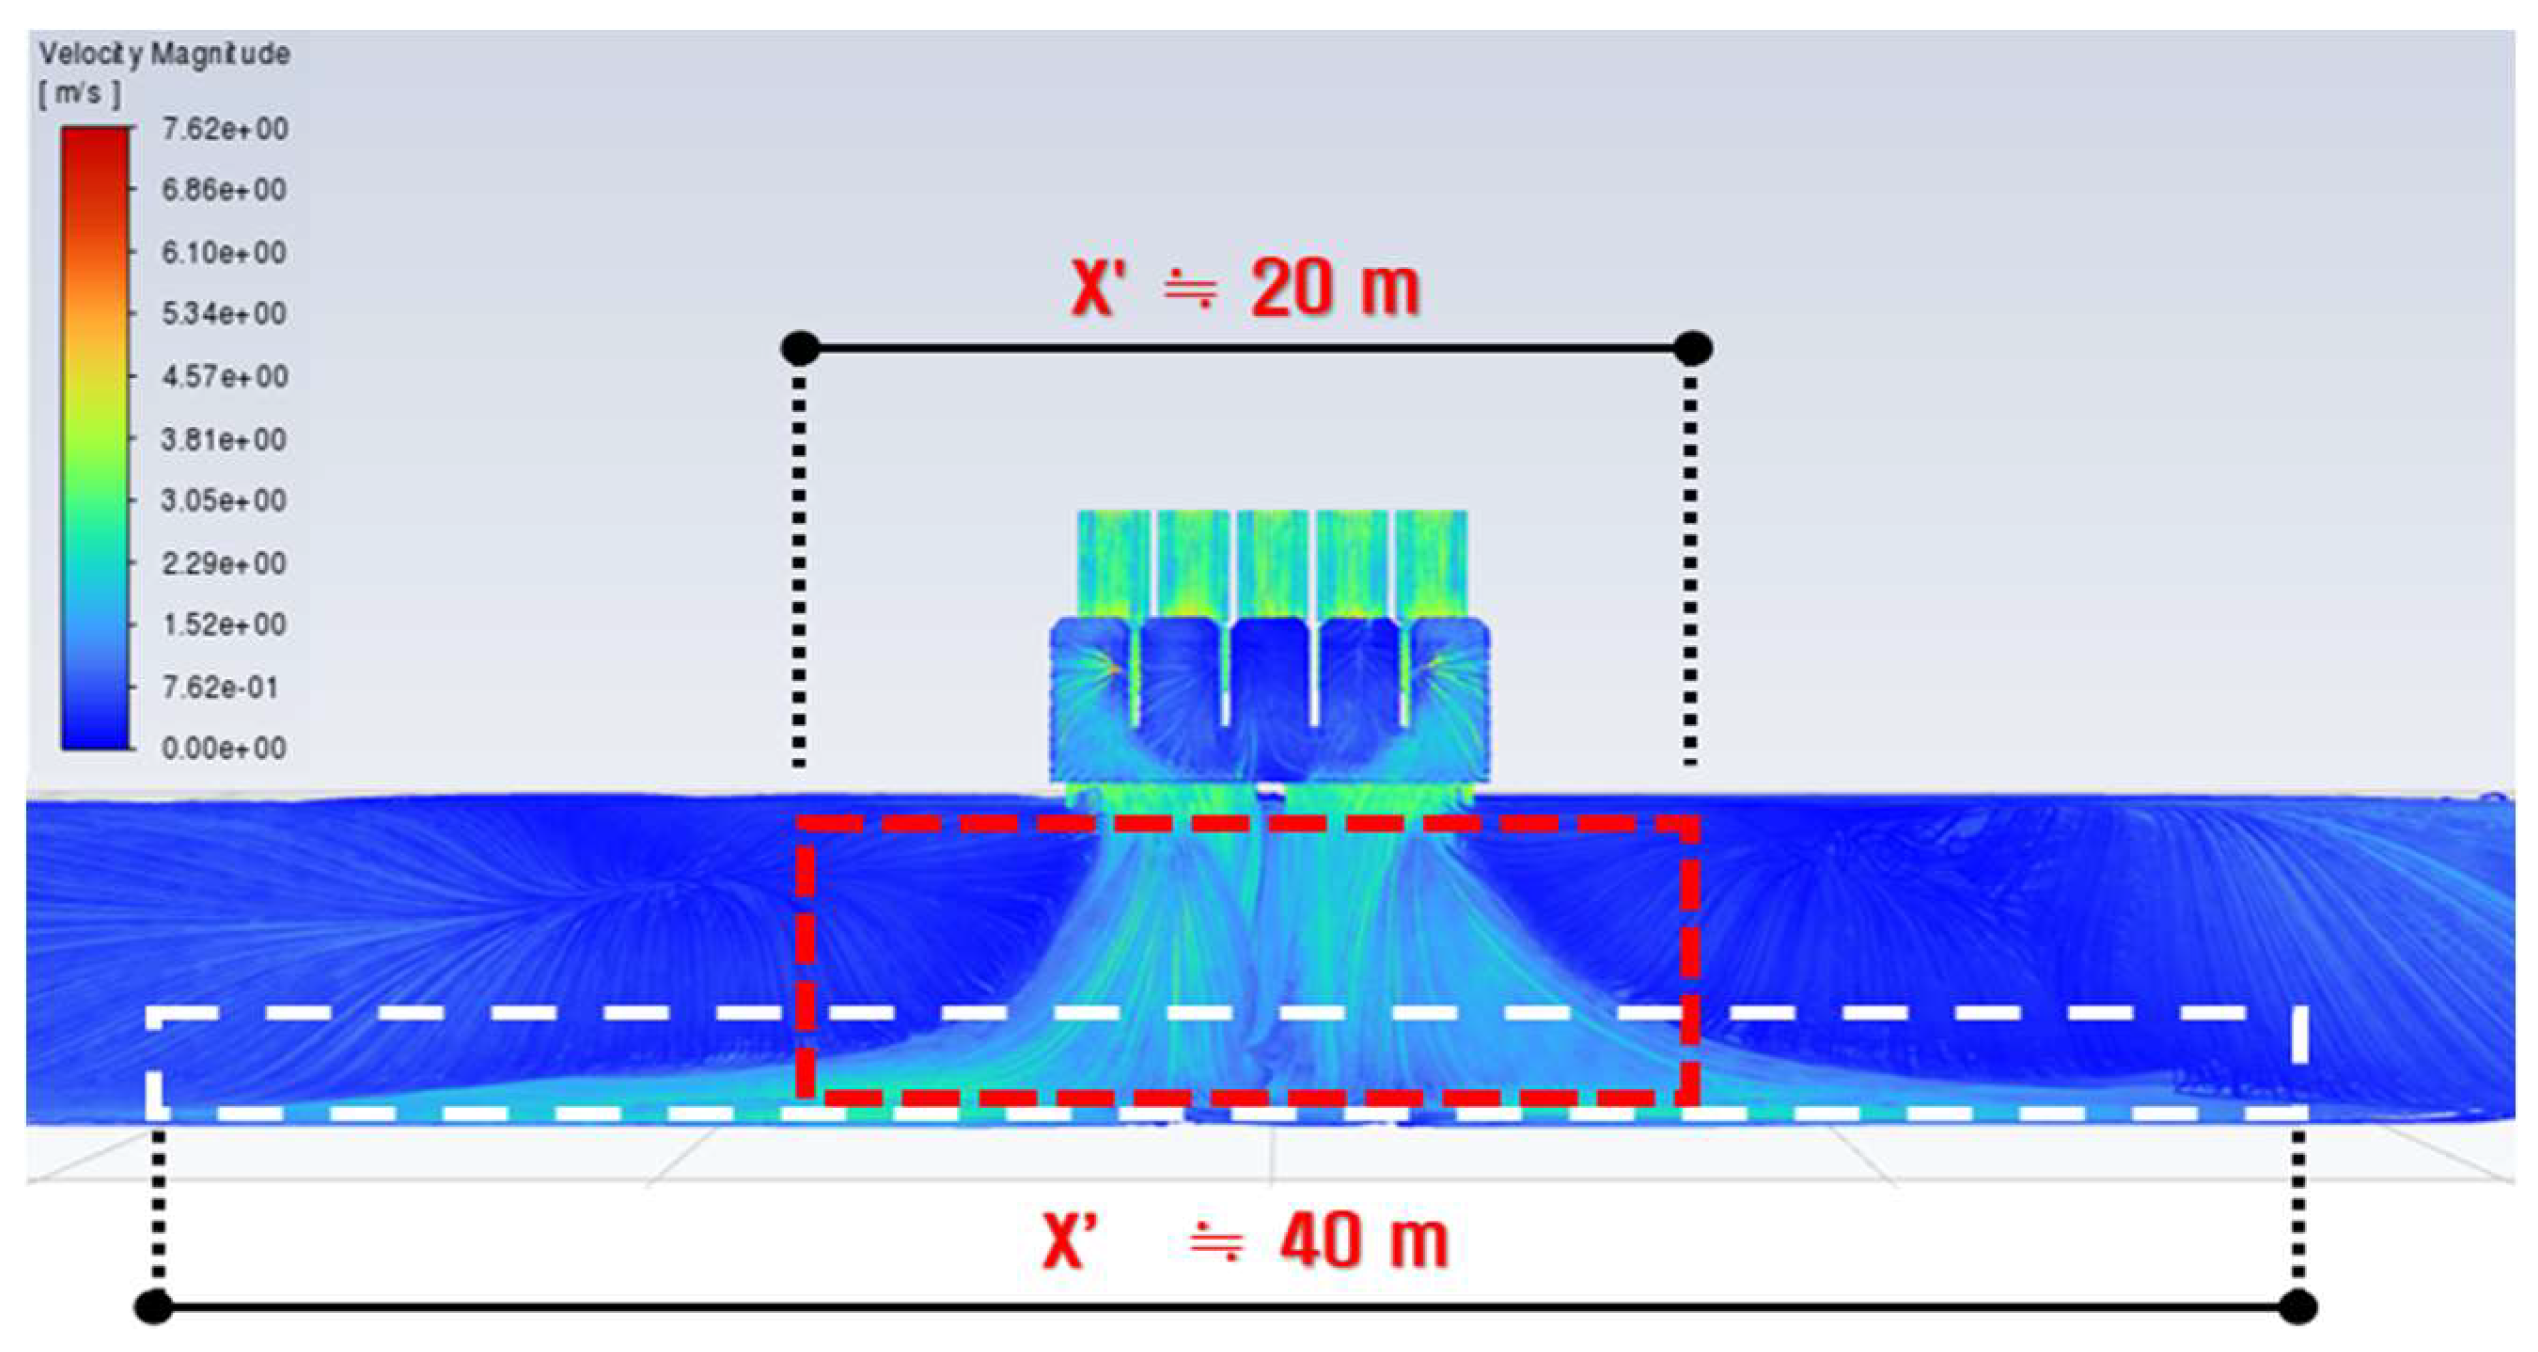
Figure 20.
CWR weld fracture near ventilation shaft.
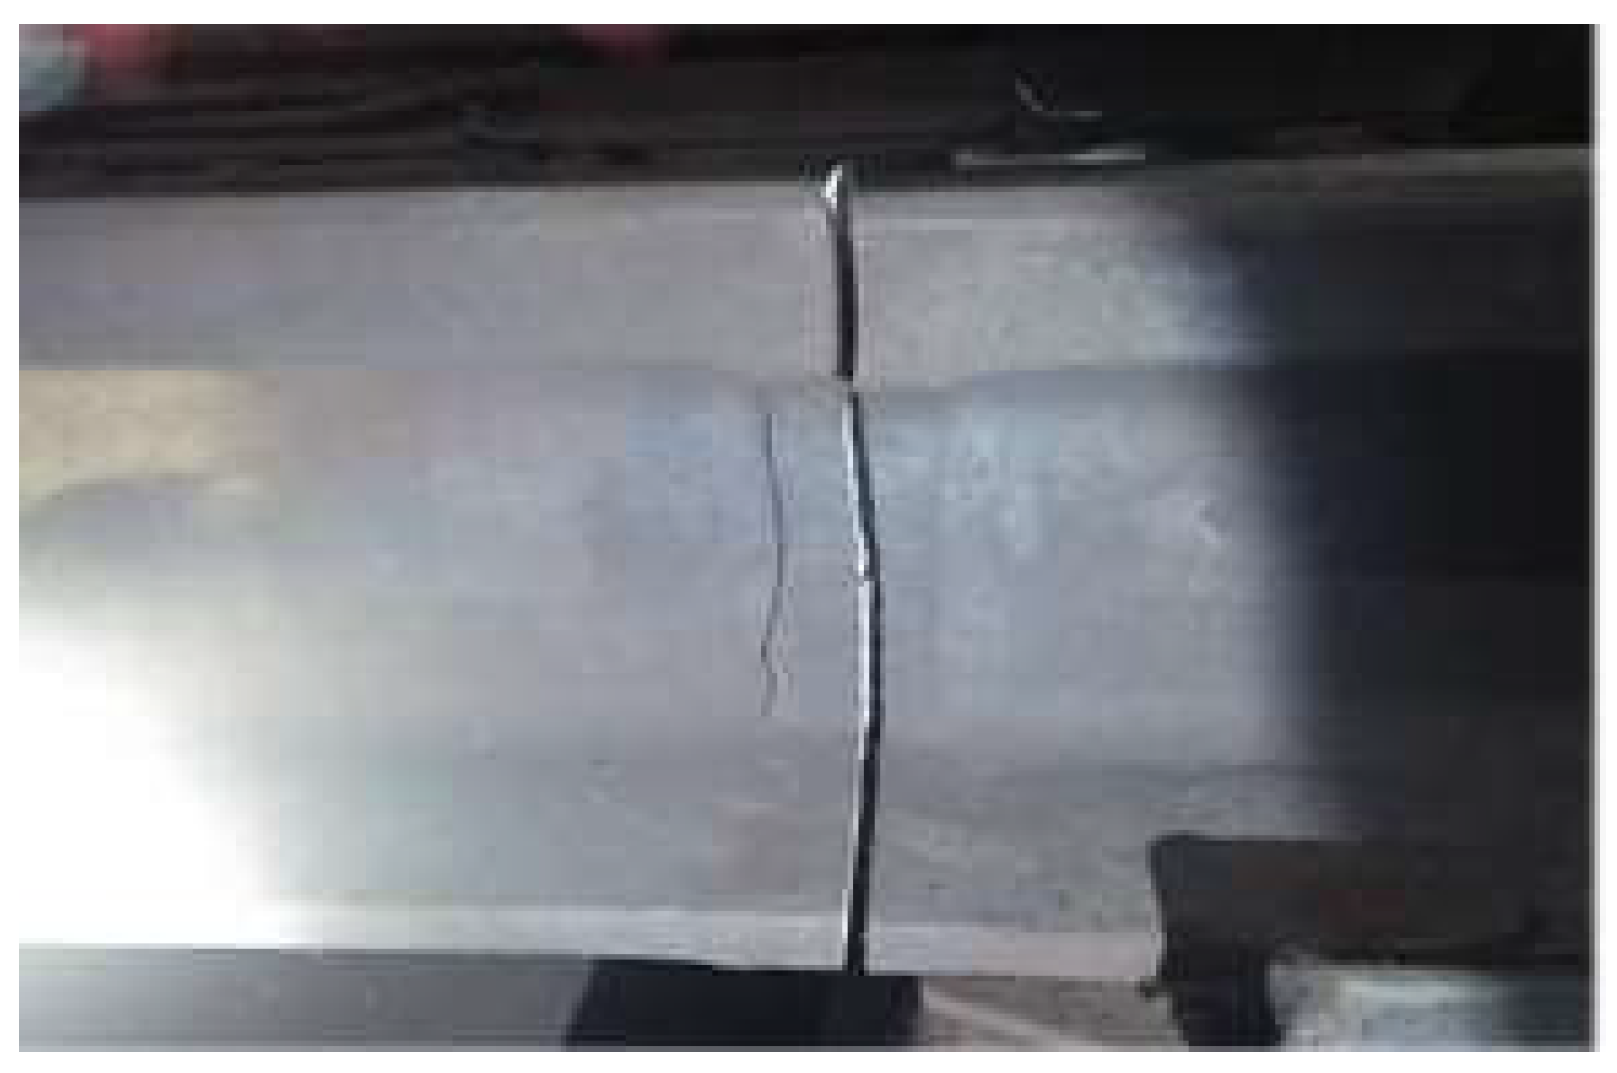
Figure 21.
Rail axial force and weld displacement during fracture.
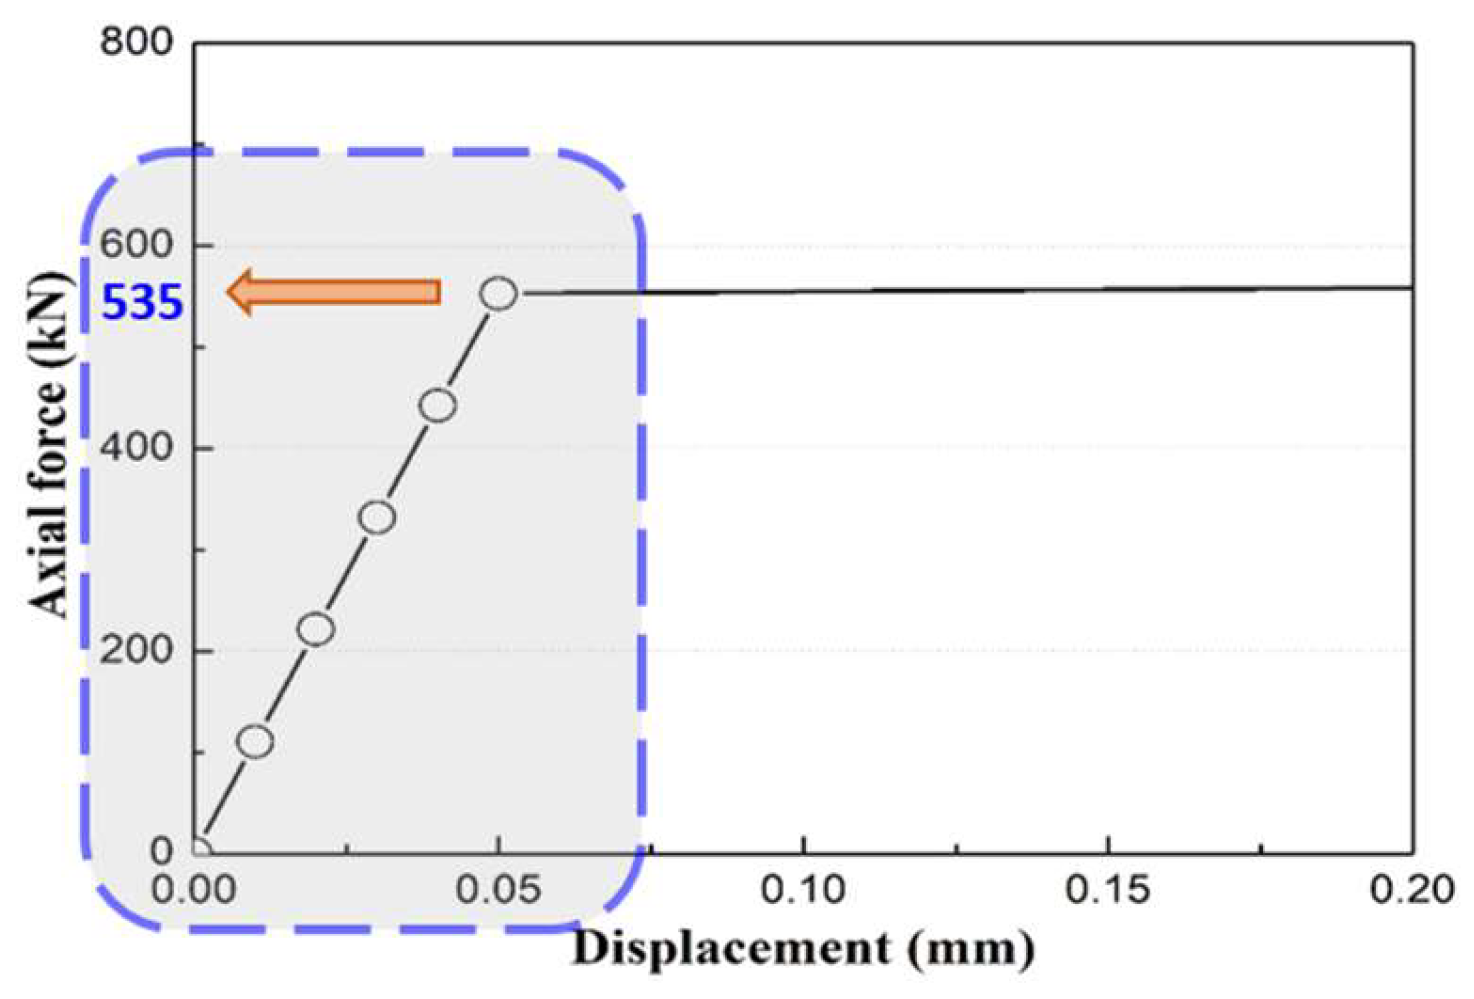
Figure 22.
Axial stress vs. rail fracture temperature variation.
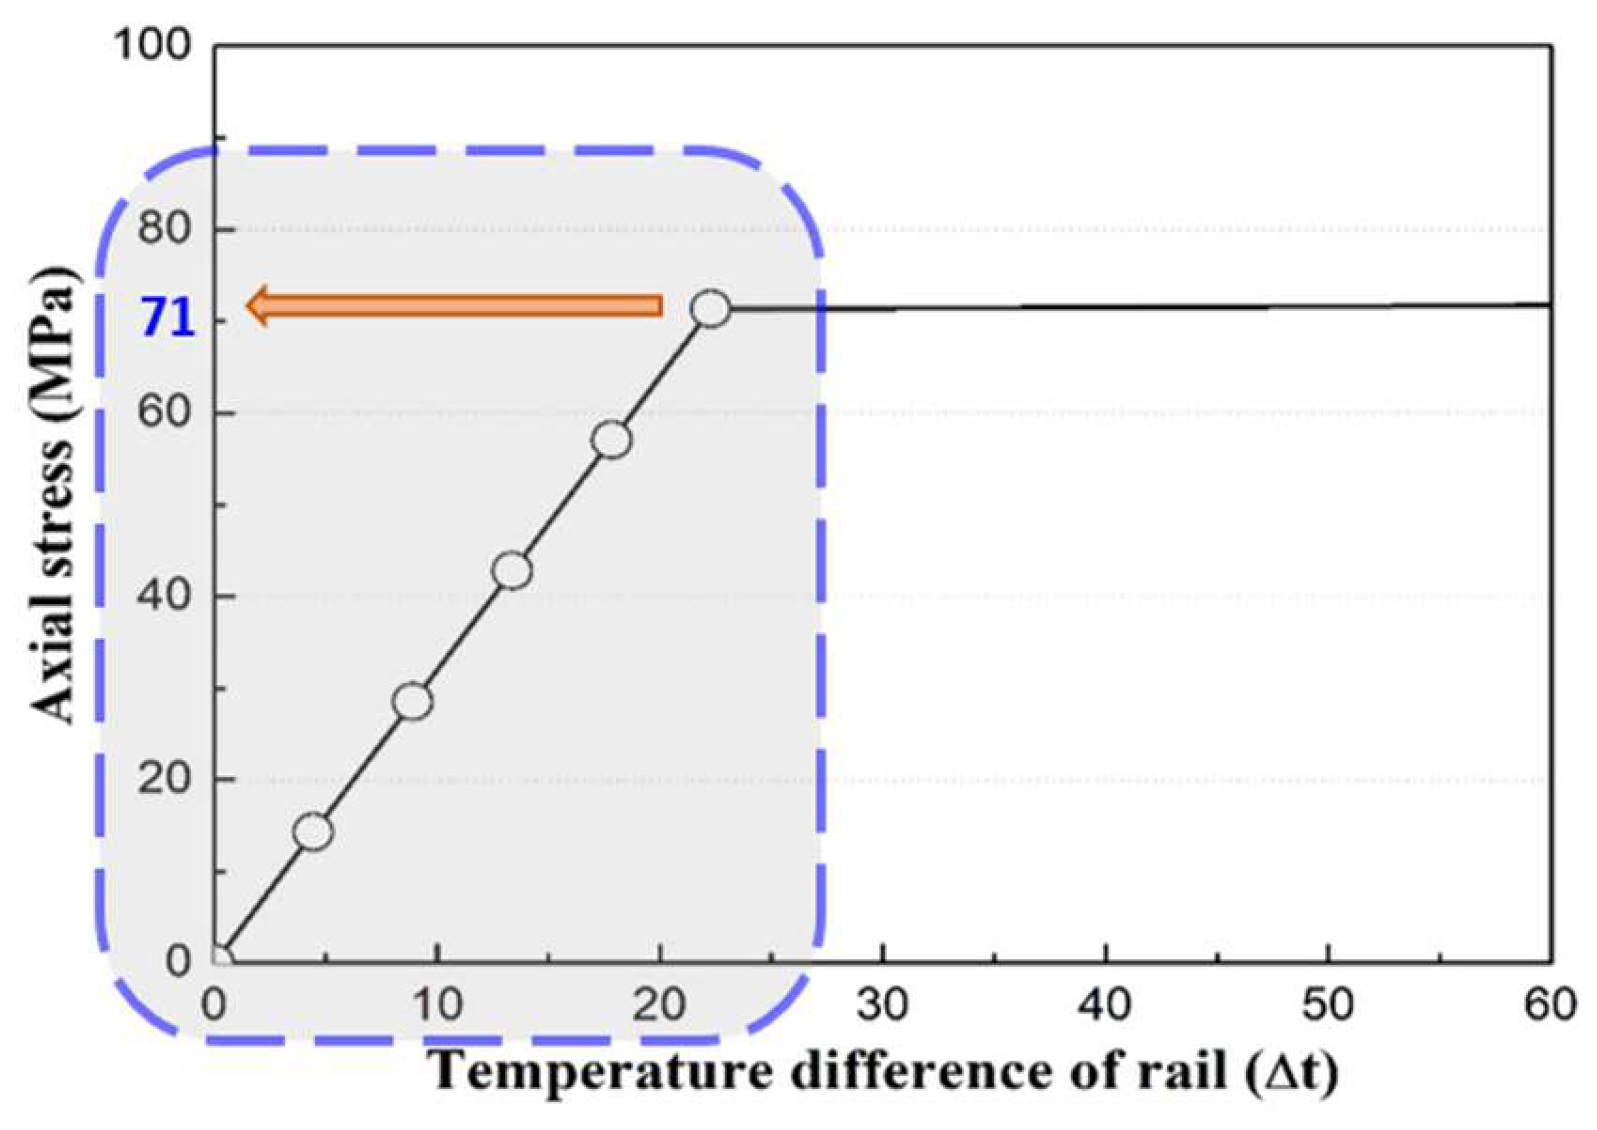

Table 1.
Cumulative rail tonnage.
| Category | Cumulative tonnage (ton) | Annual tonnage (ton) |
||
|---|---|---|---|---|
| Average | Maximum | Minimum | ||
| Line 1 | 353,564,757 | 1,166,542,899 | 46,534,472 | 37,985,936 |
| Line 2 | 429,770,051 | 1,409,051,143 | 43,191,733 | 35,412,833 |
| Line 3 | 308,694,055 | 1,009,647,703 | 24,793,729 | 25,783,785 |
| Line 4 | 371,380,412 | 1,116,506,539 | 25,250,378 | 30,590,571 |
| Line 5 | 543,161,448 | 714,882,321 | 15,016,651 | 17,210,184 |
| Line 6 | 398,654,404 | 424,788,449 | 117,362,310 | 16,346,463 |
| Line 7 | 538,070,364 | 624,131,400 | 202,664,753 | 21,690,988 |
| Line 8 | 336,416,626 | 369,261,145 | 291,078,661 | 11,304,729 |
| Average | 409,964,015 | 854,351,450 | 95,736,586 | 24,540,686 |
* As of December 2023, based on mainline data (excluding branch lines).
Table 2.
Rail welding work status.
| Category | Depot gas pressure welding | On-site gas pressure welding | Thermite welding |
|---|---|---|---|
| Quantity (locations) | 1,114 | 306 | 222 |
| Application rate | 67.9% | 18.6% | 13.5% |
Table 3.
Tunnel section temperature measurements (Lines 5–8).
| Category | Maximum | Minimum |
|---|---|---|
| Magok–Balsan | 27.0 | 2 |
| Mapo–Gongdeok | 29.6 | -2 |
| Haengdang–Wangsimni | 27.3 | 0 |
| Mapo-gu Office–Mangwon | 27.1 | 3 |
| Itaewon–Hangangjin | 33.6 | 5 |
| Sangwolgok–Dolgoji | 30.1 | -8 |
| Banpo–Express Bus Terminal | 30.2 | -6 |
| Cheonwang–Onsu | 30.0 | -4 |
| Gulpocheon–Bupyeong-gu Office | 26.8 | -5 |
| Mongchontoseong–Jamsil | 27.8 | 0 |
| Dandaeogeori–Shinheung | 28.3 | 1.1 |
Table 4.
Parameter classification.
| Category | Parameters |
| Independent variables | Minimum temperature, maximum temperature Temperature variation over time (△t) Curve radius Season Inclination Rail upper/lower, inner/outer Distance between fracture location and ventilation shaft Effect of ventilation shafts on rail fractures based on field investigation results |
| Dependent variable | Rail fracture occurrence |
Table 5.
Training dataset (Example).
| No. | Ambient temperature (△t) |
Curve radius (m) |
Inclination (‰) |
Welding type |
Rail fracture occurrence |
Ventilation shaft position | Ventilation shaft function |
Distance between fracture location and ventilation shaft center (m) | ||||
|---|---|---|---|---|---|---|---|---|---|---|---|---|
| Upper/Middle/Lower | Connection type | Ventilation shaft entrance area | Longitudinal (x) | Transverse (y) | Depth (z) | |||||||
| 1 | 9 | 299 | 7 | Gas | Rail fracture |
Lower | Ceiling | 24 | Exhaust | 160 | 1.794 | 23.73 |
| 2 | 8 | 296 | 3 | Gas | Rail fracture |
Upper | Ceiling | 27 | Exhaust | −41 | 0.75 | 19,450 |
| 3 | 8.6 | 249 | 10 | Gas | Rail fracture |
Upper | Wall | 22.4 | Intake | 240 | 1.85 | 29.32 |
| · · · |
· · · |
· · · |
· · · |
· · · |
· · · |
· · · |
· · · |
· · · |
· · · |
· · · |
· · · |
· · · |
| 50 | 8.1 | 250 | 32 | Ther mite |
Rail fracture |
Lower | Ceiling | 59.60 | U-type | −46 | 7.3 | 10.5 |
| 51 | 8.6 | 300 | −32 | Ther mite |
Rail fracture |
Upper | Ceiling | 72.73 | Natural | −45 | 4.4 | 16.94 |
| · · · |
· · · |
· · · |
· · · |
· · · |
· · · |
· · · |
· · · |
· · · |
· · · |
· · · |
· · · |
· · · |
| 83 | 7.1 | 265 | −10 | Ther mite |
Rail fracture |
Lower | Ceiling | 22.40 | Intake | 282 | 2.34 | 29.32 |
| 84 | 9.3 | Straight | −1.4 | HAZ | Rail fracture |
Upper | Ceiling | 44.10 | Intake | −114 | 1.277 | 20.22 |
Table 6.
VIF analysis results.
| Output Input |
Minimum temperature |
Maximum temperature |
Δt | Season | Curve radius |
Inclination | Welding type |
Distance (x) |
|---|---|---|---|---|---|---|---|---|
| Minimum temperature |
- | 1.97 | 1.36 | inf | inf | inf | inf | inf |
| Maximum temperature |
1.97 | - | 1.25 | inf | inf | inf | inf | inf |
| Δt | 1.36 | 1.25 | - | 2.54 | 1.28 | 1.40 | 2.14 | 1.19 |
| Season | inf | inf | 2.54 | - | 2.38 | 1.54 | 1.20 | 2.12 |
| Curve radius |
inf | inf | 1.28 | 2.38 | - | 1.45 | 1.48 | 1.54 |
| Inclination | inf | inf | 1.40 | 1.54 | 1.45 | - | 1.40 | 1.67 |
| Welding type |
inf | inf | 2.14 | 1.20 | 1.48 | 1.40 | - | 2.47 |
| Distance(x) | inf | inf | 1.19 | 2.12 | 1.54 | 1.67 | 2.47 | - |
Table 7.
Numerical analysis load conditions.
| Category | Airflow (m/s) | Temperature setting (Δt) |
|---|---|---|
| Case A | 0.5 m/s | 35 ℃ |
| Case B | 1.0 m/s | |
| Case C | 2.0 m/s | |
| Case D | 4.0 m/s |
Disclaimer/Publisher’s Note: The statements, opinions and data contained in all publications are solely those of the individual author(s) and contributor(s) and not of MDPI and/or the editor(s). MDPI and/or the editor(s) disclaim responsibility for any injury to people or property resulting from any ideas, methods, instructions or products referred to in the content. |
© 2025 by the authors. Licensee MDPI, Basel, Switzerland. This article is an open access article distributed under the terms and conditions of the Creative Commons Attribution (CC BY) license (http://creativecommons.org/licenses/by/4.0/).
Copyright: This open access article is published under a Creative Commons CC BY 4.0 license, which permit the free download, distribution, and reuse, provided that the author and preprint are cited in any reuse.


