
Submitted:
05 March 2025
Posted:
06 March 2025
You are already at the latest version
Abstract
This paper proposes a novel ontology, called SciOnt, for representing scientometric indicators. Scientometrics is the field that studies quantitative aspects of science and scientific phenomena. Scientometric indicators are used to evaluate scientific publications and research. However, many indicators and their diversity make them challenging to understand and use. SciOnt addresses this challenge by providing a formal and structured representation of scientometric indicator knowledge. It defines classes, relationships, and instances of these indicators. The ontology can be used for various purposes, including improving the analysis and comparison of scientometric indicators, facilitating the development of new and more efficient indicators, and enhancing the understanding and criticism of existing indicators. The paper details the methodology used to design SciOnt, including identifying and classifying scientometric indicators, constructing the ontology with Protégé software, and evaluating the ontology using expert feedback. Finally, the paper presents visualizations of the SciOnt ontology structure using different tools.
Keywords:
Scientometric indicators
; ontology
; SciOnt
; knowledge representation
; semantic web
1. Introduction
Scientometrics is a field of study that examines the quantitative aspects of science, scientific subjects and phenomena, scientific communication, research methods and development of science, and science and technology policies (Vinkler, 2010; Mingers and Leydesdorff, 2015). Critical functions of scientometrics include:
- Quantitative evaluation of scientific resources and publications
- Assessment of the quality and impact of scientific publications
- Examination of the inputs, outputs, and effectiveness of scientific publications
- Quantitative and qualitative evaluation of scientific publication owners, including authors, researchers, universities, etc.
- Study of various aspects of scientific communication between researchers and scientific works
- Development of science and research policies and guidelines (Vinkler, 2010; Mingers and Leydesdorff, 2015; Waltman, 2016; Glänzel et al., 2019).
Scientometric analyses study the quantitative areas of the science process, science policy, and communication in science by focusing on the author, article, journal, and institution metrics and understanding the related citations (Zakka et al., 2021). In this context, numerous indicators have been proposed in scientometric studies, each with its function and objectives.
According to Vinkler (2010) indicators are scientometrics measures describing one or more aspects of science and scientific research. The diversity of indicators has led researchers to categorize them in previous studies. For instance, Mahmoudi Topkanlo and CheshmehSohrabi (2023) provided a comprehensive overview of their study’s different categorizations proposed for scientometric indicators. In their view, classifying indicators makes understanding, studying, critiquing, and using them more accessible.
However, despite the categorizations and the presentation of these indicators in many resources and databases, it is still difficult to access all indicators in a single, organized, and structured manner. As Bonacin et al. (2016) point out, in today’s world, accessing information about a concept or phenomenon is not a challenge; instead, it is the retrieval of relevant information in the right place and time in an easier way that is a challenge due to the unstructured nature of information repositories and heterogeneous data forms. This challenge also exists in accessing and retrieving information related to scientometric indicators.
One way to improve indicators’ access and precision is to design an ontology of indicators. Ontologies are part of semantic web tools and play a significant role in knowledge representation, generation, and sharing (Aminu et al., 2022). Ontology is a clear and explicit model in the field of knowledge, including a set of concepts and relationships between them (Fathian Dastgerdi, 2023). An ontology is a modeling tool that organizes concepts and relationships between them at the knowledge and semantic level (Li et al., 2013).Ontology is a formal representation of a set of concepts of a subject area and the relationships between them, which is used to gain knowledge of the subject area and avoid the ambiguity of words, and is created by ontology representation languages like OWL and RDF (Fathian Dastgerdi, 2016). By using the concepts and terms used in a domain and identifying the relationships between these concepts, an ontology provides a shared and common understanding of the knowledge of a specific domain (Ceccaroni et al. 2004). Through the shared understanding created by ontologies, communication between people and organizations and collaboration between different systems can be improved (Uschold & Gruninger, 1996). Noy & Maguinness (2001) identify the following as the most important goals of ontology:
- Ability to analyze knowledge in a domain;
- Establishing terms and relationships between them;
- Separating knowledge from subject domains;
- Rearranging knowledge; and
- Sharing and disseminating a common understanding of the knowledge structure among people and intelligent software.
Sugumaran (2016) also mentions that accurate information processing, information application, sharing, reuse of knowledge, and discovery of new knowledge are some of the goals of ontology creation. Ontology is “a formal and explicit specification of a shared conceptualization” (Gruber, 1993). An ontology provides terminology, central concepts, classification of concepts, and relationships between them in a domain (Gaševic et al., 2009). The following paragraphs enumerate the main ontology components (Slimani, 2015a):
a. Classes or concepts: also called types or universals, are a group of individuals that share common characteristics used in a broad sense. In the SciOnt ontology, the “Measurement Method”, “Measurement Unit”, “Measurement Tool”, and “Measurement Environment” are some of the main classes.
b. Relations: In Ontologies, relations describe how individuals (instances or particulars) are related. For example, in the SciOnt ontology, we related the two individuals “co-citation” and “co-authorship” with “is related to” relationship (co-citation is related to co-authorship).
c. Instances: Instances are individuals that model concrete objects (people, proteins, machines). In the SciOnt ontology, the class “Journal Indicators” includes “Eigen Factors Score”, “Journal Impact Factor”, and “SJR Index” as individuals.
Noy and McGuinness (2001) explain some of the reasons for developing an ontology, including “to share a common understanding of the structure of information among people or software agents”, “to enable reuse of domain knowledge”, “to make domain assumptions explicit”, “to separate domain knowledge from operational knowledge”, and “to analyze domain knowledge”. By designing an ontology for scientometric indicators, it is possible to introduce and present all existing indicators while outlining their semantic relationships, identifying their similarities and differences, strengths and weaknesses, and applications. Additionally, by providing general knowledge about them, the groundwork can be laid for evaluating and updating them and creating new, more efficient indicators. Moreover, researchers, scientometricians, librarians, universities, and research institutions can use the ontology of scientometric indicators. Therefore, this paper aims to provide an ontology-based approach to the semantic representation of the indicators and relationships between them in scientometrics. The SciOnt Ontology is the result of employing such an approach.
The rest of this paper is structured as follows. First, we reviewed the related literature. Then, we discussed the methodologies used in this study to identify and classify scientometrics indicators and the SciOnt ontology construction method. The Results section is divided into two parts, including “ontology evaluation” and “ontology visualization”, in which we presented the criteria-based ontology evaluation and the visual display of concepts and relationships (RDF graphs) designed with popular Protégé visualization plugins. Finally, the Conclusion section is presented.
2. Literature Review
The significance and applicability of ontologies in knowledge modeling, organization, and representation have prompted researchers in the field of scientometrics to pay attention to the design of ontologies. In this regard, Archambault et al. (2011) designed a new journal ontology to simplify the production of bibliometric data. They proposed a new journal classification consisting of a hierarchical, three-level classification tree based on taxonomies. Categories were created based on journal classifications (ISI, CHI, ERA). Journals were assigned to particular categories via a hybrid approach, including algorithmic methods and expert judgment. This ontology is now freely available at https://www.science-metrix.com.
Mohammadi Ostani et al. (2018) conducted a study to design an ontology in scientometrics called ScientometricsOnt with the domain analysis approach. In this study, they first extracted concepts related to scientometrics from books, articles, dictionaries, thesauruses, research projects, and student dissertations. They identified the relationships and properties in the next step. Finally, they designed the scientometricsOnt ontology with the Protégé 5 editor. The designed ontology in this study comprises 185 concepts in scientometrics classified into 11 main classes, 20 relationships, and 100 individuals. ScientometricsOnt can improve knowledge representation in Scientometrics. This study does not provide a classification of indicators and only deals with the terms and concepts of the scientometrics field.
Furthermore, semantic web technologies are used in citation analysis as a branch of Scientometrics. For example, Xiao et al. (2018) suggested a new citation analysis method based on semantic technologies (e.g., ontology and linked data) in three steps: citation ontology construction, publishing linked data of citation information, and citation analysis method implementation. They examined the conditions and requirements of each step in the context of citation analysis. Finally, they presented a framework of an ontology-based citation knowledge service system with four core layers: a data resource layer, an ontology layer, a semantic association layer, and a functional layer.
Artificial Intelligence and Natural Language Processing are essential in classifying citations into different classes. For example, Ihsan and Qadir (Ihsan & Qadir, 2021) developed the Citations’ Context and Reasons Ontology (CCRO) and used an ontology-based approach to extract citation reasons. They defined ontology classes and properties based on two collections of citation sentences: a publicly available corpus and a manually curated collection. Finally, they measured the accuracy of both manual and automatic mapping.
In some studies, the need to use new tools in scientometric systems and indicators has also been addressed. For example, López-Rodríguez & Ceballos (2022) conducted a study to model scientometric indicators using data mining techniques semantically. For this purpose, they used the CRISP-DM methodology (CRISP-DM), a data mining process model. This methodology consists of 6 stages: Business Understanding, Data Understanding, Data Preparation, Modeling, Evaluation and Deployment. From their point of view, their proposed model can be used for representation, discovery, search, and combination of scientometric indicators in different organizations, including universities. Kozitsyn (2023) proposed using Thematic Search Algorithms in scientometric systems. From this point of view, the large amounts of data in scientometric systems, the differences between different subject areas, and the ambiguities and shortcomings associated with scientometric indicators make using intelligent methods, including search algorithms, essential.
Motohashi et al. (2024) studied the reciprocal relationships between science and technology using text mining and clustering techniques. The study population was data on articles and patents from Japan. The findings suggest an increasing connection trend between science and technology, although the speed of growth of the science-technology link varies across different subject areas.
As can be seen, ontology has been used to represent knowledge in scientometrics. Using ontology to introduce and present various scientometric indicators can be very helpful for universities, research centers, librarians, and researchers. This is especially true since research has yet to be done in scientometrics indicator ontology. This research can be the basis for further research in this field.
3. Materials and Methods
The current research method consists of two parts as follows:
A. Identifying and Classifying Scientometrics Indicators
At first, documentary analysis was used to identify scientometrics indicators. For this purpose, various indicators used to evaluate scientific and technical publications were identified by examining various texts, articles, and sources in Scopus and Web of Science databases. Some indicators have already been classified in some texts (Braun et al., 2006; Vinkler, 2009; Vîiu, 2016), but by studying them more closely and taking into account their similarities, differences, or functions, we also identified other categories. Overall, 31 categories were finally identified. In the next step, The Delphi technique was used to obtain the opinions of experts in the metric fields on the identification and classification of indicators for scientific and technical publications. The members of the Delphi panel were researchers, professors, and experts in the fields of bibliometrics, scientometrics, informetrics, webometrics, and altmetrics, who were selected through purposive sampling. As we emailed the experts a participation request, twenty-five experts finally agreed to cooperate in this research. The most crucial point in research conducted using the Delphi technique is reaching a consensus on opinion. In this regard, most experts consider it appropriate to repeat data collection three times (Brady, 2015; Skinner, 2015). In the present study, the Delphi technique was repeated three times. In the third time, the panel members agreed on the indicators and their categories. Kendall’s coefficient of concordance and one-sample t-test were used to check the level of agreement between the panel members, and the results of the tests indicated a high level of agreement between the panel members. Finally, based on the results of the Delphi study, the scientific indicators were categorized into 34 subclasses and eight main classes. The eight main categories were: 1) measurement method, 2) measurement unit, 3) measurement tool, 4) measurement purpose, 5) measurement development, 6) measurement source, 7) measurability, and 8) measurement environment. Based on this, the initial model for the design of scientometrics ontology was formed (Mahmoudi Topkanlo; CheshmehSohrabi, 2023).
B. The SciOnt Ontology Construction Method
The SciOnt Ontology model provides a semantic representation of the indicators and relationships between them in scientometrics. Other ontologies in scientometrics and related domains can easily reuse this ontology. There are different ontology development tools such as WebOnto, OntoEdit, Protégé, OilED, Ontolingua, WebODE, etc. The SciOnt was built using protégé desktop V.5.5.0.
Protégé is an ontology editor created at Stanford University and is very popular in Semantic Web and computer science research. Protégé is free, developed in Java, and its source code is released under a free license (the Mozilla Public License). Various formats, including RDF, RDFS, OWL, etc., can be created and edited with Protégé, and it is suitable for large-scaleOntologies (Slimani, 2015b). It is open-source, easy to learn and use, standalone, user-friendly, and fully supports OWL language. It offers plugins for graph visualization of ontology and has a large user community (Mukabunani, 2017). Protégé has become the most widely used software for building and maintaining ontologies (Musen, 2015).
This paper employed the Noy and McGuinness (2001) methodology as a general approach to designing SciOnt ontologies. However, after creating instances, we added a step (Matching individuals with BiDO) to this approach. Figure 1 indicates the Noy and McGuinness Methodology for designing ontology.
The following steps explain the SciOnt Ontology designing method.
1. Defining classes and class hierarchical structure
We organized the classes into a hierarchical taxonomy, including classes and subclasses, according to the main concepts (indicators) identified in the Delphi panel. This ontology has 43 main classes that are organized into eight main classes including “Measurement Method”, “Measurement Unit”, “Measurement Tool”, “Measurement Purpose”, “Measurement Development”, “Measurement Source”, “Measurability”, and “Measurement Environment”. The main classes and the class hierarchical structure of the SciOnt ontology, which have been designed in Protégé, are shown in Figure 2 and Figure 3, respectively.
According to Figure 3, the “Measurement Unit” has nine subclasses, including “Article Indicators”, “Book Indicators”, “Country Indicators”, “Discipline Indicators”, “Indicators of the Corporate Author”, “Indicators of the Personal Author”, “Journal Indicators”, “Patent Indicators”, and “Thematic Indicators”. In ontologies, each class inherits the characteristics and properties of its higher class.
2. Defining the properties of classes
After designing the classes, the properties and relationships between them were described. In the hierarchical structure (Figure 3), the classes and subclasses are related by an “is-a” relationship. The “is-a” relationship, for example, indicates that the “Journal Indicators” class is a type of the “Measurement Unit” class. Furthermore, this ontology defines several “object properties,” “data properties,” and “annotation properties” to represent different relationships between instances. We defined the “is-related-to” object property to represent, for example, the relationships between three individuals, “degree centrality”, “closeness centrality”, and “betweenness centrality” (degree centrality is related to closeness centrality).
Furthermore, we defined seven data properties, including “alternateTitle”, “dc:references”, “dcterms:created”, “dcterms:description”, “doi”, “hasURL”, and “proposedBy”, to relate the individuals to data types (e.g., integer, string, Literal, dataTime, anyURI, language, etc.). For example, the data property “dcterms:description” relates the “Scientometrics Indicators” class to the “string” data type (Scientometrics Indicators dcterms:description xsd:string).
The SciOnt ontology also has some annotation properties such as “rdfs:comment”, “rdfs:seeAlso”, “skos:prefLabel”, “rdfs:isDefinedBy”, “schema:image”, etc. For example, we used the “skos:prefLabel” to represent the Persian labels of individuals and classes and “rdfs:isDefinedBy” to assign the IRIs to the individuals. The “schema:image” was used to indicate the images related to individuals, and the “rdfs:seeAlso” was used to specify the references (articles, books, etc.) associated with individuals. Figure 4 shows some annotation properties used to describe the “Altmetric Indicators” class.
In Figure 4, in the “Annotations” window, we created two Persian labels through the “skos:prefLabel” and defined their data types as “xsd:string”. Then, a definition of the “Altmetric Indicators” class (xsd:string) was provided using the “rdfs:comment” property. To improve the knowledge level in this system, we searched for various references (e.g., articles, books, etc.) related to each individual. We represented their bibliographic information using the “rdfs:seeAlso” property. We used the “rdfs:isDefinedBy” property to assign URLs to these references or related links. So, we assigned a Wikipedia URL (https://en.wikipedia.org/wiki/Altmetrics) to the Wikipedia page associated with Altmetrics. We also provided an image of the “Altmetric Indicators” class via the “schema:image” property.
3. Creating Instances
Another part of ontology designing is adding instances and members to the defined classes. Each class contains several individuals that have common characteristics. The SciOnt Ontology has 97 individuals assigned to the classes.
Figure 4 indicates the individuals for the “Altmetric Indicators” class (e.g., “number of articles downloaded on social networks”) at the bottom of the image. Another example is the “Journal Indicators” class which includes the individuals “Eigen Factors Score”, “Journal Impact Factor”, and “SJR Index”. Figure 5 indicates how we specified object properties, data properties, annotation properties, and the type of “Journal Impact Factor” individual (which belongs to the “Journal Indicators” class).
According to Figure 5, the type of individual is specified in the “Description: journal impact factor” window, which determines that this individual is a subclass of the “Journal Indicators” class.
Figure 5 provided an image of the “Journal Impact Factor” using the “schema:image” annotation property. Data and object property assertions can be defined in the “property assertions” window. So, the Wikipedia URL to the “impact factor” page was provided using the “URL” property. Another name for the individual (IF) was specified by the “alternateTitle” property, and the “dcterms:description” property was used to describe the individual clearly. Furthermore, we used “proposedBy” to identify the person who first introduced or proposed the “Journal Impact Factor” term and used the “created” property to indicate when this term was created or introduced (xsd:dateTime). As shown in Figure 5, the “Journal Impact Factor” was introduced by Eugene Garfield and discussed in various articles, blogs, etc. So, we represented the bibliographic information of the related references by the “dc:references” property and then defined the references DOIs by the “doi” property.
Another example of an individual represented in the SciOnt Ontology is “Bradford’s Law”. Just like the previous individual (Journal Impact Factor), we defined various properties such as “schema:image”, “dcterms:description”, “hasURL”, “alternateTitle”, “proposedBy”, etc., for the “Bradford’s Law” individual (Figure 6).
4. Matching individuals with BiDO (the Bibliometric Data Ontology1)
The Bibliometric Data Ontology (BiDO) is a modular ontology that allows the description of numerical and categorical bibliometric data (e.g., journal impact factor, author h-index, E-index, etc.) in RDF. The BiDO is part of SPAR (Semantic Publishing and Referencing) Ontologies that concern the specification of qualitative and quantitative evaluations of a bibliographic resource or an agent (Peroni & Shotton, 2018). The SPAR Ontology Network is a suite of orthogonal and complementary ontology modules to describe the scholarly publishing domain 2. BiDO includes three distinct ontological modules:
- BiDO Core Module
- BiDO Standard Bibliometric Measures module
- BiDO Review Measures module
We used the “BiDO Standard Bibliometric Measures module” to match the SciOnt individuals. This module describes a list of possible bibliometric measures that can be used to define bibliometric data of publication-related entities3. It includes four individuals:
“author citation counts”, http://purl.org/spar/bido/author-citation-count
“e-index”, http://purl.org/spar/bido/e-index
“h-index”, http://purl.org/spar/bido/e-index
“journal impact factor”, http://purl.org/spar/bido/journal-impact-factor
In this section, we matched the BiDO and SciOnt individuals to improve and enrich our ontology knowledge. Since all the BiDo individuals existed in the SciOnt ontology, we assigned the BiDO individuals’ URIs to the same individuals in the SciOnt ontology.
4. Results and Discussion
This section is divided into two parts, including “ontology evaluation” and “ontology visualization”, in which we presented the criteria-based ontology evaluation and the visual display of concepts and relationships (RDF graphs) designed with popular Protégé visualization plugins.
4.1. Ontology Evaluation
Ontology evaluation is the final stage of ontology design. The evaluation may include clarity, consistency, extensibility, accuracy, completeness, comprehensibility, and the like (Haghighi et al., 2013). In this study, the criteria proposed by Xing et al. (2019) were used to evaluate the ontology, which includes five criteria: 1) Completeness, 2) Correctness, 3) Extensibility, 4) Conciseness, and 5) Clarity (transparency), which evaluates the ontology in terms of content. The opinions of 10 scientometrics experts who collaborated in the first part of the study were used to evaluate these criteria. The ontology evaluation process was such that in a meeting, the experts expressed their opinions after observing and investigating the ontology, and the desired corrections were made until a consensus and agreement were reached by all members. Table 1 shows the ontology evaluation criteria.
4.2. Ontology Visualization
This section indicates the SciOnt ontology structure of concepts and relationships with some of the Protégé visualization plugins, providing an easy-to-interpret visual display. Protégé provides various plugins for ontology visualization, such as OntoGraph, OWLPropViz, OWLViz, NavigOWL, etc. Figure 7, Figure 8, Figure 9, Figure 10, Figure 11, Figure 12 and Figure 13 indicate the SciOntgraphs designed with the OntoGraph and OWLViz plugins and the WebVOWL Editor web application. OntoGraph and OWLViz Plugins are installed by default in version 5.5 of the Protégé. WebVOWL is a web application for the interactive visualization of ontologies. It implements the “Visual Notation for OWL Ontologies (VOWL)” by providing graphical depictions for elements of the Web Ontology Language (OWL) that are combined to a force-directed graph layout representing the ontology4. Figure 7 indicates the graph view of the SciOnt ontology with the OntoGraph plugin.
Figure 8 indicates the graph view for the “Journal Indicators” class and its individuals designed by the OntoGraph plugin.
Figure 9 indicates the defined properties of the “Journal Impact Factor” individual.
Figure 10 indicates the graph view of the SciOnt ontology designed with the OWLViz plugin.
5. Conclusions
Scientometric indicators are essential for analysis and decision-making related to science and scientific publication. The diversity of scientometric indicators makes it difficult to understand and study them. Semantic tools such as ontologies can help better understand scientometric indicators, analysis, criticism, and the development and creation of new indicators. Ontologies can be used to create a shared understanding of scientometric indicators, making it easier to analyze, compare, and criticize them. Ontologies can also be used to develop new scientometric indicators that are more accurate and relevant to the needs of researchers and policymakers. On this basis, the design of a scientometric indicator ontology was considered in this study. We designed the SciOnt ontology and concluded that using ontologies can help overcome the challenges of understanding and using scientometric indicators. We proposed a scientometric indicator ontology that can be used to represent the knowledge about scientometric indicators in a formal and structured way. This ontology could then be used to improve scientometric indicators’ analysis, criticism, and development.
Author Contributions
“Conceptualization, M.C.; methodology, M.C.; H.MT. and A.FD.; validation, M.C.; formal analysis, H.MT and A.FD.; investigation, H.MT and A.FD.; resources, H.MT and A.FD.; data curation, H.MT.; writing—original draft preparation, H.MT and A.FD.; writing—review and editing, M.C.; visualization, A.FD.; supervision, M.C.; project administration, M.C. All authors have read and agreed to the published version of the manuscript.”
Funding
This research was funded by University of Isfahn.
Data Availability Statement
The data that support the findings of this study are available on request from the corresponding author.
Acknowledgments
This work was supported by the University of Isfahn.
Conflicts of Interest
The authors declare no conflicts of interest.
Abbreviations
The following abbreviations are used in this manuscript:
| OWL | Web Ontology Language |
| RDF | Resource Description Framework |
| SciOnt | Scientometric Indicators Ontology |
References
- Aminu, E.F., Oyefolahan, I.O., Abdullahi, M.B., & Salaudeen, M.T. (2022). MaCOnto: A robust maize crop ontology based on soils, fertilizers and irrigation knowledge. Intelligent Systems with Applications, 16, 200125.. [CrossRef]
- Archambault, É.,; Beauchesne, O.H., & Caruso, J. (2011). Towards a multilingual, comprehensive and open scientific journal ontology. In Proceedings of the 13th International Conference of the International Society for Scientometrics and Informetrics, July, 13, 66-77.
- Bonacin, R., Nabuco, O.F., & Junior, I.P. (2016). Ontology models of the impacts of agriculture and climate changes on water resources: Scenarios on interoperability and information recovery. Future Generation Computer Systems, 54, 423-434. [CrossRef]
- Brady, S.R. (2015). Utilizing and adapting the Delphi method for use in qualitative research. International Journal of Qualitative Methods, 14, 1-6. [CrossRef]
- Braun, T., Glänzel, W., & Schubert, A.A. (2006). Hirsch-type index for journals. Scientometrics, 69, 169–173. [CrossRef]
- Ceccaroni, L., Cortes, U., & Sanchez-Marre, M. (2004). OntoWEDSS: Augmenting Environmental Decision-Support Systems with Ontologies. Environmental Modelling & Software, 19, 785-797. [CrossRef]
- Fathian Dastgerdi, A. (2023). Creating the Ontology of Islamic Medicine Based on Semantic Web: A Review Study. Journal of Modern Medical Information Sciences, 9, 296-311.
- Fathian Dastgerdi, A. (2016). Designing the Metadata Ontology Model of Iran’s National Library Catalogue Based on the Linked Data Method. PhD dissertation. Mashhad: Ferdowsi University of Mashhad.
- Gaševic, D., Djuric, D., & Devedžic, V. (2009). Model driven engineering and ontology development. Springer Science & Business Media, 46-57.
- Glänzel, W., Moed, H.F., Schmoch, U., & Thelwall, M. (2019.). Springer Handbook of Science and Technology Indicators. Dordrecht: Springer, 17-40.
- Gruber, T.R. (1993). A translation approach to portable ontology specifications. Knowledge Acquisition, 5, 199–221. [CrossRef]
- Haghighi, P.D., Burstein, F., Zaslavsky, A., & Arbon, P. (2013). Development and evaluation of ontology for intelligent decision support in medical emergency management for mass gatherings. Decision Support Systems, 54, 1192-1204. [CrossRef]
- Ihsan, I., & Qadir, M.A. (2021). An NLP-based citation reason analysis using CCRO. Scientometrics, 126, 4769-4791. [CrossRef]
- Kozitsyn, A.S. (2023). Thematic Search Algorithms in Scientometric Systems. Programming and Computer Software, 49, 325-332. [CrossRef]
- Li, D., Kang, L., Cheng, X.,Li, D., Ji, L., Wang, K., & Chen, Y. (2013). An ontology-based knowledge representation and implement method for crop cultivation standard. Mathematical and Computer Modelling, 58, 466-473. [CrossRef]
- Lopez-Rodriguez, V., & Ceballos, H.G. (2022). Modeling scientometric indicators using a statistical data ontology. Journal of Big Data,, 9, 1-17. [CrossRef]
- Mahmoudi Topkanlo, H., & CheshmehSohrabi, M.(2023). Identification and classification of evaluation indicators for scientific and technical publications and related factors. Information Research an International Electronic Journal, 28, 78–105. [CrossRef]
- Mingers, J., & Leydesdorff, L. (2015). A review of theory and practice in scientometrics. European journal of operational research, 246, 1-19. [CrossRef]
- Mohammadi Ostani, M., Azargoon, M., & Cheshmesohrabi, M. (2018). Methodology of Construction and Design of Ontologies: a Case Study of Scientometrics Field. Iranian Journal of Information processing and Management, 33, 1761-1788. [CrossRef]
- Motohashi, K., Koshiba, H., & Ikeuchi, K. (2024). Measuring science and innovation linkage using text mining of research papers and patent information. Scientometrics, 129, 1-21. [CrossRef]
- Mukabunani, A. (2017). Ontology-based clinical decision support system applied on diabetes. Master’s thesis. University of Agder, Kristiansand & Grimstad , Norway.
- Musen, M.A. (2015). The protégé project: a look back and a look forward. AI Matters, 1, 4-12. [CrossRef]
- Noy, N.F., & McGuinness, D.L.(2001). Ontology Development 101: A guide to creating your first ontology. Stanford University, Stanford, CA. http://protege.stanford.edu/publications/ontology_development/ontology101.pdf.
- Peroni, S., & Shotton, D. (2018). The SPAR ontologies. In The Semantic Web–ISWC 2018: 17th International Semantic Web Conference, Monterey, CA, USA, October 8–12, Proceedings, Part II 17 (pp. 119-136). Springer International Publishing. [CrossRef]
- Skinner, R., Nelson, R.R., Chin, W.W., & Land, L. (2015). The Delphi method research strategy in studies of information systems. Communications of the Association for Information Systems, 37, 31-63. [CrossRef]
- Slimani, T. (2015a). A study investigating typical concepts and guidelines for ontology building. Journal of Emerging Trends in Computing and Information Sciences, 5, 886-893. [CrossRef]
- Slimani, T. (2015b). Ontology development: A comparing study on tools, languages and formalisms. Indian Journal of Science and Technology, 8, 1-12. [CrossRef]
- Sugumaran, V. (2016). Semantic technologies for enhancing knowledge management systems. In Successes and Failures of Knowledge Management, pp. 203-213, Morgan Kaufmann. [CrossRef]
- Uschold, M., & Gruninger, M. (1996). Ontologies: Principles, methods and applications. The Knowledge Engineering Review, 11, 93-136. [CrossRef]
- Vîiu, G.A. (2016). A theoretical evaluation of Hirsch-type bibliometric indicators confronted with extreme self-citation. Journal of Informetrics, 10, 552-566. [CrossRef]
- Vinkler, P. (2010). The Evaluation of Research by Scientometric Indicators. Elsevier, pp. 5-25.
- Vinkler, P (2009). The π-index. A new indicator for assessing scientific impact. Journal of Information Science, 35, 602–612. [CrossRef]
- Waltman, L. (2016). A review of the literature on citation impact indicators. Journal of Informetrics, 10, 365-391. [CrossRef]
- Xiao, M., Shi, Z., & Wang, S. (2018). The impact on citation analysis based on ontology and linked data. Scientometrics, 196-208. [CrossRef]
- Xing, X., Zhong, B., Luo, H., Li, H., & Wu, H. (2019). Ontology for safety risk identification in metro construction. Computers in Industry, 109, 14-30. [CrossRef]
- Zakka, W.P., Lim, N.H.A.S., and Khun, M.C. (2021). A scientometric review of geopolymer concrete. Journal of Cleaner Production, 280, 124353. [CrossRef]
Figure 1.
Noy and McGuinness Methodology (Noy and McGuinness, 2001).
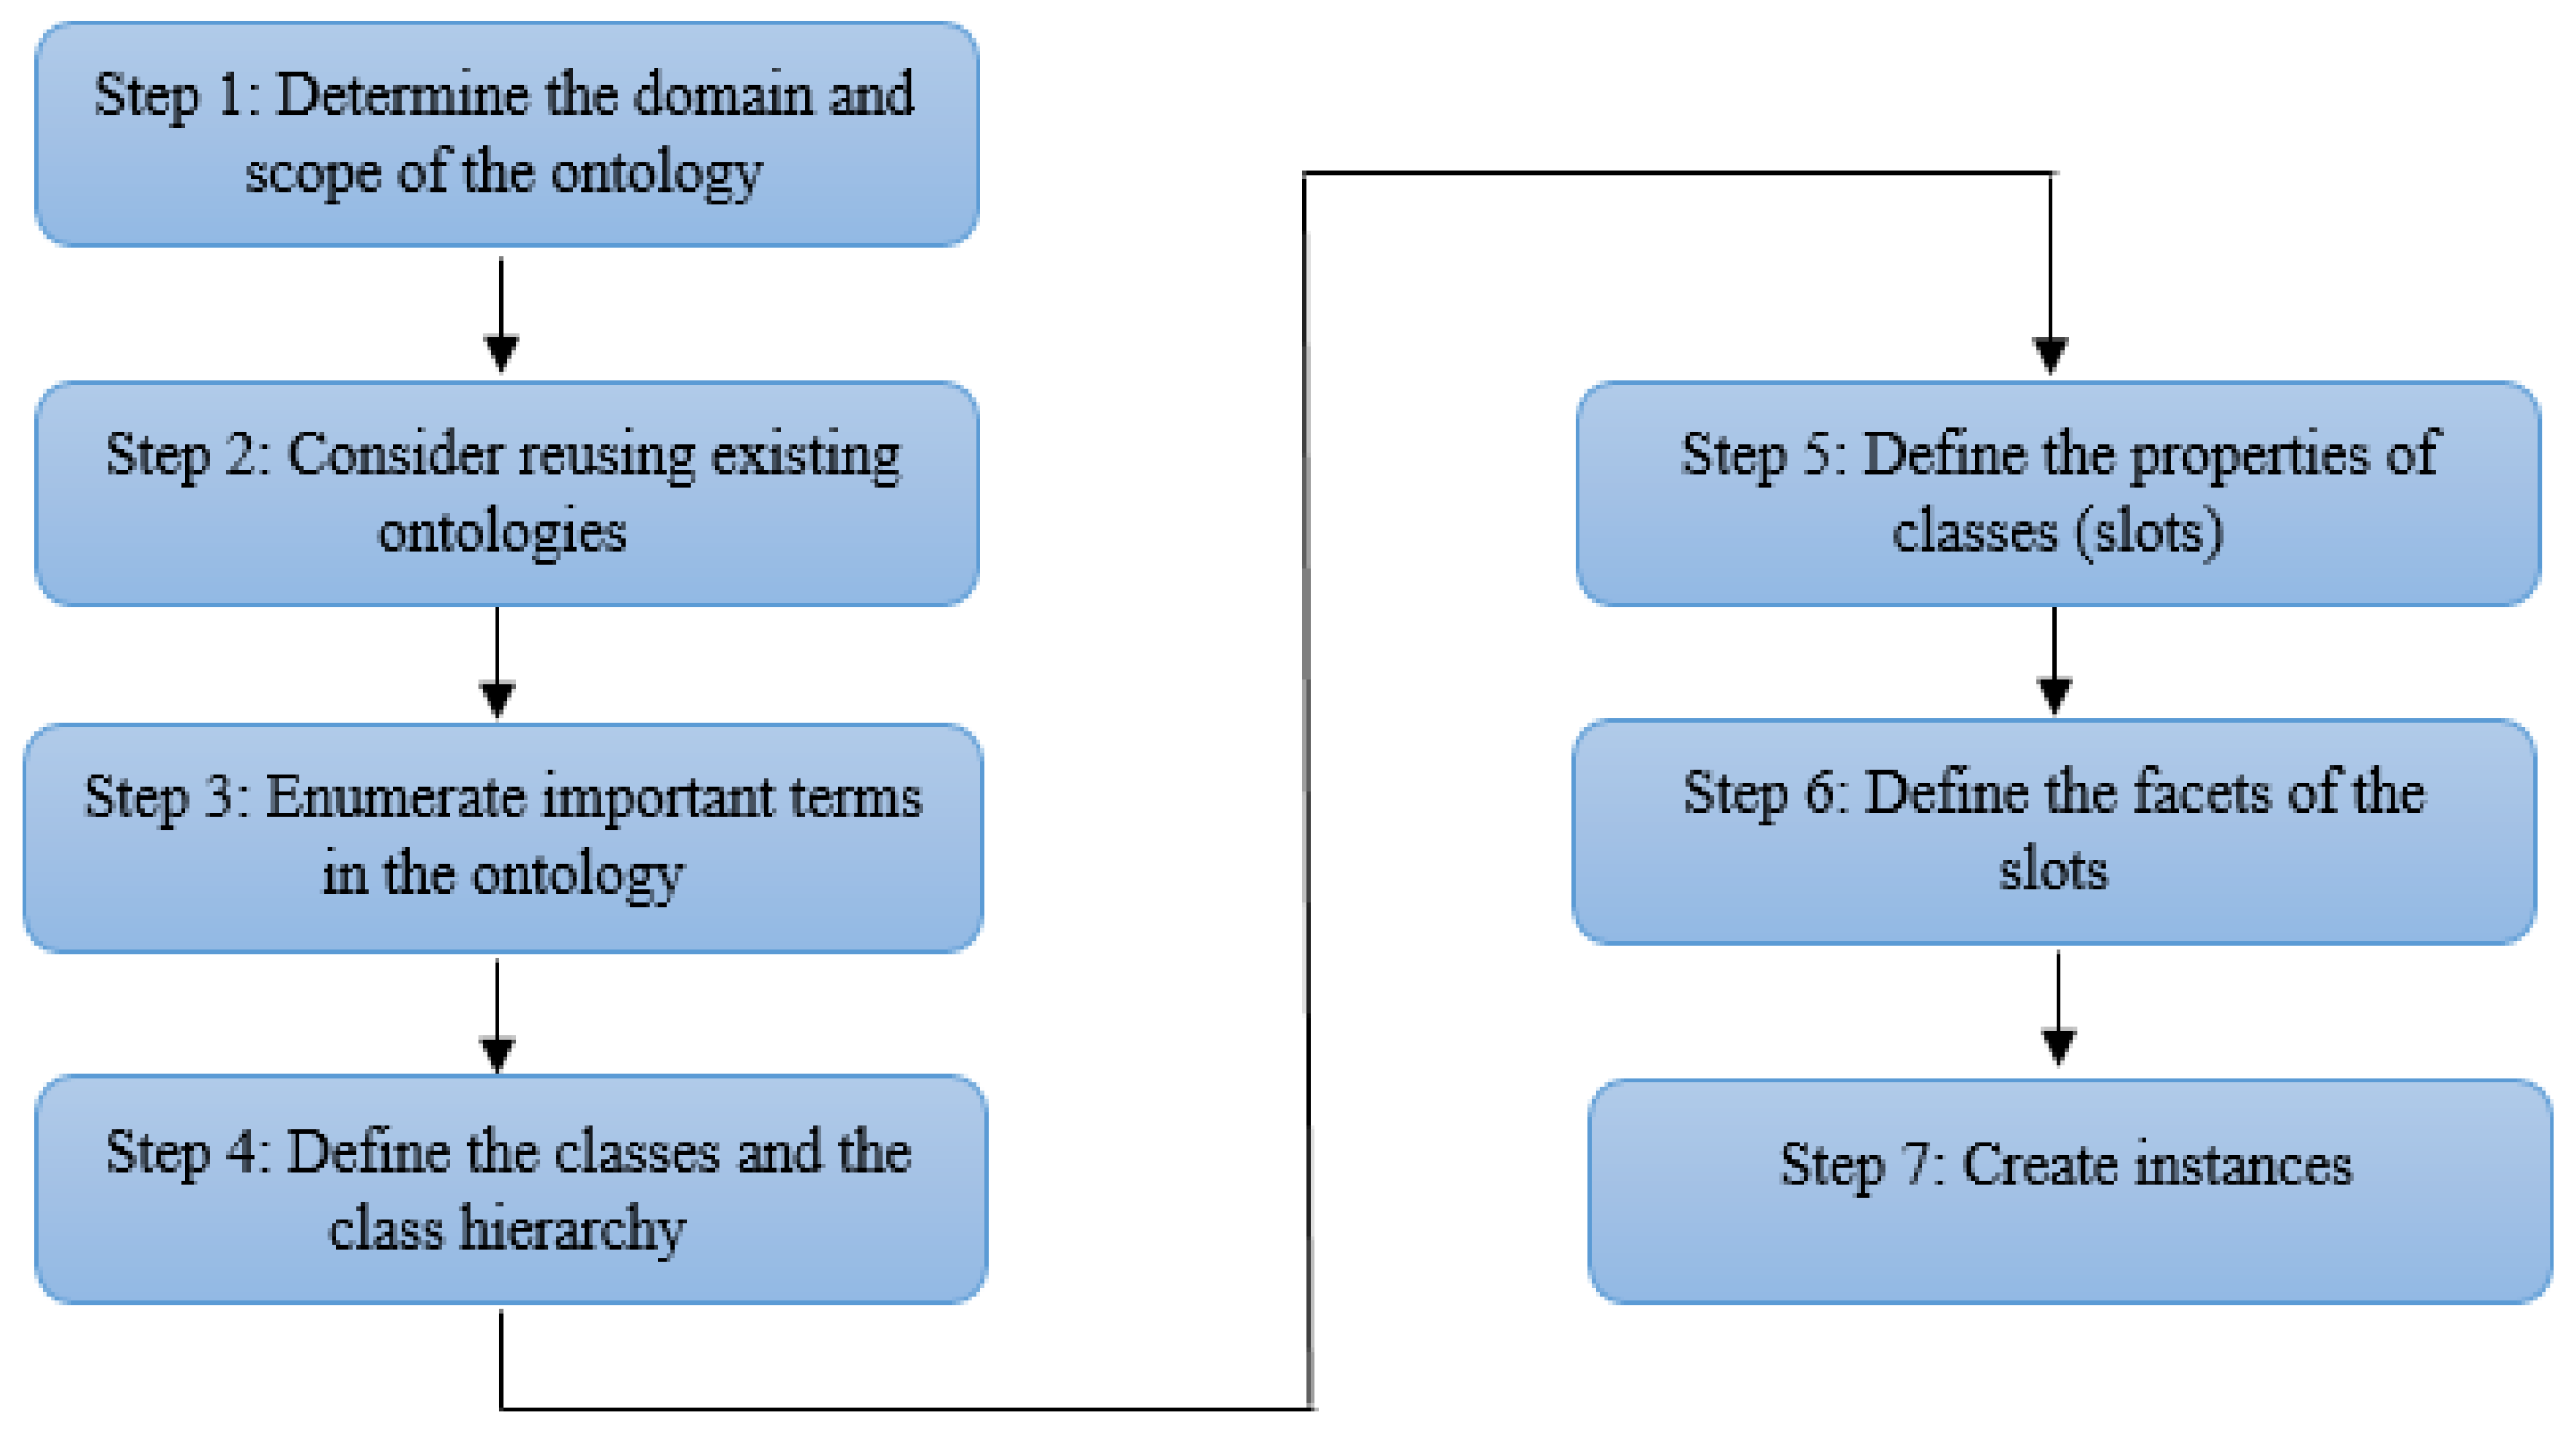
Figure 2.
The main classes of SciOnt.
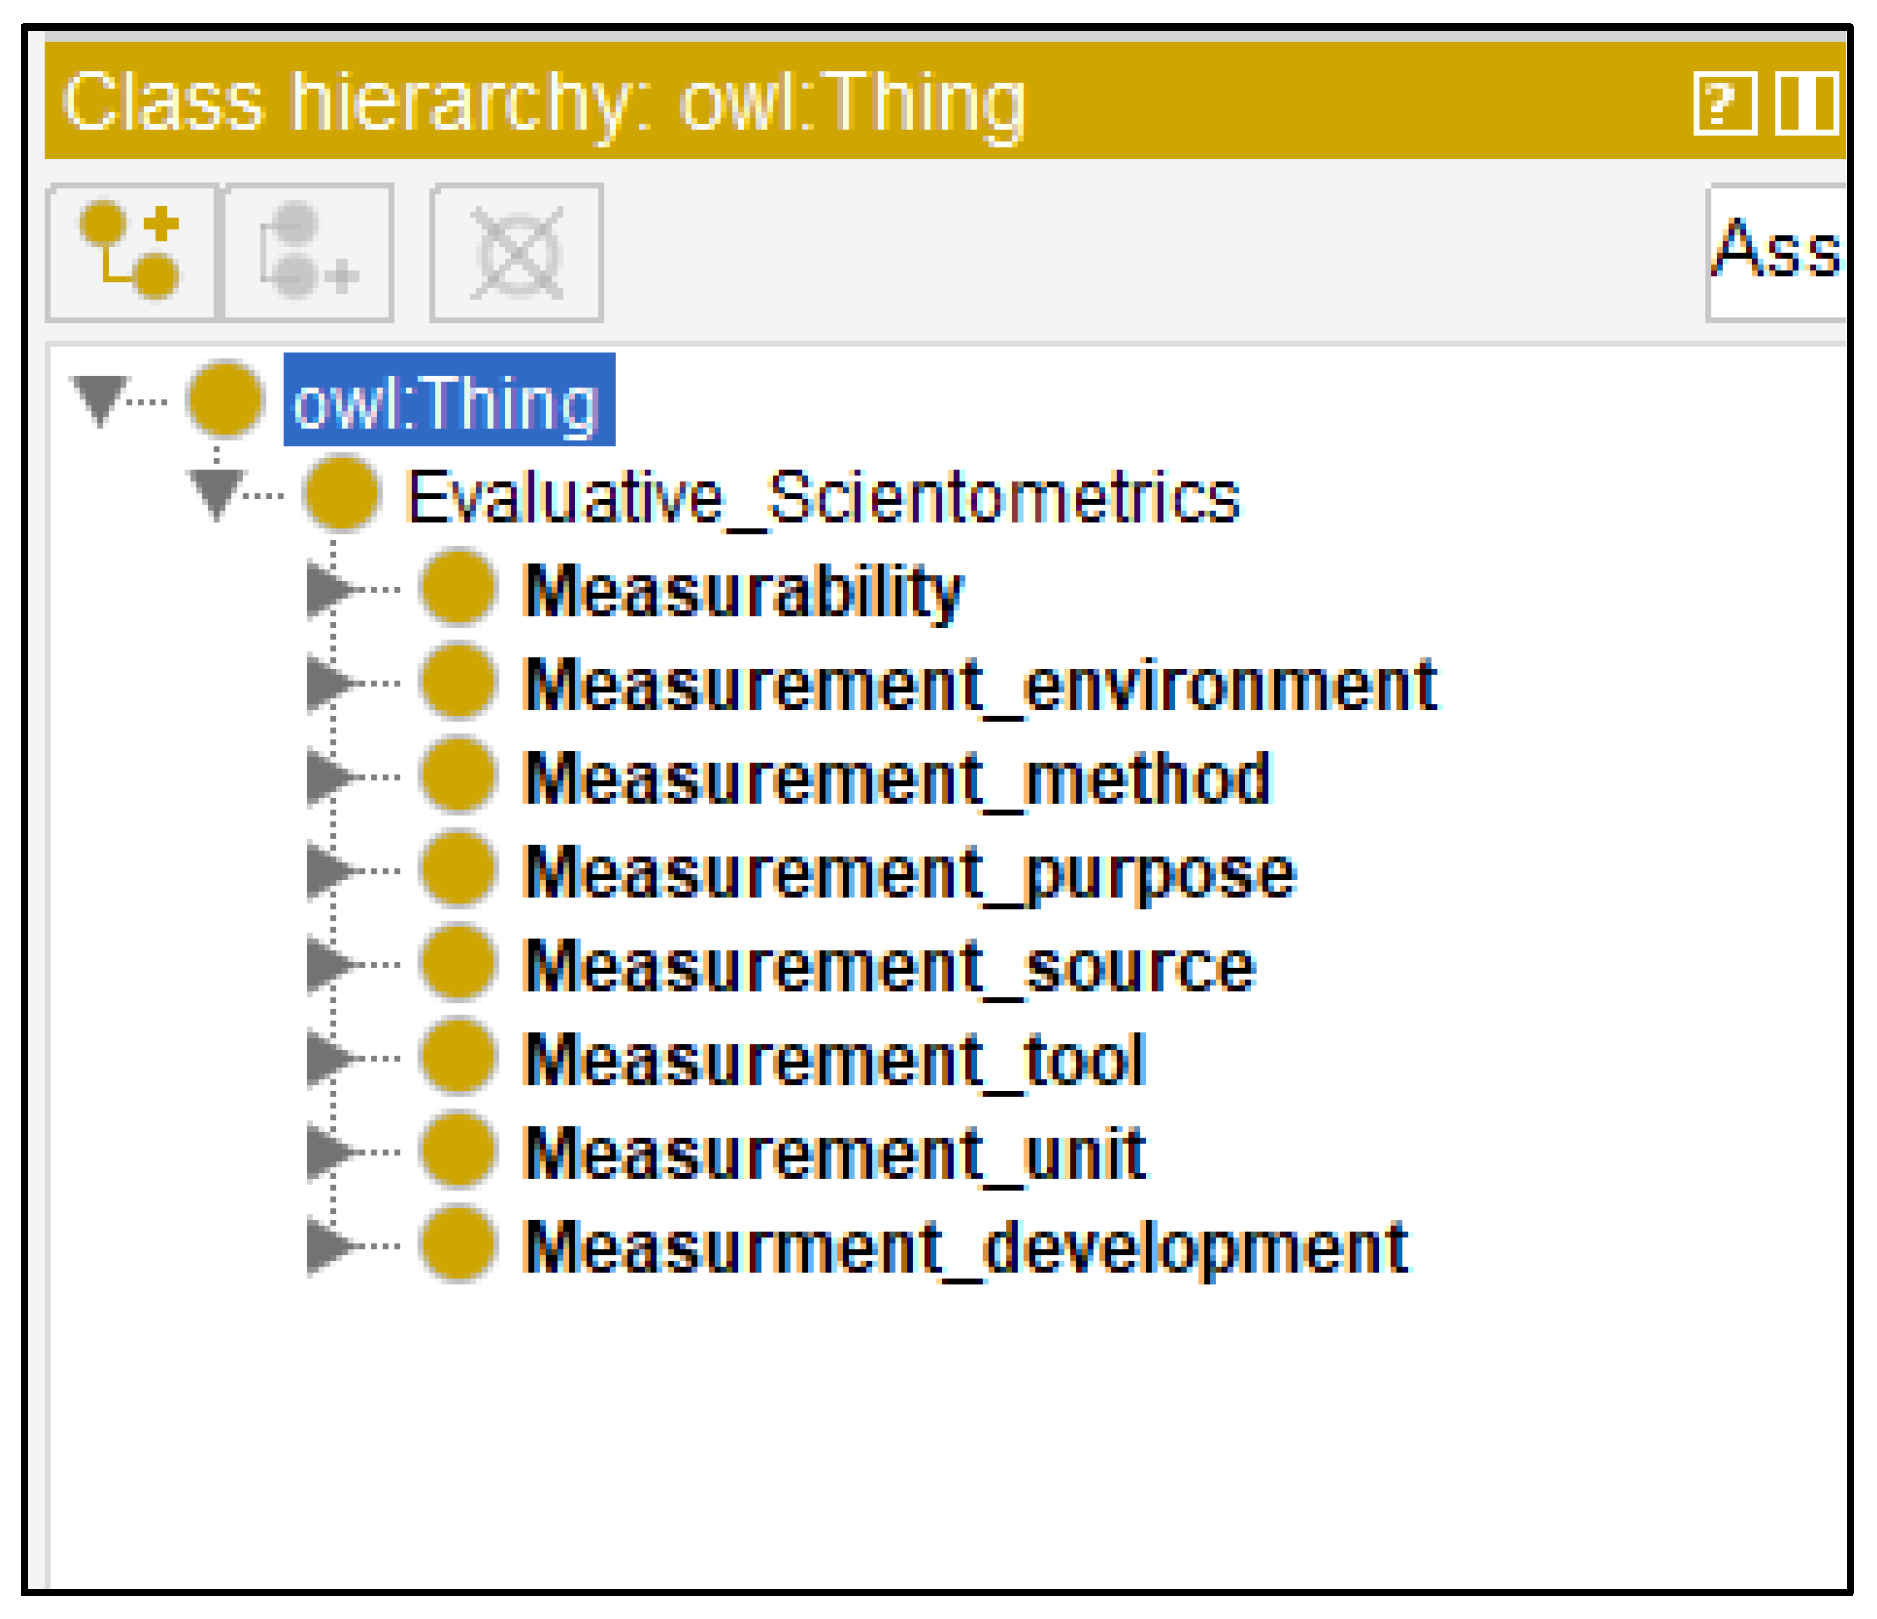
Figure 3.
The class hierarchy of SciOnt.
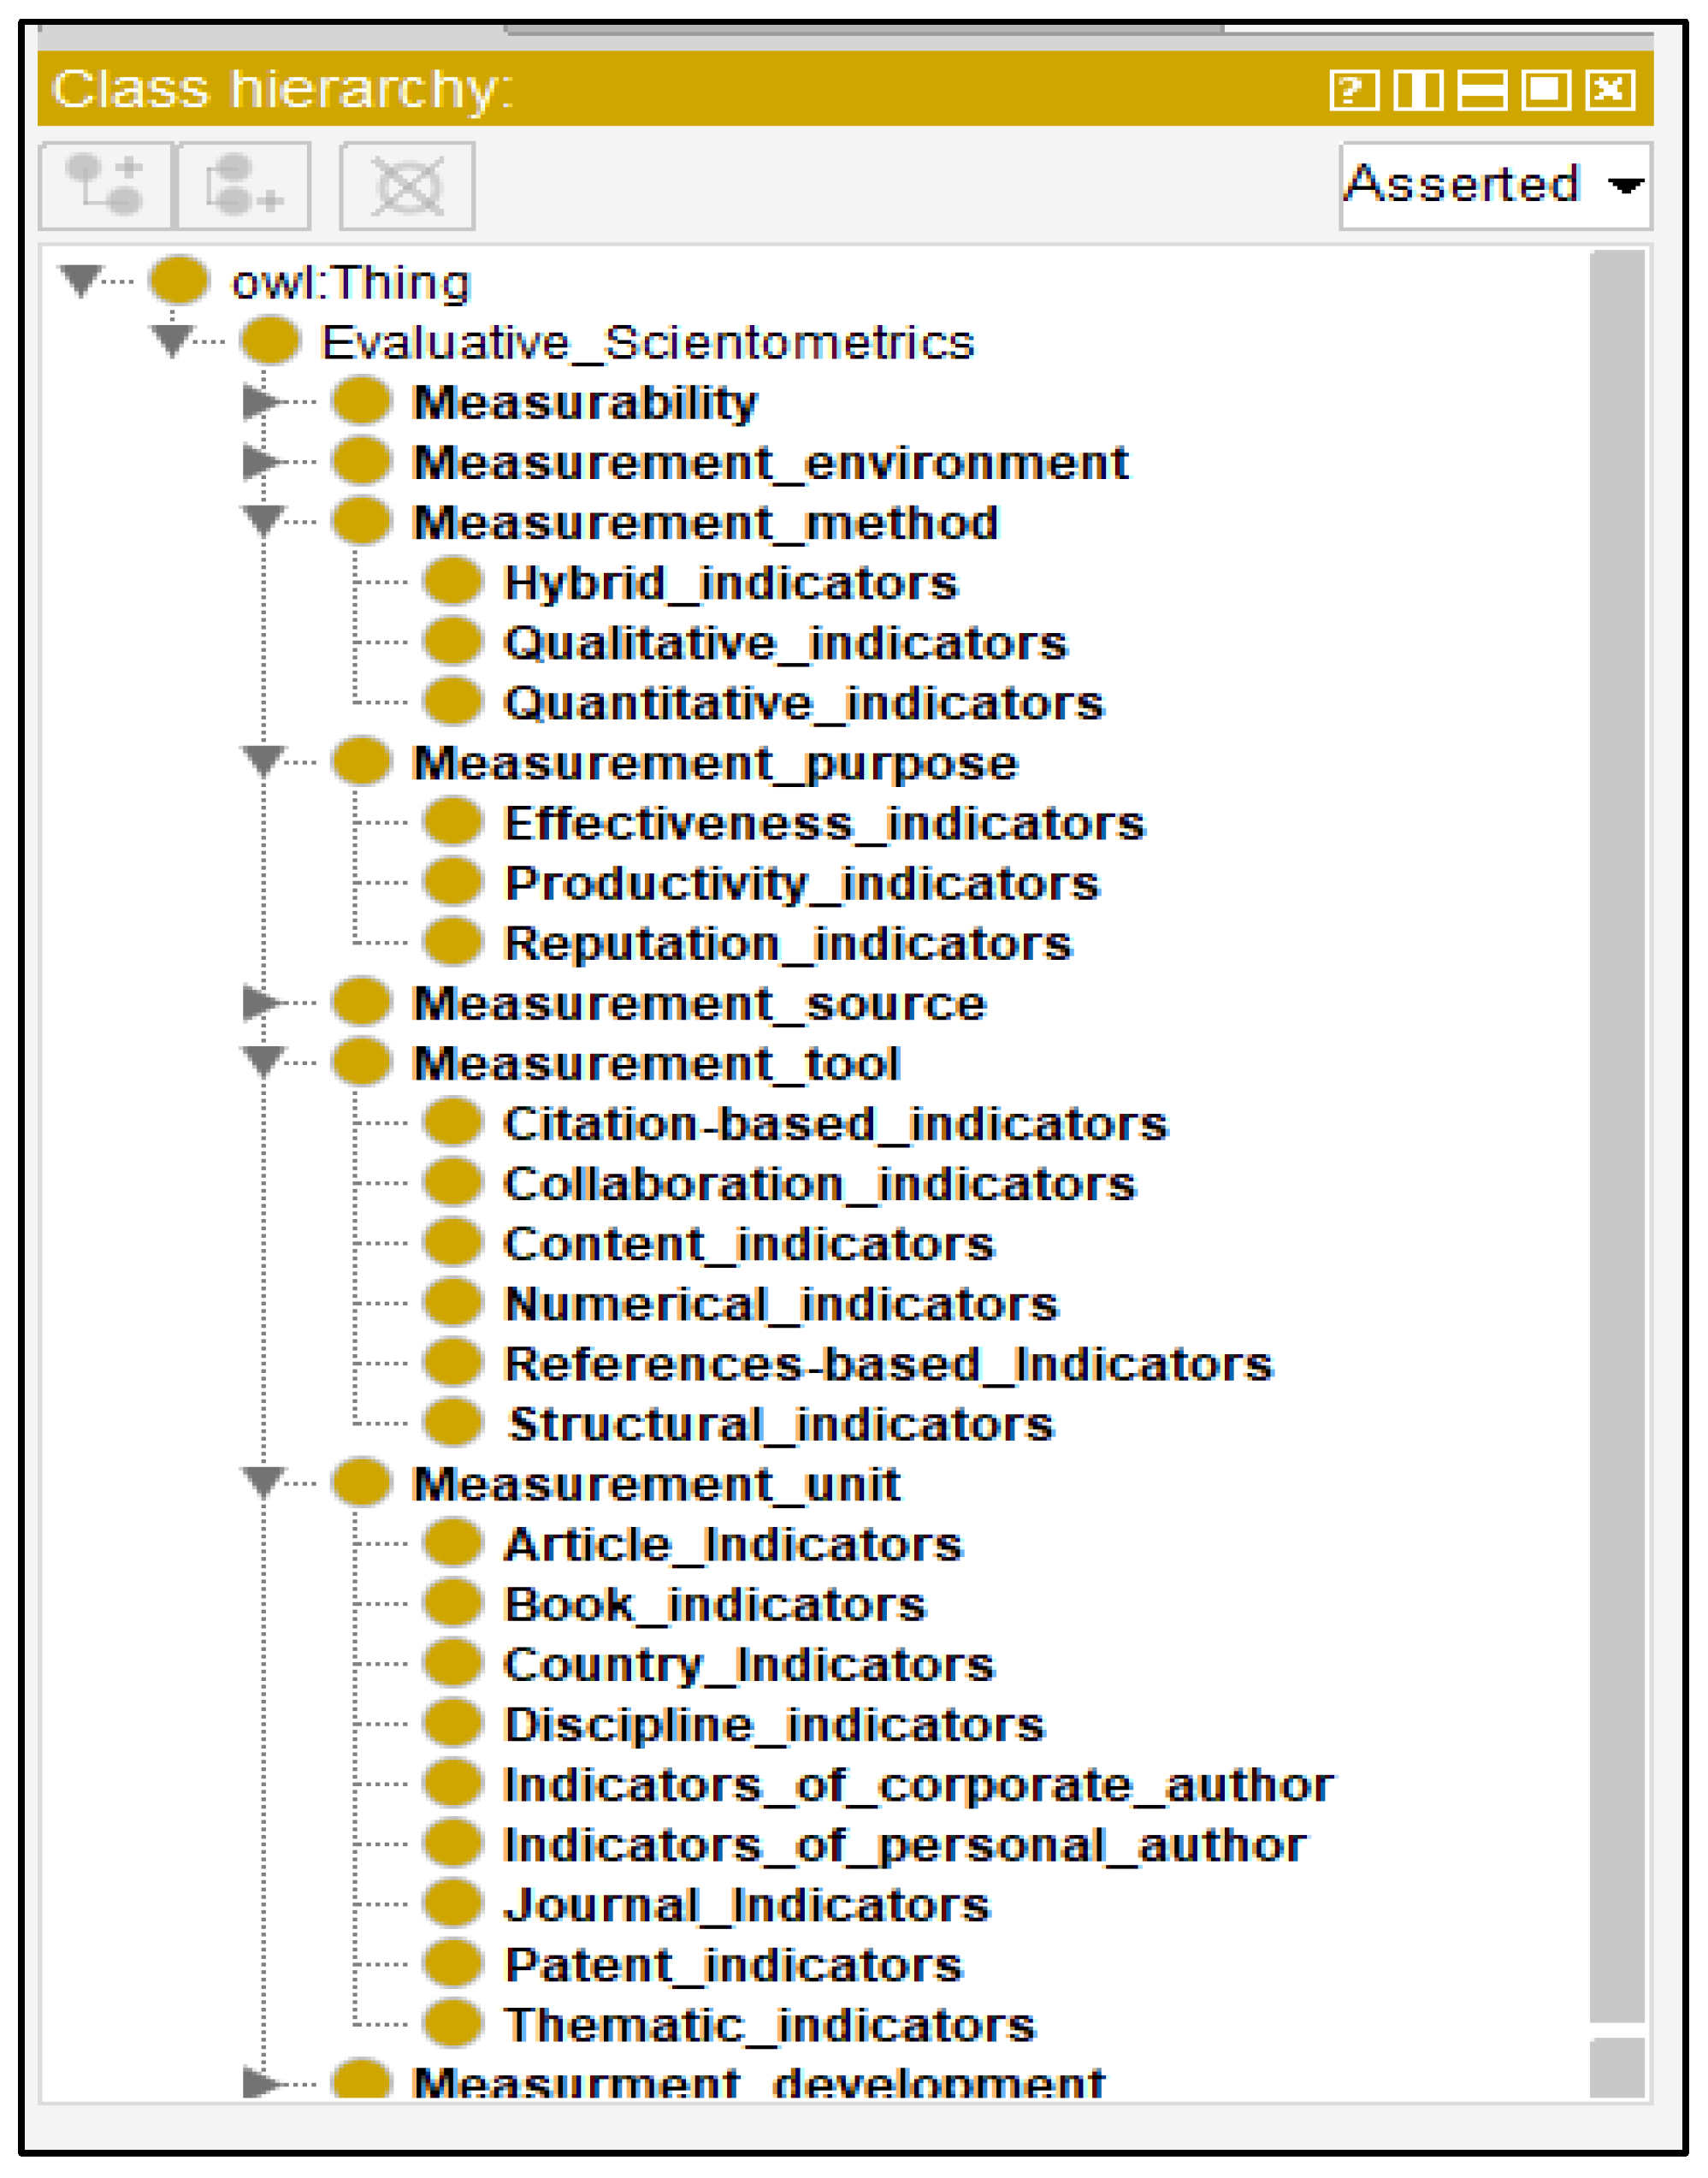
Figure 4.
Annotation properties for the “Altmetric Indicators” class.
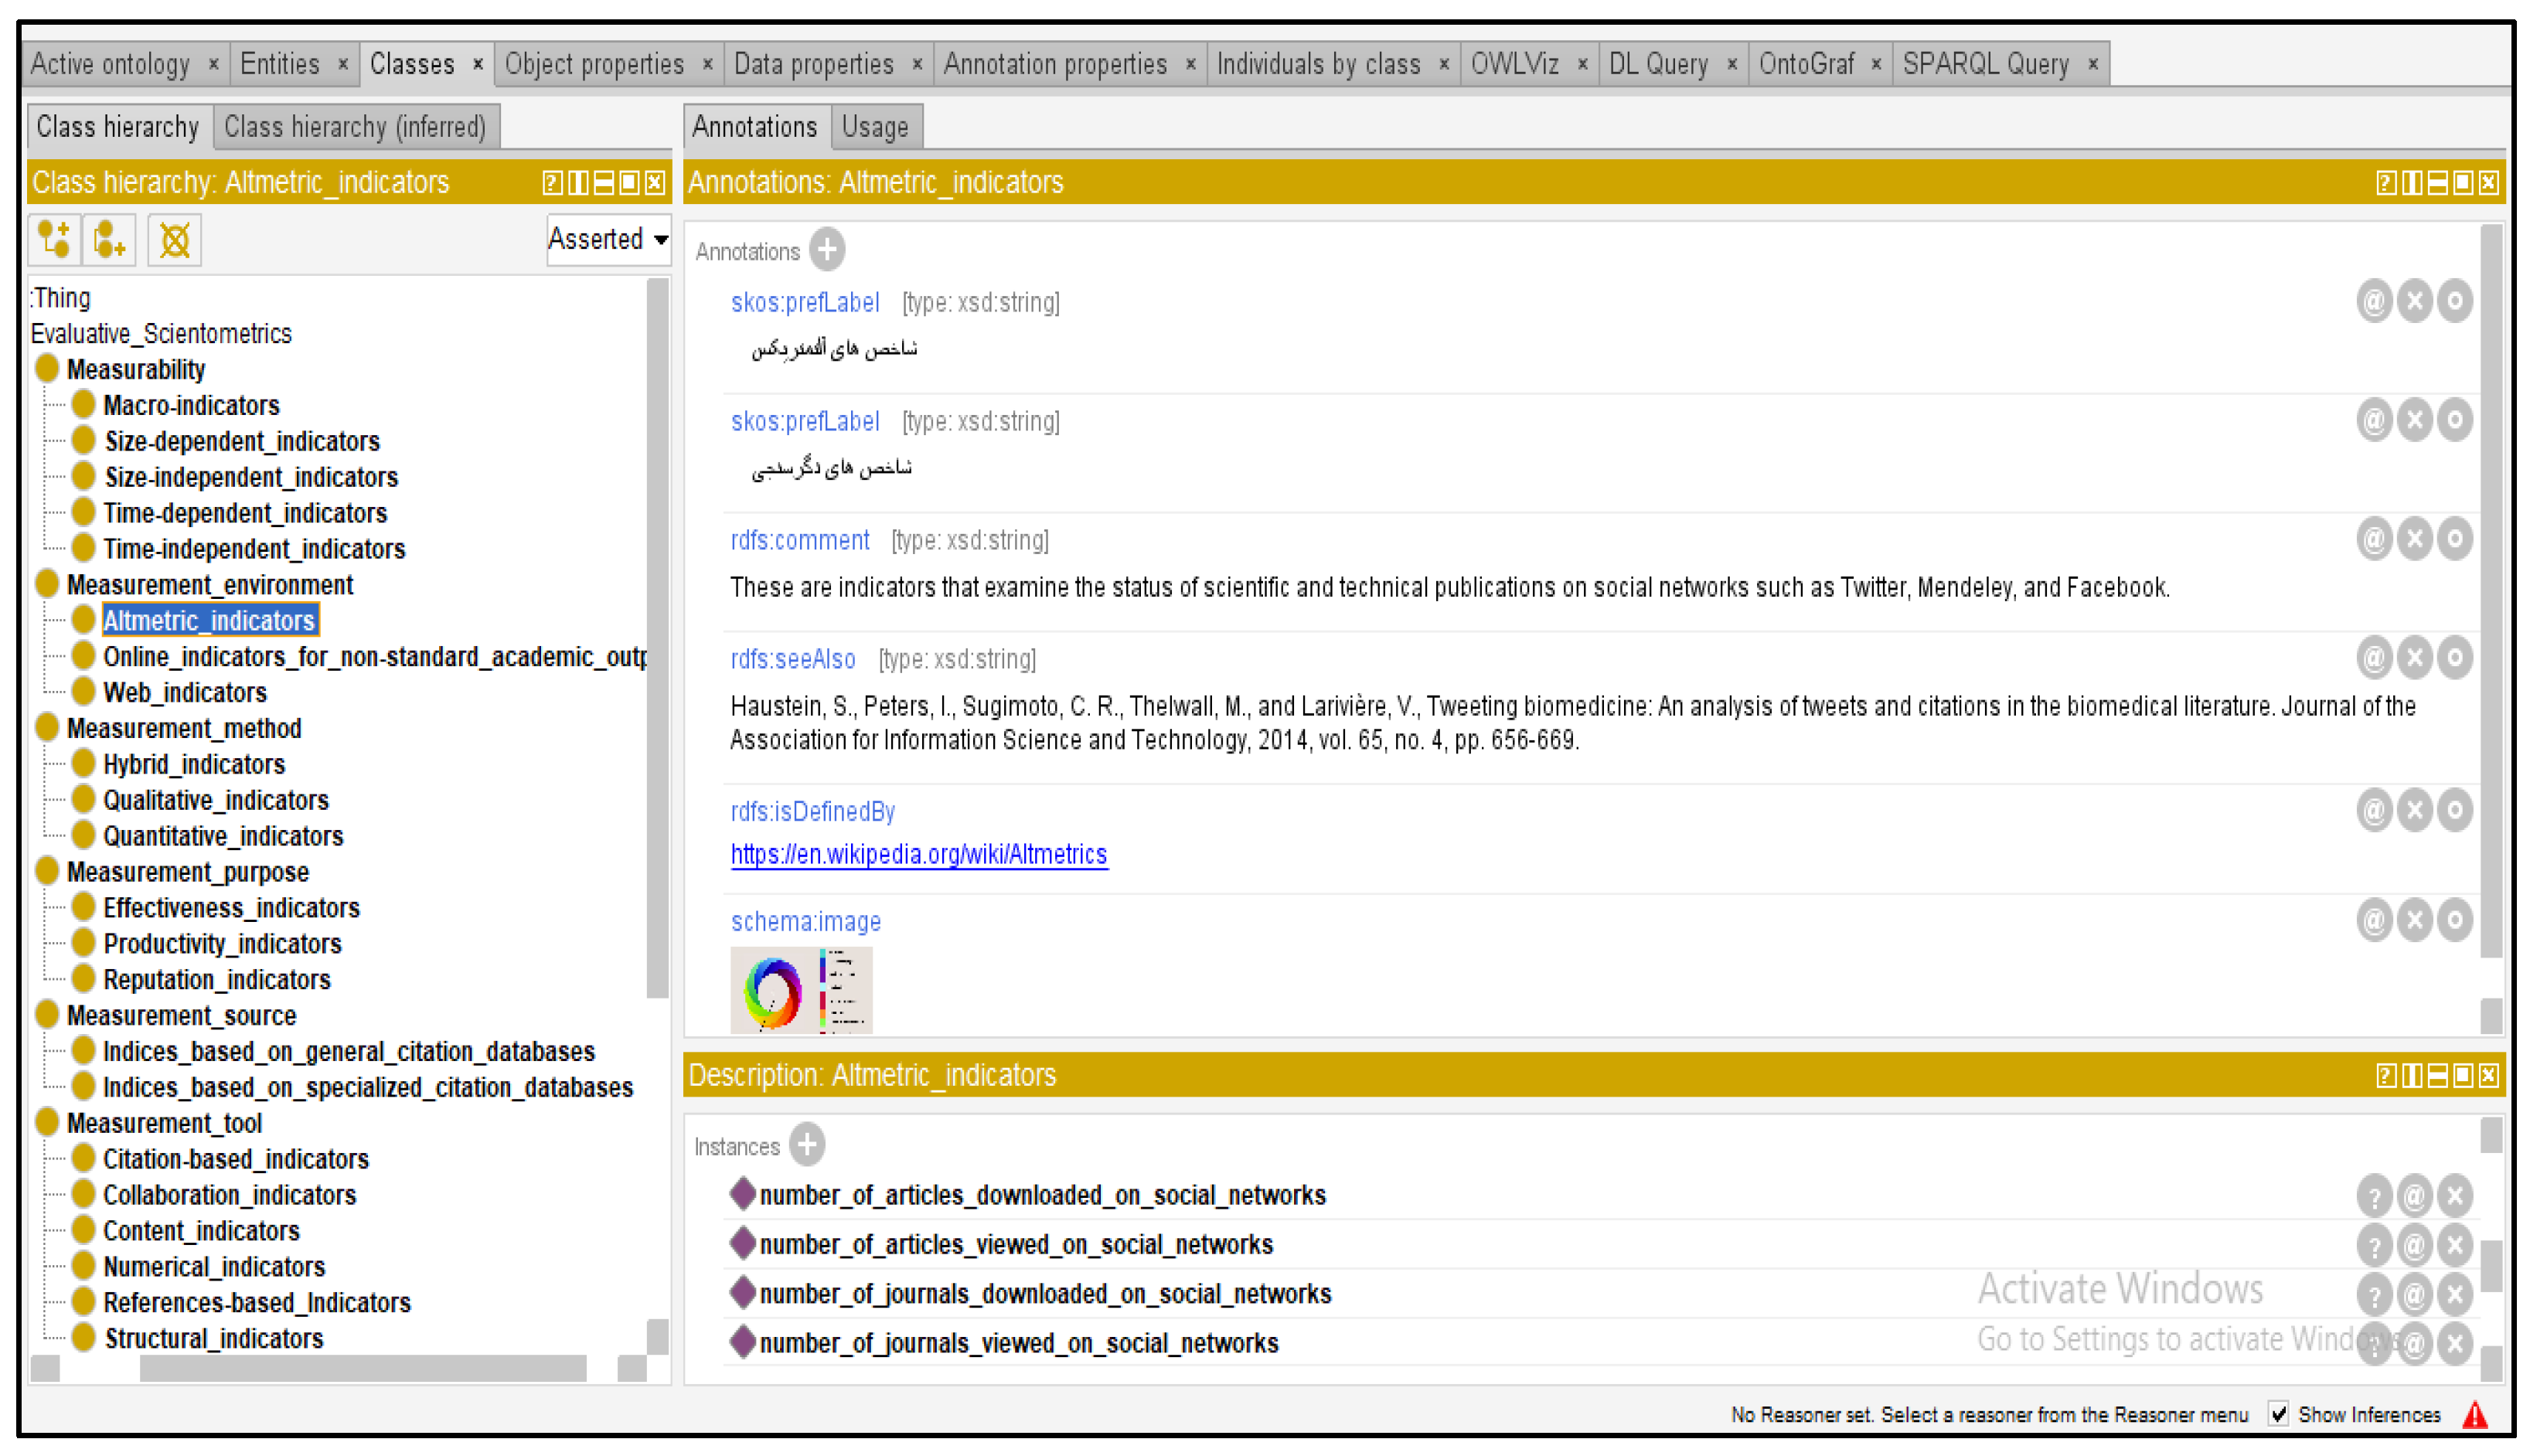
Figure 5.
Specified properties for the “Journal Impact Factor” individual.
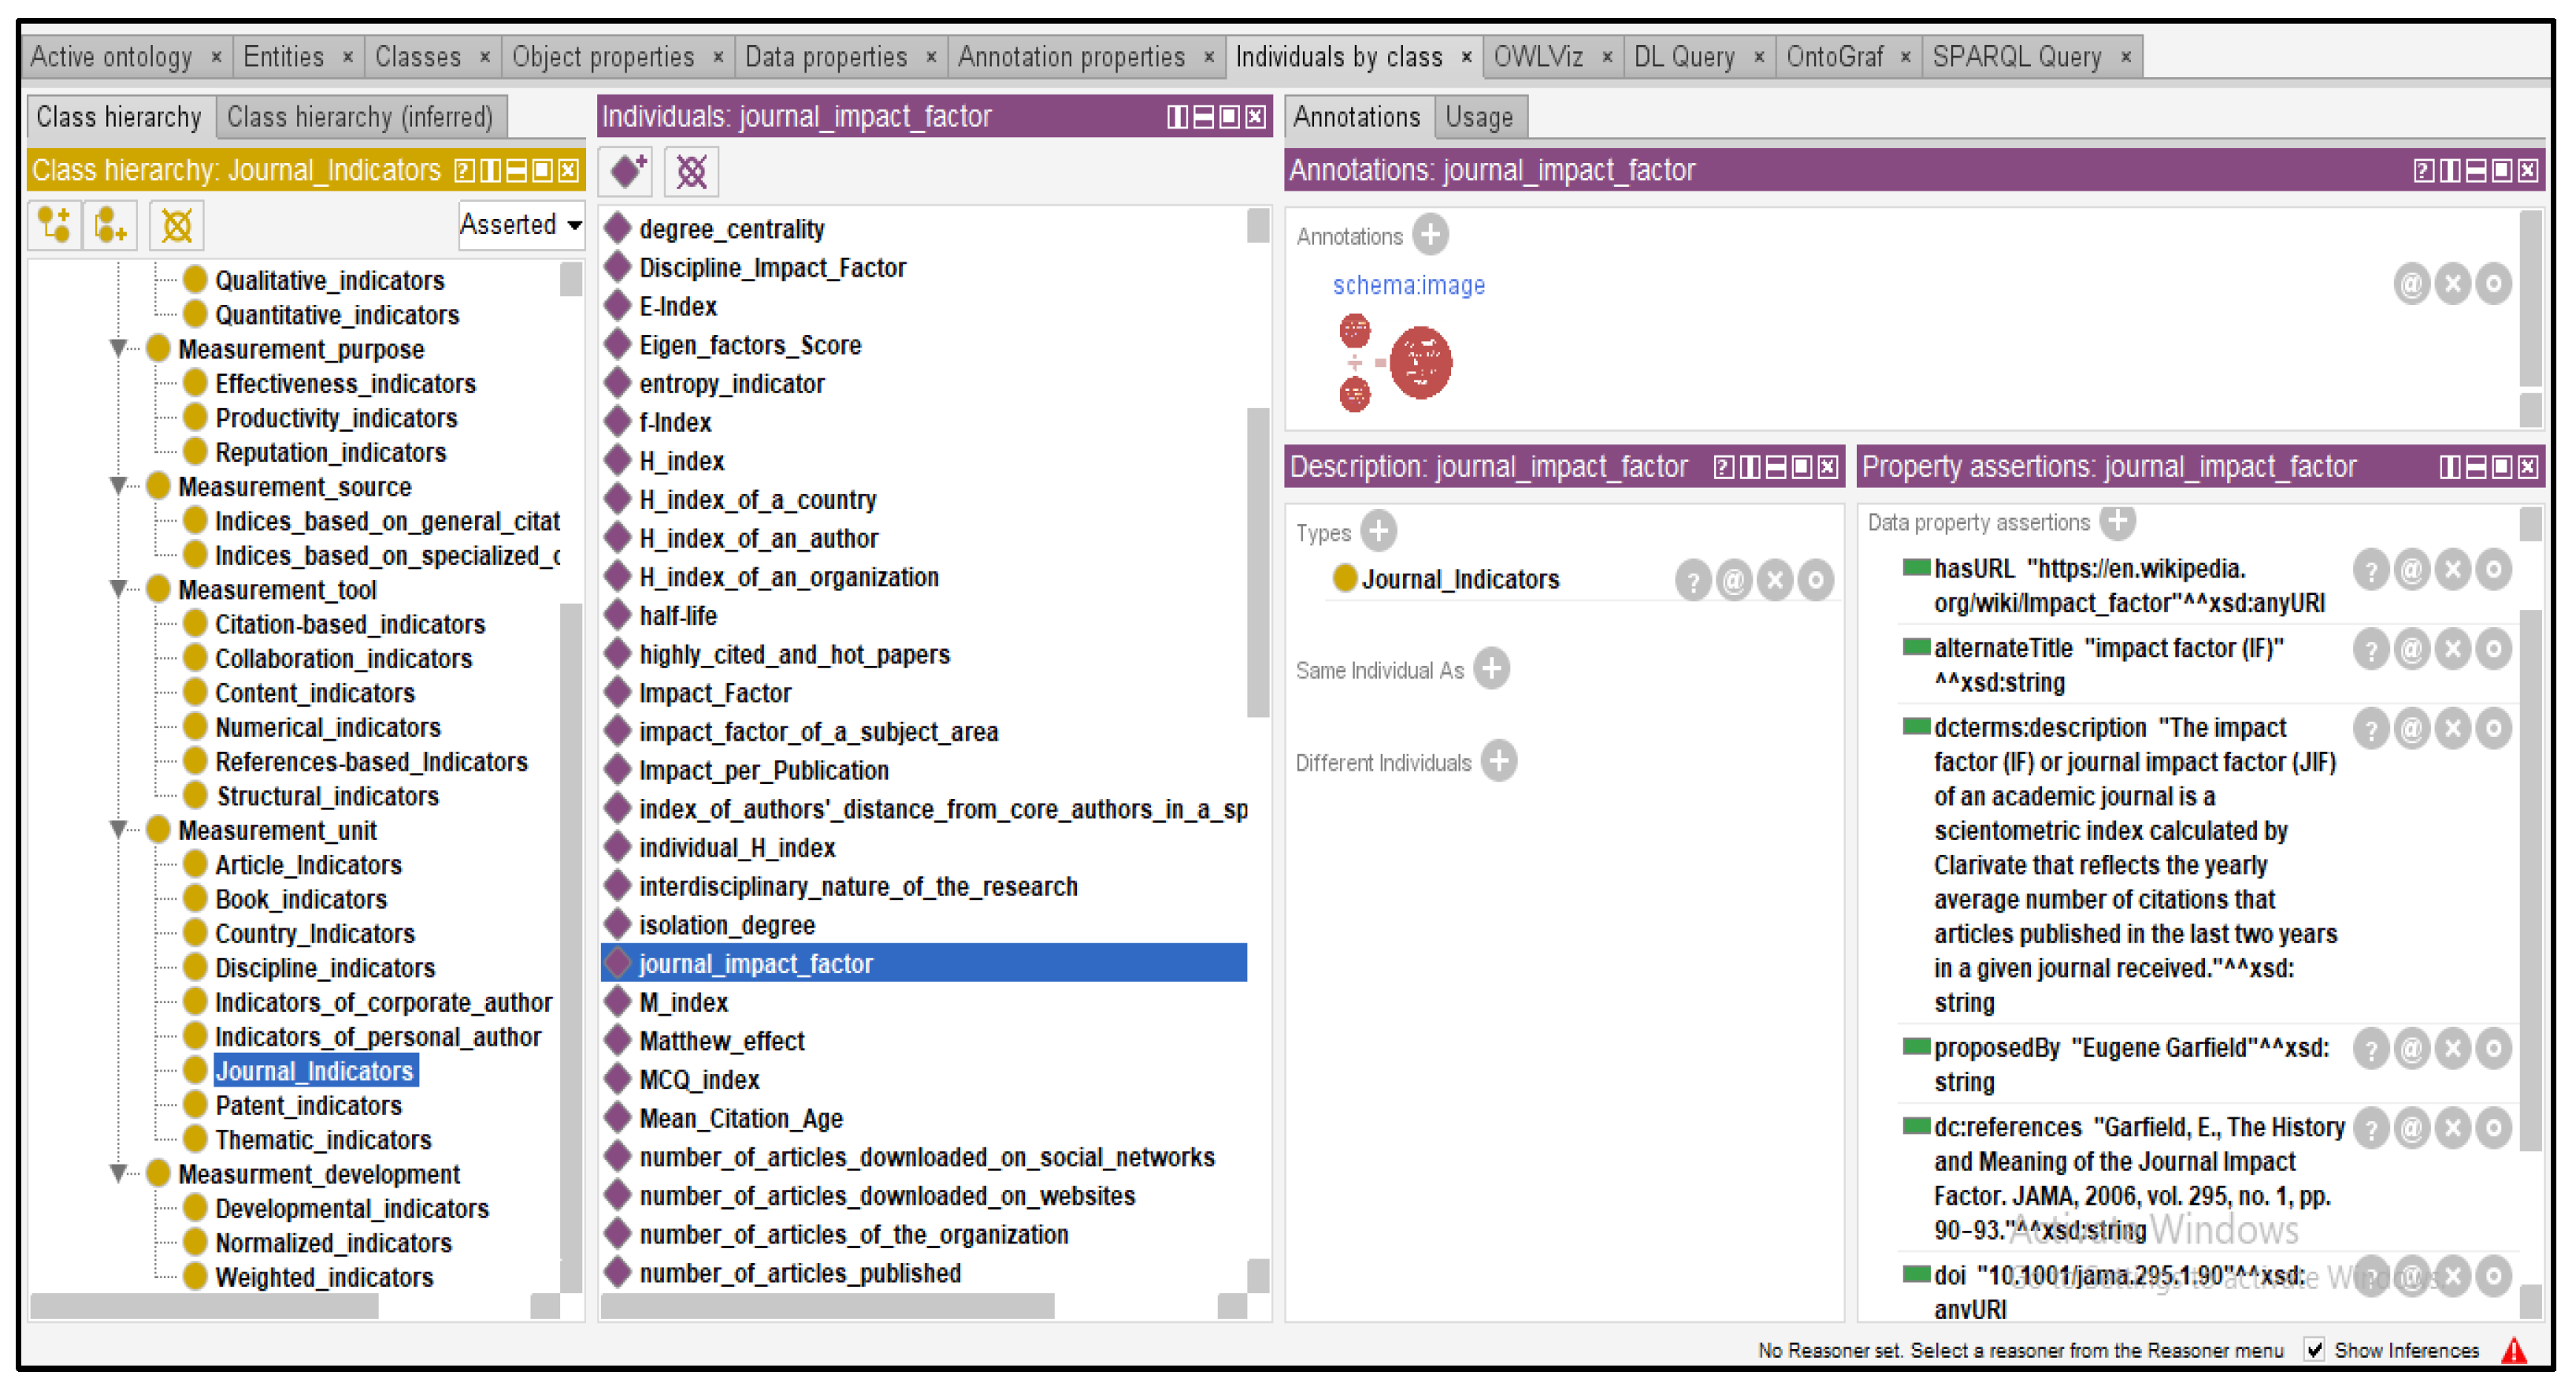
Figure 6.
Specified properties for the “Bradford’s Law” individual.
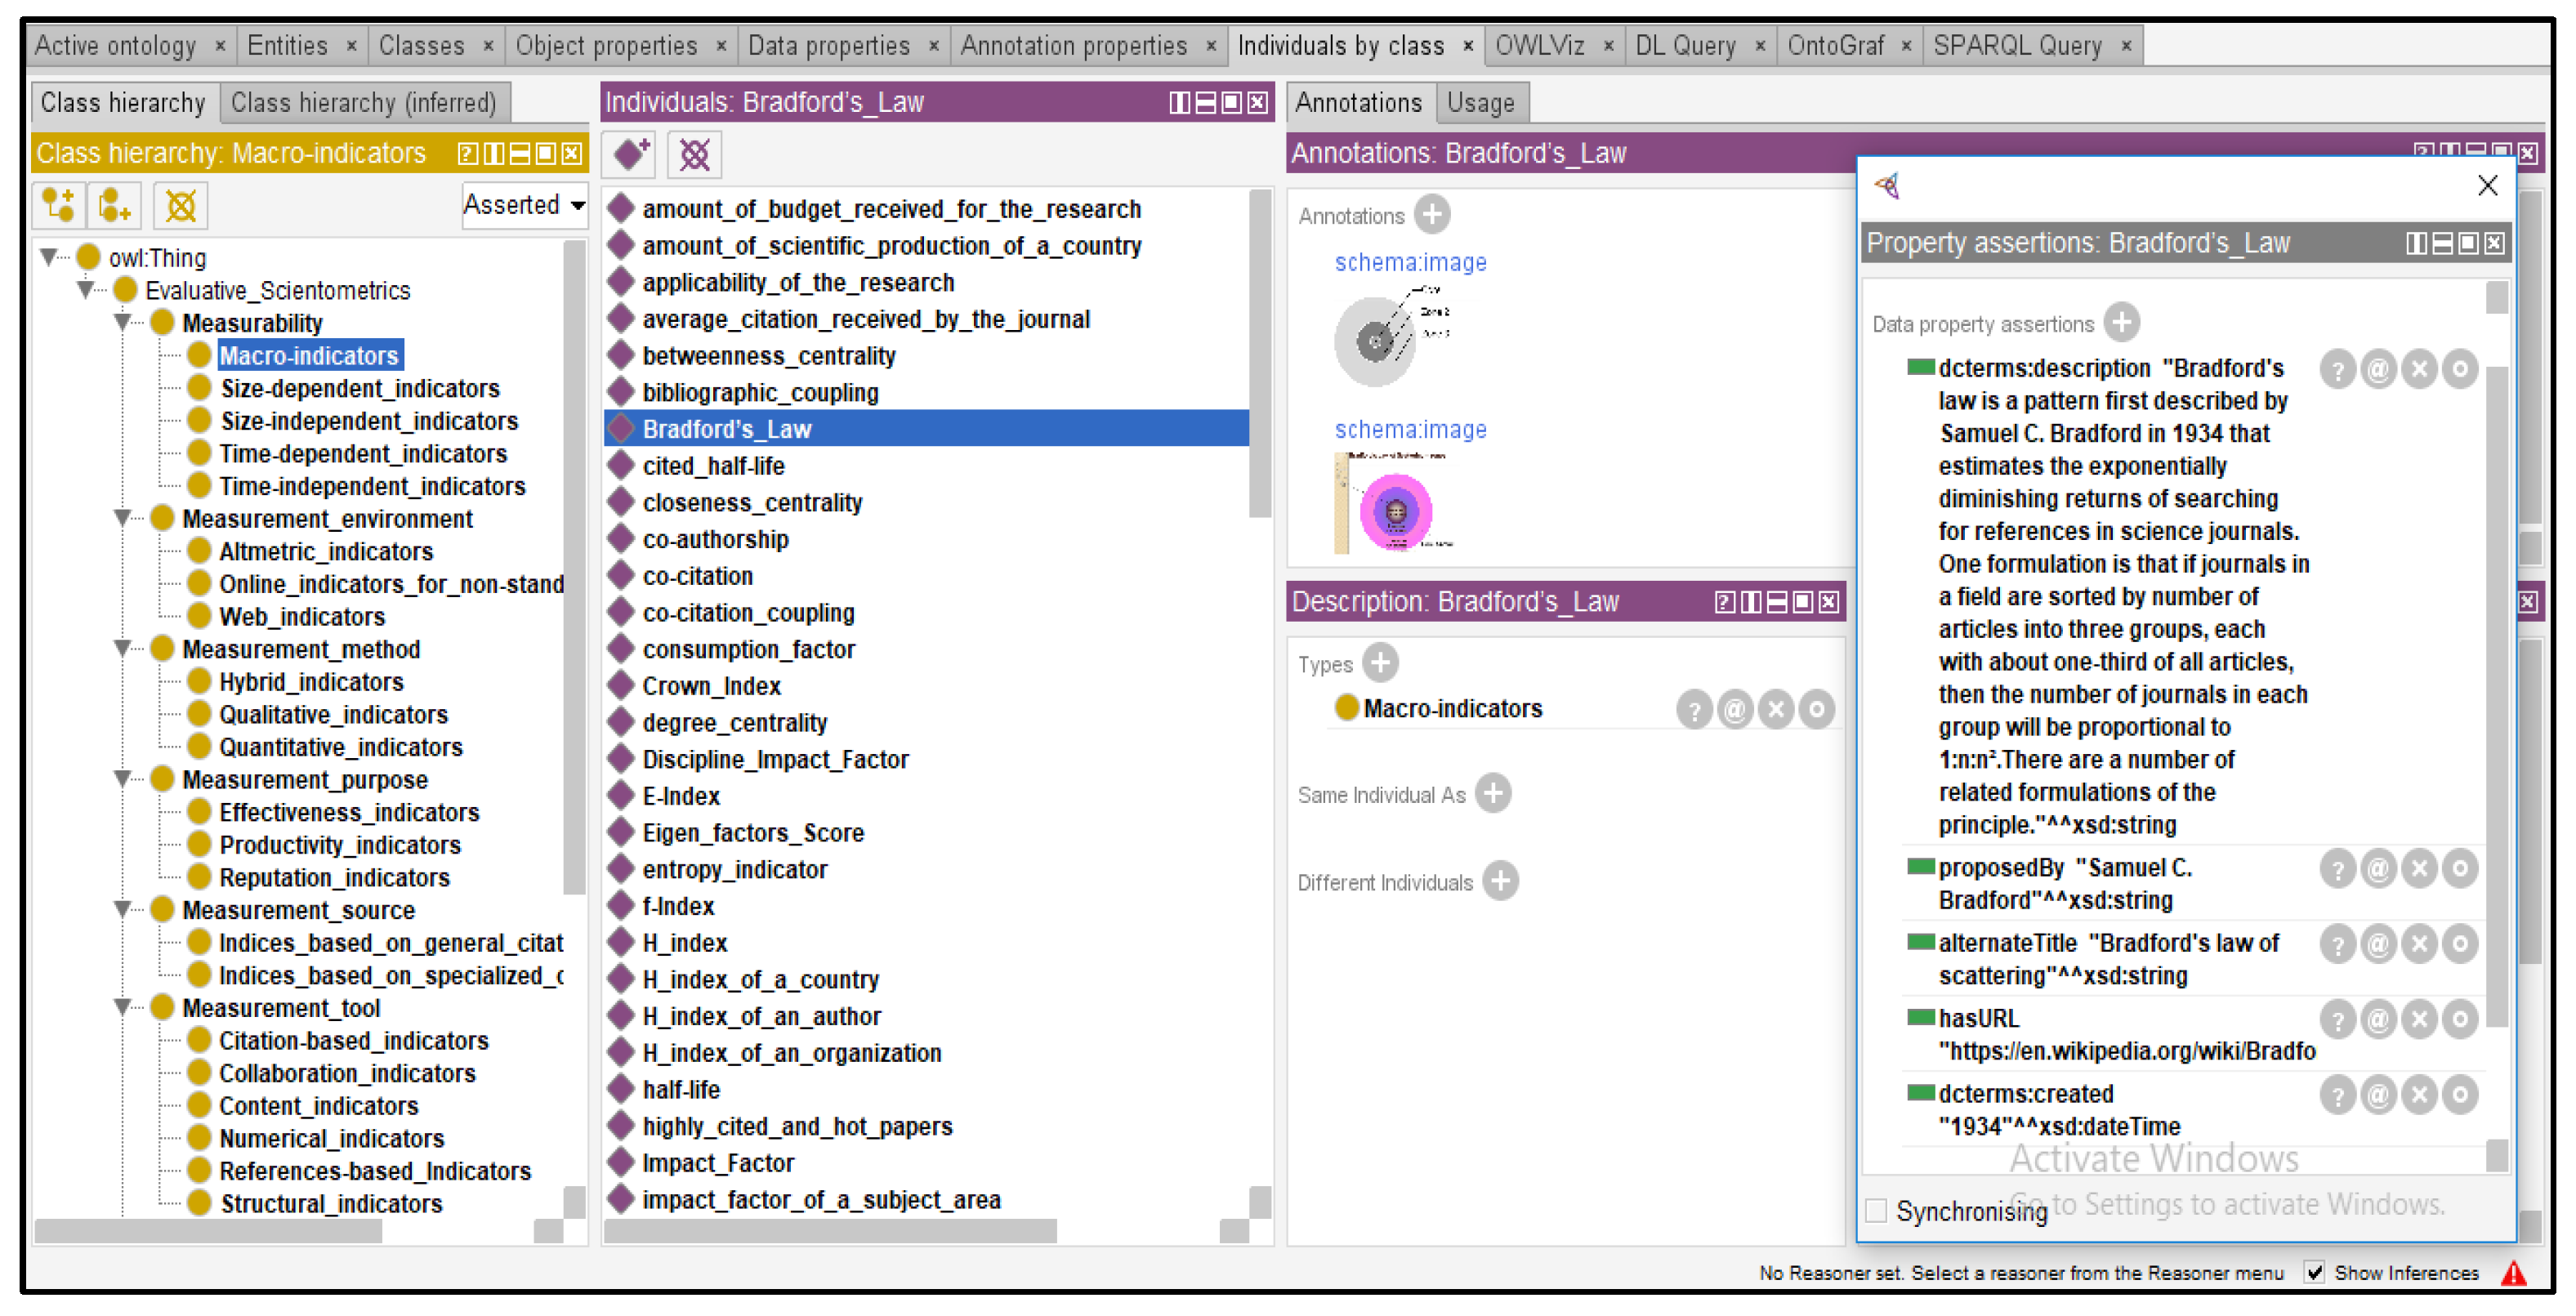
Figure 7.
The graph view of the SciOnt ontology with OntoGraph.
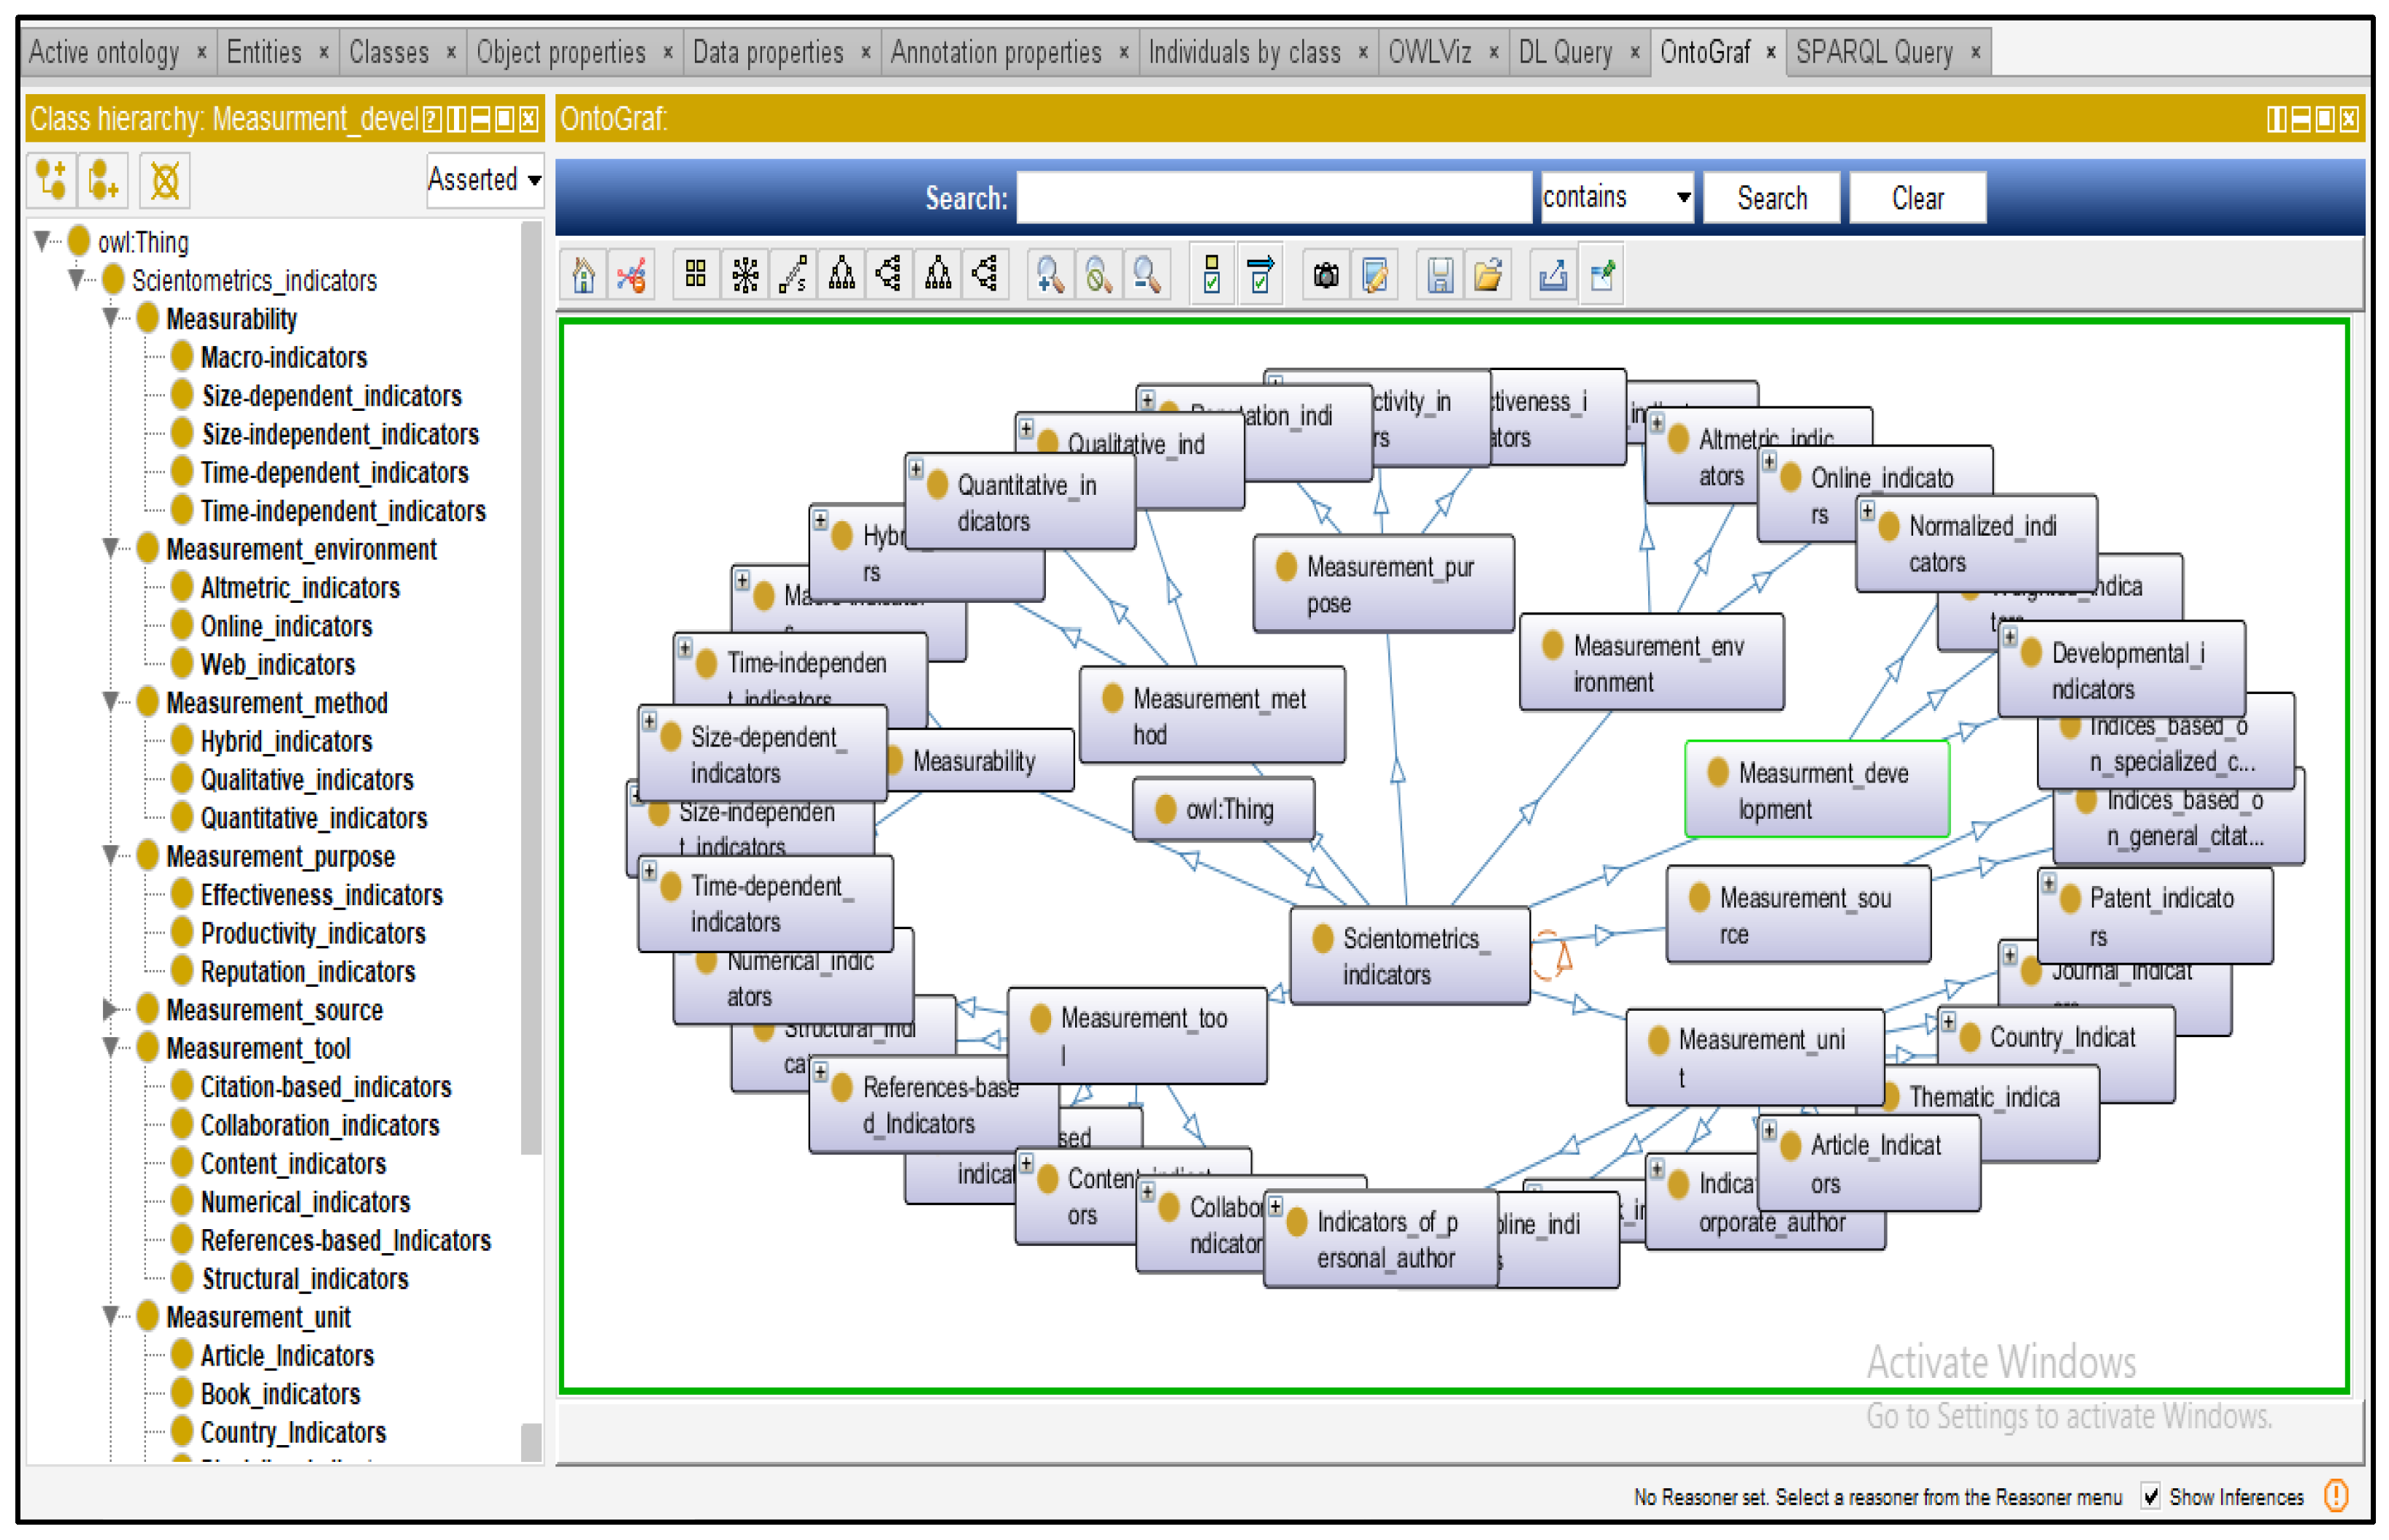
Figure 8.
The graph view of the “Journal Indicators” class with OntoGraph.
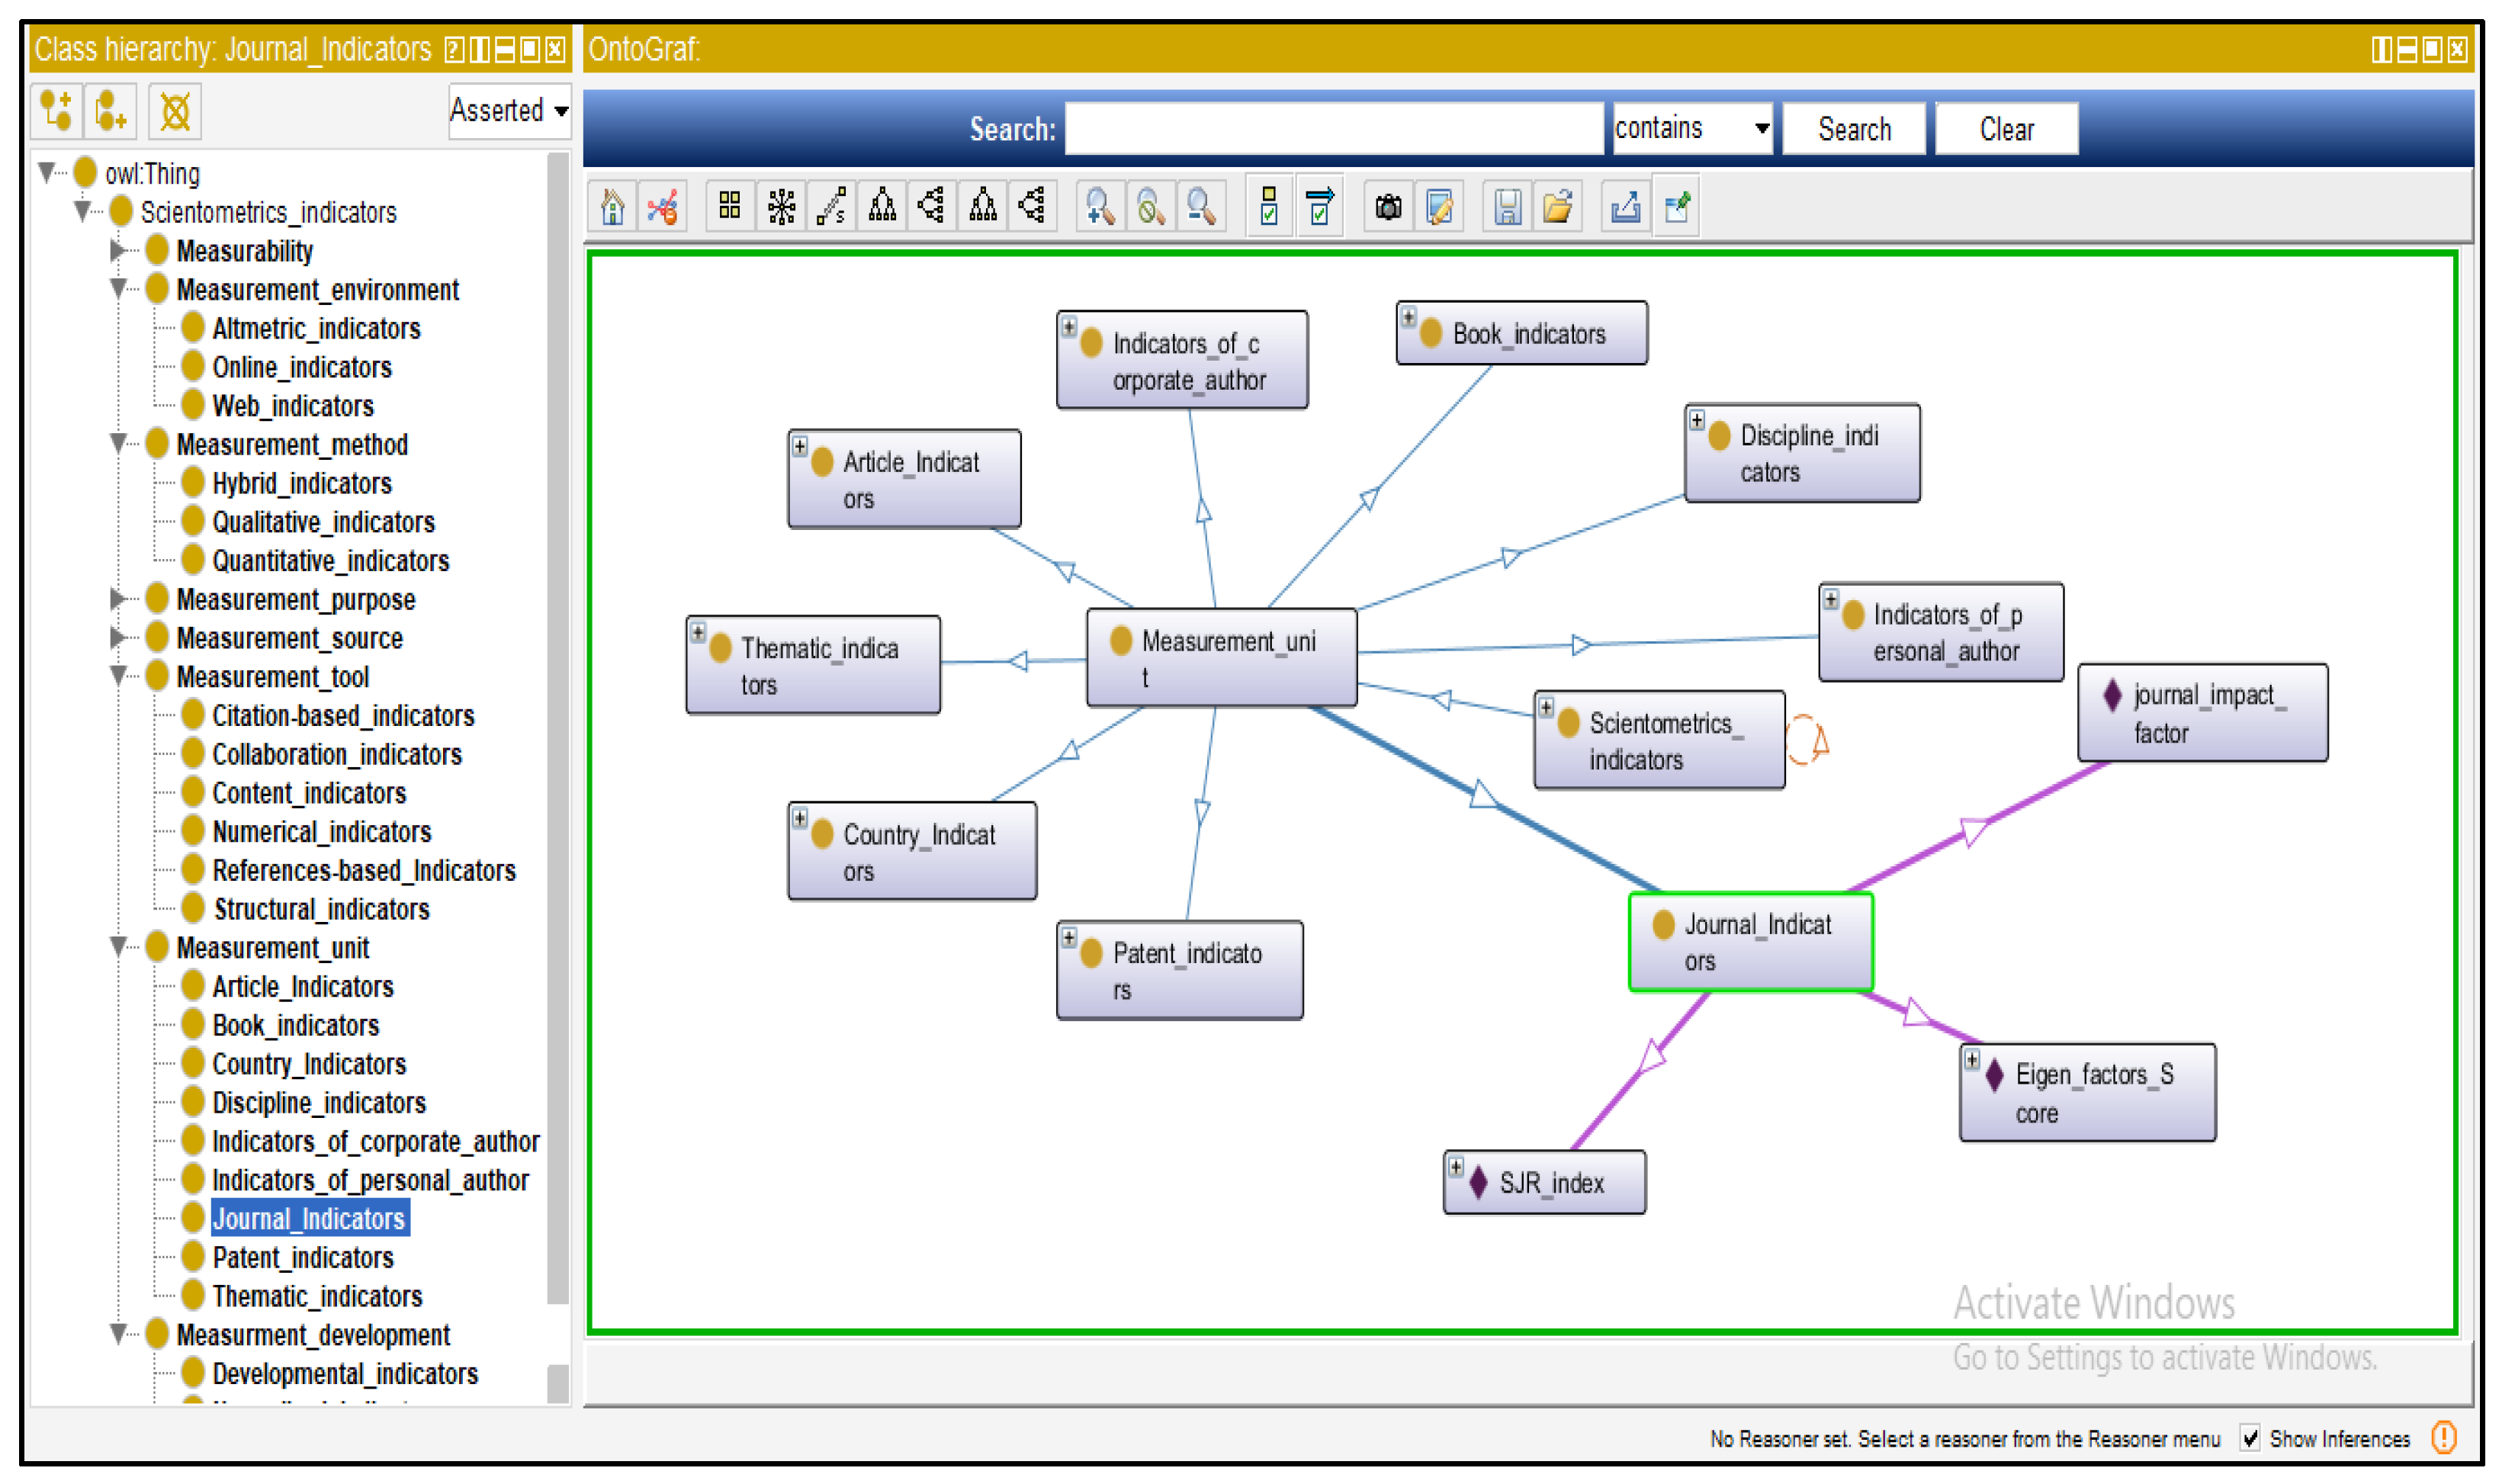
Figure 9.
The graph view of the defined properties for the “Journal Impact Factor”.
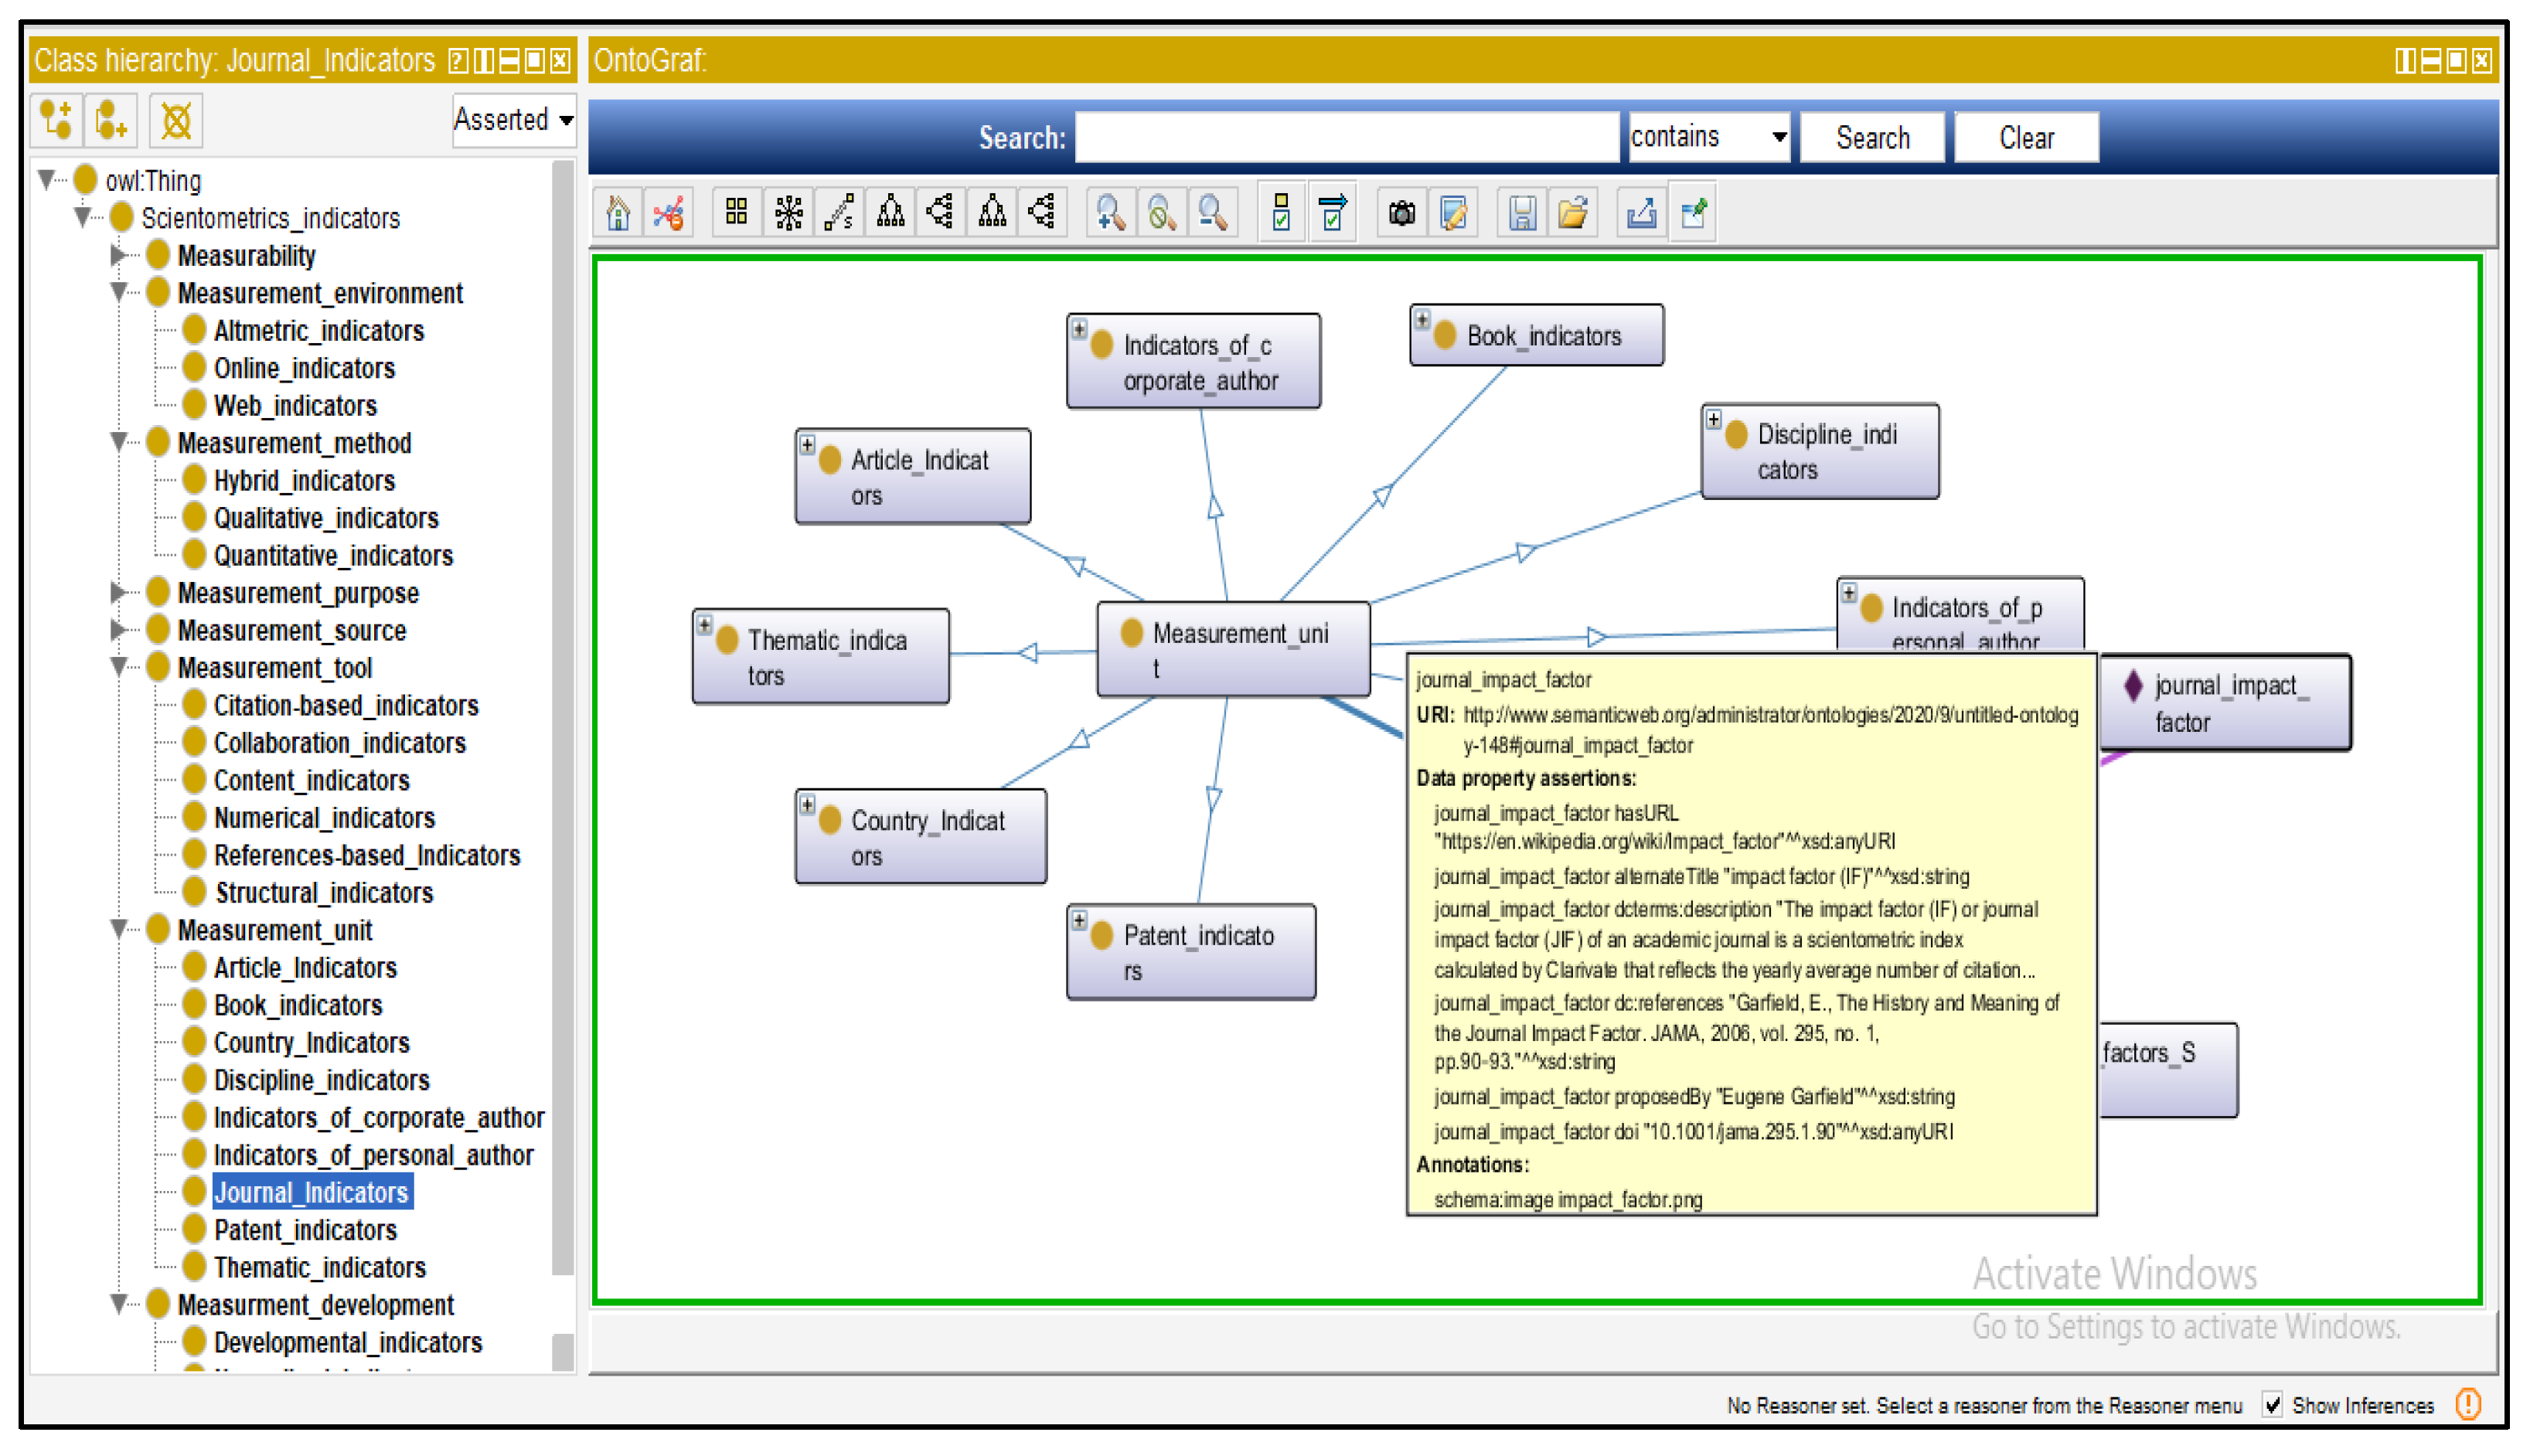
Figure 10.
The graph view of the SciOnt ontology with the OWLViz.
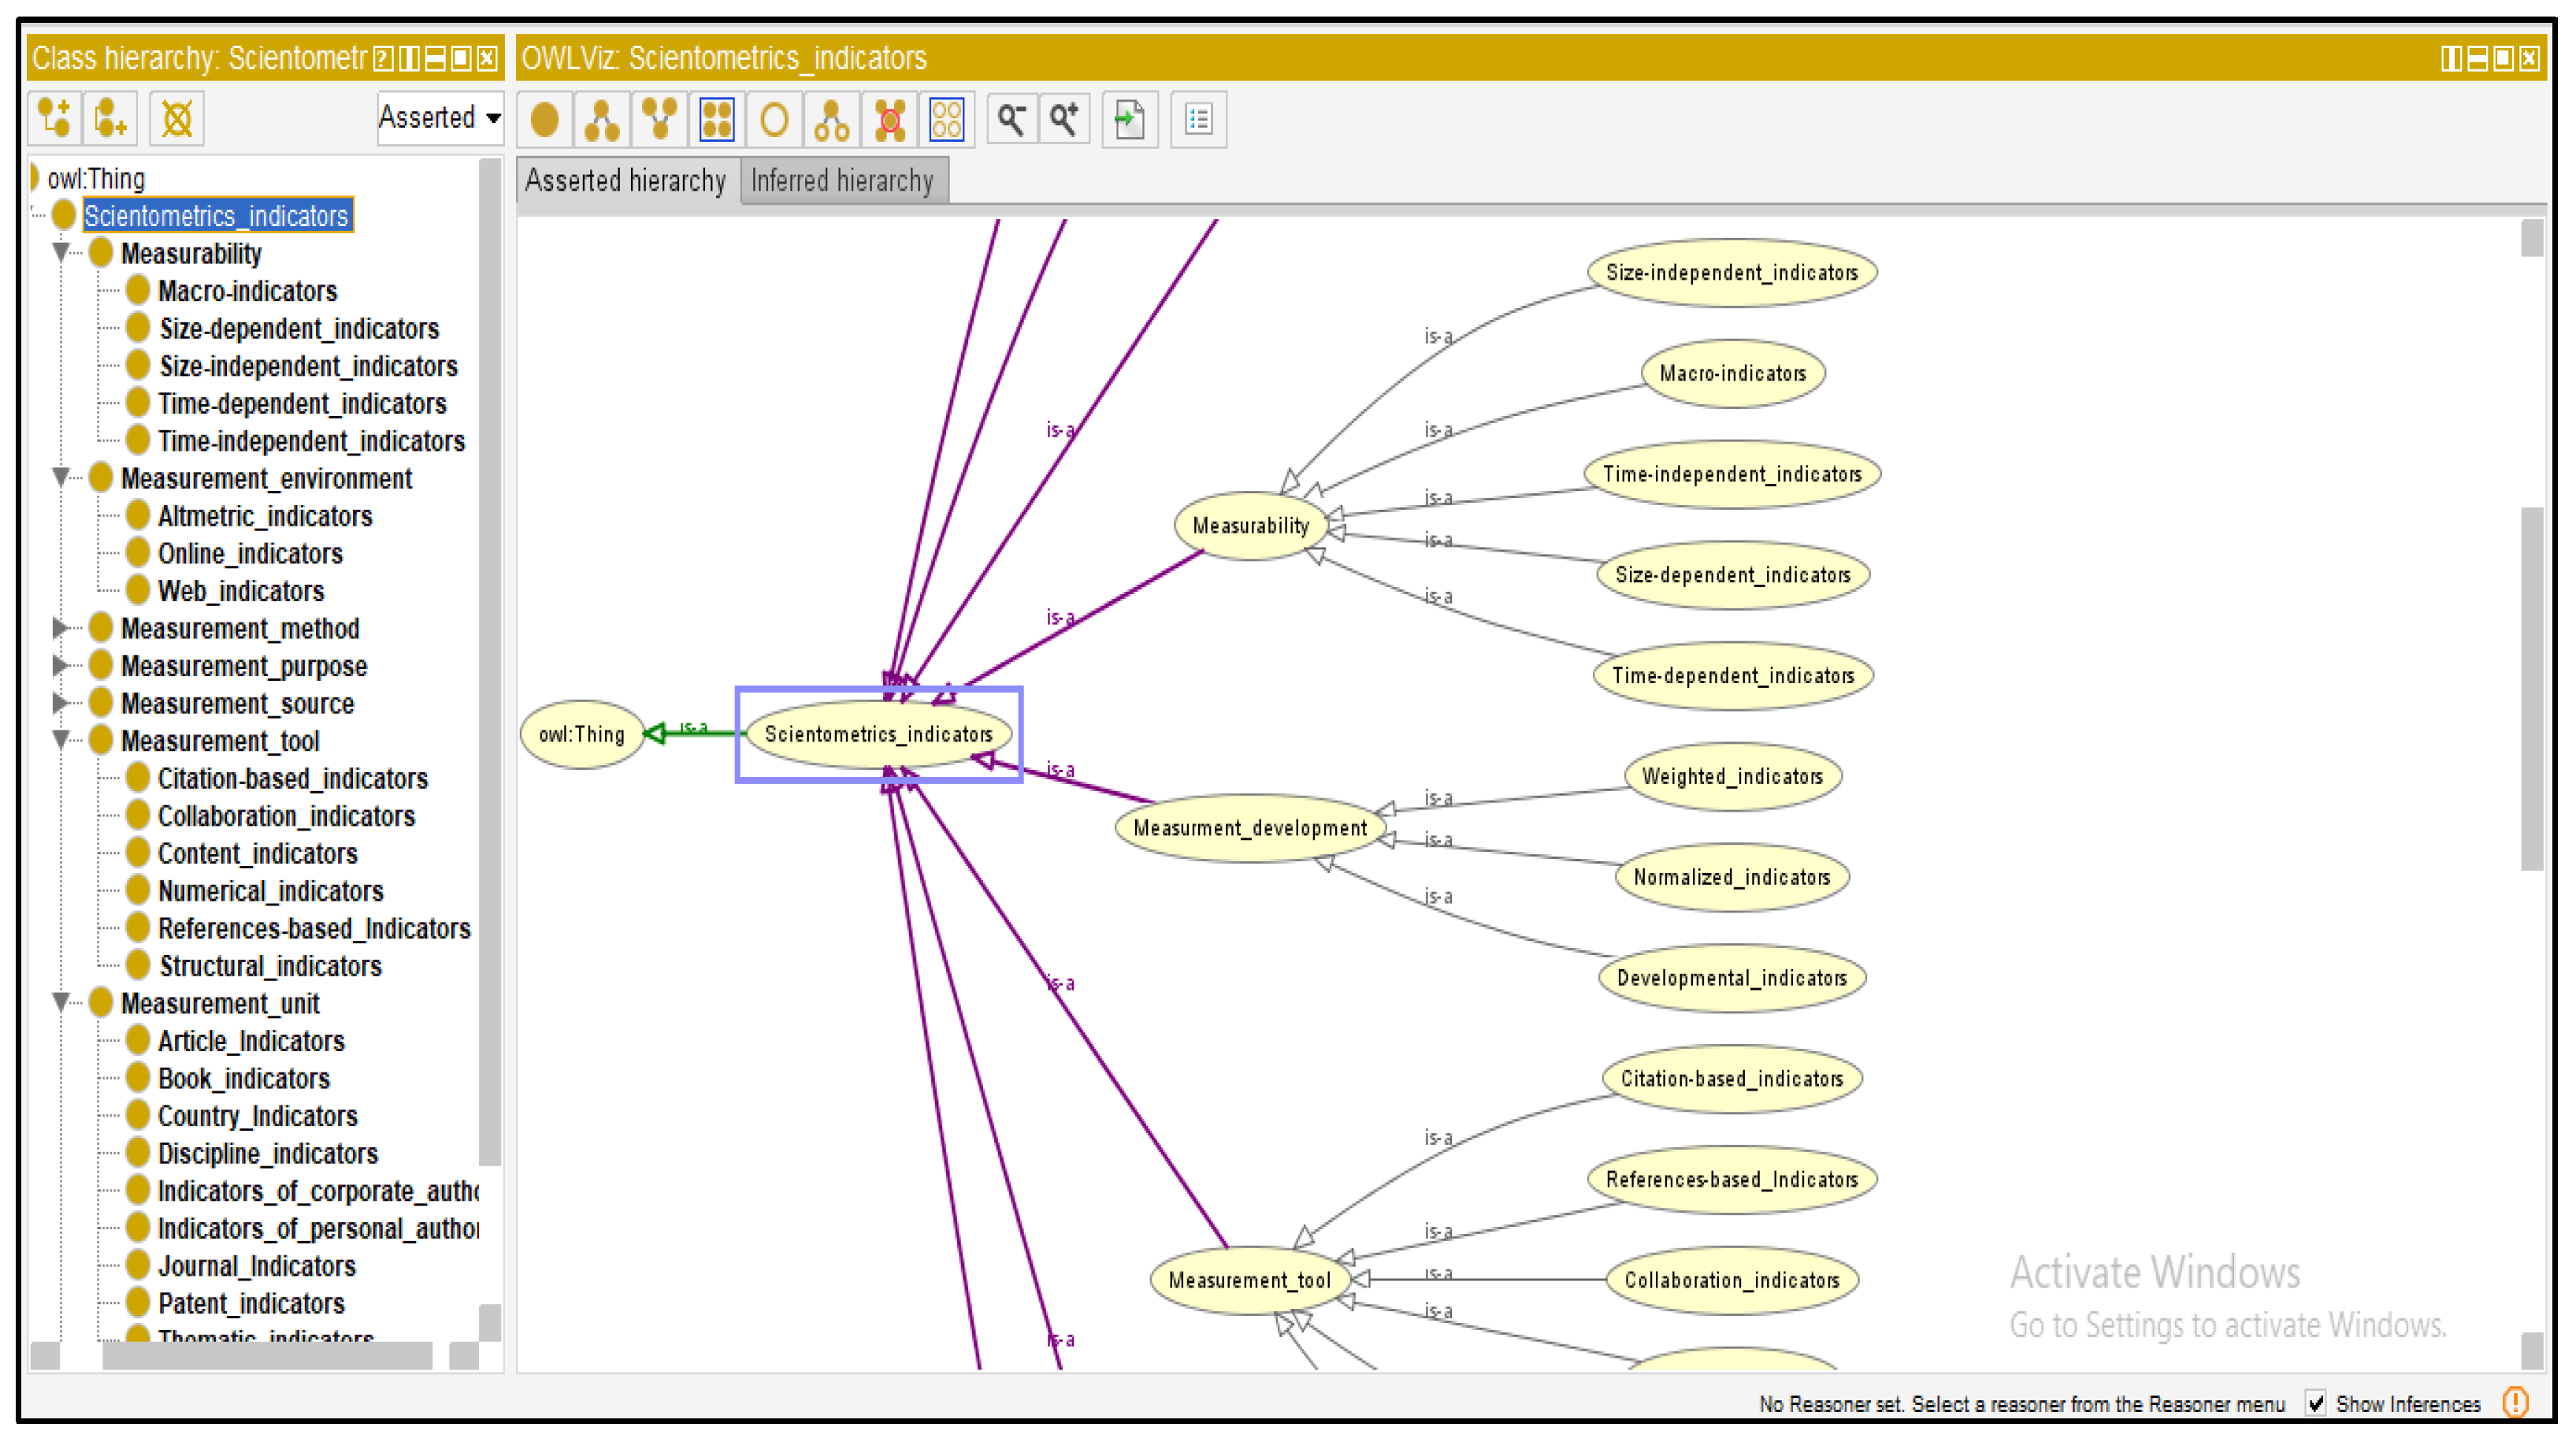
Figure 11.
The graph view of the SciOnt ontology with the WebVOWL Editor.
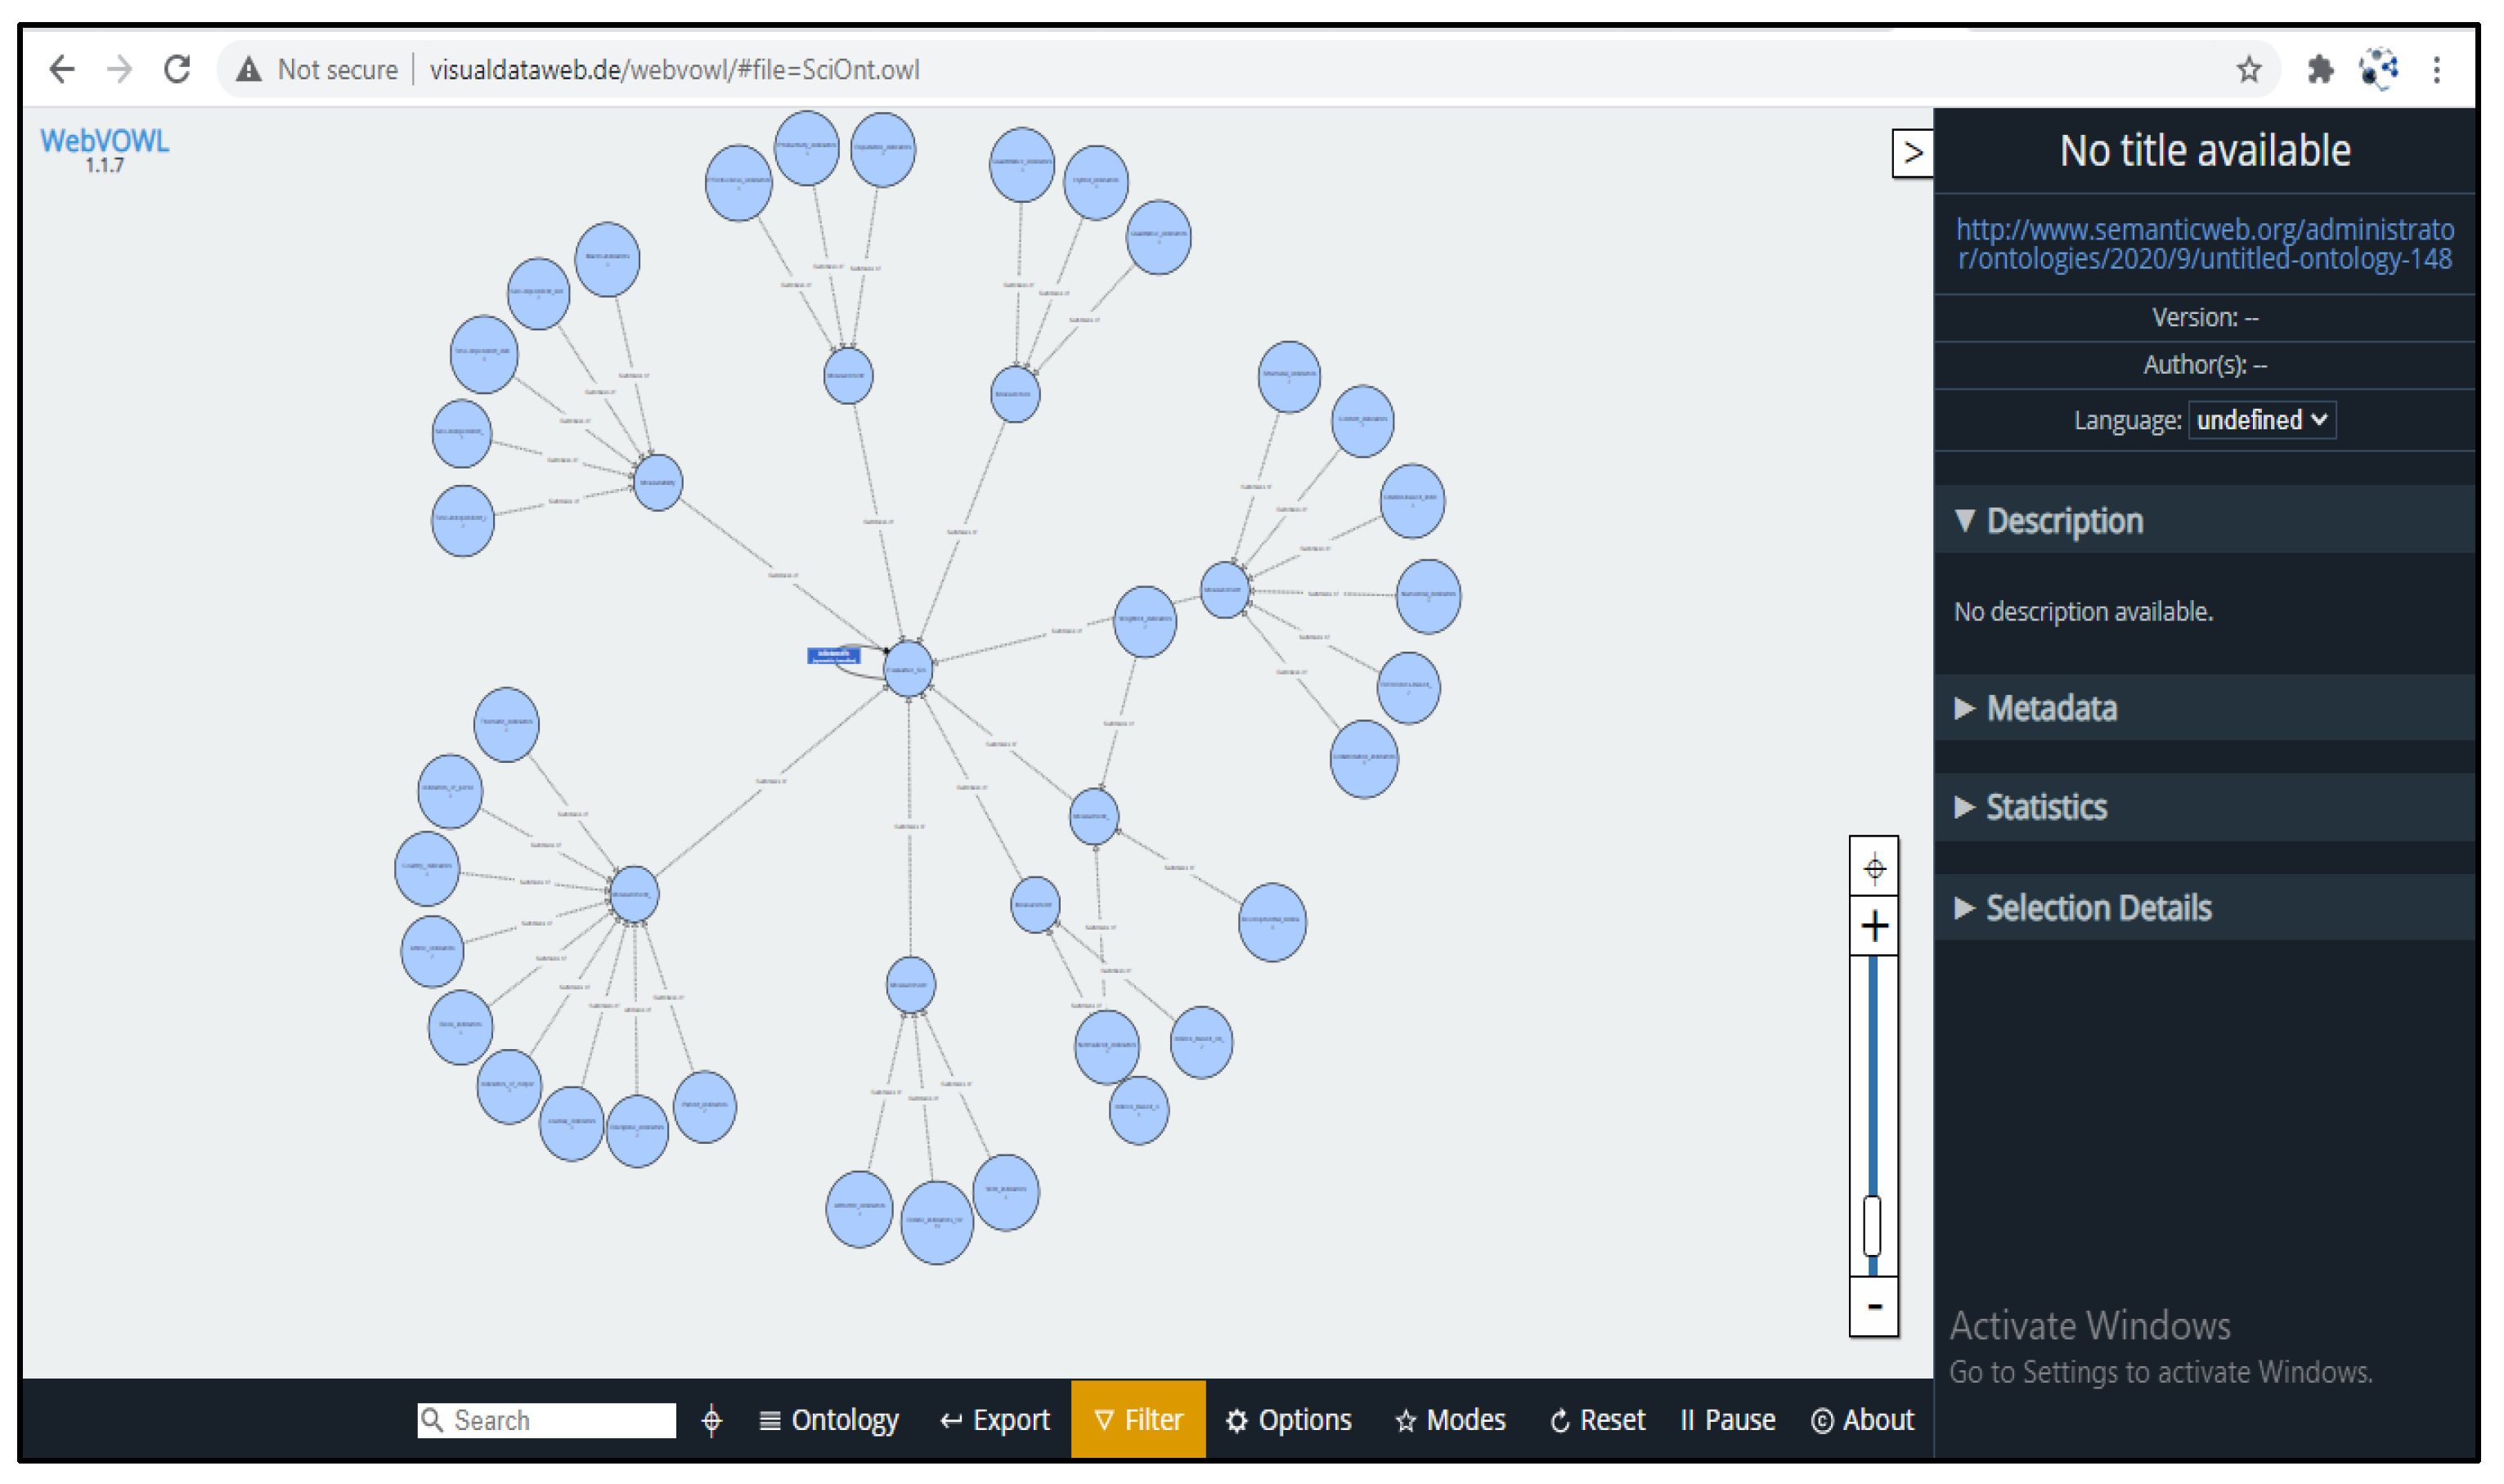
Figure 12.
The graph view of the SciOnt ontology properties with the WebVOWL.
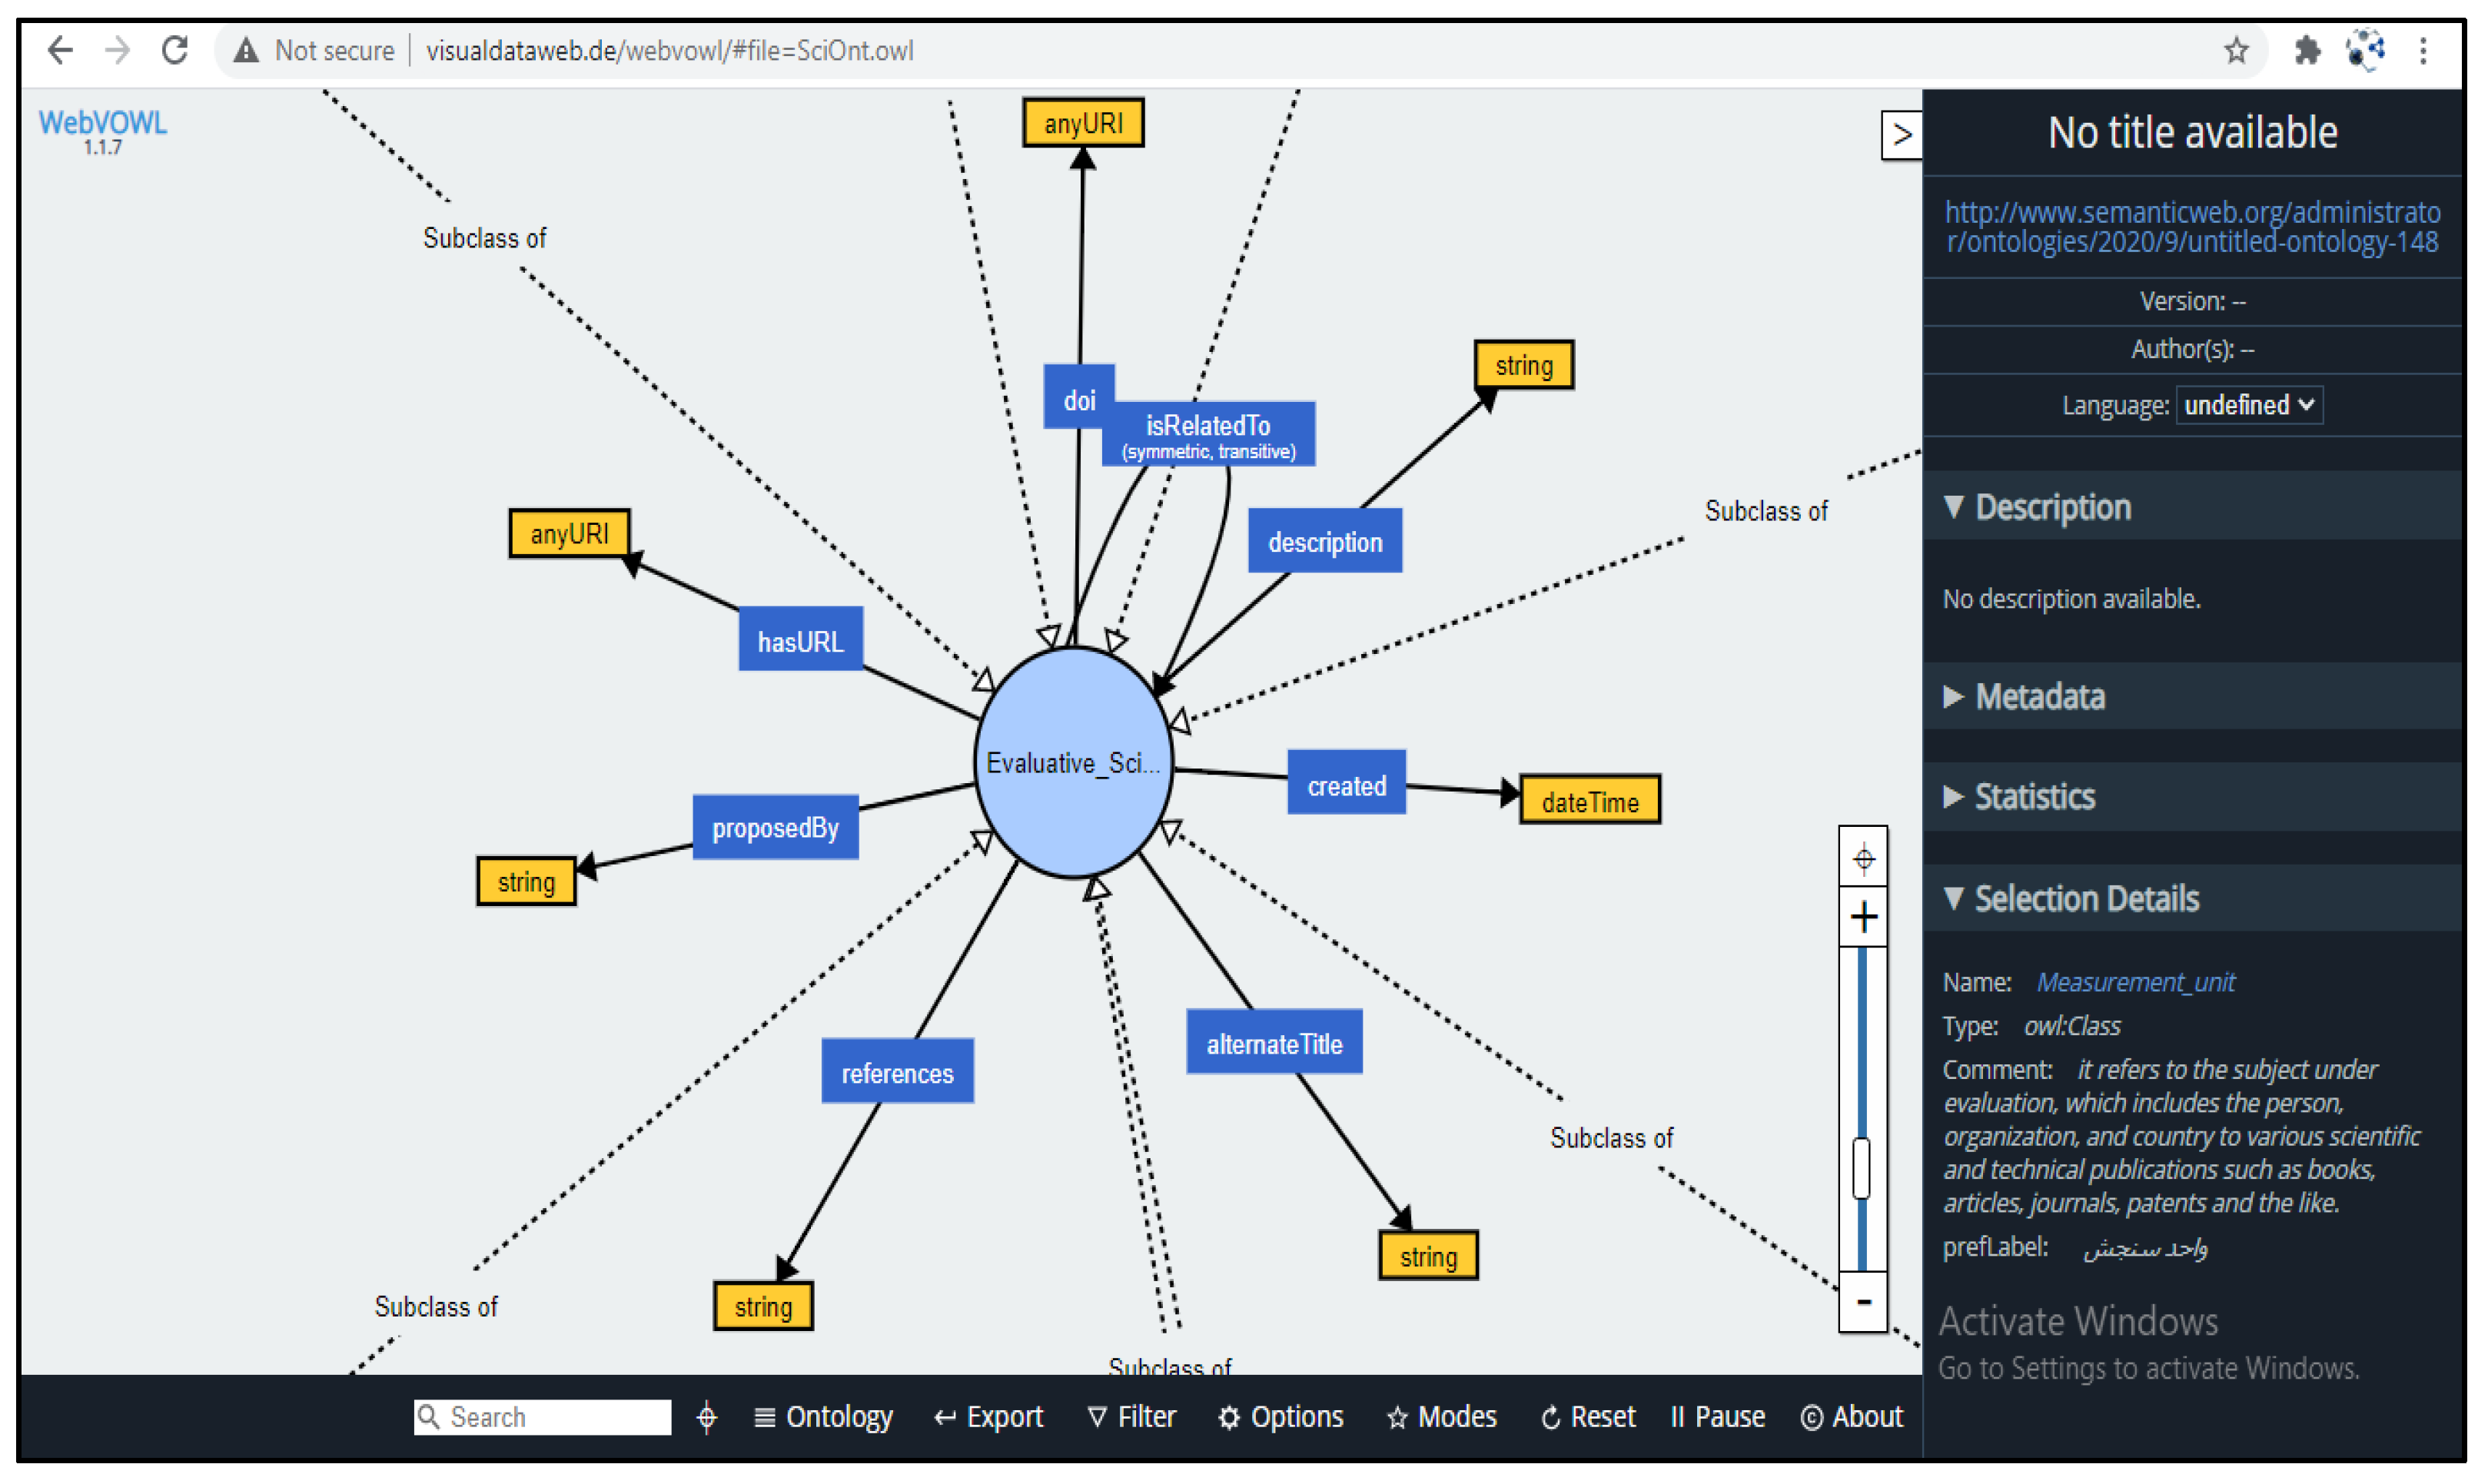
Figure 13.
The graph view of the “Journal Indicators” class with the WebVOWL.
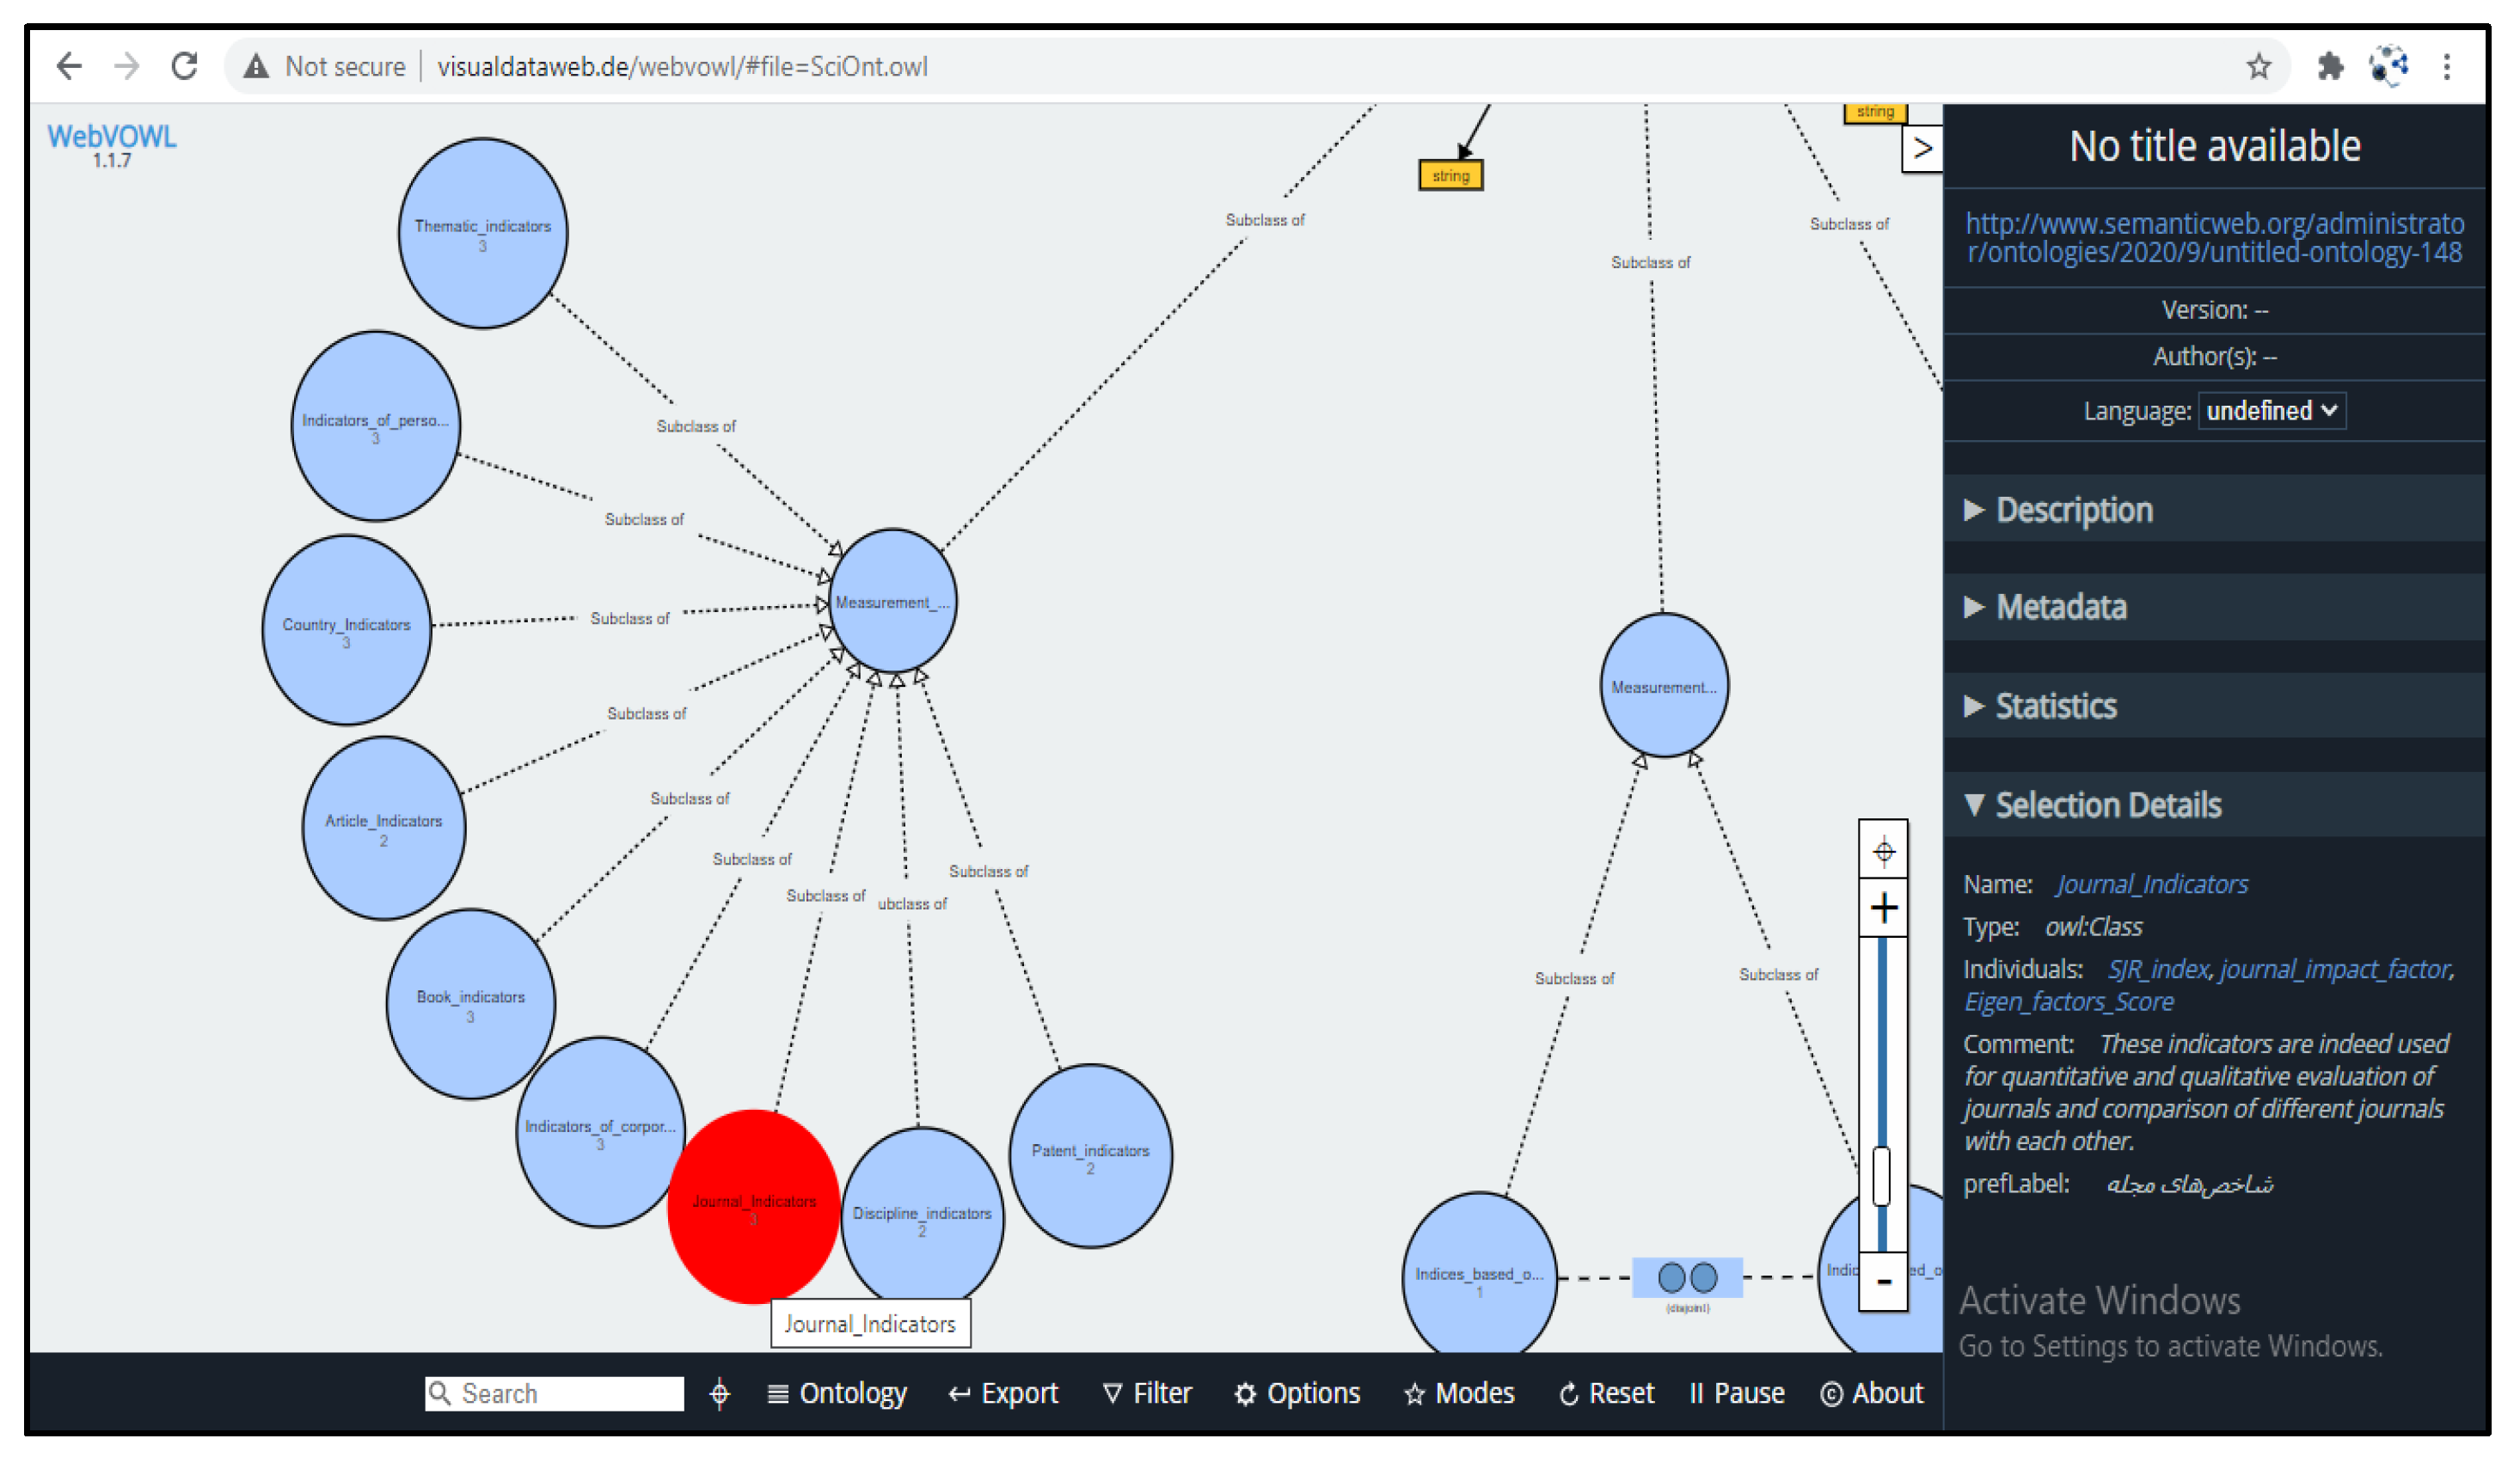

Table 1.
Criteria-based ontology evaluation (Xing et al., 2019).
| Row | Components | Statements |
|---|---|---|
| 1 | Completeness | - The classes are complete. - The class hierarchies are complete. - The domains and ranges of the relations defined in the class hierarchy are complete. |
| 2 | Correctness | The real-world concepts represented in the ontology are correct. |
| 3 | Extendibility | - The proposed ontology has the possibility of being extended to support risk identification applications involving other risks. - The proposed ontology has the possibility of being extended to be used in other specific application domains. |
| 4 | Conciseness | The proposed ontology doesn’t include unnecessary concepts or redundancies. |
| 5 | Clarity | - Concepts are defined without subjectivity. - Concepts have been documented using natural language. - Concepts can convey their intended meanings that conform to the knowledge comprehension of users and computers. |
| 1 | |
| 2 | |
| 3 | |
| 4 |
Disclaimer/Publisher’s Note: The statements, opinions and data contained in all publications are solely those of the individual author(s) and contributor(s) and not of MDPI and/or the editor(s). MDPI and/or the editor(s) disclaim responsibility for any injury to people or property resulting from any ideas, methods, instructions or products referred to in the content. |
© 2025 by the authors. Licensee MDPI, Basel, Switzerland. This article is an open access article distributed under the terms and conditions of the Creative Commons Attribution (CC BY) license (http://creativecommons.org/licenses/by/4.0/).
Copyright: This open access article is published under a Creative Commons CC BY 4.0 license, which permit the free download, distribution, and reuse, provided that the author and preprint are cited in any reuse.


