Submitted:
05 March 2025
Posted:
06 March 2025
You are already at the latest version
Abstract
The identification of influential nodes in complex networks is fundamental for assessing their importance, particularly when simultaneously considering topological structure and nodal attributes. In this paper, we introduce SL-WLEN (Semi-local Centrality with Weighted and Lexicographic Extended Neighborhood), a novel centrality metric designed to identify the most influential nodes in complex networks. SL-WLEN integrates topological structure and nodal attributes by combining local components (degree and nodal values) with semi-local components (Local Relative Average Shortest Path LRASP and lexicographic ordering), thereby overcoming limitations of existing methods that treat these aspects independently. The incorporation of lexicographic ordering preserves the relative importance of nodes at each neighborhood level, ensuring that those with high values maintain their influence in the final metric without distortions from statistical aggregations. The metric was validated on a chip manufacturing quality control network comprising 1,555 nodes, where each node represents a critical process characteristic. The weighted connections between nodes reflect correlations among characteristics, enabling the evaluation of how changes propagate through the system and affect final product quality. Robustness testing demonstrates that SL-WLEN maintains high stability under various perturbations: preserving Top-1 rankings (98%) and correlations (R²>0.92) even with 50% link removal, while maintaining robustness above 80% under moderate network modifications. These findings evidence its effectiveness for complex network analysis in dynamic environments.
Keywords:
semi-local centrality
; complex networks
; lexicographic ordering
; influential nodes
; quality control
1. Introduction
Complex network analysis fundamentally focuses on studying its structure, dynamics, and interaction to understand the importance of its nodes and connections in information diffusion, resilience, and global information. This has garnered significant attention in recent years [1]. Processes such as synchronization, diffusion, and cascade effects are predominantly influenced by nodes with higher influence and connectivity [2]. Thus, the study of these problems holds theoretical relevance, which is reflected in its practical applications across fields including computational biology, computer science, social networks, and artificial intelligence [3].
According to the information provided by a network, centrality metrics are classified into three groups (local, semi-local, and global). Each evaluates node influence from two perspectives: their topological structure, which analyzes connections and positions within the network, and their valued nodal attributes, which consider quantifiable characteristics and weights assigned to each node to determine its importance in the network.
Local metrics are subdivided into two categories: those based on topological structure, such as Degree Centrality [4], which evaluates direct connections, PageRank [5], which analyzes nodes as web pages, and Trust-PageRank [6]; and those with nodal weights such as Node-weighted Degree Centrality [7], which incorporates weights through an f(Wx) function, and the WNDegree/WNEDegree/WNEOpshalDegree variants [8] that integrate nodal attributes with topological structure.
Semi-local metrics can also be approached from these two perspectives: those based on topological structure such as K-Shell [9], which identifies influential nodes through iterative removal, Mixed Degree Decomposition [10], which considers residual degrees, Semi-local Centrality [11], which evaluates first and second-level neighbors, Local Structural Centrality [12], and Degree and Importance of Lines [13]; and those with nodal weights such as Node-weighted Harmonic Centrality [14], which combines weights and geodesic distances, Node-weighted Betweenness Centrality [15], which evaluates flows between nodes, Modified Node-weighted Eigenvector Centrality [16], and MCNDI [17], which integrates multiple indicators through the CRITIC method.
Global metrics represent the third group that utilizes information from the entire network. Among those based on classical structural topological approaches, notable examples include Betweenness Centrality [4], which analyzes shortest paths between nodes, Closeness Centrality [17], which evaluates proximity to other nodes, and Eigenvector Centrality [19], which considers the importance of neighboring nodes; while from the nodal attributes perspective, they incorporate developments such as LARSP [20] and LASP [21] that optimize shortest path calculations, and ARP [22] that considers reciprocal distances in directed networks.
These metrics have attempted to provide a balance between accuracy and efficiency in complex network analysis; however, local and global metrics possess limitations. Local metrics exhibit constraints as they only consider highly restricted information from nodes' immediate neighborhood [23]. While computationally simple and efficient in considering only the nearest neighbors, their capability to identify truly influential nodes is compromised by this limited network vision. Meanwhile, global metrics, although more accurate by utilizing information from the entire network, face considerable practical challenges. Their high computational complexity makes them impractical for large-scale networks [24].
Semi-local metrics, particularly those implementing the Extended Neighborhood Concept (ENC), overcome these limitations by providing an optimal balance. By considering local subgraphs with LRASP (Local Relative Average Shortest Path), they generally achieve high accuracy in identifying influential nodes while maintaining manageable computational complexity [25]. This approach enables evaluation of both topological position and semi-local structure, simultaneously considering node importance and the influence of its nearby neighbors.
Despite advances in semi-local metrics such as LASP, which incorporates LRASP and ENC to evaluate centrality by combining topological structure, there remains a significant gap in developing metrics that effectively integrate both topological structure and nodal values at the semi-local level. While metrics such as Node-weighted Harmonic Centrality evaluates nodal weights with geodesic distances and Node-weighted Betweenness Centrality considers flows between weighted nodes, these analyze weights in isolation without considering how these values affect the structure of local connections. This separation between weight and structure is particularly problematic in networks where a node's influence depends on both factors in an interrelated manner, as occurs in phenomena such as quality control in manufacturing environments or scientific collaboration networks, where both node attributes and network position jointly determine their actual importance. For instance, the works of [26,27,28,29,30] have addressed quality control through complex network analysis, although limiting themselves to the study of topological structure.
Lexicographic ordering has been utilized in various complex network contexts. Notable applications include the study of information diffusion through nodal configuration mapping [31] and node importance evaluation through minimal winning coalitions [32]. However, its potential for integrating topological structure with nodal values in centrality metrics remains relatively unexplored. This gap motivates the development of a new metric that leverages lexicographic ordering properties to simultaneously evaluate structure and nodal values in specific testing contexts, such as quality control.
In this context, this paper proposes a novel semi-local centrality metric called SL-WLEN (Semi-local centrality with weighted and lexicographic extended neighborhood in node-attributed weighted networks), specifically designed for a quality control network in chip production, where nodes represent critical quality characteristics and their relationships are defined by correlations between characteristics. The metric integrates both topological structure and nodal values through lexicographic ordering, aiming to capture the actual importance of characteristics based not only on their individual values but also on their interactions with other characteristics, vital for maintaining production system equilibrium.
The methodology of this work encompasses the construction of a quality control process network for chip production, followed by the theoretical formulation of the new SL-WLEN metric, its practical implementation, and culminates with a comprehensive robustness analysis to validate its effectiveness.
2. Establishment of a Quality Control Process Network for Chip Production
Complex network theory constitutes a viable methodology for analyzing and modeling interrelationships in quality control systems for chip manufacturing [29]. By establishing a network model that maps the evolution of critical quality parameters during the production process, it becomes possible to precisely identify crucial control points in the manufacturing chain. This approach enables visualization of how each stage in the chip manufacturing process influences subsequent stages, facilitating early detection of potential quality deviations [27].
To create a network that represents the dynamics of quality control in the chip manufacturing process, it is necessary to analyze and process information regarding specific characteristics that influence finished product quality. This enables the definition of each mode and how they relate and interact with one another.
2.1. Baseline Information Configuring the Network
The data used to configure the network consists of two sets. The first is a matrix X∈R^Nxp, where N=1,763 corresponds to the number of observations or manufactured products and p=1,555 represents the quality characteristics. The matrix is defined according to Eq. 1.
where
Each row represents the characteristics of the -th product. Each column vector represents the values of the -th characteristic for all products. Each component indicates the presence (1) or absence (0) of quality defects in the j-th characteristic for the i-th product. Each product is manufactured in the same system. The second set corresponds to a vector, where . Each element of vector contains information associated with the quality of each product or observation from matrix. Specifically, it indicates whether the i-th finished product meets the required final quality (1) or is defective (0).
2.2. Network Node Definition
Within the network model, each node represents a quality characteristic of the manufactured product, and the nodal value of each node is defined based on a logistic regression model with Lasso regularization. This allows assigning a numerical value to each node, representing the relevance or influence of the corresponding characteristic on the manufactured product's quality. The objective function for logistic regression with Lasso regularization is expressed according Eq. 2.
where is the total number of observations in the dataset, is the i-th observation of the binary dependent variables, is the matrix of feature vectors (independent variables) for all observations, and is the binary dependent vector, with being the model coefficients, and the regularization parameter.
The equation consists of two components: the first is the negative log-likelihood expression for binary logistic regression: , obtained after applying the negative natural logarithm to the original likelihood function (Eq. 2), while the second component, the penalty, integrates two elements: representing the regularization parameter and the norm .
Regarding the expression , the L1 norm () of vector is defined as the sum of the absolute values of its components. In other words, for vector the norm is expressed as, which measures the total magnitude of the coefficients. λ is a regularization parameter that controls the strength of the penalty. The larger λ is, the greater the penalty, leading to smaller coefficients. This additional penalty has the effect of 'shrinking' some coefficients towards zero, and in some cases, may cause certain coefficients to be exactly zero.
The incorporation of penalti into the objective function of the LASSO logistic regression enables automatic feature selection. By forcing some coefficients to zero, the lasso tends to select a more relevant subset of features, eliminating less important ones. This could result in simpler and more generalizable models.
From the fitted model, the resulting coefficients were utilized as nodal values within the network model. Each node represents a quality characteristic of the manufactured product, and its nodal value is defined by the absolute magnitude of its estimated coefficient in the Lasso model (Eq. 3).
2.3. Edge Weight Determination
The connections in the quality characteristics network are established through the Phi coefficient, which quantifies the degree and direction of statistical association between pairs of binary characteristics in matrix . For each pair of characteristics , the coefficient defines the edge connecting them, evaluating the actual correlation between their variation patterns. This coefficient is calculated using the formula ; where correspond to the frequencies in the 2×2 contingency table between characteristics : is the positive coincidence frequency (1,1), the frequency of combination (1,0), the frequency of combination (0,1), and d the negative coincidence frequency (0,0).
The weight of each edge is defined through a threshold function applied to the coefficient. The function establishes that if , or , and equals 0 if , where represents a statistical significance threshold. This threshold filters weak correlations, allowing only statistically significant relationships to form part of the network structure.
The topological structure of the graph is described by the adjacency matrix
, where if nodes are connected, and otherwise. The coefficient has a range between [-1,1], with extreme values indicating perfect association: for perfect positive association, for perfect negative association, and for absence of association. This enables the construction of a network that faithfully reflects relationships between quality characteristics, capturing both positive and negative associations while avoiding irrelevant connections that could introduce noise into the analysis.
The symmetry of the coefficient and its specificity for binary variables make it ideal for modeling complex processes, such as chip manufacturing.
2.4. Construction of the Quality Control Network in Chip Manufacturing
During the chip manufacturing process, quality emerges as a complex phenomenon resulting from the dynamic interaction among multiple characteristics. This work adopts a complex network-based approach, visualizing quality control as an integrated system where each characteristic influences both individually and through its interactions with others.
The network is constructed by representing each quality characteristic as a node, whose importance is determined through analysis of historical production data. Edges between nodes represent significant correlations between characteristics, revealing how changes in one can propagate and affect others. The resulting structure is an undirected weighted network, where nodal values quantify the individual importance of each characteristic, while edge weights reveal the strength of relationships between them. This model enables visual understanding of how the production system's equilibrium depends on both individual characteristics and their complex network of interactions.
3. Definition of a Centrality Metric for Identification and Categorization of Quality Characteristics Based on the Network
3.1. Literature Review
he study of complex networks provides methodological frameworks and fundamental structures that enable the development of more advanced and sophisticated artificial intelligence systems [33]. The intersection between AI and complex networks has revolutionized the analysis and optimization of interconnected systems, enabling the development of promising and effective solutions across various technological and social domains [34]. Within the framework of complex network analysis, the identification of influential elements and understanding their impact on the global system has garnered significant interest in recent years. This has led to the development and evolution of various metrics and methodologies aimed at quantifying the relative importance of components within these interconnected structures.
In this context, the present review examines the development of these metrics, focusing on the progression from purely structural approaches toward more sophisticated methods that integrate both the intrinsic attributes of nodes and the weights of their connections, thus responding to the growing need for more comprehensive analyses in complex networks that better reflect real-world phenomena. The analysis encompasses both local and semi-local centrality metrics, considering the topological connections between neighbors and their relative influence within the network structure.
Consider an unweighted and undirected network, where represents the set of nodes and the set of edges, depending on the application context. The adjacency matrix associated with is described by , where represents the weight of an edge between nodes and . The set denotes the neighbors of node . The degree of a node , denoted as , is defined according to Eq. 4.
Each node is characterized by an attribute vector , where is the number of attributes and each component represents the value of the k-th attribute of node . This characterization enables the integration of both the topological structure of the network and the intrinsic properties of its nodes in the centrality measure.
Such description proposes a complex network characterized by weighted edges and nodes with valued attributes, allowing the modeling of systems where the centrality and influence of each element depends on both its topological structure and the intrinsic properties of the analyzed node and those that form its relational environment. This representation is particularly relevant in contexts where the importance of an element cannot be determined solely by its connectivity patterns but requires considering the heterogeneity of nodal attributes and their interaction with the network structure.
In the context of these complex networks, where centrality depends on both the weighted topological structure and nodal attributes, the scientific literature has followed a progressive development in its approaches to measuring node importance. This development is characterized by three distinctive stages: initially, metrics focused exclusively on the network's topological structure, considering only node connections; subsequently, two parallel research lines emerged, one focused on incorporating edge weights and another on considering nodal attributes independently; finally, recent efforts seek to integrate both aspects into unified metrics, although this implies greater computational challenges. This evolution reflects the growing understanding of the multidimensional nature of centrality in complex networks, where a node's importance is defined by the interaction between its structural position and intrinsic characteristics.
Table 1 presents the evolution of metrics that exclusively consider topological structure and edge weights, encompassing different network analysis levels. Among global metrics, [4] Betweenness Centrality (BC) considers the frequency with which a node appears in the shortest paths between all node pairs in the network, while Closeness Centrality (CC) measures the proximity of a node to all others through geodesic distances, Degree Centrality (DC) proposed by [35] evaluates importance according to a node's direct connections. Semi-local metrics include Local Structural Centrality (LSC) by [11], which incorporates both neighbor degrees and their local clustering coefficients, the DIL (Degree and Importance of Lines) metric by [13] that combines node degree with the weighted importance of adjacent connections, LRASP [19] which evaluates centrality considering induced subgraphs, WHC [36] that integrates multiple centrality measures, and INASP [18] which combines three different aspects of local influence.
More advanced metrics focus on information propagation and node distance in complex networks, such as LARSP, ARP, and LASP. LARSP (Local Average Shortest Path) is a local metric that measures node centrality based on the average length of shortest paths from that node to all other nodes in its local subgraph. Its objective is to capture the node's influence on information propagation within its immediate neighborhood, considering how local connectivity impacts the node's capacity to transmit information across the network. ARP (Average Reciprocal Path) extends the LARSP concept by considering the reciprocal distance of shortest paths in a directed network. Specifically, it evaluates how the path structure between nodes, considering edge directions, affects node centrality. LASP (Local Average Shortest Path) is an optimized version of LARSP that incorporates a weighted local average of shortest distances, reducing computational complexity by focusing on each node's local subgraph.
Meanwhile, metrics considering valued nodal attributes (Table 2) also present different analytical scopes. Local metrics include node-weighted degree [7], which modifies the traditional degree definition by incorporating a nodal weight function, and WNDegree variants [8] that integrate nodal attributes with local topological structure. Semi-local metrics include node-weighted harmonic centrality [14] that considers geodesic distances in the extended neighborhood, node-weighted betweenness centrality [15] that incorporates the importance of communication between nearby node pairs, and modified eigenvector centrality [16] that adjusts nodal weight influence through a variable parameter. Additionally, hybrid metrics have been developed, such as the nodal attribute screening method, applicable at both local and global levels, and the MCNDI metric that integrates multiple indicators through the CRITIC method, combining local and global aspects [17].
The integration of nodal attributes and connectivity in combined centrality metrics began with seminal works, such as [38], who addressed attributed graph analysis by incorporating categorical attributes in centrality evaluation. Their proposal extends classical measures through the E-I homophily index and betweenness metrics, enabling node classification into groups based on qualitative characteristics. While this approach represents an initial step in considering nodal attributes, it is limited to categorical characteristics without exploiting the richness of numerical attributes that could more precisely capture actors' influence in the network.
A more comprehensive advancement in integrating global structure and attributes was proposed by [8], who developed a metric called node and edge-weighted closeness centrality, which calculates nodal importance considering both normalized distances between nodes and connection weights along shortest paths. This measure integrates the network's global structure and connection weights into a global centrality metric. This measure, denoted as , is defined as the product between the weight of node and its weighted closeness centrality . The latter is calculated as , where represents the edge weight e in the shortest path denotes the length of said path, measured as the number of links between nodes and . However, its main limitation lies in the need to calculate shortest distances between each node pair, resulting in high computational complexity, especially in extensive and complex networks. This complexity increases significantly in networks with weights and nodal attributes, due to the additional analysis required for each connection.
The development of centrality metrics reflects a progression from purely structural approaches toward approximations that incorporate edge weights or nodal attributes independently. However, there exists a significant gap in developing metrics that simultaneously integrate both edge weights and valued nodal attributes while maintaining manageable computational complexity. Existing attempts, such as [8], although promising, face significant limitations in terms of scalability and computational efficiency. This gap is particularly relevant in the current context, where complex networks frequently exhibit heterogeneity in their connections and diversity in their node characteristics. Therefore, developing a centrality metric that can efficiently capture this duality while maintaining feasible computational complexity represents a necessary research direction to advance the understanding and analysis of real-world complex networks.
3.2. Proposed Metric: Semi-Local Centrality with Weighted and Lexicographic Extended Neighborhood in Node-Attributed Weighted Networks (SL-WLEN)
The SL-WLEN metric quantifies node centrality in complex networks based on the LARSP (Local Average Shortest Path) connectivity analysis through its DegreeLocal and DegreeSemiLocal components, which evaluate partial centrality as a function of connection degrees. SL-WLEN extends this foundation by incorporating two additional components: a local component through the normalized node value, and a semi-local component via SemilocalNodeLexOrder, which introduces lexicographic ordering of neighbors. This component combination enhances the metric's capability to reflect the influence of characteristics in chip manufacturing, enabling the identification of the most relevant features of the final product by considering both their connectivity and their intrinsic values, as well as their structural position within the network. Figure 1 illustrates the metric implementation process.
3.3. Integration of Lexicographic Ordering
SL-WLEN integrates SemilocalNodeLexOrder, enabling a more precise characterization of node influence within its structural and attributive context. The implementation of SL-WLEN is based on Extended Neighborhood Connectivity (ENC), which extracts a subgraph encompassing node neighbors up to a distance L. For details on ENC, see work of [21], pages 114 and 115.
Once the subgraph is obtained through ENC, SemilocalNodeLexOrder quantifies node influence by considering its position in a lexicographic ordering based on attributes and neighborhood structure. At each distance level l, SemilocalNodeLexOrder assigns higher weights to better-positioned nodes within the ordering, allowing the capture of subtle differences in nodes' relative importance.
The metric operates by considering 1) prioritization of important features through lexicographic comparison, 2) influence penalization as distance increases and adjustment of node influence based on neighbor connectivity, and 3) influence accumulation.
Prioritization of important features through lexicographic comparison:
In the chip quality network, each node represents a quality characteristic, and its importance depends not only on its individual contribution but on its relationship with other characteristics. The SemilocalNodeLexOrder function enables node ordering based on their relative importance within their neighborhood, ensuring that the most influential characteristics maintain a priority position. Given a node , its local influence is measured from the lexicographic ordering of its immediate neighborhood at a distance . The set of neighbors is ordered according to the importance value of each characteristic , obtaining such that This ordering favors nodes with highly relevant characteristics for chip quality, ensuring that those with higher values carry greater weight in the metric. In terms of chip manufacturing, this means that characteristics that most influence defects or improvements in the final product will occupy priority positions within the centrality evaluation. The partial contribution of a node at level is defined as where is v's position in the lexicographic order. If a node has neighbors with high impact on chip quality, its position in the list will be lower (closer to 1), increasing the numerator and, consequently, its influence in the metric.
Distance-based influence penalization and node influence adjustment based on neighbor connectivity:
In the chip quality network, the effect of a characteristic can propagate through multiple interactions. However, its impact must be reduced with distance to prevent overvaluation of distant connections. The influence of v at each level l is weighted according to its neighborhood size and the maximum connectivity at that level . Here, the first term maintains the lexicographic priority based on the characteristic's importance, while the second term adjusts the relative contribution according to neighborhood size, enabling differentiation of highly connected characteristics, and the third term introduces a penalization that reduces influence as distance increases, modeling the decreasing effect of characteristic propagation in manufacturing.
This adjustment aims to capture indirect relationships between characteristics without excessively diluting or overestimating their influence, ensuring that closer nodes have a more relevant impact on the metric, while the effects of distant nodes are attenuated in a controlled manner. In the context of chip quality, this approach helps evaluate not only directly influential characteristics but also those affecting the product in a more indirect yet equally relevant way, without excessive overvaluation.
Influence Accumulation:
Finally, the total semi-local influence of node v is obtained by accumulating partial contributions at each exploration level up to maximum L in the form . This enables consideration of how a characteristic affects chip quality not only directly but also through indirect relationships with other characteristics. Additionally, it balances influence from to , preventing nodes with high connectivity from dominating the metric, and providing a fair evaluation based on network structure. Lexicographic ordering proves particularly appropriate for evaluating chip manufacturing quality due to its unique capability to preserve the importance of critical characteristics. Unlike existing metrics, which tend to dilute the influence of important characteristics through various procedures, lexicographic ordering maintains the relevance of the most significant nodes throughout the analysis.
Traditional metrics present limitations in this context. Some use weighted sums like Node-weighted Degree Centrality, others rely on distance normalizations like Node-weighted Harmonic Centrality, or employ shortest paths like Node-weighted Betweenness Centrality. There are also those that apply products with adjustable parameters, linear regressions, or combine multiple indices, such as MCNDI. All these approaches may inadvertently reduce the influence of critical characteristics through their statistical aggregations. In contrast, lexicographic ordering preserves the relative importance of each characteristic through three complementary aspects: prioritizes nodes based on their individual value, connectivity level, and influence adjusted by distance. This combination enables a more precise evaluation where the importance of each characteristic is determined by its own value and its relationships with neighboring characteristics, without losing critical information in the process.
3.4. Definitions
The SL-WLEN metric quantifies node centrality in a complex network by considering two levels of analysis: local and semi-local, and integrating weighted connectivity components and nodal attributes. Its purpose is to capture node influence not only through direct connectivity but also by evaluating the importance of its neighbors at different proximity levels, their characteristics, and their relative position in the network. To achieve this, it integrates four main factors: local influence by connectivity (DegreeLocal), local influence by node , Semi-Local Degree influence (DegreeSemiLocal), and Semi-Local node value influence based on lexicographic ordering (SemilocalNodeLexOrder).
In the final metric, normalizes the node value by relativizing it within its neighborhood, capturing its intrinsic importance beyond structural connectivity.
Definition 1: Local influence by connectivity (DegreeLocal)
DegreeLocal captures the local influence of the node based on its direct connectivity, normalizing the node degree with respect to the total network size. This reflects its immediate importance within the network. The local influence by connectivity of v denoted as is defined according to Eq. 5.
where is the degree of node and is the number of directly connected nodes.
Definition 2: Semi-Local Degree Influence (DegreeSemiLocal)
DegreeSemiLocal, derived from LARSP [20] and based on LASP [21], quantifies semi-local influence by considering nearby neighbors within a subgraph extracted through the ENC (Extended Neighborhood Connectivity) concept. This influence is weighted based on several aspects: weighted connectivity, which reflects the intensity of relationships between the node and its neighbors through edge weights; proximity, where neighbor influence decreases as distance increases, modeling impact propagation within the network; and structural importance, which prioritizes neighbors with higher topological relevance. The semi-local influence of v, denoted as , is defined according to Eq. 6.
where | is the set of all neighbors up to level L of node in network , and is the set of all neighbors at level of node .
Definition 3: Semi-Local Node Value Influence Based on Lexicographic Ordering (SemilocalNodeLexOrder)
SemilocalNodeLexOrder introduces a novel perspective through lexicographic ordering of nodes based on their attributes and neighborhood structure. This evaluates how a node's relative position within this order affects its influence, considering its structural and attributive environment at different distance levels. Additionally, it includes the contribution of nearby neighbors within a subgraph extracted through ENC, enabling a deeper evaluation of the node within its topological and attributive context.
The Semi-Local Node Influence based on Lexicographic measures node influence by considering its nearby neighbors at different distance levels (up to a maximum ). Each level contributes with a partial contribution that depends on the node's position in the lexicographic order within its neighborhood, the number of neighbors at that distance, and the maximum degree among nodes at the same level according to Eq. 7.
where the partial contribution per level is defined according to Eq. 8.
Here, is the total number of nodes, defines node v's position in the lexicographic order at level , is the number of neighbors at distance from node , is the maximum degree among all nodes at level , is the maximum exploration level.
The ordering function is defined as an ordered set of nodes based on lexicographic comparison (Eq. 9).
While :
where is a set of neighbors of v at distance , are values of 's neighbors sorted in descending order, and is the shortest path length between and in .
The metric uses normalized values for each node, obtained by dividing its value by the maximum value of its neighbors at the same distance level, which adjusts its influence based on relative importance within the neighborhood.
- Special considerations
If several nodes have the same lexicographic order , it is resolved by assigning the same order for the set of nodes V. The term can be interpreted as the sum of contributions from each level , facilitating detailed analysis of each node's behavior at each exploration level.
Definition 4: Total Influence
For a node , SL-WLEN is defined by Eq. 11:
where and are adjustable parameters between 0 and 1. The first two control the local and semi-local influence of node connectivity, and the remaining ones control the local and semi-local influence of its nodal value, satisfying the condition .
4. SL-WLEN Example
To better clarify the computational procedure of the proposed metric, we describe a numerical example. An undirected weighted graph with 11 nodes and 14 edges is assumed, as shown in Figure 2. We present a calculation example for , considering and edge weights as shown on the edges, with assigned nodal values .
Figure 2.
A simple graph with 11 nodes and 14 edges.
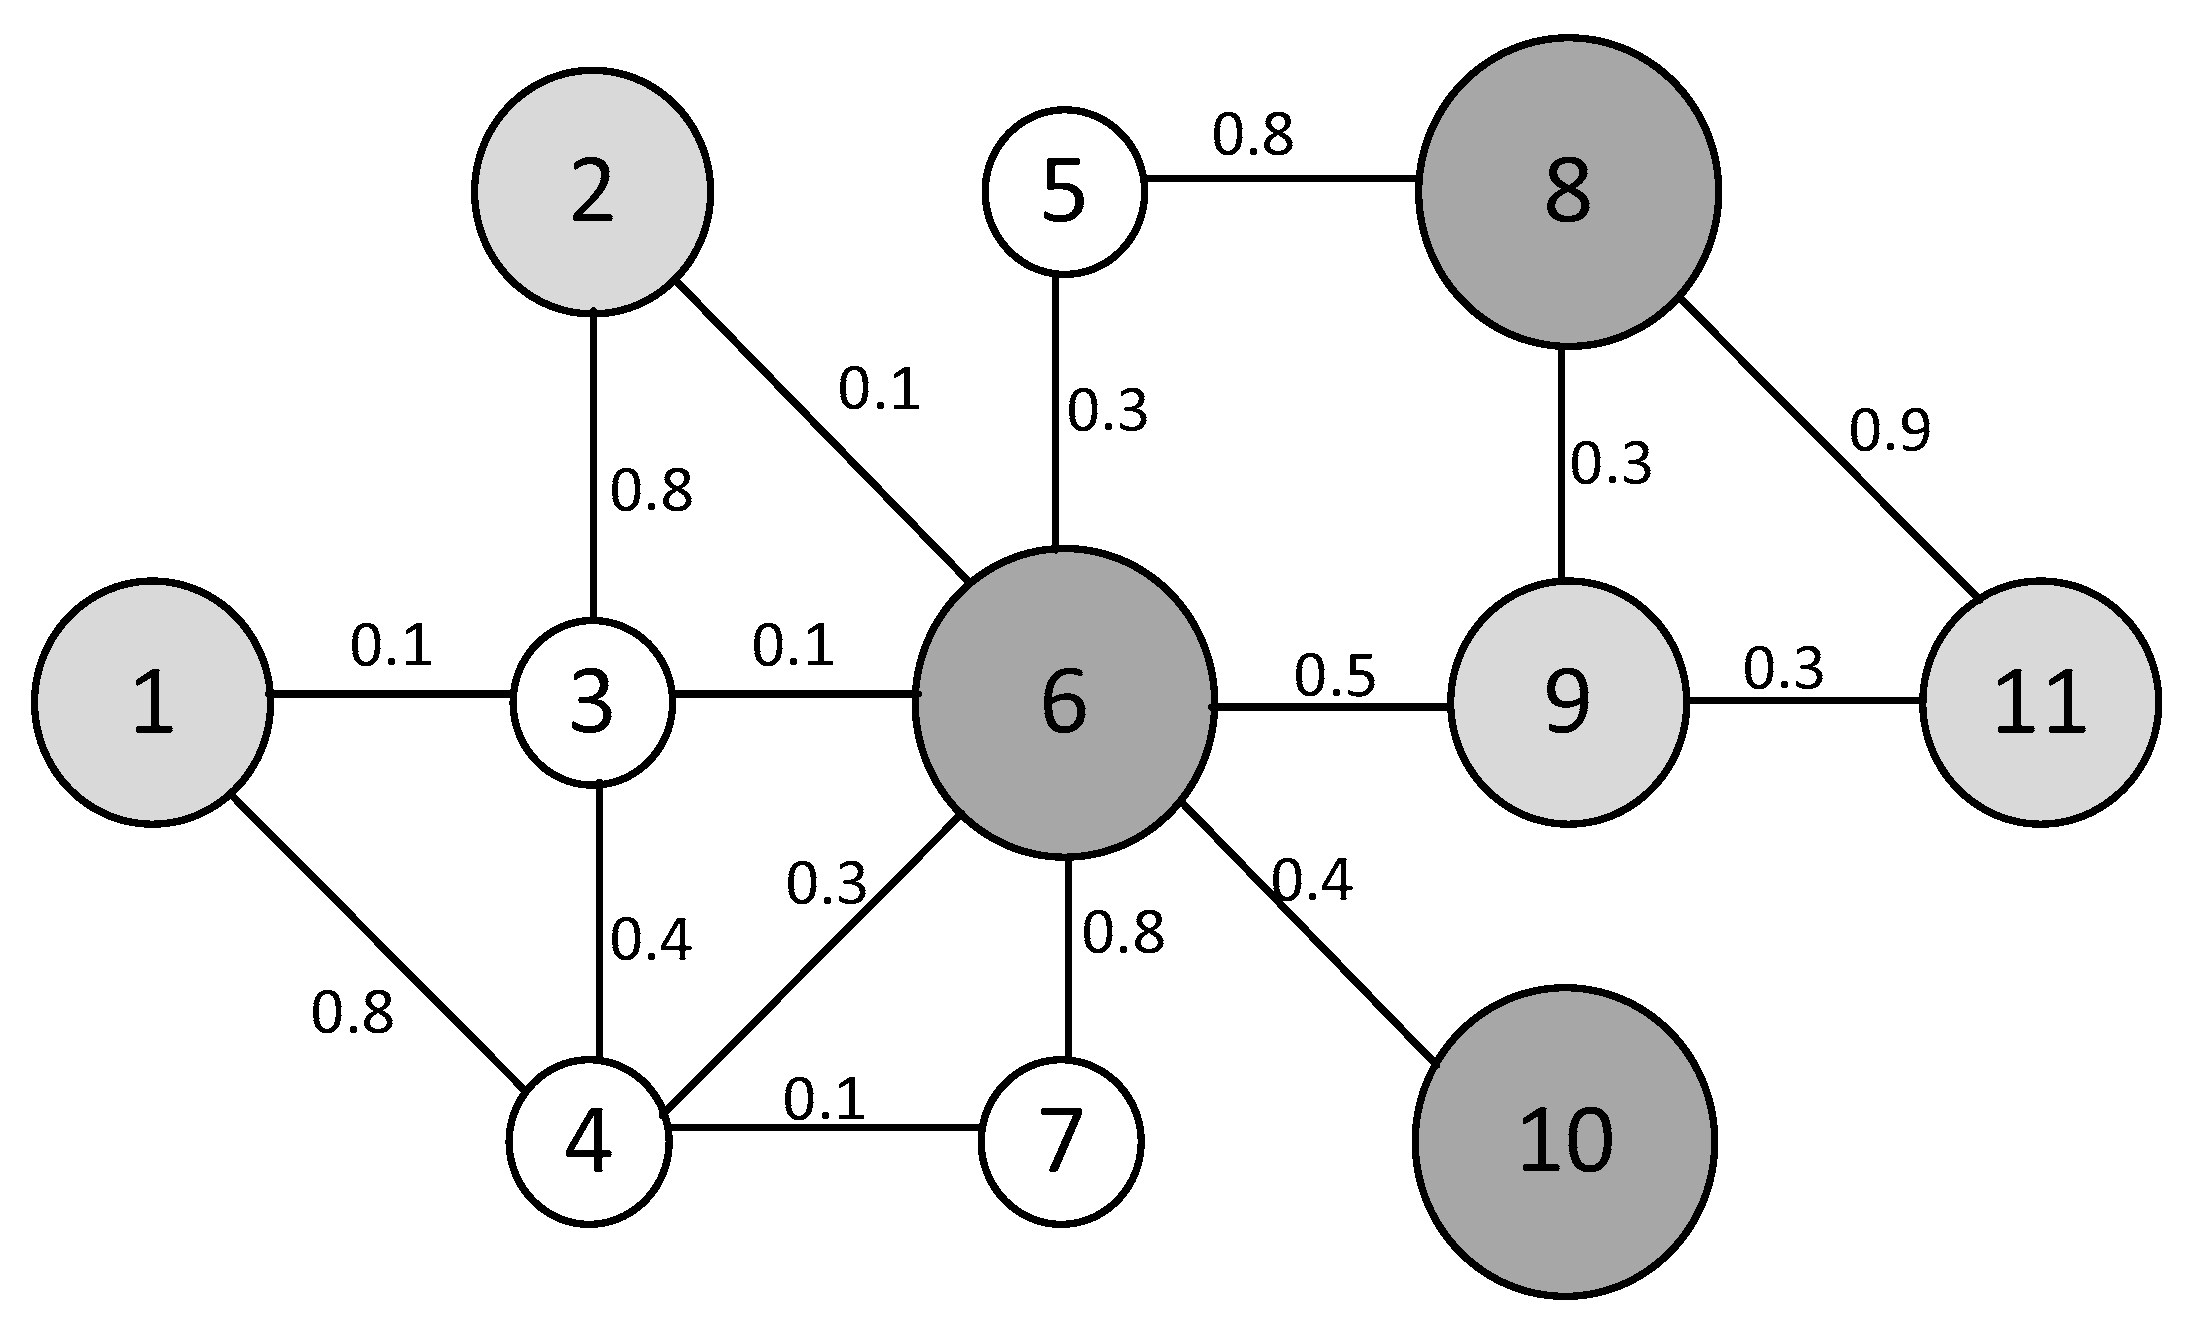
According to Definition 1, since and .According to Definition 2, the calculation of is performed as follows:
is determined from Definition 3.
At level 1, the neighbors of are nodes number 2, 3, 4, 5, 7 and 9, giving a total of |neighbors. To calculate the lexicographic order, the normalized values associated with these nodes are considered, which are 0.375, 0.125, 0.125, 0.125, 0.125, 0.375, and 1.00. These values are sorted in descending order to form node V6's signature, resulting in {1.0, 0.375, 0.375, 0.125, 0.125, 0.125, 0.125}. Comparing this signature with other nodes in the graph generates a ranking where nodes with higher signatures are placed first. In this case, node occupies position 4 in the level 1 lexicographic ranking, defined as .
At level 2, the neighbors of are nodes number 1, 8 and 11, resulting in neighbors. The normalized values associated with these neighbors are 0.375, 1.0, and 0.375, which are sorted in descending order to form 's signature at this level, obtaining . Following the same signature comparison process to determine lexicographic order, it is concluded that occupies position 4 in the level 2 lexicographic ranking, defined as . Substituting the values in Eq. 6 and 7, is determined as:
Finally, SL-WLEN(3) is calculated according to the adjustable parameters condition , in accordance with Eq. 16:
The SL-WLEN metric results for all nodes are shown in Table 3.
5. Experimental Results
In the following illustration, a general view of the complex network for chip manufacturing quality control is presented. The visualization shows the complete network structure, where nodes (circles) represent quality characteristics and edges (lines) represent the correlations between them.
Figure 2.
presents the detailed visualization of the quality control network. Node size and blue color intensity indicate the individual importance level of each characteristic (nodal value) - larger size and darker blue tonality correspond to greater importance. Connections between nodes (edges) are represented on a grayscale, where tonalities closer to black indicate stronger correlations between characteristics, while lighter tones represent weaker correlations.
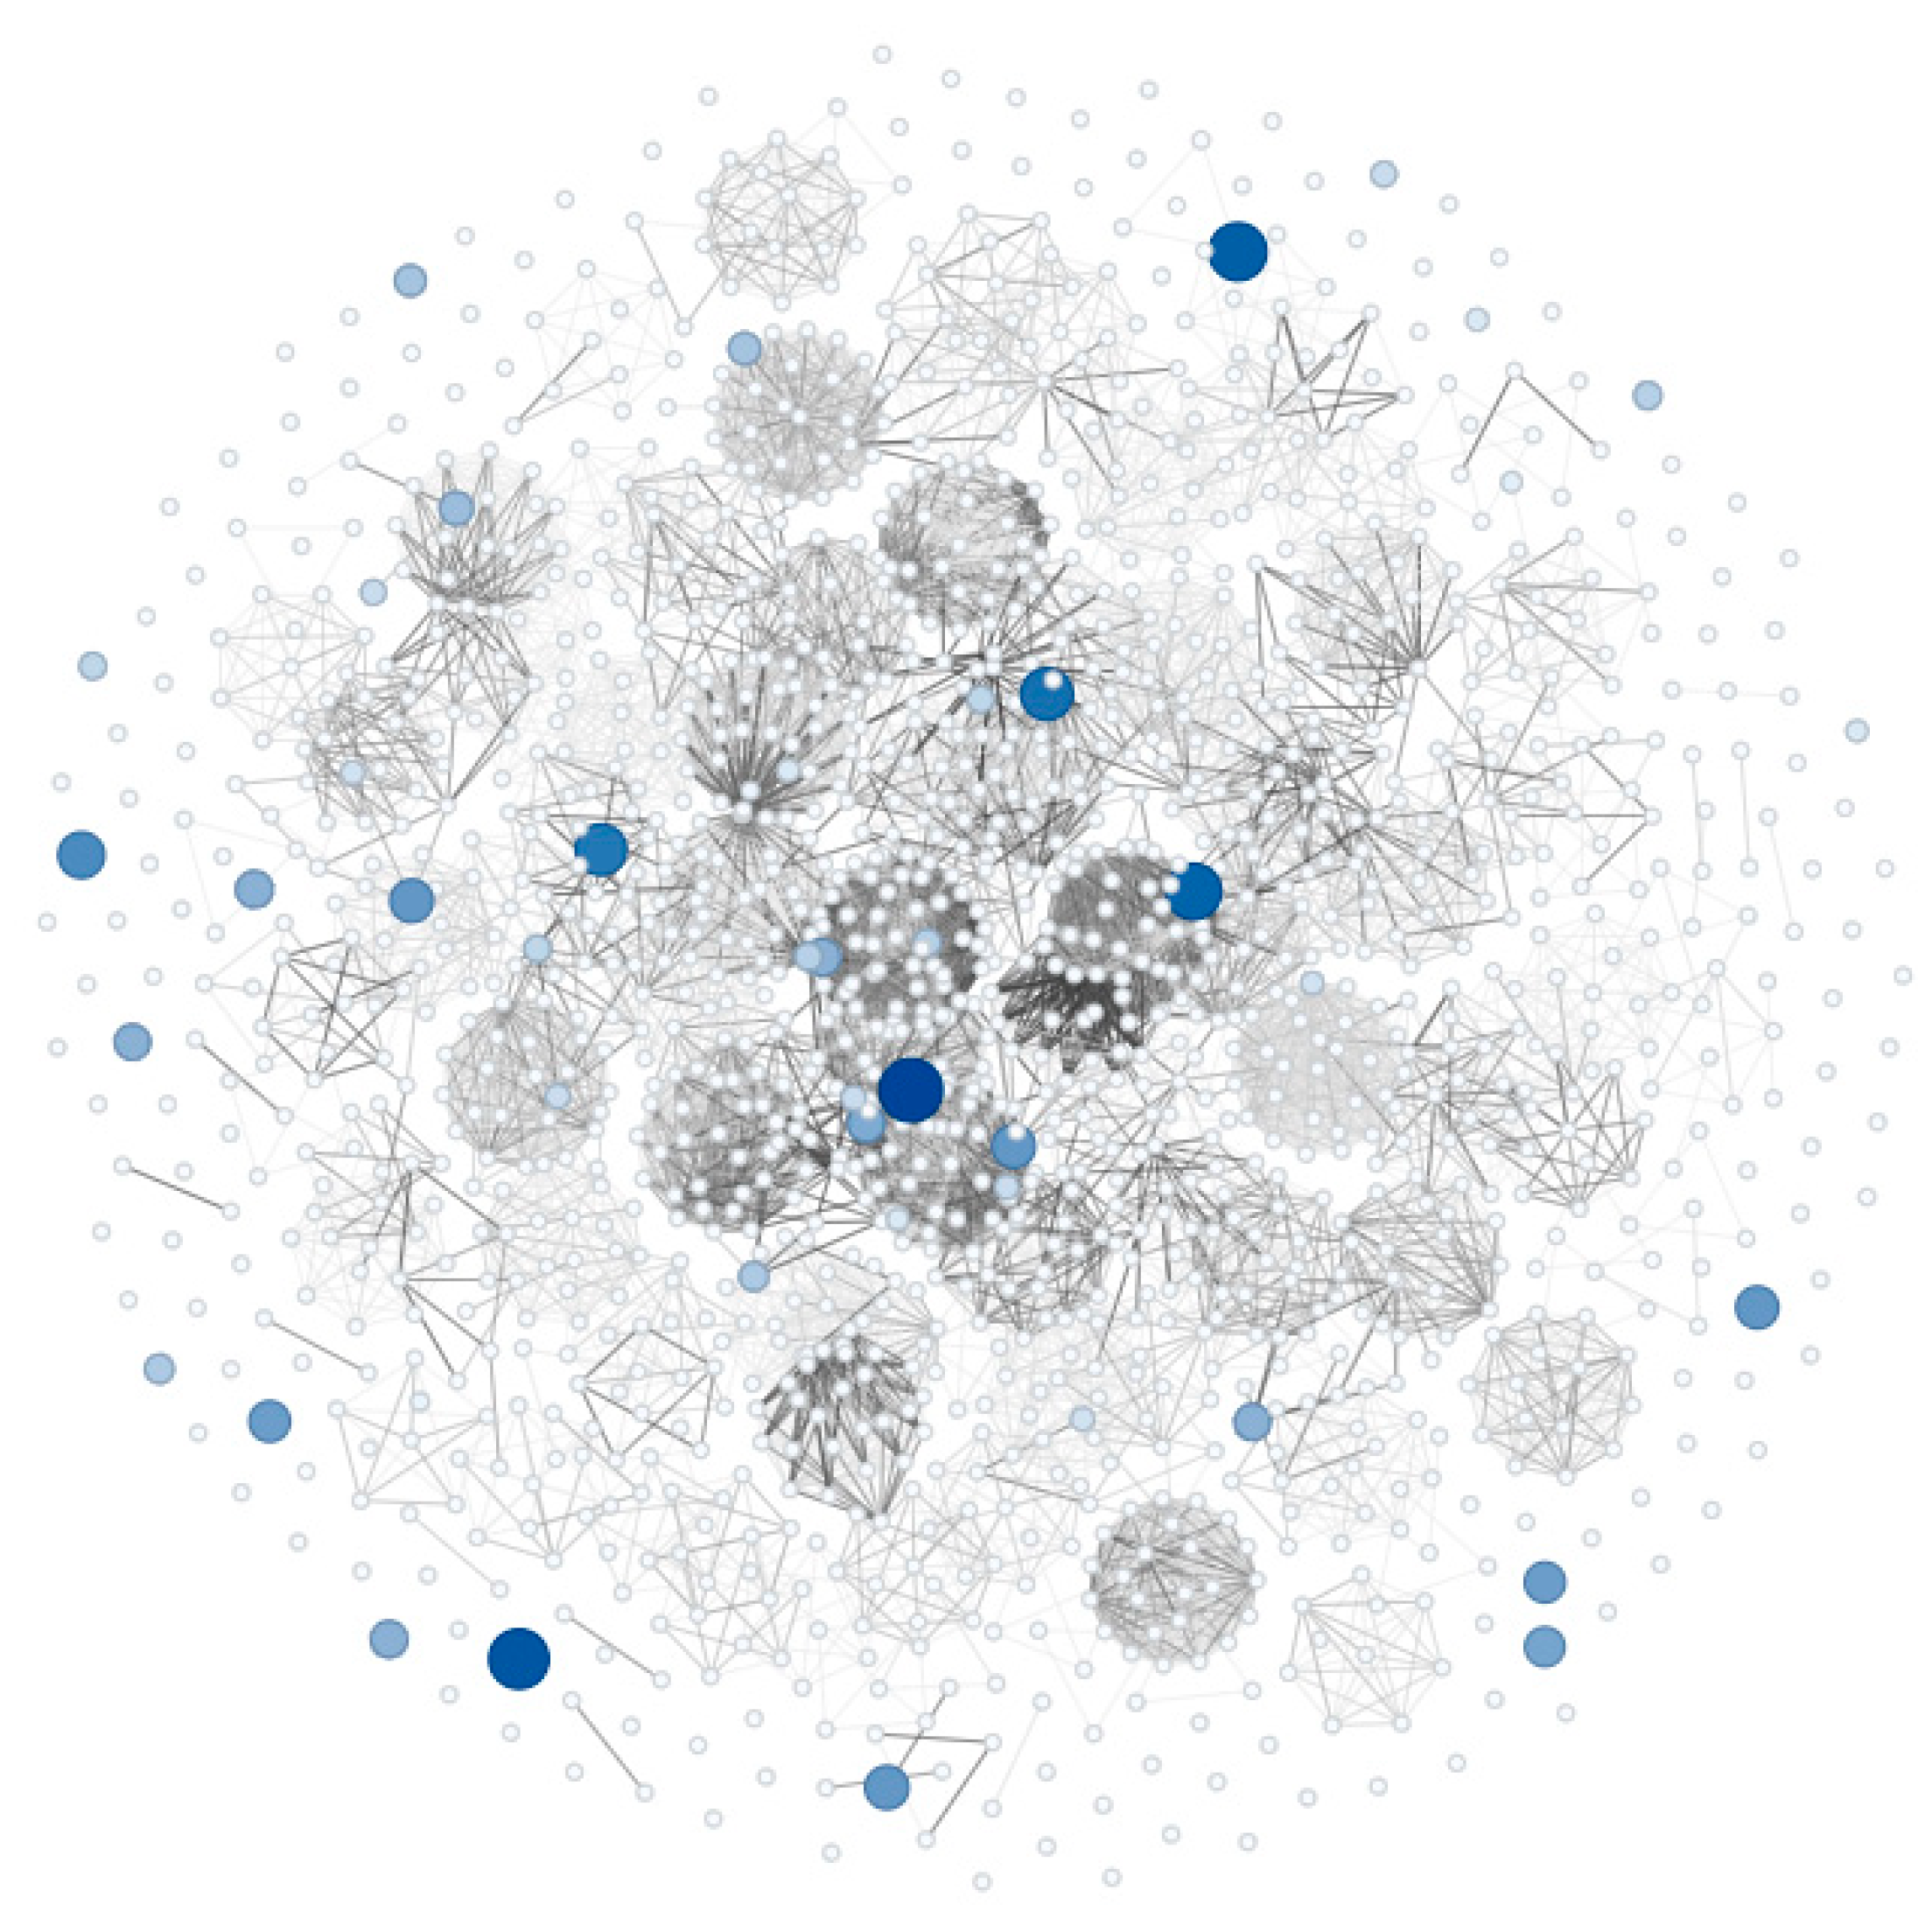
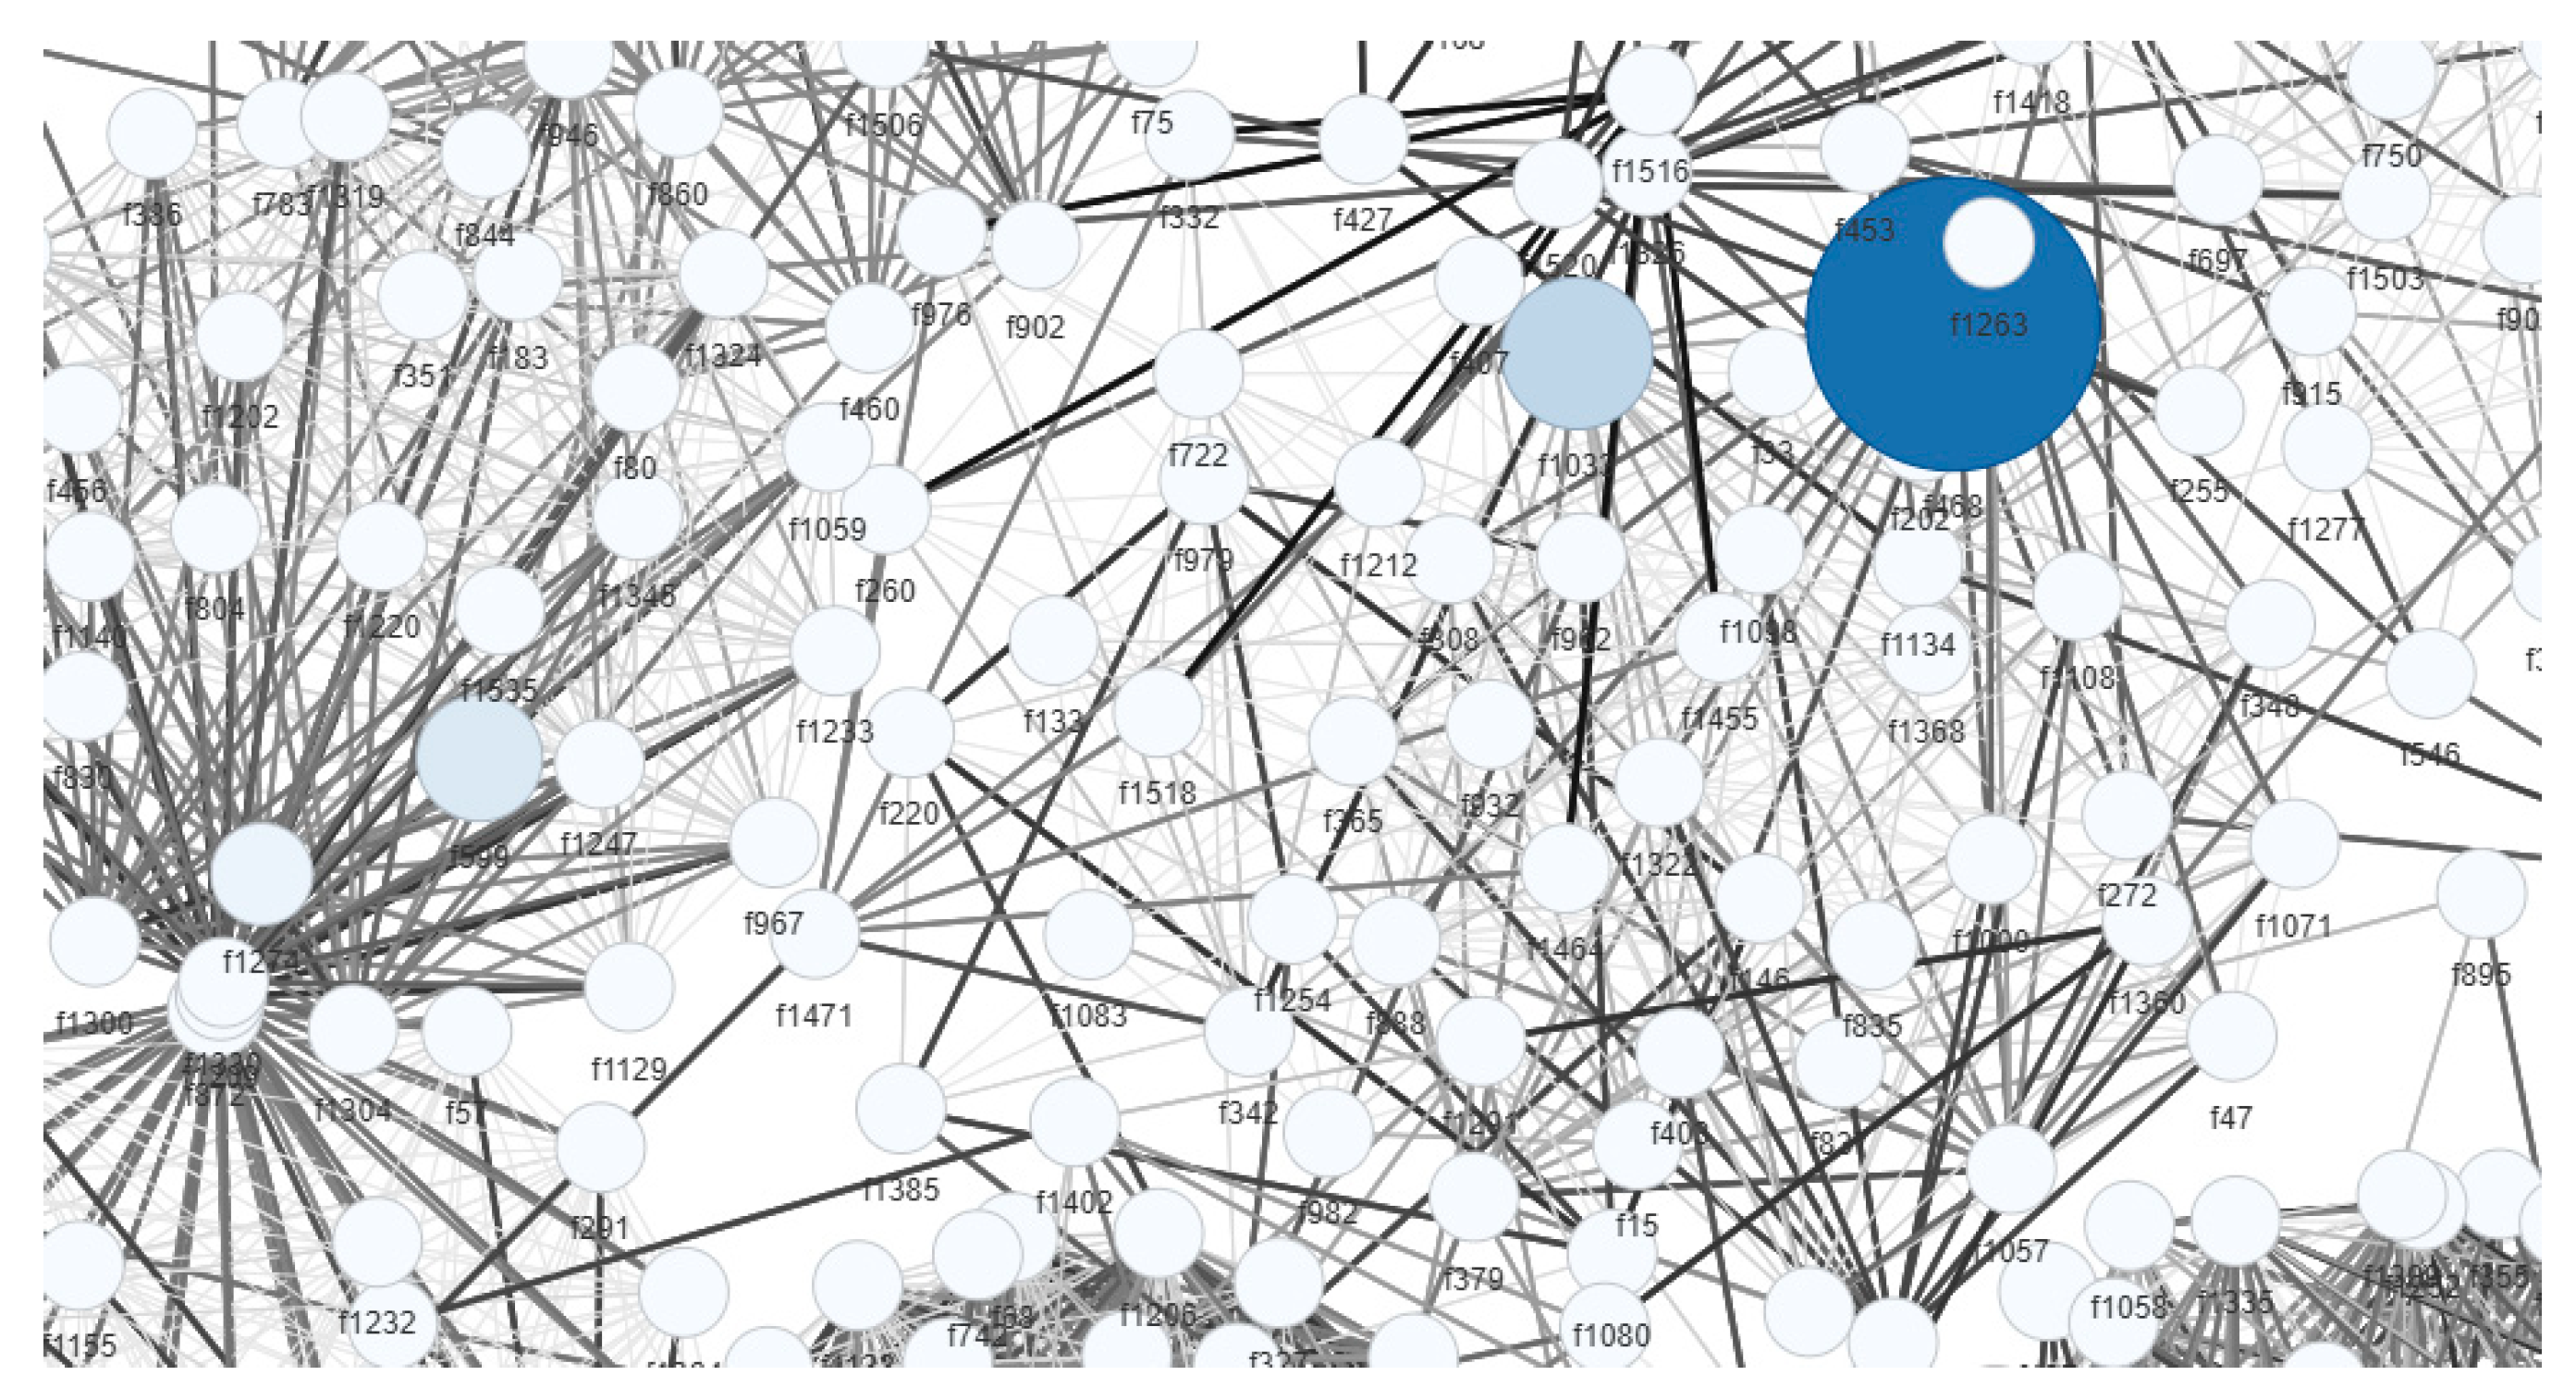
Figure 5.
presents the visualization of the quality control network with characteristic identifiers. The features are identified with the prefix "f" followed by a four-digit sequential number. For example, f1263 corresponds to feature number 1263 of the process.
Figure 5.
presents the visualization of the quality control network with characteristic identifiers. The features are identified with the prefix "f" followed by a four-digit sequential number. For example, f1263 corresponds to feature number 1263 of the process.
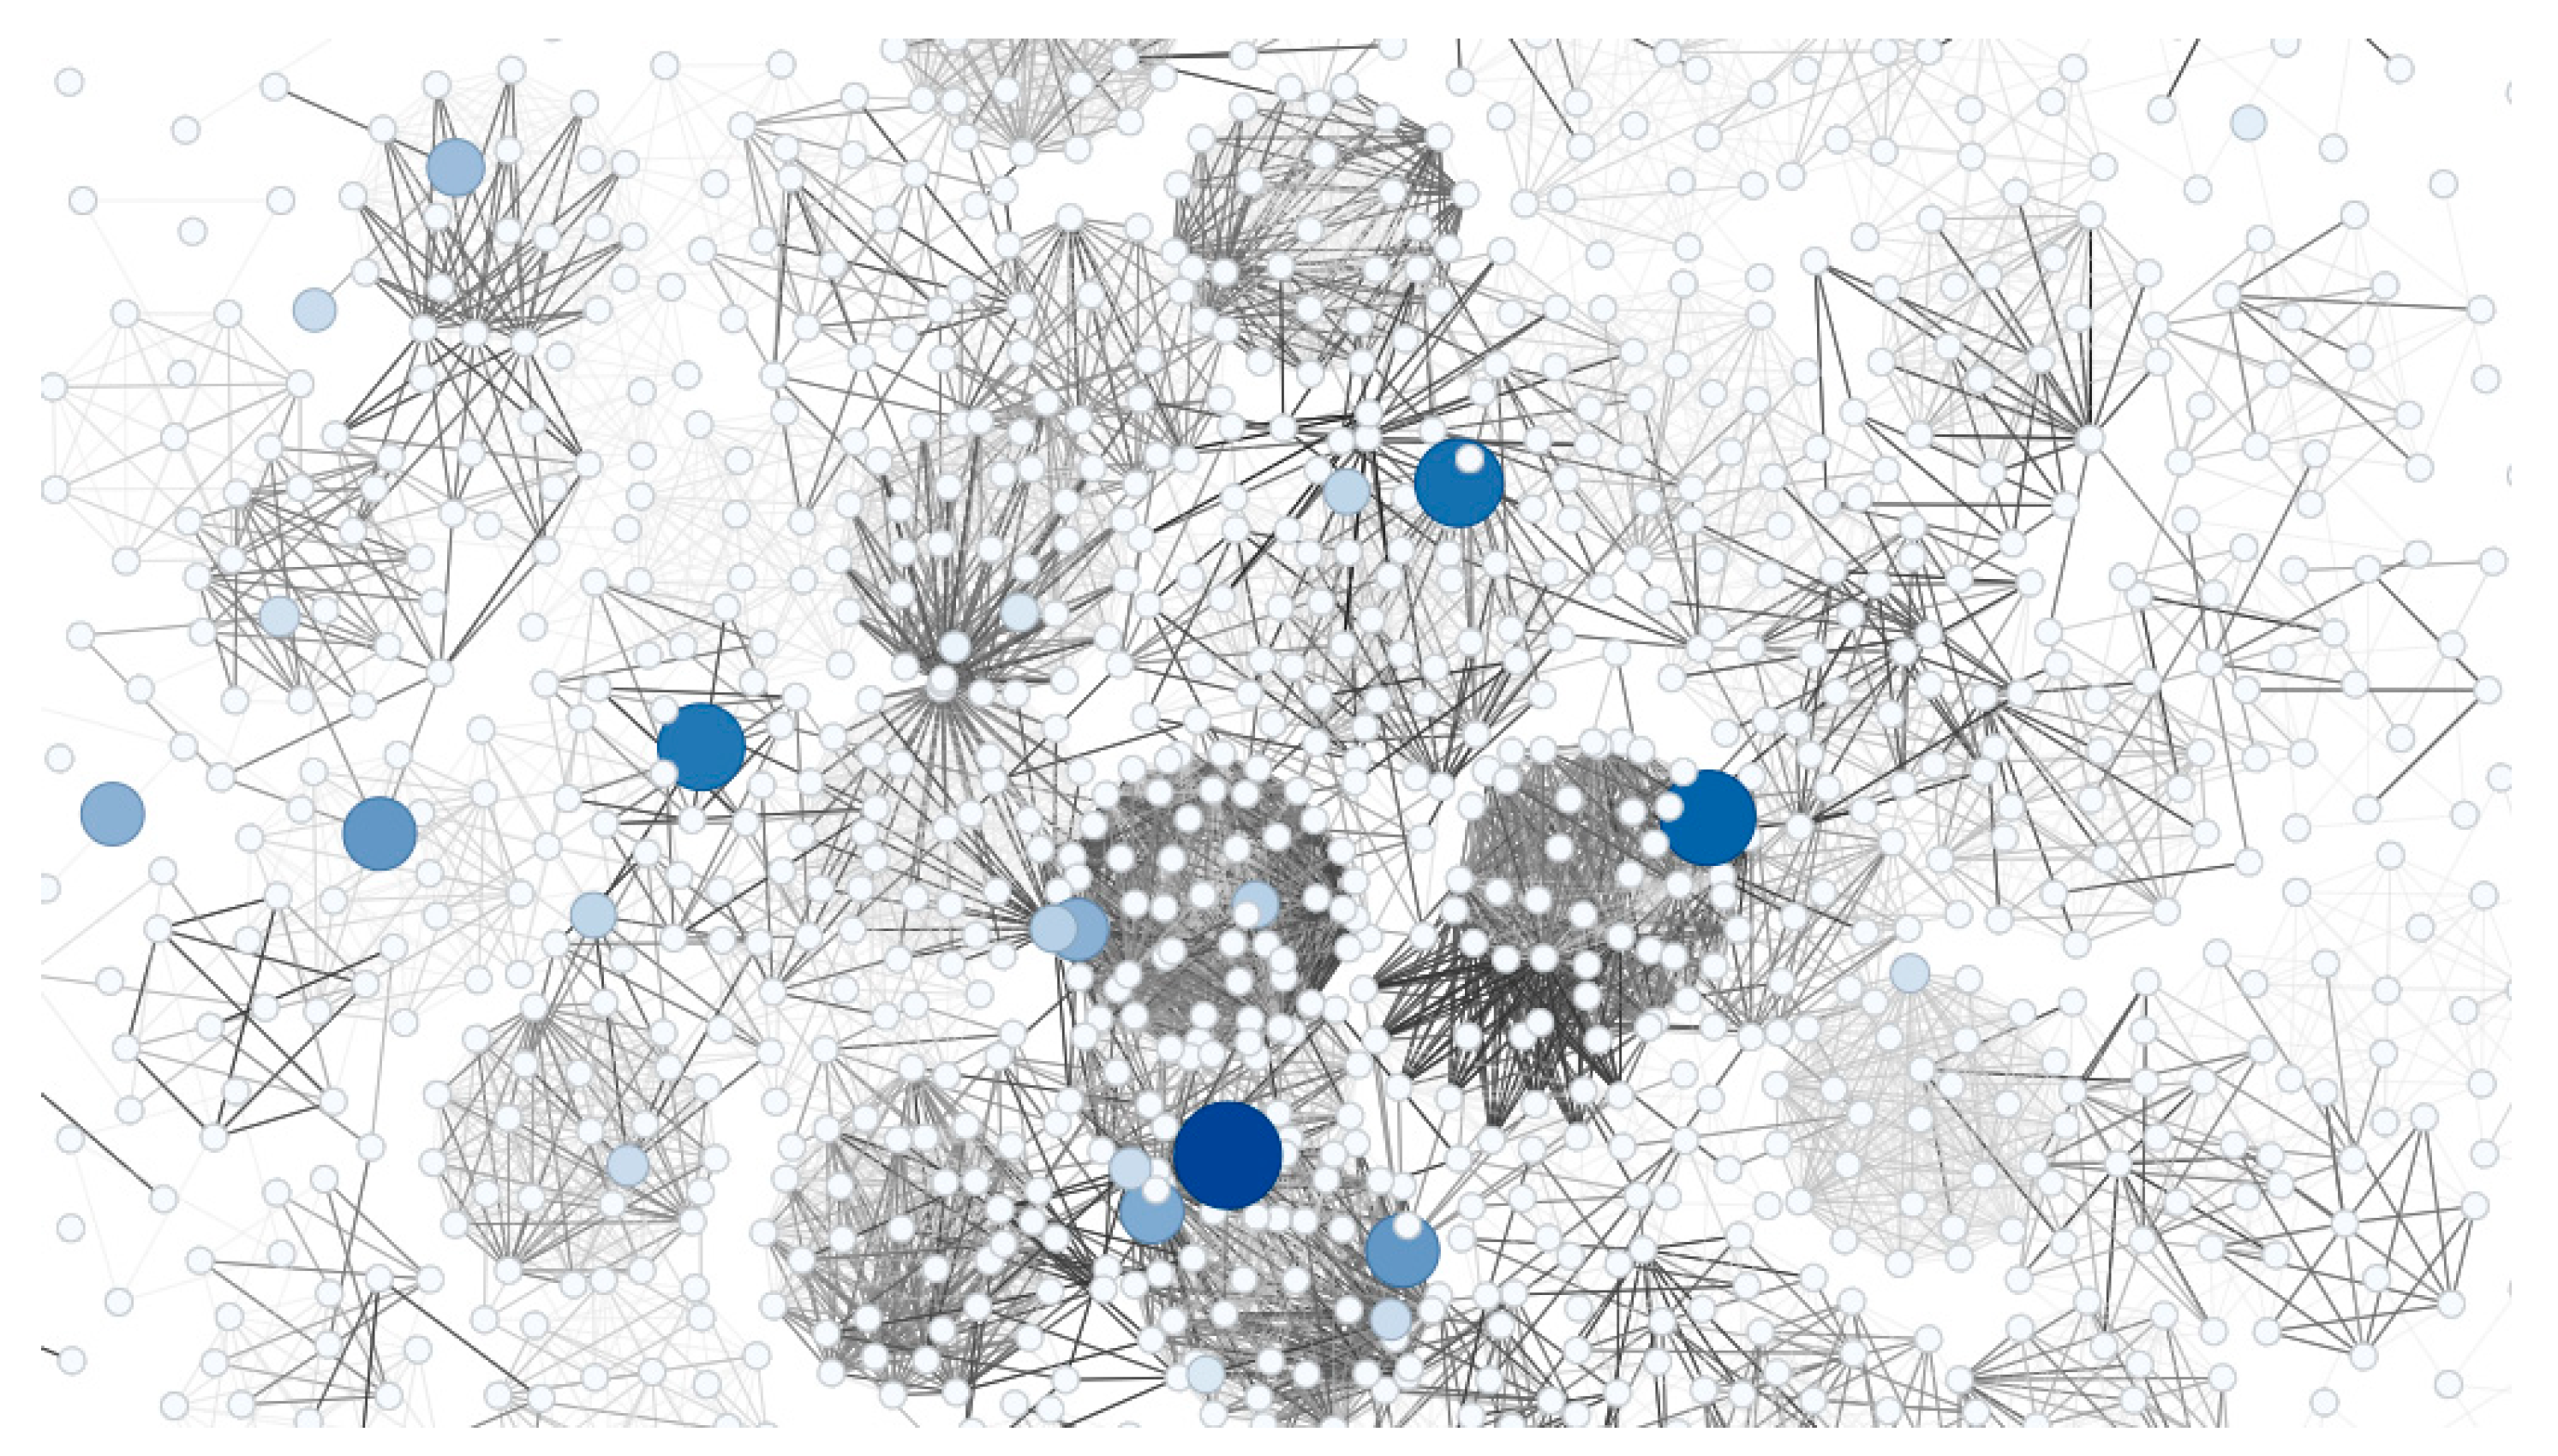
Figure 6.
illustrates the visualization of the network's structural configuration in core and peripheral zones. Panel (a) shows how the network accumulates connections in high-density areas, with strongly interconnected nodes forming clusters that reveal grouping patterns from the network's center outward. Meanwhile, panel (b) illustrates the network's peripheral region, where nodes with lower connectivity are located, demonstrating how these elements are spatially distributed in areas furthest from the network's center. This progressive representation facilitates understanding the network's complexity from different perspectives, enabling direct appreciation of the relationships between process characteristics.
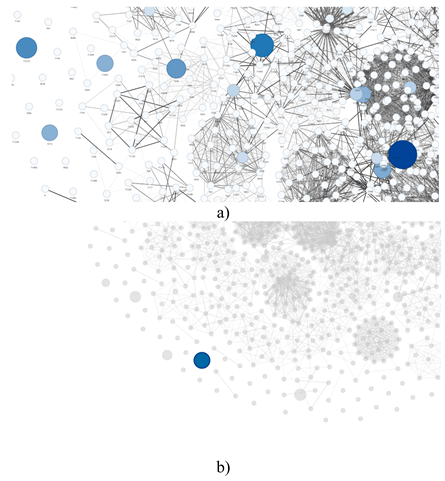
The visualization of the quality control network in chip manufacturing maintains graphical legibility, enabling identification of characteristics' importance hierarchy through node size and tonality, as well as correlation strength through connection intensity. The representation achieves a balance between showing densely connected structures (clusters) and more dispersed zones. This clarity in visualization facilitates understanding of the complex network of interrelationships in the manufacturing process, providing an effective visual tool for quality control monitoring and analysis.
Table 4 shows the top 20 nodes with highest centrality according to the SL-WLEN metric, including their components and final rankings.
The following figure presents visual local subnetworks corresponding to the six highest-ranked nodes according to the SL-WLEN metric, revealing distinctive patterns of connectivity and local structure. The composite visualization shows different topological configurations that justify the ranking obtained through the proposed metric.
Node f625, which occupies the first position, exhibits high density of local connections with a compact and well-connected structure, characterized by multiple intermediate nodes forming a cohesive community. The second highest-ranked node, f1397, presents a distinctive triangular connectivity pattern, less dense than f625 but with strategically distributed connections in its neighborhood. In third position, f468 shows a predominantly radial structure with direct connections and a more pronounced dispersion pattern than the previous ones. Node f506, in fourth place, is characterized by minimal but strategic connectivity, with sparse links and a simpler structure compared to higher-ranked nodes. The fifth node, f981, presents moderate connection density with a semi-compact structure and irregular link distribution. Finally, f732, in sixth position, is distinguished by a hexagonal structure with regular and symmetric connections, showing moderate density with an ordered pattern.
This visualization provides empirical evidence of how the SL-WLEN metric captures different aspects of centrality and local structure in the network. Visually, it is possible to appreciate its capability to identify significant nodes based on multiple topological and structural criteria.
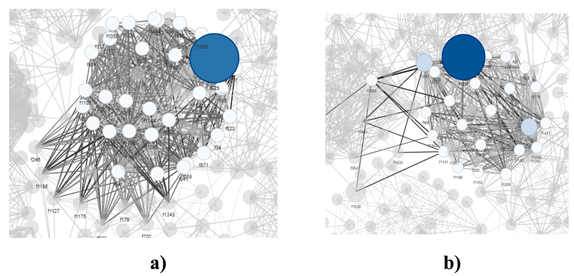
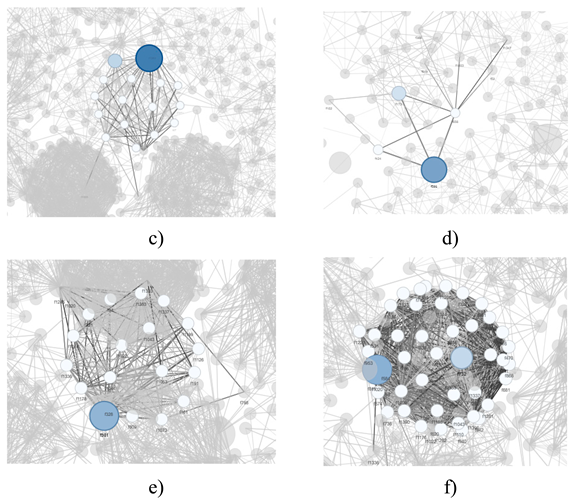
The visualizations are consistent with the SL-WLEN ranking. The top three nodes (f625, f1397, f468) demonstrate more sophisticated connectivity patterns that reflect their high metric values: f625 with its dense and cohesive structure (SLWLEN=0.4462), f1397 with strategic triangular connections (SLWLEN=0.4331), and f468 with its efficient radial pattern (SLWLEN=0.3754). The lower-ranked nodes (f506, f981, f732) exhibit simpler or less integrated structures, consistent with their lower SLWLEN values (0.3437, 0.3378, 0.3192 respectively).
The identification of these central characteristics through SL-WLEN reveals not only nodes important for final product quality but also their role in manufacturing system stability. The connection structure of these nodes suggests they are critical points for maintaining process coherence and stability: alterations in these characteristics could propagate extensively through the network due to their multilevel connectivity patterns. This complements the traditional approach based solely on nodal values by considering how these characteristics act as system stabilizers through their interconnections. For example, the dense and cohesive structure of node f625 suggests it is crucial not only for final quality but also for maintaining operational stability of the manufacturing process.
6. Robustness Analysis of the SL-WLEN Metric
To evaluate the robustness of the SL-WLEN metric, we adapted the methodology proposed by [38], which continues to be employed in contemporary research, such as in the study by [39], who developed a systematic framework to analyze how classical centrality measures (degree, betweenness, closeness, and eigenvector) maintain their consistency under different conditions of error or perturbation in network data. The same perturbation and evaluation techniques were applied to our composite SL-WLEN metric, which, unlike classical metrics, incorporates both structural aspects and nodal values in its calculation. The importance of this analysis lies in that, in real situations, networks may be subject to various types of modifications or errors in their structure.
The process began with selecting a representative sample of the network, balancing computational efficiency and structural representativeness. Given that the complete network consists of 1,555 nodes, a robustness analysis on the entire network would be computationally intensive and time-demanding. Therefore, a sample size of 100 nodes was determined, large enough to capture the network structure without compromising analysis viability. To ensure representativeness, stratified sampling based on connectivity distribution was implemented, following the power-law distribution observed in real networks. Strata were defined according to node degree, classifying them into high, medium, and low connectivity. Node allocation in each stratum was performed using the formula , where is the sample size for stratum , the total sample size, the stratum size in the population, and the total number of nodes. To ensure balanced network representation, the sample distribution was adjusted, allocating 20% to highly connected nodes (hubs), 60% to medium connectivity nodes, and 20% to peripheral nodes. This allowed capturing the global network structure while optimizing computational resources during test execution.
Four fundamental types of error that can occur in real networks were considered. Node removal simulates scenarios where data from some actors is lost, randomly selecting nodes, where n is the total number of nodes and p is the modification proportion (0.01, 0.05, etc.). Node addition represents situations where new actors are incorporated into the network, creating new nodes with degree similar to randomly selected existing nodes. Edge removal simulates cases where existing connections are lost, randomly selecting edges, where m is the total number of edges. Edge addition represents scenarios where new connections are created between previously unconnected nodes.
The selection of perturbation levels was made considering a spectrum ranging from minimal modifications to substantial network changes. Levels of 1% were used, representing minimal errors or minor natural changes in the network; 5% and 10% simulating moderate perturbations; 25% representing significant structure alteration; and 50% simulating extreme network modification. This gradation allows evaluating the metric's sensitivity to small perturbations, its resistance to moderate changes, and its behavior under extreme conditions.
To evaluate different aspects of robustness, five complementary metrics were implemented. The Top 1 metric measures the proportion of times the most important node maintains first position after modification, Top 3 indicates the frequency with which it remains among the top three, and Top 10% represents the proportion of times it stays within the first decile. For example, if a node has values of 0.980 in Top 1, 0.900 in Top 3, and 1.000 in Top 10%, it means that in 98% of replications it retained first position, in 90% it remained among the top three, and in all replications it stayed within the first decile.
The Overlap measure calculates the normalized intersection between the upper deciles of the original and modified networks, defined as , where A and B represent the sets of nodes in the first decile of each network. Its value varies between 0 and 1, indicating the degree of coincidence between both networks; for example, a value of 0.720 means that 72% of nodes in the first decile are the same in both versions. On the other hand, represents the square of the Pearson correlation between the SL-WLEN values of the original and modified network. Values close to 1, such as 0.997, indicate that the relative order of nodes is preserved almost perfectly, while lower values reflect a greater discrepancy in ordering.
The validation process was designed at multiple levels to ensure the robustness of results. Fifty replications were performed, generating in each one a modified version of the network, called "test network," on which modifications were applied. The evaluation included independent analysis of each combination of error type and level, calculating the five robustness measures and averaging the results. The entire process was documented, recording changes in each replication, ensuring modification traceability, and generating detailed reports.
Table 5, Table 6, Table 7 and Table 8 show the robustness results of the SL-WLEN metric under different network perturbation levels.
The test results demonstrate that the SL-WLEN metric exhibits robust and reliable behavior under different network perturbation conditions. The metric shows notable stability against element removal, particularly in the case of edges, where it maintains Top1/3/10% values above 0.900 even with 50% modifications. For node removal, the metric preserves its stability up to 25% modification, with Top1/3/10% values equal to or greater than 0.800, and maintains R² values above 0.92 even with 50% alterations.
Regarding element addition, both for nodes and edges, the metric shows progressive deterioration starting from 10% modification, demonstrating greater sensitivity to the incorporation of new elements than to their removal. This sensitivity is reflected in a substantial decrease in consistency for large-scale modifications, where R² decreases to approximately 0.77. Nevertheless, the metric maintains high reliability in scenarios with small perturbations of 1-5%.
The practical implications of these results confirm that the SL-WLEN metric is particularly effective in identifying and maintaining the hierarchy of the most important nodes in the network, even under conditions of moderate data loss. Its greater sensitivity to the incorporation of new elements suggests the need for caution when making modifications that exceed 25% of the network structure. These findings validate the robustness and utility of the SL-WLEN metric for complex network analysis, demonstrating its capability to maintain consistency in identifying critical nodes under various perturbation conditions.
7. Conclusions
This paper proposes SL-WLEN as a weighted semi-local centrality metric based on the integration of lexicographic ordering and extended neighborhood concept for identifying influential nodes in complex quality control networks. Beyond node importance, SL-WLEN incorporates both topological structure and nodal values in its evaluation, considering four main components: local influence by connectivity, local node influence, semi-local degree influence, and semi-local influence based on lexicographic ordering. By applying a distributed approach that analyzes subgraphs per node and utilizing lexicographic ordering to evaluate hierarchical importance, SL-WLEN provides an effective balance between accuracy and computational complexity. Numerical robustness tests demonstrate SL-WLEN's high stability, especially against element removal, maintaining its consistency even with significant network modifications. However, the metric shows greater sensitivity to the incorporation of new elements, suggesting areas for improvement in future work. The extension of the metric to consider network temporal dynamics and its adaptation for different types of complex networks represents a promising direction for subsequent research.
Author Contributions
Maricela Fernanda Ormaza Morejón designed the study. Material preparation, data collection, and analysis were performed by Maricela Fernanda Ormaza Morejón with methodological contributions from Rolando Ismael Yépez Moreira. The first draft of the manuscript was written by Fernanda Maricela Ormaza Morejón, and both authors commented on previous versions of the manuscript. Both authors read and approved the final manuscript.
Data Availability Statement
The original data presented in the study are openly available in Kaggle at https://www.kaggle.com/datasets/arbazkhan971/anomaly-detection.
Acknowledgments
This research was conducted within the framework of the Mathematics Ph.D. Program at the Instituto de Estudios Superiores de Investigación y Postgrado de Venezuela, to which we express our gratitude.
Conflicts of Interest
The authors declare no conflict of interest in this work.
References
- Liu, Z.; Gu, Z.; Liu, P. Artificial neural networks. In Transportation Big Data: Theory and Methods; Elsevier: Amsterdam, Netherlands, 2025; pp. 347–382. [Google Scholar] [CrossRef]
- Cuevas, E.; Avila, K.; Islas Toski, M.; Escobar, H. Complex networks and graph theory. In Agent-based Models with MATLAB; Elsevier: Amsterdam, Netherlands, 2025; pp. 75–103. [Google Scholar] [CrossRef]
- Lazzaro, I.; Milano, M. Network centralities and node ranking. In Reference Module in Life Sciences; Elsevier: Amsterdam, Netherlands, 2024. [Google Scholar] [CrossRef]
- Freeman, L.C. A set of measures of centrality based on betweenness. Sociometry 1977, 40, 35–41. [Google Scholar] [CrossRef]
- Brin, S.; Page, L. The anatomy of a large-scale hypertextual web search engine. Comput. Networks ISDN Syst. 1998, 30, 107–117. [Google Scholar]
- Sheng, J.; Dai, J.; Wang, B.; Duan, G.; Long, J.; Zhang, J.; Guan, W. Identifying influential nodes in complex networks based on global and local structure. Phys. A Stat. Mech. Appl. 2020, 541, 123262. [Google Scholar] [CrossRef]
- Abbasi, A.; Hossain, L. Hybrid centrality measures for binary and weighted networks. In Complex Networks; Springer: Berlin, Germany, 2013; pp. 1–7. [Google Scholar]
- Benyahia, O.; Largeron, C. Centrality for graphs with numerical attributes. In Proceedings of the IEEE/ACM International Conference on Advances in Social Networks Analysis and Mining (ASONAM), Paris, France, 25–28 August 2015; pp. 1348–1353. [Google Scholar] [CrossRef]
- Kitsak, M.; Gallos, L.K.; Havlin, S.; Liljeros, F.; Muchnik, L.; Stanley, H.E.; Makse, H.A. Identification of influential spreaders in complex networks. Nat. Phys. 2010, 6, 888–893. [Google Scholar]
- Zeng, A.; Zhang, C.J. Ranking spreaders by decomposing complex networks. Phys. Lett. A 2013, 377, 1031–1035. [Google Scholar]
- Chen, D.; Lü, L.; Shang, M.S.; Zhang, Y.C.; Zhou, T. Identifying influential nodes in complex networks. Phys. A Stat. Mech. Appl. 2012, 391, 1777–1787. [Google Scholar]
- Gao, S.; Ma, J.; Chen, Z.; Wang, G.; Xing, C. Ranking the spreading ability of nodes in complex networks based on local structure. Phys. A Stat. Mech. Appl. 2014, 403, 130–147. [Google Scholar]
- Liu, J.; Xiong, Q.; Shi, W.; Shi, X.; Wang, K. Evaluating the importance of nodes in complex networks. Phys. A Stat. Mech. Appl. 2016, 452, 209–219. [Google Scholar]
- Opsahl, T.; Agneessens, F.; Skvoretz, J. Node centrality in weighted networks: Generalizing degree and shortest paths. Soc. Networks 2010, 32, 245–251. [Google Scholar]
- Puzis, R.; Elovici, Y.; Zilberman, P.; Dolev, S.; Brandes, U. Topology manipulations for speeding betweenness centrality computation. J. Complex Netw. 2014, 3, 84–112. [Google Scholar]
- Akanmu, A.A.; Wang, F.Z.; Yamoah, F.A. Clique structure and node-weighted centrality measures to predict distribution centre location in the supply chain management. In Proceedings of the Science and Information Conference (SAI), London, UK, 27–29 August 2014; pp. 100–111. [Google Scholar]
- Bavelas, A. Communication patterns in task-oriented groups. J. Acoust. Soc. Am. 1950, 22, 725–730. [Google Scholar] [CrossRef]
- Zhang, K.; Zhou, Y.; Long, H.; Wang, C.; Hong, H.; Armaghan, S.M. Towards identifying influential nodes in complex networks using semi-local centrality metrics. J. King Saud Univ. Comput. Inf. Sci. 2023, 35, 101798. [Google Scholar] [CrossRef]
- Bonacich, P. Factoring and weighting approaches to status scores and clique identification. J. Math. Sociol. 1972, 2, 113–120. [Google Scholar] [CrossRef]
- Hajarathaiah, K.; Enduri, M.K.; Anamalamudi, S. Efficient algorithm for finding the influential nodes using local relative change of average shortest path. Phys. A Stat. Mech. Appl. 2022, 591, 126708. [Google Scholar]
- Xiao, Y.; Chen, Y.; Zhang, H.; Zhu, X.; Yang, Y.; Zhu, X. A new semi-local centrality for identifying influential nodes based on local average shortest path with extended neighborhood. Artif. Intell. Rev. 2024, 57, 115. [Google Scholar] [CrossRef]
- Lv, Z.; Zhao, N.; Xiong, F.; Chen, N. A novel measure of identifying influential nodes in complex networks. Phys. A Stat. Mech. Appl. 2019, 523, 488–497. [Google Scholar]
- Zhao, X.; Liu, F.; Wang, J.; Li, T. Evaluating influential nodes in social networks by local centrality with a coefficient. ISPRS Int. J. Geo-Inf. 2017, 6, 35. [Google Scholar] [CrossRef]
- Tripathy, A.; Green, O. Scaling betweenness centrality in dynamic graphs. In Proceedings of the IEEE High Performance Extreme Computing Conference (HPEC), Waltham, MA, USA, 25–27 September 2018; pp. 1–7. [Google Scholar] [CrossRef]
- Hajarathaiah, K.; Enduri, M.K.; Dhuli, S.; Anamalamudi, S.; Cenkeramaddi, L.R. Generalization of relative change in a centrality measure to identify vital nodes in complex networks. IEEE Access 2023, 11, 653–666. [Google Scholar] [CrossRef]
- Qu, D.; Liang, W.; Zhang, Y.; Gu, C.; Zhou, G.; Zhan, Y. Research on identification of critical quality features of machining processes based on complex networks and entropy-CRITIC methods. Computers 2024, 13, 216. [Google Scholar] [CrossRef]
- Kulcsár, E.; Gyurika, I.G.; Csiszér, T. Network-based – Quality Function Deployment (NB-QFD): The combination of traditional QFD with network science approach and techniques. Comput. Ind. 2021, 133, 103592. [Google Scholar] [CrossRef]
- Niu, Q.; Cheng, S.; Qiu, Z. Algorithm for correlation diagnosis in multivariate process quality based on the optimal typical correlated component pair group. Processes 2024, 12, 652. [Google Scholar] [CrossRef]
- Charitou, T.; Lallas, E.; Gerogiannis, V.C.; Karageorgos, A. A network modeling and analysis approach for pharma industry regulatory assessment. IEEE Access 2024, 12, 46470. [Google Scholar] [CrossRef]
- Wang, L.; He, F.; Zhao, Y.; Wang, J.; Lu, P.; Ou, Z.; Jia, Y. Complex network-based analysis of inter-basin water transfer networks. Ecol. Indic. 2023, 156, 111197. [Google Scholar] [CrossRef]
- Unicomb, S.; Iñiguez, G.; Gleeson, J.P.; Karsai, M. Dynamics of cascades on burstiness-controlled temporal networks. Nat. Commun. 2021, 12, 133. [Google Scholar] [CrossRef]
- Aleandri, M.; Fragnelli, V.; Moretti, S. Lexicographic ranking based on minimal winning coalitions. arXiv 2022, in press. [Google Scholar] [CrossRef]
- Ding, J.; Liu, C.; Zheng, Y.; Zhang, Y.; Yu, Z.; Li, R.; Chen, H.; Piao, J.; Wang, H.; Liu, J.; Li, Y. Artificial Intelligence for Complex Network: Potential, Methodology and Application. arXiv 2024. submitted.. [Google Scholar]
- Liu, X. Special Issue "Artificial Intelligence in Complex Networks". Appl. Sci. 2024, 14, 2822. [Google Scholar] [CrossRef]
- Freeman, L.C. A centrality in social networks conceptual clarification. Soc. Networks 2002, 1, 238–263. [Google Scholar] [CrossRef]
- Sherly, K.D.; Bhattacharjee, S. A weighted hybrid centrality for identifying influential individuals in contact networks. In Proceedings of the IEEE International Conference on Electronics, Computing and Communication Technologies (CONECCT), Bangalore, India, 15–17 July 2022; pp. 1–6. [Google Scholar]
- Zhang, W. Screening node attributes that significantly influence node centrality in the network. Selforganizology 2016, 3, 114–124. [Google Scholar]
- Borgatti, S.P.; Carley, K.M.; Krackhardt, D. On the robustness of centrality measures under conditions of imperfect data. Soc. Networks 2006, 28, 124–136. [Google Scholar] [CrossRef]
- Everett, M.G.; Borgatti, S.P. Categorical attribute-based centrality: E-I and G-F centrality. Soc. Networks 2012, 34, 562–569. [Google Scholar]
Figure 1.
General implementation process of the proposed centrality metric.
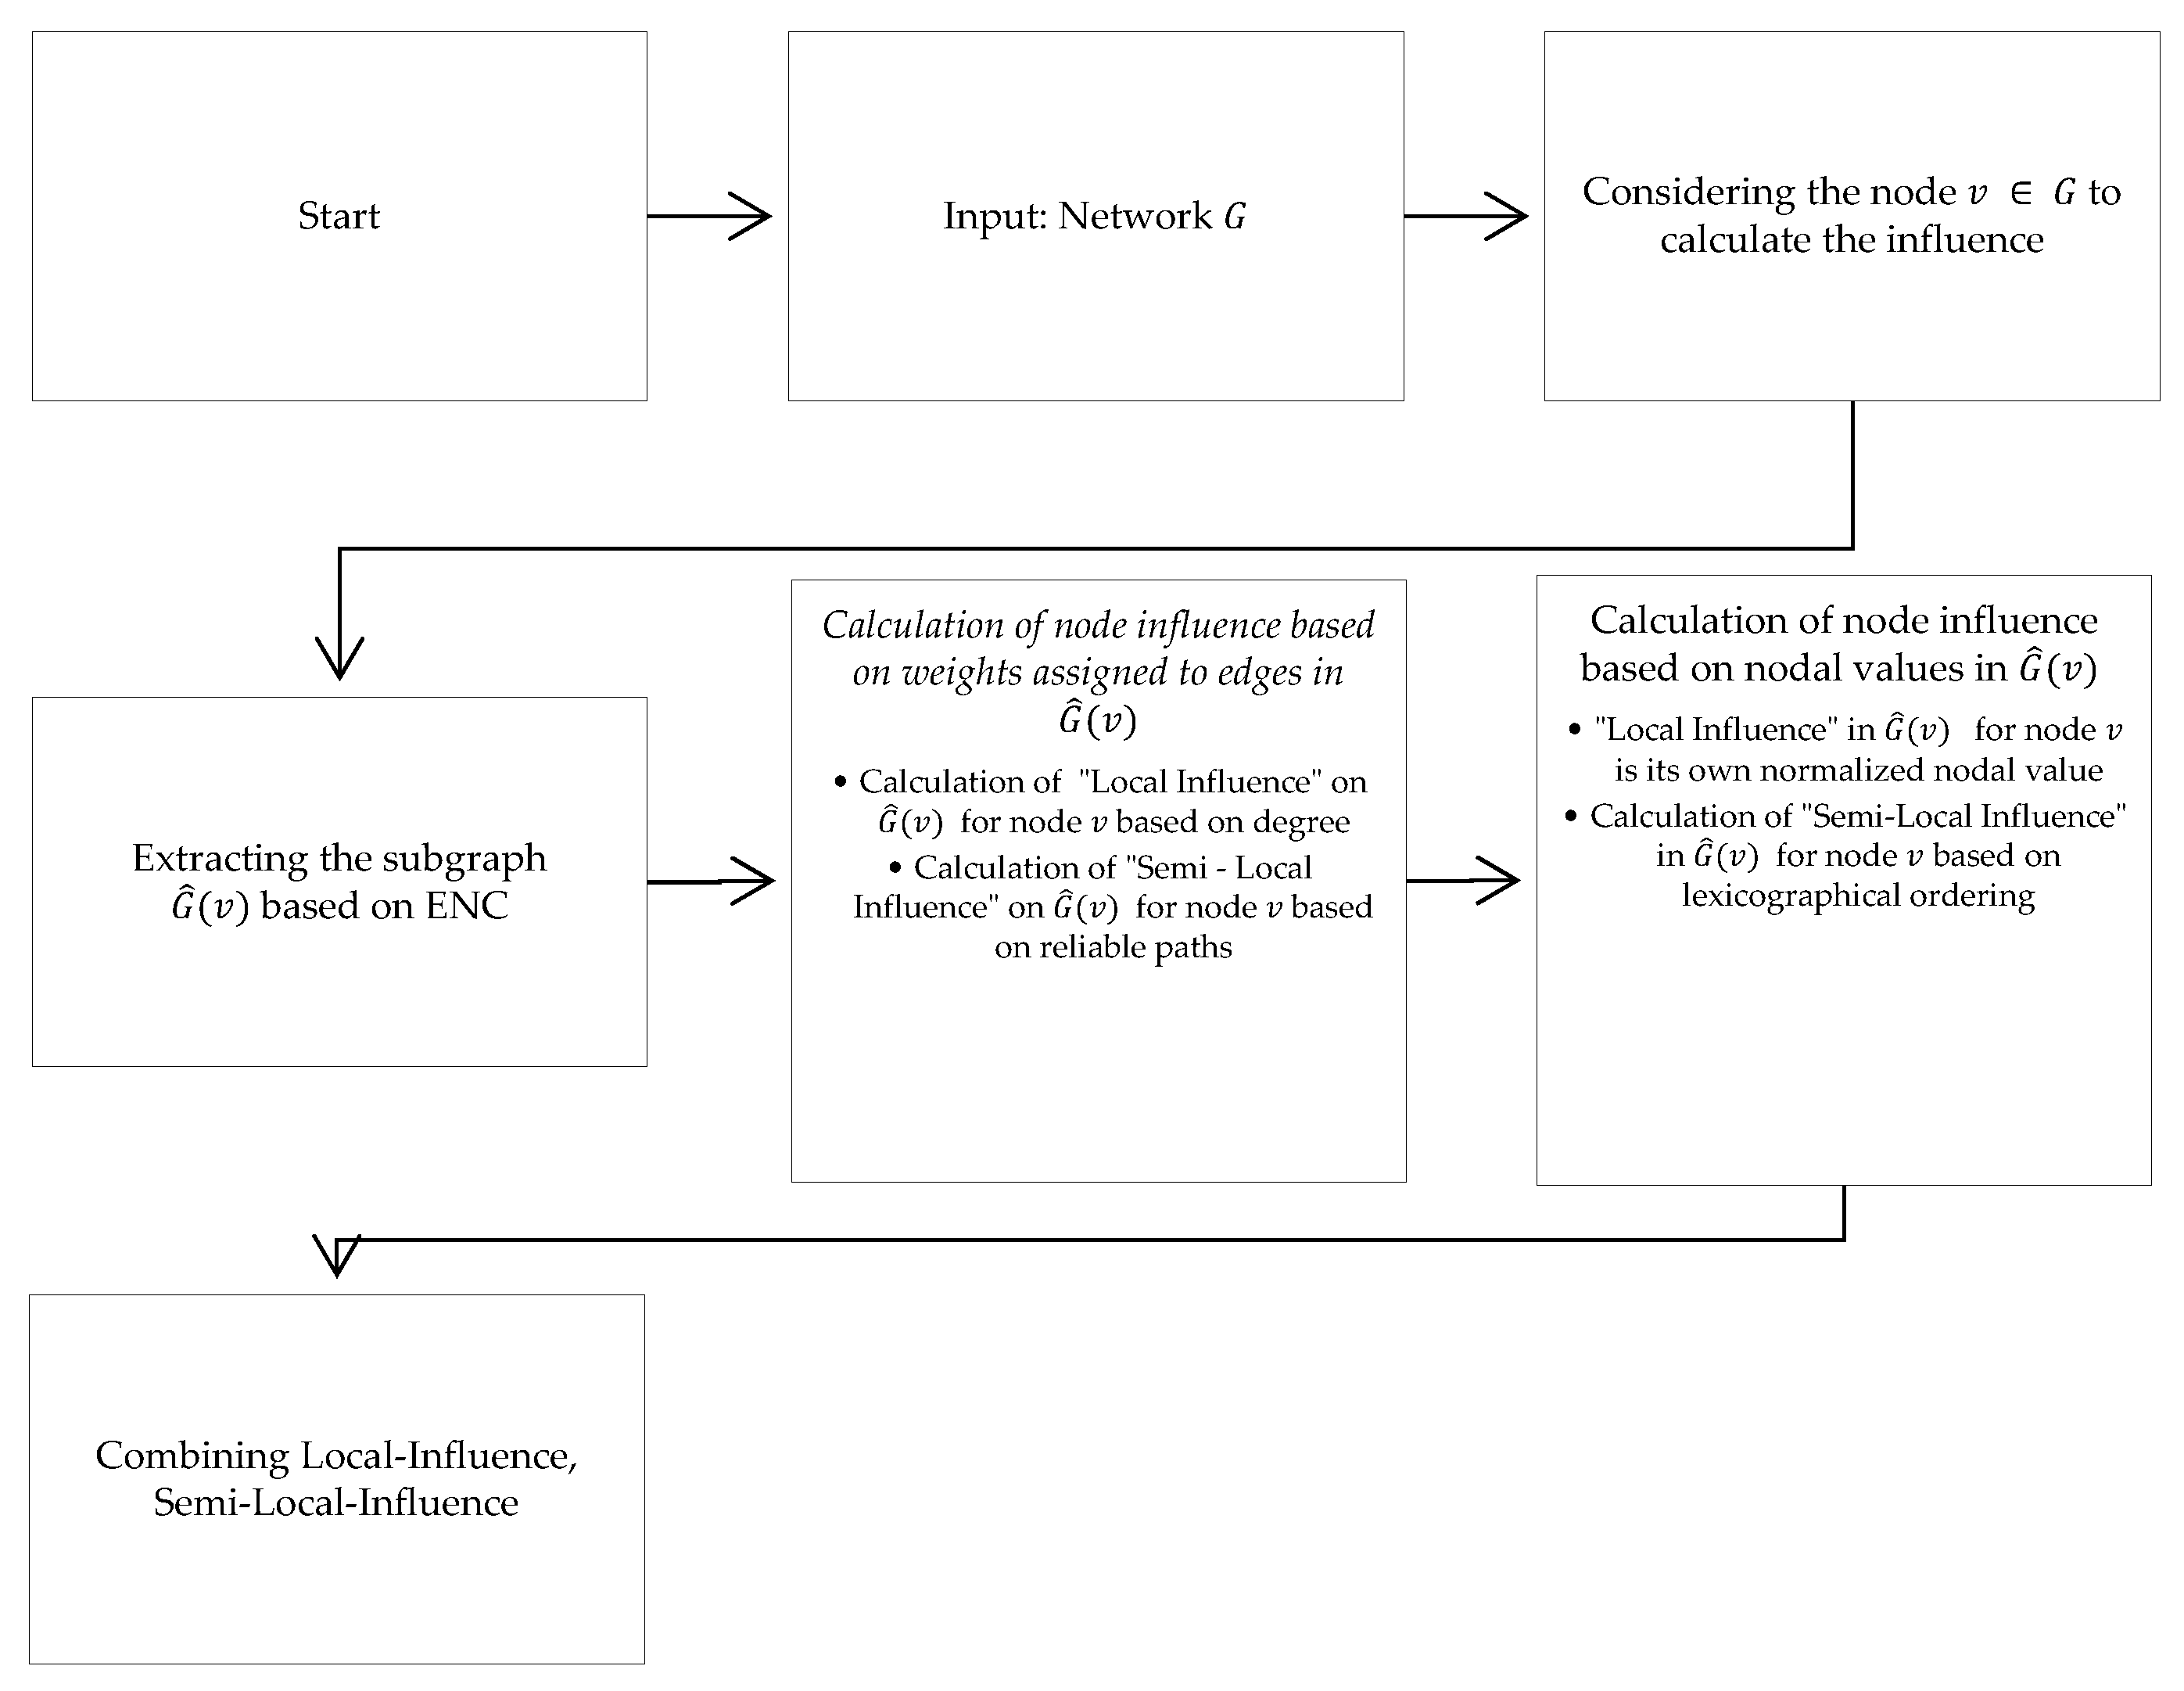

Table 1.
This is a table. Tables should be placed in the main text near to the first time they are cited.
Table 1.
This is a table. Tables should be placed in the main text near to the first time they are cited.
| Reference | Metric | Category | Formula | Parameter Description |
| [35] | DC | Local | ||
| [4] | BC | Global | ||
| [11] | SC | Semilocal | ||
| [12] | LSC | Semi-local | ||
| Liu et al. (2016) | DIL | Semi-local | ||
| [19] | LRASP | Semi-local | is removed | |
| [36] | WHC | Semi-local | ||
| [18] | INASP | Semi-local | are the impact coefficients |
Table 2.
Node-attribute based centrality metrics.
| Reference | Metric | Category | Formula | Parameter Description |
| [7] | Node-weighted Degree Centrality | Local | ||
| [14] | Node-weighted Harmzonic Centrality | Semi-local | . | |
| [15] | Node-weighted Betweenness Centrality | Semi-local | . | |
| [16] | Modified Node-weighted Eigenvector Centrality | Semi-local | is the unweighted eigenvector centrality. | |
| [37] | Node Attribute Screening Centrality | Local/Global | are regression coefficients. | |
| [8] | Node-weighted Degree Centrality | Local | . | |
| [17] | Multi-attribute CRITIC Network Decision Indicator (MCNDI) | Multi-atributo | are computed using the CRITIC method |
Table 3.
SL-WLEN metric results for all nodes in the example network
| Rank | Node | φDegreeLocal | Degree Semilocal | SemilocalNodeLexOrder(v) | SLWLEN(v) | |
| 1 | V6 | 0.636 | 1.000 | 0.403 | 0.308 | 0.587 |
| 2 | V8 | 0.273 | 1.000 | 0.376 | 0.025 | 0.419 |
| 3 | V10 | 0.091 | 1.000 | 0.166 | 0.010 | 0.317 |
| 4 | V9 | 0.273 | 0.375 | 0.285 | 0.171 | 0.276 |
| 5 | V4 | 0.364 | 0.125 | 0.343 | 0.229 | 0.265 |
| 6 | V2 | 0.182 | 0.375 | 0.191 | 0.231 | 0.245 |
| 7 | V3 | 0.364 | 0.125 | 0.262 | 0.210 | 0.240 |
| 8 | V5 | 0.182 | 0.125 | 0.262 | 0.345 | 0.228 |
| 9 | V11 | 0.182 | 0.375 | 0.297 | 0.055 | 0.227 |
| 10 | V1 | 0.182 | 0.375 | 0.200 | 0.054 | 0.203 |
| 11 | V7 | 0.182 | 0.125 | 0.223 | 0.157 | 0.172 |
Table 4.
SL- Top 20 SL-WLEN metric application in measuring quality characteristics centrality.
| Node | φDegreeLocal | Degree Semilocal | SemilocalNodeLexOrder(v) | SLWLEN(v) | Rank | |
| f625 | 0.0193 | 0.8412 | 0.6195 | 0.3047 | 0.4462 | 1 |
| f1397 | 0.0148 | 1.0000 | 0.6081 | 0.1095 | 0.4331 | 2 |
| f468 | 0.0096 | 0.7487 | 0.3923 | 0.3509 | 0.3754 | 3 |
| f506 | 0.0019 | 0.5576 | 0.4357 | 0.3796 | 0.3437 | 4 |
| f981 | 0.0109 | 0.4842 | 0.6195 | 0.2365 | 0.3378 | 5 |
| f732 | 0.0277 | 0.3096 | 0.6149 | 0.3245 | 0.3192 | 6 |
| f1020 | 0.0167 | 0.3912 | 0.6026 | 0.2623 | 0.3182 | 7 |
| f18 | 0.0051 | 0.5979 | 0.5259 | 0.1407 | 0.3174 | 8 |
| f901 | 0.0148 | 0.4201 | 0.4320 | 0.3188 | 0.2964 | 9 |
| f1245 | 0.0193 | 0.2558 | 0.6593 | 0.2277 | 0.2905 | 10 |
| f1048 | 0.0039 | 0.2307 | 0.5820 | 0.3438 | 0.2901 | 11 |
| f396 | 0.0006 | 0.7429 | 0.3657 | 0.0417 | 0.2877 | 12 |
| f181 | 0.0013 | 0.9256 | 0.0000 | 0.1667 | 0.2734 | 13 |
| f1165 | 0.0026 | 0.4705 | 0.5363 | 0.0833 | 0.2732 | 14 |
| f7 | 0.0193 | 0.0000 | 0.6410 | 0.4116 | 0.2680 | 15 |
| f1209 | 0.0251 | 0.0000 | 0.7026 | 0.3346 | 0.2656 | 16 |
| f1033 | 0.0103 | 0.2543 | 0.5077 | 0.2681 | 0.2601 | 17 |
| f721 | 0.0109 | 0.0000 | 0.5159 | 0.4992 | 0.2565 | 18 |
| f84 | 0.0161 | 0.0776 | 0.5680 | 0.3598 | 0.2553 | 19 |
| f1176 | 0.0257 | 0.0000 | 0.5118 | 0.4815 | 0.2548 | 20 |
Table 5.
Robustness test results for the SL-WLEN metric under different perturbation levels: node removal case.
Table 5.
Robustness test results for the SL-WLEN metric under different perturbation levels: node removal case.
| Proportion | Top1 | Top3 | Top10% | Overlap | R² |
| 0.01 | 0.980 | 0.980 | 0.980 | 0.687 | 0.996 |
| 0.05 | 0.920 | 0.920 | 0.920 | 0.636 | 0.994 |
| 0.10 | 0.900 | 0.900 | 0.900 | 0.580 | 0.991 |
| 0.25 | 0.800 | 0.800 | 0.800 | 0.381 | 0.978 |
| 0.50 | 0.500 | 0.500 | 0.500 | 0.213 | 0.921 |
Table 6.
Robustness test results for the SL-WLEN metric under different perturbation levels: node addition case.
Table 6.
Robustness test results for the SL-WLEN metric under different perturbation levels: node addition case.
| Error type | Top1 | Top3 | Top10 | Overlap | R² |
| 0.01 | 0.960 | 0.960 | 0.960 | 0.684 | 0.989 |
| 0.05 | 0.840 | 0.840 | 0.840 | 0.533 | 0.963 |
| 0.10 | 0.640 | 0.640 | 0.640 | 0.441 | 0.925 |
| 0.25 | 0.440 | 0.440 | 0.460 | 0.275 | 0.833 |
| 0.50 | 0.480 | 0.480 | 0.480 | 0.175 | 0.766 |
Table 7.
Robustness test results for the SL-WLEN metric under different perturbation levels: edge removal case.
Table 7.
Robustness test results for the SL-WLEN metric under different perturbation levels: edge removal case.
| Error type | Top1 | Top3 | Top10 | Overlap | R² |
| 0.01 | 1.000 | 1.000 | 1.000 | 0.720 | 0.997 |
| 0.05 | 0.980 | 0.980 | 1.000 | 0.759 | 0.998 |
| 0.10 | 1.000 | 1.000 | 1.000 | 0.726 | 0.998 |
| 0.25 | 1.000 | 1.000 | 1.000 | 0.632 | 0.994 |
| 0.50 | 0.900 | 0.900 | 1.000 | 0.553 | 0.983 |
Table 8.
Robustness test results for the SL-WLEN metric under different perturbation levels: edge addition case.
Table 8.
Robustness test results for the SL-WLEN metric under different perturbation levels: edge addition case.
| Error type | Top1 | Top3 | Top10 | Overlap | R² |
| 0.01 | 0.980 | 0.980 | 0.980 | 0.734 | 0.994 |
| 0.05 | 0.840 | 0.840 | 0.840 | 0.569 | 0.967 |
| 0.10 | 0.660 | 0.660 | 0.700 | 0.530 | 0.928 |
| 0.25 | 0.580 | 0.580 | 0.600 | 0.313 | 0.862 |
| 0.50 | 0.640 | 0.640 | 0.660 | 0.225 | 0.797 |
Disclaimer/Publisher’s Note: The statements, opinions and data contained in all publications are solely those of the individual author(s) and contributor(s) and not of MDPI and/or the editor(s). MDPI and/or the editor(s) disclaim responsibility for any injury to people or property resulting from any ideas, methods, instructions or products referred to in the content. |
© 2025 by the authors. Licensee MDPI, Basel, Switzerland. This article is an open access article distributed under the terms and conditions of the Creative Commons Attribution (CC BY) license (http://creativecommons.org/licenses/by/4.0/).
Copyright: This open access article is published under a Creative Commons CC BY 4.0 license, which permit the free download, distribution, and reuse, provided that the author and preprint are cited in any reuse.


