Submitted:
04 March 2025
Posted:
05 March 2025
You are already at the latest version
Abstract
This study investigates the influence of pressure pulse characteristics on the noise level generated by a swashplate axial piston pump. Axial piston pumps are widely used in hydraulic systems, but their inherent pulsating flow can lead to significant noise and vibration, affecting system performance and operator comfort. This research focuses on understanding the relationship between pressure pulses generated within the pump and the resulting airborne noise. Experiments were conducted by varying key pump operating parameters, such as rotation speed and discharge pressure, and measuring the pressure pulses at the pump outlet and the noise levels emitted.
Keywords:
Аgricultural machienry
; Axial piston pump
; Tractors
; Combine harvesters
; Sprayers
; Planters
; Swash plate
; Agricultural loaders
; Pressure pulse
; Noise level
; Vibration
1. Introduction
Variable displacement axial piston pumps offer significant advantages in agricultural machinery, where precise control and efficiency are crucial.
Variable displacement allows for precise adjustment of hydraulic power, according to the requirements of different devices and tasks. This optimizes performance and reduces energy loss [1-3]. By delivering only the amount of fluid needed, these pumps minimize power losses, resulting in fuel savings and reduced operating costs.
Variable displacement enables smoother and more responsive control of hydraulic devices, such as:
Tractors: Control of hydraulic systems for lifting, steering and powering attachments.
Combine harvesters: Regulate the speed and power of cutting heads, conveyors and other components.
Sprayers: Precisely control spray rate and pressure for accurate application of pesticides and fertilizers.
Planters: Providing consistent seed delivery and depth control.
Agricultural loaders: Highly precise control of loader arms and buckets.
These pumps can be integrated with electronic control systems to optimize hydraulic power delivery based on real-time operating conditions [4]. Variable-flow control of the speed and power of the cutter head, threshing mechanism, and grain handling system ensures efficient harvesting and minimizes grain loss at the combine [5]. Variable-flow pumps in agricultural sprayers allow precise control of spray rate, ensuring accurate chemical application and reducing environmental impact. Variable flow axial piston pumps are essential in the hydraulic systems that drive the wheels of many modern agricultural machines. Variable flow allows for smooth changes in speed and direction. In essence, variable-flow axial piston pumps contribute to: increased productivity, reduced fuel consumption, improved accuracy, and increased environmental sustainability [6,7,8].
Monitoring the frequency and amplitude of vibrations in a variable flow axial piston pump can indicate the severity of the problem. Direct measurement of pressure pulsations using a pressure transducer can provide valuable data. Analysis of the frequency and amplitude of pressure fluctuations can help identify specific faults [9]. Measuring fluctuations in the pump's rotational speed can indicate wear on internal components, especially in the flow distribution pair [10,11].
By combining diagnostic methods, it is possible to effectively identify and resolve pressure pulsation problems in axial piston pumps used in agricultural machinery, minimizing downtime and maximizing productivity.
Previous studies have extensively investigated the noise and vibration characteristics of axial piston pumps with conventional valve plate designs [12]. However, the specific influence of the flap valve design on pressure pulse generation and noise remains relatively under-researched [13]. This study aims to bridge this gap by systematically investigating the relationship between pressure pulse characteristics and noise levels in axial piston pumps using flap valves. A detailed analysis of the pressure pulse waveforms, including amplitude, frequency, and harmonic content, was correlated with the measured noise spectra [14]. The study aims to identify the dominant noise sources and the specific pressure pulse characteristics that contribute most significantly to noise generation. The findings provide valuable insights for optimizing pump design and operating conditions to reduce noise and improve the overall performance of hydraulic systems [15]. This includes investigating potential mitigation strategies, such as optimizing the design of the baffle plate, valve timing, and pulsation dampers, to reduce pressure pulsations and consequently lower noise levels [16,17,18].
This study involves a combined analytical and experimental approach. Detailed measurements of the pump output pressure pulsations and emitted noise were carried out under various operating conditions, such as pump speed, discharge pressure, and fluid properties. Advanced signal processing techniques were used to analyze the pressure and noise data, identifying key parameters such as pulse amplitude, frequency content, and harmonic components. Furthermore, the study investigated the dynamic behavior of the flap disc itself and its correlation with the observed pressure pulsations [19,20,21].
The ultimate goal of this research is to gain a deeper understanding of the mechanisms by which flap disc valves contribute to noise generation in axial piston pumps. The findings will provide valuable insights for optimizing flap disc design and pump operating parameters to minimize noise and vibration, leading to quieter and more efficient hydraulic systems. This knowledge can then be used to develop improved pump designs and noise reduction strategies, ultimately contributing to the advancement of hydraulic system technology.
Axial piston pumps are the cornerstone of modern hydraulic systems, finding widespread application in industries ranging from construction and agriculture to aerospace and manufacturing. Their ability to deliver high pressures and variable flow rates makes them indispensable for numerous power transmission and control applications. However, a significant drawback of these pumps is the inherent generation of pressure pulsations due to the reciprocating motion of the pistons and the discrete nature of fluid delivery. These pressure fluctuations propagate throughout the hydraulic system, manifesting as noise and vibration, which can negatively impact system performance, reduce operator comfort, and even lead to premature component wear [22].
In particular, the valve plate design and associated flow dynamics play a key role in the generation and characteristics of pressure pulsations. This study specifically focuses on axial piston pumps equipped with a poppet valve design. Flap discs offer potential advantages in terms of ease of manufacture and cost-effectiveness, but their impact on pressure pulse generation and noise characteristics requires detailed investigation. Unlike traditional valve plates, the dynamic behavior of a flap disc, including its opening and closing characteristics under different flow conditions, can significantly affect the pressure waveform and the resulting noise character.
Previous research has extensively investigated the noise and vibration characteristics of axial piston pumps with conventional valve plate designs. However, the specific impact of flap valve design on pressure pulse generation and noise remains relatively under-researched. This research aims to bridge this gap by systematically investigating the relationship between pressure pulse characteristics and noise levels in axial piston pumps using flap valves [23].
This study involves a combined analytical and experimental approach. Detailed measurements of the pump outlet pressure pulsation and the emitted noise were carried out under various operating conditions, such as pump speed, discharge pressure and fluid properties. Advanced signal processing techniques were used to analyze the pressure and noise data, identifying key parameters such as pulse amplitude, frequency content and harmonic components. Furthermore, the study investigated the dynamic behavior of the flap disc itself and its correlation with the observed pressure pulsations.
The ultimate goal of this research is to gain a deeper understanding of the mechanisms by which flap disc valves contribute to noise generation in axial piston pumps. The findings will provide valuable insights for optimizing the flap disc design and pump operating parameters to minimize noise and vibration, leading to quieter and more efficient hydraulic systems. This knowledge can then be used to develop improved pump designs and noise reduction strategies, ultimately contributing to advances in hydraulic system technology [24-25].
2. Mathematical Model
It is necessary to study what possibilities exist to reduce noise when the pressure increases at the same time. One way is to choose the optimal angles of the suction and discharge openings on the valve plate to obtain certain angles - the compression angle αк and the expansion angle αe (Figure 1a)

Table 1.
The Descriptions of Parameter symbols.
| Symbol | Description |
| D = 2R | Diameter of the dividing circle of the cylinder block |
| E | Modulus of compressibility |
| VC | Volume of working fluid in the cylinder |
| VBDC | Volume of fluid bottom dead center (BDC) |
| A | Surface of the piston |
| p | Pressure |
| Minimum volume of fluid in the cylinder | |
| ∝e | The angle of spread top dead center |
| β | Angle of the swash plate |
| ∝k | Compression angle |
| Current plate rotation angle | |
| ∆WBDC | Compression losses at bottom dead center (BDC) |
| ∆WTDC | Compression losses at top dead center (TDC) |
| VTDC | Volume of fluid at top dead center (TDC) |
| Vα | Volume of working fluid in the cylinder when rotated through an angle α |
| ∆p0 | Optimal pressure difference at bottom dead center |
| pS | Supply pressure |
Equation for compression and expansion of a liquid in a cylinder:
The volume of the working fluid in the cylinder of the cylinder block can be expressed by the equations:
The compression and expansion cycle of a liquid in a cylinder is shown in the diagram, points ABCD. At point B, the pressure of the liquid in the cylinder increases rapidly and reaches the discharge value, while at point D the pressure begins to decrease rapidly and reaches the charge value. The shock waves that cause noise are generated due to these rapid pressure changes. In the case of the correct choice of the compression angle, the liquid in the cylinder is compressed and then discharged into the throttle opening, point F. In this way, the shock wave is avoided because the liquid is compressed to the pressure existing in the throttle opening. In the same way, by choosing the correct expansion angle, the pressure at point D can be reduced to the pressure at point E. In the first case when ∝k= ∝e = 0, the mechanical work required is equal to the area of the rectangle ABCD, and in the second case the work required is equal to the area EBFD. Analyzing this, we find that in both cases the hydraulic energy generated is represented by the surface EBFD. In the case when ∝k= ∝e = 0, more work is required, which is to some extent spent on compression losses.
The compression losses at the bottom dead center ∆WBDC are shown by the area of the triangle BCF, while the losses at the top dead center ∆WTDC are shown by the area of the triangle ADE.
Using equations (1) and (2):
This equation can also be written in another form
If the requirement that ∆p = ∆pb is met, losses do not occur at the top dead center for the propagation angle ∝e. Analogously to equation (4), equation (5) is obtained:
Compression losses at top dead center for pressure difference ∆p will be: Compression losses at top dead center for pressure difference ∆p will be:
We can write the equation for compression losses at bottom dead center:
In the case where αe = αk = 0, the losses can be expressed as:
The relative compression loss in percentage can be expressed by the equation:
If the pressure difference ∆p is below ∆pmin,
(where ∆pmin = ∆pb- ps, and ps, is the supply pressure), negative pressure must not occur in the cylinder
Figure 4.
Diagram for ∆p≤∆pmin.
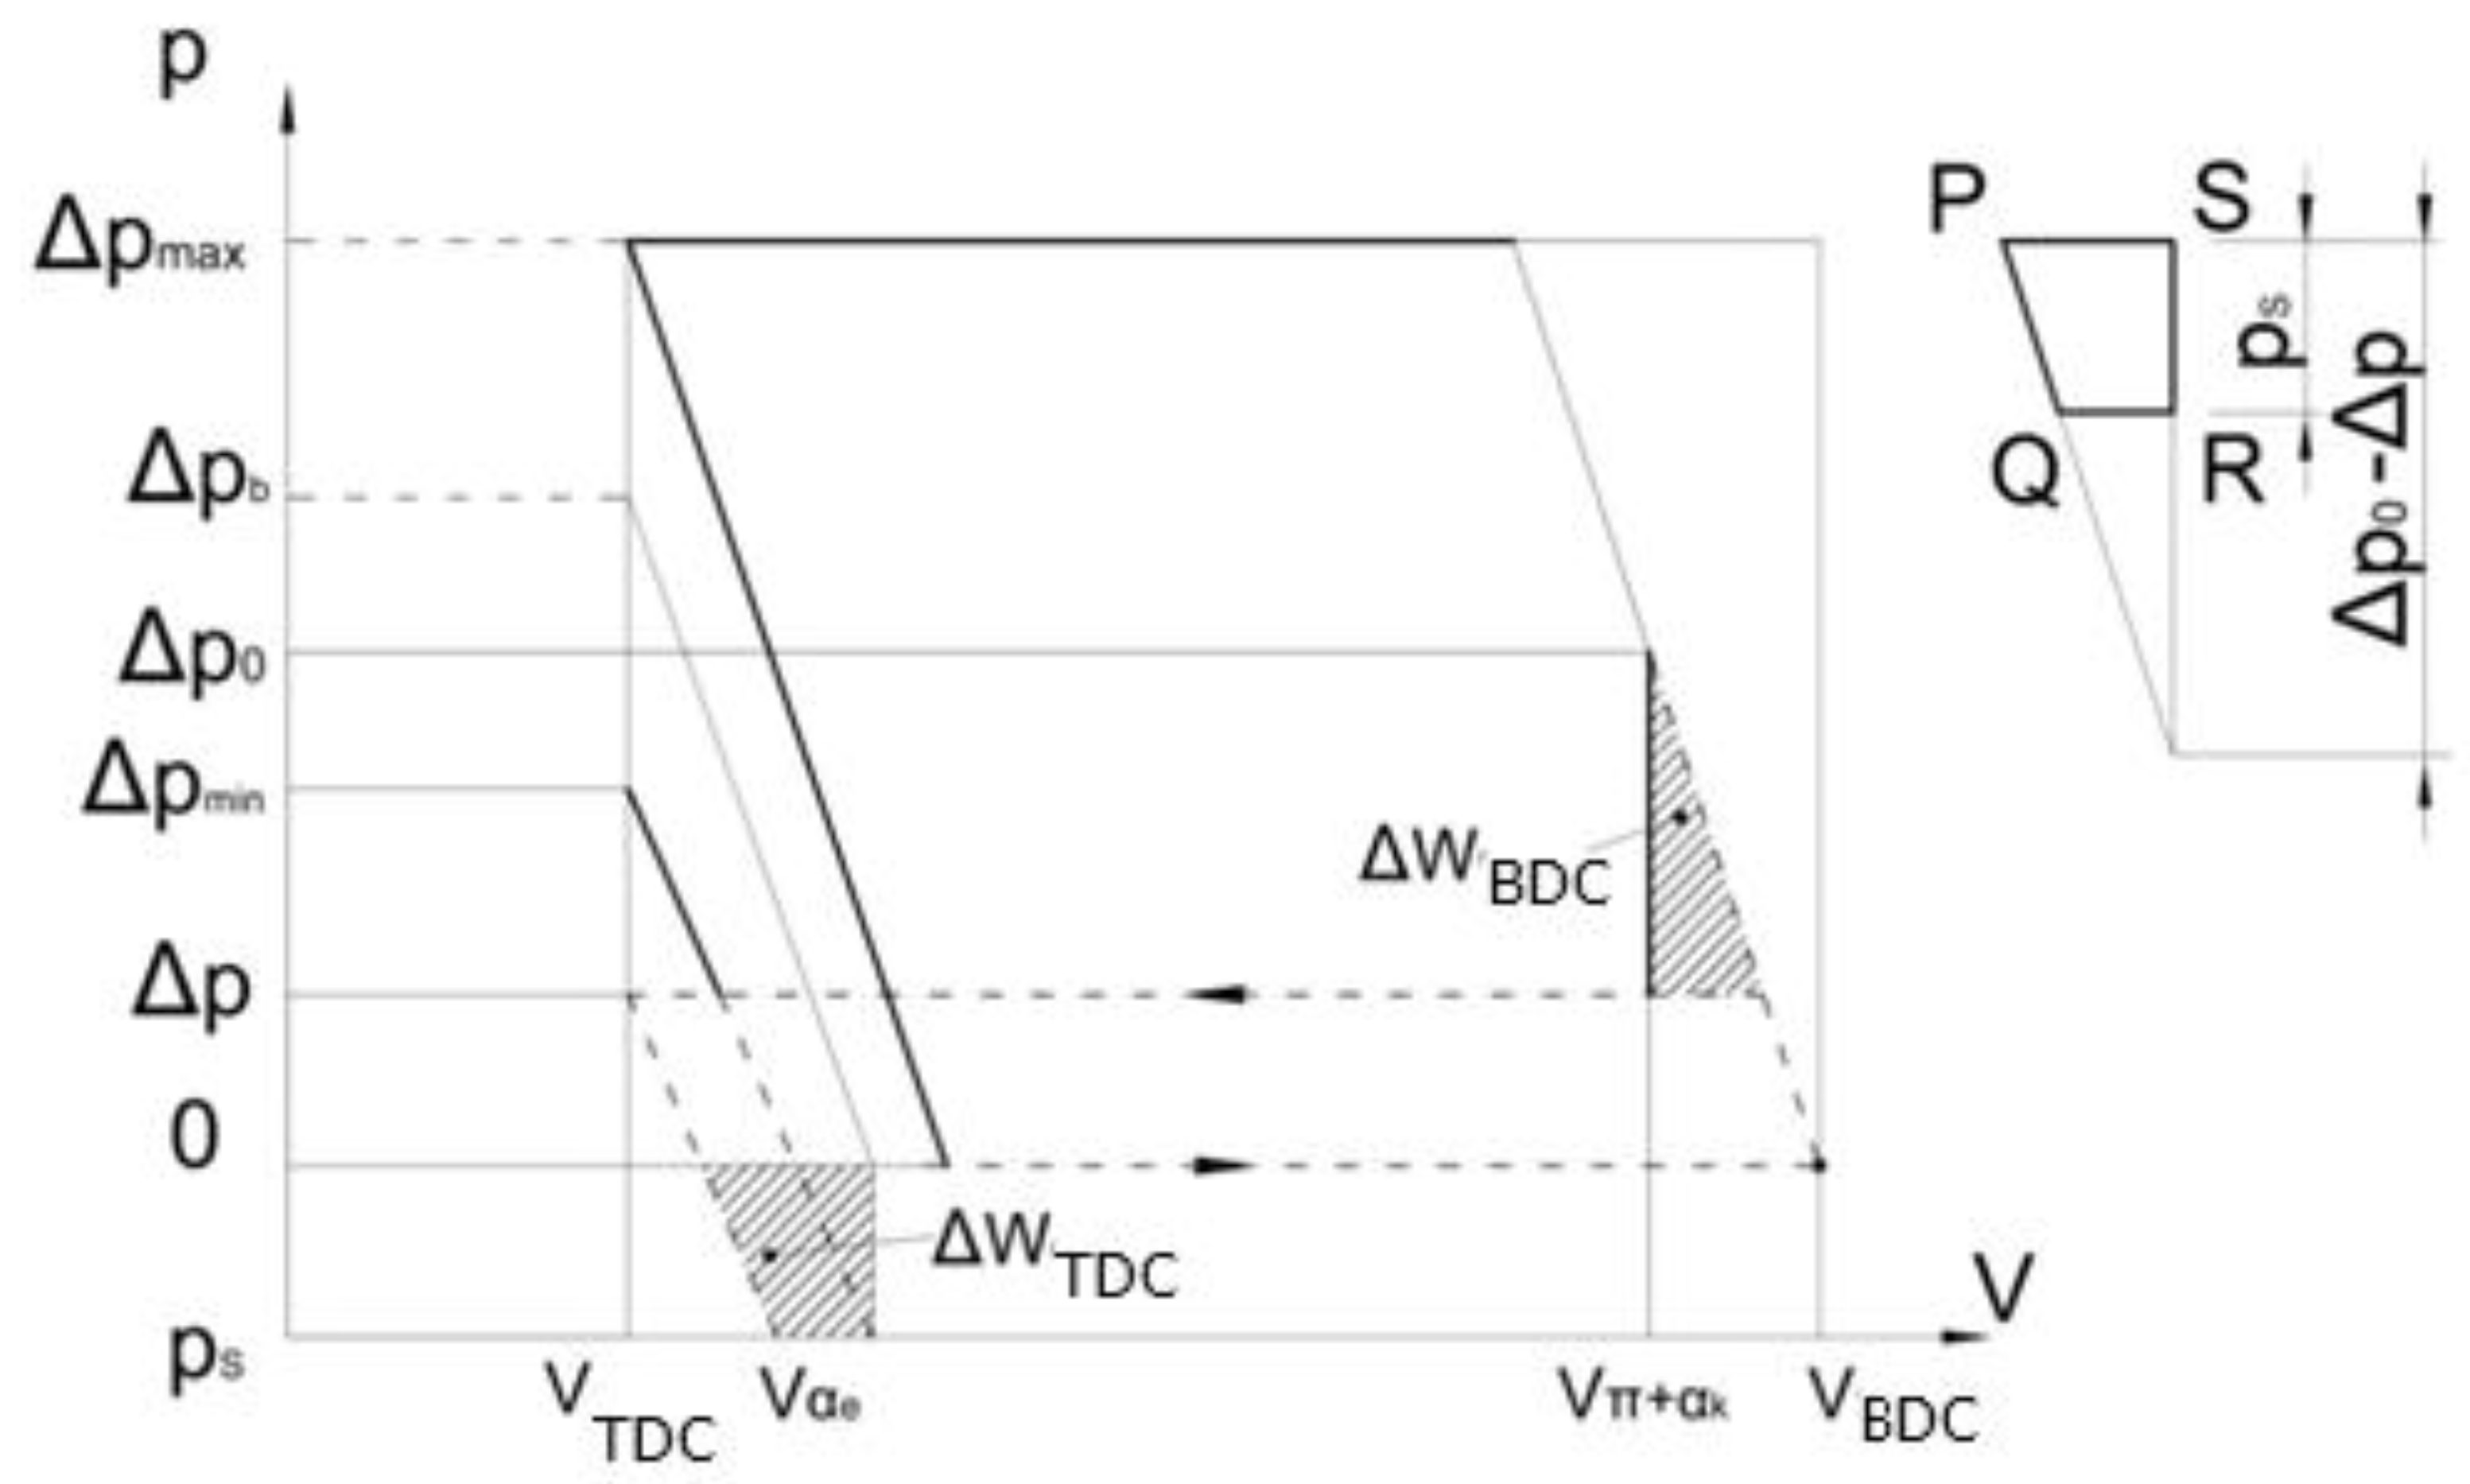
The expansion losses at the bottom dead center can be expressed by the following equation:
These equations can be used to obtain a diagram of losses depending on the compression and expansion angles. First, the pressure differences ∆po and ∆pb are calculated, and then WTDC and WBDC are calculated.
3. Experimental Results and Discussion
Verification of the operating parameters of the pump prototype, simulating real pump operating conditions, was carried out on the multi-purpose hydraulic test bench shown in Figure 5.
This multi-purpose hydraulic test bench is used for testing pumps, hydraulic motors of manifolds, other hydraulic accessories (cranes, valves, etc.) and assemblies, and static testing of hydraulic components. The equipment consists of three sub-assemblies: test panel, hydraulic system, and electrical cabinet. The hydraulic system is installed in a separate room.
Technical data of the axial piston pump with a variable flow swash plate:
D = 43 ∙ 10−3 m - diameter of the cylinder block pitch circle,
V0 = 0.581 ∙ 10−6 m3 - minimum volume of liquid in the cylinder,
β = 19° angle of the swash plate,
A = 0.785 ∙ 10−4 m2 - piston area,
E = 1.542 ∙ 103 MPa - compression modulus of the AMG10 fluid at a temperature of t = 60° and pressure of p =20MPa.
Figure 6 shows a diagram of the change in losses depending on the change in fluid pressure in the pressure pipe. Compression losses and leakage losses increase linearly with increasing pressure.
On the other hand, mechanical losses first decrease to a certain limit, and then increase with increasing pressure
Compression losses largely depend on:
• Compressibility modulus of the working fluid E
• Pressure difference ∆p
• Minimum cylinder volume V0
The minimum volume and compressibility modulus are taken as constant, although the compressibility modulus depends on temperature and pressure. It is noted that at constant values of the swash plate angle β and the pressure difference ∆p, the compression losses can be minimized by properly choosing the angles ∝k and ∝e. The problem is that the angle of inclination β and the pressure difference ∆p are constantly changing during pump operation, so that the optimal precompression and preexpansion are not performed at certain angles ∝k and ∝e. The diagrams ∆WBDC and ∆WTDC for one cylinder and one revolution depending on the angles ∝k and ∝e are shown in Figure 7 and Figure 8, as a result of these calculations. It should be noted that any change in the angle of inclination of the transverse plate affects the change in the losses ∆WBDC and ∆WTDC.
Analysis shows that the compression loss at TDC is much lower than at BDC at higher values of the angle ∝e. The optimal compression angle ∝k for a given operating range can be selected from the diagram shown in Figure 6.
For example, if we assume that the angle β=19° and the pressure difference 0< p < 21MPa, then ∝k (opt) =14. For the angle ∝k =14°, the compression loss per cylinder and revolution is a maximum of 0.13Nm, and then the pressure difference ∆p varies from 0 to 21 MPa. However, if another angle β or another range of pressure difference ∆p is chosen, then from the diagram we can find the optimal value of the compression angle ∝k. Table I. shows the compression losses for different values of the inclination angle β and the compression angle ∝k.
By analyzing the average values of the losses, it can be concluded that for certain inclination angles, the compression angle ∝k has an optimal value of 14°.
Table 2.
The compression losses for various of the inclination angle β and compression angle ∝k.
| β ∝k | 10° | 11° | 12° | 13° | 14° | 15° | 16° | 17° |
| 19° | 0.29 | 0.24 | 0.20 | 0.15 | 0.13 | 0.19 | 0.22 | 0.29 |
| 15° | 0.31 | 0.27 | 0.22 | 0.20 | 0.14 | 0.12 | 0.14 | 0.22 |
| 10° | 0.31 | 0.29 | 0.27 | 0.24 | 0.20 | 0.18 | 0.19 | 0.21 |
| 5° | 0.33 | 0.33 | 0.31 | 0.29 | 0.28 | 0.27 | 0.25 | 0.22 |
| Average value | 0.31 | 0.28 | 0.25 | 0.22 | 0.19 | 0.19 | 0.20 | 0.23 |
Figure 8 shows a diagram of losses depending on the expansion angle ∝e, at a certain swash plate inclination angle β, supply pressure ps and minimum cylinder volume Vo. It can be seen from the diagram that for a sufficiently large expansion angle ∝e, the losses ∆WTDC can be neglected.
The optimal expansion angle ∝e for the above data is in the range from 12 to 16°.
Noise issues are also considered in this paper, and the tests were carried out on the same pump on which the compression losses were measured. The noise level was measured using a noise measuring device with a C filter. The microphone was attached to a stand at a distance of 5 cm from the front of the valve plate. This location was chosen because the loudest noise occurs in the valve plate area and to exclude the effect of noise from other devices. Figure 8 shows the results of noise measurements as a function of the fluid pressure in the discharge pipe. In this case, the expansion angle is ∝e = 0, the rotation frequency n = 1500 min-1, the angle of inclination of the transverse plate is β = 19°, while the compression angle has changed and had the values ∝k1= 0,
∝k2 = 14, ∝k3 = 20. It can be concluded that at the lowest pressure and the highest compression angle ∝k = 20° the noise is higher than in the first pump, where the compression angle was ∝k = 0°. If the compression angle is ∝k = 14°, the noise reduction will occur at a pressure of 6 MPa.
Figure 10 shows the results of noise measurements under the same conditions as in the previous case, with the exception of the compression and expansion angles ∝k and ∝e. The compression angle was ∝k = 0°, and the expansion angle was changed and had the values ∝e1 = 0, ∝e2 = 12, ∝e3 = 14°. By analyzing the diagram, it can be concluded that for these test conditions the optimal expansion angle is ∝e = 12°.
∝k = 0
Figure 11, Figure 12 and Figure 13 show the results of noise measurements depending on pressure for different rotation frequencies n1 = 1500 min-1, n2 = 1980 min-1, n3 = 3000 min-1 and for different propagation angles ∝e1= 0°, ∝k1= 0°, ∝e2= 12°, ∝k2= 14°, ∝e3= 14°, ∝k3= 14°.
Since the optimal value of the expansion angle ∝e = 12° is close to the optimal value of the compression angle ∝k = 14°, the case where ∝e = ∝k = 14° is considered. The symmetry of the pump distribution opening is present in this case, so the pump can be bidirectional with the same valve plate, which reduces production costs with a slight increase in noise.
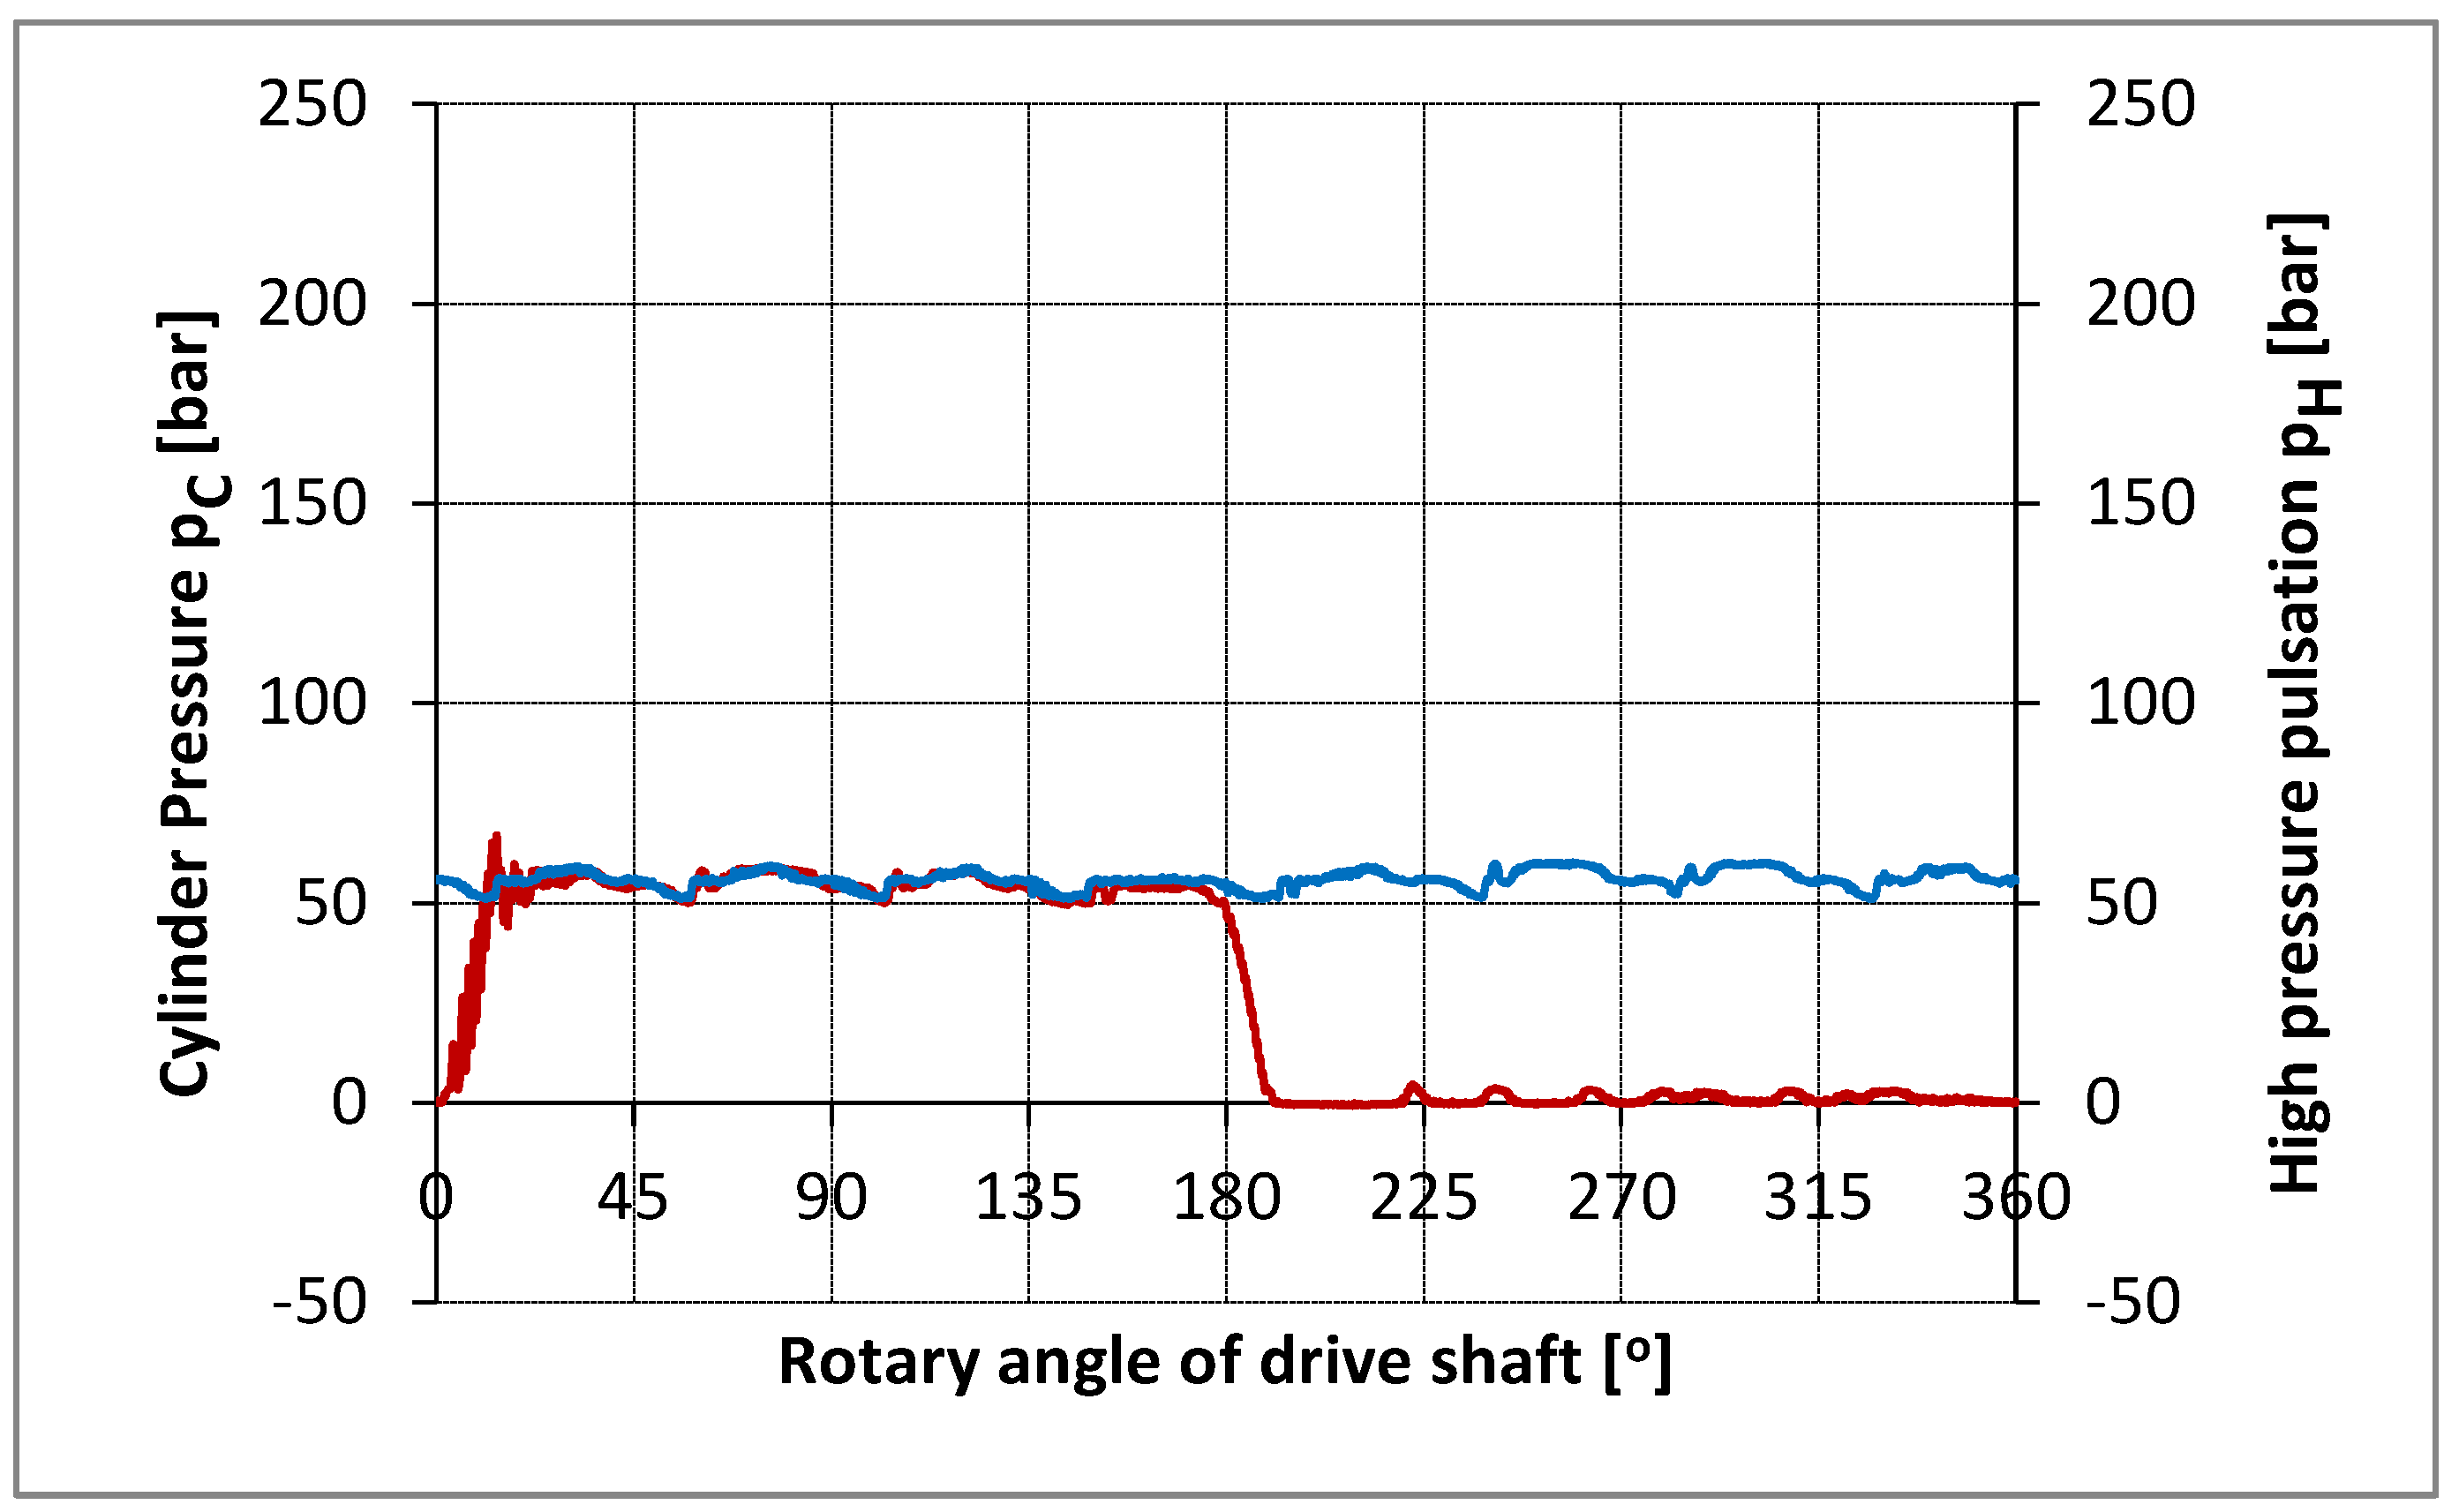
As part of the experimental tests, the pressure flow in the cylinder, discharge space and suction pipe was measured, as well as the vibration of the pump housing depending on the angle of the pump shaft. All pressures and vibrations were measured completely parallel every approximately 0.09° of the pump shaft (exactly 4.096 times per shaft rotation). An optical encoder with 1024 pulses per rotation was used as an incremental angle encoder. The angle encoder interface on the ADS 2000 system increased the angle encoder pulses by 4 times, thus obtaining 4096 pulses per shaft rotation. In order to see the repetition of consecutive cycles with an unchanged operating mode, 10 consecutive cycles were measured. At the same time, the time interval from corner to corner was measured to determine the uniform angular velocity of the shaft and to control the operation of the incremental angle encoder. All analog signals (pressure, vibration) were converted into an encrypted form in parallel using four ultrafast converters operating simultaneously (in parallel). The total number of measured data was (4+1) x 4096 = 20480 per rotation (cycle), or 204800 for ten consecutive cycles. The number of samples of 4096 was not chosen randomly, but intentionally with the aim of applying the fast Fourier transform (FFT) of the measured signals. Measurements were made for seven operating modes. Figures 14 - 17 show the measured pressure flow for individual, or ten consecutive cycles of the piston axial pump. The results refer to the experiment at the operating mode n = 875.6 min-1.
The high similarity of the measured pressures for the first of ten consecutive cycles (MERF) compared to the average of ten consecutive cycles (MERM).
The diagram shows the visual pressure gradients in the compression and expansion phases, as well as the appearance of the peaks during the intake. The pressure pulses in the discharge space depend on the number of cylinders, which is obvious in this case, since it is an 8-cylinder pump.
Figures 14 -17 present the measured pressure flow in the cylinder (pc) for one, that is middle for ten consecutive cycles with the aim to analyze in detail the gradient growth of pressure at the stage of pressing. The same diagram, at the same interval, shows the pressure pulses in the discharge space. The Figure 14, Figure 15, Figure 16 and Figure 17 stand for diagrams of measured pressure at the different work regime .
4. Conclusions
It is not possible to give a precise determination of the parameters of the hydrodynamic processes of a piston axial pump neither experimentally nor by mere mathematical modeling. By combining the application of pressure flow measurements in the cylinder, mathematical modeling of the real hydrodynamic process and the nonlinear optimization method that allows, at the same time, the determination of system measurement errors and unknown parameters, sufficiently accurate parameters can be obtained.
Computer programs provide the possibility of combining influential pump parameters in order to achieve an optimal solution, in terms of flow losses, flow inputs, etc.
Further research is possible in the design of piston-axial pumps with a bent cylinder block and splitting of the working fluid using a split panel. In that case, the mathematical model would be expanded with a dynamic cylinder block and hydrodynamic processes in the gaps between the cylinder block and the split panel.
A fundamental fact that manufacturers and users of axial piston pumps must accept is that any increase in operating pressure leads to an increase in pump noise. An increase in the rotation frequency of the pump drive shaft has a greater impact on the noise level than an increase in the pressure in the discharge pipe. Since the rotation frequency has a large impact on noise, it is often reduced in order to neutralize the noise caused by the increase in pressure. If the rotation frequency is reduced, we have to use a larger pump that is heavier and more expensive to maintain the same flow rate. In the case of a two-fold increase in flow rate (which means that the rotation frequency can be reduced by two times), the price of the pump increases by 30%. In addition, the weight increases by approximately 50% and more space is required for installation due to the increase in built-in dimensions.
Reducing the rotation frequency in order to reduce noise also has a negative effect, but if the pump is installed in places where noise must be as low as possible, then this solution is used.
Cavitations resulting from insufficient pump power can affect noise levels. Bearings and gears also contribute to noise. It should also be noted that the selection of appropriate materials can reduce certain vibrations that also lead to noise. Pump noise can be minimized if all of these factors are taken into account.
Author Contributions
For research articles with several authors, a short paragraph specifying their individual contributions must be provided. The following statements should be used “Conceptualization, A.B., M.A., R.P., S.M., N.Dj. and J.L.; methodology, A.B., M.A., R.P., S.M., N.Dj. and J.L.; software, A.B., M.A., R.P., S.M., N.Dj. and J.L.; validation, A.B., M.A., R.P., S.M., N.Dj. and J.L.; formal analysis, A.B., M.A., R.P., S.M., N.Dj. and J.L.; investigation, A.B., M.A., R.P., S.M., N.Dj. and J.L.; resources, A.B., M.A., R.P., S.M., N.Dj. and J.L.; data curation, A.B., M.A., R.P., S.M., N.Dj. and J.L.; writing—original draft preparation, A.B., M.A., R.P., S.M., N.Dj. and J.L.; writing—review and editing, A.B., M.A., R.P., S.M., N.Dj. and J.L.; visualization, A.B., M.A., R.P., S.M., N.Dj. and J.L.; supervision, A.B., M.A., R.P., S.M., N.Dj. and J.L.; project administration, R.P.; funding acquisition, R.P. All authors have read and agreed to the published version of the manuscript.” Please turn to the CRediT taxonomy for the term explanation. Authorship must be limited to those who have contributed substantially to the work reported.
Funding
This paper is funded by the University “Union-NikolaTesla”, Faculty of Information Technology and Engineering.
Institutional Review Board Statement
Not applicable.
Informed Consent Statement
Not applicable.
Data Availability Statement
Data are contained within the article.
Acknowledgments
The authors would like to thank the Editor-in-Chief, Editor, and anonymous reviewers for their valuable reviews.
Conflicts of Interest
The authors declare no conflicts of interest.
References
- M. Welscher, T. Maeder, J. Schröder “A STUDY INTO FORCES AND MOMENTS ACTING ON THE SWASH PLATE OF AN AXIAL PISTON PUMP USING A NOVEL APPROACH TO REDUCE PRESSURE AND”, 12th International Fluid Power Conference | Dresden 2020, https://tud.qucosa.de/api/qucosa%3A71105/attachment/ATT-0/.
- Y. Peng, J. Schröder ” THE INFLUENCE OF THE SWASH PLATE OSCILLATION ON PRESSURE RIPPLE IN VARIABLE DISPLACEMENT AXIAL PISTON PUMP ”, 12th International Fluid Power Conference | Dresden 2020. https://tud.qucosa.de/api/qucosa%3A71101/attachment/ATT-0/.
- Y. Zhou, Z. Zhang, J. Huang, Z. Yao “Analysis of the Influence of Structure and Parameters of Axial Piston Pump on Flow Pulsation”, Published: MDPI, 2022, https://www.mdpi.com/2227-9717/10/10/2138.
- L. Wang, D. Zhang, X. Chen, Z. Peng, F. Tao “A Hydraulic Axial Piston Pump Fault Diagnosis Based on Instantaneous Angular Speed under Non-Stationary Conditions”, Published: MDPI, 2021 https://www.mdpi.com/2075-4442/11/9/406.
- Johansson, A., “Design Principles for Noise Reduction in Hydraulic Piston Pumps Simulation, Optimisation and Experimental verification”, Ph.D. Thesis 2005, Linkoping University, Sweden.
- Pratin Naik, “Modelling and Simulation of an axial piston pump-a feasibility study for an alternate design for pulsation reduction. M.S.Thesis 2016, Kettering University, Flint, USA.
- Seeniraj G K. and Ram S. Chandran, “Study into effect of dead center position on pressure and flow ripples of a variable displacement axial piston swash plate hydraulic pump”, The twelfth Scandinavian International conference on Fluid Power, May 18-20 2011,Tampere, Finland.
- Achten P “Dynamic high-frequency behaviour of the swash plate in a variable displacement axial piston pump. Proceedings of the Institution of Mechanical Engineers, Part I: Journal of Systems and Control Engineering, 227(6), 529-540. (2013). [CrossRef]
- Fang X, Ouyang X, Yang H “Investigation into the Effects of the VariableDisplacement Mechanism on Swash Plate Oscillation in High-Speed Piston Pumps”Applied Sciences, 8(5), 658. (2018).
- Ericson L “Swash plate oscillations due to piston forces in variable in-line pumps. In Proceedings of 9th International Fluid Power Conference, Aachen, Germany. (2014).
- Ericson L ”Movement of the swash plate in variable in-line pumps at decreased displacement setting angle. In Proceedings of the 22nd International Congress of Mechanical Engineering, Ribeirão Preto, SP, Brazil (pp. 3-7), (2013).
- SCHOEMACKER F, MURRENHOFF H. “Interaction Between Swash PlateMovement And Commutation In Axial Piston Machines. JFPS International Journal of Fluid Power System, 11(3), 49-54 (2019).
- Qian, W.X.; Gao, Q.H.; Li, X.Y.; Zhang, Y. “Simulation Research on Flow Pulsation Characteristics of Axial Piston Pump Based on AMESim”. Mach. Tool Hydraul. 2018, 46, 114–117. [Google Scholar]
- Qian, W.; Gao, Q.; Li, X.; Li, Y. Co-simulation Research on Flow Pulsation Characteristics of Plunger Pump Based on AMESim and ADAMS. In Proceedings of the 2017 5th International Conference on Mechatronics, Materials, Chemistry and Computer Engineering (ICMMCCE 2017), Chongqing, China, 15–16 December 2017. [Google Scholar]
- Xu, Z.Y.; Miao, X.H.; Zuo, H. The research on pulsation of pump pressure in water mist system. Energy Procedia 2015, 66, 73–76. [Google Scholar]
- Liu, Y.; Jiang, W.; Bao, C.W. Simulation Analysis of Flow and Pressure of Swashplate Axial Piston Pump Based on AMESim. Sci.-Tech. Innov. Product. 2019, 11, 50–53. [Google Scholar]
- Gao, L. Finite Element Analysis and Flow Pulsation of Key Components of Piston Pump. Master’s Thesis, Hebei University of Engineering, Handan, China, 2022. [Google Scholar]
- Zhang, H. Cavitation effect to the hydraulic piston pump flow pulsation. Appl. Mech. Mater. 2014, 599, 230–236. [Google Scholar]
- Yang, Y.; Ding, L.; Xiao, J.; Fang, G.; Li, J. Current status and applications for hydraulic pump fault diagnosis: A Review. Sensors 2022, 22, 9714. [Google Scholar] [CrossRef] [PubMed]
- Wu, F.; Tang, J.; Jiang, Z.; Sun, Y.; Chen, Z.; Guo, B. The remaining useful life prediction method of a hydraulic pump under unknown degradation model with limited data. Sensors 2023, 23, 5931. [Google Scholar] [CrossRef] [PubMed]
- Zhang, L.; Wang, S.; Yin, G.J.; Guan, C.N. Fluid–structure interaction analysis of fluid pressure pulsation and structural vibration features in a vertical axial pump. Adv. Mech. Eng. 2019, 11, 2072151946. [Google Scholar] [CrossRef]
- Geng, B.L.; Gu, L.C.; Liu, J.M. Novel methods for modeling and online measurement of effective bulk modulus of flowing oil. IEEE Access 2020, 8, 20805–20817. [Google Scholar] [CrossRef]
- Geng, B.L.; Gu, L.C.; Liu, J.M.; Shi, Y. Dynamic modeling of fluid nonlinear compression loss and flow loss oriented to fault diagnosis of axial piston pump. Proc. Inst. Mech. Eng. Part C J. Mech. Eng. Sci. 2021, 235, 3236–3251. [Google Scholar] [CrossRef]
- Zhu, Y.; Su, H.; Tang, S.; Zhang, S.; Zhou, T.; Wang, J. A novel fault diagnosis method based on SWT and VGG-LSTM model for hydraulic axial piston pump. J. Mar. Sci. Eng. 2023, 11, 594. [Google Scholar] [CrossRef]
- Chao, Q.; Xu, Z.; Tao, J.; Liu, C. Capped piston: A promising design to reduce compressibility effects, pressure ripple and cavitation for high-speed and high-pressure axial piston pumps. Alex. Eng. J. 2023, 62, 509–521. [Google Scholar] [CrossRef]
Figure 1.
a) Axial piston pump with swash plate, b) Detail of valve plate port.
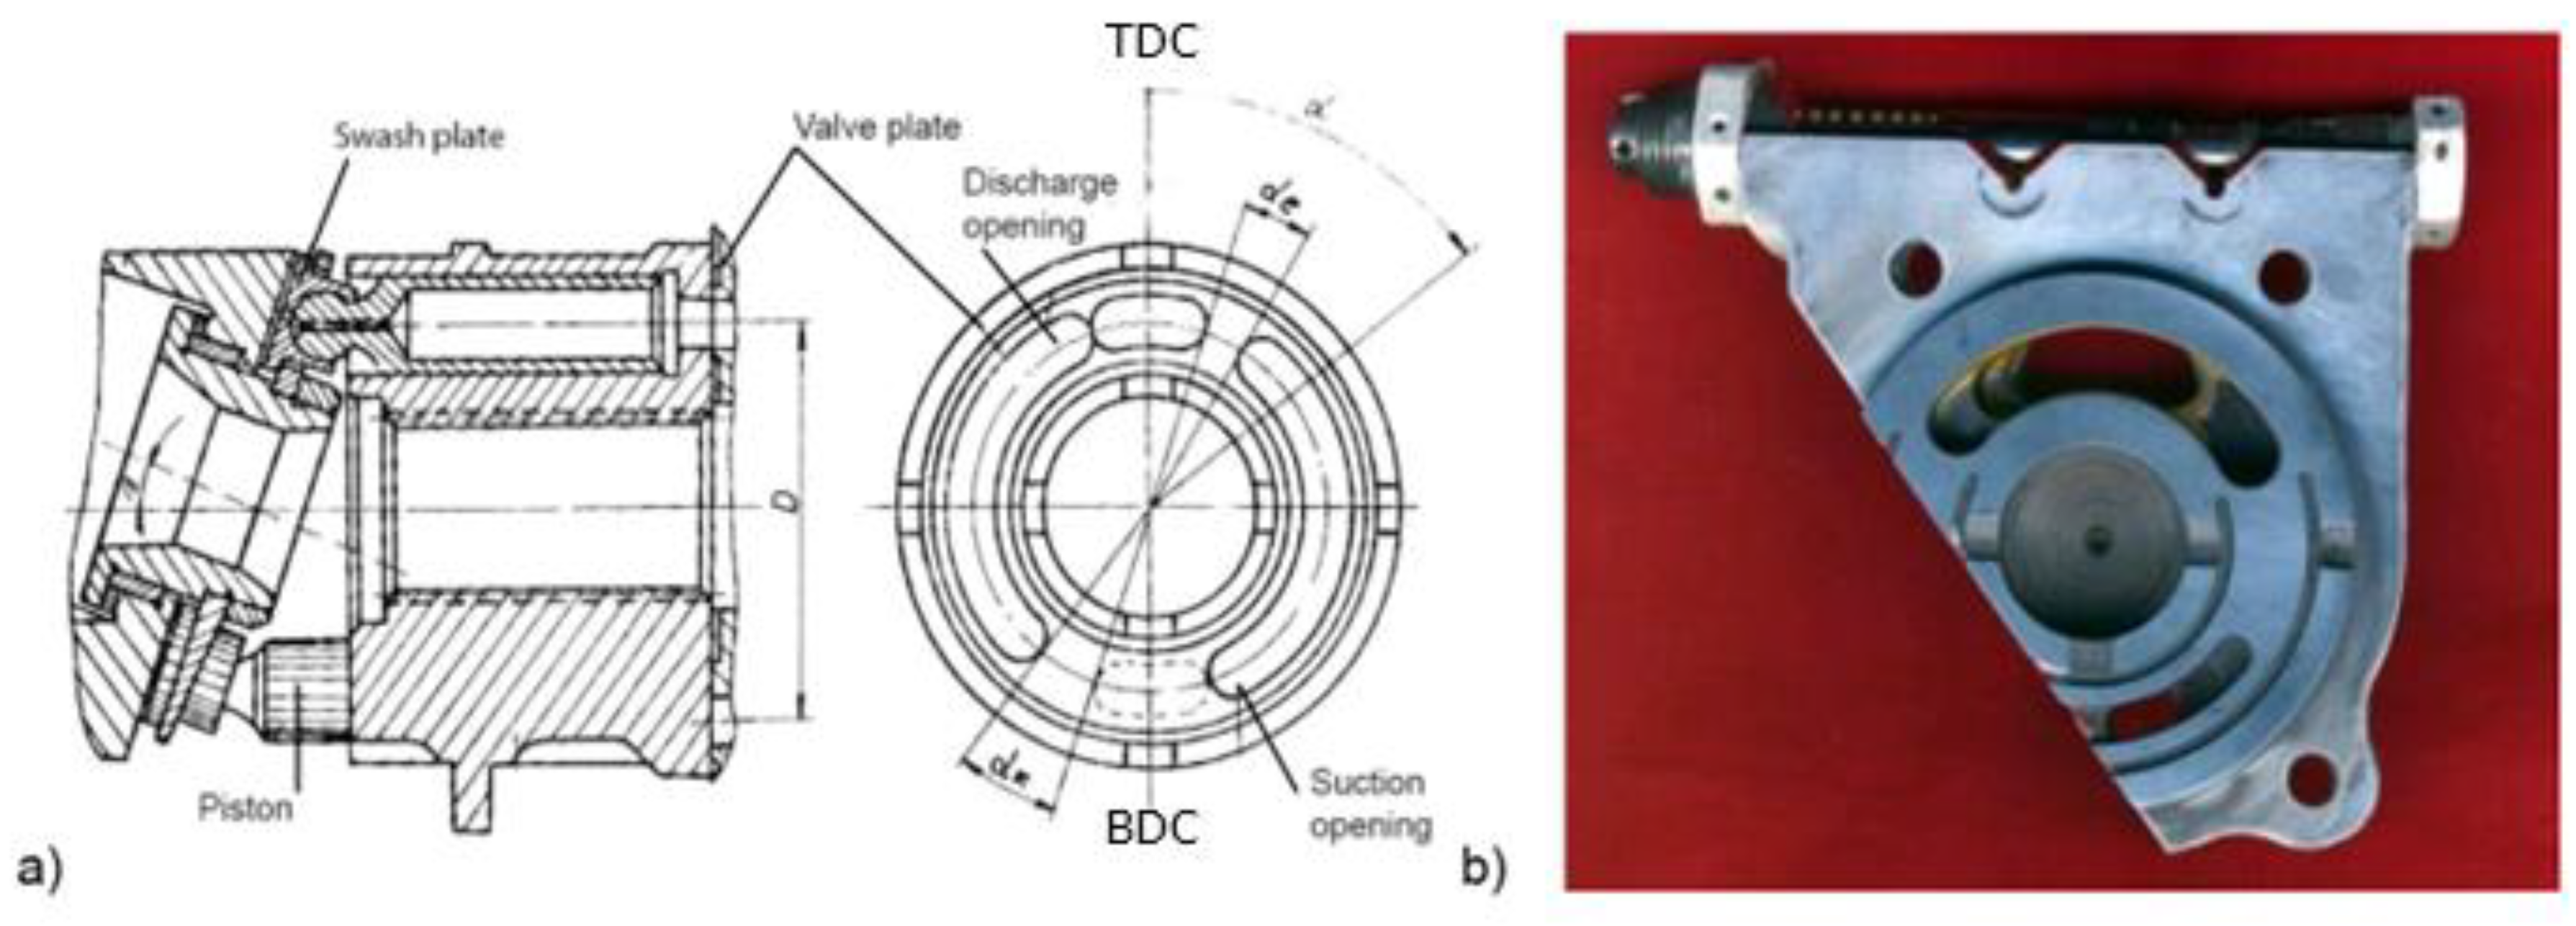
Figure 2.
The cycle of compression and expansion of the fluid in cylinders.
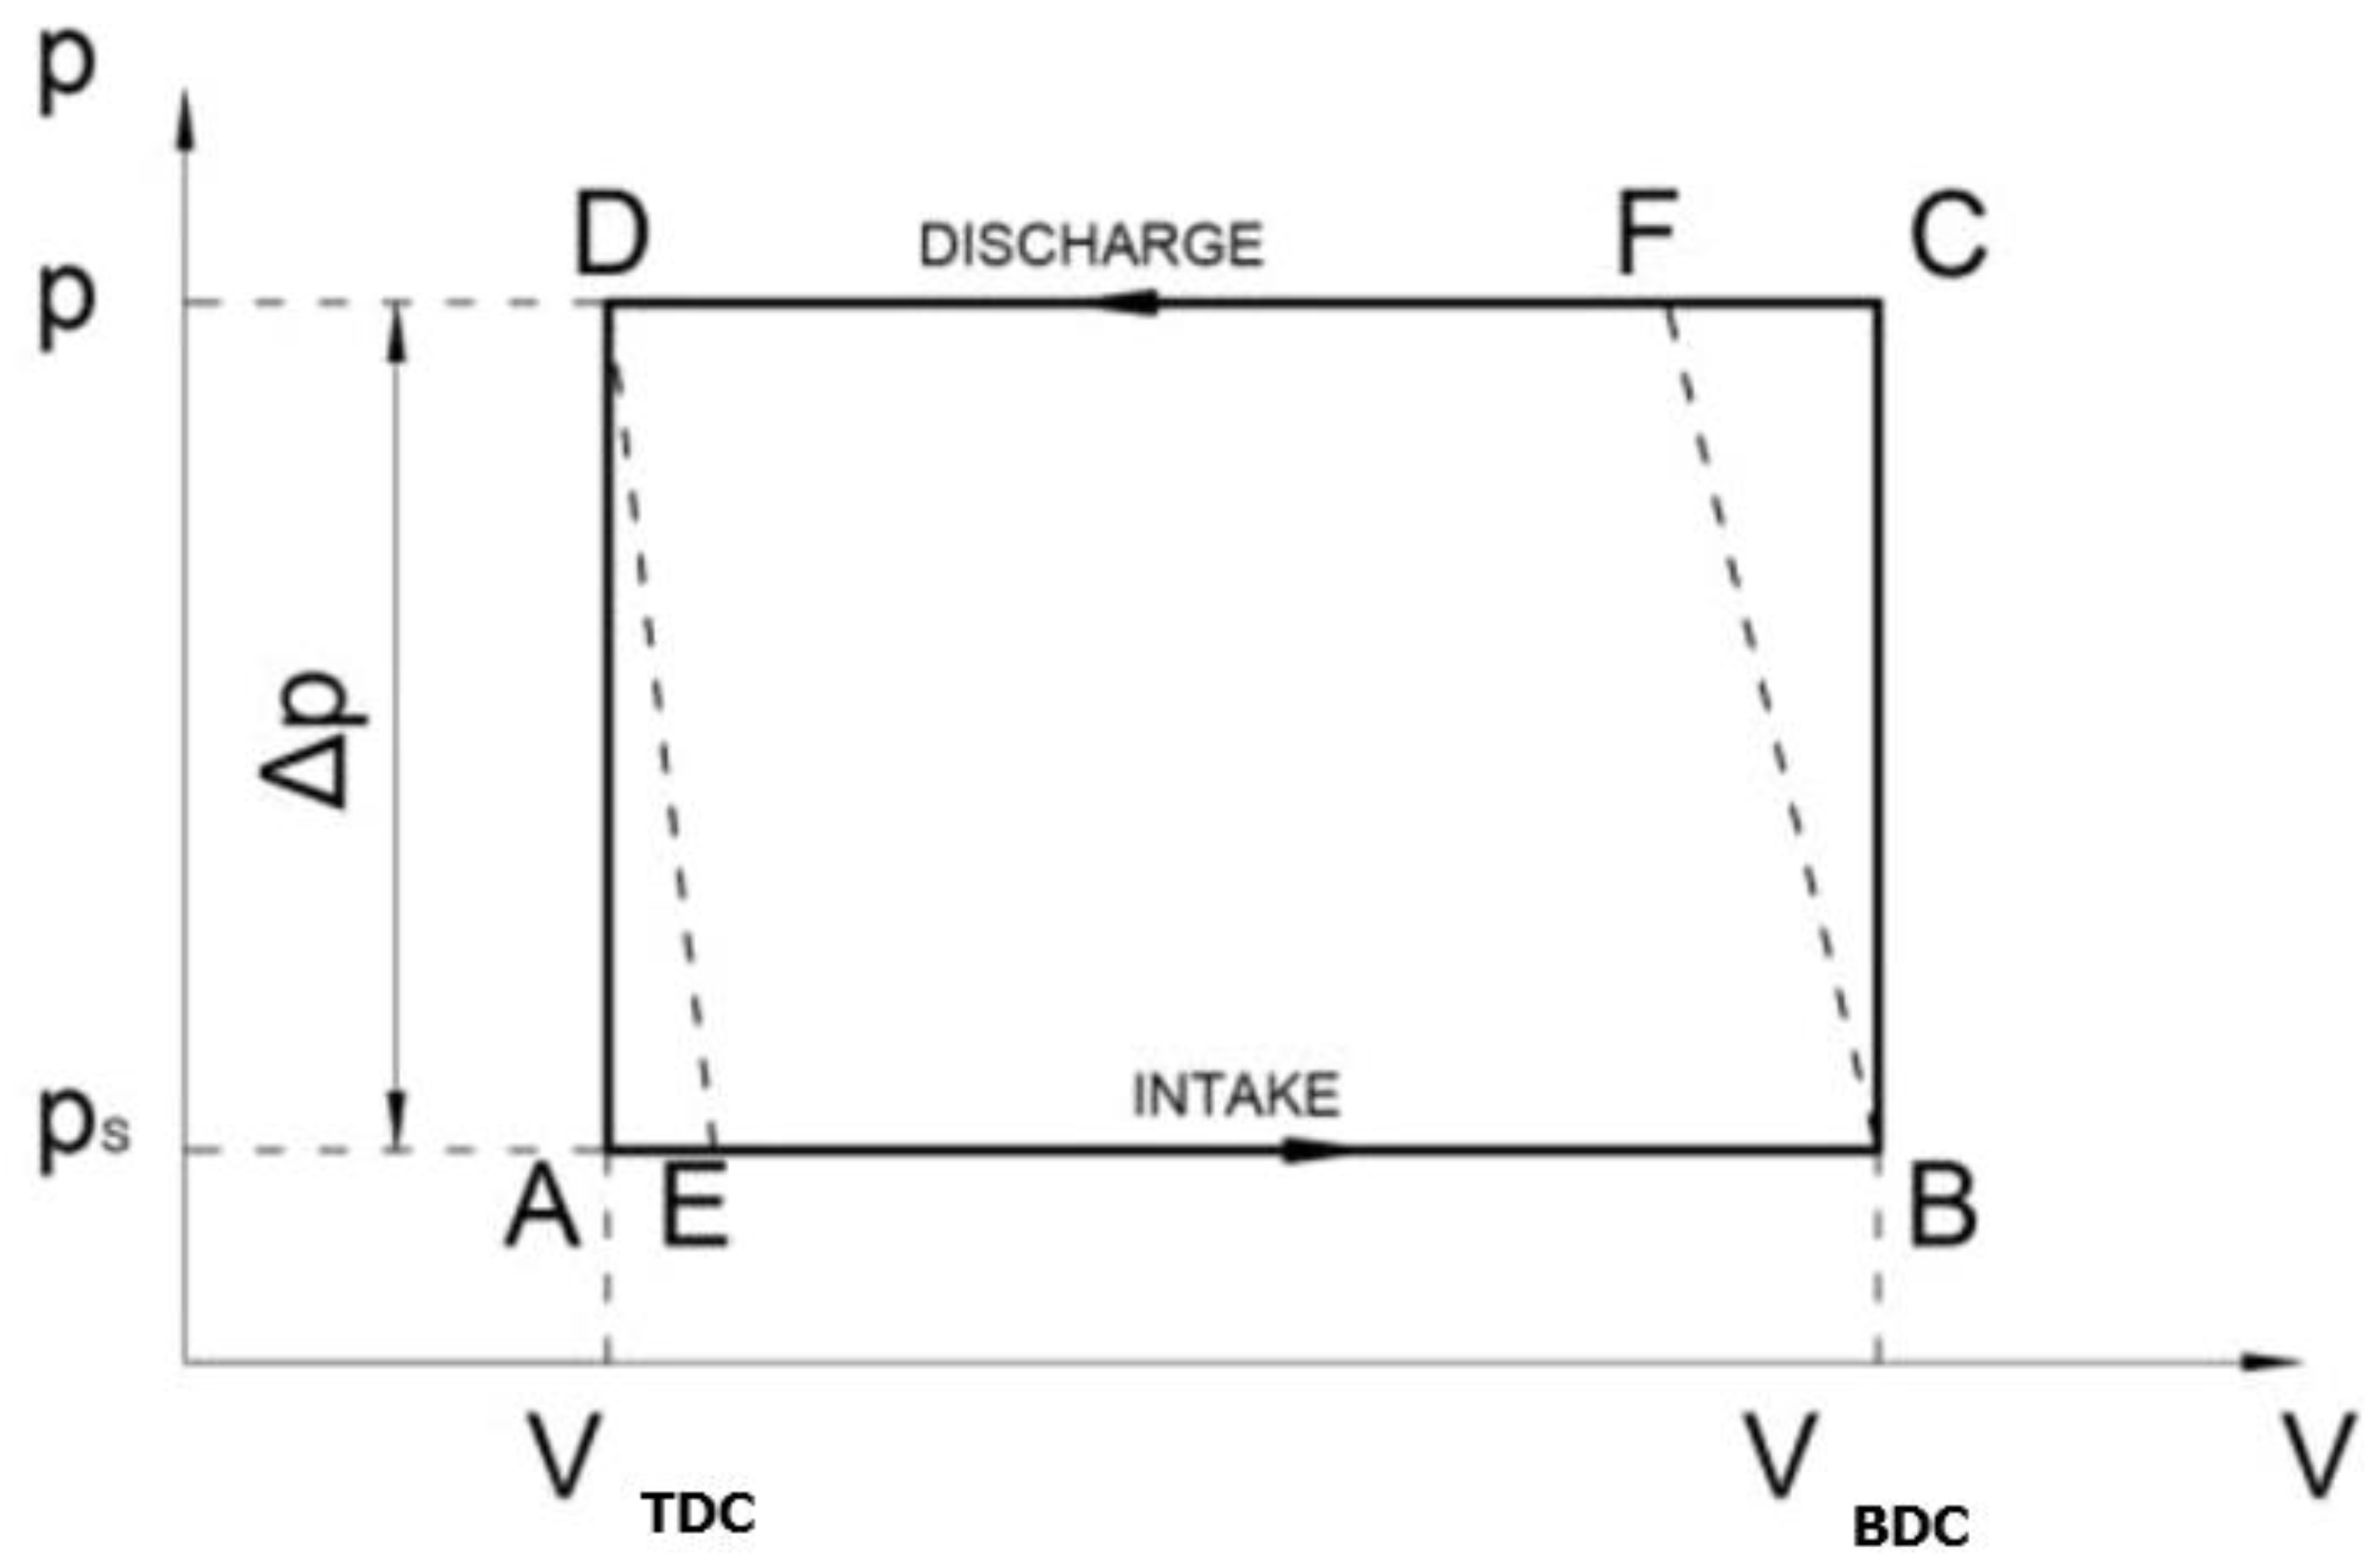
Figure 3.
Diagram for ∆p>∆pmin.
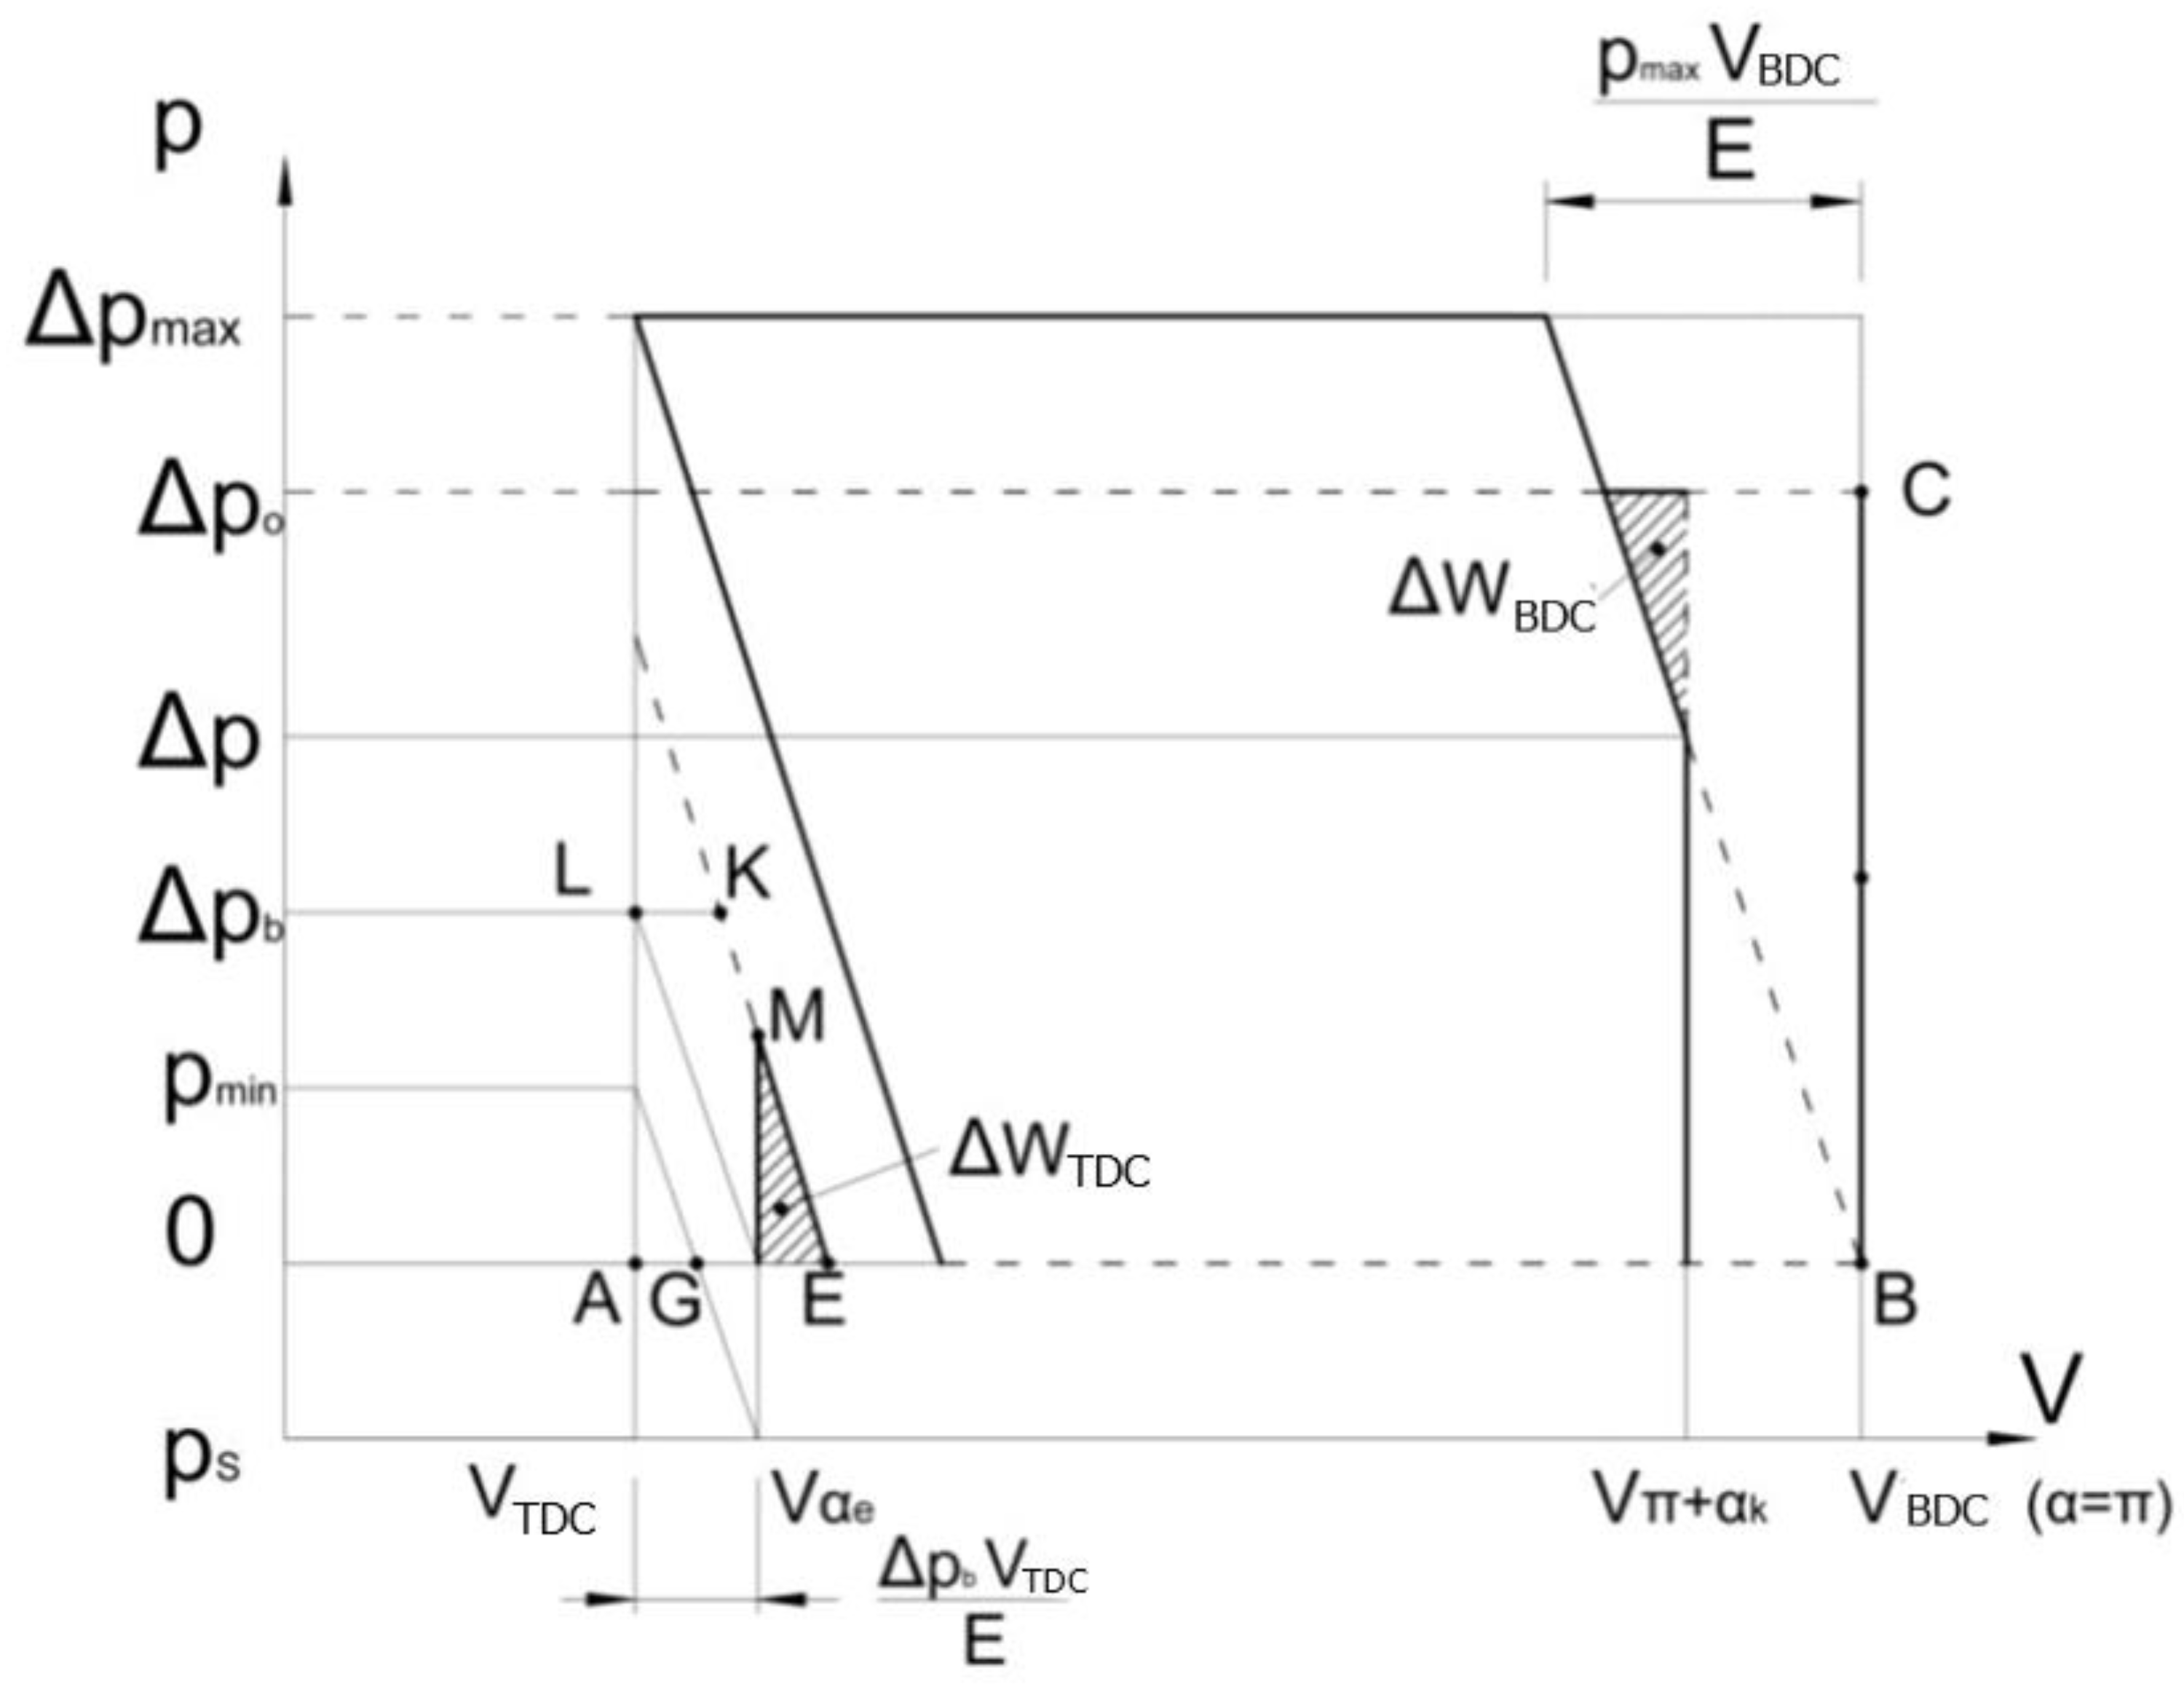
Figure 5.
Original hydraulic pump test system; 1—electric motor, 2— axial piston pump, 3—safety valve, 4—manometer, 5—pressure transducer, 6—electromagnetic distributor, 7— pressure regulator, 8—muffler, 9—flow transducer, 10—reservoir.
Figure 5.
Original hydraulic pump test system; 1—electric motor, 2— axial piston pump, 3—safety valve, 4—manometer, 5—pressure transducer, 6—electromagnetic distributor, 7— pressure regulator, 8—muffler, 9—flow transducer, 10—reservoir.
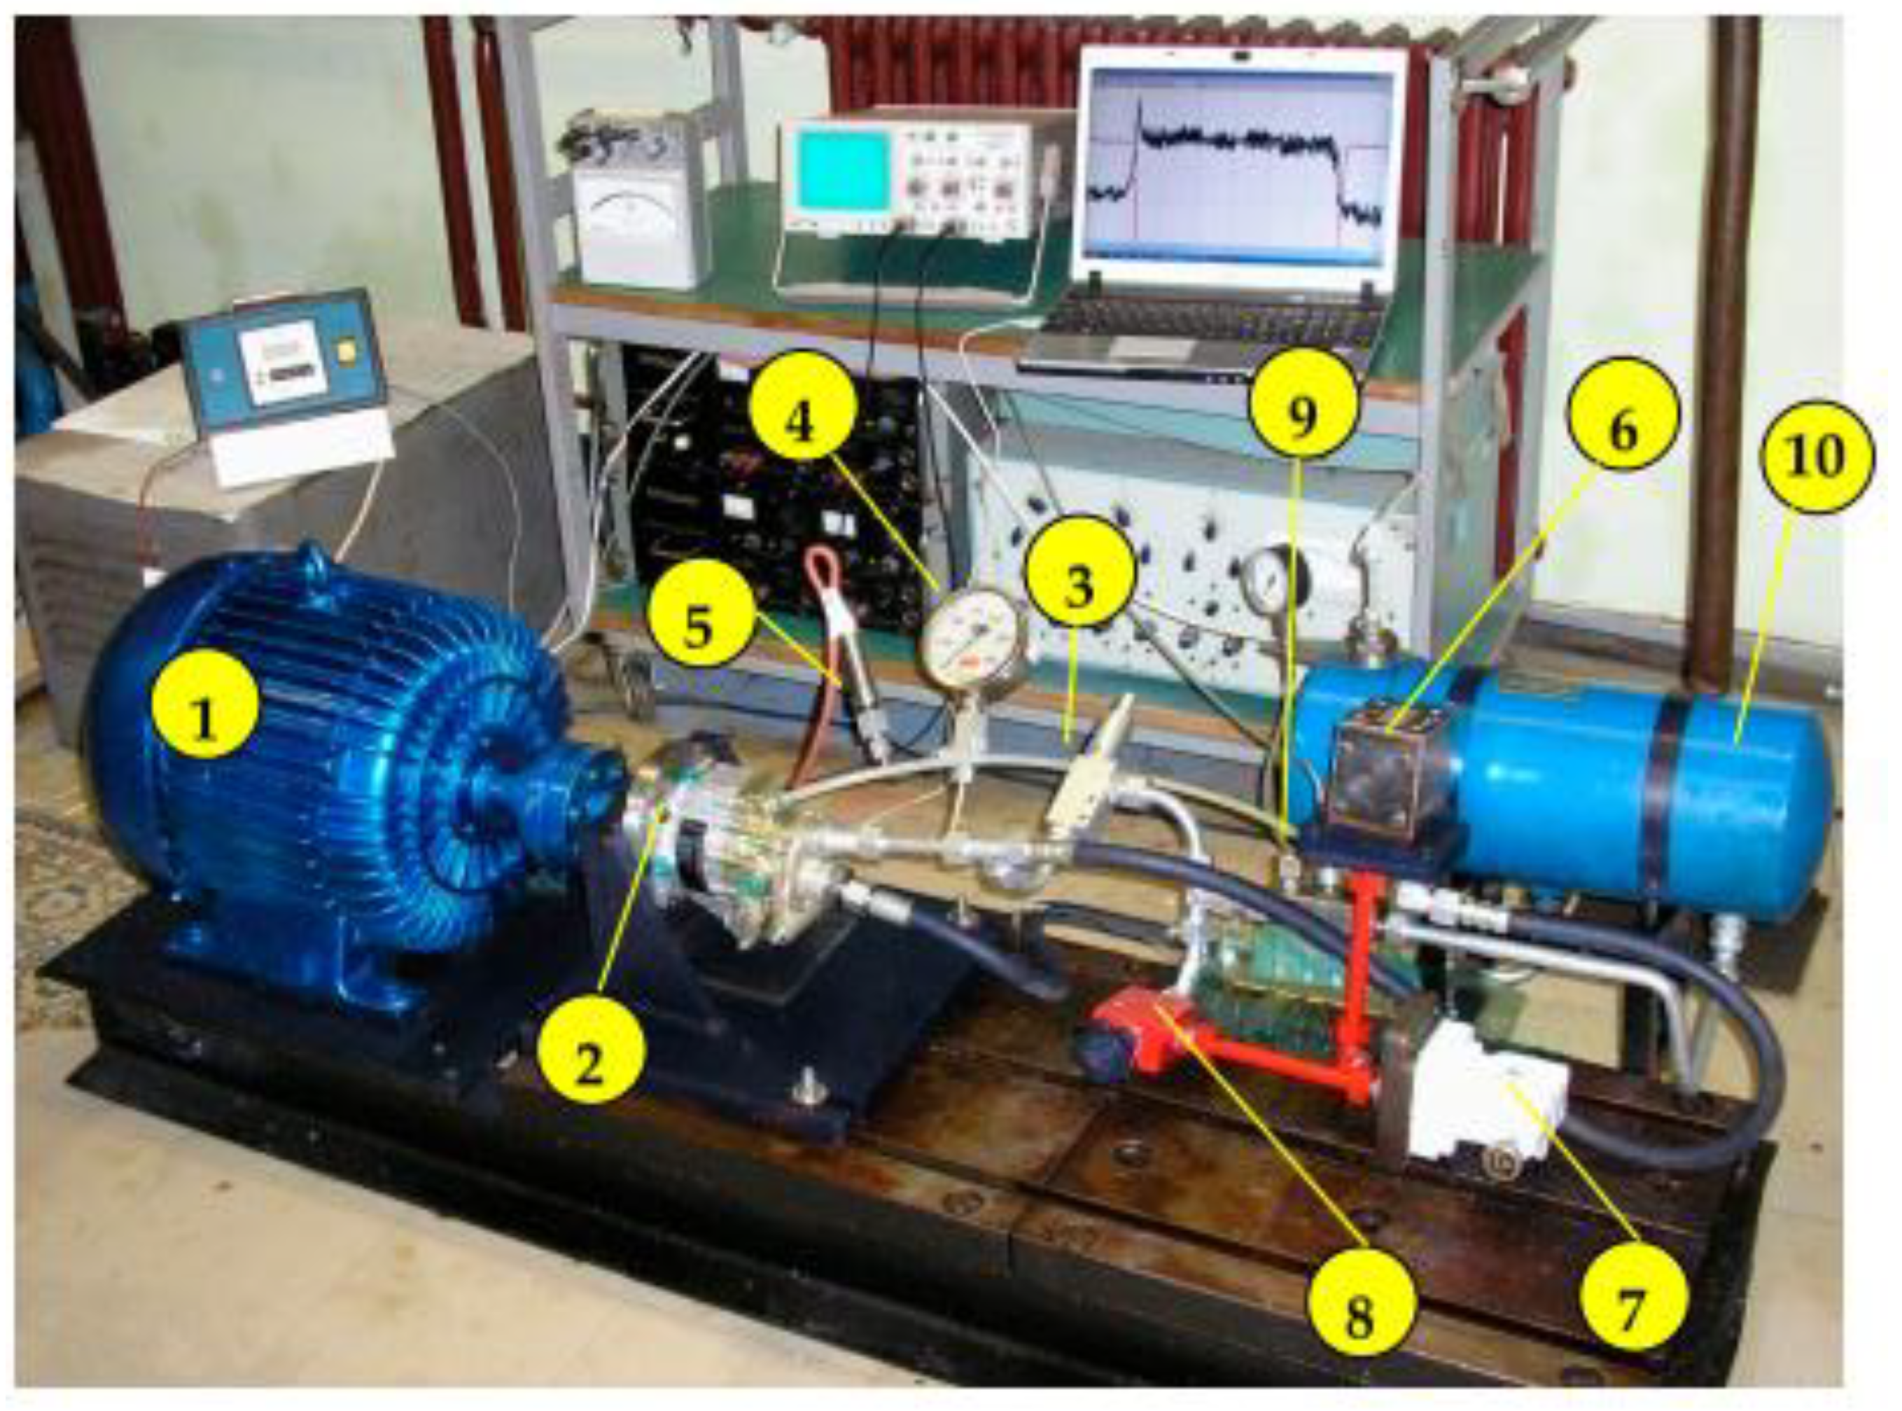
Figure 6.
Diagram of some losses of piston axial pump.
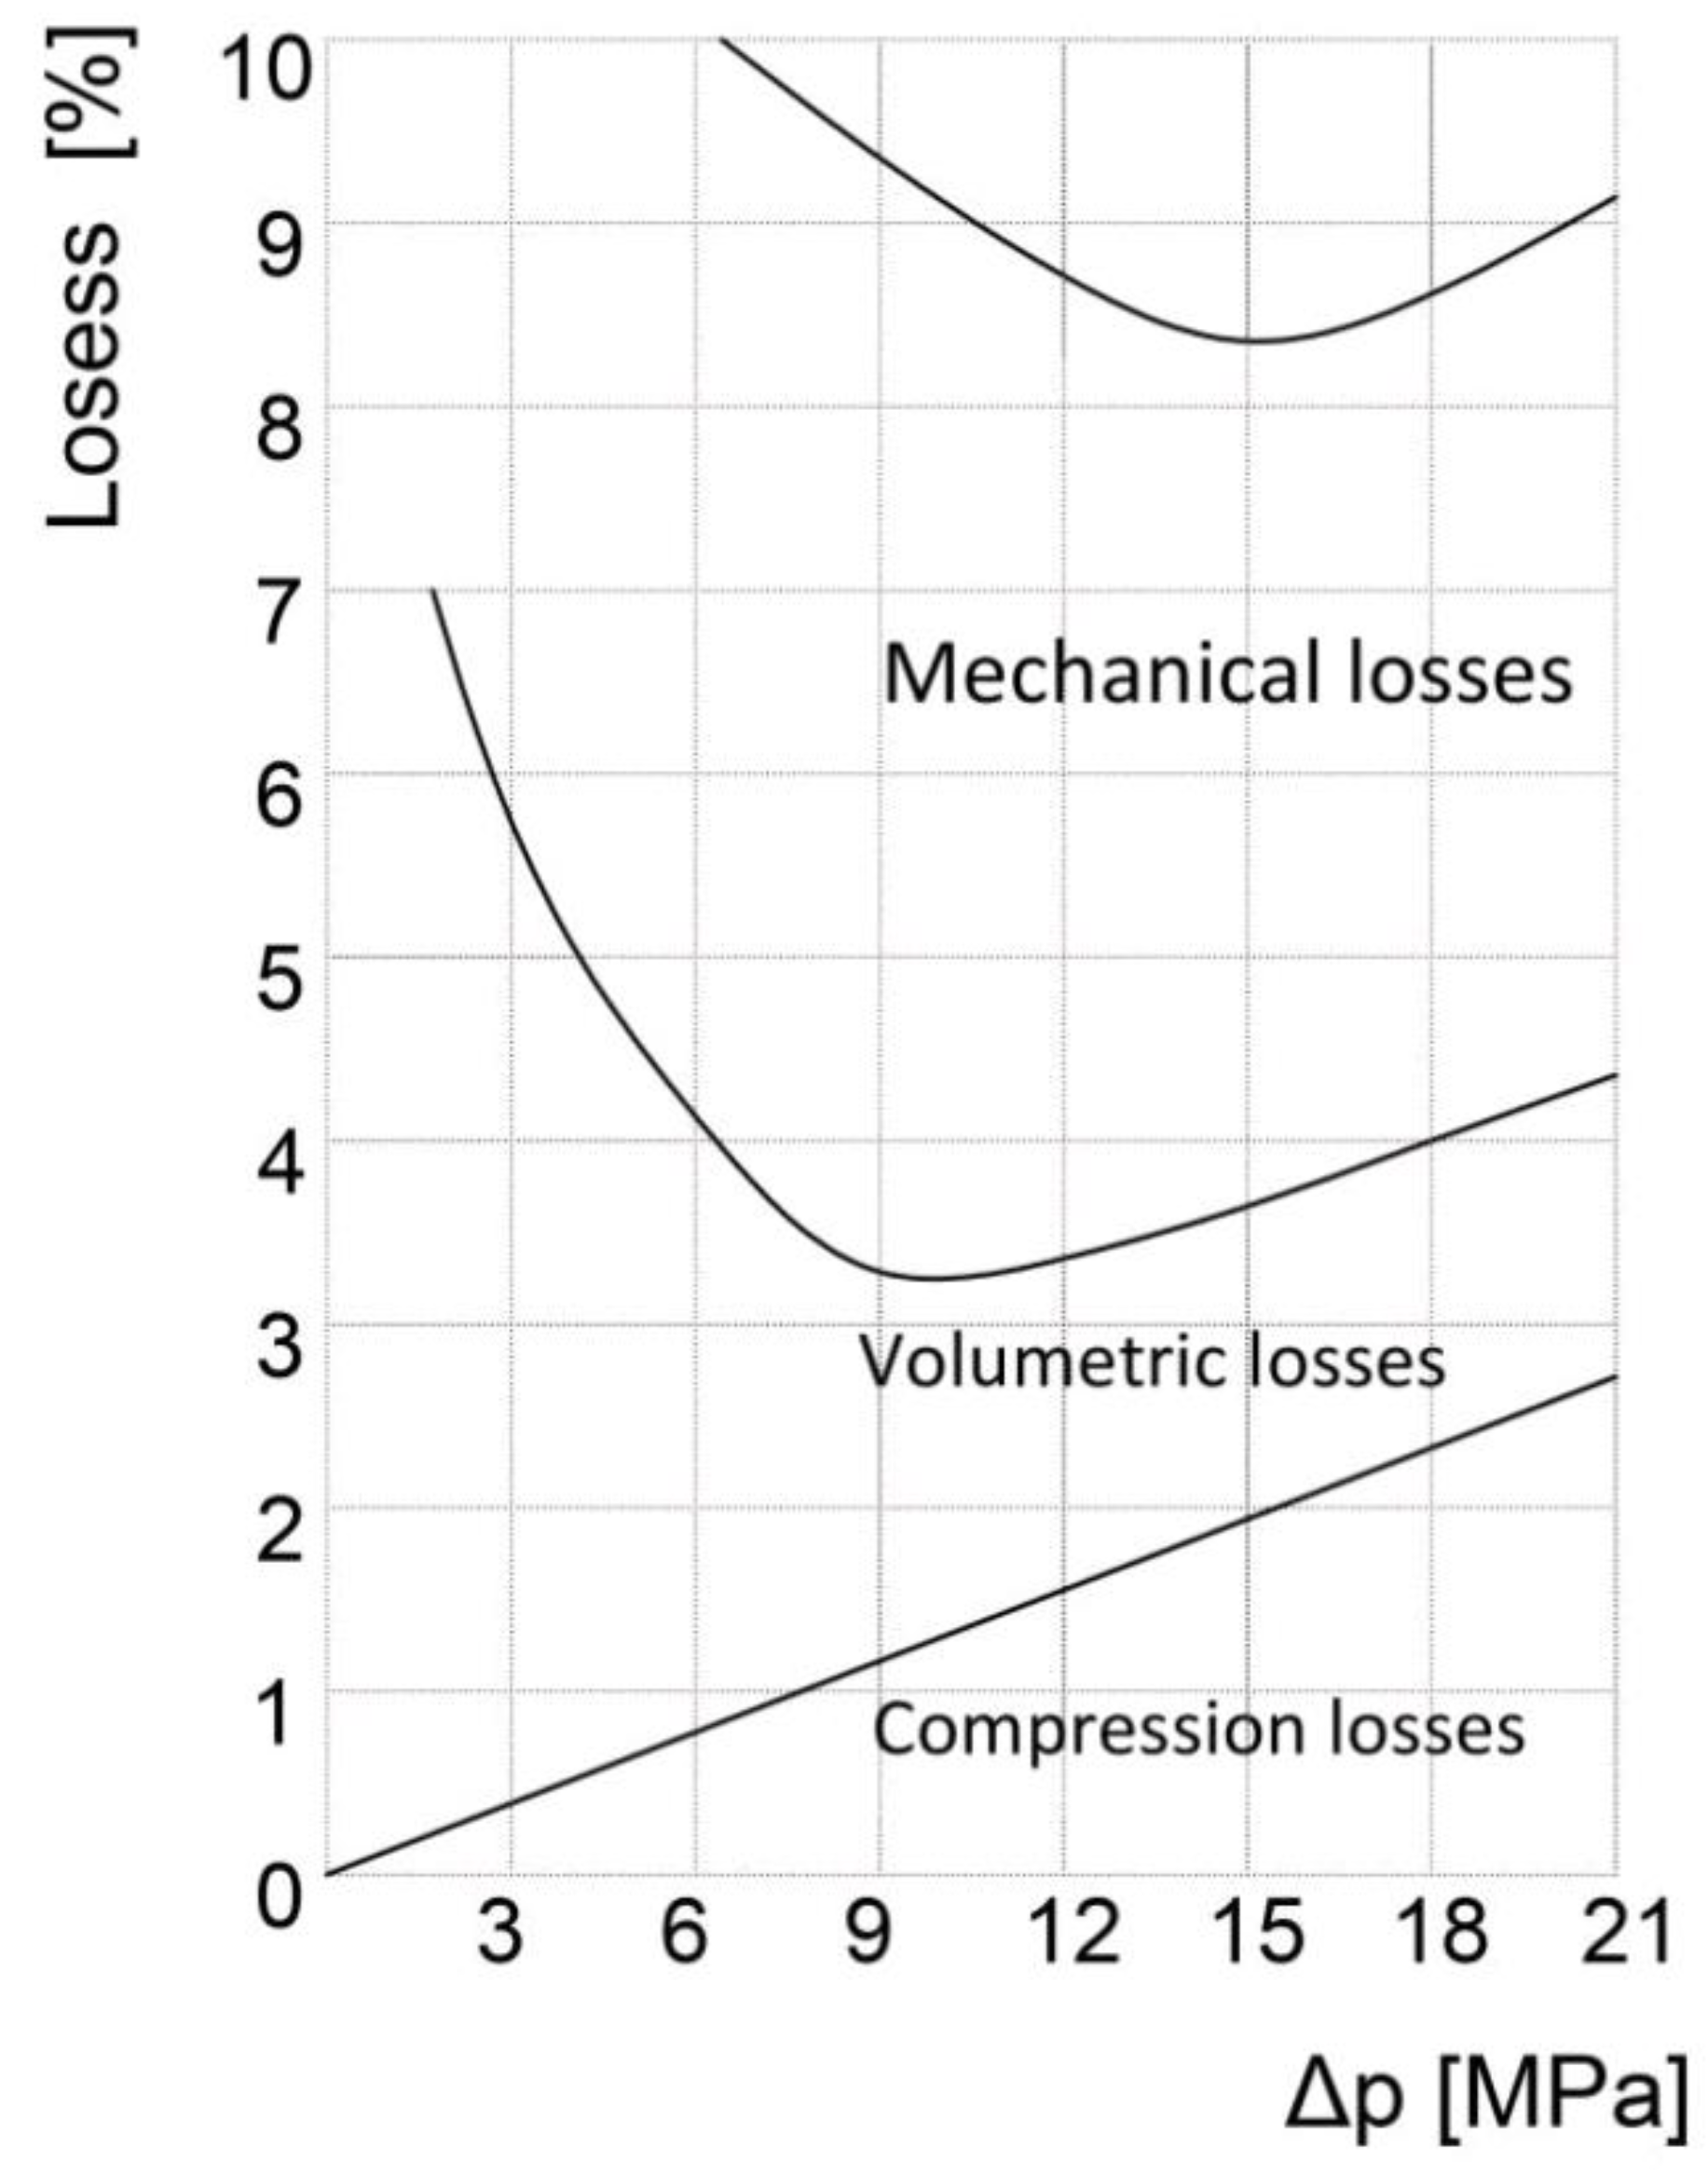
Figure 7.
Diagram of comperssion losses in BDC for one cylinder and one revolution .
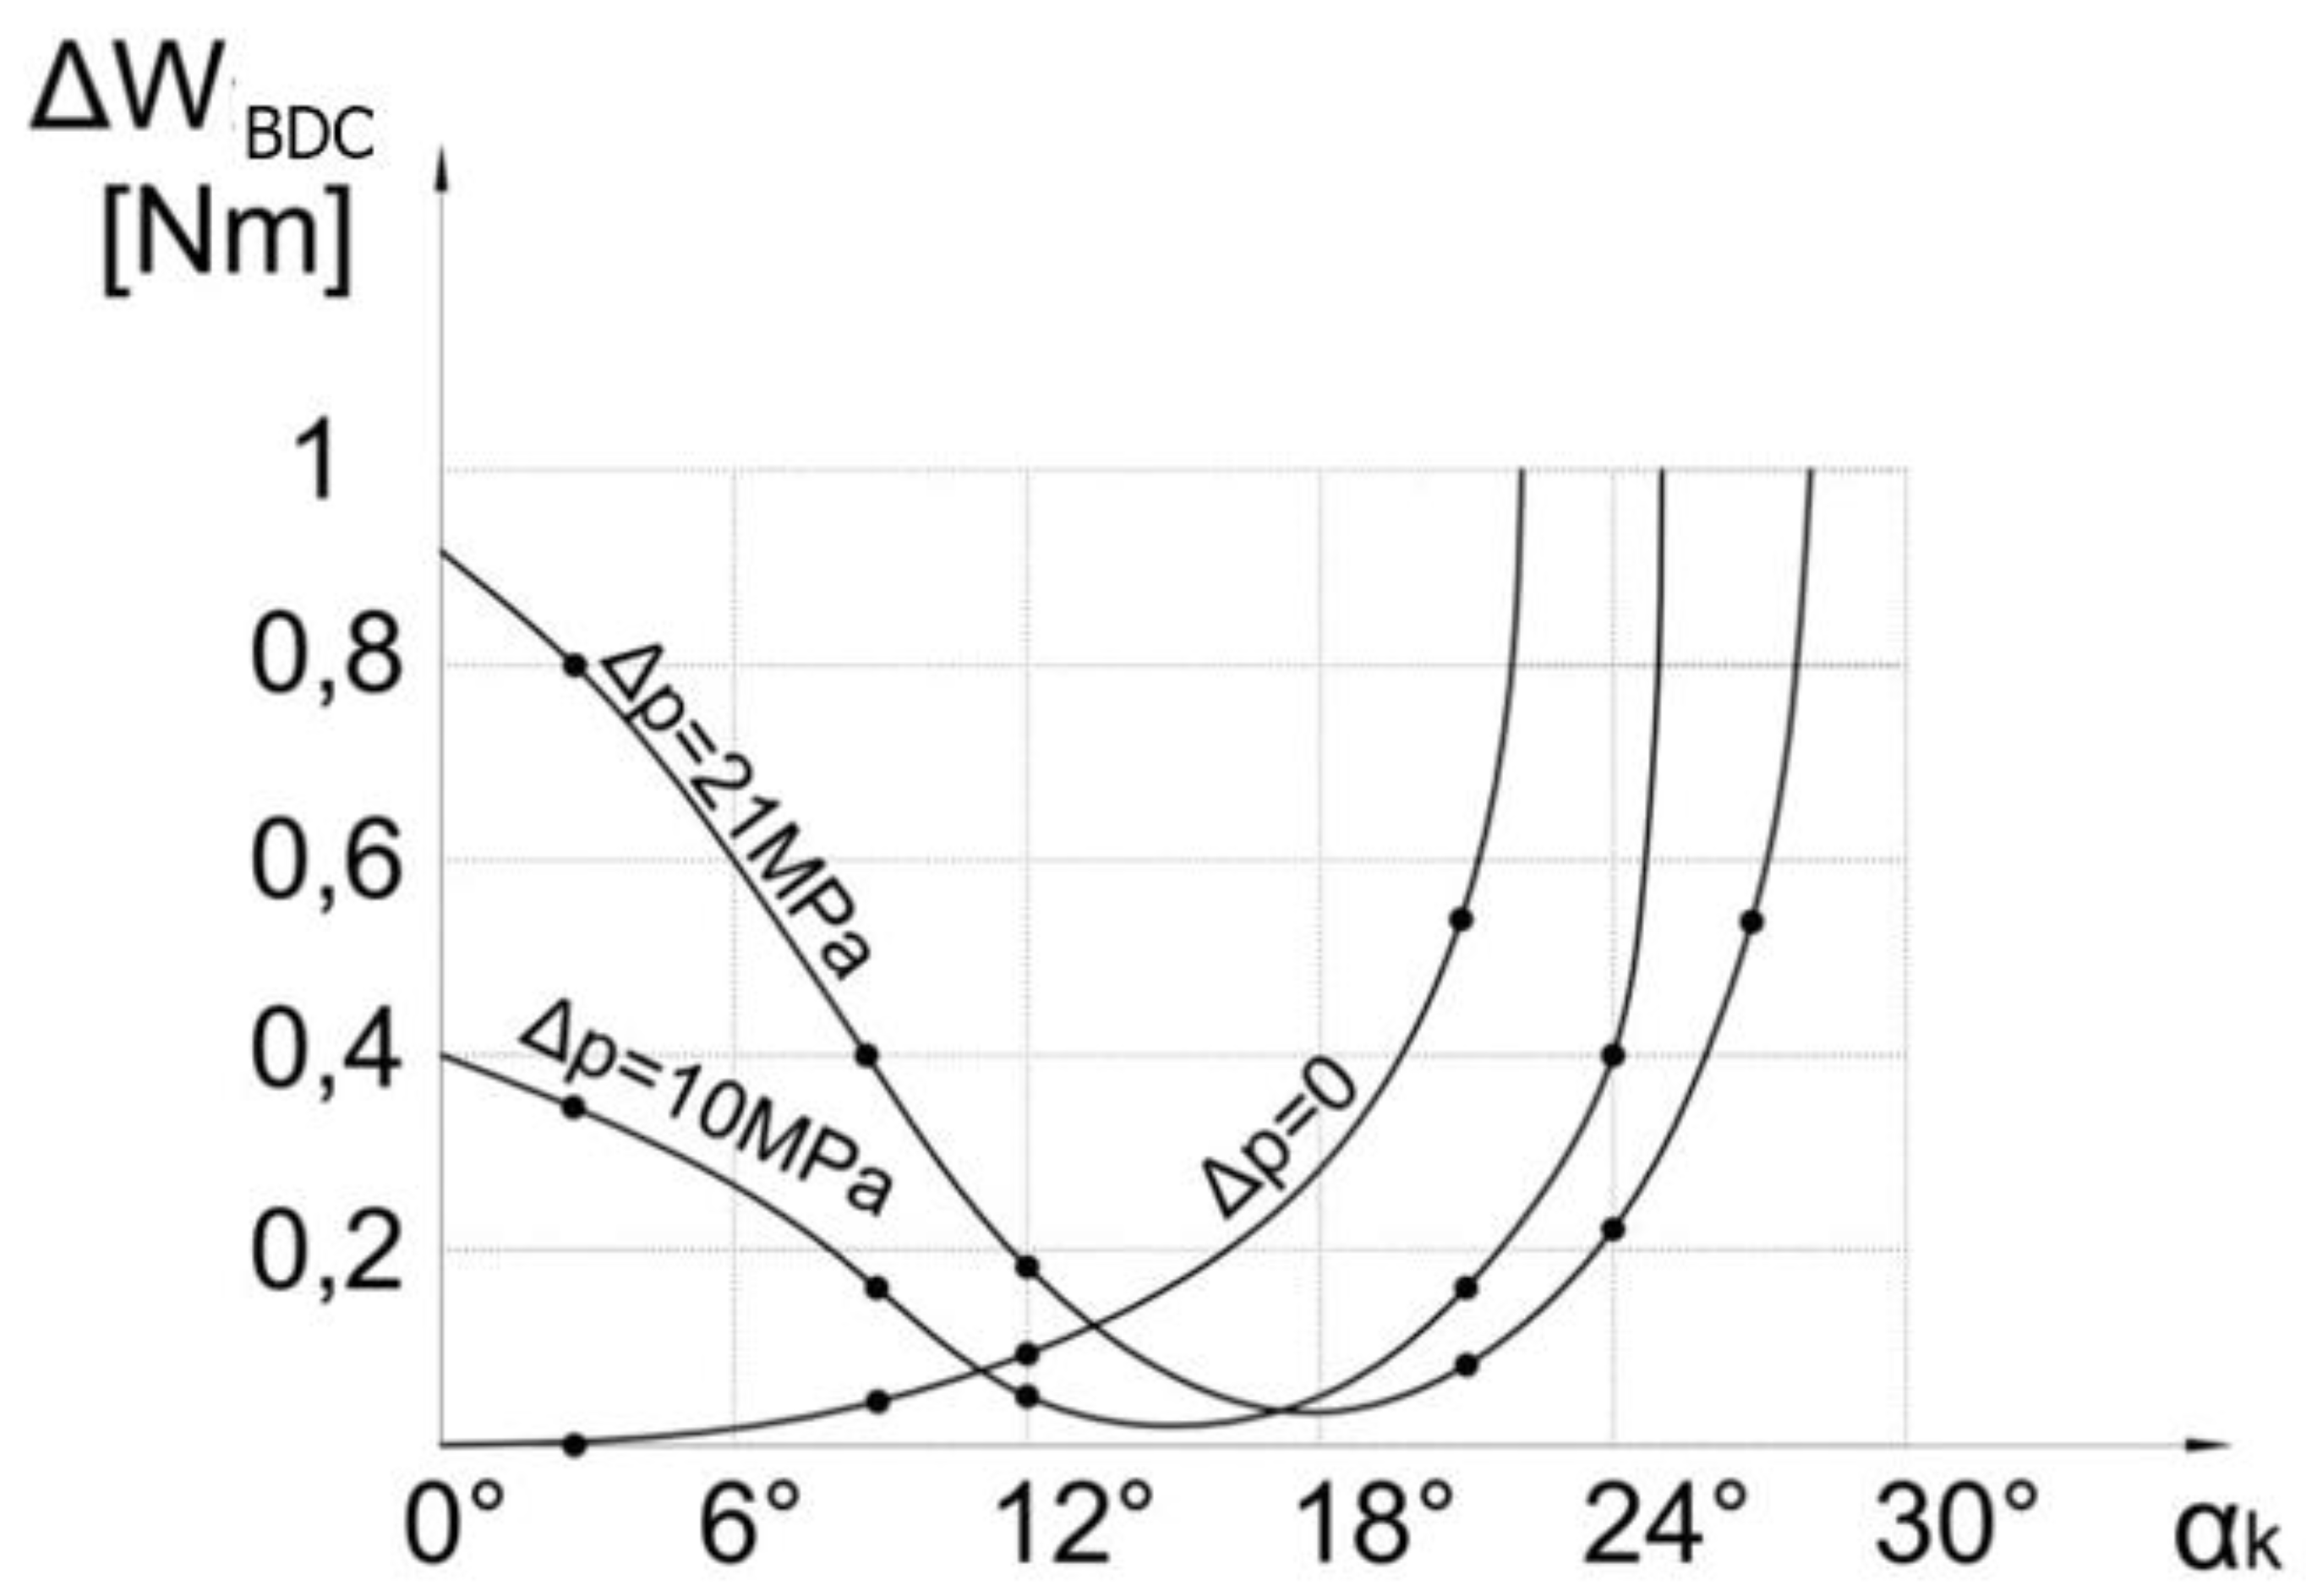
Figure 8.
Diagram of comperssion losses in TDC for one cylinder and one revolution.
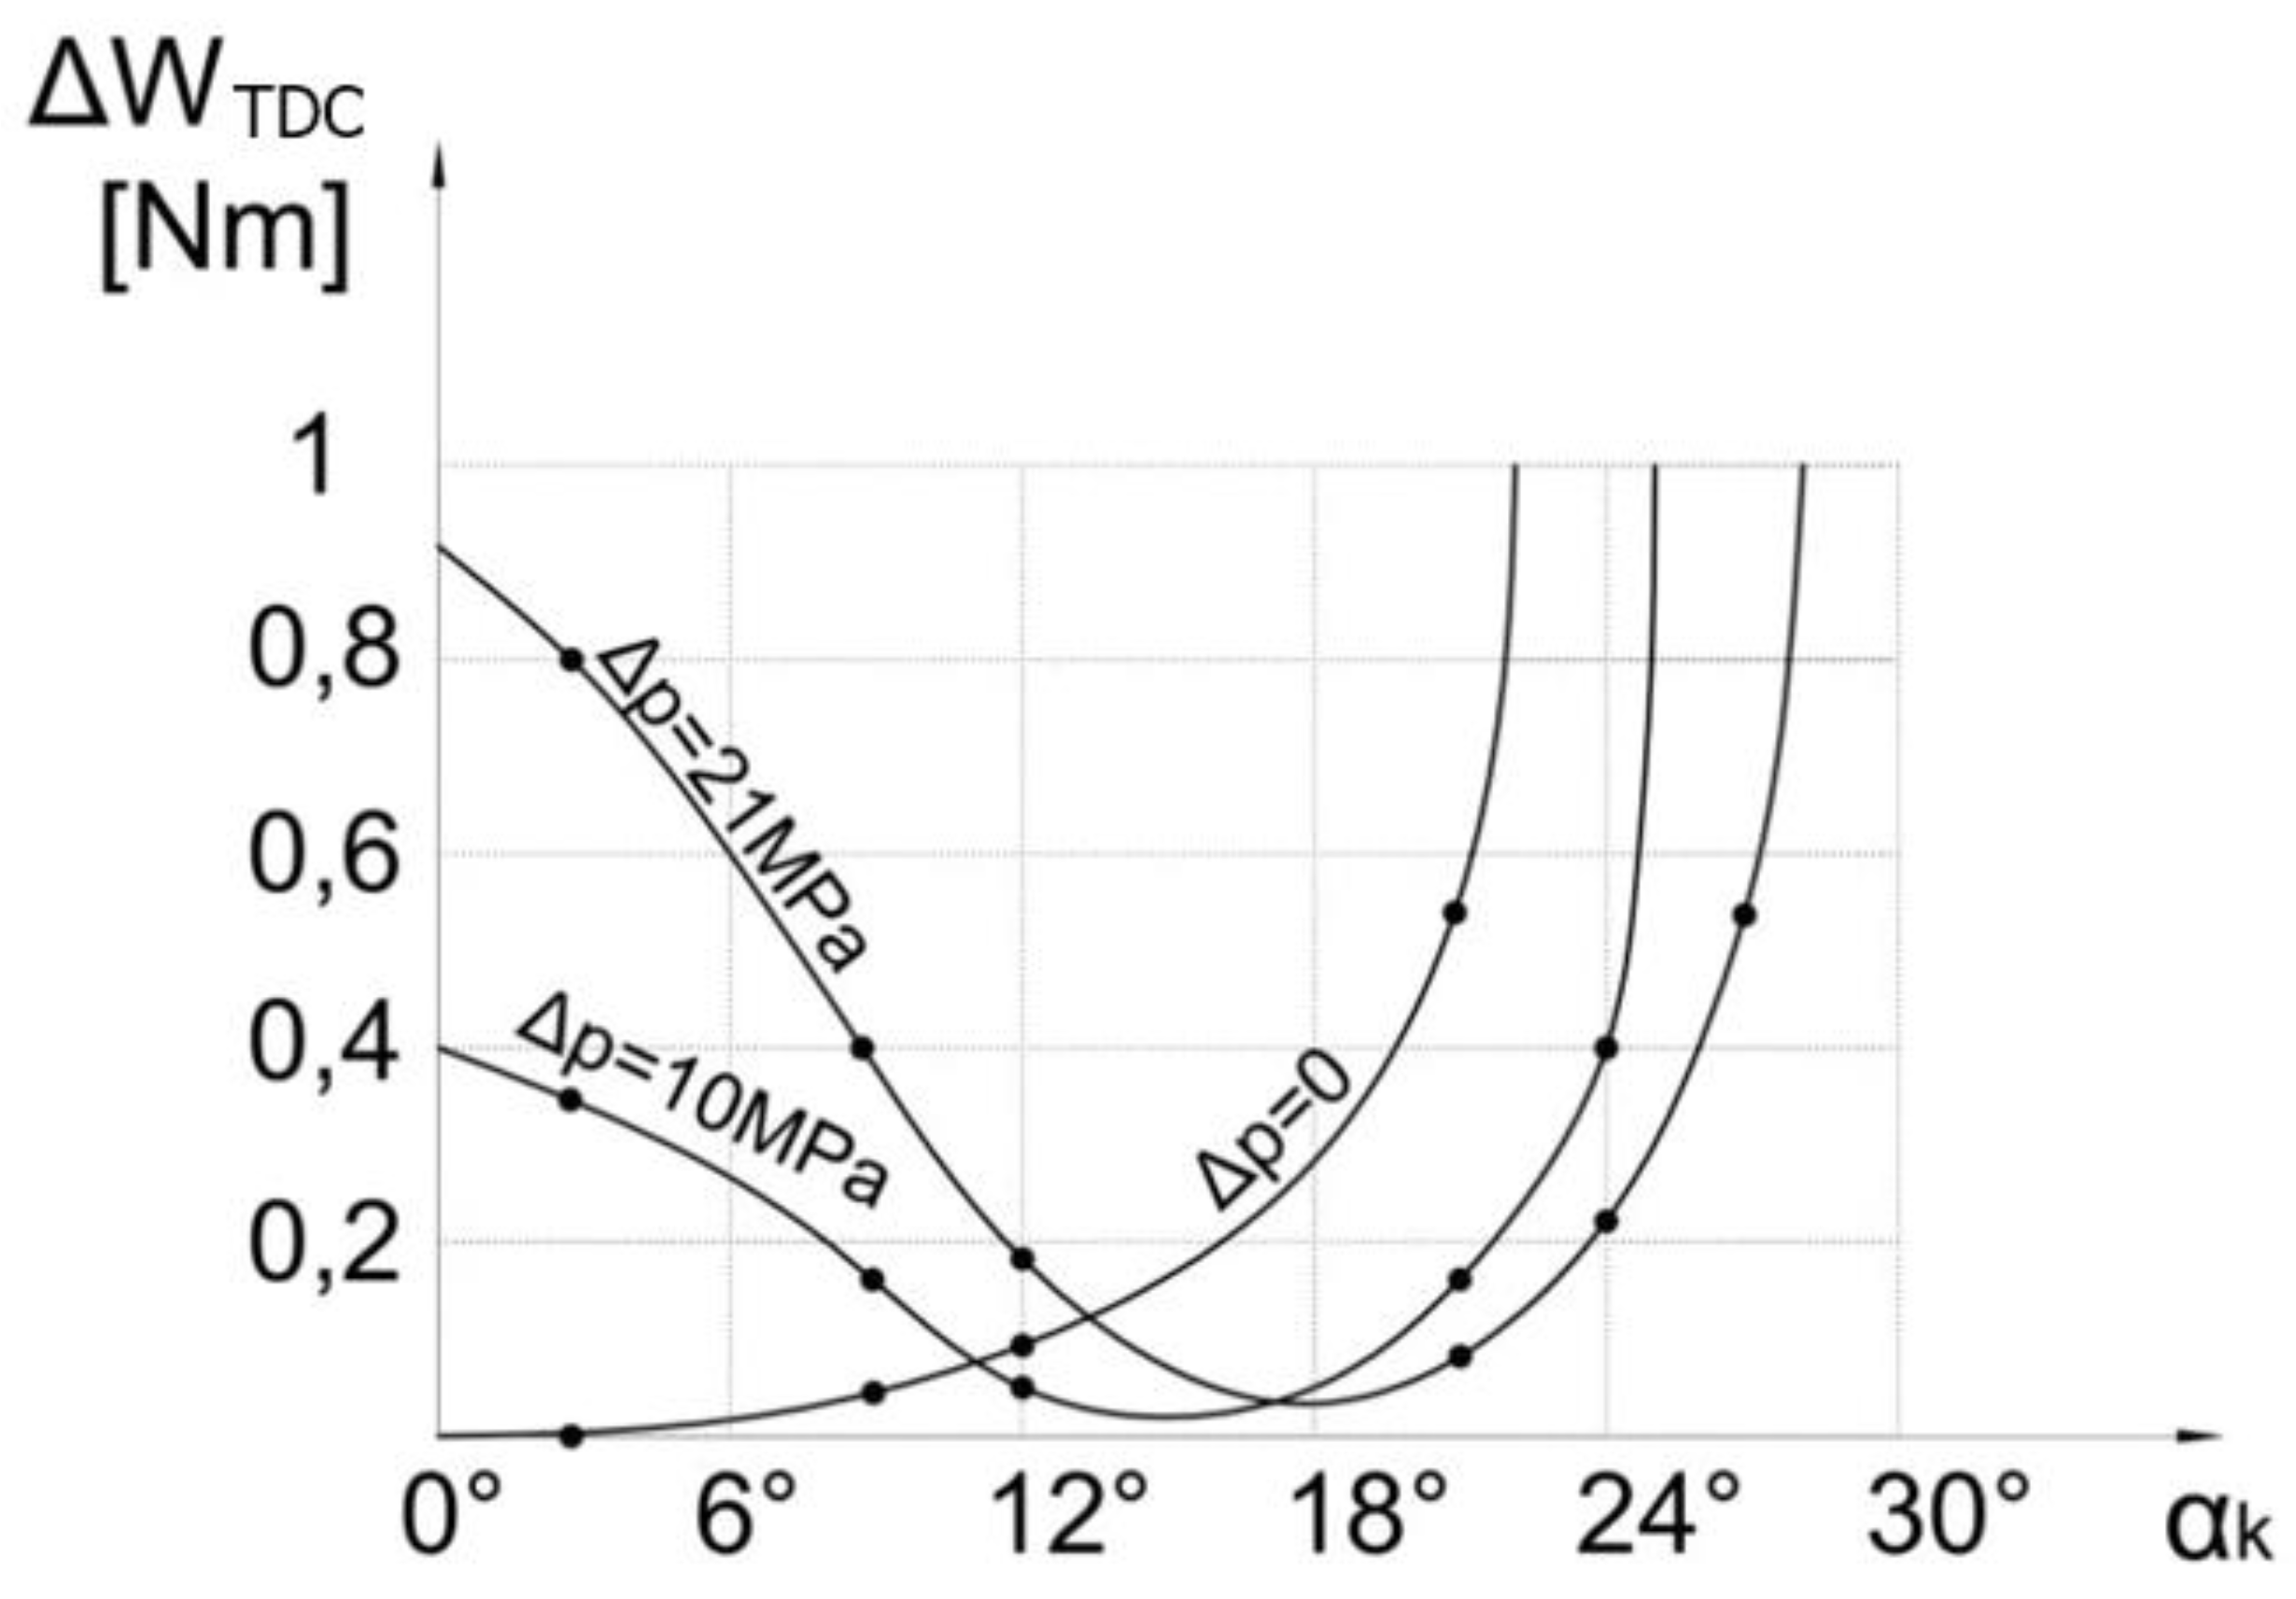
Figure 9.
Results of measurements of noise depending on the pressure n=1980min-1,β = 19°, ∝e = 0.
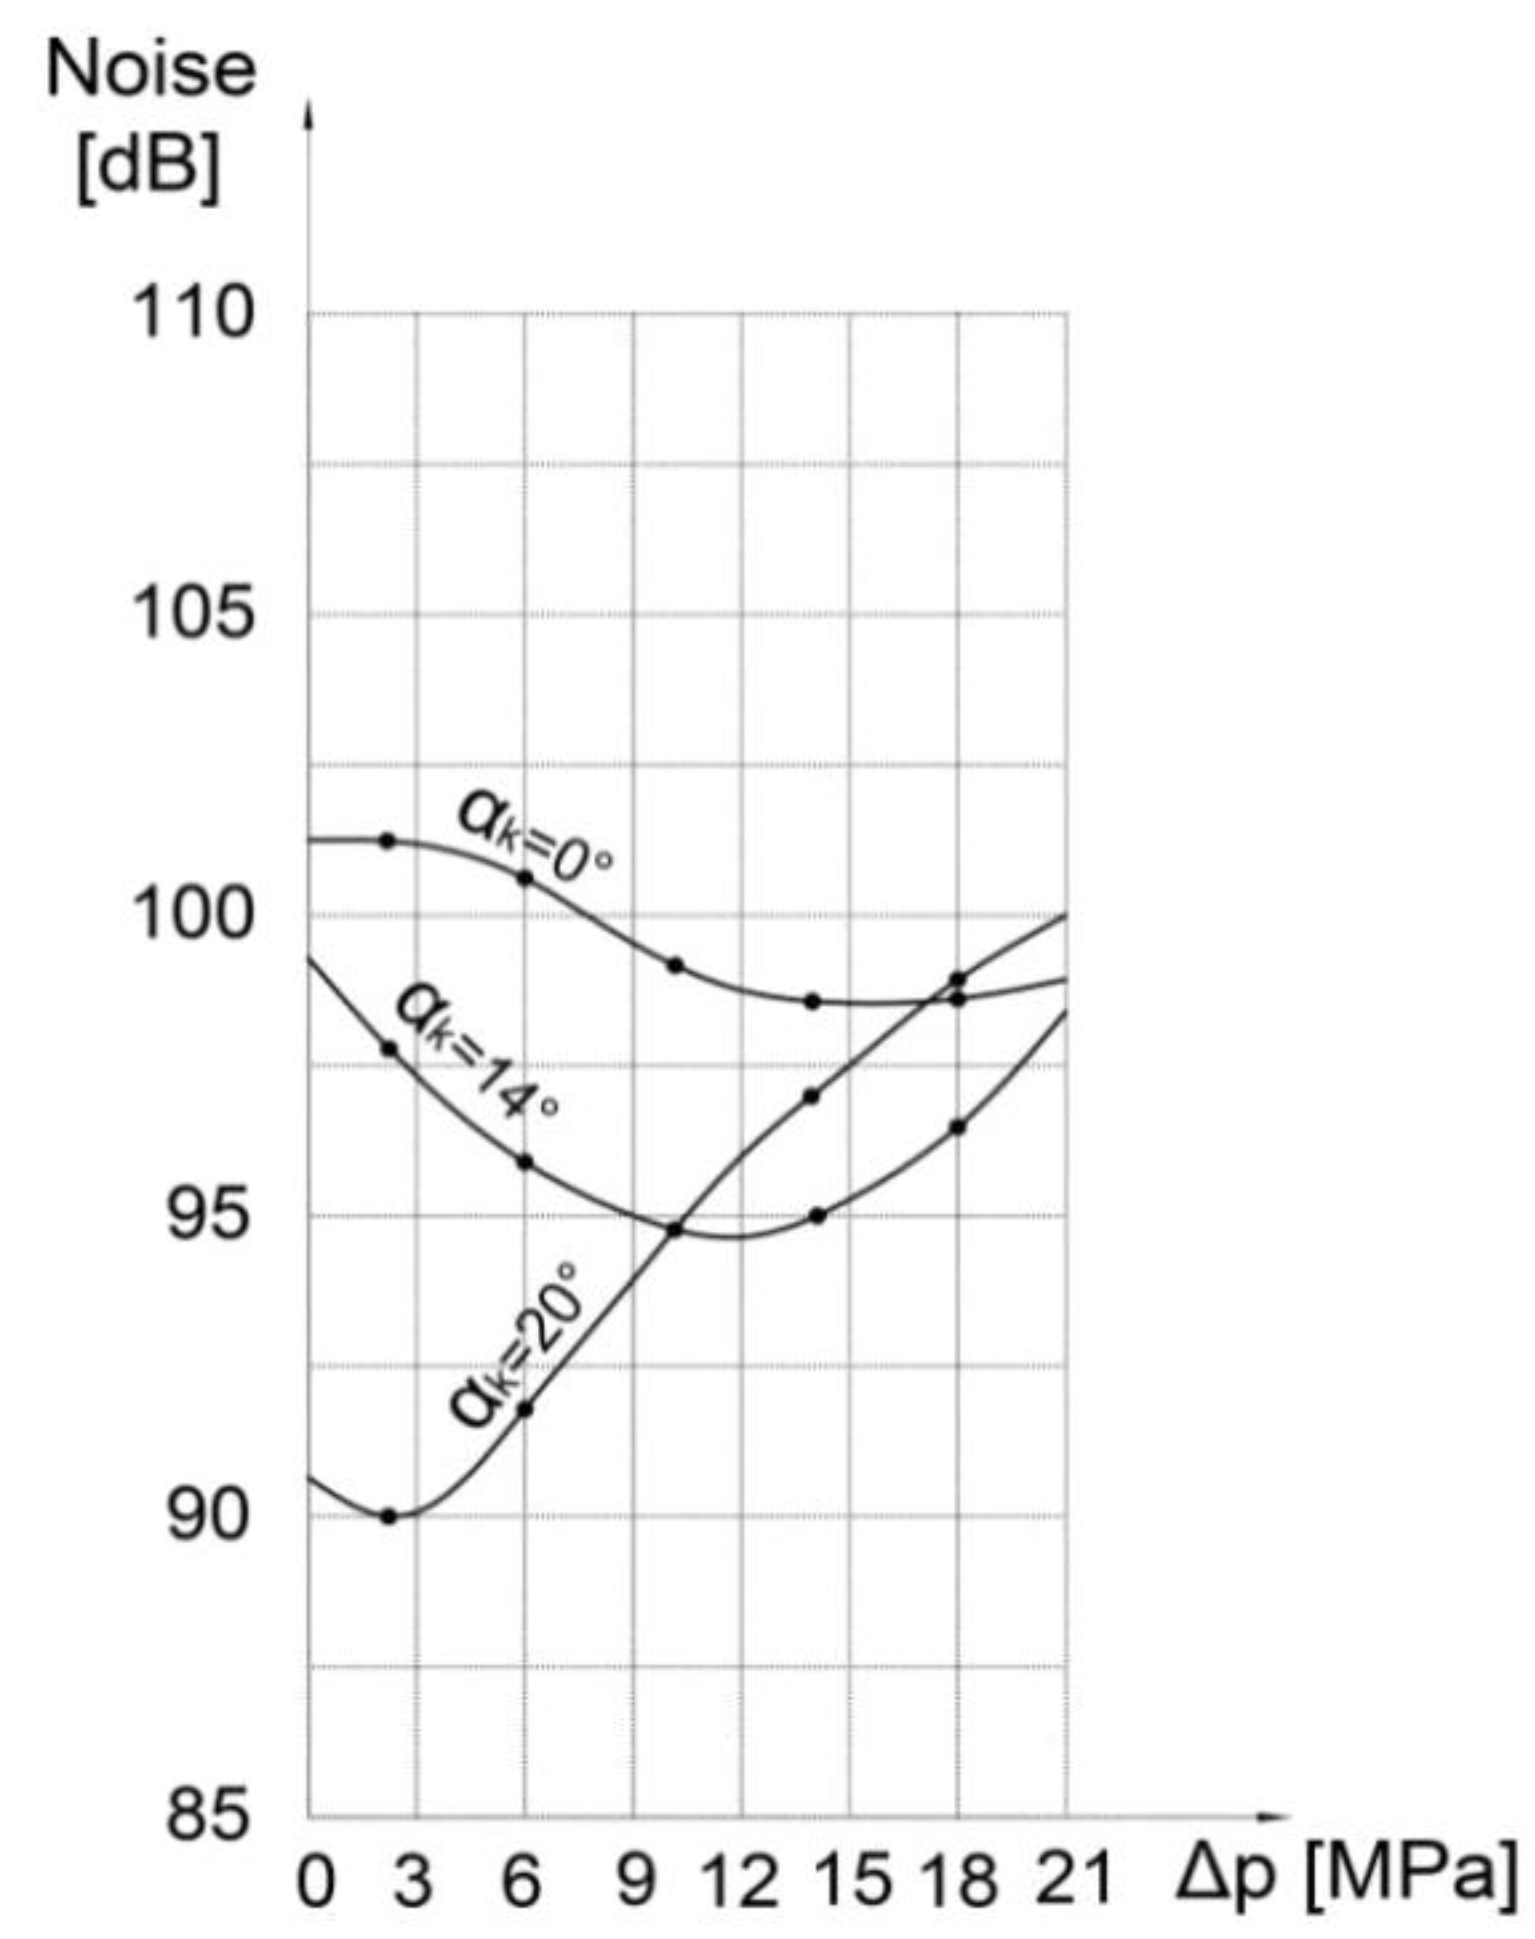
Figure 10.
Results of measurements of noise depending on the pressure n=1980min-1,β = 19°.
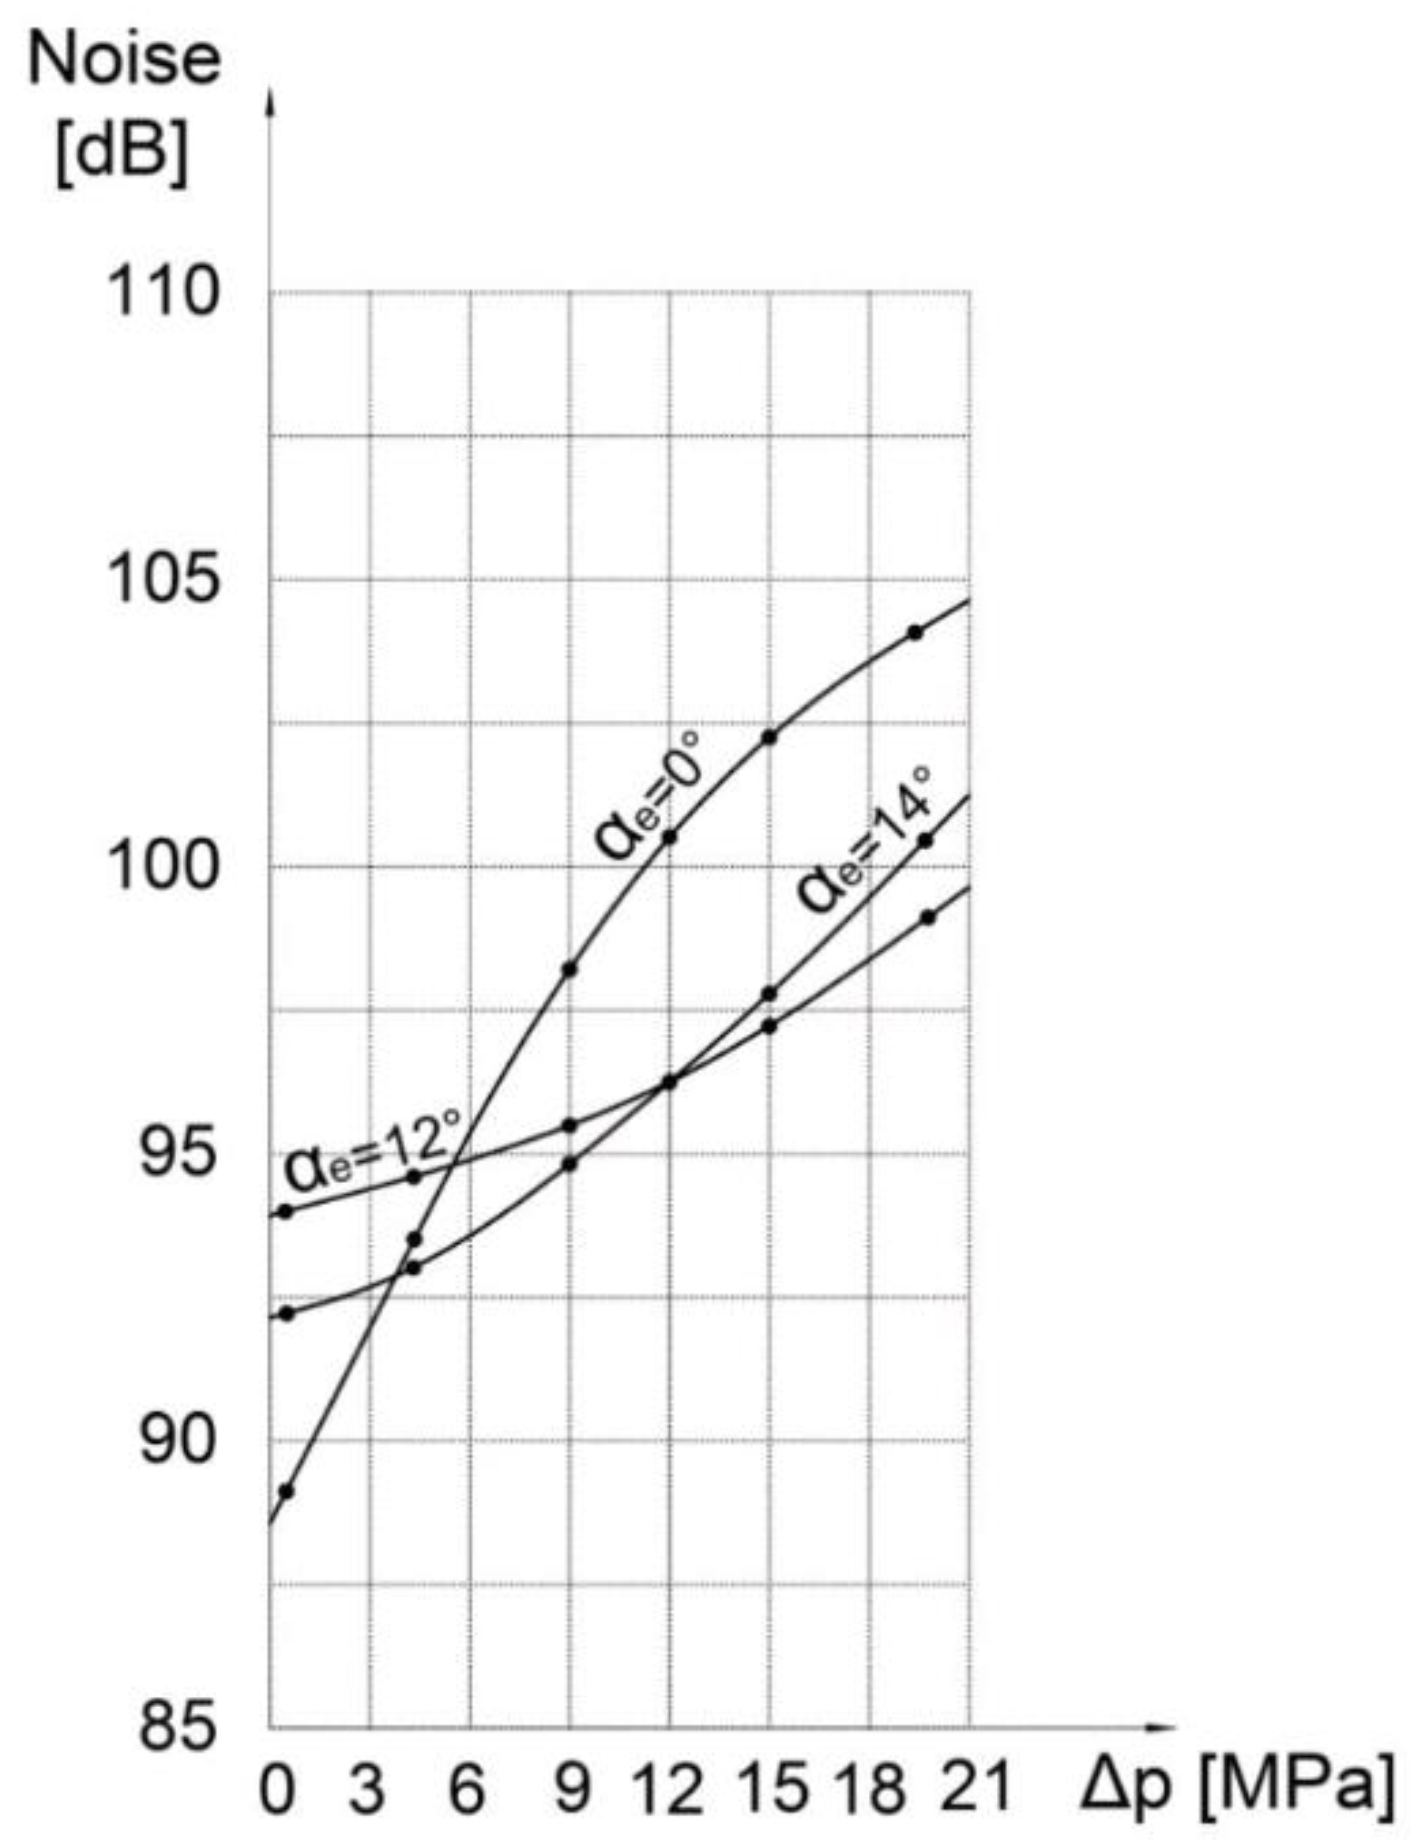
Figure 11.
Results of measurements of noise depending on the pressure n=1500min-1,β = 19°.
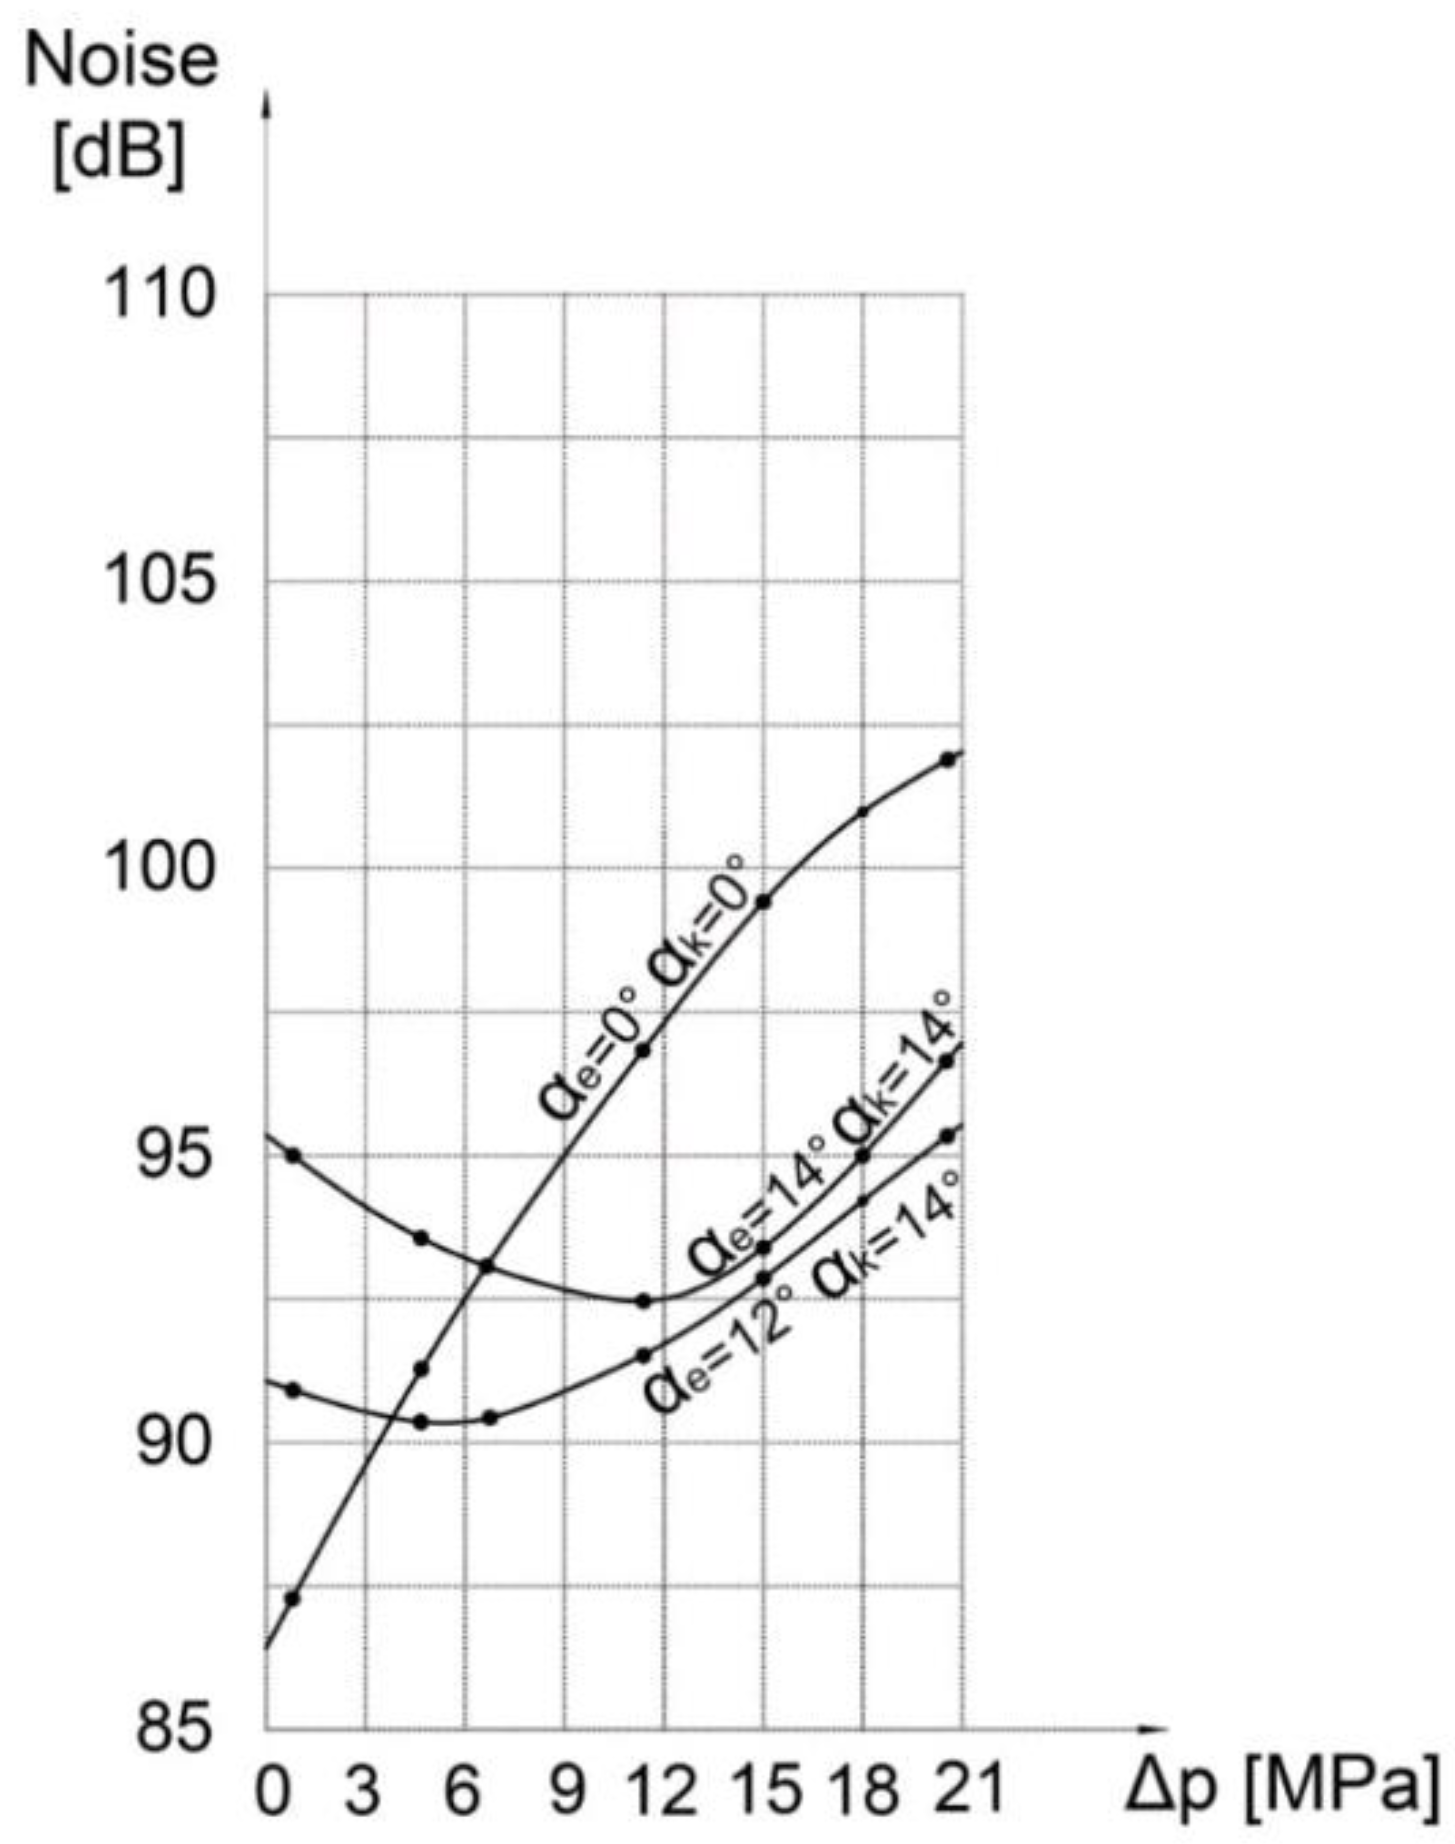
Figure 12.
Results of measurements of noise depending on the pressure n=1980min-1,β = 19°,
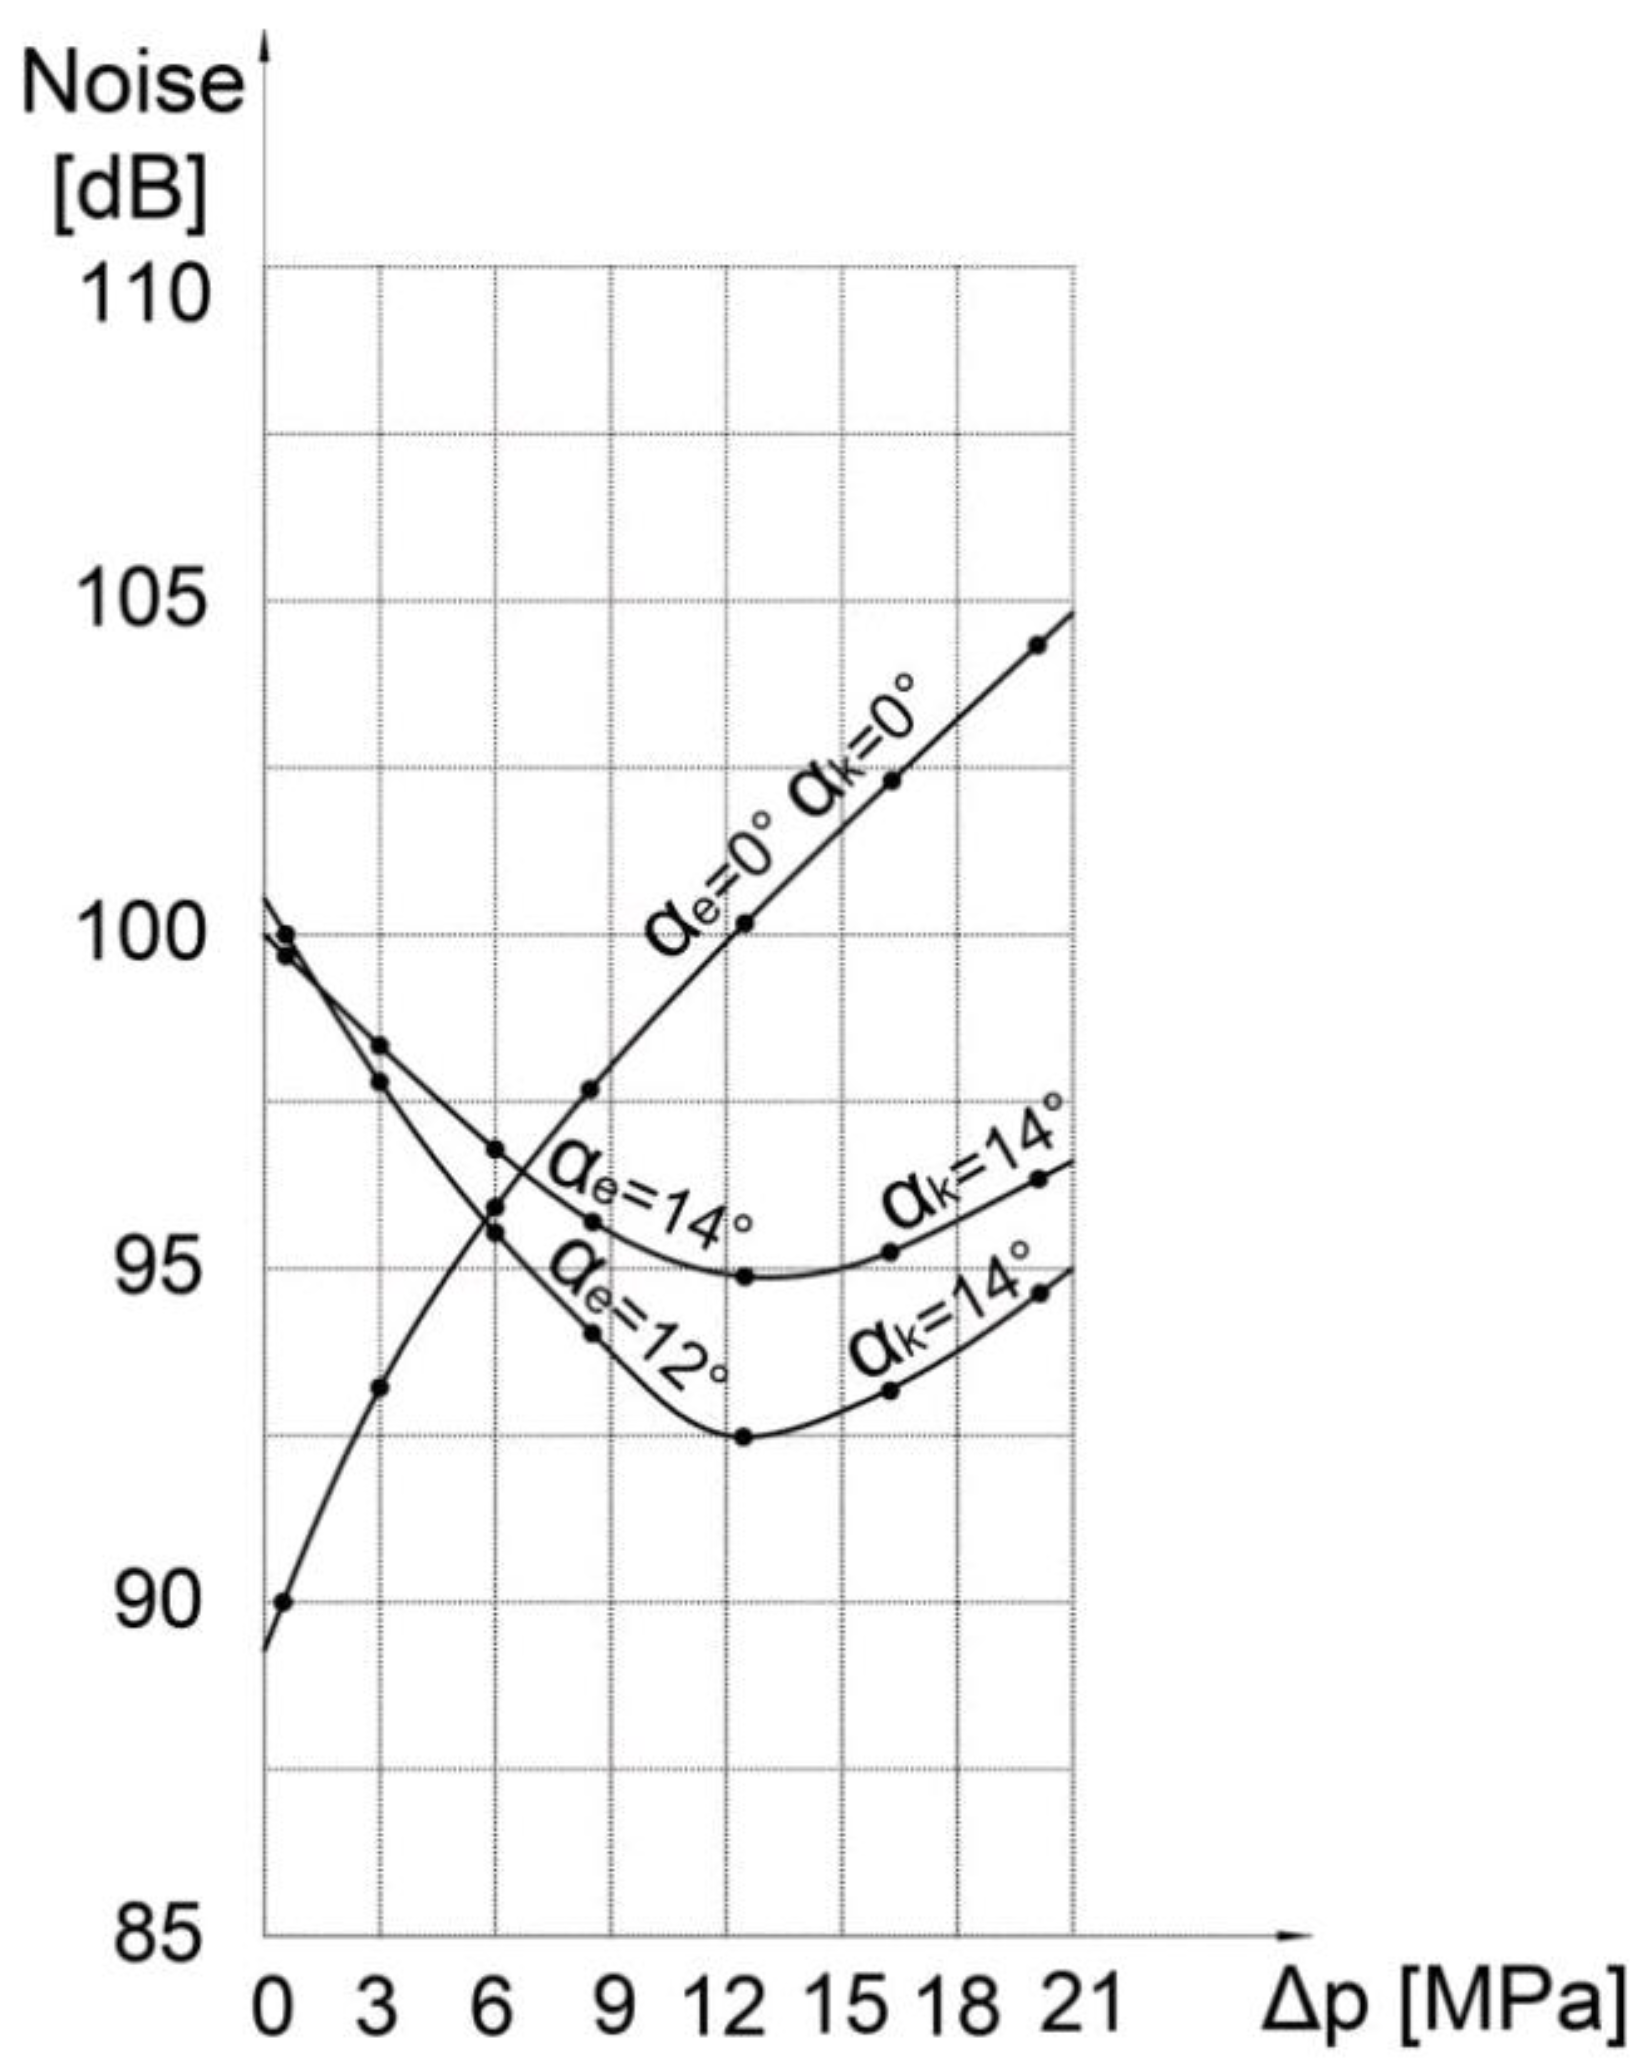
Figure 13.
Results of measurements of noise depending on the pressure n=3000min-1,β = 19°.
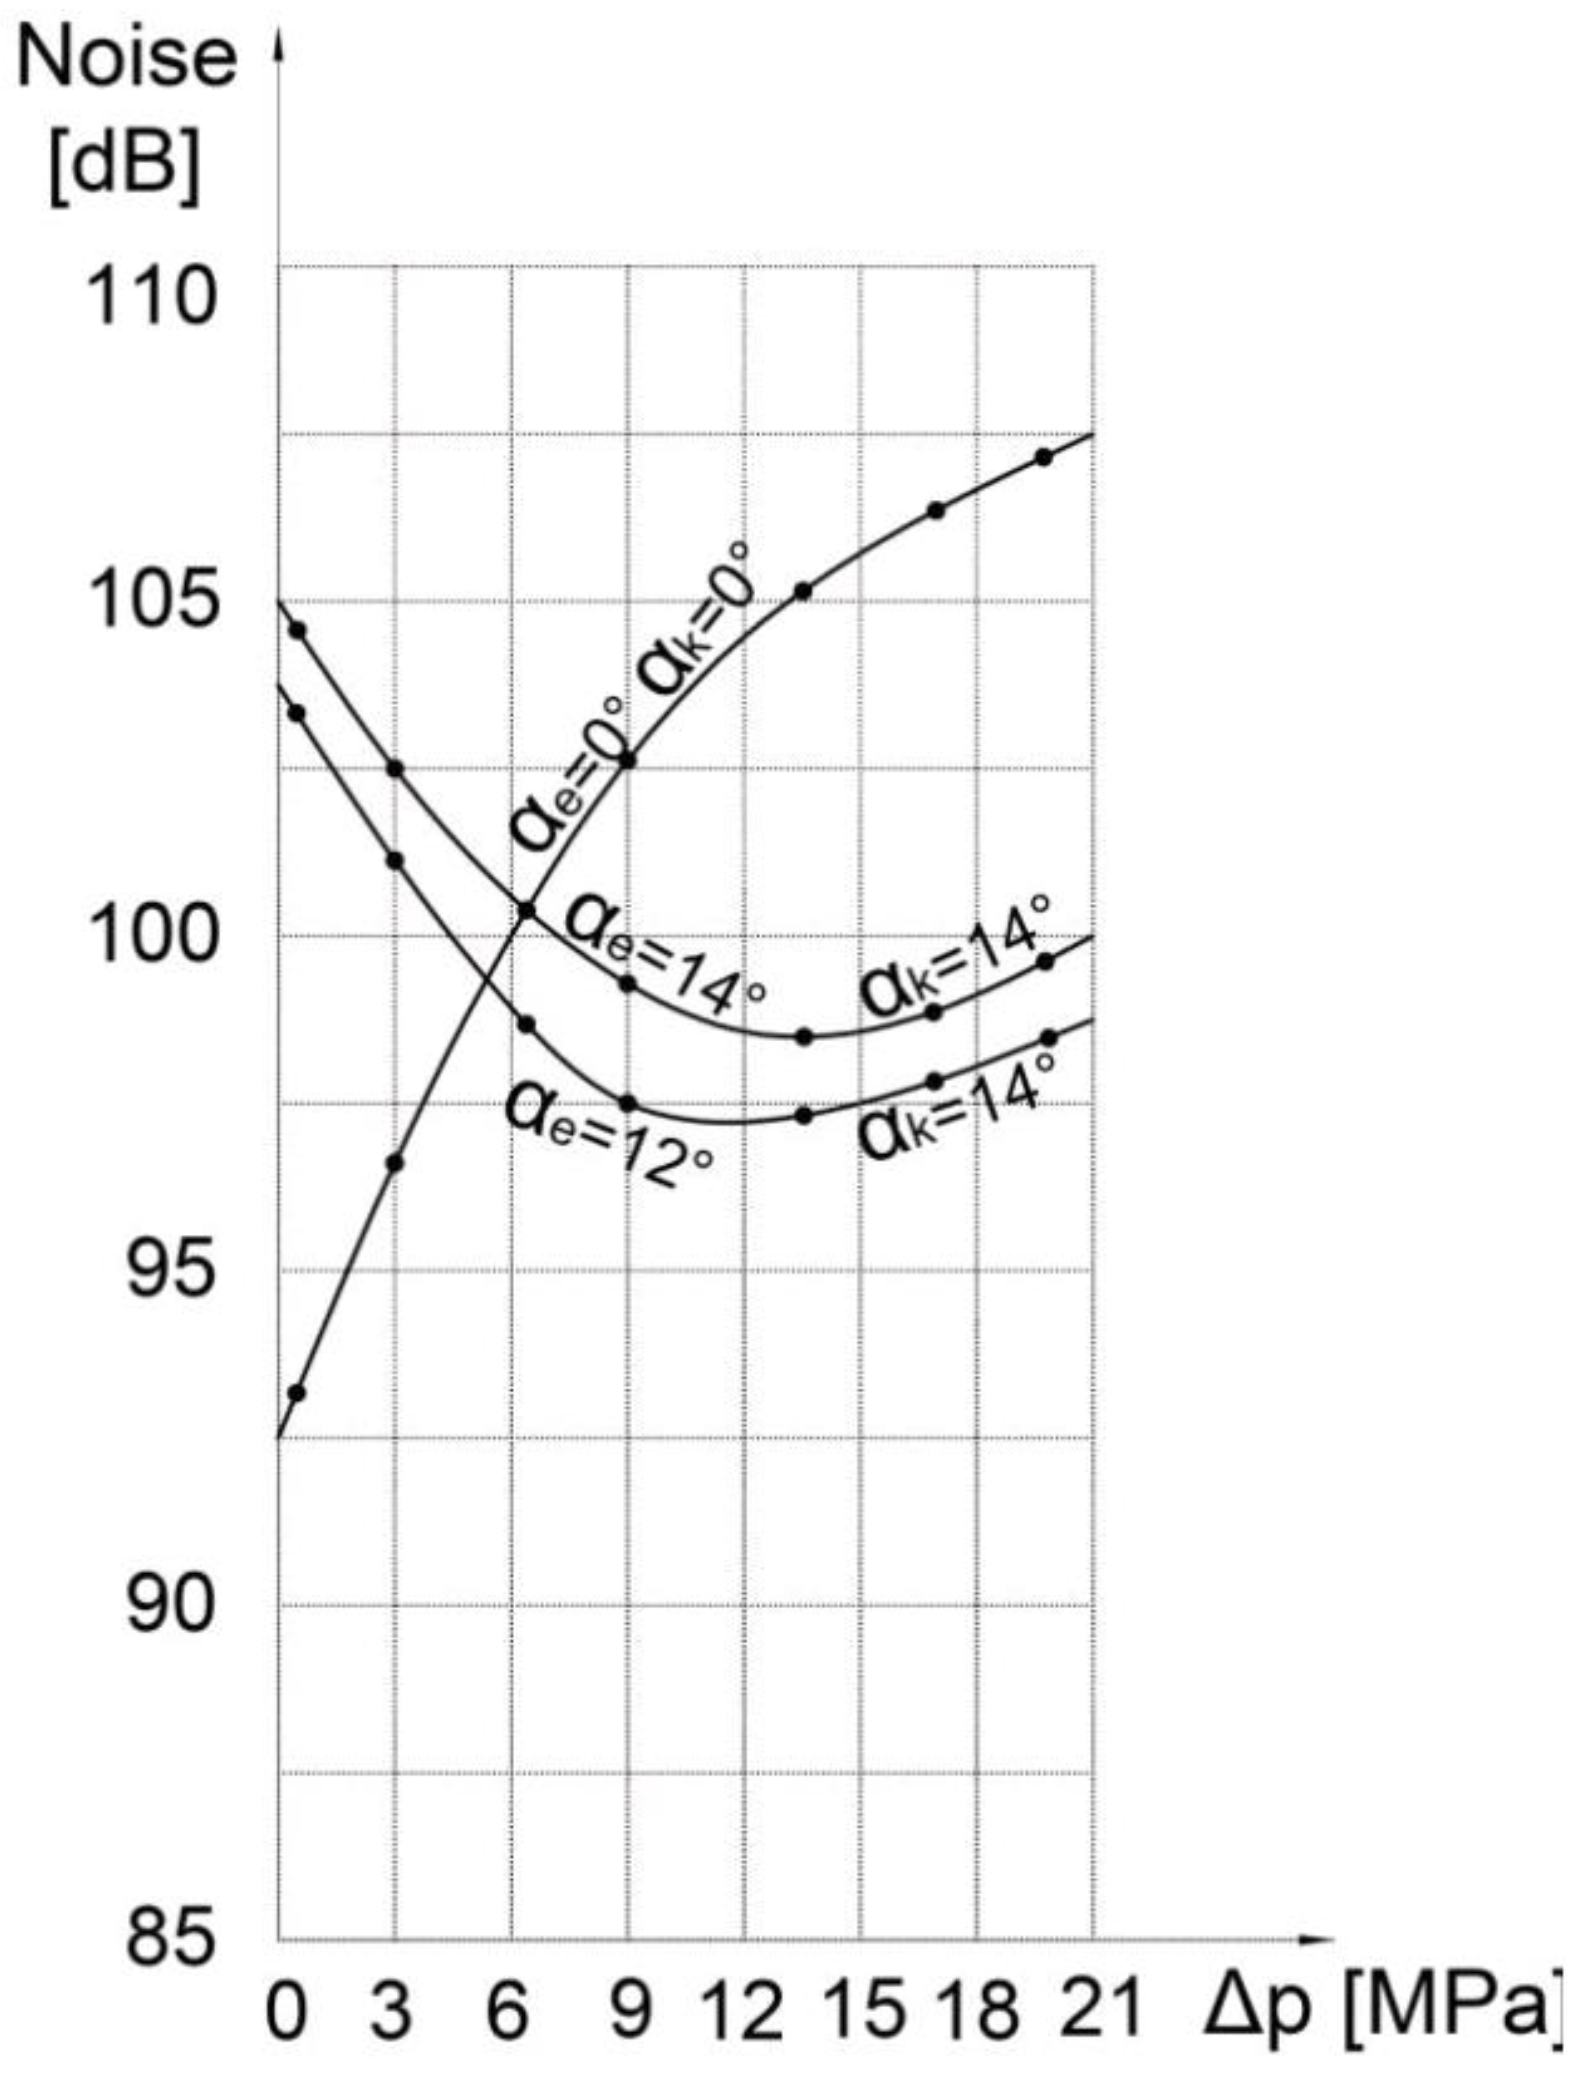
Figure 14.
The pressure history in the cylinder ( pc )and delivery chamber ( ph ) for one cycle.
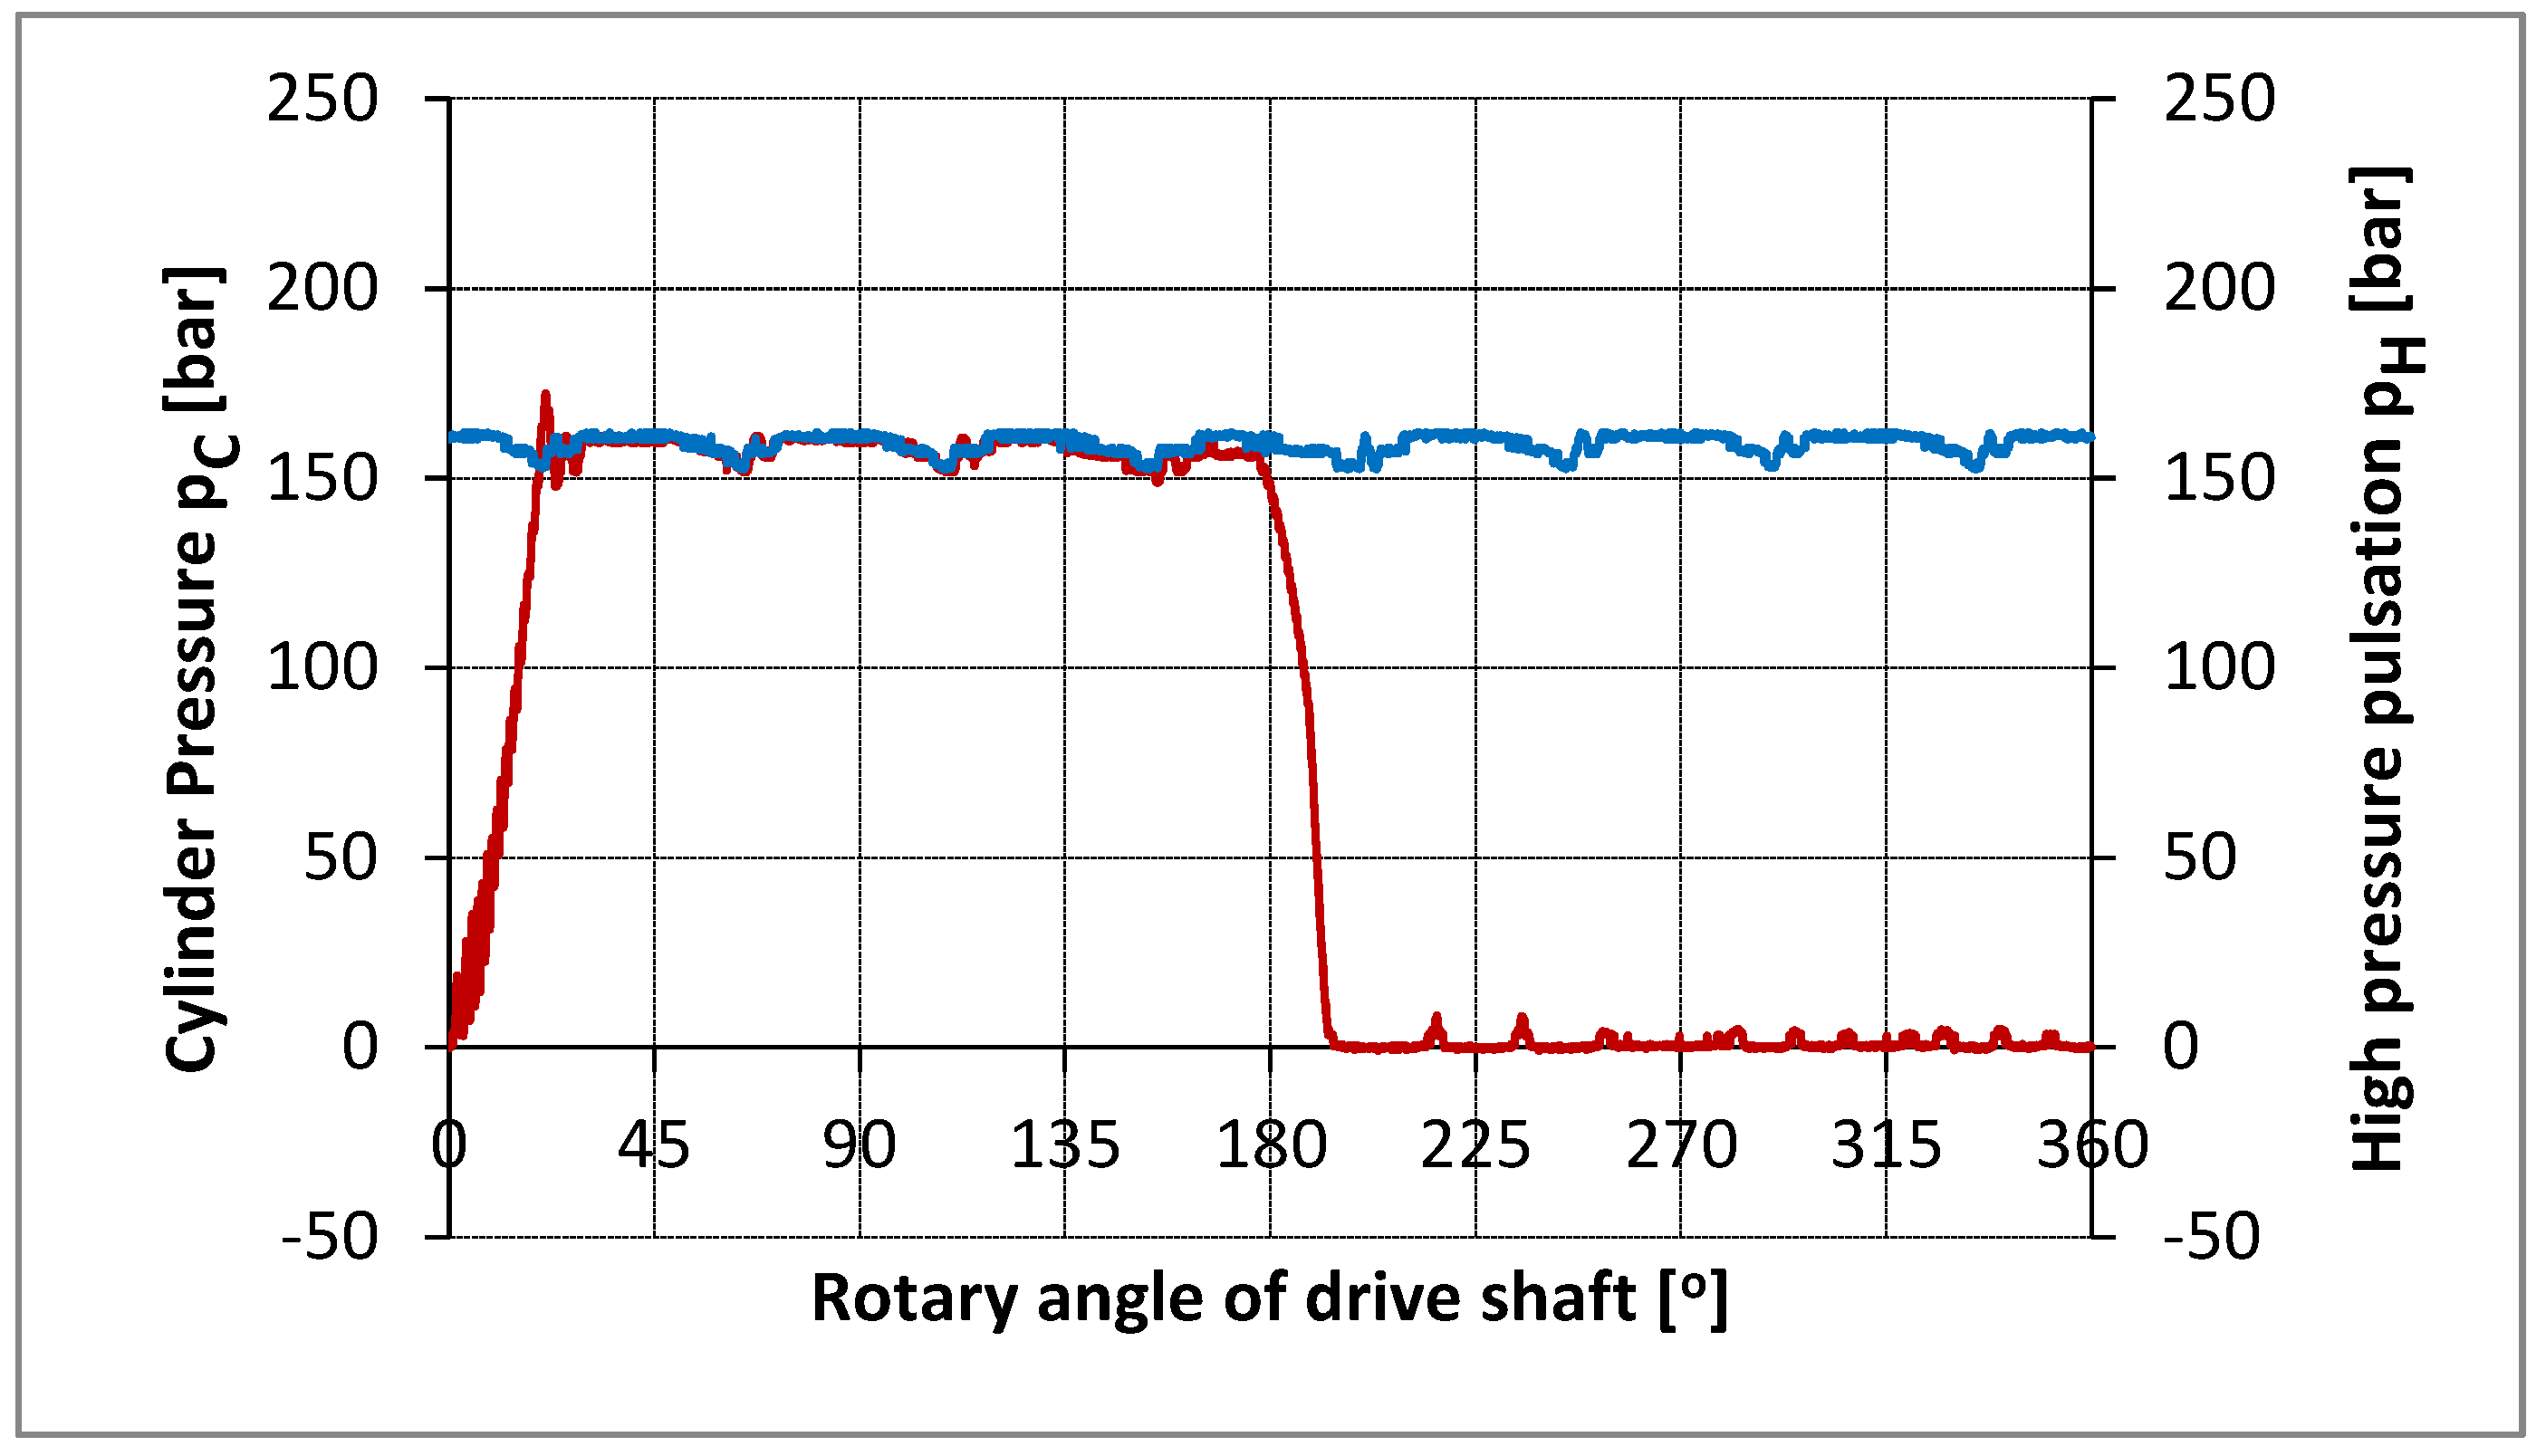
Figure 15.
The pressure history in the cylinder ( pc ) and delivery chamber ( ph ) for the average cycle.
Figure 15.
The pressure history in the cylinder ( pc ) and delivery chamber ( ph ) for the average cycle.
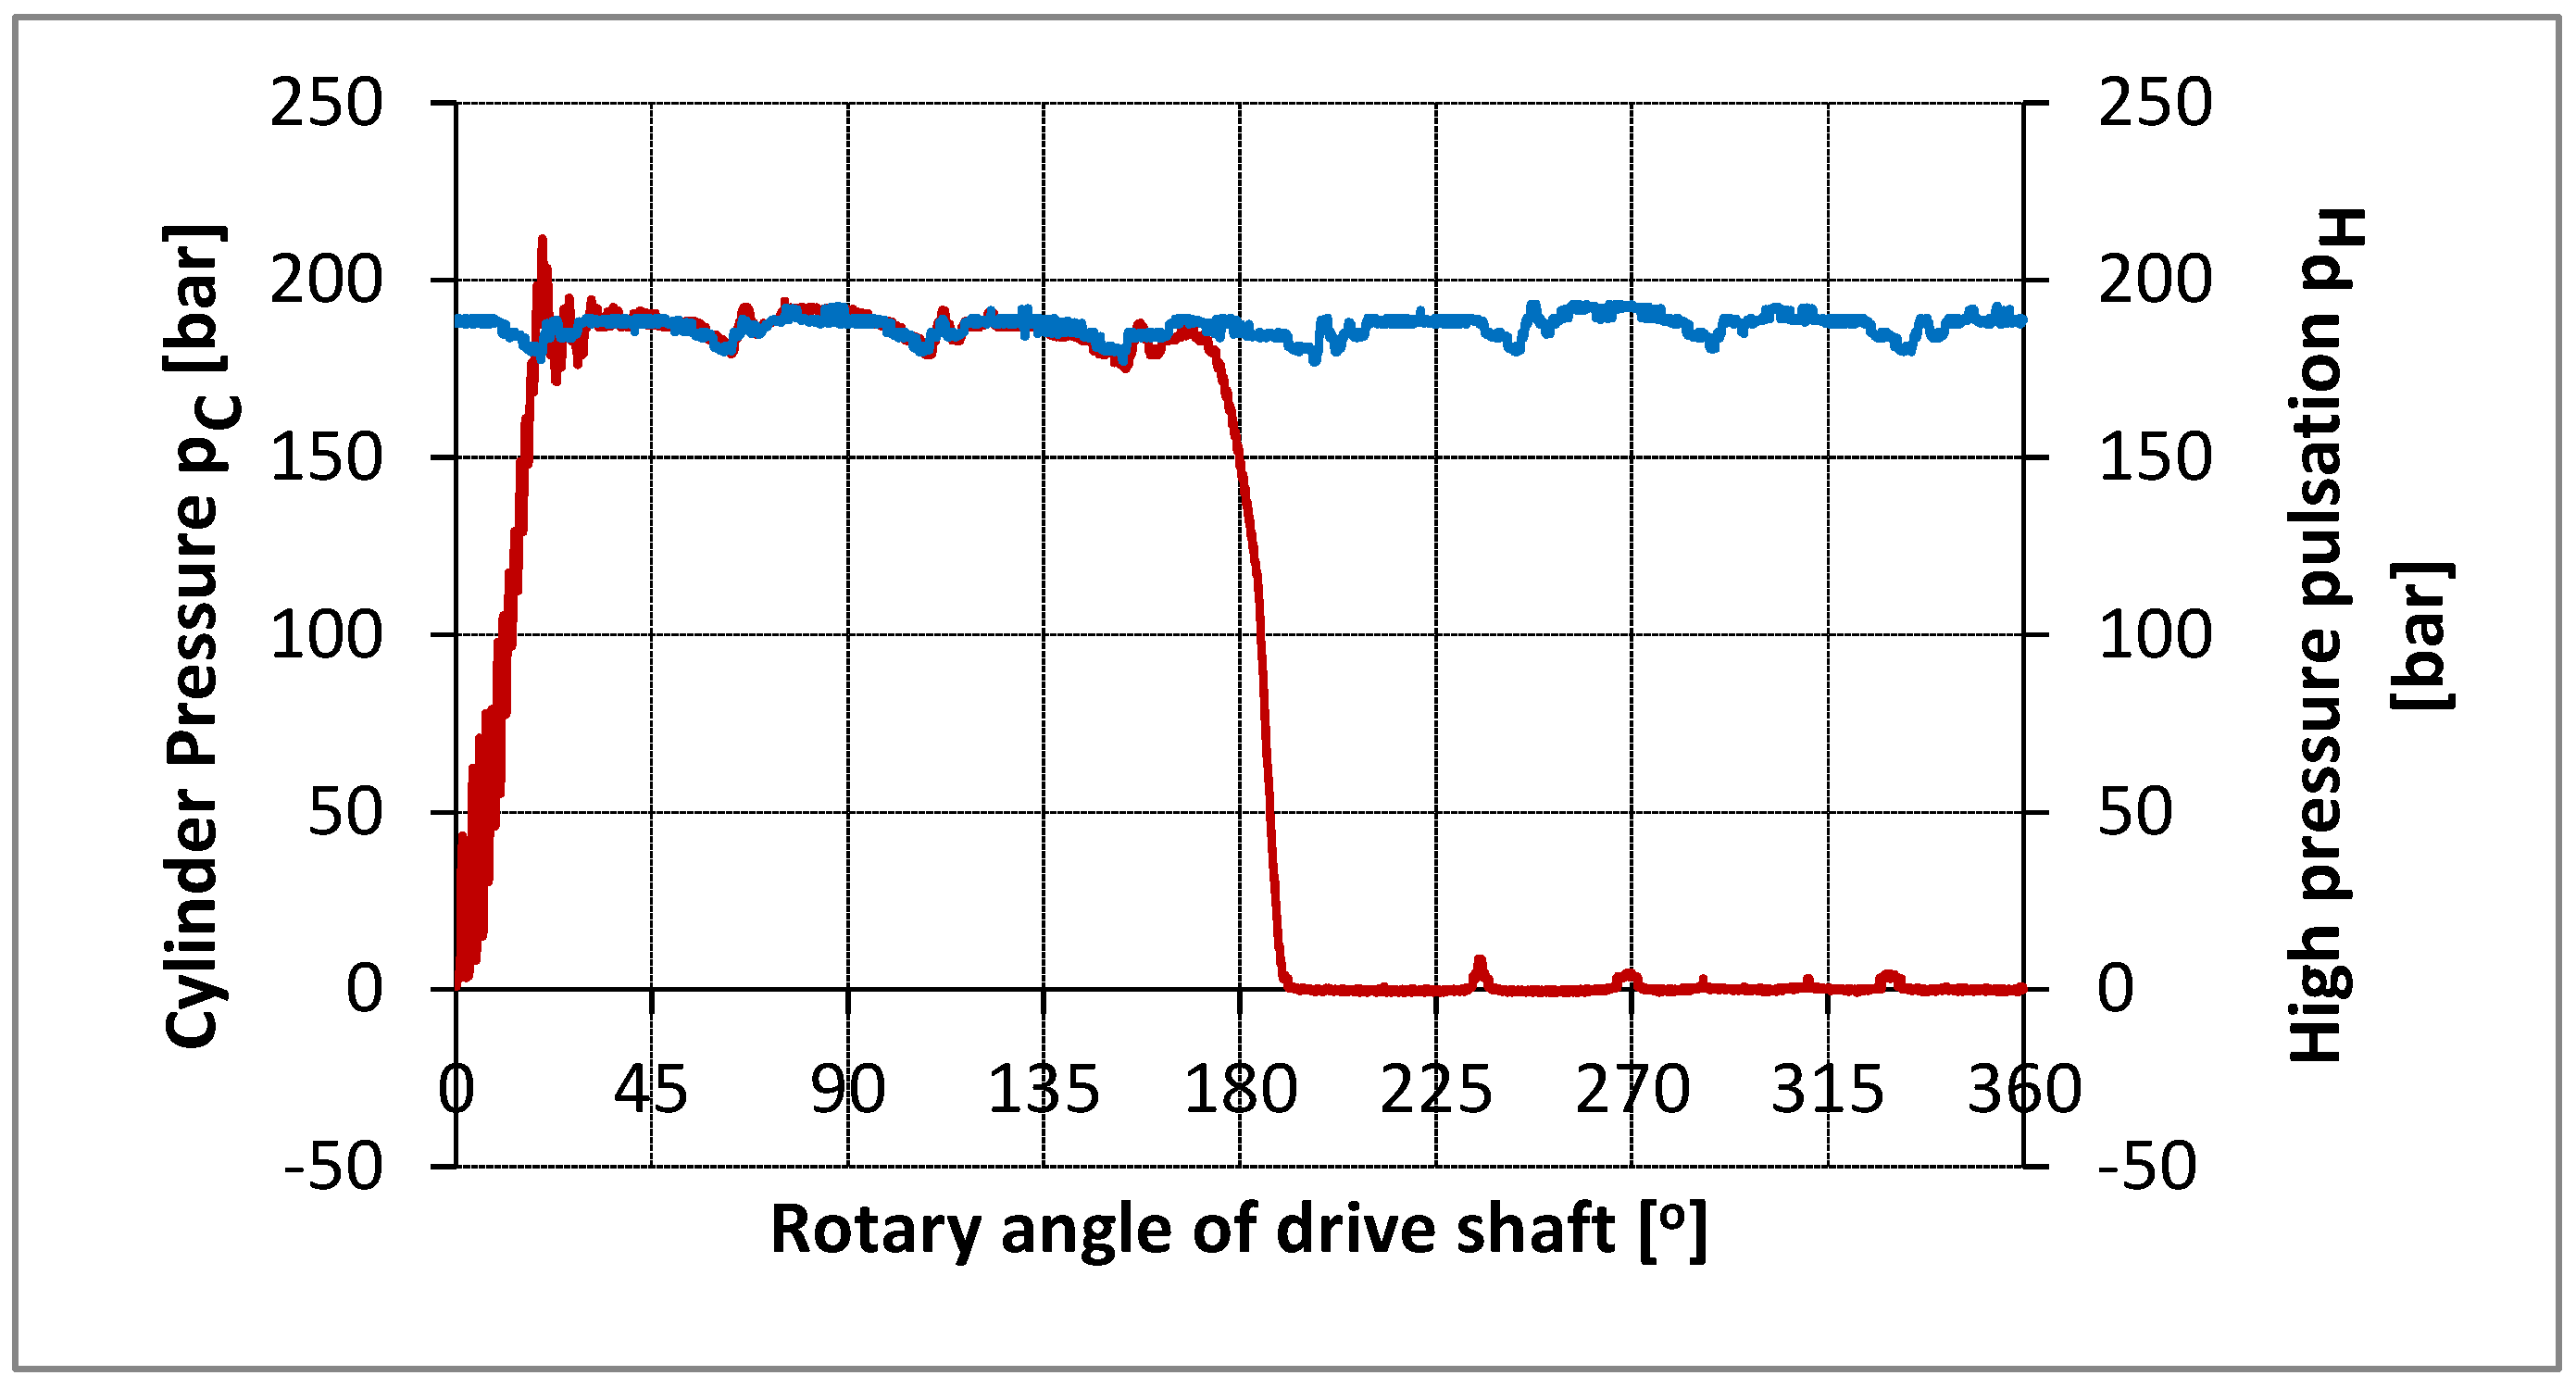
Figure 16.
The pressure history in the cylinder ( pc ) and delivery chamber ( ph ) for the average cycle.
Figure 16.
The pressure history in the cylinder ( pc ) and delivery chamber ( ph ) for the average cycle.
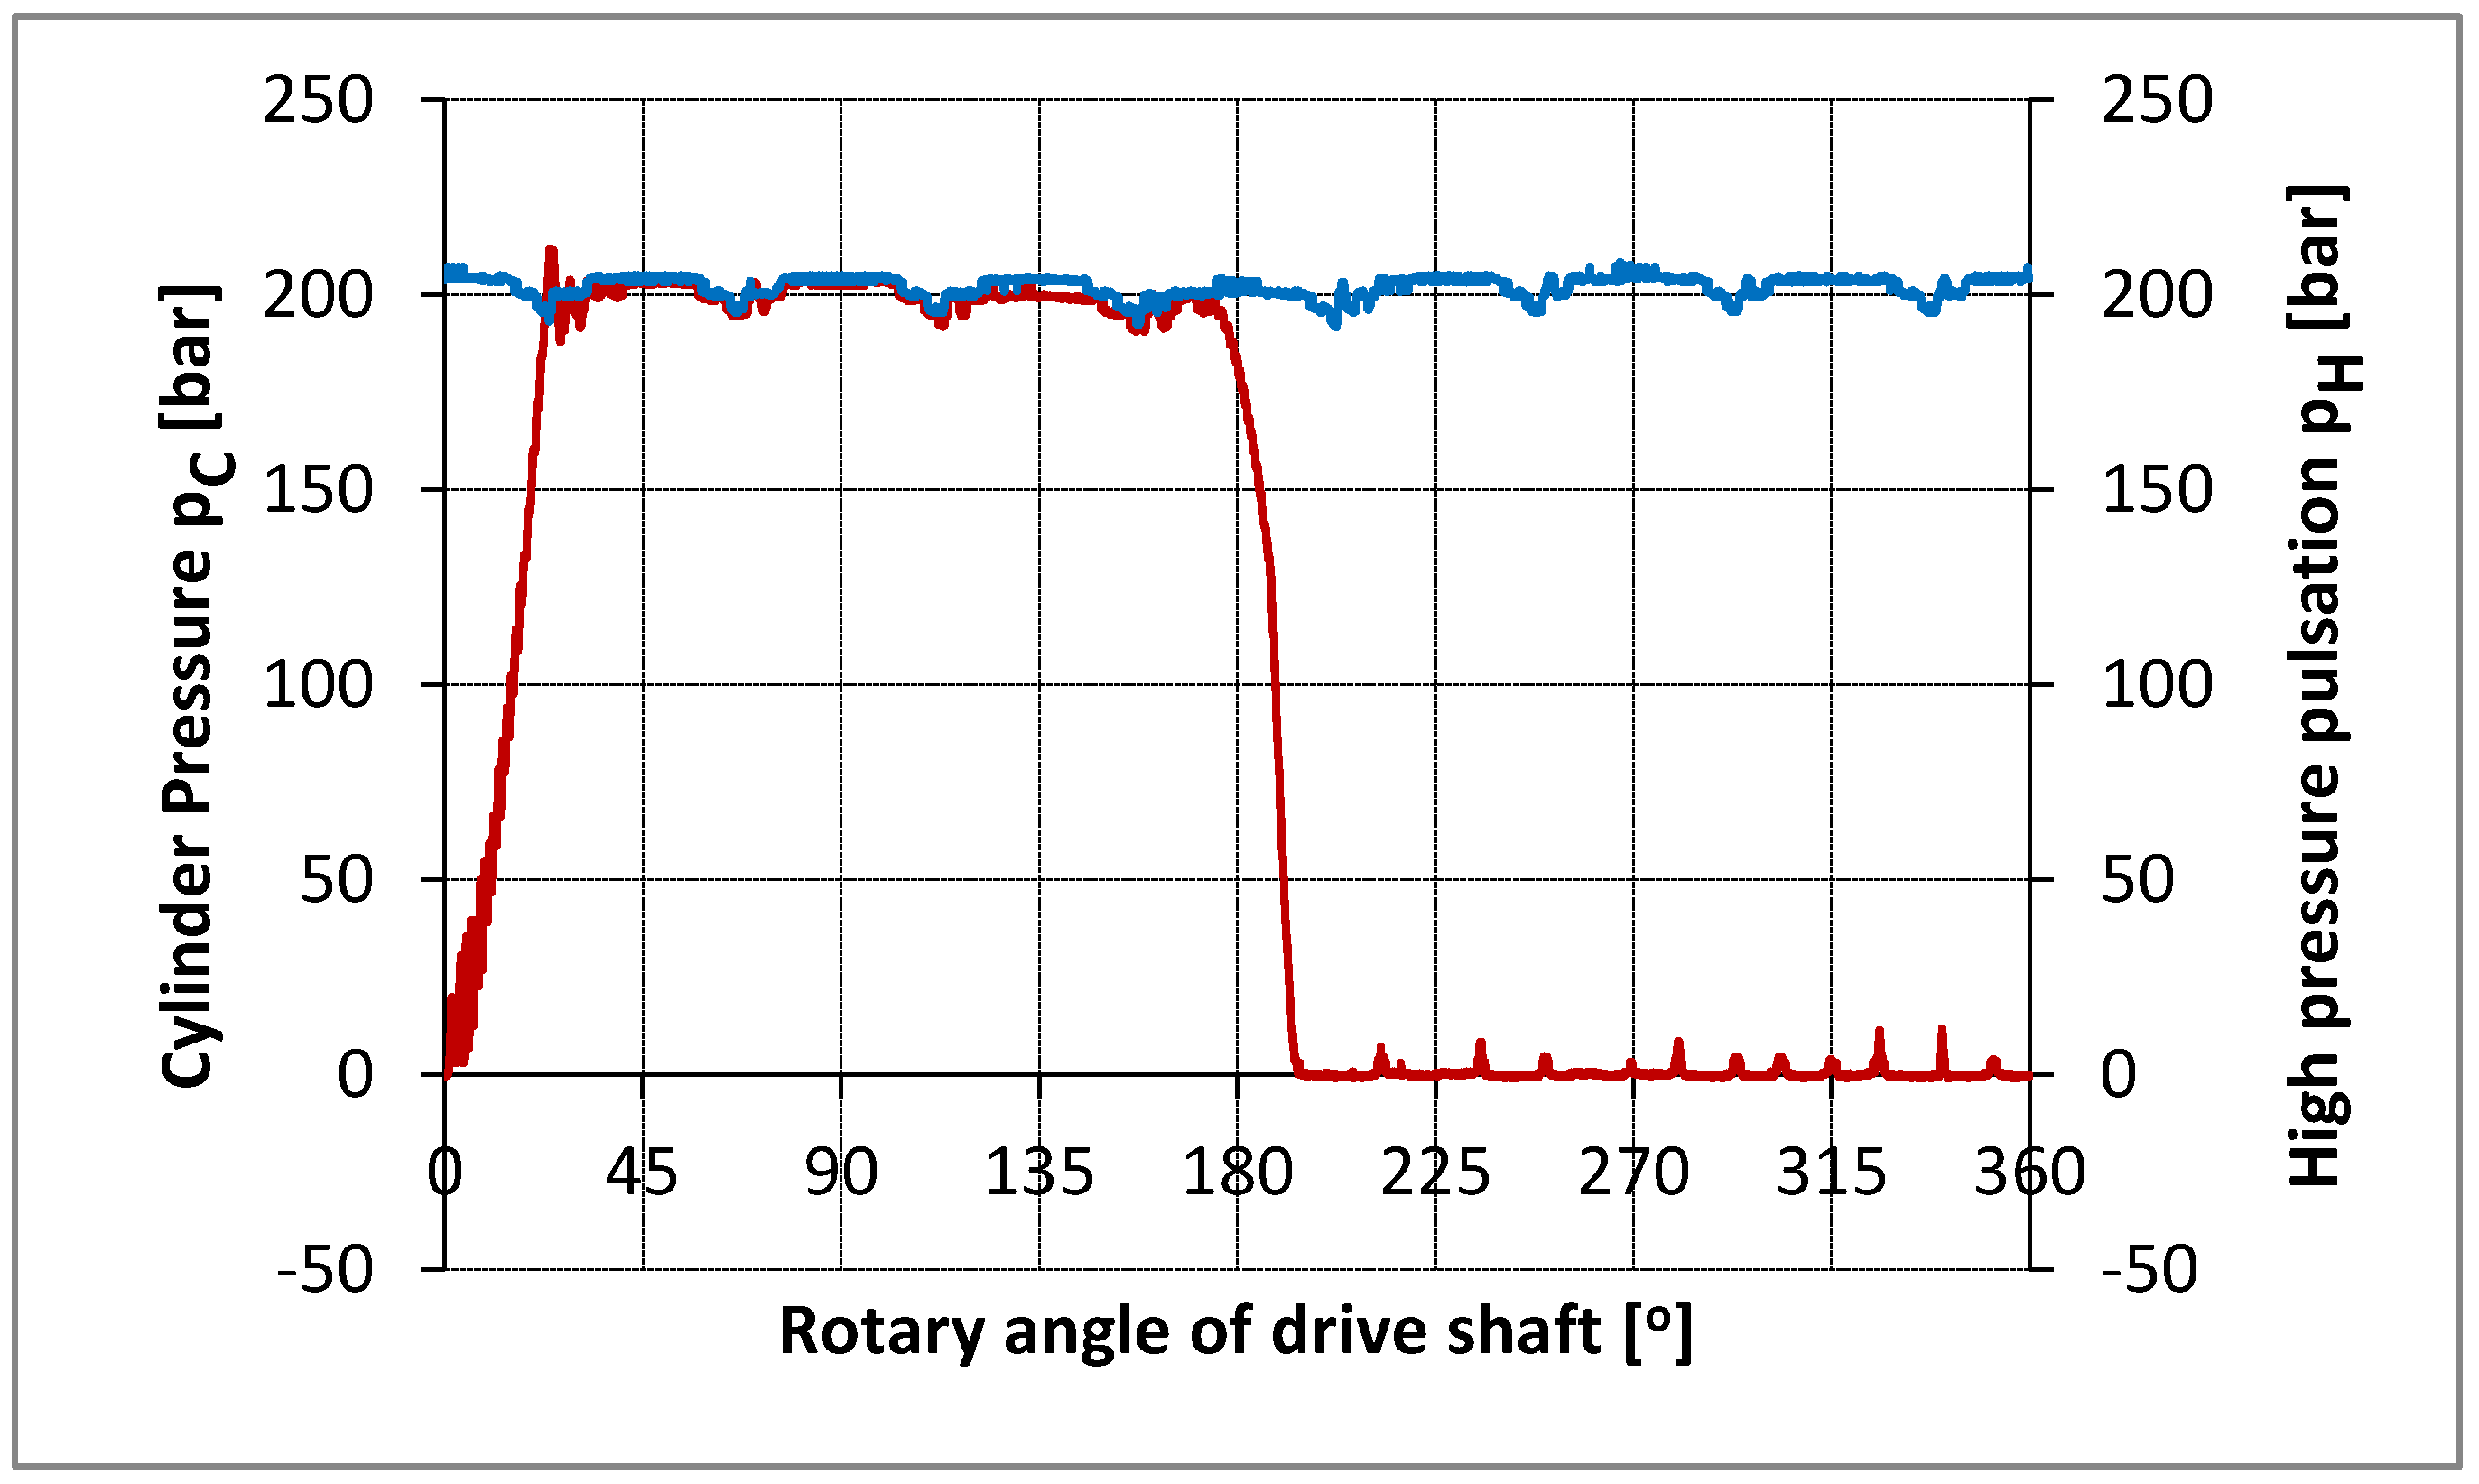
Figure 17.
The pressure history in the cylinder ( pc ) and delivery chamber ( ph ) for the average cycle.
Figure 17.
The pressure history in the cylinder ( pc ) and delivery chamber ( ph ) for the average cycle.
Disclaimer/Publisher’s Note: The statements, opinions and data contained in all publications are solely those of the individual author(s) and contributor(s) and not of MDPI and/or the editor(s). MDPI and/or the editor(s) disclaim responsibility for any injury to people or property resulting from any ideas, methods, instructions or products referred to in the content. |
© 2025 by the authors. Licensee MDPI, Basel, Switzerland. This article is an open access article distributed under the terms and conditions of the Creative Commons Attribution (CC BY) license (http://creativecommons.org/licenses/by/4.0/).
Copyright: This open access article is published under a Creative Commons CC BY 4.0 license, which permit the free download, distribution, and reuse, provided that the author and preprint are cited in any reuse.


