
Submitted:
03 March 2025
Posted:
05 March 2025
You are already at the latest version
Abstract
The dynamic behavior of heterogeneous materials, such as semiconductor materials, under impact loading is one of the experimental studies to improve the material properties. However, the non-uniformity of the material, such as grains and defects, is around 100 microns, which requires high-spatially resolved and high-dimensional measurement methods. In this paper, an area array fiber optic probe with 100-micron spatial resolution is designed, and the two-dimensional continuous measurement of the free surface velocity of heterogeneous materials is realized on the light gas gun platform with DISAR velocimetry technology. The dynamic behavior change process under different positions is obtained, which provides experimental data for the study of the impact response of polycrystalline materials.
Keywords:
dynamic behavior
; heterogeneous
; velocimetry
; area array
1. Introduction
As the core materials of modern electronic devices and solar cells, the study of semiconductor materials under shock loading is of great significance to improve their reliability and performance. As a typical semiconductor material, the dynamic deformation and fracture behavior of monocrystalline silicon under impact loading have been widely studied [1]. The results show that there are significant differences in the volume stress history and fracture mode of monocrystalline silicon when it is loaded in different crystalline directions. For example, in the split Hopkinson pressure bar experiment, with in-situ X-ray imaging and diffraction systems, the volume stress history can be measured and the Lowe diffraction pattern can be observed, revealing microstructural changes in the material under impact loading [2]. Semiconductor materials are susceptible to cracks and voids under impact loading, especially under thermal shock conditions [3]. The transient response study of cracked thermoelectric materials shows that the transient response of finite-sized TE (Thermoelectric) media with arbitrary positioning internal cracks can be analyzed by a thermo-mechanical coupling method, which is essential for engineering applications [4].
Due to the average effect of single-point velocity measurement in the spatio-temporal domain, the two-dimensional shock wave velocity field cannot be truly and comprehensively reflected [5]. The research progress of high spatially resolved area array velocity measurement technology in the field of shock wave mainly focuses on the use of area array CCD and CMOS image sensors for high-precision velocity measurement [6,7,8]. These technologies combine narrow-band filters, spatial filtering techniques, and differential detection techniques to accurately measure the velocity and displacement of moving targets [9]. The application of area array CCD and CMOS image sensors in velocity measurement has been widely studied [10]. For example, the spatial filtering velocimetry technology of area array CCD has been used to measure the velocity field distribution of particle flow, and the spatial filtering characteristics of multi-slit are simulated by interlaced sampling, so as to realize the optical non-contact measurement of particle velocity in obstacle flow. In addition, the spatial filter velocimetry (SFV) of the area array CCD does not need to track tracer particles, and only requires an ordinary LED light source, showing strong environmental adaptability and ease of operation [11,12,13].
In addition to area array CCD spatial filtering technology, laser interferometric velocimetry is also an important tool in shock wave physics research. Laser interferometers use the Doppler effect to measure the velocity of shock waves, which is characterized by high accuracy. For example, velocity interferometers (VISARs) on arbitrary reflective surfaces are commonly used to measure free-surface velocities, interface velocities, and particle velocities, among other things [14,15,16]. These measurements are of great significance for deriving the stress-strain state of materials and establishing a theoretical model of the state of matter. VISAR (Velocity Interferometer System for Any Reflector) requires highly reflective surfaces with high requirements for surface flatness and normal incidence, which is susceptible to noise interference, and requires complex optical setups and synchronized streak cameras [17]. DISAR (Displacement interferometer system for any reflector) is prone to introduce noise because it uses two signals to calculate the displacement and then differentially derive the velocity [18].
The study of the behavior of semiconductor materials under impact loading is a complex and diverse field, involving many aspects such as dynamic deformation, plastic behavior, damage mode and its anisotropy [19,20,21]. Through experiments and numerical simulation methods, the response mechanism of these materials under extreme conditions can be deeply understood, so as to provide a scientific basis for the design and optimization of semiconductor devices. Future research will further reveal the microscopic mechanism of semiconductor materials under impact loading [22,23,24].
In this paper, a high spatially resolved velocity measurement technique is used to obtain the dynamic response behavior of materials under impact loading (~8 GPa). Firstly, the spatial area measurement point distribution is realized by using the area array fiber close-row method and the coupling of optical lens group. Secondly, combined with the high-precision and continuous measurement characteristics of laser interferometry velocimetry, a high-spatially resolved area array velocity measurement technology is formed. Last, the mechanism of material inhomogeneity or anisotropy under impact loading was experimentally studied.
2. Materials and Methods
2.1. Area Array Fiber Optic Probes
Based on the fiber close-row array and optical lens, the laser transmitting and receiving integrated probe with spatial resolution is designed. The goal is a multi-point measurement system with a large stroke, and in order to improve the depth of field of the optical system, it is necessary to design a telecentric optical path structure with a small object numerical aperture. Single-mode fiber close-row array and optical lens group coupling technology is adopted. As shown in Figure 1 (a), the emitted spot of a single fiber probe is typically around 200 μm. When a material exhibits inhomogeneities such as polycrystalline or cracks, the entire spot area covers the differences caused by these inhomogeneities. This averages out these differences, and the final measured speed is an average. In order to improve the spatial resolution to measure the differences due to non-uniformity, multiple fibers were geometrically closely arranged to obtain an area array bundle, as shown in Figure 1 (b).
According to the principle of geometrical optics and measurement requirements, the optical lens is designed to be coupled with the fiber bundle, as shown in Figure 2 (b). A 19-core fiber bundle was selected, with a total of two turns except for one fiber in the center. In order to obtain a long working distance and a large depth of field, the selected optical lenses were parametrically optimized in the ZEMAX software. As shown in the Figure 2 (a), from left to right, are the fiber bundle, the lens, and the surface being measured. After optimization, the lens has a thickness of 2.05 mm and a diameter of 0.636 mm. Aspherical lens with a focal length of 5 mm. The actual probe obtained is shown in the Figure 2 (c).
The imaging effect can be seen from the point spread function (SPF) diagram, that is, the spot of the central fiber is optimal, and the spot far from the optical axis is distorted, as shown in Figure 3 (a). The "OBJ" and "IMA" in the point diffusion diagram represent the object plane and the image plane, respectively. In addition, it is possible to see the image quality of the imaging system at different fields of view, such as the difference in imaging between the off-axis field of view and the defocus plane. As shown in the Figure 3 (b), the spot is more rounded in the focal plane and on the optical axis. Off-axis spot aberrations are the largest, which also limits the number of area array fibers. The out-of-focus spot appears to be smaller and smaller in the direction of the light source, and conversely the spot is getting larger and larger. This also means that when measuring, don't move away from the length of the focal point.
The focal spot size and spacing of the 19-core area array fiber optic probe were measured under an optical microscope as shown in Figure 4 (a). The focal spot diameter is about 20 μm, and the distance between adjacent spots is about 120 μm. This also illustrates that the spatial resolution of the measurement point is about 120 μm. The spot size and energy distribution were observed under the spot analyzer, as shown in Figure 4 (b). The overall spot size is relatively uniform, and the energy difference between the channels is small.
2.2. Experimental System
The experimental test system is divided into a DISAR velocimeter, an oscilloscope and an area array fiber optic probe as shown in the Figure 5 (a). The experimental design is to drive the metal flyer to hit the non-uniform target material at high speed on the light air cannon loading platform, as shown in the Figure 5 (b). The center spot of the area array probe is aligned with the center of the non-uniform target, while the flyer is aligned with the target through the guide pipe. The target material to be tested is a disc with a diameter of 10 mm and a thickness of 2 mm. The velocity of the flyer is 428 m/s, which is obtained by multiple sets of magnetic guide coils. Meanwhile the velocity of the flyer is determined by the pressure of the compressed helium. Since the area array probe has 19 cores, the DISAR velocimeter corresponds to 19 channels. In order to avoid crosstalk of adjacent signals, the wavelengths of the four fibers next to each other are set differently. The inhomogeneous target material is polycrystalline, with a grain size of about 100 microns, which is just in line with the spatial resolution of the probe. Because laser velocity measurement requires that the measured surface can reflect enough intensity of signal light into the probe, the single-point exit light power of the probe should not be less than 50 mW, and the roughness of the measured surface should not be less than the laser wavelength (i.e., 1.5 μm).
3. Results and Discussion
The free-plane velocity curve obtained by the shock wave reflected many times in the inhomogeneous material as shown in Figure 6 (a). When the shock wave reaches the free surface of the target plate, the free surface velocity suddenly increases and reaches a loading plateau value (~420 m/s), which is due to the direct action of the shock wave. Subsequently, when the right-hand sparse wave head reflected from the free plane behind the flyer crosses the target plate to the free surface of the target plate, the free plane velocity begins to decrease. When the subsequent sparse wave reaches the free surface when the shock wave reflected at the laminar crack plane reaches the free surface, the free surface velocity jumps back from the lowest point (~290 m/s) to form the so-called pull-back signal. This bounce phenomenon indicates that the free-surface velocity reaches its lowest point and then rises rapidly, forming a significant peak as shown in Figure 6 (b). In the free-plane velocity profile, periodic oscillations are formed due to the reciprocating reflection of laminar fissure pulses in the laminar lobes. This oscillation reflects the multiple reflection and energy dissipation processes of the lamina pulse within the lamina lobe. Shock waves are reflected from the free surface to produce complex wave systems, including shock waves and sparse waves that are reflected multiple times. These wave systems form multiple incidences and reflections on the free plane, resulting in multiple jumps and bounces in the free plane velocity profile. The change of the velocity curve of the free surface can indirectly reflect the evolution dynamics of micro-damage in the material. For example, the occurrence of pull-back signals is closely related to the damage nucleation and propagation of inhomogeneous damage within the material. The effect of the non-uniformity of the material can be seen from the difference in the velocity curve of each measurement point. For example, the difference in the take-off time of different measurement points.
The spatial position of the area array fiber is added to the velocity curve, that is, the spatial position coordinate axis is extended, as shown in the Figure 7. Since the area matrix measurement points are distributed in two-dimensional space, the velocity coordinate axis only represents the relative value, that is, one grid represents 500 m/s. As a result, a continuous measurement of two-dimensional velocity was obtained, which was expanded from a single point to a surface velocity result.
4. Conclusions
The inhomogeneity of materials requires the use of highly spatially resolved two-dimensional velocity measurements. To this end, an area array fiber optic probe was designed to achieve a spatial resolution of 120 microns, and a continuous measurement of two-dimensional surface velocity was realized with DISAR velocimetry technology. In summary, the free surface velocity curves obtained by the multiple reflections of the shock wave in the metal material show the characteristics of loading platform, velocity jump, pull-back signal, periodic oscillation and complex multiple reflected wave system, and these characteristics are closely related to the damage evolution inside the material. The measurement of area velocity provides a more intuitive means for the study of the response behavior of the microstructure of materials under impact loading.
Funding
This research was funded by the National Natural Science Foundation of China, grant numbers 62101518, 52105195 and U2241276, and the Foundation of National Key Laboratory of Shock Wave and Detonation Physics, grant number JCKYS2022212001.
References
- J.Y. Huang, J.C. E, J.W. Huang, et al. Dynamic deformation and fracture of single crystal silicon: Fracture modes, damage laws, and anisotropy[J]. Acta Materialia, 2016, 114(1): P136-145. [CrossRef]
- C. L. Williams, C. Kale, S. A. Turnage, et al. Real-time observation of twinning-detwinning in shock-compressed magnesium via time-resolved in situ synchrotron XRD experiments[J]. Physical Review Materials, 2020, 4(8): P083603. [CrossRef]
- O. V. Menshykov, M. V. Menshykova, I. A. Guz. Effects of crack closure and friction for linear crack under normal impact[J]. Engineering Analysis with Boundary Elements, 2020, 115: P1-9. [CrossRef]
- P. Wang, B.L. Wang, K.F. Wang. Dynamic response of cracked thermoelectric materials[J]. International Journal of Mechanical Sciences,2019, 160(1): P298-306. [CrossRef]
- J.D. Weng, H. Tan, X. Wang, et al. Optical-fiber interferometer for velocity measurements with picosecond resolution[J]. Applied Physics Letters, 2006, 89: 111101. [CrossRef]
- G. Whiteman, G. D. Owen, J. De'Ath, et al. Spatially resolved measurements of grain size effects on the shock and spall response of quasi-Taylor wave loaded pure copper. Journal of Applied Physics, 2017, 122: 035106. [CrossRef]
- T.J. Vogler, W.M. Trott, W.D. Reinhart, et al. Using the line-VISAR to study multi-dimensional and mesoscale impact phenomena[J]. International Journal of Impact Engineering, 2008, 35: 1844-1852. [CrossRef]
- A.V. Mikhaylyuk, D.S. Koshkin, K.L. Gubskii, et al. Line-imaging VISAR for laser-driven equations of state experiments[C]. J. Phys.: Conf. Ser., 2016, 774: 012057.
- K. Zhou, Y. P. Huang, E. Chen, et al. Real-Time Detection and Spatial Segmentation of Difference Image Motion Changes[J]. IEEE Access,2020, 8(1): P144931-144944. [CrossRef]
- B. Sheng, J. C. Huang, H. F. Ji, et al. A New Contactless Cross-Correlation Velocity Measurement System for Gas–Liquid Two-Phase Flow[J]. Sensors,2023, 23(10): 4886. [CrossRef]
- D.M. Rocha, F.T. Kanizawa, K. Hayashi, et al. Velocity field characterization of single-phase flows across a tube bundle through spatial filter velocimetry[J]. Experimental Thermal and Fluid Science, 2023, 147(1): 110947.
- Z.P. Chi, H. Yang, R. Li, et al. Measurements of unconfined fresh concrete flow on a slope using spatial filtering velocimetry[J]. Powder Technology,2021, 393(1): P349-356. [CrossRef]
- M. Schaeper and N. Damaschke. Fourier-based layout for grating function structure in spatial filtering velocimetry[J]. Measurement Science and Technology, 2017, 28(5): 055008. [CrossRef]
- P. M. Celliers, D. K. Bradley, G. W. Collins, et al. Line-imaging velocimeter for shock diagnostics at the OMEGA laser facility[J]. Rev. Sci. Instrum., 2004, 75: 4916. [CrossRef]
- D.E. Fratanduono, J.H. Eggert, T.R. Boehly, et al. Internal target reflections and line-imaging velocimetry[J]. High Energy Density Physics, 2014, 11:26-29. [CrossRef]
- M.E. Glinsky, M.R. Weis, A.J. Thompson, et al. Line VISAR measurements of energy deposition for next generation MagLIF laser preheat at NIF[C]. IEEE International Conference on Plasma Science (ICOPS), 2021.
- L. M. Barker, R. E. Hollenbach. Laser interferometer for measuring high velocities of any reflecting surface[J]. Journal of Applied Physics, 1972, 43(11):4669. [CrossRef]
- J. D. Weng, H. Tan, X. Wang, and et al. Optical-fiber interferometer for velocity measurments with picosecond resolution [J]. Rev. Sci. Instrum., 2006, 89, 111101. [CrossRef]
- J. Pawlicki, Z. Stanik, A. Płachta, et al. A New Method of Testing the Dynamic Deformation of Metals[J]. Materials, 2021, 14(12): P3317. [CrossRef]
- .L. Eksergian. The Plastic Behavior of Metal in Drawing[J]. Journal of Fluids Engineering,2023, 48: P609. [CrossRef]
- O. Deluigi, N. Amigo, F.J. Valencia, et al. Plastic behavior of a nanoporous high-entropy alloy under compression[J]. Computational Materials Science, 2023, 226(1): 112241. [CrossRef]
- K. Chatterjee, V. Arumuru, D. Patil, et al. Multipoint monitoring of amplitude, frequency, and phase of vibrations using concatenated modal interferometers. Sci Rep ,2022, 12: 3798. [CrossRef]
- K. Van Acoleyen, H. Rogier, R. Baets. Two-dimensional optical phased array antenna on silicon-on-insulator[J]. Opt Express, 2010, 18(13):13655-60. [CrossRef]
- U. Das, H. Mishra, Z. Mallick, et al. Insight of the high switching window and data retention in lead-free 2D layered double perovskite resistive memory device[J]. Appl. Phys. Lett. 2023, 123 (20): 203505. [CrossRef]
Figure 1.
(a) Average effect measured with a single probe; (b) Geometric close-packed area array bundles
Figure 1.
(a) Average effect measured with a single probe; (b) Geometric close-packed area array bundles
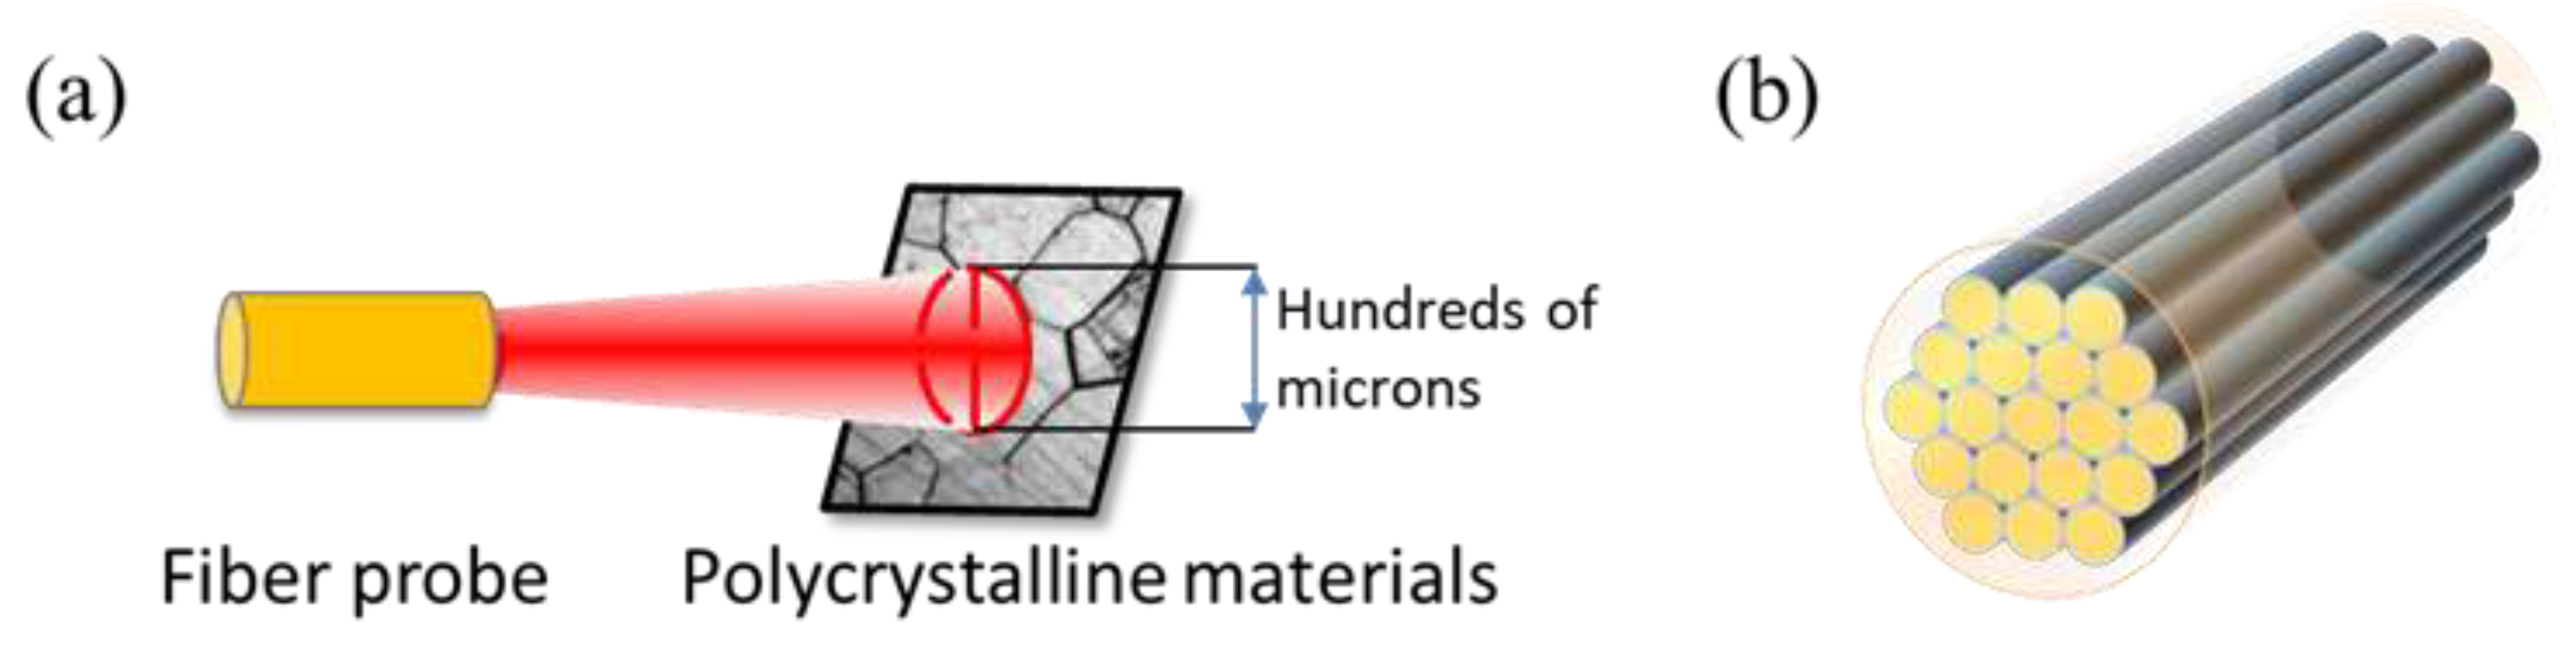
Figure 2.
(a) Diagram of the 3D optical system of an area array fiber optic probe; (b) Ray tracing diagram of the optical system; (c) Physical diagram of the fiber optic probe.
Figure 2.
(a) Diagram of the 3D optical system of an area array fiber optic probe; (b) Ray tracing diagram of the optical system; (c) Physical diagram of the fiber optic probe.
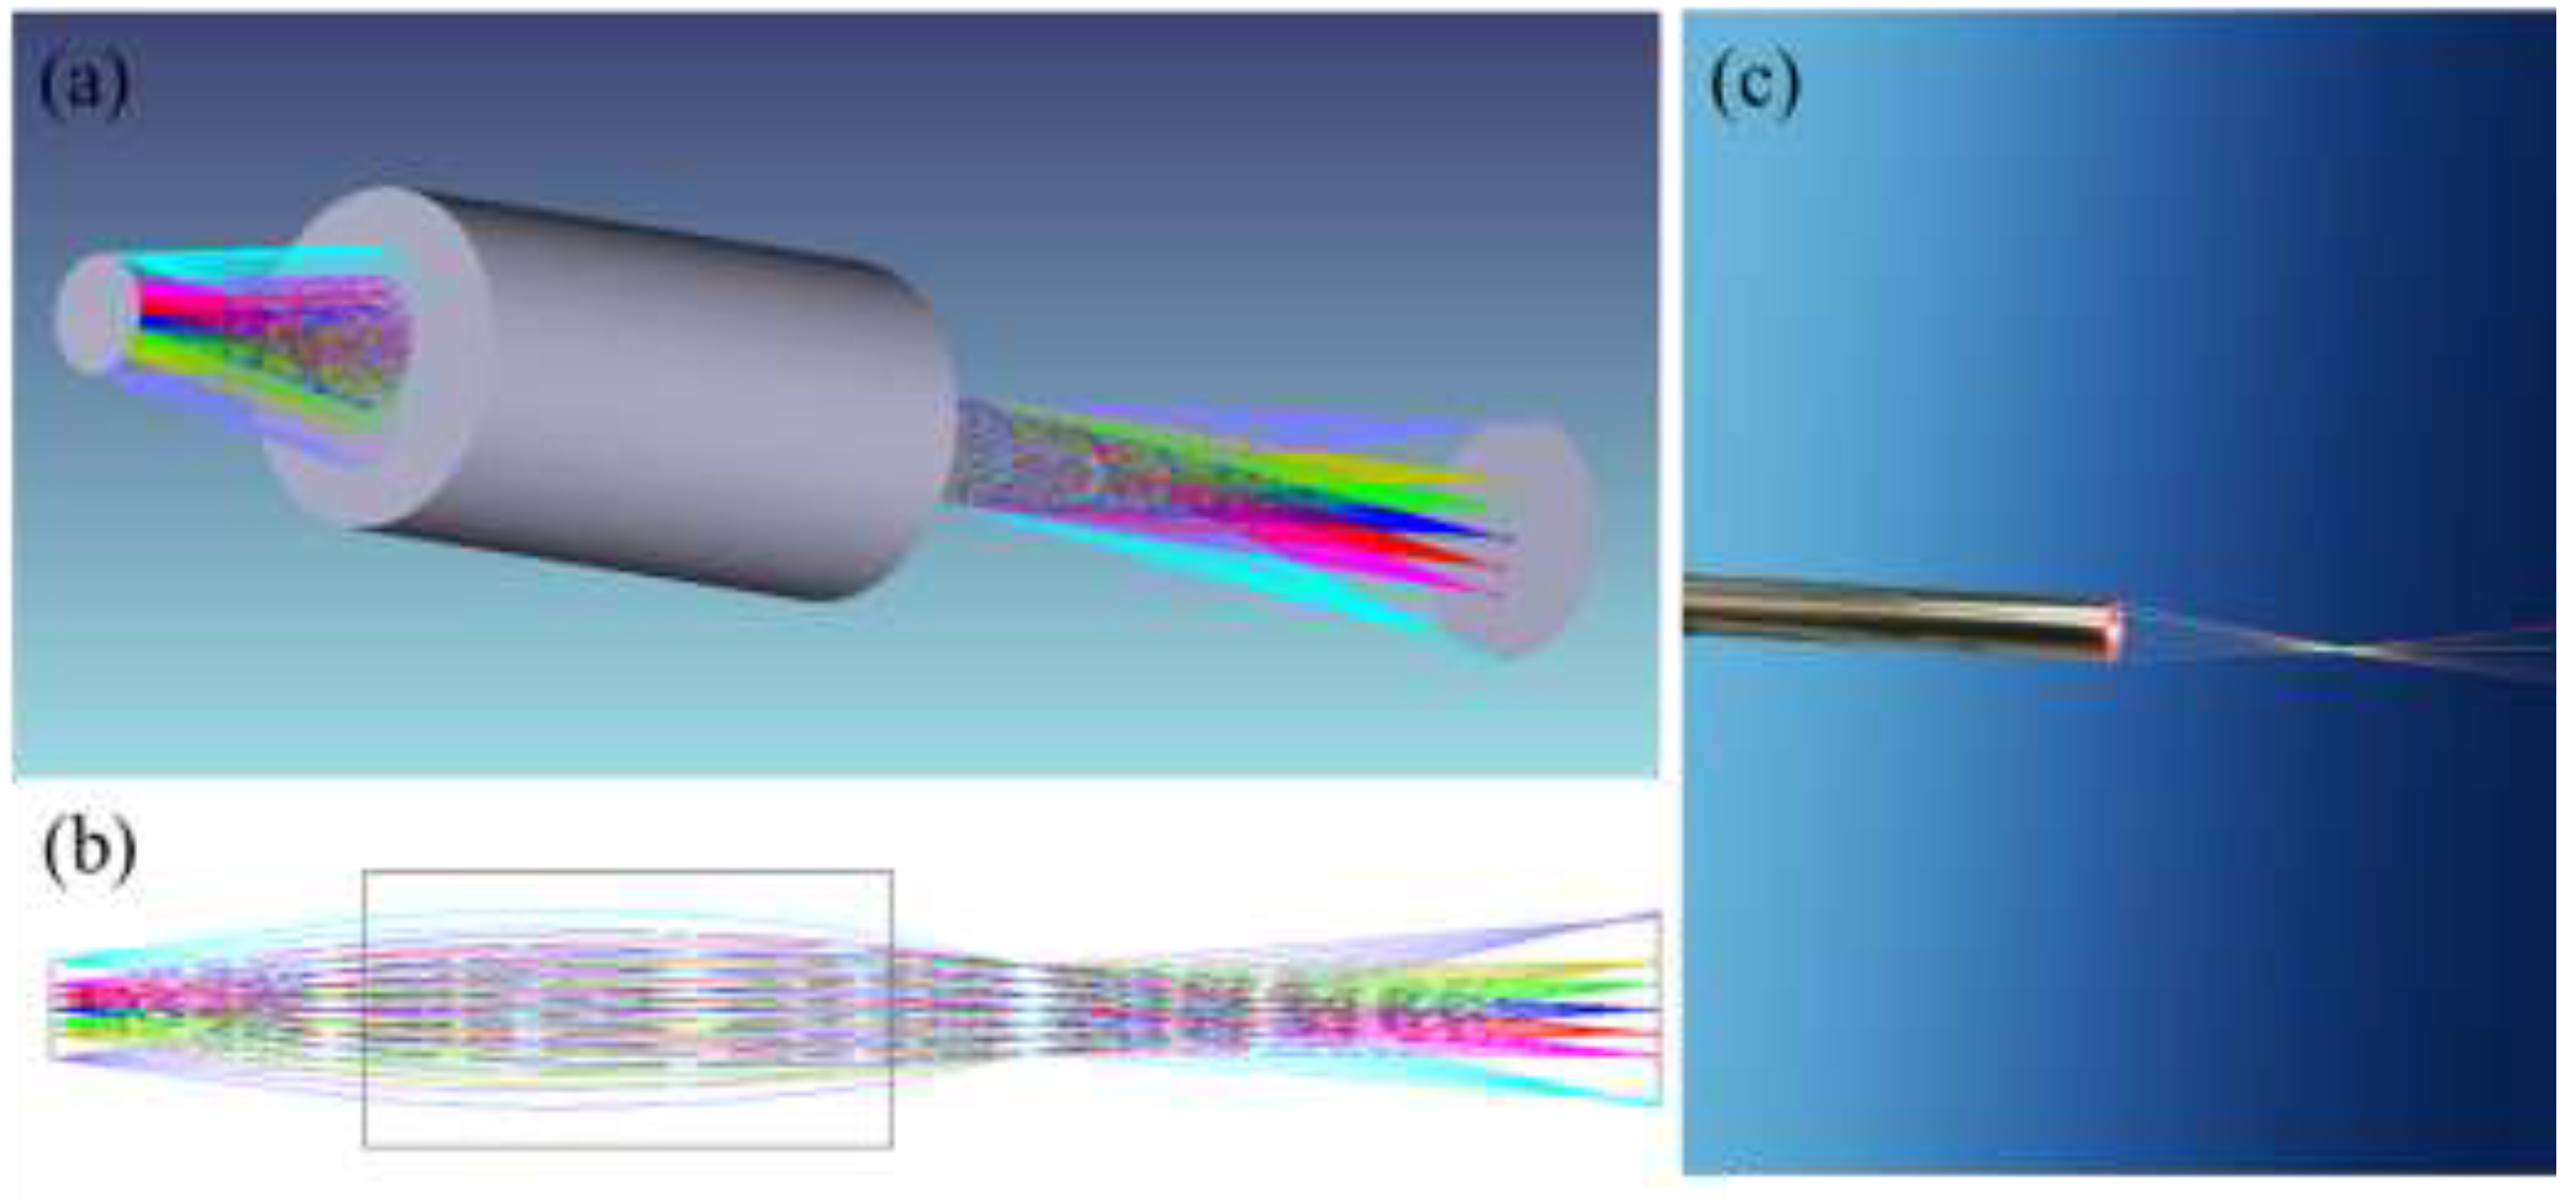
Figure 3.
(a) point spread function (SPF) diagram at the focal point; (b) SPF diagram at different defocus distances.
Figure 3.
(a) point spread function (SPF) diagram at the focal point; (b) SPF diagram at different defocus distances.
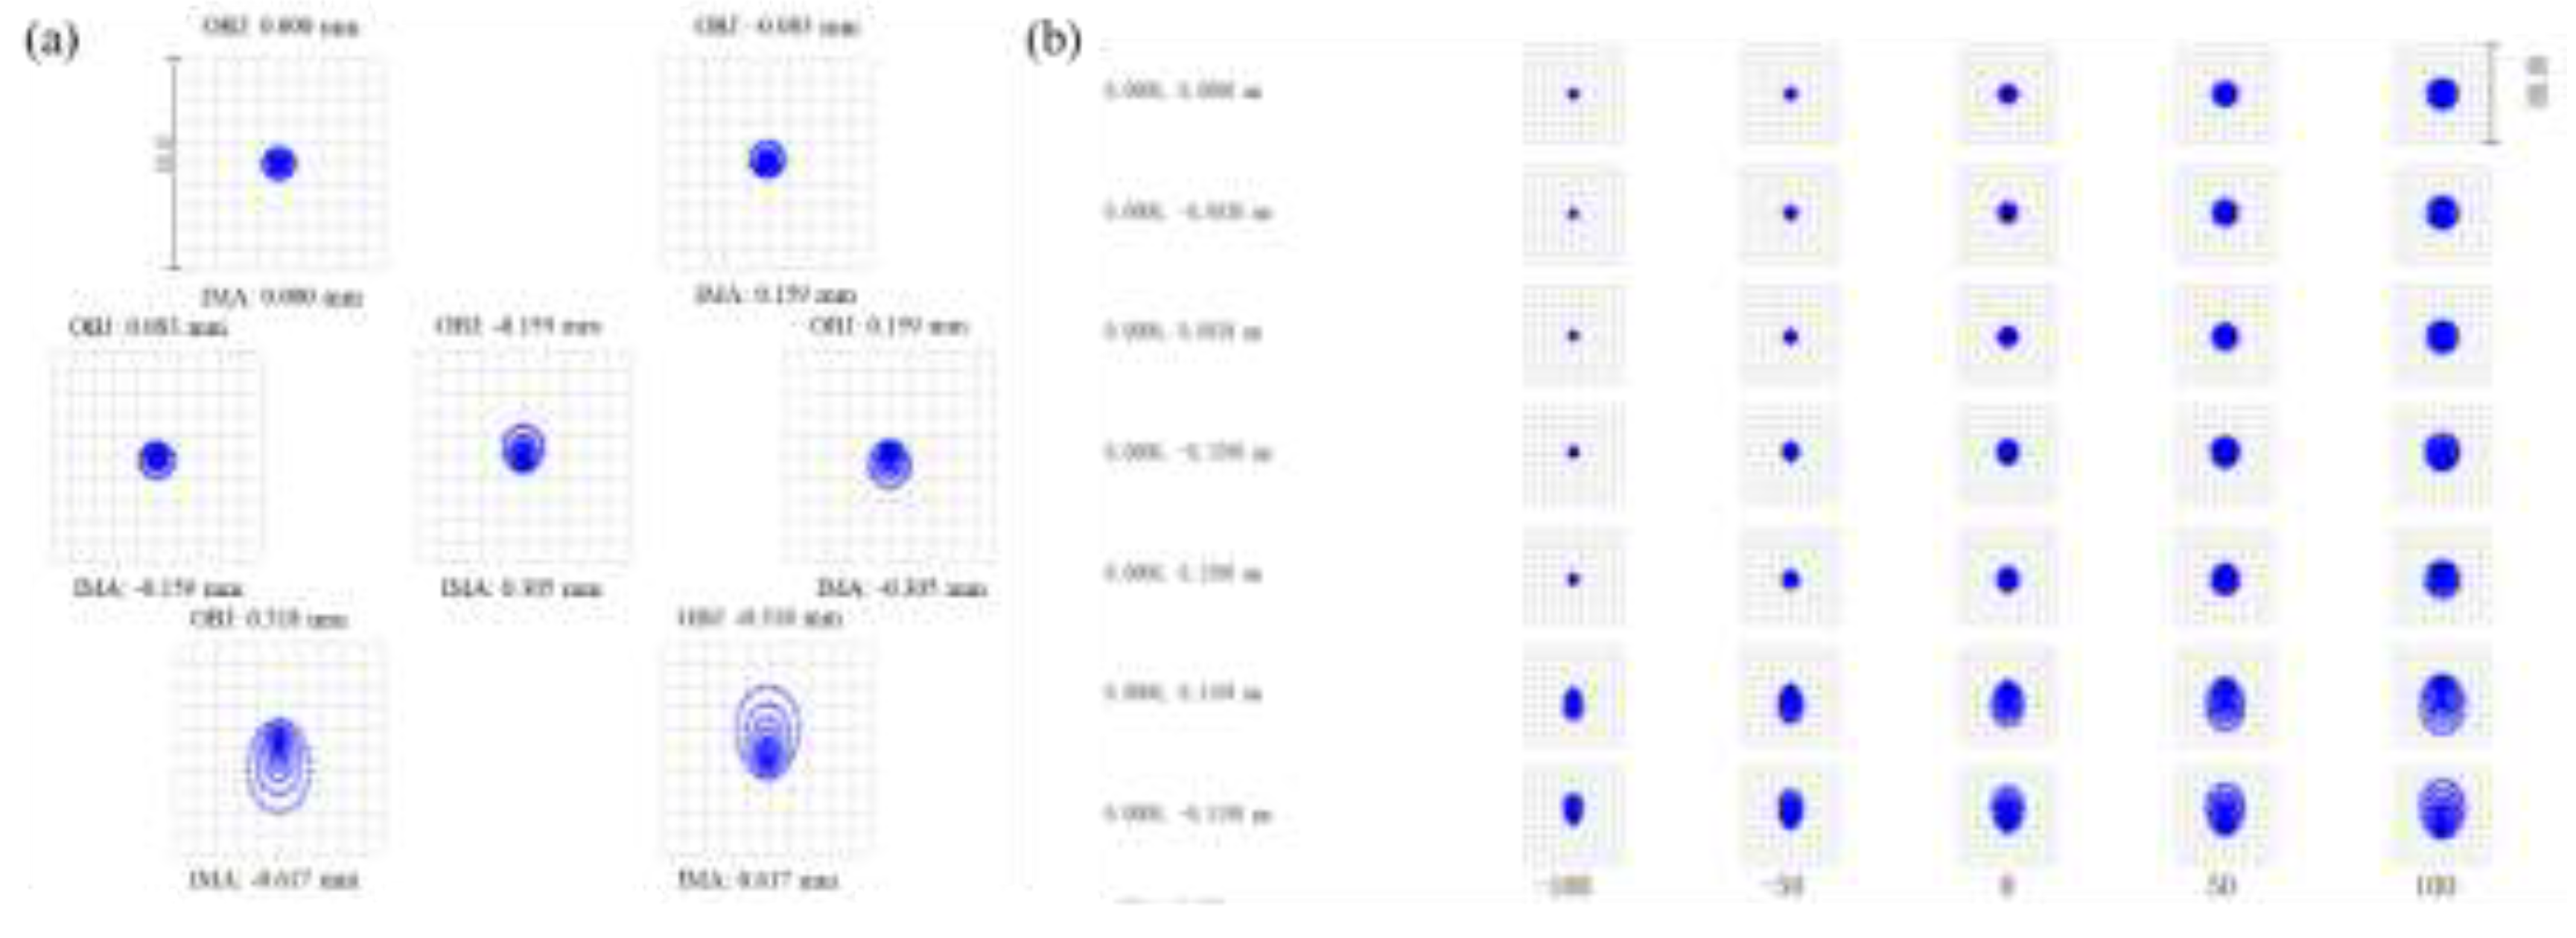
Figure 4.
(a) Microscope photograph of an area array spot; (b) Photograph of the light intensity of the area array spot.
Figure 4.
(a) Microscope photograph of an area array spot; (b) Photograph of the light intensity of the area array spot.
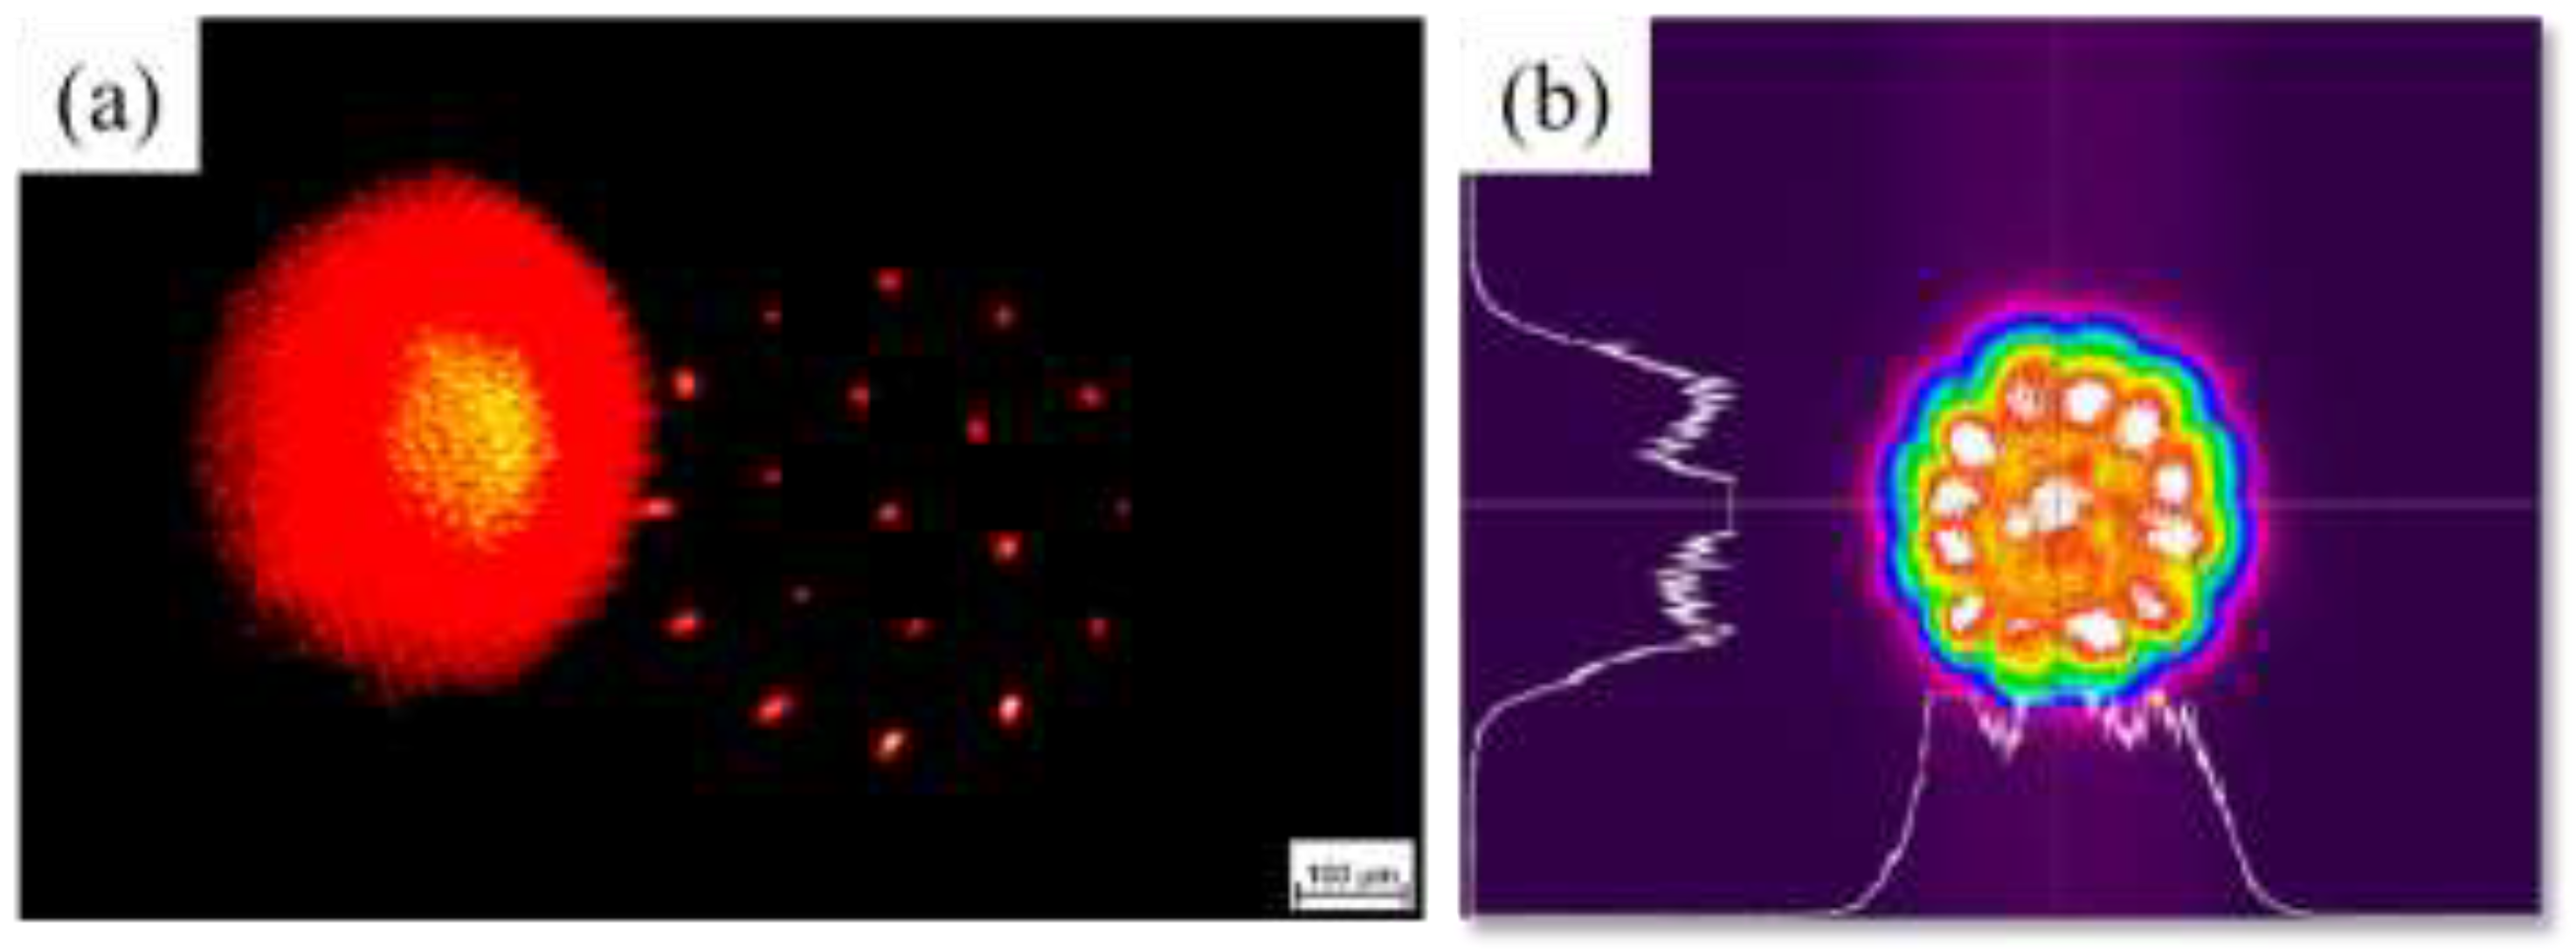
Figure 5.
(a) The experimental test system; (b) Experimental setup and loading platform.
Figure 6.
(a) 19 free-surface velocity curves; (b) Partial enlarged view in a red box.
Figure 7.
19 area array velocity curves
Disclaimer/Publisher’s Note: The statements, opinions and data contained in all publications are solely those of the individual author(s) and contributor(s) and not of MDPI and/or the editor(s). MDPI and/or the editor(s) disclaim responsibility for any injury to people or property resulting from any ideas, methods, instructions or products referred to in the content. |
© 2025 by the authors. Licensee MDPI, Basel, Switzerland. This article is an open access article distributed under the terms and conditions of the Creative Commons Attribution (CC BY) license (http://creativecommons.org/licenses/by/4.0/).
Copyright: This open access article is published under a Creative Commons CC BY 4.0 license, which permit the free download, distribution, and reuse, provided that the author and preprint are cited in any reuse.


