
Submitted:
04 March 2025
Posted:
04 March 2025
You are already at the latest version
Abstract
Accurate tomato yield estimation and ripeness monitoring are critical for optimizing greenhouse management. While manual counting remains labor-intensive and error-prone, this study introduces a novel vision-based framework for automated tomato counting in standardized greenhouse environments. The proposed method integrates YOLOv8-based detection, depth filtering, and an inter-frame prediction algorithm to address key challenges such as background interference, occlusion, and double-counting. Our approach achieves 97.09% accuracy in tomato cluster detection, with mature and immature single-fruit recognition accuracies of 92.03% and 91.79%, respectively. The multi-target tracking algorithm demonstrates a MOTA (Multiple Object Tracking Accuracy) of 0.954, outperforming conventional methods like YOLOv8+DeepSORT. By fusing odometry data from an inspection robot, this lightweight solution enables real-time yield estimation and maturity classification, offering practical value for precision agriculture.
Keywords:
agricultural robotics
; computer vision
; multiple objects tracking
; tomato counting
; yield estimation
1. Introduction
Accurate and efficient tomato counting is crucial for optimizing greenhouse management, enabling strategic picking schedules, yield prediction, and informed sales strategies. Traditional manual counting, while providing a baseline, is labor-intensive, costly, and prone to errors, particularly within the confined spaces of commercial greenhouses. Farmers in large operations can spend more than 20 hours per week on manual counting, incurring labor costs of approximately 15% per season and experiencing error rates as high as 35%. These inefficiencies highlight the need for automated solutions.
Computer vision and deep learning have emerged as promising tools for crop recognition in agriculture [1,2]. Deep learning-based object detection methods are gradually becoming the mainstream in computer vision. Object detection algorithms like YOLO [3], Faster-RCNN [4], and image segmentation algorithms such as Mask-RCNN [5] and Yolact [6], have been applied to various agricultural tasks. For instance, YOLO-tomato [7] improved tomato detection accuracy using circular detection frames.
However, these methods often struggle with the specific challenges of greenhouse environments, including: (1) Occlusion: Overlapping tomato clusters and leaves obscure individual fruits, leading to undercounting. (2) Variable Lighting: Fluctuations in natural light and shadows create inconsistencies in image appearance, affecting detection accuracy. (3) Real-time Performance: Deploying computationally intensive algorithms like Mask-RCNN [11] on resource-constrained mobile robots can be challenging.
Multi-objective tracking algorithms, originally developed for applications like pedestrian and vehicle counting [12], have been adapted for use in fruit counting and yield prediction. Algorithms such as DeepSORT [13] and FairMOT [14] have undergone continuous refinement, extending their utility to agriculture. Rong JC et al.[15] from China Agricultural University proposed a dual-channel fused YOLOv5-4D object detection network to achieve precise filtering of background tomatoes, while realizing high detection rates and high mAP in tomato counting through the integration of the ByteTrack multi-object tracking algorithm. Zhongxian Qi et al. adopted a NanoDet lightweight detector and integrated patrol-based counting with maturity detection, achieving accuracy rates of 92.79% and 90.84% for counting and maturity detection respectively[16]. Yuhao Ge et al. [17] introduced a visual object tracking network named YOLO-DeepSORT, designed to identify and count tomatoes at different growth stages. Zan Wang and Yiming Ling et al. improved the Faster R-CNN model by introducing an aggregation network and utilizing RolAlign to obtain more accurate bounding boxes, demonstrating that this method can overcome the effects of branch occlusion and fruit overlap[18]. Addie Ira Borja Parico et al. [19] applied YOLOv4 and DeepSORT to develop a robust real-time pear counter, noting limitations due to flickering in detection. A YOLOv4-based tomato detection model was developed to enhance detection accuracy in natural environments. Taixiong Zheng et al. constructed a novel backbone network, R-CSPDarknet53, by integrating residual neural networks, which improved the accuracy and recall rates of tomato detection in natural environments to 88% and 89% respectively[20].
To address these limitations, this paper presents a novel and computationally efficient tomato counting framework for a self-propelled greenhouse inspection robot. The key contributions are:
Sensor Fusion for Robust Tracking: We integrate YOLOv8-based fruit detection with IMU-derived odometry to predict fruit positions between frames, thereby improving tracking accuracy and reducing ID switches, particularly in challenging lighting conditions. Unlike purely vision-based tracking methods, our approach leverages motion information to maintain object identities even during brief occlusions.
Depth-Aware Post-Processing for Accurate Counting: We introduce a post-processing method based on depth filtering and occlusion analysis. This approach effectively removes background tomatoes, mitigates the impact of overlapping fruits on counting accuracy, and compensates for fruits at the edge of the image.
Experimental Validation and Performance Improvement: We validate the proposed framework on a real-world greenhouse dataset, demonstrating a 37.20% improvement in MOTA (Multiple Object Tracking Accuracy) and a 16.85% reduction in single fruit counting error compared to a Density Estimation baseline.
The dataset collection and tomato counting process is executed by a self-propelled greenhouse inspection robot. The robot navigates autonomously along a pre-defined track while utilizing a camera system capable of performing tasks such as dataset collection and counting.
The remainder of this paper is structured as follows: Section 2 details the materials and methods used in our approach, including the robot platform, sensor system, and algorithms. Section 3 presents the experimental results and compares our approach to existing methods. Section 4 discusses the implications of our findings and outlines directions for future research. Finally, Section 5 concludes the paper.
2. Materials and Methods
2.1. Data Acquisition and Preparation
The image dataset was collected from a commercial greenhouse (NiJiaWan greenhouse,Suzhou City, Jiangsu Province, 120.62°E, 31.32°N). As illustrated in Figure 1, tomatoes were cultivated in a typical ridge formation, with rows spaced 80-95 cm apart and individual plants spaced 25-35 cm apart along each ridge. Mature tomato fruits are typically found within a height range of 50cm-160cm above the ground, following the standard agronomic practices. A 60-meter-long track is positioned between the two ridges, facilitating the movement of inspection robots. The greenhouse environment is controlled by an automated system that ensures the tomato crop is grown in optimal conditions, maintaining consistent growth rates and ripening.
Image data were captured using a Realsense D435i depth camera mounted on the inspection robot. The camera captured color images and aligned depth images at a resolution of 1080×720 pixels. To minimize motion blur, the robot moved at a constant speed of 0.1 m/s, and the camera acquired images at a frame rate of 5 frames per second. Data was collected during three periods each day (6:00-8:00 AM, 12:00-14:00 PM, and 16:00-17:00 PM) between October and December 2024 to caputure diverse weather and lighting conditions. Over the three-month period, approximately 80 GB of image data were collected. A subset of 3000 images, representing diverse backgrounds and varying fruit ripeness levels, were selected for manual labeling.
The image data were labeled twice using Labelme. First, tomato clusters were identified and labeled with rectangular bounding boxes. Second, individual fruits within each clustere were labeled, distinguishing between immature (green) and mature (red) fruits based on color (Figure 2). Labeling criteria excluded: (1) background tomatoes on opposite or adjacent ridges to avoid confusion; (2) tomatoes partially occluded by the image edge to ensure complete object representation; and (3) tomatoes entirely outside the image boundary. The labeled datasets were cross-checked by two independent annotators to ensure data quality.
To enhance the convolutional neural network (CNN) model’s robustness and generalizability, data augmentation techniques were applied, including horizontal flipping, random translation (up to 10% of image width/height), and random rotation (up to 10 degrees). This resulted in a final dataset of 15,000 images for tomato clusters and 15,000 images for individual fruits.
2.2. Inspection Robot and Sensor system
The self-propelled greenhouse inspection robot (Figure 3) consists of three main components: (1) a sensor suite, (2) a lifting rod, and (3) a mobile chassis. Table 1 summarizes the key specifications of the robot.
The sensor suite includes three RealSense D435i depth cameras, which captures both color and depth images. The cameras are mounted on a motor platform that allows for 360° rotation, enabling comprehensive data collection. Three cameras were evenly arranged on the rotating platform along the height direction of the plant, and each camera was responsible for capturing images of the top, middle and lower parts of the plant. The tomato fruits in this study were all located in the lower part of the plant, and we only used the lower camera for image acquisition work. The chassis uses a two-wheel drive system with four driven wheels for enhanced stability. It navigates within the greenhouse using a ground marking and RFID tags, allowing it to seamlessly transition between concrete pavement and greenhouse tracks. The onboard IMU and RFID tags provide odometry data, enabling the robot to estimate its position and orientation within the greenhouse. This odometry data is crucial for the sensor fusion approach described in Section 2.3.3.
To ensure optimal visibility of the tomatoes, the camera's central axis was aligned perpendicular to the ridge plane at a distance of 40-50 cm. The lower camera at a height of 165 cm from the ground. These parameters were determined empirically to maximize the number of visible fruits while minimizing occlusion from leaves and other plants.
2.3. Algorithms
This paper introduces a visual inspection system for automatic tracking and counting of tomato clusters and individual fruits. The system comprises three main modules: (1) target detection, (2) information extraction, and (3) multi-target tracking.Tomato Detection Network YOLOv8, a single-stage object detection model, was used to identify both tomato clusters and individual fruits. YOLOv8 was chosen for its balance of accuracy and speed, making it suitable for real-time deployment on the robot's embedded computing platform. Zhou et al. [21] have previously validated the effectiveness of YOLO in greenhouse tomato inspection. Two YOLOv8 models were trained: one for detecting tomato clusters and another for detecting individual fruits (both mature and immature). The tomato cluster detection model identifies regions of interest within each image. The individual fruit detection model then processes these regions of interest to count and classify the fruits.
Figure 4.
Flow chart of spatiotemporal tuple generation.
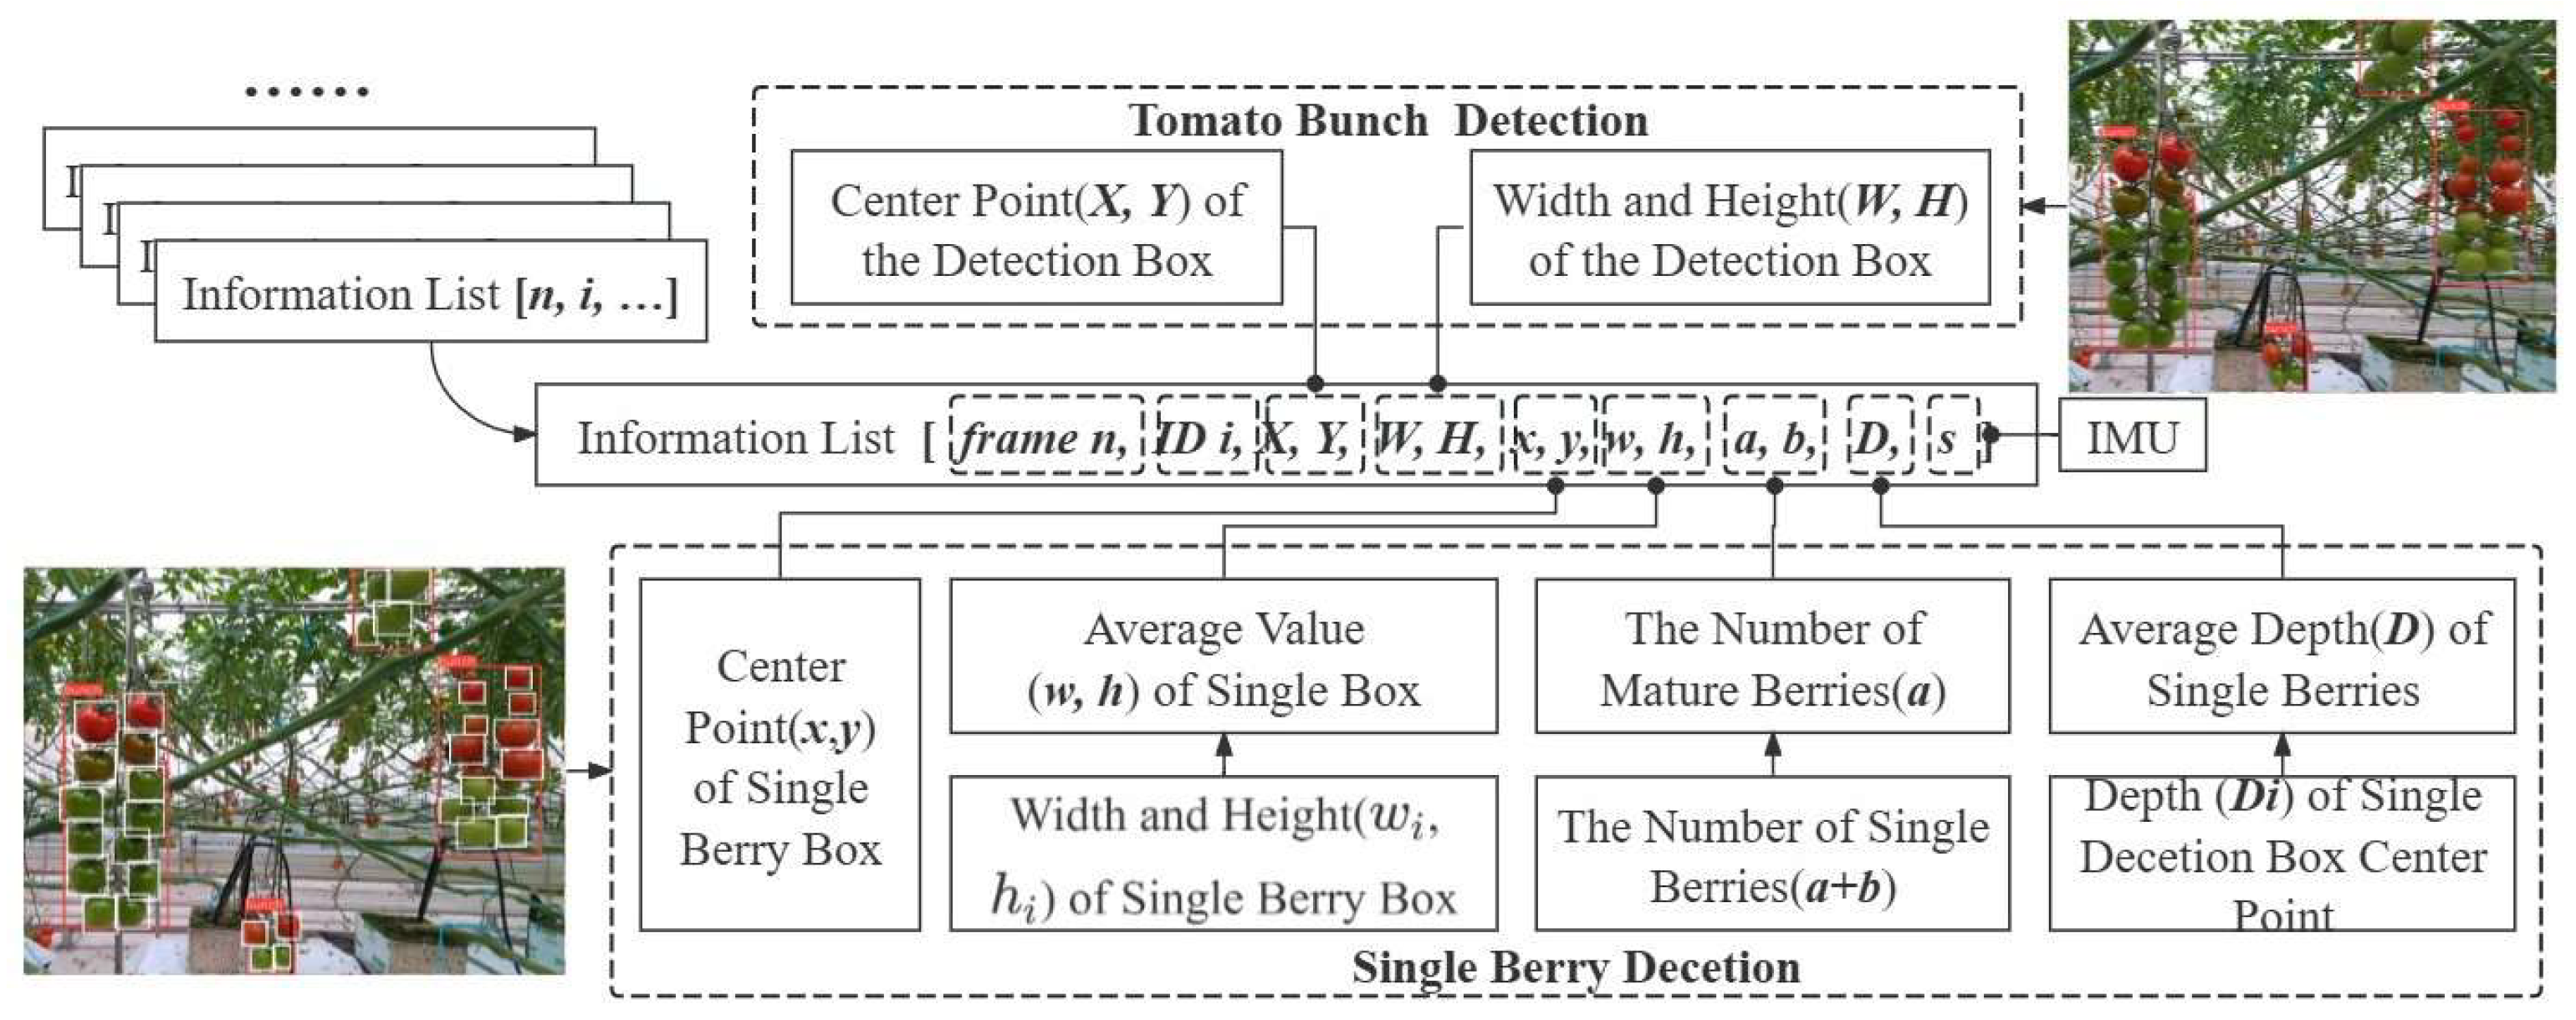
2.3.1. Spatiotemporal tuple
For each tomato cluster detected in each frame, a spatiotemporal tuple is created to provide distinct, identifiable information and reduce the risk of oversight. The list contains key details such as size, location, and the count of individual fruits, relative to the average size of different tomato bunches, as depicted in Fig.4. Additionally, we perform computations and eliminate duplicate lists for the same tomato bunch in subsection 2.3.3.
The creation of the spatiotemporal tuple is mainly done by YOLOv8, which act as a detector to provide size parameters for an individual tomato or an entire tomato bunch. Meanwhile, the task of counting both individual tomatoes and bunches of tomatoes is perfomed by the detector. The IMU provides the distance information, the camera provides the number of frames n, and the cumulative bunch ID is determined by the algorithms described in subsection 2.3.3.
After a frame is fed into the detection model, all identified tomato bunches within the image are enclosed in a rectangular box. To determine the number of individual fruits within each bunch, a masked image is generated for each tomato bunch. The masked image selectively blacks out the region outside the tomato bunch rectangular box, and this masked image is then fed into the single fruit detection model to obtain the final individual fruits count. Depth values for tomato bunchs are determined by averaging the depth values of all individual fruits within the bunch. The depth values for individual fruits are derived from the detected center point of the rectangular box outlining the individual fruit and the depth image obtained. To reduce interference from individual fruits on the opposite side of the same ridge and the background ridge, a 70 cm depth threshold filter is implemented to exclude individual fruits detected in the image that are more than 70cm away from the camera plane.
If the value 'D’ in the generated spatiotemporal tuple exceeds 70 cm, the list is excluded as it relates to the background tomato fruit. Through a series of experiments, we refined the spatiotemporal tuple by excluding values ’x’ that are less than 100 or greater than 1180. This adjustment aims to mitigate the effects of incomplete rectangular box information caused by tomatoes intersecting with the image edge, as shown in Figure 5.
2.3.2. Tracking and counting tomatoes with sensor fusion
Across different photographs in the collected spatiotemporal tuples, instances of recognizing the same group of tomatoes will result in identical groups of tomato being represented in multiple lists. To ensure a one-to-one correspondence between tomatoes and lists, a crucial step in tracking and counting tomatoes is the elimination of duplicate lists. The main steps in eliminating duplicate lists are: (1) Assignment, which considers all possible pairings of spatiotemporal tuples corresponding to tomatoes in different frames; (2) Inter-frame prediction, which computes the position of the rectangular box in the current list corresponding to any frame of the image; and (3) Target detection, which computes the Intersection over Union (IOU) of the inferred rectangular box and all rectangular boxes in the current frame to determine whether two rectangular boxes represent the same bunch of tomatoes.
Inter-frame prediction: During the robot’s movement, a bunch of tomatoes may appear in multiple image frames, resulting in the generation of multiple rectangular boxes and spatiotemporal tuples. To eliminate redundant spatiotemporal tuples for the same bunch of tomatoes and to avoidt double counting, an inter-frame prediction algorithm incorporating IMUs is used to predict and track the detection box. We use the IMU distance information s and the position (Xn, Yn) of detection box in frame n to predict the position of the detection box in frame m. In adition, we assume that the depth of the same bunch of tomatoes remains constant as the camera begins to move.
Each detected tomato cluster is represented as a spatiotemporal tuple :
[framen, IDi, Xn, Yn, xn, yn, Wn, Hn, wn, hn, an, bn, Dn, sn]
Firstly, we transformed the pixel coordinates (Xn,Yn) of the center point of the rectangular box in frame n into coordinates (xn,yn) in the camera coordinate system, as indicated by Equation 1 and Equation 2, where cx,cy, fx,and fy represent the camera internal parameters.
Subsequently, the coordinates () of the center point of rectangular box in the camera coordinate system can be computed using the displacement s of the inspection robot between two frames. Ultimately, the information for rectangular box is derived, as depicted in Equations 3 and 4.
The inter-frame prediction process uses the robot's displacement s to estimate the new position of the tomato cluster in the camera coordinate system. This prediction is then used to associate tomato clusters across frames, even if their appearance changes slightly due to lighting variations or partial occlusion.
Target detection: Through inter-frame estimation, it was possible to compute the parameters of the tomato rectangular in frame n, corresponding to the rectangular in frame m. The target detection function was designed to compute the IOU of the inferred rectangular and all rectangular detected in frame m. It determined whether and represented the same tomato. As shown in Figure 6, based on multiple experiments, the IOU threshold value is set at 0.7. If the computed intersection and union ratio for and exceeded 0.7, then and represented the same tomato bunch and resulted in the output of a single spatiotemporal tuple. Conversely, if and represented different tomatoes, two separate spatiotemporal tuples were generated.
Typically, the spatiotemporal tuple from the current frame and the spatiotemporal tuples from the previous t frames are used for target detection processing, where t represents the maximum number of tracking frames. This value is determined by the processing speed of the algorithm and the movement speed of the robot, and must be greater than or equal to the number of frames in which the tomato bunch appears in the image. After numerous tests, t is set at 70.
At the end of the target judgement process, only one spatiotemporal tuple is output if the two spatiotemporal tuples represent the same bunch of tomatoes, as shown in Figure 6. The number of individual fruits in the list ultimately determines which spatiotemporal tuple is retained. As shown in Figure 7, the same bunch of tomatoes may have different shapes in different images due to changes in the camera’s viewing angle during motion, and there may be cases where some individual fruits are obscured. We choose the spatiotemporal tuple with the highest number of individual fruits, as this corresponds to the tomato in the image that is closer to the front or back of the bunch.
The number of stored spatiotemporal tuples increased progressively with the number of images detected, reflecting the total number of tomato bunches in the final spatiotemporal tuples. The total number of red fruits and green fruits corresponds to the cumulative sum of “a” and “b” in all lists, respectively.
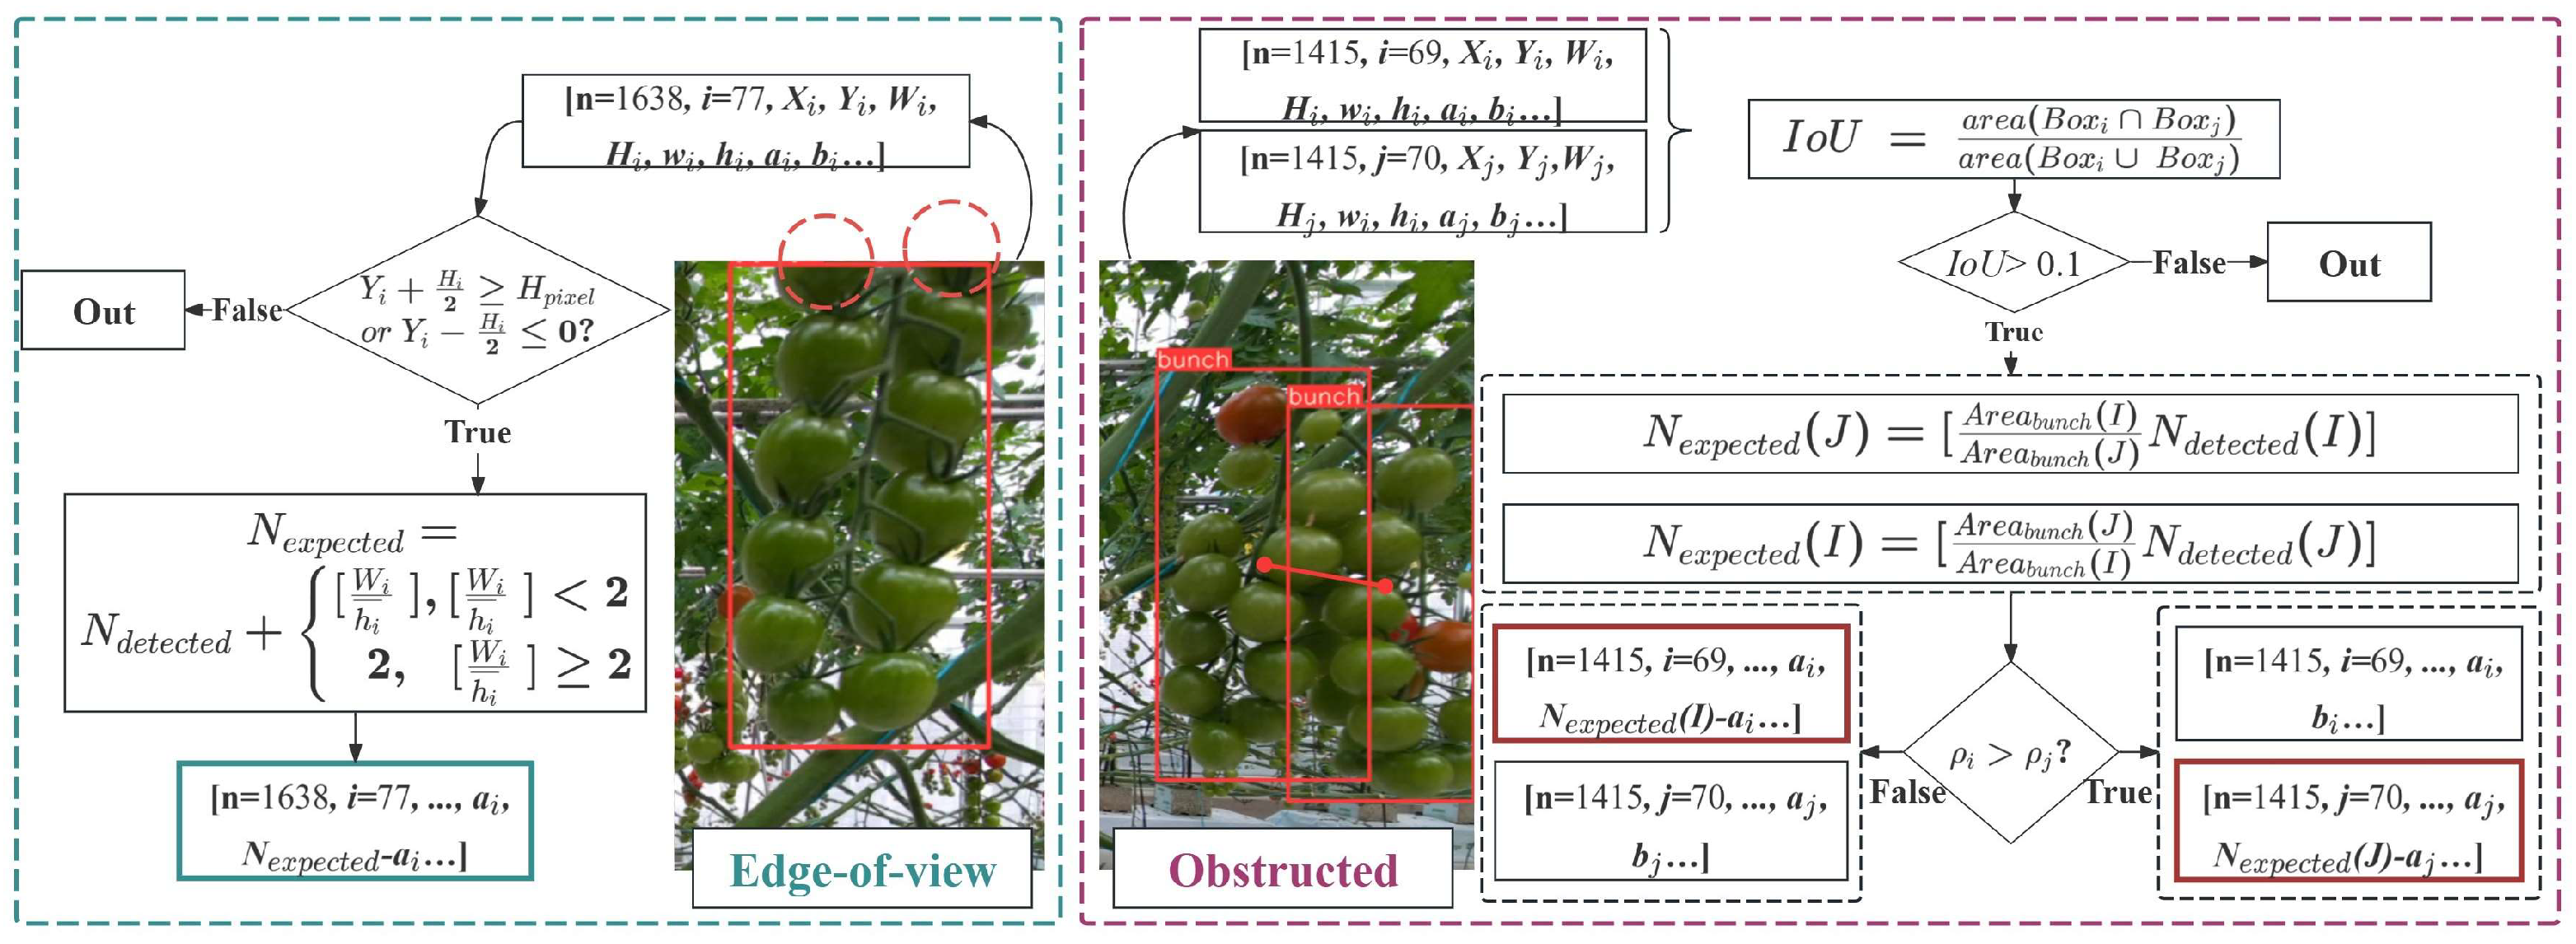
Post-processing: The main causes of missed detections are occlusion between tomato clusters and individual fruits, and incomplete fruit display at the edges of the field of view. To address this, we’ve introduced post-processing methods for significant deviations between expected and actual fruit counts.
For tomato clusters located at the edges of field-of-view, we categorize them as those located at the top and bottom edges and those located at the left and right edges. The approach to dealing with tomatoes at the left and right edges of the field of view has already been explained in Section 2.3.2, and the methods for dealing with individual fruits that shade each other are also described in the 'Target detection' section. It is worth noting that we consider both of the above methods to be part of post-processing.
We determine whether tomato clusters are at the top or bottom boundaries by comparing the coordinates of the target detection frame with the edges of the field of view. Given the dense arrangement of tomato clusters in the standardized greenhouse, we use the residual between the transversal side length of the tomato cluster detection frame and the average transversal side length of individual fruits to determine compensation amount.
Then, when encountering a pair of overlapping tomato clusters, we analyze the coordinates of the center point of the detection frames for two adjacent clusters and their respective side lengths to determine whether their frames intersect. If an intersection is detected, we identify this as an occlusion between the tomato clusters. Tomato clusters with a high density of fruits are categorized as shaded tomato clusters.
Since two occluding tomato clusters in the same row have similar depth values and occupy a comparable number of pixels per individual fruit, we estimate the number of individual fruits within the occluded cluster based on the fruit density found in the nearby unobstructed cluster nearby.
It’s important to note that we mitigate instances where the detection frames of tomato clusters intersect but true occlusion does not occur by implementing an IOU threshold as a filtering mechanism.
Figure 8.
Post-processing Framework. The post-processing framework demonstrates the determination conditions and compensation for "Edge-of-view" and "Obstructed".
Figure 8.
Post-processing Framework. The post-processing framework demonstrates the determination conditions and compensation for "Edge-of-view" and "Obstructed".
2.3.3. Ripeness Determination
In practical greenhouse production, determining whether a cluster of tomatoes meets the harvest criteria typically involves assessing if the fruits at the end of the cluster have reached maturity. Therefore, the judgment of individual fruit maturity is fundamental for subsequent harvesting operations and yield estimation.
Figure 9.
Tomato Cluster Maturity Reference Chart
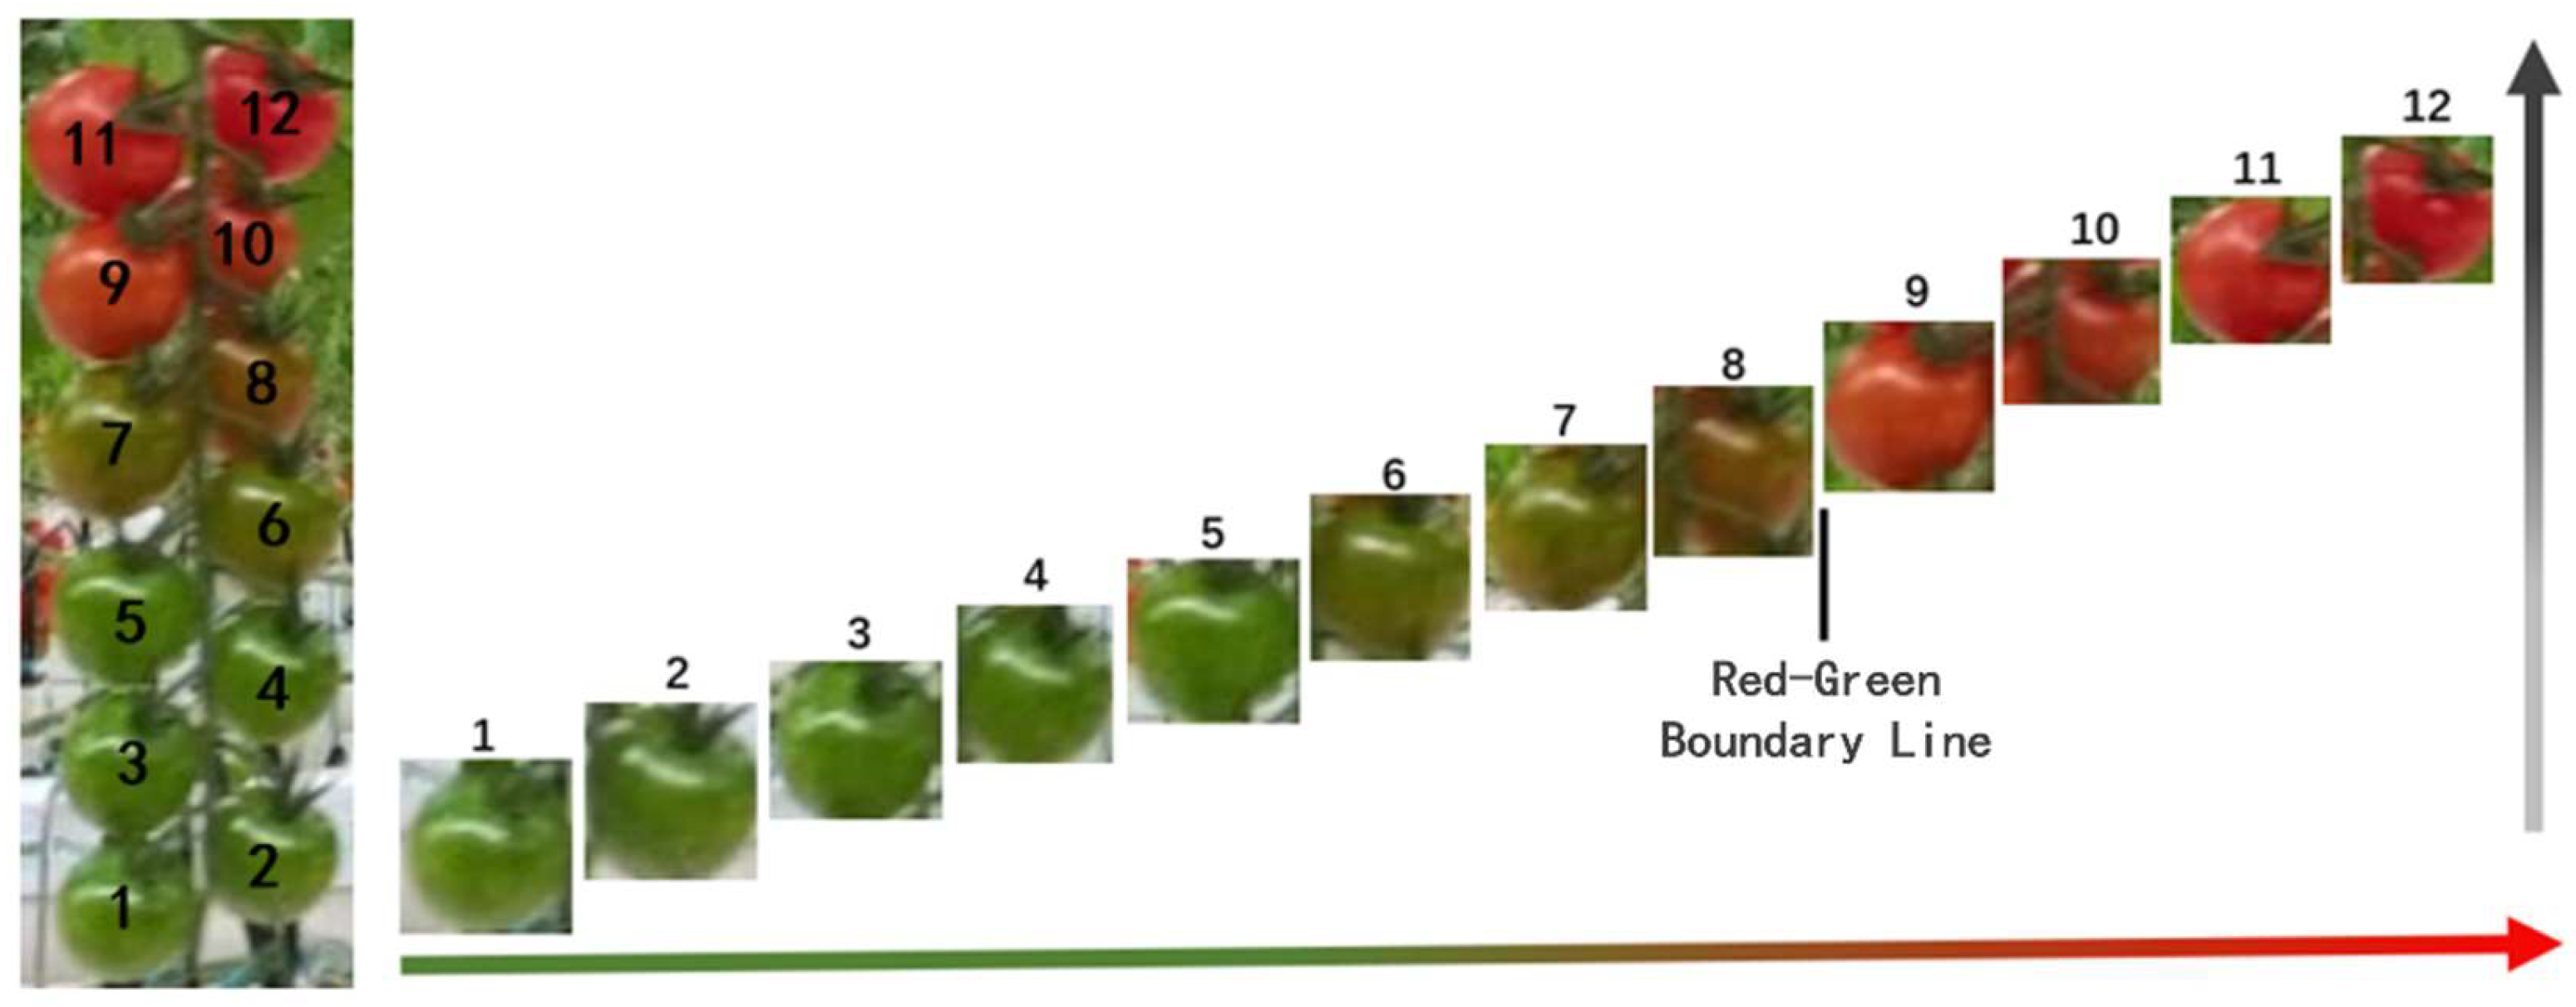
This study classifies tomato maturity into two categories: mature and immature. The classification criteria are based on the actual needs of greenhouse production, and a maturity reference chart is established. By analyzing the distribution of tomato color spaces in the reference chart, maturity standards are defined: the sum of the R value in the RGB color space and the a value in the Lab color space is divided by the G value to serve as a quantitative threshold. Tomatoes with a k value of 0-74% are considered immature, while those with a k value of 74-100% are deemed mature, and the k value is normalized.
Where:
- R = The red component in the RGB color space
- a = The a component in the Lab color space
- G = The red component in the RGB color space
3. Results and disscusion
We conducted the following experimental and evaluation tasks:
- comparison of our counting method with the YOLOv8+DeepSORT method;
- comparison of our counting method with the tomato counting method for density estimation;
- analysis of the compensation processing steps and their impact on tomato detection results.
- evaluation of the current ripeness detection method.
3.1 Experimental setup
The experiment was conducted in the commercial greenhouse, the same environment from which the training dataset was collected (described in Section 2). This date was chosen to coincide with a period of high tomato fruit load while still maintaining fruit characteristics (size, color) similar to those in the training dataset. While the specific tomatoes used to create the initial dataset were no longer present due to harvesting cycles, the same variety, cultivation practices, and environmental conditions were maintained to ensure a fair comparison.
Three adjacent rows (referred to as Ridge 1, Ridge 2, and Ridge 3) were selected for the experiments. The ground truth number of tomato clusters, mature fruits, and immature fruits in each row was determined by manual counting (Table 1). The total number of tomato fruits in each ridge was 1010, 1055, and 1177, with the number of tomato clusters counting 98, 105, and 108.

Table 1.
Number of tomatoes counted (Reference).
| Title 1 | Ridge 1 | Ridge 2 | Ridge 3 |
| Number of tomato clusters | 98 | 105 | 108 |
| Number of mature fruits | 232 | 258 | 251 |
| Number of immature fruits | 778 | 797 | 926 |
| Total | 1010 | 1055 | 1177 |
To ensure a controlled comparison, the density estimation method, YOLOv8+DeepSORT, and our proposed method were tested within the same greenhouse environment. The assessment of all three methods was to gauge the accuracy of single-fruit counting. Additionally, bunch counting accuracy and multi-target tracking performance were assessed in three designated rows. As the density estimation method does not involve multi-target tracking, the comparison for this performance was solely between YOLOv8+DeepSORT and our algorithm. Our ripeness detection assessment, as a factor in the method we proposed, will take place in the third row.
Across all three experiments, images were captured with the RealSense D435i depth camera mounted on the inspection robot, while maintaining a consistent speed of 0.1m/s. The NVIDIA GTX2060 graphics card equipped on the industrial computer on the inspection robot was used to execute each method to perform the recognition and counting.
The model in this study was trained and tested using a server equipped with an AMD R7 5800x CPU and RTX 3080ti. The 15,000 image tomato dataset was separated into 90% training, 5% test, and 5% validation sets. Random selection was used for all images in the training, test, and validation datasets.
3.2 Comparison with other approaches
Counting tomatoes, as a task in the field of agriculture, can be done using a myriad of methods. Our aim is to present a comprehensive evaluation and provide a comparative analysis for our method: bunch counting, individual-fruits counting and alongside tracking methods. To achieve this, we have chosen two widely utilized methods for assessment.
The first approach, or the YOLOv8+DeepSORT method, utilizes the YOLOv8 as a detector and DeepSORT as a multi-target tracking system. DeepSORT has a core principle that involves predicting the motion trajectory of the detected tomatoes using a Kalman filter and subsequently utilizing the Hungarian algorithm for target matching. This method provides accurate counting by effectively identifying targets and tracking them within the agricultural context. The second method, or the density estimation method, employs the density estimation technique leveraging YOLOv8. This method extrapolates the entire dataset from partial samples. With a sampling technique, it obviates the necessity for multi-target tracking specifically for tomato bunches. In comparison with the other two methods, our method offers a more well-rounded functionality due to its all-in-one functionality
3.2.1 Evaluation indicators
In this study, different evaluation criteria were used for tomato cluster (bunch) counting and single-fruit counting, owing to the distinct counting principles involved in each task. To comprehensively assess the performance of the three methods (our proposed method, YOLOv8+DeepSORT, and density estimation), we selected a set of established metrics that evaluate both accuracy and tracking capabilities.
Metrics for Tomato Cluster Counting:
Multiple Object Tracking Accuracy (MOTA): MOTA is a widely used metric for evaluating multi-object tracking algorithms. It considers three types of errors: false negatives (FNt), false positives (FPt), and identity switches (IDSWt). MOTA provides a comprehensive measure of tracking accuracy by combining detection performance with tracking consistency. This will be the key metric to address that background tomatoes will be accurately filtered.
Where:
- FNt = Number of target tomato clusters not detected in frame t
- FPt = Number of non-target objects (false positives) detected as tomato clusters in frame t
- IDSWt = Number of identity switches (incorrectly assigned IDs) for tomato clusters in frame t
- GTt = Actual number of target tomato clusters in frame
Accuracy (ACC): To compare our proposed method, YOLOv8+DeepSORT, and density estimation, ACC (percentage) was calculated as follows:
Where:
- EC = Estimated count, or the number that the method has counted
- AC = Actual count, or the ground-truth number we obtained from manual counting as referenced from table 1.
Metrics for Single Fruit Counting:
Coefficient of Determination (R2): The R2 is a statistical measure that represents the proportion of the variance in the dependent variable (estimated fruit number) that is predictable from the independent variable (actual fruit number). R2 ranges from 0 to 1, with higher values indicating a better fit between the estimated and actual counts. We want to evaluate and explain the accuracy and predictive capability of counting models concerning the actual crop data. It is calculated as follows:
Where:
- SSR = Sum of Squares Regression
- SST = Sum of Squares Total
- SSE = Sum of Squares Error
3.3 Tomato counting based on density estimation
The density estimation method aims to estimate the total number of tomatoes in the entire greenhouse based on a sample of tomatoes in each row. The inspection robot followed a consistent route at a fixed speed, capturing images at regular intervals along the ridge. This data collection has a limited sample, which could lead to higher variance in the R2. The tomato detection model (described in Section 3.1) provided the number of tomato clusters, mature individual fruits, and immature individua fruits in each image. To minimize interference, depth filtering was applied to filter out background tomatoes. To prevent inaccurate predictions resulting from the same cluster of tomatoes appearing in two consecutive images, we made sure to capture an image, with an interval exceeding the actual pixel width of one frame. The following formula was used to see if the image width did not exceed the actual pixel width of one frame corresponding to the ridge plane. The following formula was used:
The length of the ridge plane corresponding to the image width could be computed using camera internal parameters and the distance from the camera to the ridge plane, as demonstrated in Equation 8, where d represents the average depth from the camera to the tomato, and is the internal parameter of the camera. The camera depth average measured 0.5m, with the camera width at 1280 and the focal length parameter 823.88.
The robot was configured to capture an image every 1.5 meters (approximately every 15 seconds) for operational simplicity. At the conclusion of one side inspection, we assumed the robot collected a total of n images, and the number of bunches, mature individual fruits, and immature individual fruits were denoted as i, j, and k respectively. We can denote the following equation to calculate the estimated number of tomato fruits on one side of the ridge using the density estimation method. We can predict the number of bunches for all tomatoes on one side of the ridge (denoted as ‘I’), and the total number of mature and immature fruits.
We evaluated how well these methods align with actual values using coefficient of determination (R2) plots. The tomato counting method based on density estimation achieved an R2 of 0.837. In contrast, our method demonstrated a stronger correlation, with fruits detected showcasing a higher alignment with true values, with a higher value of R2 of 0.853, as shown in Fig. 9. The density estimation method would yield high error as we predict variable lighting would reduce the sampled extraction.
Given that this method extrapolates the entire dataset from partial samples, its coefficient of determination may exhibit variability, fluctuating between low and high values. This variability can stem from unfavorable detection conditions, such as variable lighting conditions affecting the accuracy of sample extraction. Because the samples are extracted in varying environmental conditions and have non-uniform planting across different regions and lighting conditions, the result has a potential to result in non-representative outcomes. However, However, we cannot change the unstructured nature of the greenhouse environment.
3.4 Tomato counting based on YOLOv8 and DeepSORT
DeepSORT is a multi-object tracking (MOT) algorithm based on a tracking-by-detection strategy. Its core principle involves predicting the motion trajectory of detected tomatoes using a Kalman filter and subsequently utilizing the Hungarian algorithm for target matching. DeepSORT is widely employed in monitoring cameras for counting people and vehicles. However, DeepSORT performance is largely dependent on the performance of its detection, which makes DeepSORT inherently susceptible to the detection issues.
In this section, we want to assess the difference with our method, individual fruits counting (ACC), the multi-target tracking performance (MOTA), and the coefficient of determination (R2) for individual fruits counting with the YOLOv8+DeepSORT algorithm.
In the multi-target tracking evaluation experiments, our method demonstrates a higher target tracking accuracy (MOTA=0.954) compared to the YOLOv8+Deepsort method (MOTA=0.582). This discrepancy can be attributed to the significantly high FP (False Positive) and IDSW (Identity Switch) values associated with the YOLOv8+Deepsort method. FP arises primarily from false background tomato detections, constituting a significant contributor to the IDSW value. Another contributing factor to the elevated IDSW might stem from the high similarity among tomatoes, which leads to potential confusion in the ReID-based surface features. This similarity poses a challenge for the algorithm to differentiate. Because there are less instances of FP, we also saw a reduction in IDSW. For individual fruit tracking, 29, 34, and 31 instances of FP were recognized at Ridge 1, 2, and 3. Our method only had one instance, at Ridge 3.
With the high increase in values of performance, it is due to the 3D filtering and the displacement measurement that our method brings that YOLOv8+DeepSORT lacks. This is likely due to the algorithm confusing the surface features with other objects, especially in clustered environments and partially shaded environments.
The FP of our method mainly originated from tomatoes growing in the middle of two sides, possibly falling below the depth threshold we set, and some false detections of non-tomato elements.
Table 2.
MOTA of tomato clusters counting based on YOLOv8+DeepSORT and Our Method.
| YOLOv8+DeepSORT | Our Method | |||||
| Ridge 1 | Ridge 2 | Ridge 3 | Ridge 1 | Ridge 2 | Ridge 3 | |
| Sum of frames | 2272 | 2254 | 2297 | 2251 | 2191 | 2236 |
| GT | 98 | 105 | 108 | 98 | 105 | 108 |
| FN | 2 | 3 | 2 | 2 | 4 | 3 |
| FP | 29 | 34 | 31 | 0 | 0 | 1 |
| IDSW | 10 | 13 | 9 | 0 | 0 | 1 |
| MOTA | 0.582 | 0.524 | 0.600 | 0.980 | 0.952 | 0.954 |
Concerning tomato clusters counting, as indicated in Table 3, the accuracy of tomato cluster counting of our method (average value 97.30%) is significantly higher than that of the other two methods. The primary reason for this improvement lies in the fact that our method not only tracked and counted all tomatoes but also effectively filtered out background tomatoes.
With YOLOv8+DeepSORT, the tracking counting was greater than the actual. This was likely to occur due to the algorithm failing to recognize consecutive frames and deviating from the predicted position. Because of this, it was likely that the algorithm treated this tracking as a separate bounding box, increasing the tracking.
We generated R2 plots to compare the performance characteristics of the three methods. We wanted to document missed and incorrectly detected tomato clusters, which may indicate issues in the algorithm.
For samples that were over-detected, including those with duplicate detections or background tomatoes, we recorded the "Number of Reference Fruits" as 0 and positioned this value along the vertical axis. Concurrently, any missed data was plotted along the horizontal axis. To ensure fairness, both the YOLOv8+DeepSORT method and our approach incorporate post-processing method mentioned in this paper.
Figure 10.
R2 plot of three methods (we biased the overlap points).Since the main sources of false positives (FP) were background tomatoes and repeated counts of tomatoes in the same cluster, the data points for false positive indicators were located on the y-axis and at the origin; the data points for ID switched (IDSW) were mainly located at the origin mainly because the number of single fruits in tomato clusters did not switch even though the cluster IDs switched.
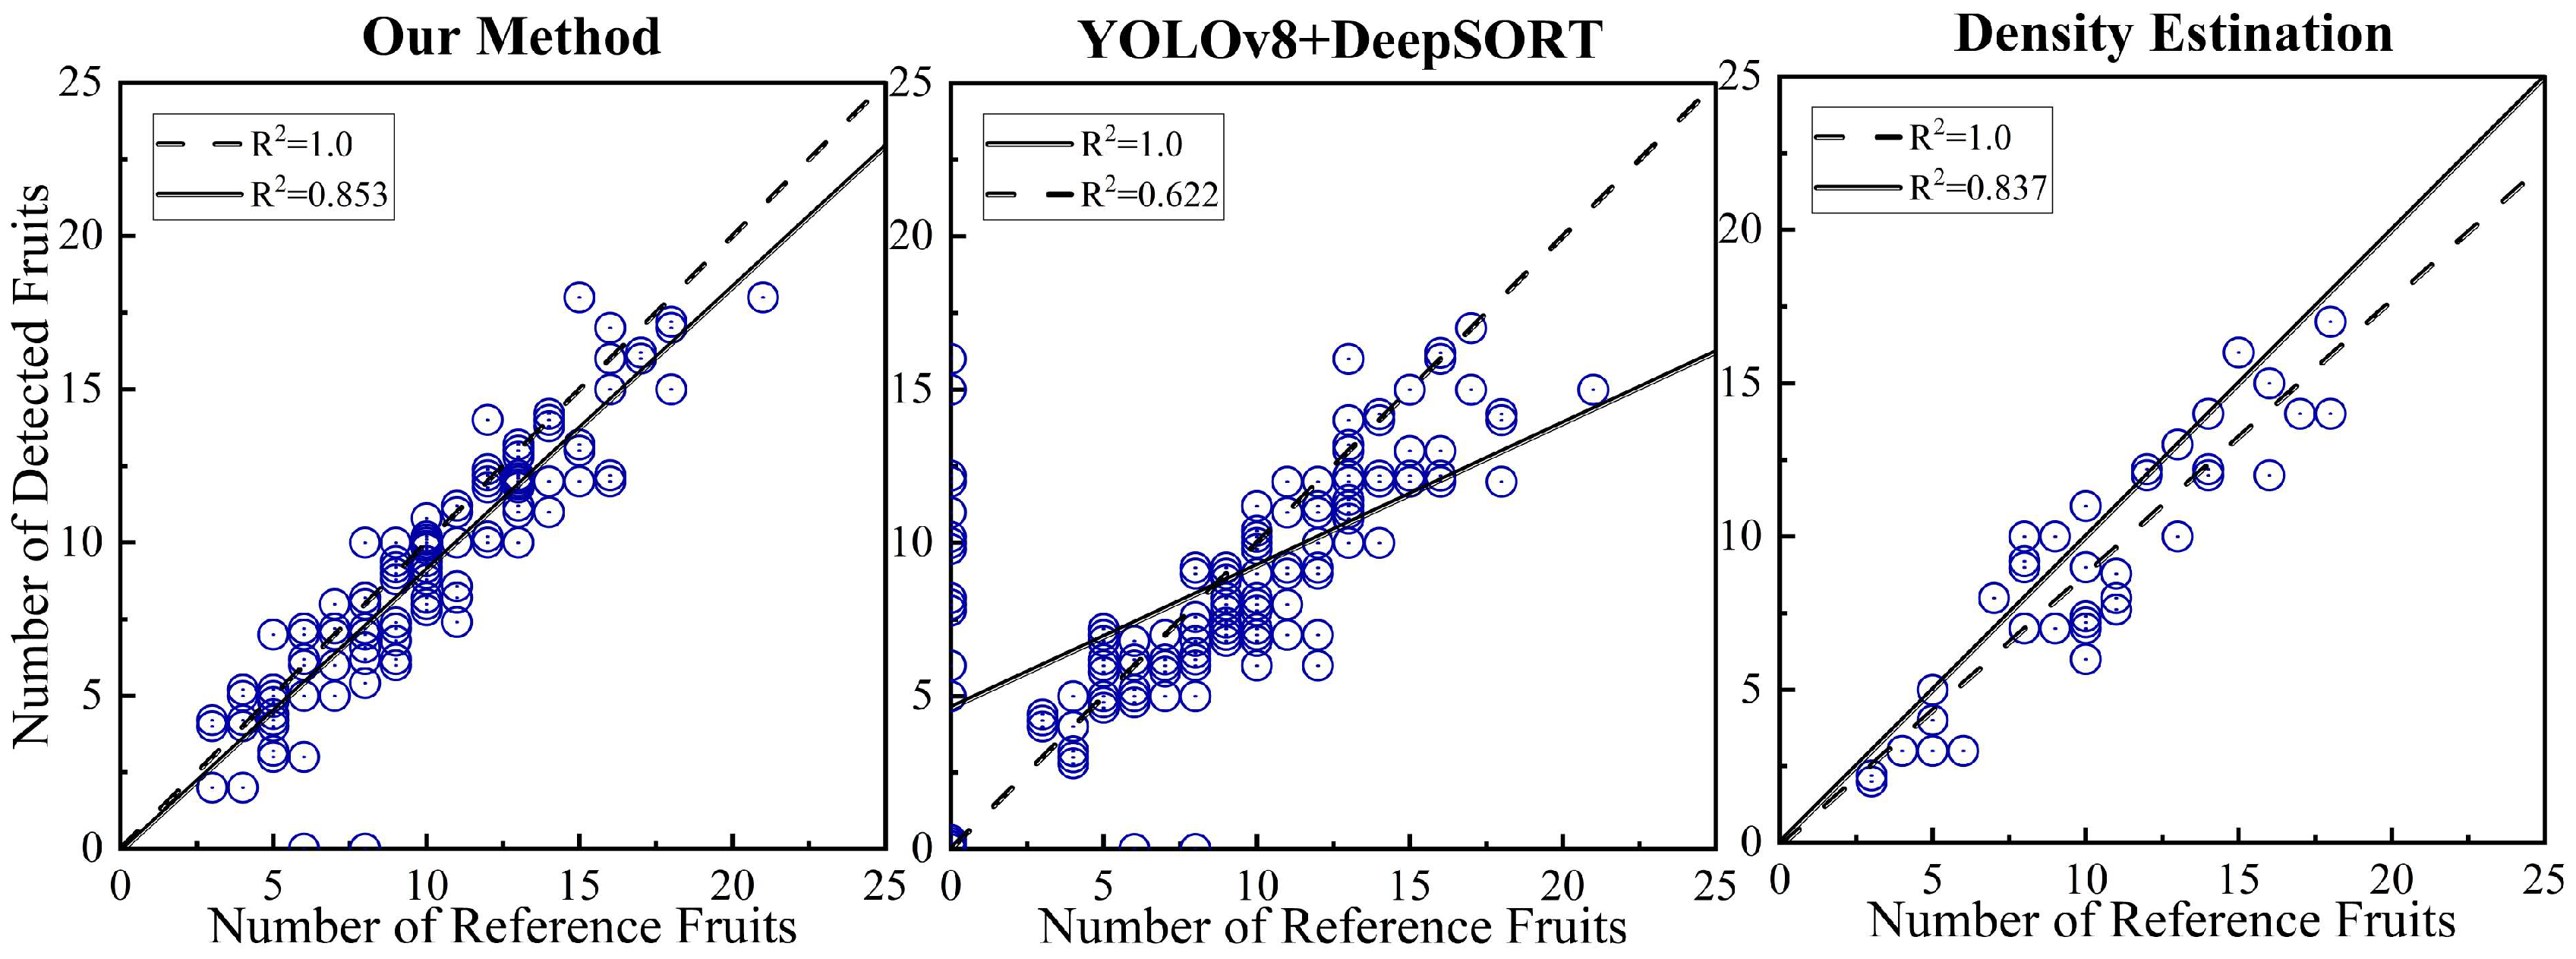
The coefficient of determination of our method (R2=0.853) is higher than the coefficient of determination of YOLOv8+DeepSORT (R2=0.622), which indicates that the couting results are more polymerized than the YOLOv8+DeepSORT method. The linear regression model of our method in Figure 9 (solid line, Slope =0.921) is closer to the ideal model (dashed line, Slope = 1). It is also evident in Figure 9 that YOLOv8+DeepSORT has more incorrectly detected data points, mainly attributable to this method misidentifying background tomatoes or tracking bunches of fruit with ID switch.
3.5 Impact of post-processing
Our individual fruits recognition may be subjected to occlusion and incomplete display of image edges, which affects recognition. To combat this, we designed an approach with target detection and post-processing to minimize instances when those happen. We want to assess the effectiveness our method has in target detection, or the decision-making on the number of tomatoes, which is quantified using the slope of the linear regression model with R-squared, while the effect on the individual fruits is quantified with occlusion and image processing.
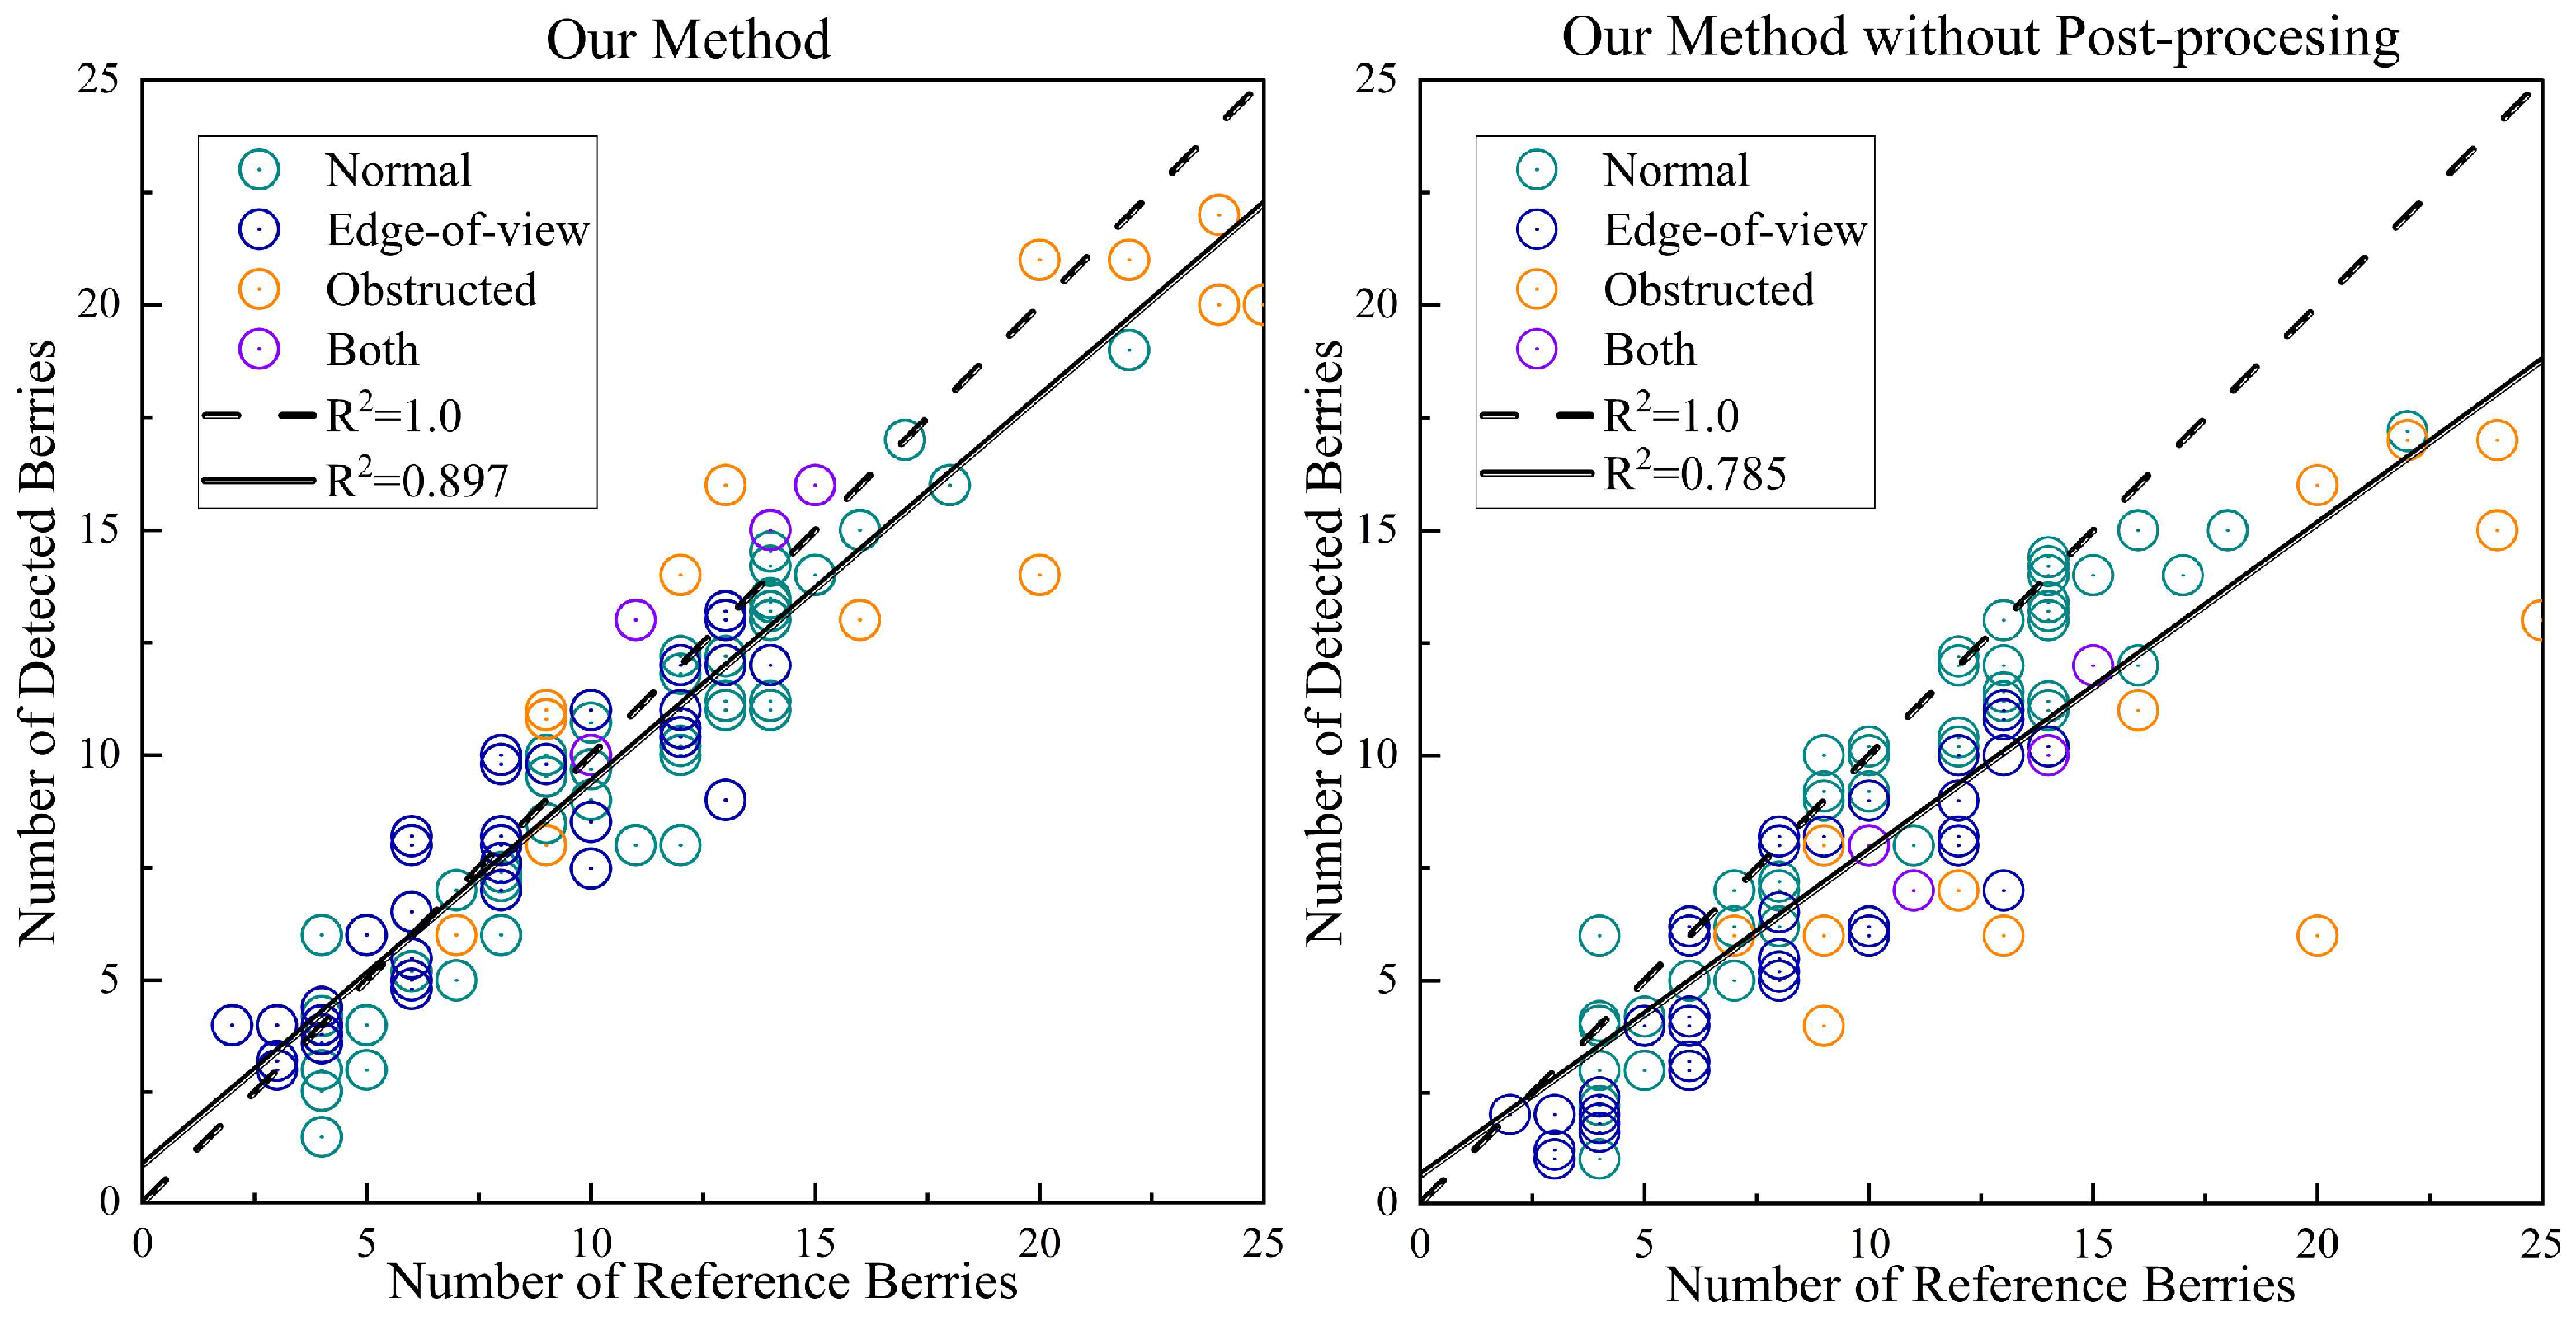
In the study to measure this effect, we perform a two-group analysis, one with the treatment, or the post-processing, and the other with the controlled group, or the indvidual fruit recognition without the post-processing group. This would accurately allow us to gauge the overall impact of the occlusion and edge issues. We hypothesize that the linear aggression model would more closely approximate to a slope of 1 and higher accuracy of single fruit identification with the group that receives the post-processing compared to the one that doesn’t. For analysis, we divided the R2 plots into occluded tomato clusters, tomato clusters at the edge of the field of view, and occluded tomato clusters that were also at the edge of the field of view. This would enable us to better see the effectiveness of our method to decrease instances of missed detections.
Figure 10 shows that after incorporating post-processing, the slope of the linear regression model (Slopes=0.856) more closely approximates that of the ideal model (Slope=1), while the coefficient of determination (R2=0.897) significantly increases. This post-treatment notably affects fruits situated at the upper and lower edges as well as shaded fruits, effectively rectifying a number of missed individual fruits. Meanwhile, its impact on tomato bunches in the normal class is comparatively lesser, which meets our expectations.
However, it is important to state that there is a trade off. The overcorrection stemming from the post-processing contributes to an undesired factor, leading to higher-than-actual values in certain obscured and marginal tomato detections. It was important to measure this as our method may not perform up to par on areas that are already clearly visible.
Figure 11.
R2 plot of posting-processing (overlapping points are handled with an offset).
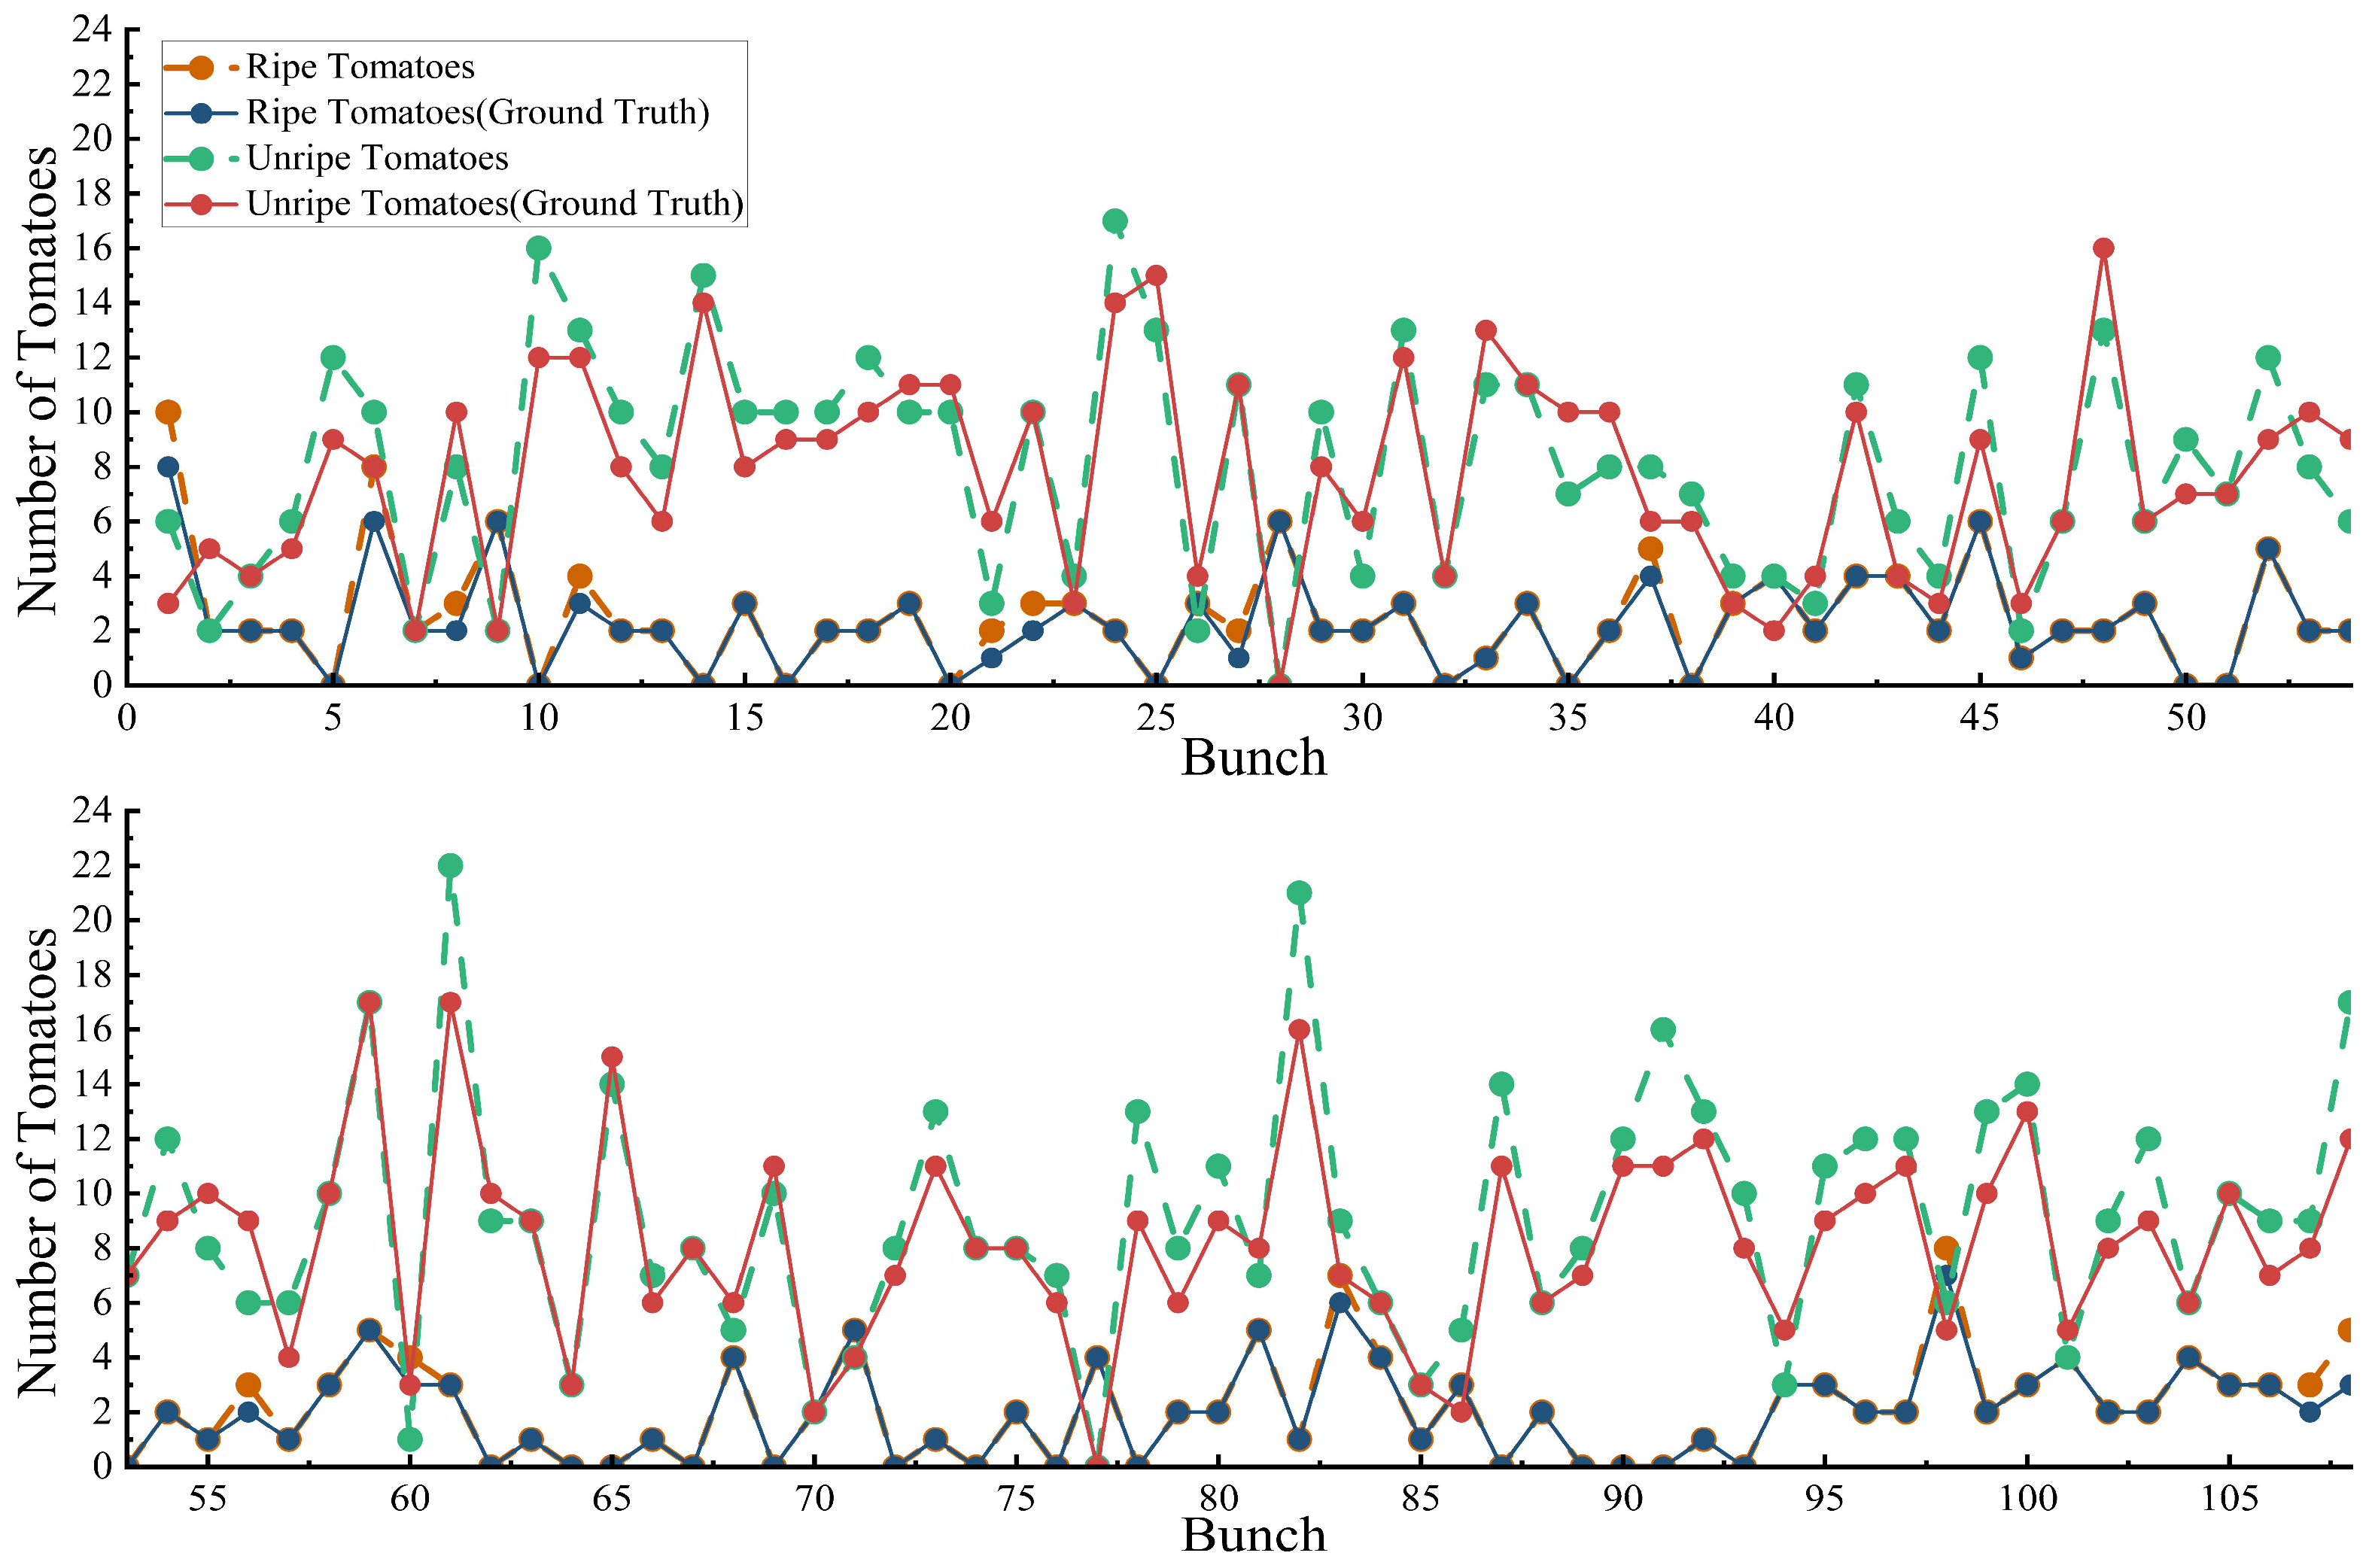
3.6 Accuracy of mature and immature fruits counting
In this experiment, we seek to identify the maturity effectiveness of our method. With our current method, the counting accuracy of mature fruits reached 92.03%, and for immature fruit, it was 91.79%. On average, the maturity was at an accuracy of 91.96%. Our hypothesis that mature fruit would have higher accuracy aligns with the idea that the algorithm was more effective with the easily distinguishable red color. In comparison with the density estimation-based tomato counting method, we performed a comparative analysis of our method in identifying tomato clusters and single fruits. We measured that the highest counting accuracy for mature fruit was 80.08%, for immature fruit, the accuracy went up to 78.62%, and the average was 79.35%. Our method was significantly more effective to accurately measure ripe and unripe berries and maturity. Table 4 contains further details on the experiment. With this, we can identify the limitation that the density-based method does not perform well under different variations as a result of its limited samples.
Figure 12.
Counts of ripe individual fruits and unripe individual fruits in the Ridge 3 by our methods.
Figure 12.
Counts of ripe individual fruits and unripe individual fruits in the Ridge 3 by our methods.
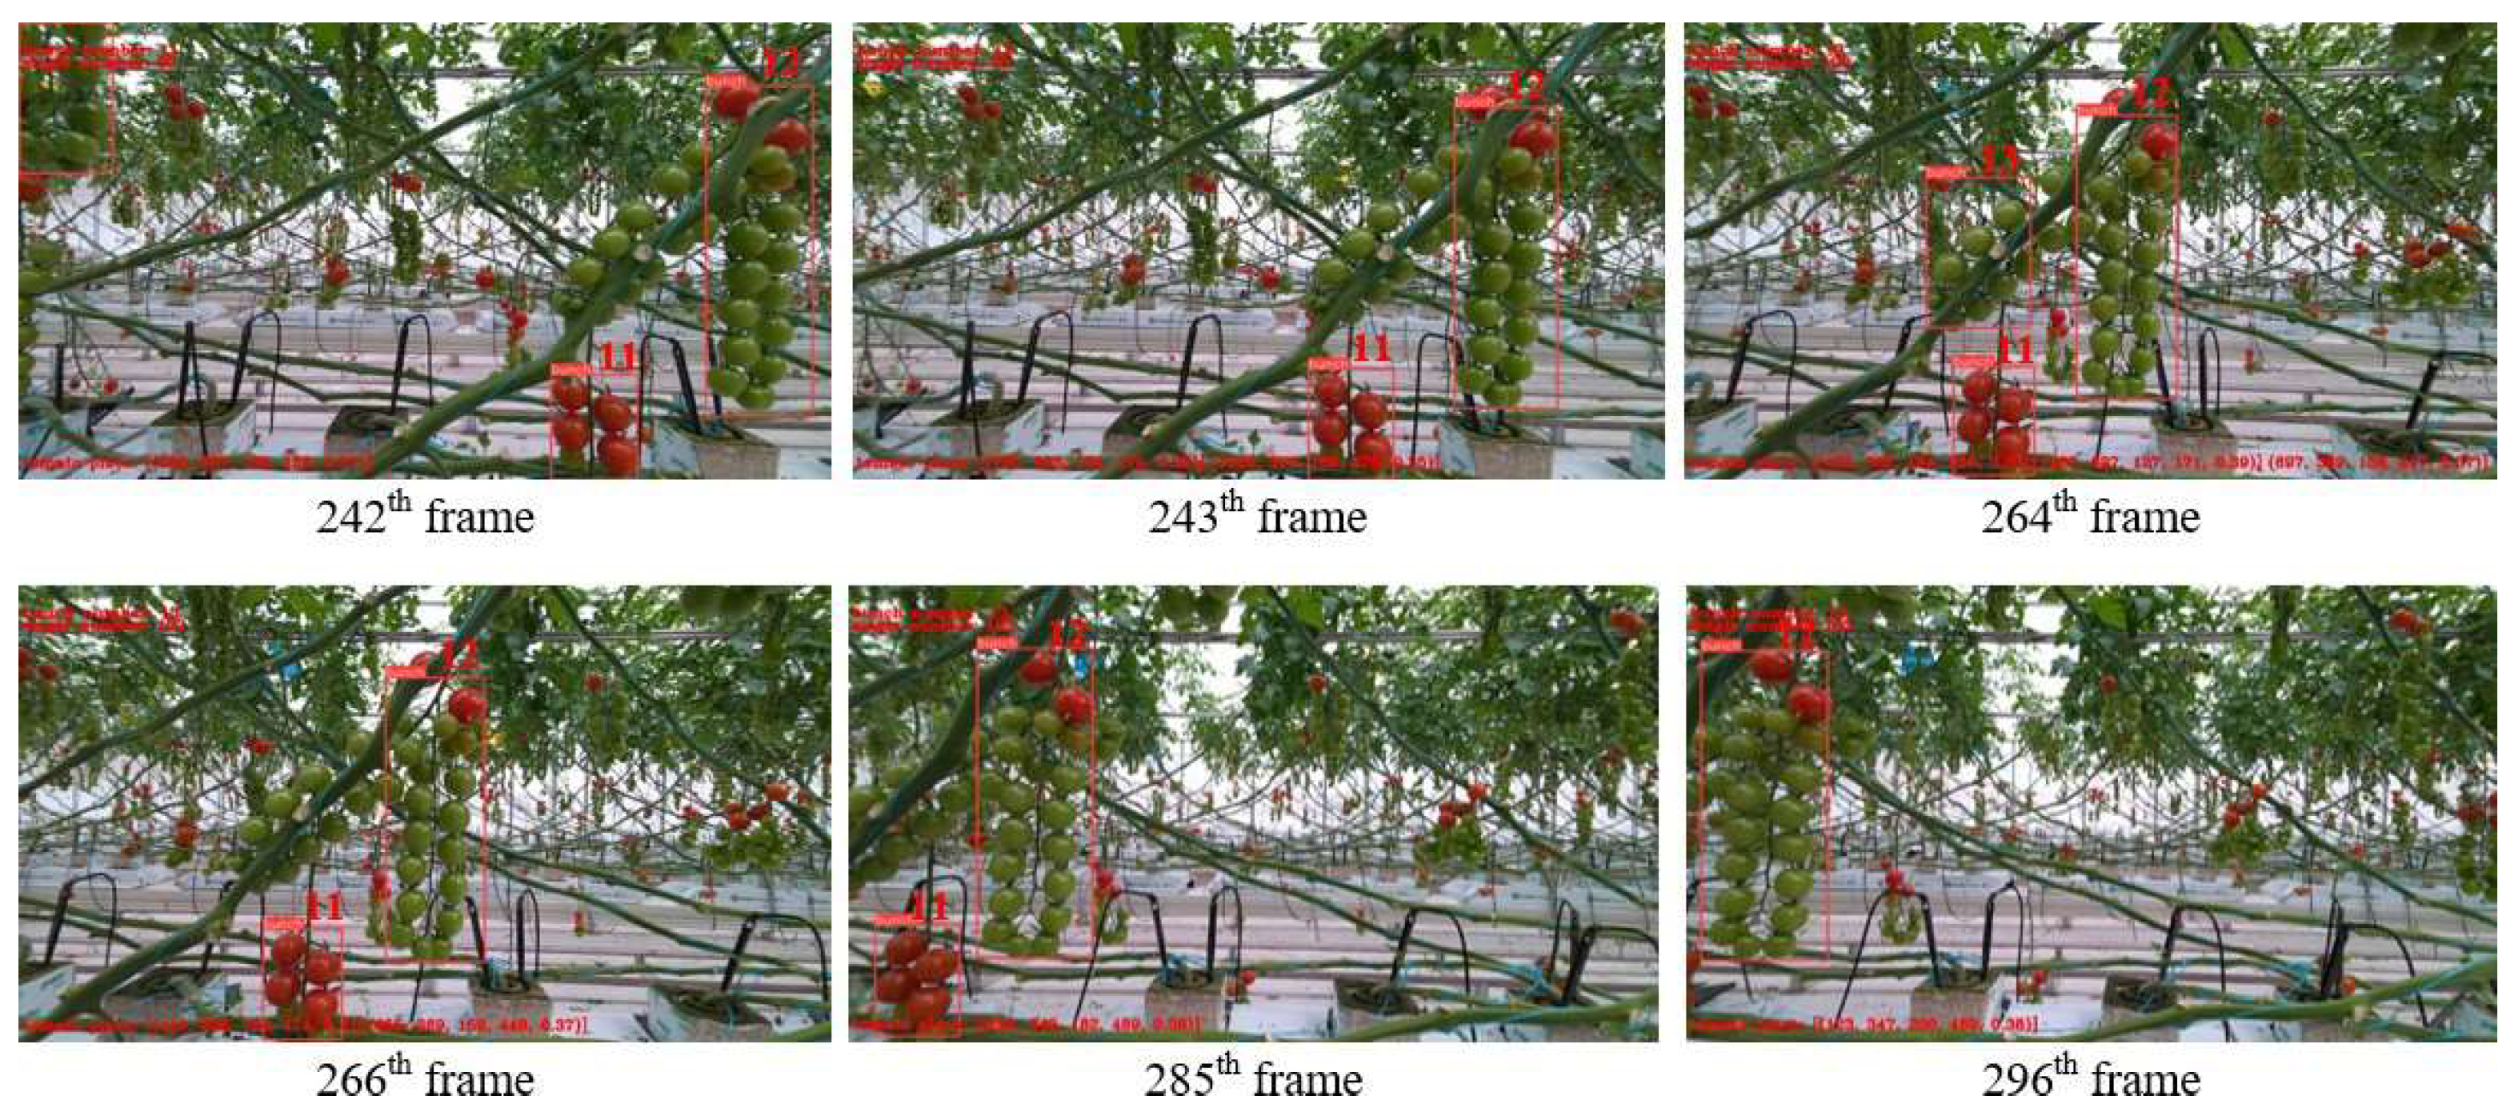
3.7 Visualization results of the tomato inspections
While visual inspection may not have a direct impact on quantifiable results, it provides a qualitative method that complements the study. To better demonstrate the effectiveness of the study, we provide a sample as Figure 12 to demonstrate tracking, edge case reading, 3D imaging with displacement sensors and single fruit collection. This, together with the analysis, can demonstrate an effective and reliable reading method for our algorithm.
Figure 12 shows an example of tomato counting in a greenhouse using our algorithm. It shows that in frame 242 the tomato was identified as on the image, as it appeared on the top edge. As the tomato leaves change in frame 264, the algorithm is still able to track the movement of each individual fruit. Over time, the tomato leaves may get in the way of the algorithm reading the individual fruits, but the algorithm is accurate in its readings. The spatiotemporal tuple is shown below to demonstrate its effective tracking capabilities. As frame 242 had the tomato in the edge case, as frame 243 passes to frame 297, it accurately recognises the tomatoes it initially had.
Figure 13.
Tracking example of tomato counting.
4. Conclusion and Future Work
This paper presented a novel and efficient tomato fruit counting method integrated into a greenhouse inspection robot. By leveraging the robot's displacement information from its IMU, the algorithm effectively tracked tomato clusters across frames, enabling accurate counting while minimizing ID switches. The system achieved a tomato cluster detection accuracy of 97.09% with a processing time of only 0.03s per image using the YOLOv8 network. Furthermore, the detection accuracy for mature and immature single fruits reached 92.03% and 91.79%, respectively, with a processing time of 0.08s per image. It took 0.18s to convert tomato clusters in an image into a spatiotemporal tuple using the YOLOv8 network and a series of coordinate conversions. The inter-frame prediction algorithm used in this method based on the robot’s spatial displacement achieved a multiple object tracking accuracy (MOTA) of 0.954. In comparison with the YOLOv8+DeepSORT algorithm, this achieved a reduction in the false detection of background tomatoes and decreased identity switches.
The integration of the 3D filter with the displacement information was seen to lead the algorithm to have advantages, and provide a reliable, and accurate reading method for tomato detection. It realized effective tracking across the images and performed single fruit counting, making it an efficient system.
Future work will focus on several areas to further enhance the capabilities of the proposed system: (1) Improving Detection Robustness under Occlusion: Using the method for tomato recognition, it will allow an improvement in robustness for tomato detection. This can be achieved by taking on tomato occlusion, and tomato detection and further integrating attention mechanisms to increase single-frame accuracy. (2) Integration with Automation Control System: By accurately being able to recognize tomato ripeness, this could integrate with automation control. It may lead to better control of the ripeness, and provide a higher crop yield.
In summary, this will provide a reliable means to perform tomato detection, crop yield and resource management, as shown throughout our experiment.
Author Contributions
Conceptualization, P.W.; Funding acquisition, P.W.; Methodology, P.W., G.D.; Image Annotation, W.Z. and M.H.; Software, W.Z. and G.D.; Validation, W.Z., G.D. and M.H.; Writing—original draft, W.Z. and G.D.; Writing—review and editing, W.Z. and P.W. All authors have read and agreed to the published version of the manuscript.
Funding
This research was funded by Science and Technology Program of Suzhou (SNG2022055), and in part by the Science and Technology Project of Jiangsu Province Administration for Market Regulation (KJ2024079).
Institutional Review Board Statement
Not applicable
Informed Consent Statement
Not applicable
Data Availability Statement
Not applicable
Acknowledgments
In this section you can acknowledge any support given which is not covered by the author contribution or funding sections. This may include administrative and technical support, or donations in kind (e.g., materials used for experiments).
Conflicts of Interest
The authors declare no conflicts of interest.
References
- Zheng, Y.Y.; Kong, J.L.; Jin, X.B.; Wang, X.Y.; Su, T.L.; Zuo, M. CropDeep: The crop vision dataset for deep-learning-based classification and detection in precision agriculture. Sensors 2019, 19, 1058. [Google Scholar] [CrossRef] [PubMed]
- Tian, H.; Wang, T.; Liu, Y.; Qiao, X.; Li, Y. Computer vision technology in agricultural automation—A review. Information Processing in Agriculture 2020, 7, 1–19. [Google Scholar] [CrossRef]
- Redmon, J. You only look once: Unified, real-time object detection. In Proceedings of the Proceedings of the IEEE conference on computer vision and pattern recognition, 2016.
- Faster, R. Towards real-time object detection with region proposal networks. Advances in neural information processing systems 2015, 9199, 2969239–2969250. [Google Scholar]
- He, K.; Gkioxari, G.; Dollár, P.; Girshick, R. Mask r-cnn. In Proceedings of the Proceedings of the IEEE international conference on computer vision, 2017, pp. 2961–2969.
- Bolya, D.; Zhou, C.; Xiao, F.; Lee, Y.J. Yolact: Real-time instance segmentation. In Proceedings of the Proceedings of the IEEE/CVF international conference on computer vision, 2019, pp. 9157–9166.
- Liu, G.; Nouaze, J.C.; Touko Mbouembe, P.L.; Kim, J.H. YOLO-tomato: A robust algorithm for tomato detection based on YOLOv3. Sensors 2020, 20, 2145. [Google Scholar] [CrossRef]
- Suo, R.; Gao, F.; Zhou, Z.; Fu, L.; Song, Z.; Dhupia, J.; Li, R.; Cui, Y. Improved multi-classes kiwifruit detection in orchard to avoid collisions during robotic picking. Computers and Electronics in Agriculture 2021, 182, 106052. [Google Scholar] [CrossRef]
- Yu, Y.; Zhang, K.; Yang, L.; Zhang, D. Fruit detection for strawberry harvesting robot in non-structural environment based on Mask-RCNN. Computers and electronics in agriculture 2019, 163, 104846. [Google Scholar] [CrossRef]
- Tian, Y.; Yang, G.; Wang, Z.; Wang, H.; Li, E.; Liang, Z. Apple detection during different growth stages in orchards using the improved YOLO-V3 model. Computers and electronics in agriculture 2019, 157, 417–426. [Google Scholar]
- Afonso, M.; Fonteijn, H.; Fiorentin, F.S.; Lensink, D.; Mooij, M.; Faber, N.; Polder, G.; Wehrens, R. Tomato fruit detection and counting in greenhouses using deep learning. Frontiers in plant science 2020, 11, 571299. [Google Scholar] [PubMed]
- Pei, Y.; Liu, H.; Bei, Q. Collision-Line Counting Method Using DeepSORT to Count Pedestrian Flow Density and Hungary Algorithm. In Proceedings of the 2021 IEEE 3rd International Conference on Civil Aviation Safety and Information Technology (ICCASIT). IEEE, 2021, pp. 621–626. [CrossRef]
- Wojke, N.; Bewley, A.; Paulus, D. Simple online and realtime tracking with a deep association metric. In Proceedings of the 2017 IEEE international conference on image processing (ICIP). IEEE, 2017, pp. 3645–3649. [CrossRef]
- Zhang, Y.; Wang, C.; Wang, X.; Zeng, W.; Liu, W. Fairmot: On the fairness of detection and re-identification in multiple object tracking. International journal of computer vision 2021, 129, 3069–3087. [Google Scholar]
- Jiacheng Rong, Hui Zhou, Fan Zhang, Ting Yuan, Pengbo Wang. Tomato cluster detection and counting using improved YOLOv5 based on RGB-D fusion, Computers and Electronics in Agriculture 2023, 207, 107741.
- Zhongxian Qi, Wenqiang Zhang, Ting Yuan, Jiacheng Rong, Wei Li et al. An improved framework based on tracking-by-detection for simultaneous estimation of yield and maturity level in cherry tomatoes, Measurement 2024, 226, 114117. [CrossRef]
- Ge, Y.; Lin, S.; Zhang, Y.; Li, Z.; Cheng, H.; Dong, J.; Shao, S.; Zhang, J.; Qi, X.; Wu, Z. Tracking and counting of tomato at different growth period using an improving YOLO-deepsort network for inspection robot. Machines 2022, 10, 489. [Google Scholar] [CrossRef]
- Zan Wang, Yiming Ling, Xuanli Wang, et al. An improved Faster R-CNN model for multi-object tomato maturity detection in complex scenarios, Ecological Informatics 2022, 72, 101886. [CrossRef]
- Parico, A.I.B.; Ahamed, T. Real time pear fruit detection and counting using YOLOv4 models and deep SORT. Sensors 2021, 21, 4803. [Google Scholar] [CrossRef] [PubMed]
- Taixiong Zheng, Mingzhe Jiang, Yongfu Li, Mingchi Feng,Research on tomato detection in natural environment based on RC-YOLOv4, Computers and Electronics in Agriculture 2022, 198, 107029. [CrossRef]
- Zhou, X.; Wang, P.; Dai, G.; Yan, J.; Yang, Z. Tomato fruit maturity detection method based on YOLOV4 and statistical color model. In Proceedings of the 2021 IEEE 11th Annual International Conference on CYBER Technology in Automation, Control, and Intelligent Systems (CYBER). IEEE, 2021, pp. 904–908. [CrossRef]
Figure 1.
Tomatoes grown in the production greenhouse.
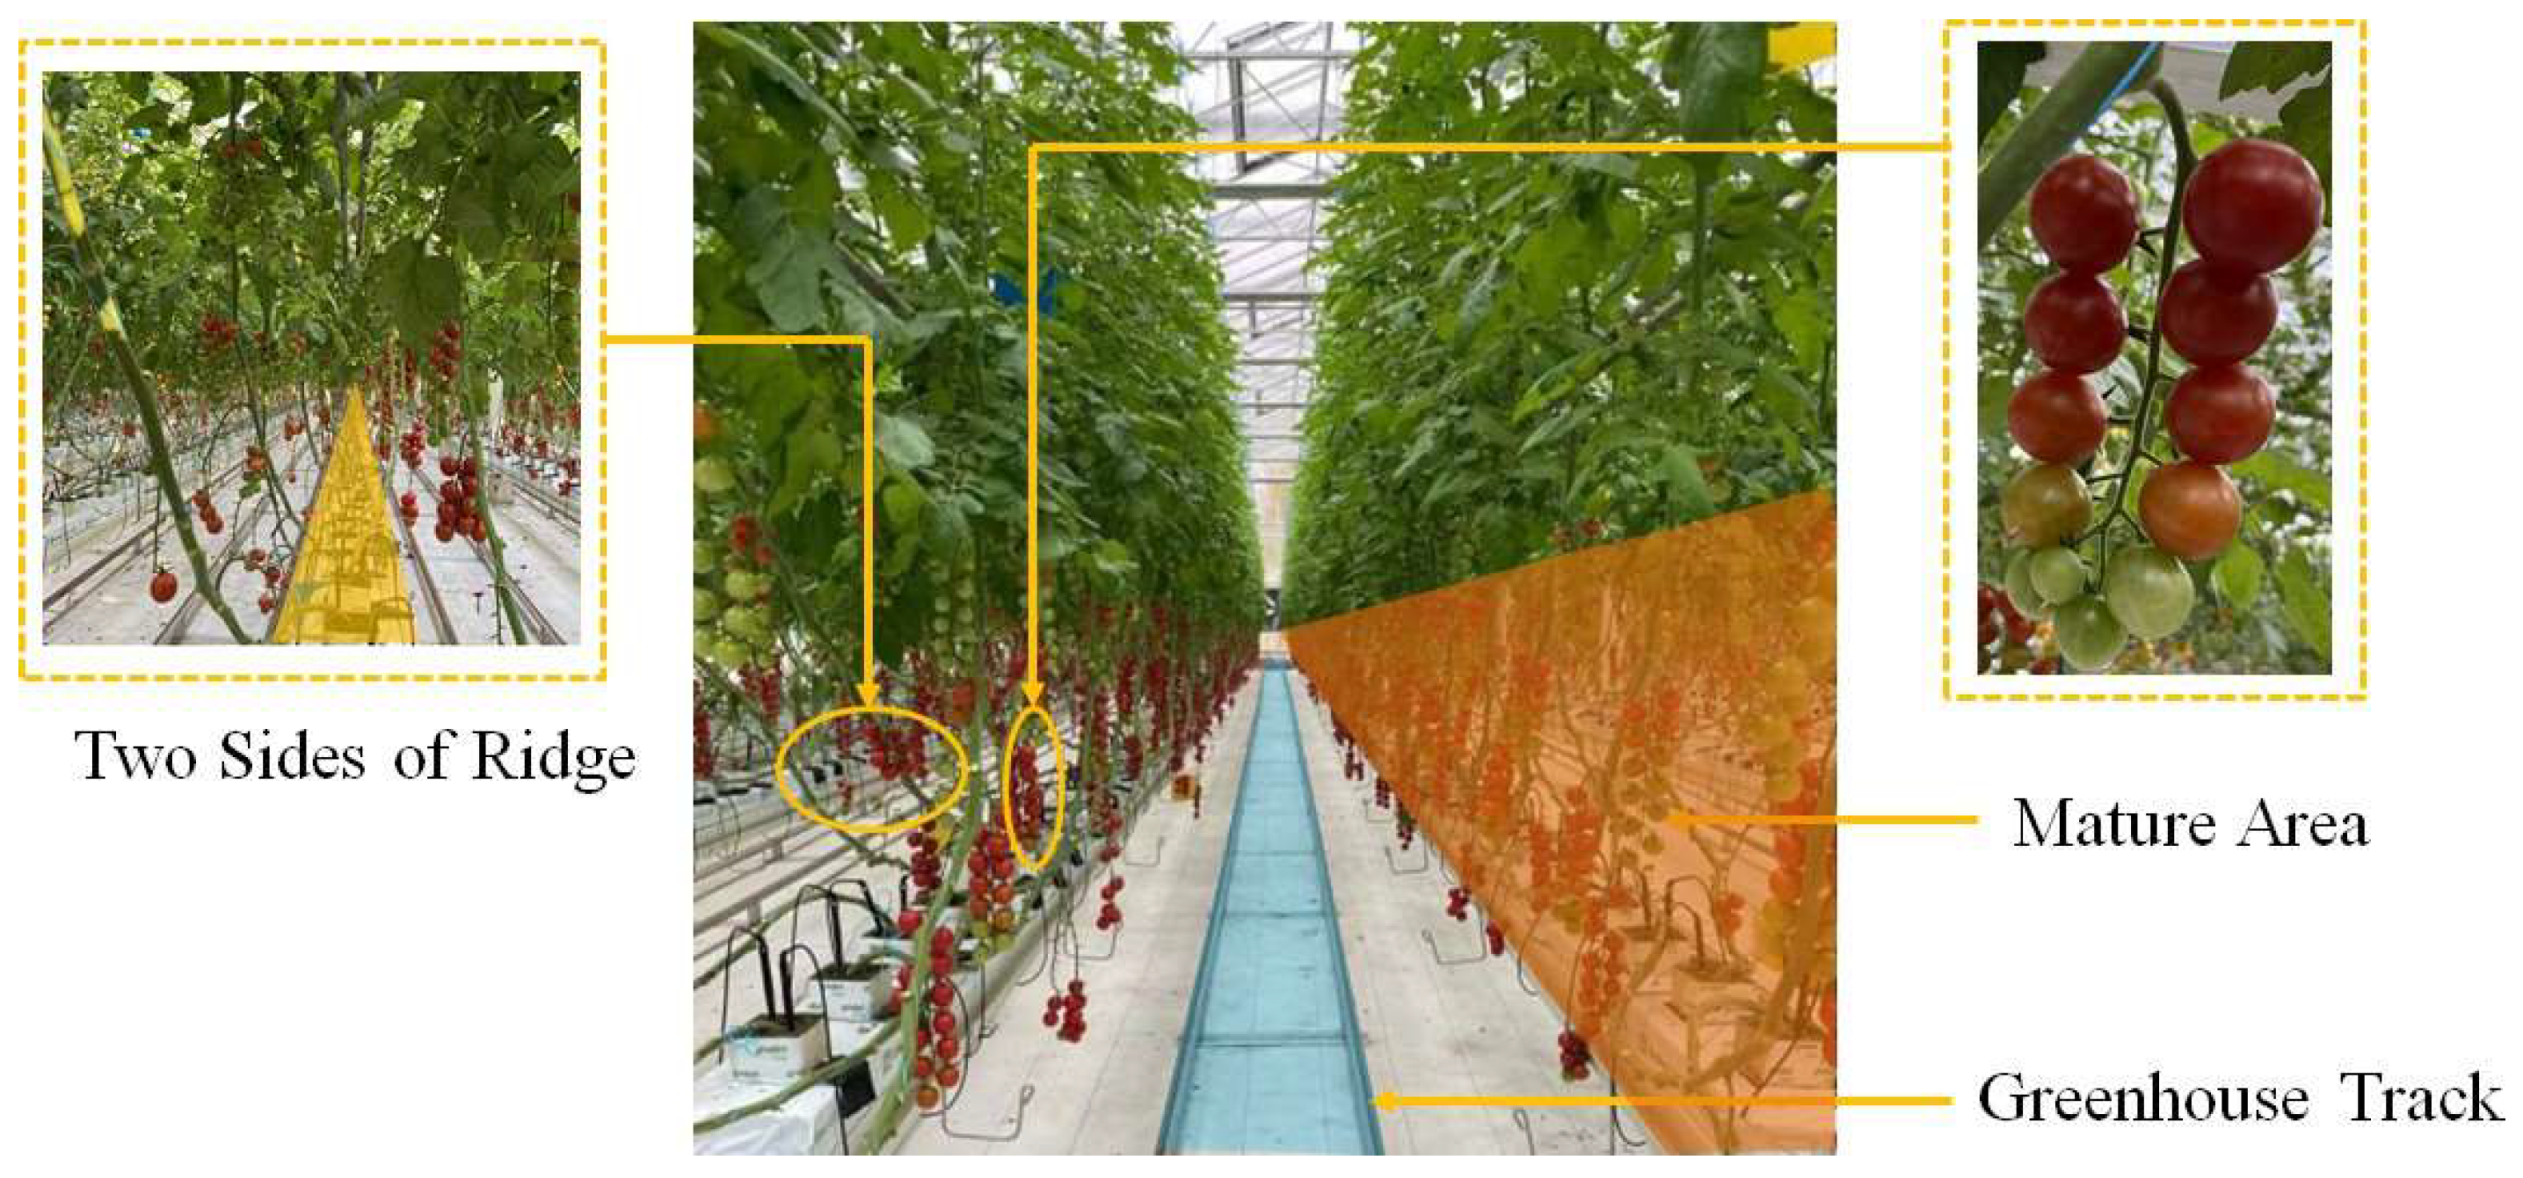
Figure 2.
Tomatoes in different states of maturity: (a) immature tomato fruit; (b) mature tomato fruit.
Figure 2.
Tomatoes in different states of maturity: (a) immature tomato fruit; (b) mature tomato fruit.
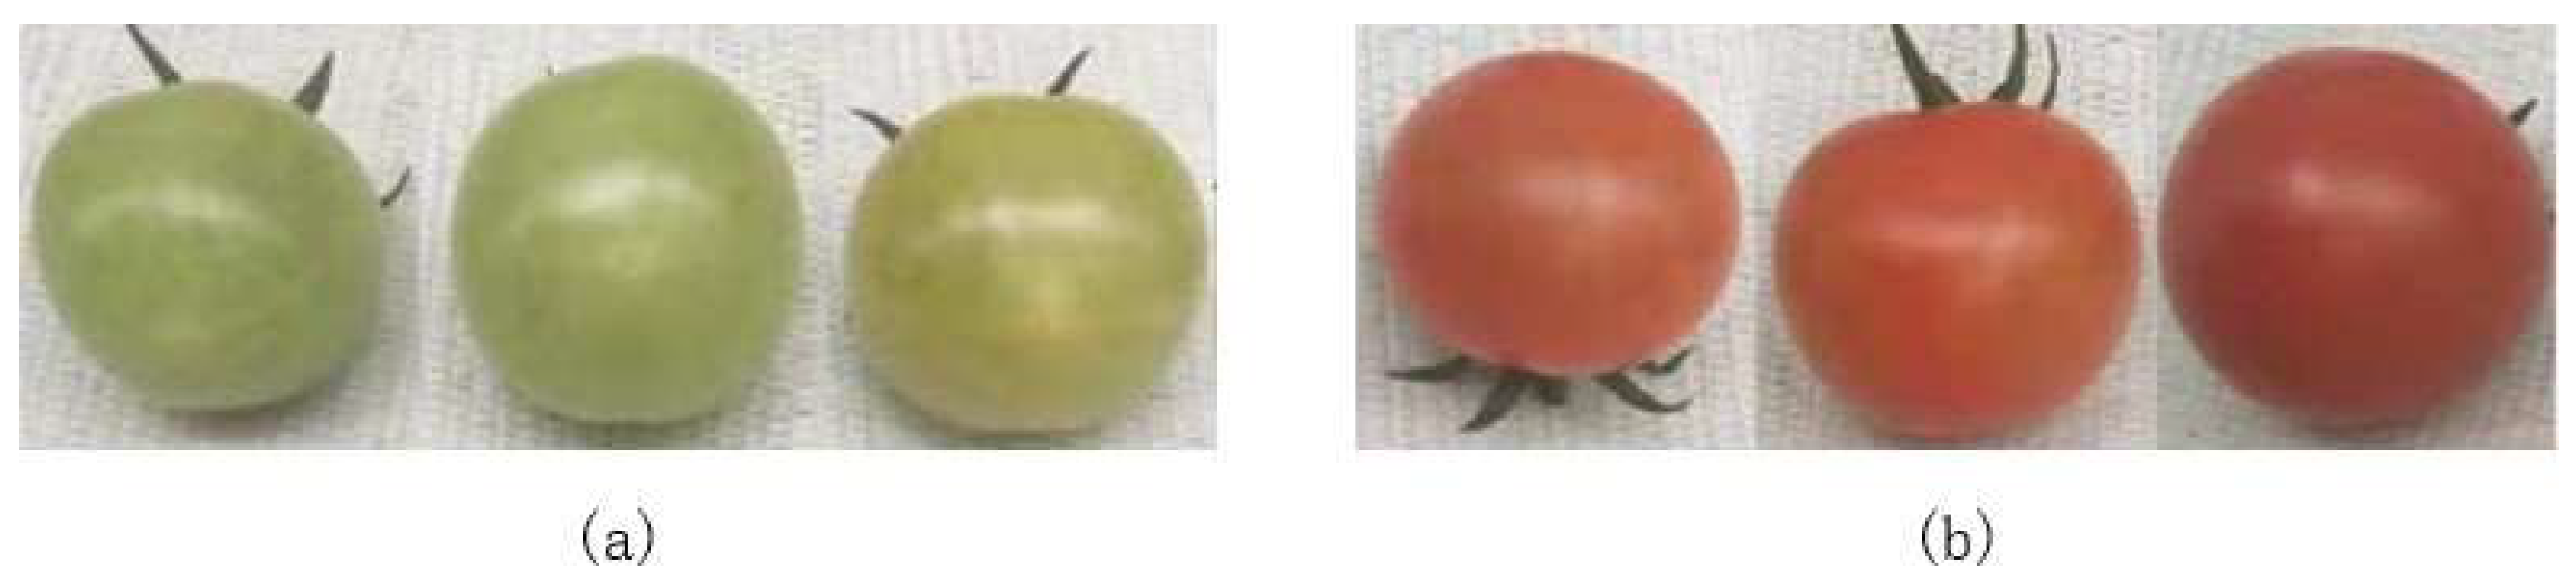
Figure 3.
The self-propelled inspection robot.
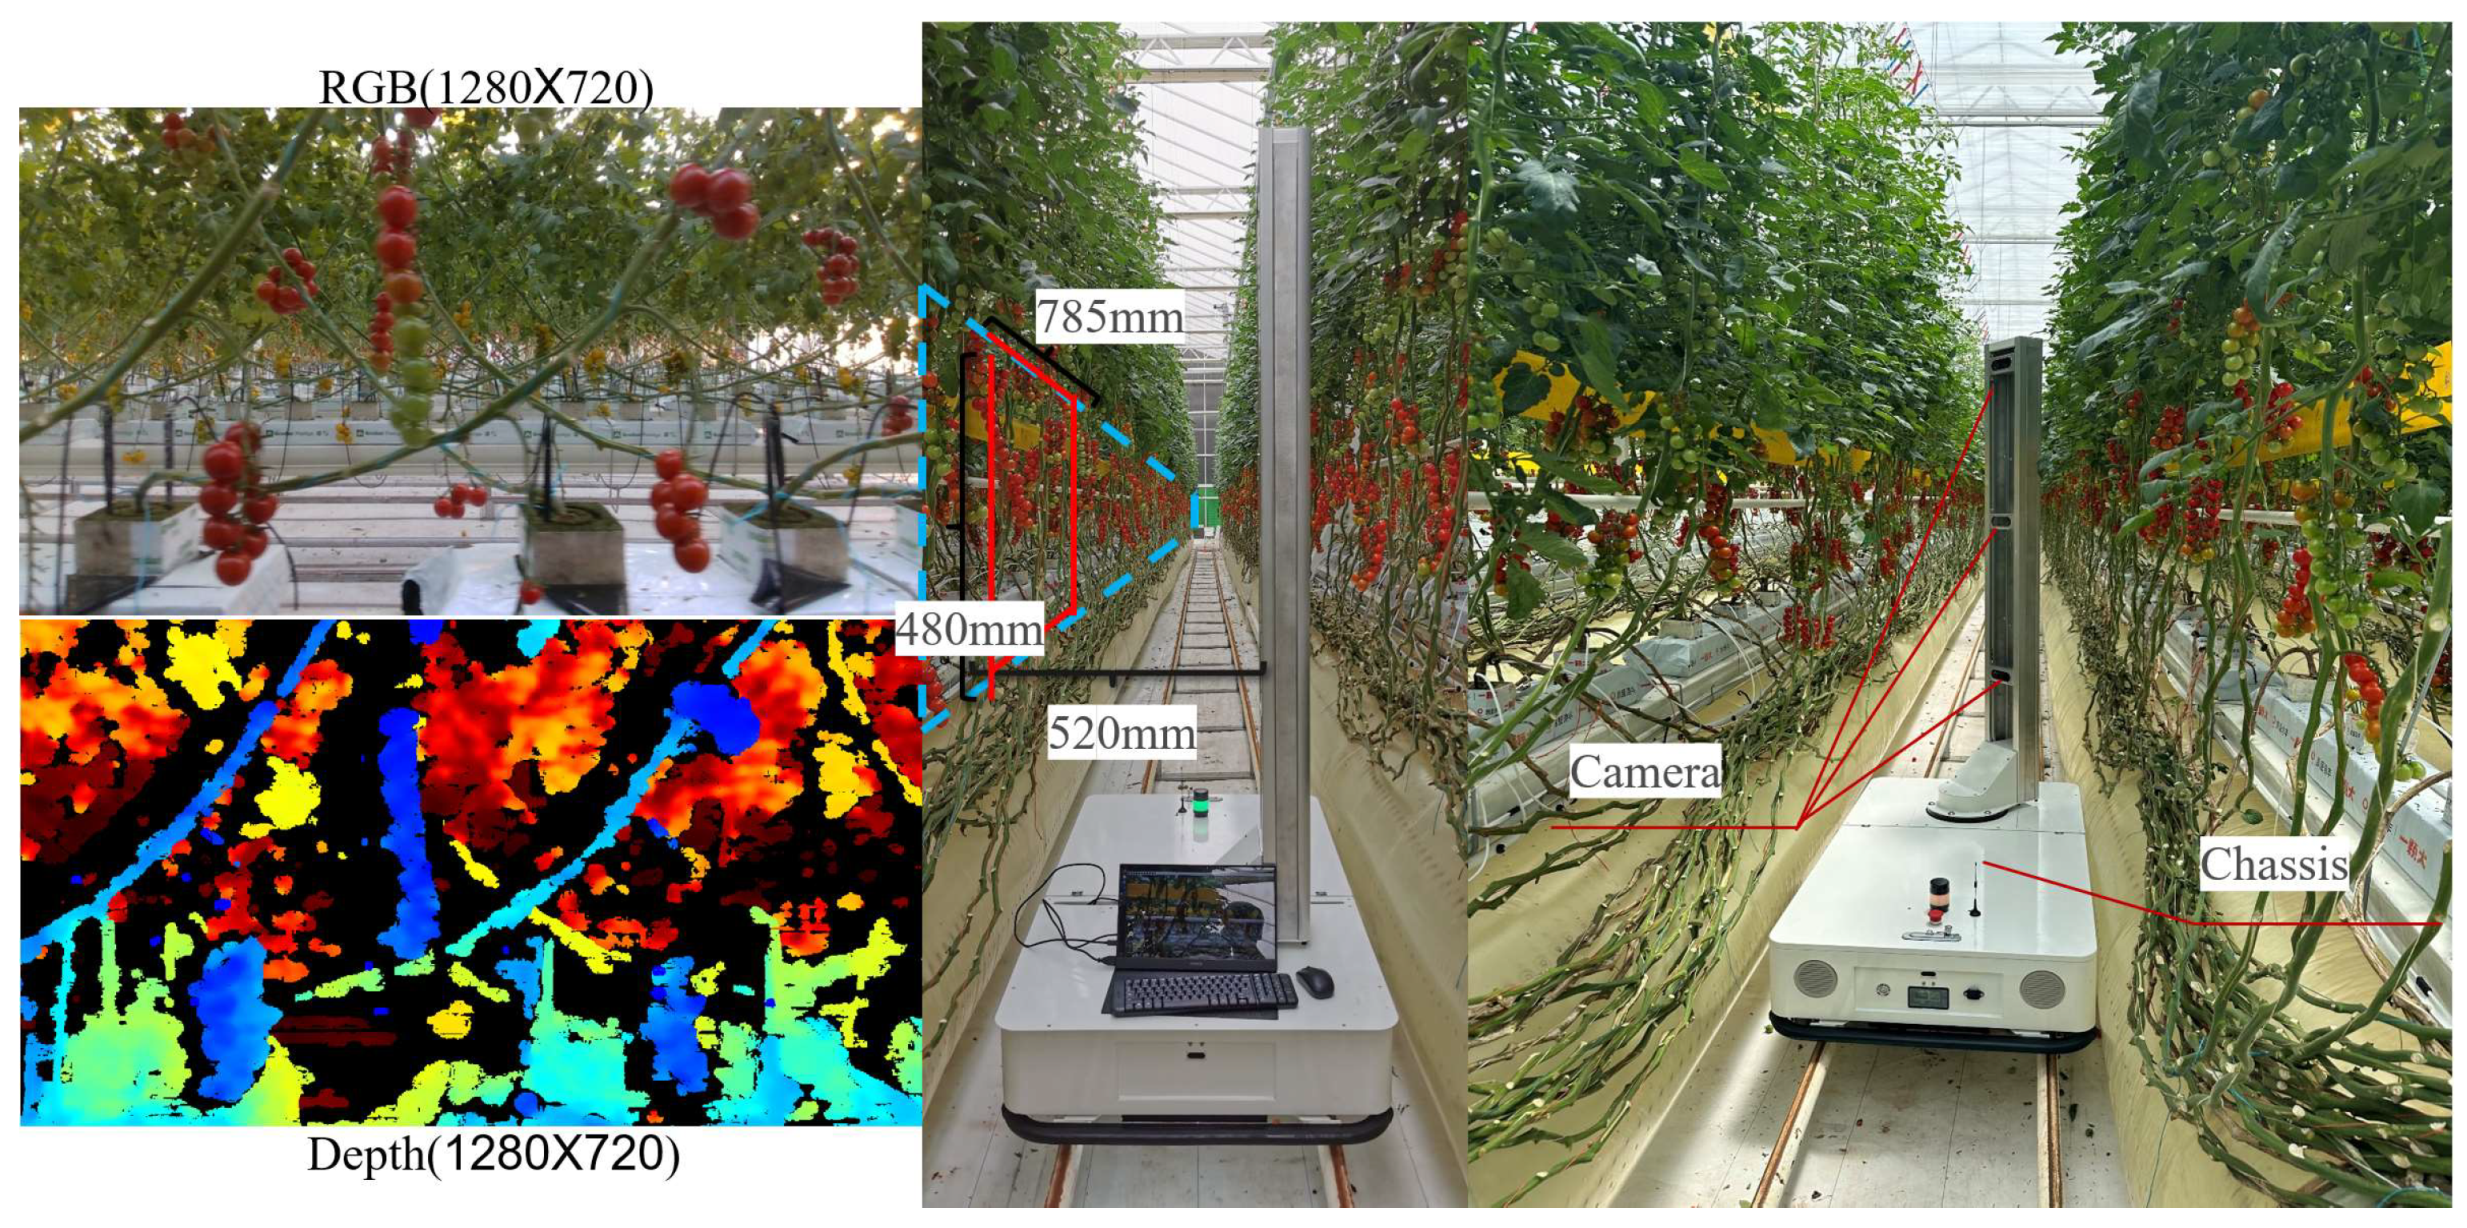
Figure 5.
Tomato filtering at the edge of the field of view: (a) the spatiotemporal tuple corresponding to the right rectangular box is deleted; (b) the spatiotemporal tuple corresponding to the right rectangular box is retained.
Figure 5.
Tomato filtering at the edge of the field of view: (a) the spatiotemporal tuple corresponding to the right rectangular box is deleted; (b) the spatiotemporal tuple corresponding to the right rectangular box is retained.
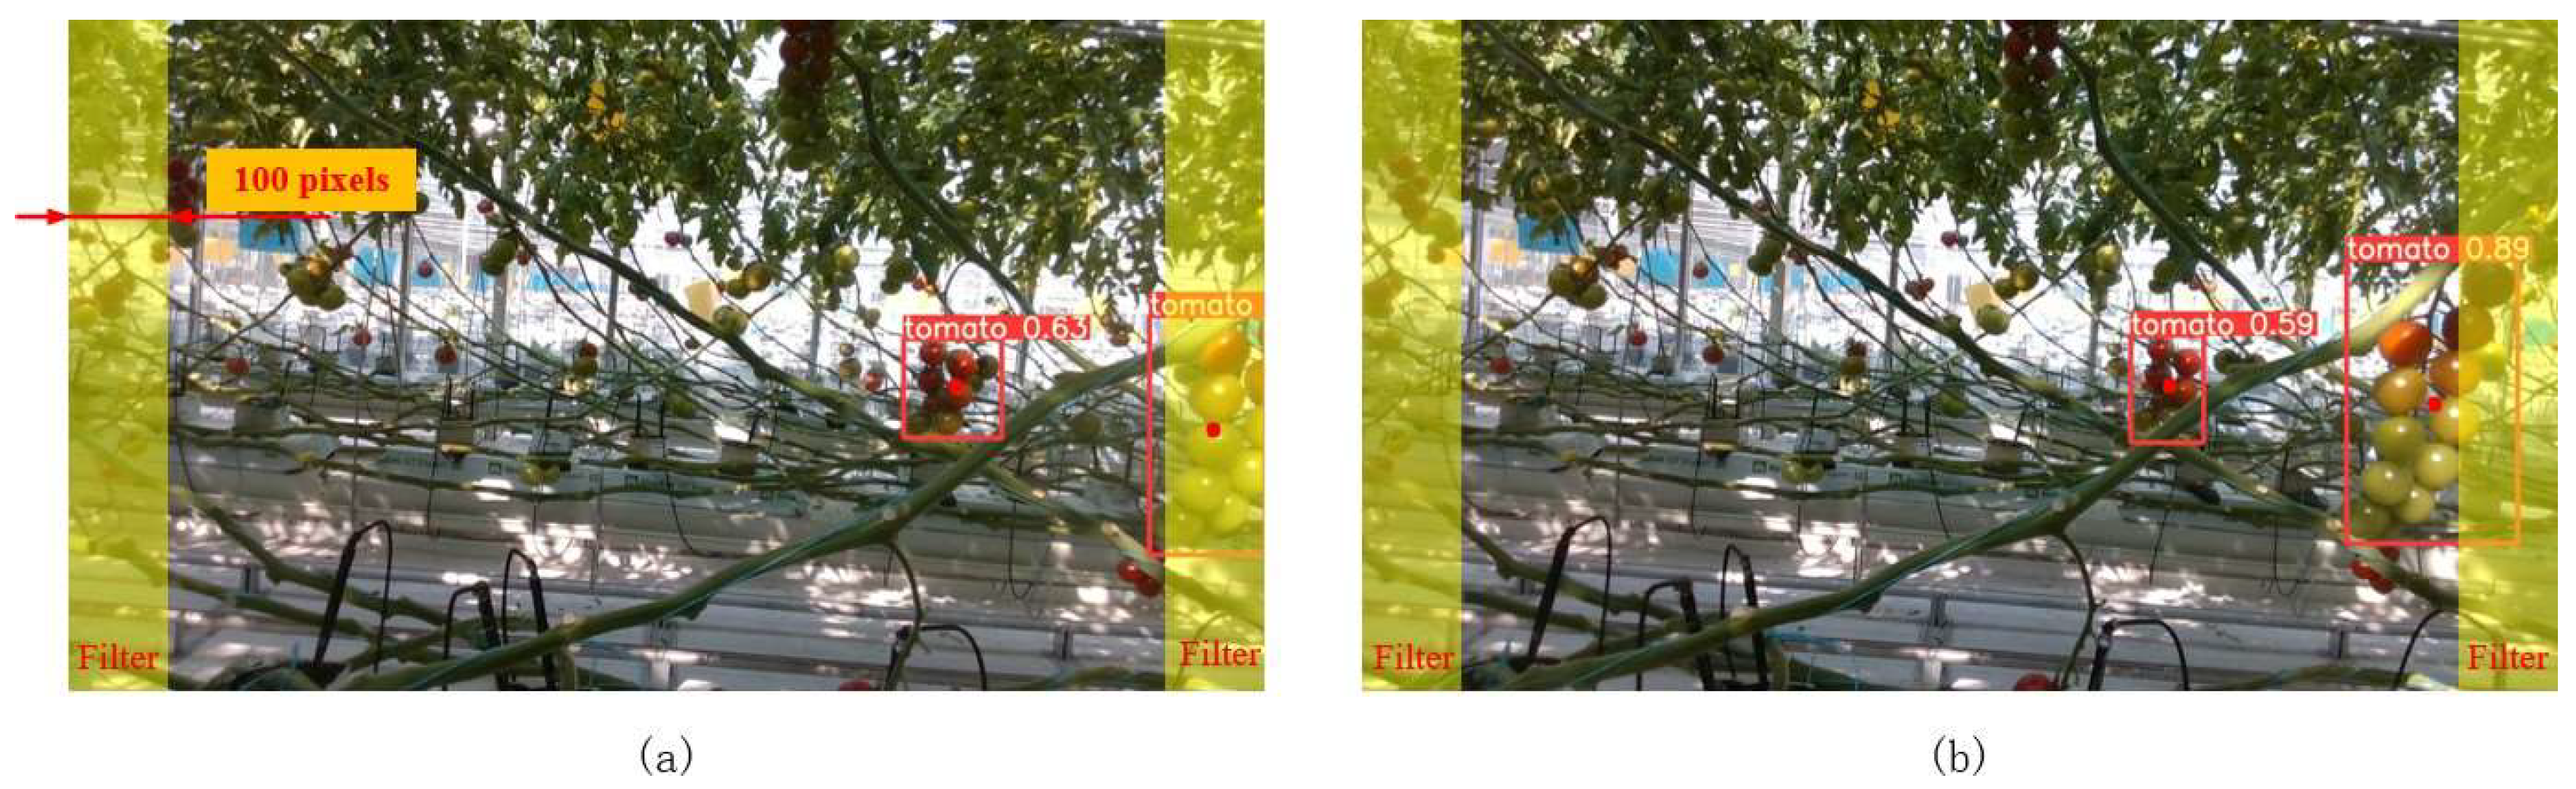
Figure 6.
Flow chart of Inter-frame prediction and target judgment.
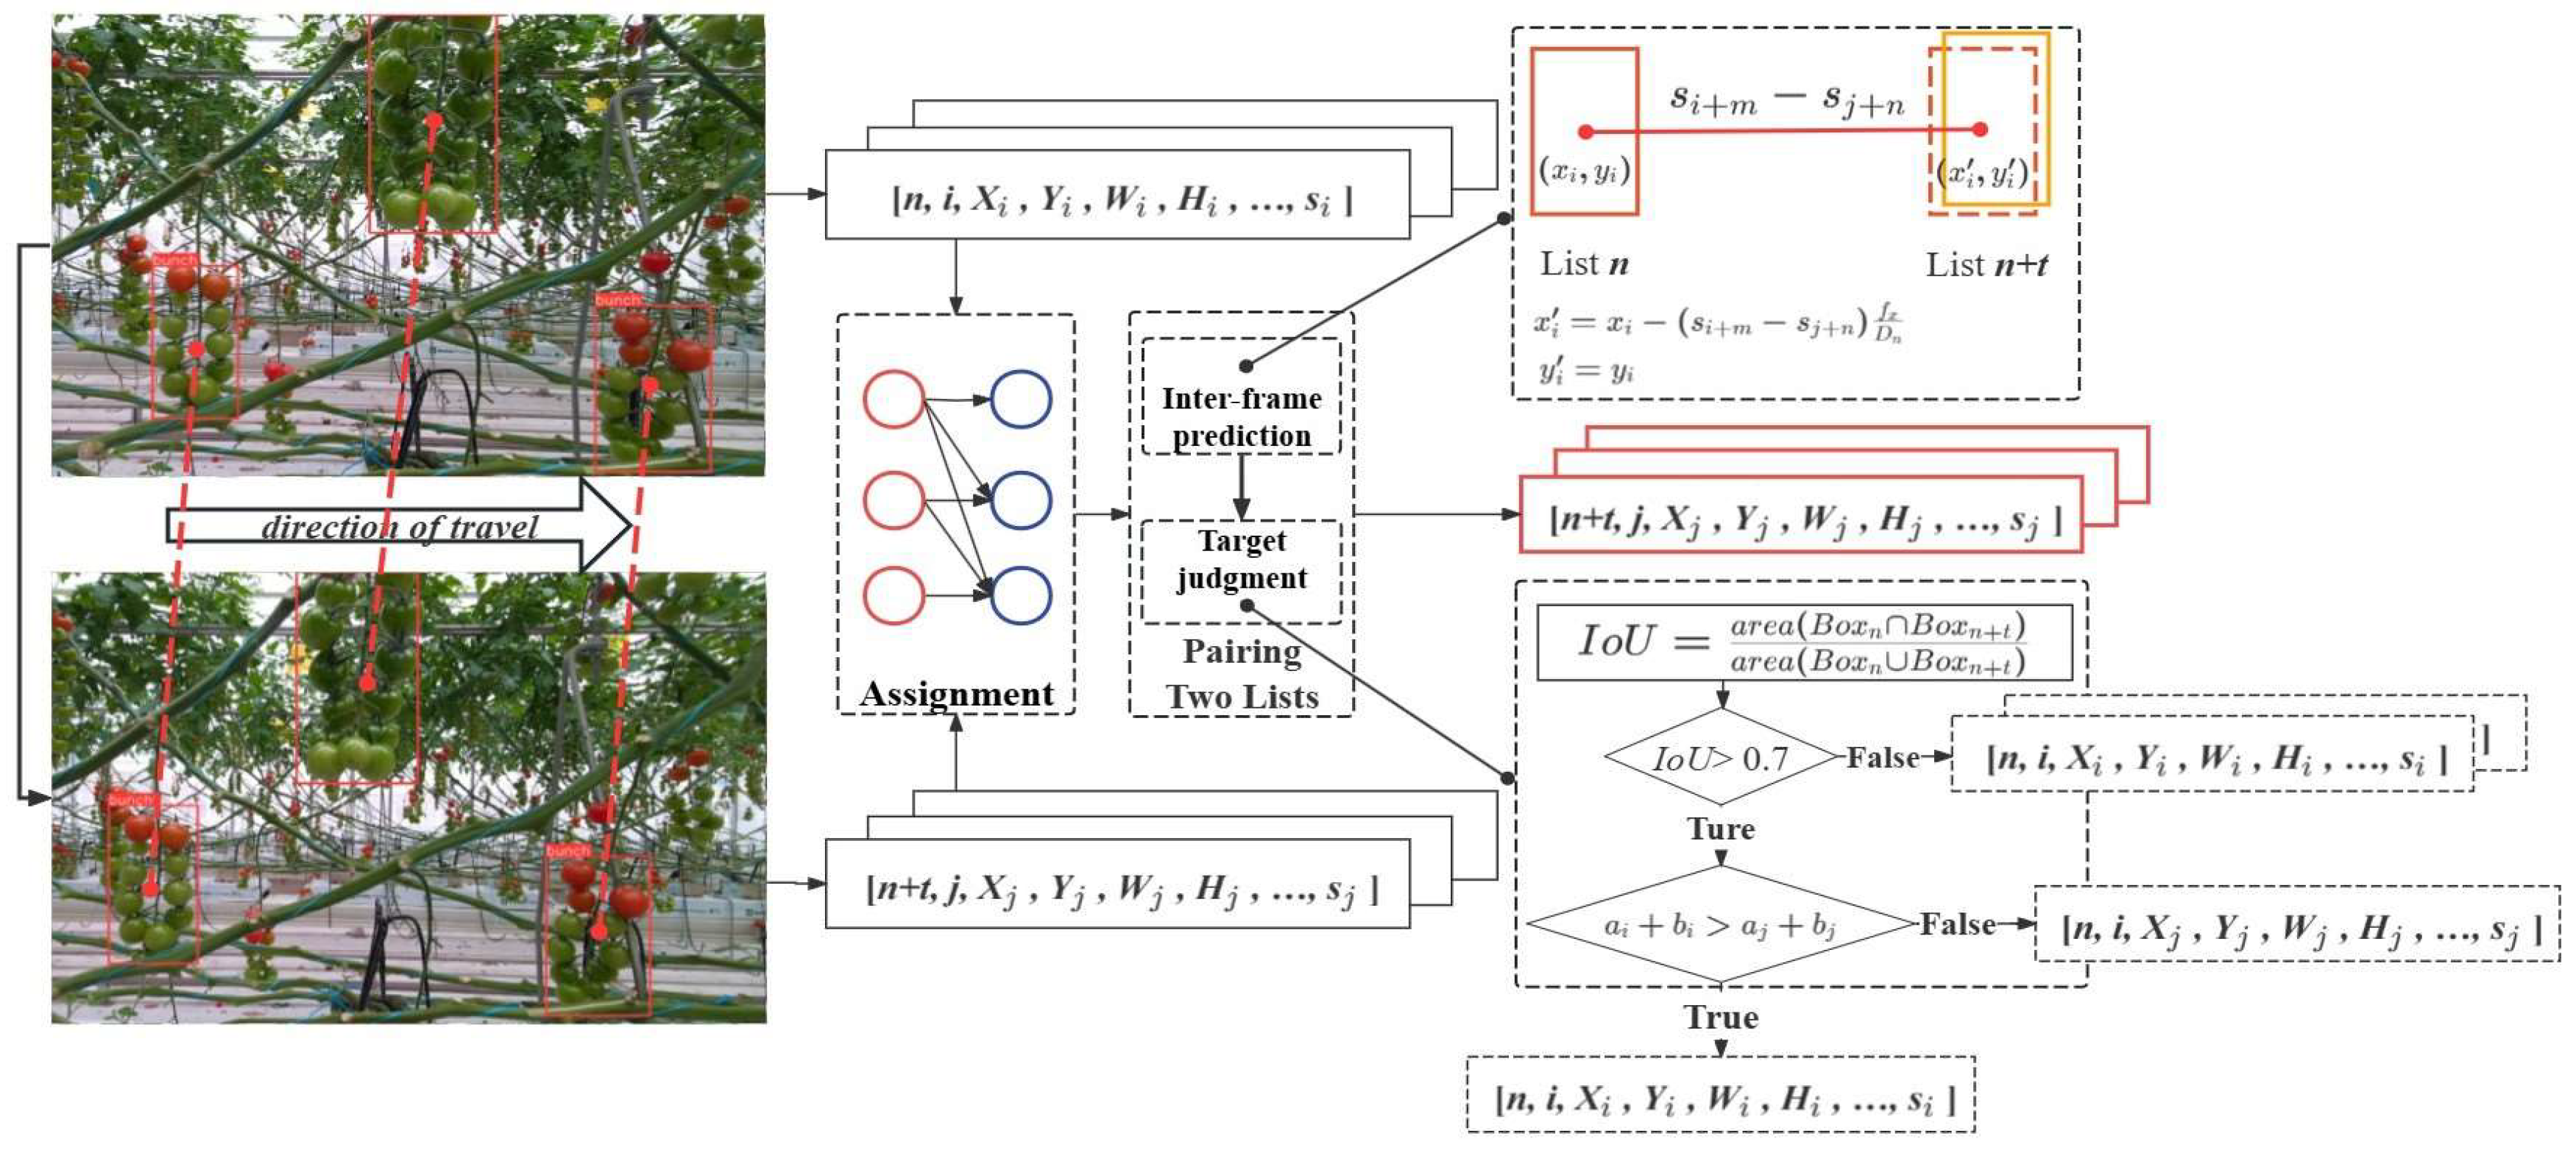
Figure 7.
The same tomato from different perspectives.
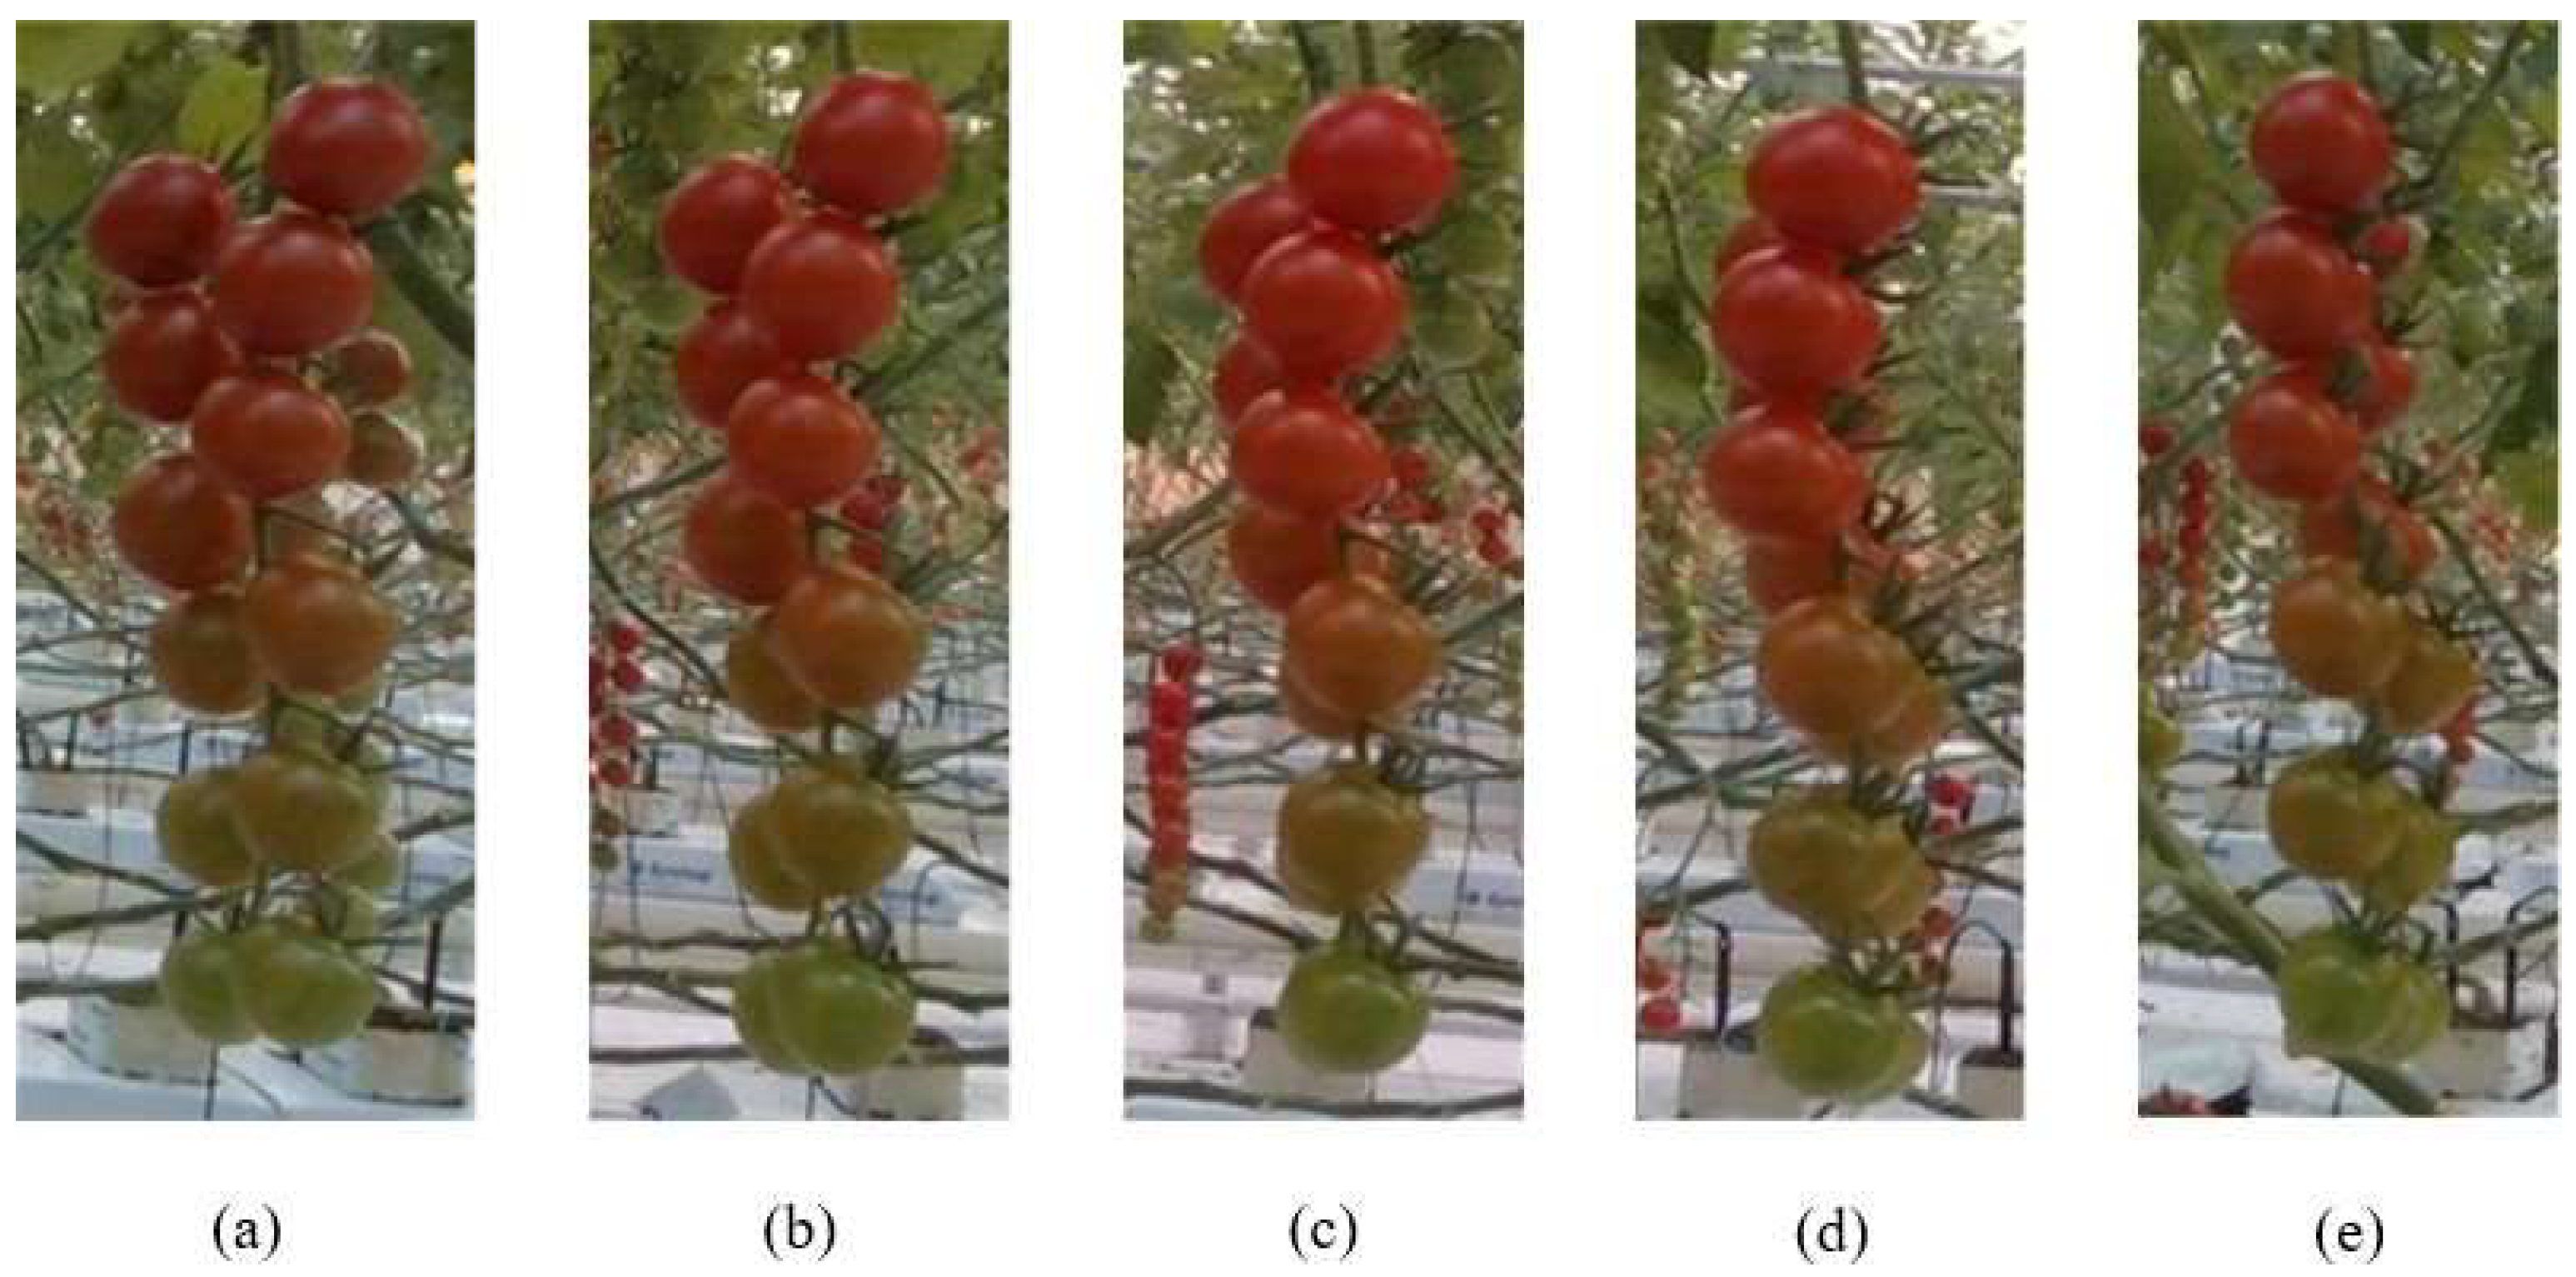
Table 1.
Inspection Robot Specifications.
| Feature | Specification |
| Dimensions | 1.4×0.86×2.2m |
| Weight | 200kg |
| Max Speed | 0.3 m/s |
| Operating Time | 6 hours |
| Camera | RealSense D435i |
| - Resolution | 1080x720 pixels |
| - Field of View (H) | [Insert FOV, 69.4°] |
| - Field of View (V) | [Insert FOV, 42.5°] |
| IMU | [IMU model,] |
| - Accuracy | [IMU accuracy, <1°/hr gyro drift] |
| -Resolution | [0.061(o/s)/(LSB)] |
| Computer | NVIDIA Jetson Nano |
Table 3.
Accuracy of tomato clusters counting in Ridge 1, 2, 3.
| Our Method | YOLOv8+DeepSORT | Density Estimation | |||||||
| 1st | 2nd | 3rd | 1st | 2nd | 3rd | 1st | 2nd | 3rd | |
| EC | 302 | 300 | 300 | 368 | 371 | 353 | 253(E) * | 231(E) | 277(E) |
| ACC | 97.73% | 97.09% | 97.09% | 80.91% | 79.94% | 85.76% | 81.81% | 74.80% | 83.90% |
* E indicates that the value is a calculated value by density estimation methods.
Table 4.
Counting accuracy of different maturity fruits based on our method.
| Our Method | Density Estimation | |||||
| 1st | 2nd | 3rd | 1st | 2nd | 3rd | |
| Measured value(mature) | 234 | 231 | 231 | 195(E) * | 161(E) | 201(E) |
| Measured value(mature) | 857 | 850 | 831 | 672(E) | 728(E) | 714(E) |
| ACC(mature) | 93.22% | 92.03% | 92.03% | 77.70% | 64.14% | 80.08% |
| ACC(immature) | 92.55% | 91.79% | 89.74% | 72.57% | 78.62% | 77.10% |
* E indicates that the value is a calculated value by density estimation methods.91.89
Disclaimer/Publisher’s Note: The statements, opinions and data contained in all publications are solely those of the individual author(s) and contributor(s) and not of MDPI and/or the editor(s). MDPI and/or the editor(s) disclaim responsibility for any injury to people or property resulting from any ideas, methods, instructions or products referred to in the content. |
© 2025 by the authors. Licensee MDPI, Basel, Switzerland. This article is an open access article distributed under the terms and conditions of the Creative Commons Attribution (CC BY) license (http://creativecommons.org/licenses/by/4.0/).
Copyright: This open access article is published under a Creative Commons CC BY 4.0 license, which permit the free download, distribution, and reuse, provided that the author and preprint are cited in any reuse.


