Submitted:
04 March 2025
Posted:
04 March 2025
Read the latest preprint version here
Abstract
Purity determination of precious metal is very crucial due to the economic value and hence metals like gold used for making jewelry must reflect the true value. Quantitative determination of jewelry is very important to ensure product integrity and consumer protection. The aim of the current study is to assess and compare the performance of EDXRF technique in the quality determination of gold jewelry. A total of 119 jewelry items containing gold of varying purity were assessed in the study and compared with fire assay. In conclusion, EDXRF technique appears to be a comparable alternative for rapid determination of elemental composition of gold in alloys especially for finished and semifinished ornaments. Further refinements in analytical accuracy may even replace destructive methods in practice.
Keywords:
EDXRF
; cupellation
; calibration
; purity
; gold
; silver
; zinc
Introduction
Elemental analysis refers to the determination of chemical composition and their composites in a given matrix. Analytical techniques commonly employed in elemental analysis include atomic absorption, inductively coupled plasma-mass spectrometry ICP-MS and ICP-optical emission spectroscopy depending on the sample characteristics, elements of interest, and assay sensitivity. Precious metals are naturally occurring elements of high economic value which include platinum, gold, silver, palladium, rhodium, etc. It is important from the consumers perspective that the metal like gold used for making jewelry must meet the quality mark specified in the label and reflect the true value of the product. Quantitative determination of jewelry is crucial especially when misrepresentation of the gold content is suspected. Therefore, measurement accuracy closest to the true concentrations is very important to protect consumers rights and trade related disputes.
Cupellation is a technique which involves subjecting the alloyed metals to a very high temperature to eliminate all base metals through oxidation in a cupel to determine the percentage of gold in alloy. It is the legal method applied for gold hallmarking due to its accuracy rates [1]. However, the destructive nature of this method makes it difficult to apply on jewelry product as it is not practical to destroy it every time to determine the purity.
Energy Dispersive X-Ray is a nondestructive rapid method that determines elemental abundance in liquid and solid samples [2]. It collects the excitation of elements simultaneously in an energy dispersive detector coupled to a multi-channel analyzer. The characteristic radiation of different energies from each sample element is then separated. The method is capable of both qualitative and quantitative determination of elements [3]. The main advantage of this technique is that it can be applied on semi-finished and finished jewelry without destruction and determines the quality of gold and other elements. The inherent concern of this technique appears to be the measurement uncertainty particularly with surface and matrix effect samples [4,5]. In EDXRF analysis, quantification is achieved by converting the measured fluorescent intensities into the elemental concentrations by fundamental parameters (FP) method. The factors influencing the accuracy of FP methods include measurement geometry, spectral distribution of X-ray tube etc. Application of standards mimicking the query samples has been found to compensate these effects leading to more accurate results. For instance, compatible calibration materials have shown to improve the accuracy in gold jewelry to less than 0.27% (1). Since the method is rapid, non-destructive and produces results close to fire assay [6], it has been widely applied for quality assessment of gold jewelry [7].
With this background, the purpose of the study is to assess whether EDXRF method can be applied to gold jewelry quality determination by comparing the results with more accurate fire assay which is a laborious and detstructive technique.
Materials and Method
Instrument and Calibration
An EDX-8100 energy dispersive X-ray fluorescence spectrometer (Shimadzu, Japan) was applied in the current study. The instrument is equipped with five primary filters and a camera for sample positioning. The high-performance SDD detector and optimized optics achieve high assay sensitivity. A standard sample is measured and the relationship with the fluorescent X-ray intensity plotted as a calibration curve, which is used for the quantitation of unknown samples. PCEDX pro software offers analysis, conditions settings, and data processing. The instrument was calibrated before analyzing the sample using the standard A750 provided by the manufacturer. Application of calibration standards containing known percentage Gold, Silver, Copper and Zinc comparable to the query samples. The parameters (tube voltage, current, etc.) and collimator size were same for calibration standards and the samples.
Sample Preparation & Analysis
Samples to be analyzed were wiped with alcohol and placed in the sample cuvette. Sample such as bracelet, bangles, rings etc., were mounted on sample tray using transparent tape and placed into the EDXRF sample compartment. An interference test was performed for both transparent tape and sample container to rule out any possible interference.
The samples were assessed at least on 2 different positions with 3 replicates and the mean value was taken. The analysis time for each replicate shall be equal to the time used for the reference material. A total of 119 jewelry items containing gold of varying purity were assessed in the study to determine the elemental composition. To compare the analytical accuracy, 10 representative samples (5 Bracelet, 3 Earing, and 2 other category samples were subjected to fire assay. A multivariate analysis was performed to assess the correlation and/ or differences among the alloy composition. To investigate the relationships between metal components (Gold, Silver, Copper, and Zinc) in jewelry samples, a pairplot visualization using the Seaborn library in Python was employed.
Results and Discussion
The factors influencing the analytical performance were optimized experimentally. The optimized values (50 kV voltage, 1mm collimator diameter and 60 seconds collection time) were applied throughout the study.
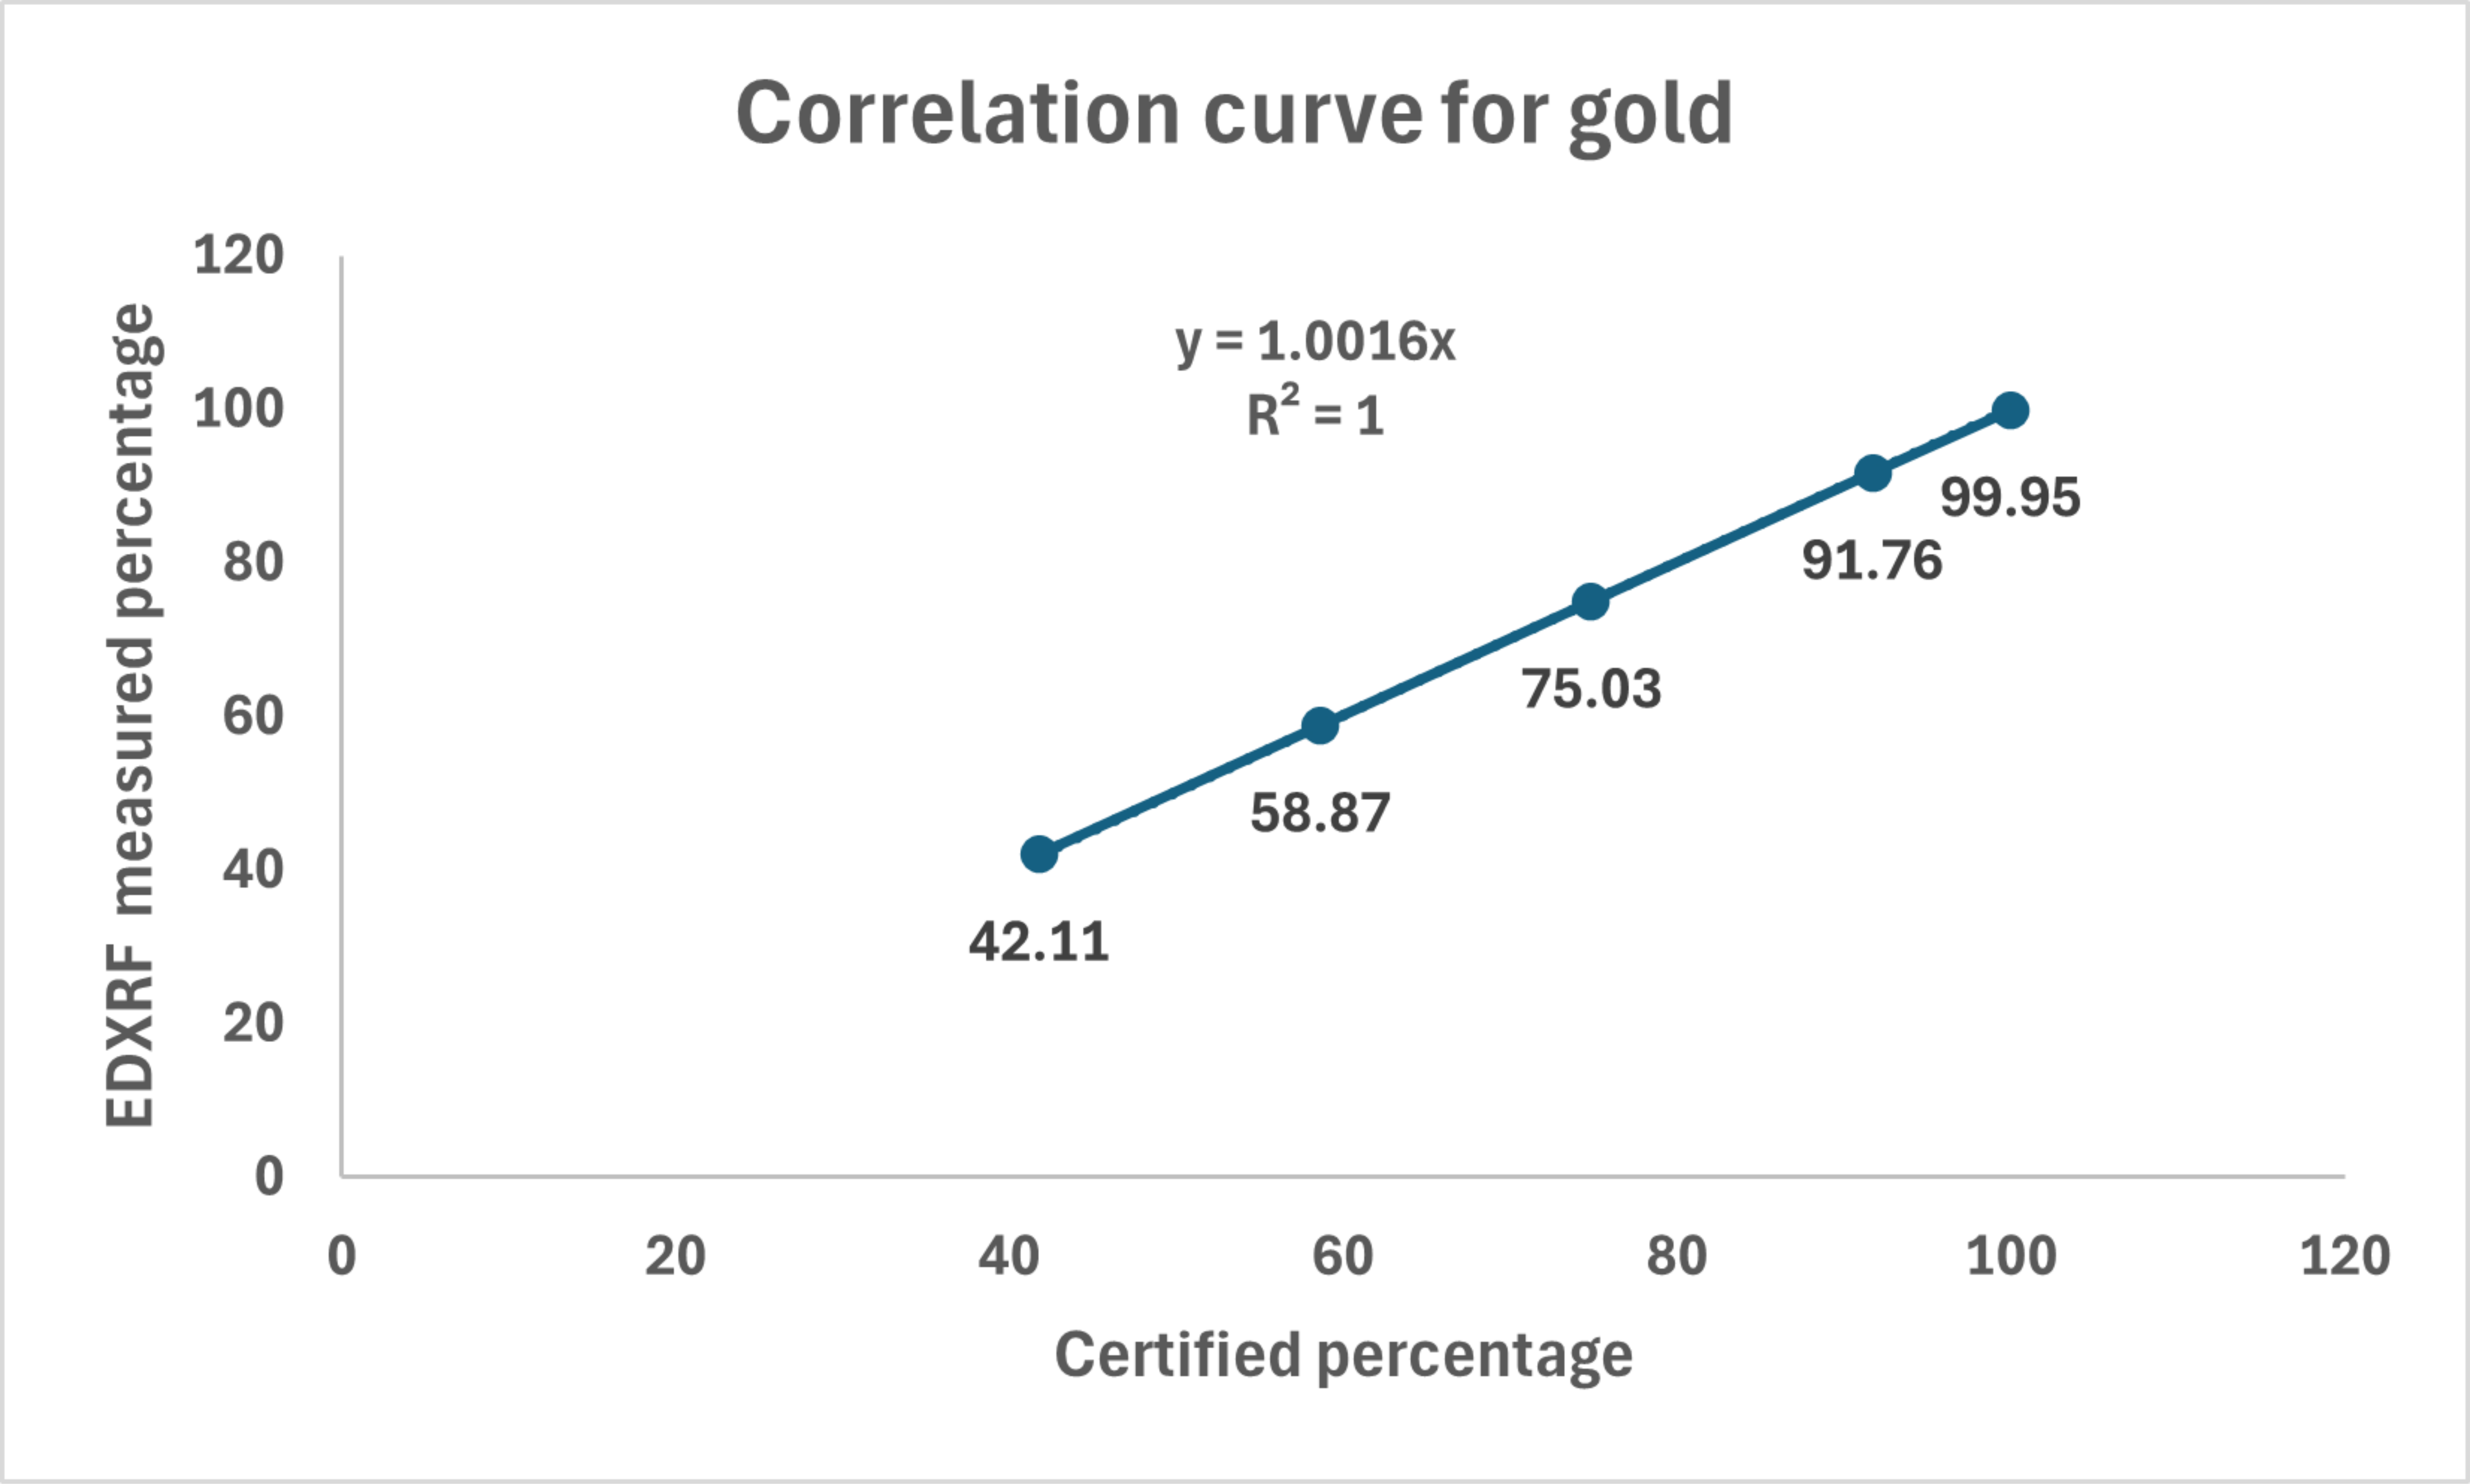
Despite its application in many analytical arenas for elemental analysis, quantitative determination is a challenge due to matrix effect [8]. Therefore, calibration of standard reference material plays a pivotal role to determine the accuracy of analytical instrument. The correlation coefficient of the applied standards suggests the linearity of the standard curve (Fig. 1).
The elemental composition of 119 jewelry samples utilized in the current study contained gold as major element followed by silver, copper and zinc. The purity determination of the studied samples was in the range of 51.08 ± 0.08 to 99.96 ±0.02 while predominant of the samples were in the range of 75.4 ±0.05. Of the tested samples, only one gold coin exhibited 24 carat quality with purity of 99.96 ±0.02 while the remaining 7 samples were in the range of 89.1 ±0.07- 93.3 ±0.05. The percentage of copper in the jewelry ranged from 5.18 ±0.08- 22.7±0.09% and was observed in all the samples except the 24-carat gold coin. About 86% of the sample contained silver at a percentage ranging from 1.2 ±0.12-13.3 ±0.07% while 73% of the sample contained zinc in the range of 0.4 ±0.17- 5±0.19. However, zinc was not found in jewelry of relatively higher purity. It appears that zinc is added as minor component in 18-carat gold alloys for mechanical properties, durability, and color. The elemental concentration determined by EDXRF were higher than those obtained through fire assay. A similar observation was reported by Lopez and coworkers (1) while determining the gold jewelry samples. Since EDXRF is known to exhibit disruptive property due to interelement effect [9], the observed variance could be an attribute of this effect and requires further investigation.
It is evident from the current study that application of matrix specific standards has improved the analytical accuracy of EDXRF by matrix effect correction. The mean absolute error was between 0.04 to 0.21% except for sample category range having 50% gold content. The error rate was 0.45 which is relatively higher when compared to other sample category (Table. 1). Although it is a significant progress in the analytical sensitivity, obtaining matrix specific materials for each category of jewelry is a challenge and needs to be developed and validated for different elemental composition.
The descriptive statistics of the dataset revealed an average gold content of 78.2 ±4.94% followed by silver, copper, and zinc of approximately 7.16%, 12.26%, and 2.39%, respectively. A one-way ANOVA did not find significant differences across jewelry groups for most elements (p-values > 0.05). The correlation coefficients calculated to quantify the strength and direction of relationships between metal components revealed negative correlations between gold content and other metals (r = -0.53 with Silver, r = -0.46 with copper, and r = -0.50 with Zinc), indicating the compositional trade-offs in jewelry alloys. The pairplot shows that the distributions of the metal concentrations have noticeable differences across groups (Fig. 2) with a strong inverse relationship between Gold and the other metals. As Gold content increases, the contents of Silver, Copper, and Zinc tend to decrease, which is also reflected in the negative correlations from the matrix. The visual clusters by jewelry group suggest that the alloy compositions may differ between groups, giving rise to distinct patterns in the pairwise comparisons.
Conclusion
In conclusion, EDXRF technique appears to be a comparable alternative for rapid determination of elemental composition of gold in alloys especially for finished and semifinished ornaments. Further refinements in analytical accuracy may even replace destructive methods in practice.
Acknowledgments
The authors gratefully acknowledge the support and encouragement of the Abu Dhabi Quality and Conformity Council. Gratitude is also extended to the management of Central Testing Laboratories (CTL) for invaluable support.
References
- Jurado-López, A., de Castro, L. & Pérez-Morales, R. 2006. Application of energy-dispersive X-ray fluorescence to jewelry samples determining gold and silver. Gold Bull 39, 16–21. [CrossRef]
- Krummenauer, A., Lapazin, L. H., Cenci, M. P., and Veit, H. M. 2023. Portable EDXRF spectrometer: determination of linearity, LOD, LOQ, and working range for the analysis of base and precious metals in liquid matrices. Journal of Physics.
- Figueiredo, F.M.J., Carretas, J.M., Leal, J.P. et al. 2024. Fast, accessible and reliable method for elemental analysis of metals in solution by ED-XRF spectroscopy. J Anal Sci Technol 15, 29. [CrossRef]
- Trojek, T., & Trojková, D. 2023. Uncertainty of Quantitative X-ray Fluorescence Micro-Analysis of Metallic Artifacts Caused by Their Curved Shapes. Materials, 16(3), 1133. [CrossRef]
- Pessanha, S., Guilherme, A. & Carvalho, M. L. 2009. Comparison of matrix effects on portable and stationary XRF spectrometers for cultural heritage samples. Appl. Phys. A 97, 497–505. [CrossRef]
- Yusoff M.S, M., Maarop, H., Noorul Ehsan, M., & Harun, H. (2002). Development of a Nondestructive Quantitative Procedure for the Analysis of Gold in Jewellery. Malaysian Journal of Science, 21, 27–30.
- Buccolieri A, Castellano A, Degl’Innocenti E, Cesareo R, Casciaro R, Buccolieri G. 2017. EDXRF analysis of gold jewelry from the archaeological museum of Taranto Italy. X-Ray Spectrom, 6(5):421–6. [CrossRef]
- Selivanovs, Z., Panchuk, V., & Kirsanov, D. (2023). On the Possibility of Universal Chemometric Calibration in X-ray Fluorescence Spectrometry: Case Study with Ore and Steel Samples. Applied Sciences, 13(9), 5415. [CrossRef]
- Mazuki, A. A. M., Mahat, M. M., Abdullah, S., Ramli, R., and Nor, F. M. 2023. Improving the accuracy of EDXRF results in gold alloy analysis by matrix effect correction. Spectrochim. Acta Part B At. Spectrosc, 201: 106629. [CrossRef]
Disclaimer/Publisher’s Note: The statements, opinions and data contained in all publications are solely those of the individual author(s) and contributor(s) and not of MDPI and/or the editor(s). MDPI and/or the editor(s) disclaim responsibility for any injury to people or property resulting from any ideas, methods, instructions or products referred to in the content. |
© 2025 by the authors. Licensee MDPI, Basel, Switzerland. This article is an open access article distributed under the terms and conditions of the Creative Commons Attribution (CC BY) license (http://creativecommons.org/licenses/by/4.0/).
Copyright: This open access article is published under a Creative Commons CC BY 4.0 license, which permit the free download, distribution, and reuse, provided that the author and preprint are cited in any reuse.


