
Submitted:
03 March 2025
Posted:
04 March 2025
You are already at the latest version
Abstract
Phase change materials (PCM) as liquid phase have the advantage of using the latent thermal heat as energy storage. Coconut oil (CO) has attracted much attention as PCM due to its high stability against oxidation. The addition of fumed silica has exhibited superior performance in thickening, thixotropy, sag resistance, reinforcement, and caking resistance. Although viscosity of CO-based dispersions has extensively been studied, few research has been done on time-dependent flow be-haviors. In this work, the rheological properties of fumed silica dispersed in CO at fractions of 1, 2, 3, and 4 vol.% were investigated. All suspensions showed shear-thinning behavior, which became more Newtonian at temperatures above the phase change. The 3 and 4 vol. % suspensions showed gel-like microstructures. The thixotropic properties of the 3 vol.% suspension at 30 °C and 35 °C were mainly studied through stepwise changes in shear rate. The results were consistent with thixotropic behavior with a complete recovery of the microstructure. The sweep frequency of this sample demonstrated the dominance of the elastic modulus at both temperatures. Therefore, a thixoelastic nature of this gel could be inferred.
Keywords:
coconut oil
; fumed silica
; thixotropy
; viscosity
; phase change material
; gel
; thermal damping
; cooling
1. Introduction
Conventional heat exchange fluids have generally lower thermal properties compared to solids. To address this limitation, nanofluids (NFs) have emerged as a transformative technology in industrial applications such as manufacturing engineering, electronics and computing [1,2,3]. NFs are colloidal suspensions of nano-sized particles (<100 nm) in base fluids. NFs significantly enhance thermal properties and heat exchange efficiency in both conductive and convective heat transfer mechanisms. The practical application of nanofluids is still under active investigation owing to the variability of results. Key factors governing their behavior and the heat transmission include the size, shape, and volumetric concentration of the nanoparticles, as well as the temperature, thermal conductivity, and flow dynamics of the base fluid [4,5]. The most important properties to consider in heat transfer applications are thermal conductivity and flow behavior, which are closely related to the stability of dispersions. [5,6,7].
Suspensions based on phase change materials (PCM) as liquid phase have the advantage of using the latent thermal heat as energy storage [8]. Typically, green phase change materials are found in vegetable oils. They are harmless, quite renewable, biodegradable, and easy to dispose of [8,9]. The use of vegetable oils as PCM has opened a wide space of research opportunities. Coconut oil (CO) has attracted much attention as PCM due to the high content of saturated fatty acids, which helps against oxidation. For that reason, the oxidative stability of CO is higher than other vegetable oils [10,11,12]. The addition of nanoparticles improves the thermal properties of these base liquids. Nano additives, such as fumed silica, exhibit superior performance in thickening, thixotropy, sag resistance, reinforcement, and caking resistance [13].
Rheological properties of fumed silica in vegetable oil dispersions play an important role in heat transmission applications. The stability of the suspensions is of utmost importance because the thermal and flow properties could vary if the nanoparticles are not well dispersed. Several researchers have investigated the rheological properties of CO based nanofluids [14,15,16,17]. They have mainly characterized the flow behavior in steady state. For example, viscosity curves as a function of shear rate have been fitted using well-known mathematical models. However, few research has been done on time-dependent flow behaviors. In some cases, suspensions can develop phenomena such as thixotropy or viscoelasticity. For example, in some heat transfer applications thixotropic fluids facilitate the flow and distribution of cooling agents by reducing their viscosity under high strain conditions. If the microstructure is restored after standing, this fluid could be reused in multiple cycles. In processes such as painting, drilling, and food processing, thixotropy is of vital importance to both processing and product performance.
In previous works [18], we have investigated the thermal properties of fumed silica in coconut oil. It was found that such suspensions form a strong microstructure at volume fractions higher than 3 vol.% which could be defined as gels. In this work, the rheological properties of fumed silica suspensions in CO at volume fractions of 1, 2, 3, and 4 vol.% were explored. Steady state viscosity versus shear rate curves were performed over a wide range of temperatures for all the silica concentrations. The viscosity increase due to the phase change was quantified with the power law mathematical model. The time-dependent rheological behavior, such thixotropy and viscoelasticity, of the 3 vol.% gel was investigated via stepwise changes and hysteresis loop. Finally, a thermal damping application of this gel was presented.
2. Results and Discussion
2.1. Characterization Studies
2.1.1. Nanofluid Chemical Composition. Particle Size and Shape
The FTIR of virgin coconut oil (CO) is depicted in Figure 1a. This IR spectrum shows the characteristic peaks of the CO components. The absence of peaks near 3,000 cm─1 and 1,650 cm─1 can be noted, indicating the absence of unsaturated fatty acids. However, the characteristic bands of the C─O bond ranging from 1,120-1,090 cm─1 and the carbonyl group at 1741 cm─1 predictable bands of fatty acid ethyl esters are present. There are also present the characteristic bands of the alkyl chain such as ─CH3 at 1,375 cm─1, ─CH2 at 720 cm─1 and C─H at 2920-2960 cm─1. This IR spectrum confirms that the major component of VCO is lauric acid and agrees with other reported IR spectra of coconut oil [19,20]. Figure 1b shows the FTIR spectrum of fumed silica A200. Figure 1b shows the FTIR spectrum of fumed silica A200. A band ranging from 1000-1100 cm-1 characteristic of the stretching vibration of the Si-O-Si structure can be distinguished. The shoulder found at 3,300-3,500 cm-1 can be assigned to the O-H stretching vibration of silanol groups. However, the peak around 1,630 cm-1, due to water molecules adsorbed onto the Si-O-Si bonds was not observed [21].
Figure 2 shows the TEM (transmission electron micro-118 scope) micrography of the silica powder A200 at two distinct magnifications, 100 nm and 50 nm, respectively. The TEM image revealed an average diameter of 20 ± 5 nm. In Figure 2a fractal structures of particles or groups of particles are shown and some platelet-like of different sizes are drawn. In Figure 2b groups of particles with fractal dimension are presented.
2.1.2. Differential Sacanning Calorimetry (DSC)
The evaluation of calorimetric properties is of paramount importance because additives may affect the phase change latent heat and the flow properties. Figure 3 presents the appearance of the base fluid (CO) and the CO-A200 suspensions at 10 °C, when the coconut oil was crystalized. In this Figure, it can be appreciated how the addition of silica particles strengthen the microstructure of the suspensions. The higher the particle loading the more solid-like structure was formed. The gel-like appearance is mainly observed at 3 and 4 vol% of fumed silica particles.
Figure 4 presents the corresponding 3-D DSC cooling (crystallization-Exo) and heating (melting-endo) dynamic thermograms of the CO-silica suspensions. Figure 4a shows the DSC cooling thermogram of coconut oil (CO) and the suspensions of silica in CO. The crystallization process of coconut oil is characterized by two peaks at -5.74 °C and 1.33 °C, respectively. These two peaks shift to higher temperatures and overlap with the addition of silica A200 becoming a shoulder at 3 and 4 vol% of silica, as it can be noticed in Figure 4a.
However, the DSC heating thermogram of all the samples slightly changed with the addition of silica, as it can be observed in Figure 4b. Contrary to the crystallization process in which heat conduction is the predominant heat exchange mechanism, in the melting process heat transfer involves mechanisms of both thermal conduction and natural convection. This complexity of the heat exchange process is reflected in the thermogram as a broad peak with the same phase change temperature for all the samples, around 24 °C. These thermograms were analized in a previous work [18]. Table 1 shows the phase change latent heat of the four suspensions and the base liquid. It can be assumed a linear decrease in the phase change latent heat. However, for heat exchange purposes the challenge should be an enhancement on the cp with the minimum reduction of the latent heat exchange. The CO-3A200 suspension maintained a good latent heat value and good enhancement of the specific heat capacity with respect to the CO [18].
2.2. Rheological Behavior
The flow properties of the CO─A200 suspensions must be studied for a better knowledge of the microstructure of the suspensions. The study was divided into steady shear and oscillatory shear.
2.1.1. Viscosity Curves in Steady Shear
The viscosity ─ shear rate/temperature curves are shown in Figure 5. It could be appreciated how the viscosity decreases with the increase of shear rate (left). The phase change also affects the viscosity, causing a great reduction of this parameter over 23 °C. But this effect diminished when increasing particle concentration. Therefore, the volume fraction of silica A200 exerted a great influence on the suspension rheology, as it is shwon in Figure 5 (left). For example, the suspension 4 vol% slightly modified the viscosity with temperature during the phase change. All temperatures (20-30 °C), exhibited shear-thinning flow, as it is expected in complex fluids. However, when the volume fraction was reduced, 3, 2, 1 vol%, a big jump in viscosity was observed during the phase change. Figure 5 (right) represents the effect of temperature on the suspension viscosities at different shear rate. In all cases, the influence of temperature also showed a reduction of the suspension viscosities. At temperatures over the phase change, this parameter exerts a weak effect on the suspensions viscosities. However, when the phase change start the flow behavior becomes non-Newtonian. At temperatures under the phase change the viscosity dramatically increases, mainly at low volume fractions (see 1, 2, 3 vol %).
The power law is the mathematical model (Equation 1) [22], which better describes the viscosity curves exhibited in Figure 5 (left).
Equation (1) can be easily linearized representing the logη versus log. The slope of this line is (n-1), where n is the flow behavior index. The intercept is logK, where K is called the flow consistency index. It reflects the thickness or the fluid resistance to flow. K also provides a complete picture of the fluid response under several shear condictions a ta a given temperature. The influence of particle concentration and temperature on K can be better visualize in Figure 6a. In this picture, the flow consistency index is displayed as a function of temperature for all the A200 concentrations. As it was explained before, K increases with volume particle concentration and reduces significantly over the phase change temperatures. This picture also confirms the small change of K with temperature at 4 vol% of silica. From the rheological point of view, K is related to the microstructure of the suspensions. High K values could be associated to a more interconnected network such as a structurated suspension or a gel. The 3 and 4 vol% colloids would be examples of structurated suspensions or gel. Figure 6b shows the effect of temperature on the flow behavior index, estimated from Equation (1). According to this picture, at temperatures below the phase change the suspensions are far from the Newtonian behavior. While at temperatures over the phase change the flow becomes more Newtonian at low volume fractions, as it can be expected. At 3 - 4 vol% the change of the flow index with temperature is minor.
2.1.2. Stepwise Changes Tests
Thixotropy could be defined as the rheological behavior characterized by a time-dependent decrease in viscosity caused by shear flow. This effect should be reversible when the flow is ceased. Therefore, the viscosity of these materials depends on the shear history. They could be shear-thinning, time dependent and they could also exhibit yield stress. Stepwise changes in shear rate provide a good basis for evaluating thixotropy behaviors. Figure 7 shows the stepwise changes in the shear rate of the CO-3A200 suspension. The sample at rest is suddenly subjected to a constant shear rate of 10 s-1 for 10 s. The material response produces an overshoot which gradually decreases until reaching a steady state value. In Figure 7a the corresponding curves at 30 and 35 ºC are presented. If the shear rate increases to 50 s-1 (Figure 7b) in a step-up test. The CO-3A200 responses in a similar way as it was explained before. That is, sudden increase of the stress followed by a gradual decay towards the steady value. If a rapid decrease of the shear rate to 10 s-1 is now applied, the stress growth response was observed. This last behavior provides the clearest evidence of a thixotropic response [23,24]. In this stepwise change test the microstructure of the dispersion was completely recovered, as it can be seen in Figure 7a and 7c. When the suspension is at rest a size distribution of flocs are formed. If mechanical energy is applied the sudden shear rate will normally decrease floc size because they are broken down by the hydrodynamic forces and the stress is reduced, as it is presented in Figure 7a at shear rate of 10 s-1. If the shear rate increases again, at 50 s-1 as in Figure 7b, the mechanical energy will reduce even more the floc sizes and the suspension stress until a lower constant value. A stepwise decrease in the shear rate allows the dispersion to build up the microstructure again. The mechanical shear energy cannot only cause floc breakdown but also induce flocculation to recover the original microstructure.
2.1.3. Hysteresis Loop
The hysteresis loop is a common phenomenon associated with thixotropy. It is observed in the viscosity curves upon ramping up the shear rate until a maximum value and then ramping it down to the initial value. Figure 8a shows the shear rate ramp of the CO-3A200 suspension at 30 °C and 35 °C. At 30 °C the hysteresis area is negligible. But at 35 °C, the viscosity is higher on increasing the shear rate than on the ramping down part of the cycle. That is, it appears a hysteresis loop in viscosity, which is consistent with thixotropy behavior [24]. This loop can be justified because the mechanical energy breaks down the suspension microstructure reducing the viscosity when increasing shear rate. In the second part of the cycle, when reducing the shear rate, the material has no time for building up structures to recover the initial viscosity. Figure 8b shows the frequency sweep in the linear viscoelastic region (LVR), γ=0.005, from 0.01 to 5 Hz of CO-3A200 at 30 °C and 35 °C. At both temperatures, G´, elastic modulus, is higher than the loss modulus, G´´. Although it seems inconsistent that G´ at 35 °C is higher than G´at 30 °C similar behavior is observed in Figure 8a. As was explained in 2.1.1, both indexes, K and n, were not greatly affected by temperature. Therefore, it could be assumed that the microstructure of this suspension was hardly influenced by thermal energy. This figure could reflect a certain elastic behavior at both temperatures. Therefore, this gel could be described as a thixoelastic material [24].
2.3. Buffer Application
Based on the thermal properties shown in Figure 4 discussed in 2.1.2 and the flow properties debated in 2.2 the CO-3A200 suspension was selected as the most appropriate for heat exchange purposes. To check the suitability of the CO-3A200 suspension as heat exchanging material a buffer test with a laptop charger was designed. 300 ml of CO-3A200 were placed in a plastic bag (wrapping) and cooled in the refrigerator to a temperature around 15 °C. The computer charger was wrapped with the nanofluid bag, as it is shown in Figure 9a, ensuring that the contact wrapper-charger was total, to minimize heat losses and achieve effective heat transfer between both bodies. Thermographic pictures were taken to control the evolution of temperature with time. In the first test, the thermal pictures were taken with the charger inside the wrapper, as shown in Figure 9a. The second test was performed with the wrapper open, as shown in Figure 9b. The third test was performed in the open air.
Figure 10a shows the curves obtained in the three tests performed during 140 min, as it was described above. In the three tests, the thermal images were taken each 10 min. The test performed with the charger in open air (COA) showed a maximum temperature peak of 54.5 °C at 40 min, which began to slowly decrease to 37 °C at 140 min. The images taken on the outer side of the wrapper, named as charger in close wrapper (CCW), exhibited a temperature reduction of 9 °C (28 °C) at 70 min, which decreased to 22 °C at 140 min. The pictures taken on the charger onto the open wrapper (COW) displayed a peak temperature of 38 °C at 50 min. This temperature reduced to 30 °C at 140 min. Figure 10b exhibits the visible and infrared images of the wrapper after enclosing the charger for 140 min. The green circle shows the shape of the charger originated when the heat of the power supply melted the suspension which was inside the bag in contact with it. When the heat transfer process is completed the nanofluid can be recycled to its initial state by cooling it in the refrigerator to the initial temperature of 15 ºC. The heat exchange process can be repeated under the conditions initially described for more than 25 cycles. The stepwise tests demonstrated the recycling capacity of CO-3A200 suspension. The thermal stability of this suspension was described in [18].
3. Conclusions
In this work, the rheological behavior of fumed silica in CO was discussed. The following conclusions can be drawn from the results obtained:
- The viscosity of the suspensions increased with the addition of fumed silica and during the phase change of the base liquid. However, above the phase change temperature the suspension viscosities demonstrated little variation with temperature.
- The 3 and 4 vol.% dispersions exhibited gel like microstructure. Stepwise changes in shear rate of the 3 vol.% suspension at 30 °C and 35 °C revealed a trend consistent with a thixotropic response. However, the hysteresis loops showed a small area at 35 °C and were negligible at 30 °C. This could be interpreted as slight thixotropic behavior. The frequency sweep presented higher values of the elastic modulus for the two temperatures. Therefore, the CO-3A200 gel could be described as a thixoelastic material.
- In summary, the addition of 3 vol.% fumed silica contributed to the formation of a strong and resilient internal structural suspension. This gel-like material flowed under high stress, facilitating optimal flow and rapid heat dissipation and reversibly reconstituted when the stress was removed, ensuring long-term use. This rheological behavior conferred to the CO-3A200 suspension superior thermal damping capabilities compared to conventional fluids.
4. Materials and Methods
Coconut oil (CO) was purchased in a local grocery store. The density in the solid state is 0.916 ± 0.002 g/mL at 15 ºC and in the liquid phase 0.9015 ± 0.0005 g/mL at 25 °C. Commercially available colloidal hydrophilic silica (A200) was purchased from Evonik Degussa Ibérica S.A. (Spain). The real density was 2.318 ± 0.0012 g/cm3. The BET (Brunauer-Emmett-Teller) area was 108 ≈ 200 ± 20 m2/g [18]. Nanofluids were prepared by adding silica powder to coconut oil at 25 °C in concentrations of 1, 2, 3 and 4 vol.%. The mixture was stirred in an Onilab OS40-Pro system (Labbox, Barcelona, Spain) at 750 rpm for 30 min. The samples were sonicated at low vacuum for 30 min to disperse the powder and eliminate air bubbles.
A FTIR 6800FV model was used to record the IR spectra in the range from 400 cm-1 to 4000 cm-1, with a standard resolution of 4 cm-1, as well as 64 accumulations per sample. Measurements were performed by attenuated total reflectance using the ATR ProOne accessory and targeting in air, without the need to disperse or treat the samples. Electron micrographs (TEM) were performed in a JEM-1400 TEM, JEOL Company, USA, with a tungsten-filament of 120 kV. The powder was dispersed in ethanol and some drops were left on Formvar (copper) grids. Thermal images were taken using a 222 Testo model 872 camera (Testo SE & Co. KGaA, Spain), with a thermal sensitivity of 0.06 223 °C and resolution of 320 x 240 pixels, which provides infrared and/or real images in the 224 range of -30 °C to 100 °C. Rheological tests were conducted in a Haake Mars 40/60 rheometer (ThermoFisher Scientific, Vreden, Germany) using a plate-plate geometry of 20 mm diameter made of stainless steel. A Peltier system controlled the temperature of the samples. Viscosity-shear rate curves were recorded in the interval of 0.01-100 s-1. The stepwise test was performed at shear rates of 10 s-1 – 50 s-1 – 10 s-1, respectively. Each step lasted for 10 s. The frequency sweep was performed in the range of 0.01–10 Hz under a shear strain of 0.005. To eliminate the previous material history, a pre-shear stage was applied at 60 s-1 for 30 s followed by a 30 s rest time before the measurements of each test were recorded.
Author Contributions
Conceptualization, J.J.J.G. and A.I.G.M.; methodology, J.J.J.G. and A.I.G.M.; software, J.J.J.G. ; validation J.J.J.G. and A.I.G.M.; formal analysis, J.J.J.G. and A.I.G.M.; investigation, J.J.J.G.; resources, A.I.G.M.; data curation, J.J.J.G.; writing—original draft preparation, J.J.J.G. and A.I.G.M.; writing—review and editing, J.J.J.G. and A.I.G.M.; visualization, J.J.J.G.; supervision, A.I.G.M.; project administration, A.I.G.M.; funding acquisition, J.J.J.G. and A.I.G.M.; All authors have read and agreed to the published version of the manuscript.
Funding
This research was funded by the PROYEXCEL_00181 (Junta de Andalucia), Spain.
Data Availability Statement
The original contributions presented in the study are included in the article, further inquiries can be directed at the corresponding author.
Acknowledgments
The authors would like to acknowledge Prof. F.J. Rubio-Hernández for the rheological advice. The financial support provided by the PROYEXCEL_00181 (Junta de Andalucia), Spain, the SCAI service of the University of Málaga for the DSC measurements, SEM, TEM and optical images and the IMECH.UMA.
Conflicts of Interest
The authors declare no conflicts of interest. The funders had no role in the design of the study; in the collection, analyses, or interpretation of data; in the writing of the manuscript; or in the decision to publish the results.
References
- Rafati, M.; Hamidi, A.A.; Niaser, M.S. Application of nanofluids in computer cooling systems (heat transfer performance of nanofluids). App. Thermal Eng. 2012, 45, 9–14. [Google Scholar] [CrossRef]
- Maghrabie, H.M.; Olabi, A.G.; Sayed, E.T.; Wilberforce, T.; Elsaid, K.; Doranehgard, M.H.; Abdelkareem, M.A. Microchannel heat sinks with nanofluids for cooling electronic components: Performance enhancement, challenges, and limitations. Therm. Sci. Eng. Prog. 2023, 37, 101608. [Google Scholar] [CrossRef]
- Wang, X.; Song, Y.; Li, C.; Zhang, Y.; Ali, H.M.; Sharma, S. . Zhou, Z. Nanofluids application in machining: a comprehensive review. Int. J. Adv. Manuf. Technol. 2024, 131, 3113–3164. [Google Scholar] [CrossRef]
- Philip, J.; Shima, P.D. Thermal properties of nanofluids. Adv. Colloid Interface Sci. 2012, 183, 30–45. [Google Scholar] [CrossRef] [PubMed]
- Bobbo, S.; Buonomo, B.; Manca, O.; Vigna, S.; Fedele, L. Analysis of the parameters required to properly define nanofluids for heat transfer applications. Fluids 2021, 6, 65. [Google Scholar] [CrossRef]
- Awais, M.; Bhuiyan, A.A.; Salehin, S.; Ehsan, M.M.; Khan, B.; Rahman, M.H. Synthesis, heat transport mechanisms and thermophysical properties of nanofluids: A critical overview. Int. J. Thermofluids. 2021, 10, 100086. [Google Scholar] [CrossRef]
- Oemar, B.; Arifin, A.; Bahrin, D.; Ramadhan, D.; Rifqy, M.A.; Tinambunan, M.R. Experimental Investigation on Thermophysical and Stability Properties of TiO2/Virgin Coconut Oil Nanofluid. Sci. Technol. Indones. 2023, 8, 178–183. [Google Scholar] [CrossRef]
- Nazir, H.; Batool, M.; Osorio, F.J. B.; Isaza-Ruiz, M.; Xu, X.; Vignarooban, K. . Kannan, A.M. Recent developments in phase change materials for energy storage applications: A review. Int. J. Heat Mass Transf. 2019, 129, 491–523. [Google Scholar] [CrossRef]
- Kahwaji, S.; White, M.A. Edible oils as practical phase change materials for thermal energy storage. Appl. Sci. 2019, 9, 1627. [Google Scholar] [CrossRef]
- Wu, W.Y.; Gao, M.; Jueyuan, R.Y.; Lin, M.; Wang, S.; Thitsartarn, W.; Zhang, X.; Kai, D.; Wang, P.; Qu, Z.; Xu, J.; Loh, X.J.; Zhu, Q. Plant oil-based phase change materials for sustainable thermal energy storage: A review. Fuel 2024, 378, 132940. [Google Scholar] [CrossRef]
- Saleel, C.A. A review on the use of coconut oil as an organic phase change material with its melting process, heat transfer, and energy storage characteristics. J. Therm. Anal. Calorim. 2022, 147, 4451–4472. [Google Scholar] [CrossRef]
- Jayadas, N.H.; Nair, K.P. Coconut Oil as Base Oil for Industrial Lubricants—Evaluation and Modification of Thermal, Oxidative and Low Temperature Properties. Tribol. Int. 2006, 39, 873–878. [Google Scholar] [CrossRef]
- Ellerbrock, R.; Stein, M.; Schaller, J. Comparing amorphous silica, short-range-ordered silicates and silicic acid species by FTIR. Sci. Rep. 2022, 12, 11708. [Google Scholar] [CrossRef]
- Cortes, V.; Ortega, J.A. Evaluating the rheological and tribological behaviors of coconut oil modified with nanoparticles as lubricant additives. Lubricants. 2019, 7, 76. [Google Scholar] [CrossRef]
- Sujith, S.V.; Solanki, A.K.; Mulik, R.S. Experimental evaluation on rheological behavior of Al2O3-pure coconut oil nanofluids. J. Mol. Liq. 2019, 286, 110905. [Google Scholar] [CrossRef]
- Sajeeb, A.; Krishnan Rajendrakumar, P. Experimental studies on viscosity and tribological characteristics of blends of vegetable oils with CuO nanoparticles as additive. Micro Nano Lett. 2019, 14, 1121–1125. [Google Scholar] [CrossRef]
- Raghav, R.; Mulik, R.S. Effects of temperature and concentration of nanoparticles on rheological behavior of hexagonal boron nitride/coconut oil nanofluid. Colloids Surf. A: Physicochem. Eng. Asp. 2024, 694, 134142. [Google Scholar] [CrossRef]
- Jiménez-Galea, J.J.; Gómez-Merino, A.I. Fumed Silica in Coconut Oil Based Nanofluids for Cooling and Lubrication in Drilling Applications. Lubricants. 2024, 12, 436. [Google Scholar] [CrossRef]
- Dhamodharan, P.; Bakthavatsalam, A.K. Experimental investigation on thermophysical properties of coconut oil and lauryl alcohol for energy recovery from cold condensate. J. Energy Storage. 2020, 31, 101639. [Google Scholar] [CrossRef]
- Kumari, S.; Jamwal, R. Use of FTIR spectroscopy integrated with multivariate chemometrics as a swift, and non-destructive technique to detect various adulterants in virgin coconut oil: a comprehensive review. Food Chem. Adv. 2023, 2, 100203. [Google Scholar]
- Kim, K.M.; Kim, H.; Kim, H.J. Enhancing thermo-mechanical properties of epoxy composites using fumed silica with different surface treatment. Polymers. 2021, 13, 2691. [Google Scholar] [CrossRef] [PubMed]
- Chen, Q.; Li, J.; Song, Y.; Christopher, D.M.; Li, X. Modeling of Newtonian droplet formation in power-law non-Newtonian fluids in a flow-focusing device. Heat Mass Transf. 2020, 56, 2711–2723. [Google Scholar] [CrossRef]
- Mewis, J.; Wagner, N.J. Thixotropy. Adv. Colloid Interface Sci. 2009, 147, 214–227. [Google Scholar] [CrossRef] [PubMed]
- Larson, R.G.; Wei, Y. A review of thixotropy and its rheological modeling. J. Rheol. 2019, 63, 477–501. [Google Scholar] [CrossRef]
- Malkin, A.Y.; Derkach, S.R.; Kulichikhin, V.G. Rheology of gels and yielding liquids. Gels. 2023, 9, 715. [Google Scholar] [CrossRef]
Figure 1.
FTIR spectra of (a) virgin coconut oil (CO) and (b) fumed silica.
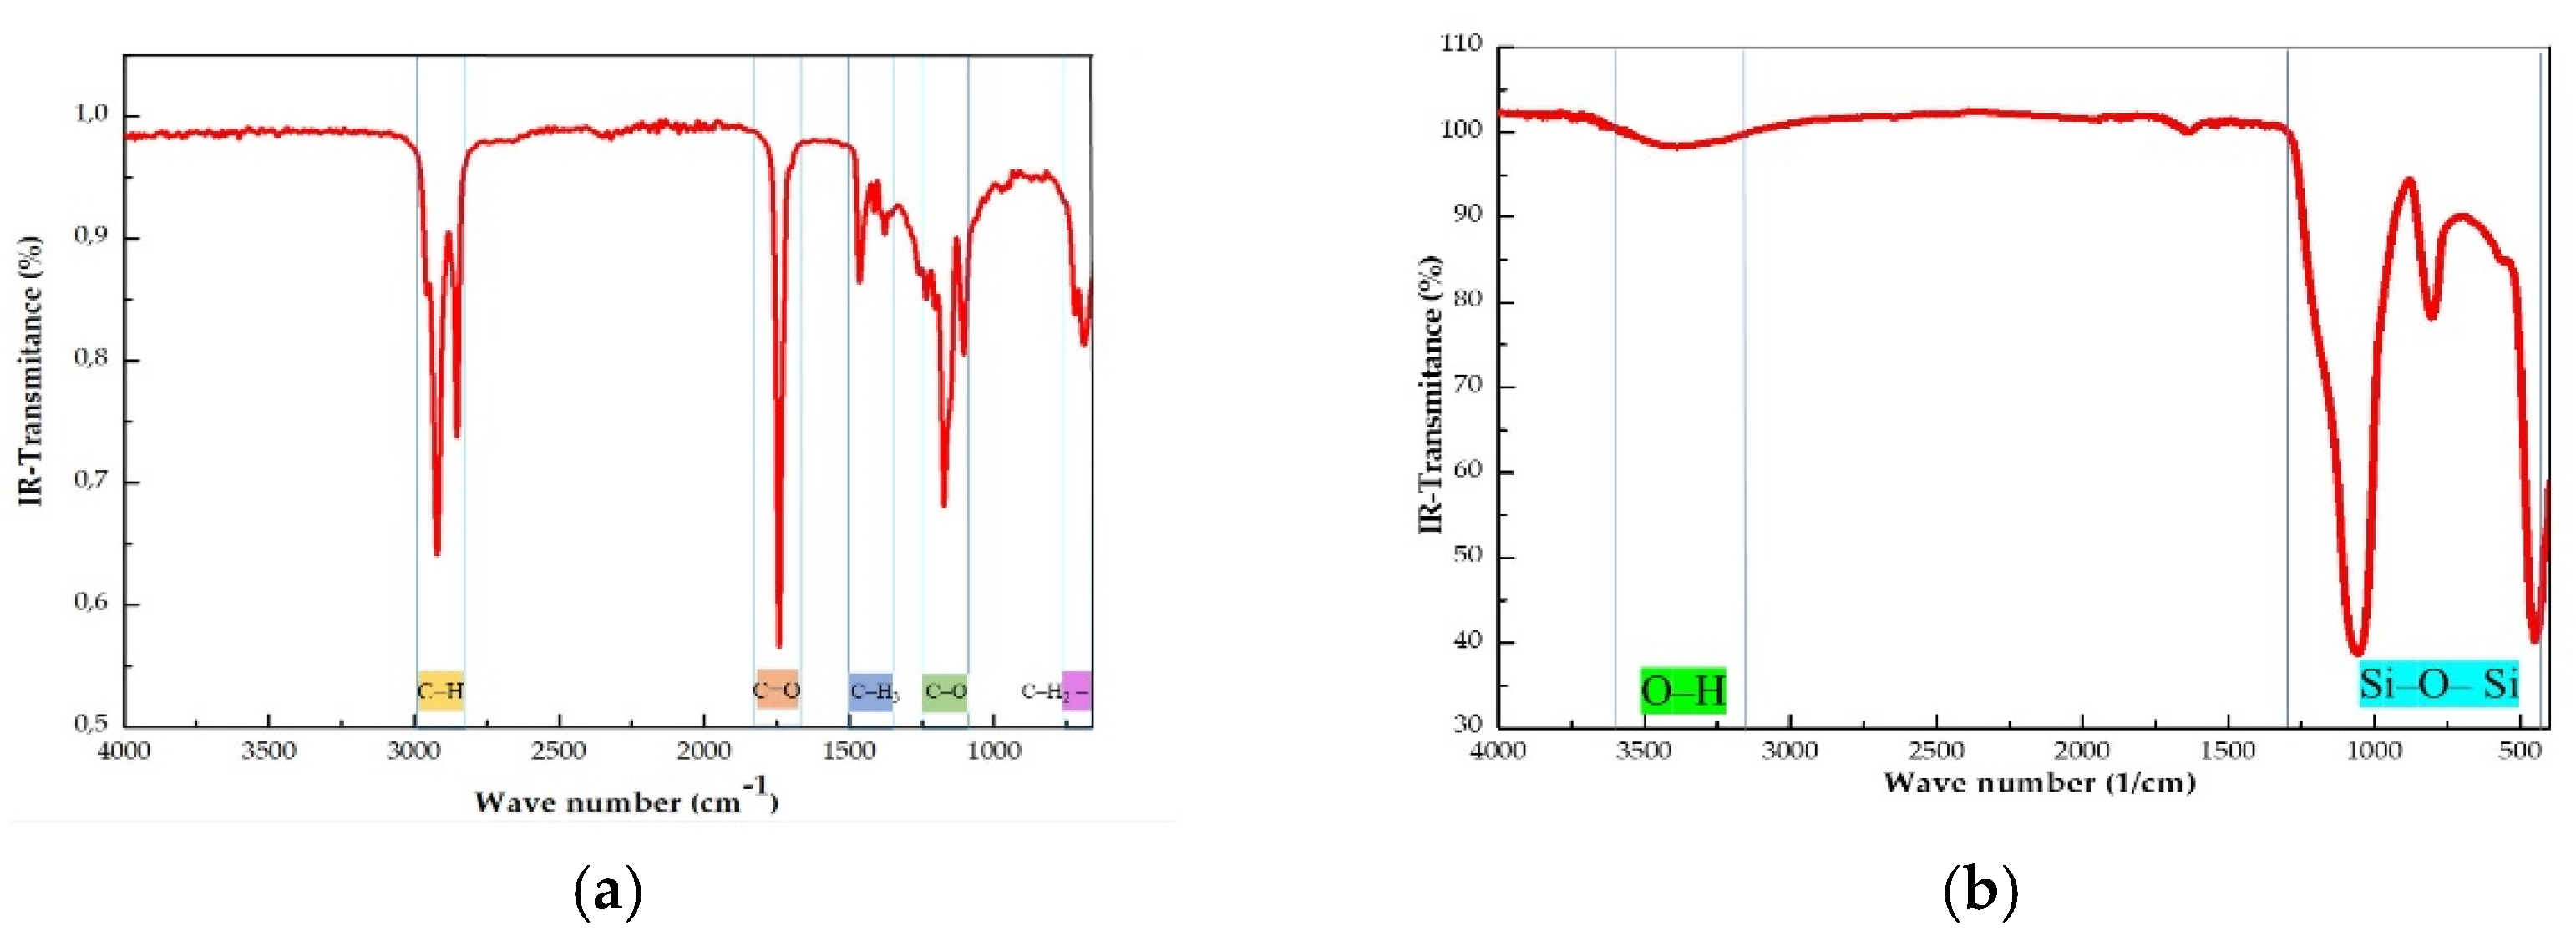
Figure 2.
(a) TEM images of the silica powder A200 at two magnifications forming aggregates of different fractal structures. (b) Platelet-like shapes of different sizes are highlighted in one of the fractal structures formed by the silica aggregates.
Figure 2.
(a) TEM images of the silica powder A200 at two magnifications forming aggregates of different fractal structures. (b) Platelet-like shapes of different sizes are highlighted in one of the fractal structures formed by the silica aggregates.
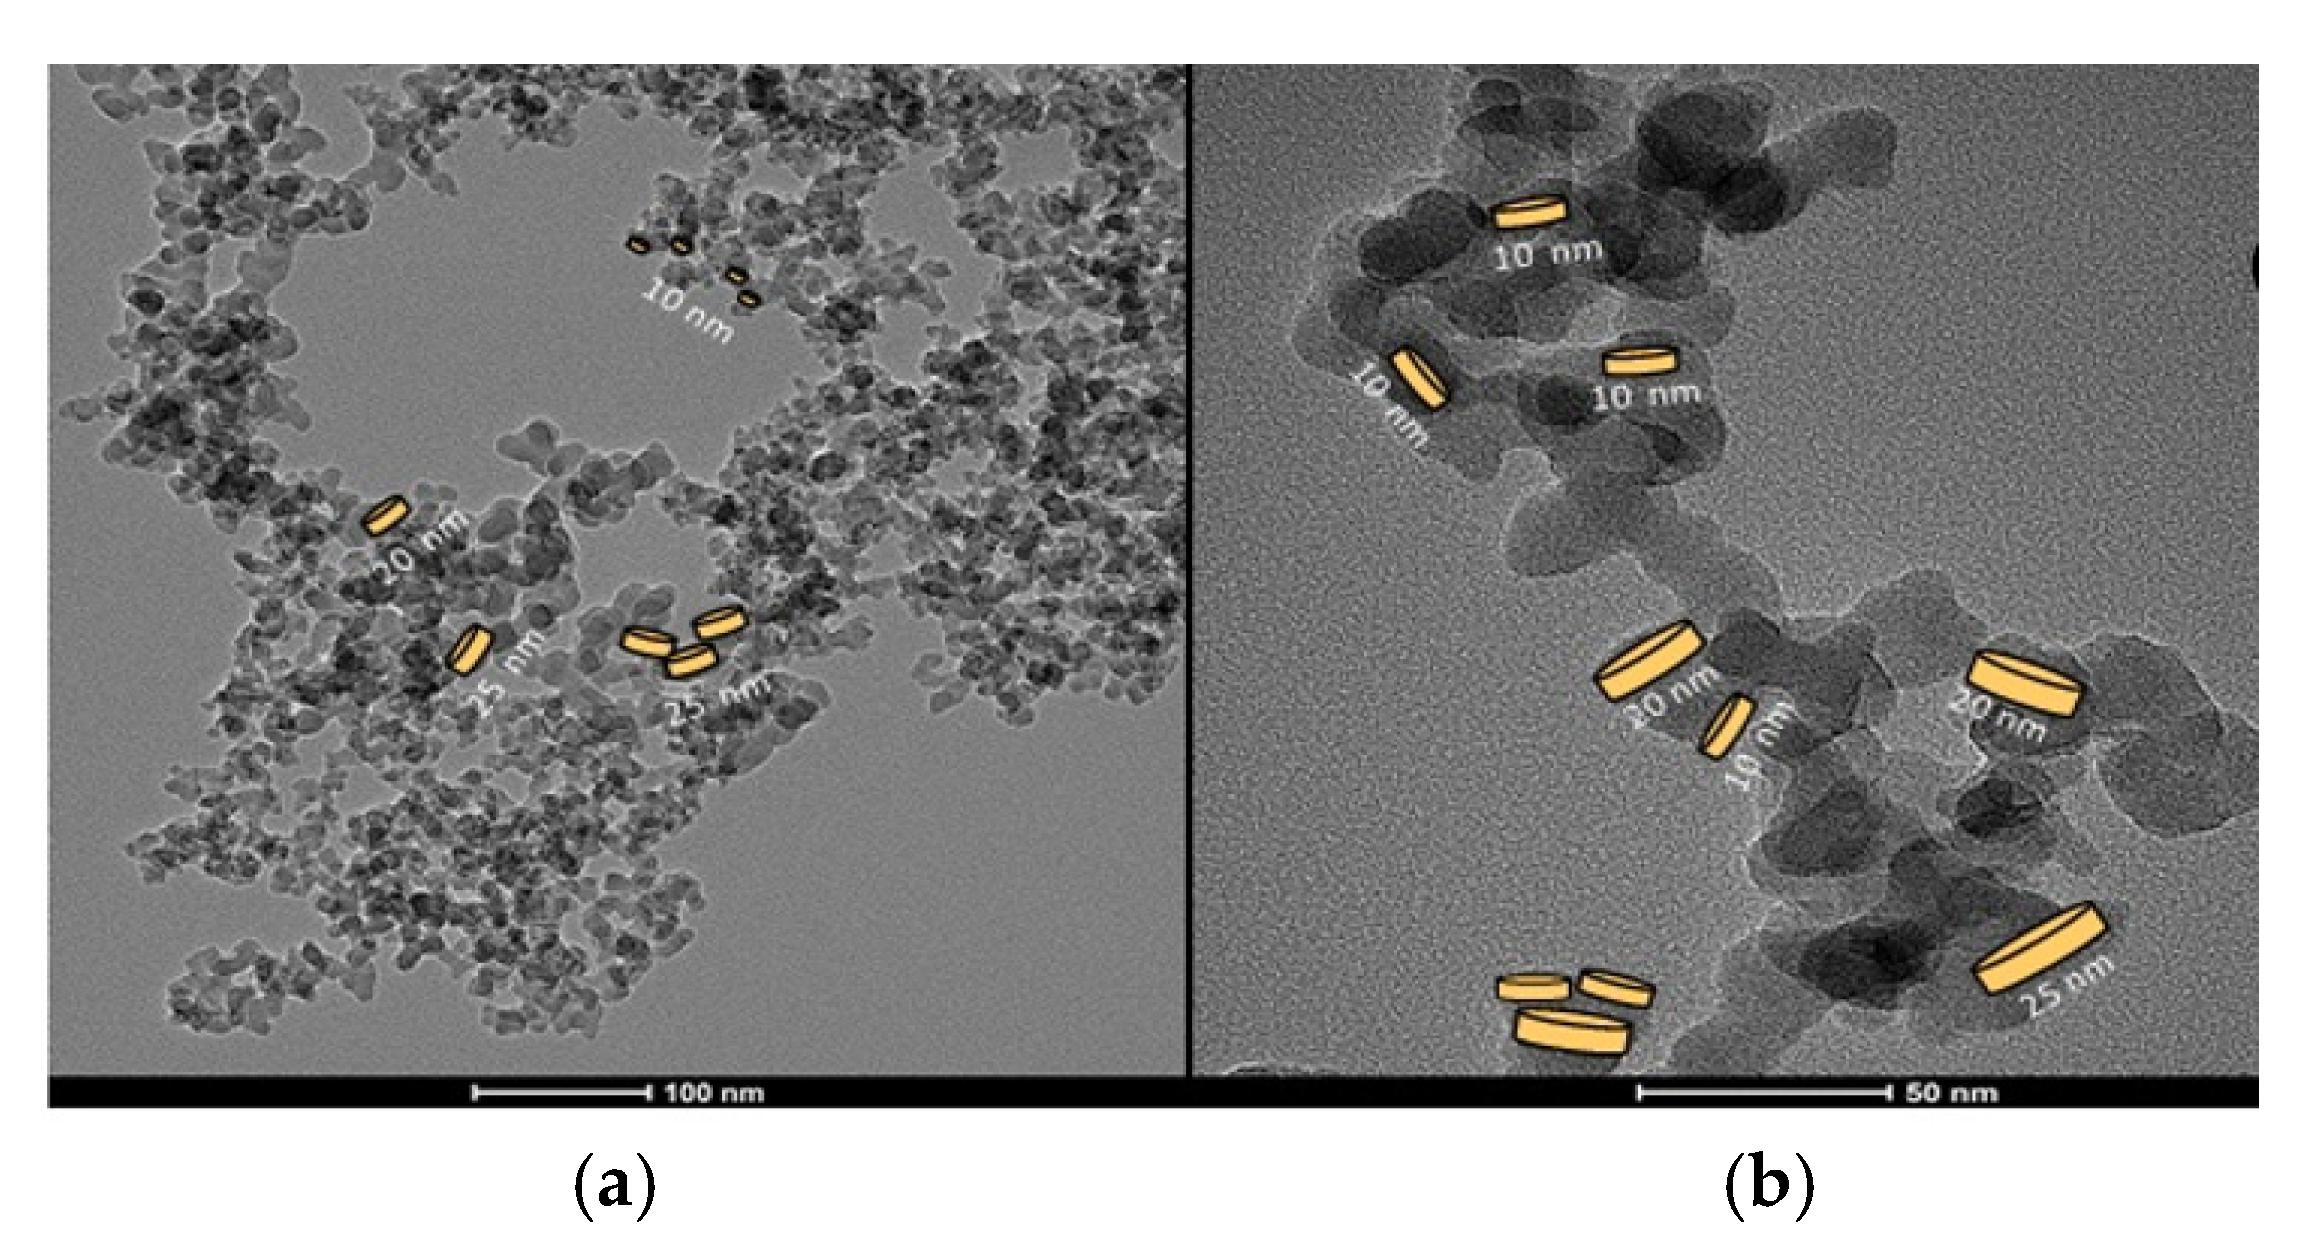
Figure 3.
(Left) Suspensions of fumed silica A200 in coconut oil (CO) at 1, 2, 3 and 4 vol%. (Right) Polarized light optical microphotographs at two magnifications of the CO and the silica-CO suspensions at 10 °C.
Figure 3.
(Left) Suspensions of fumed silica A200 in coconut oil (CO) at 1, 2, 3 and 4 vol%. (Right) Polarized light optical microphotographs at two magnifications of the CO and the silica-CO suspensions at 10 °C.
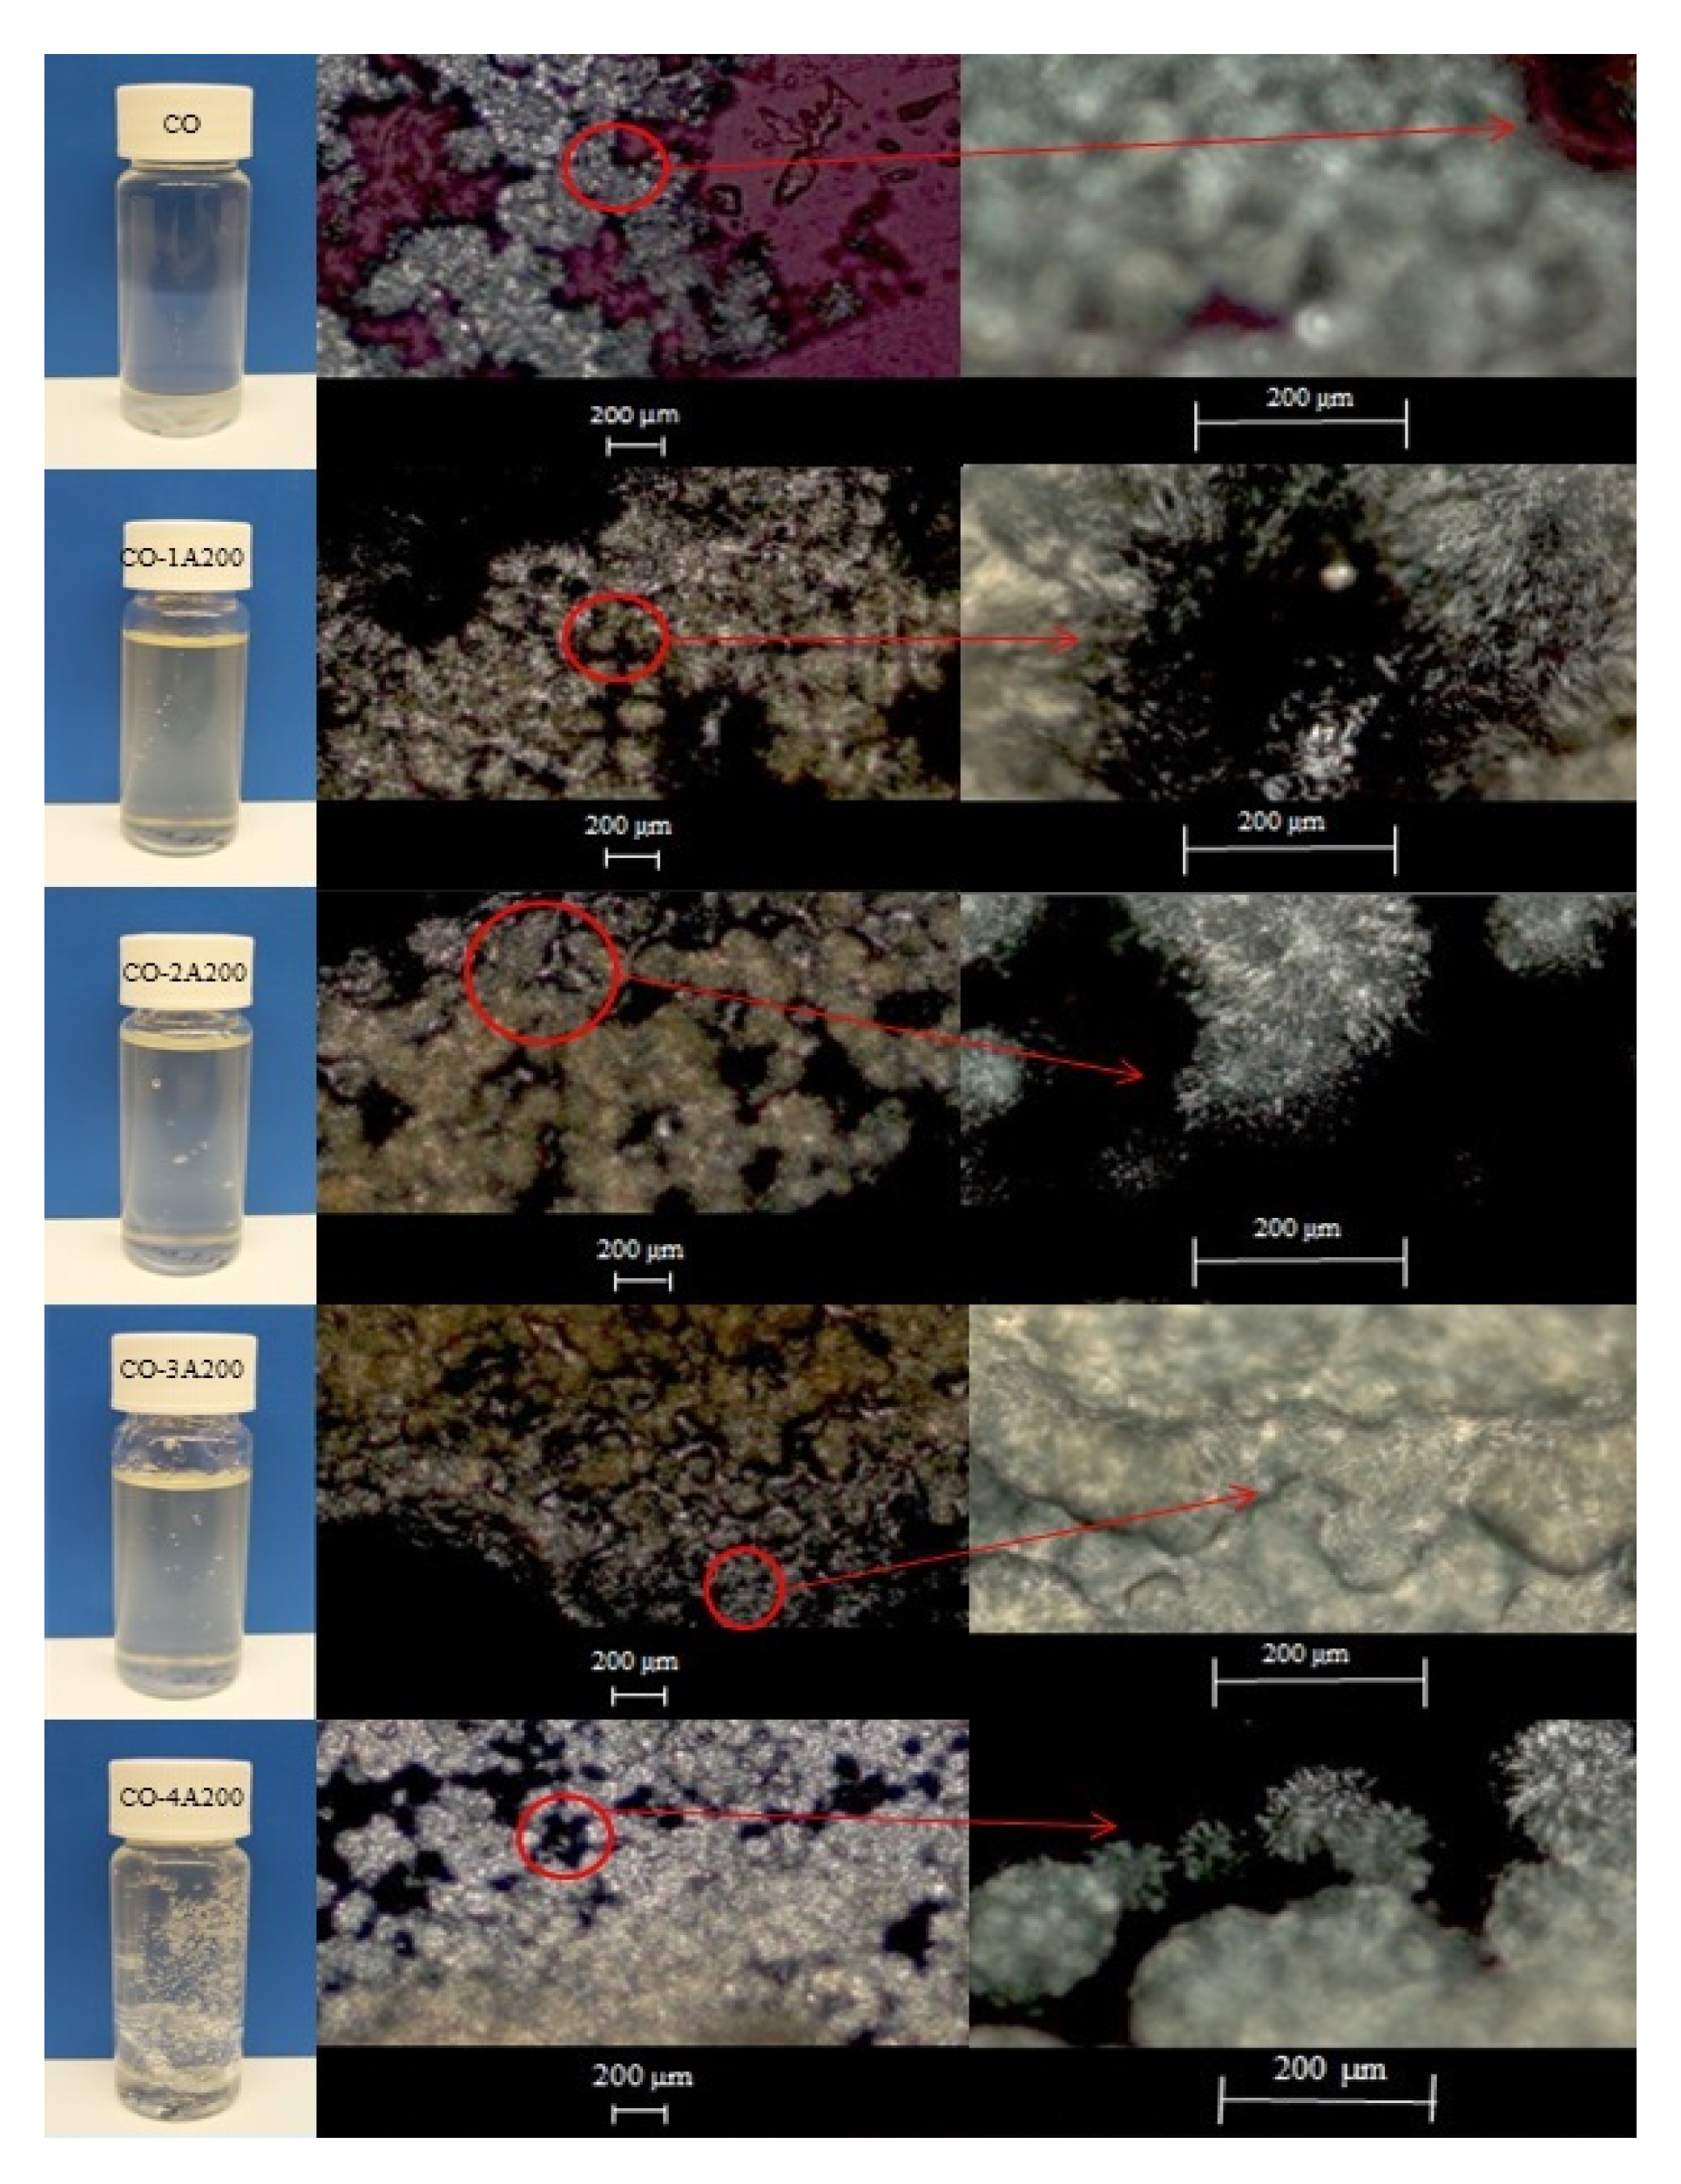
Figure 4.
Two-dimensional DSC cooling (a) and heating (b) dynamic thermograms of the CO base fluid and the silica A200 in CO suspensions at various concentrations.
Figure 4.
Two-dimensional DSC cooling (a) and heating (b) dynamic thermograms of the CO base fluid and the silica A200 in CO suspensions at various concentrations.
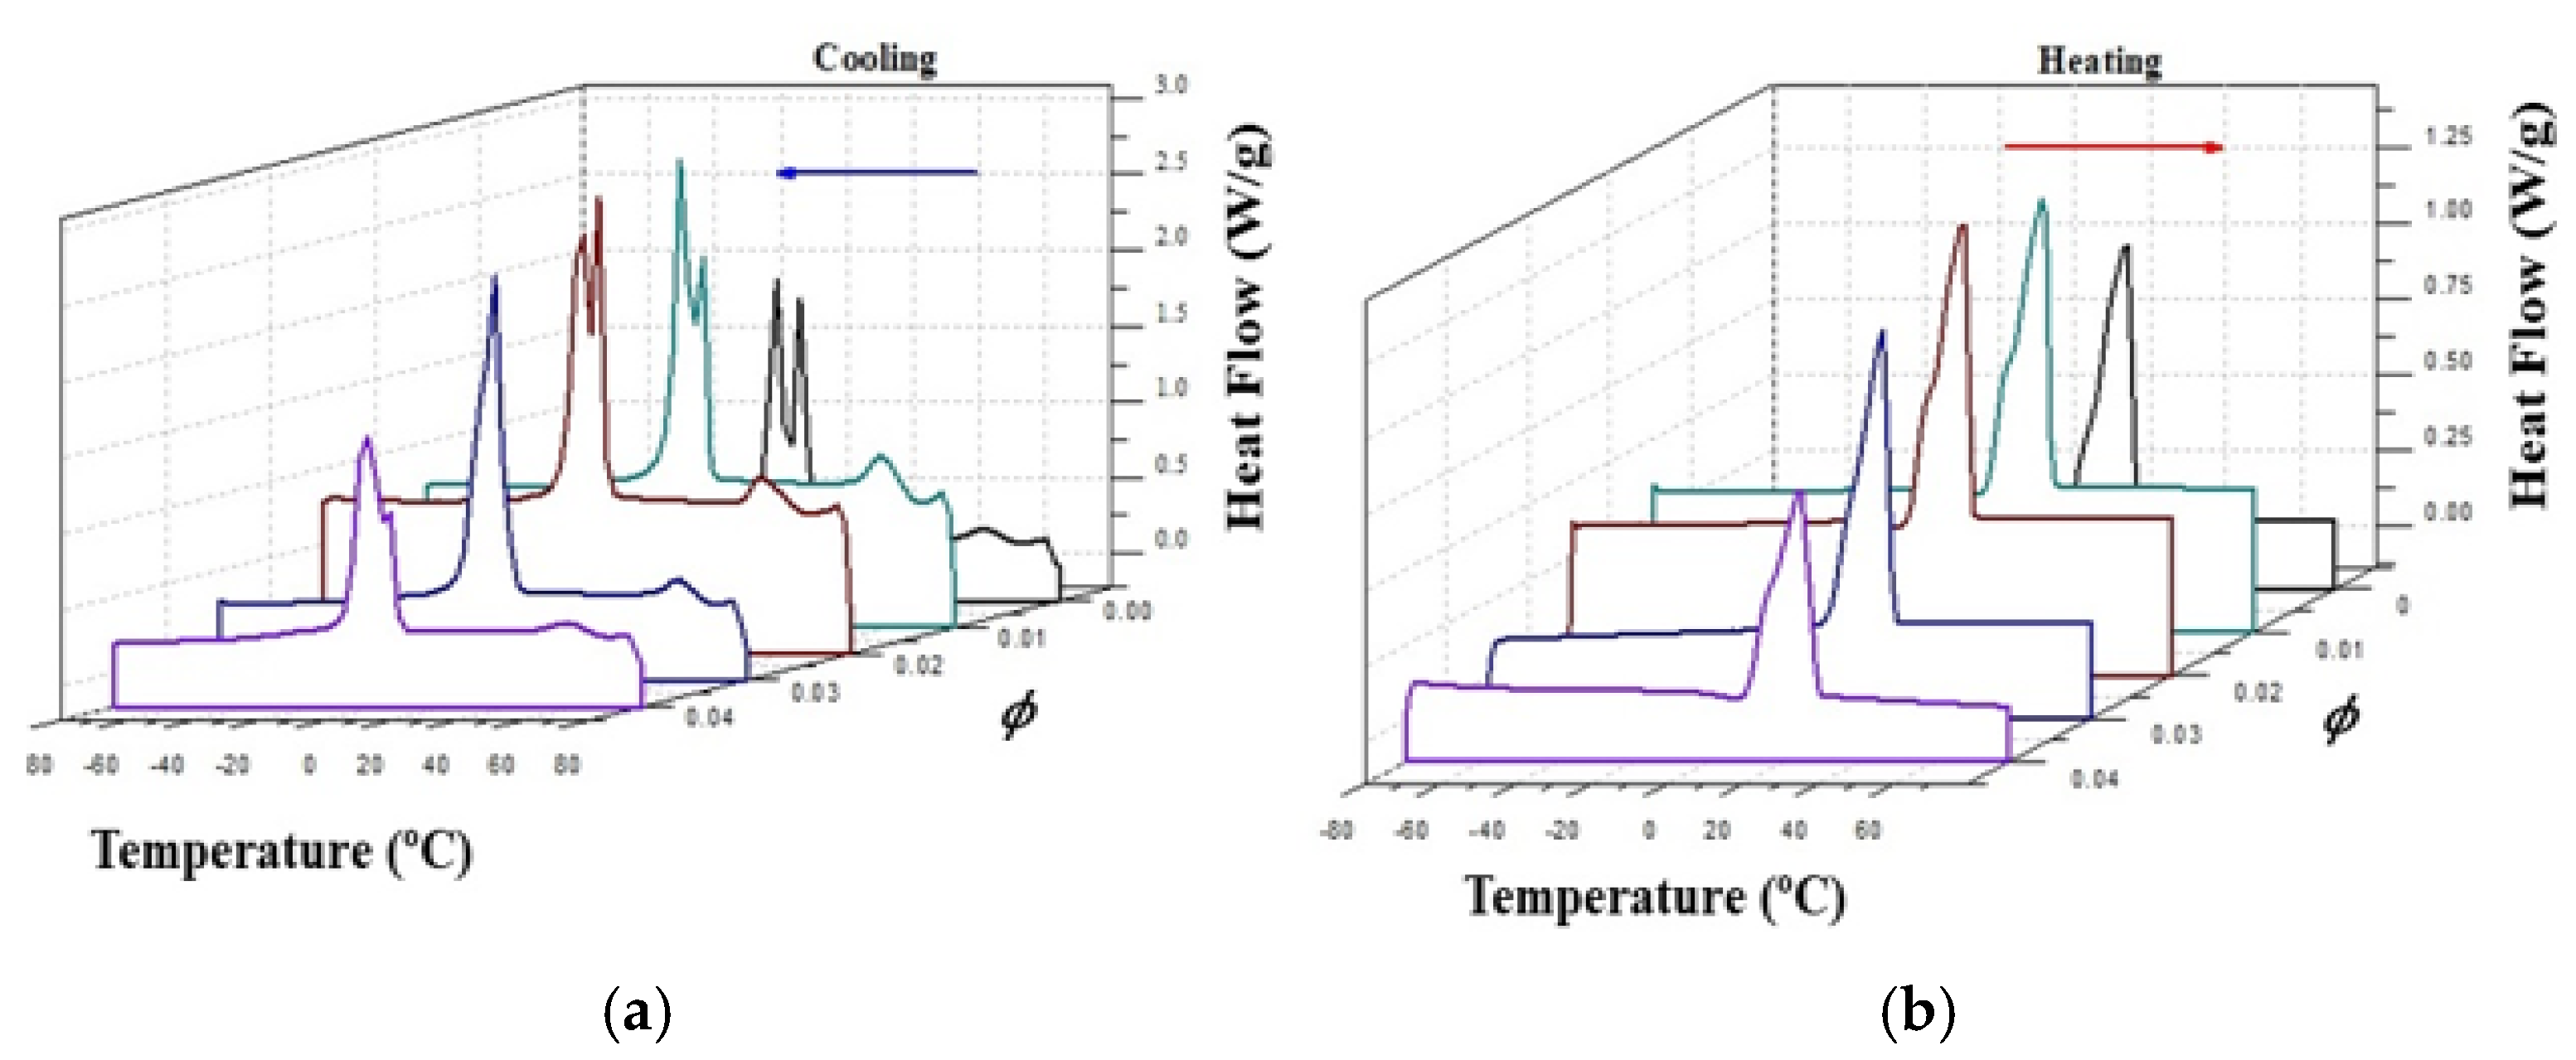
Figure 5.
(Left) Viscosity versus shear rate curves in the 20-30 °C temperature interval. (Right) Viscosity versus temperature curves at different shear rates.
Figure 5.
(Left) Viscosity versus shear rate curves in the 20-30 °C temperature interval. (Right) Viscosity versus temperature curves at different shear rates.
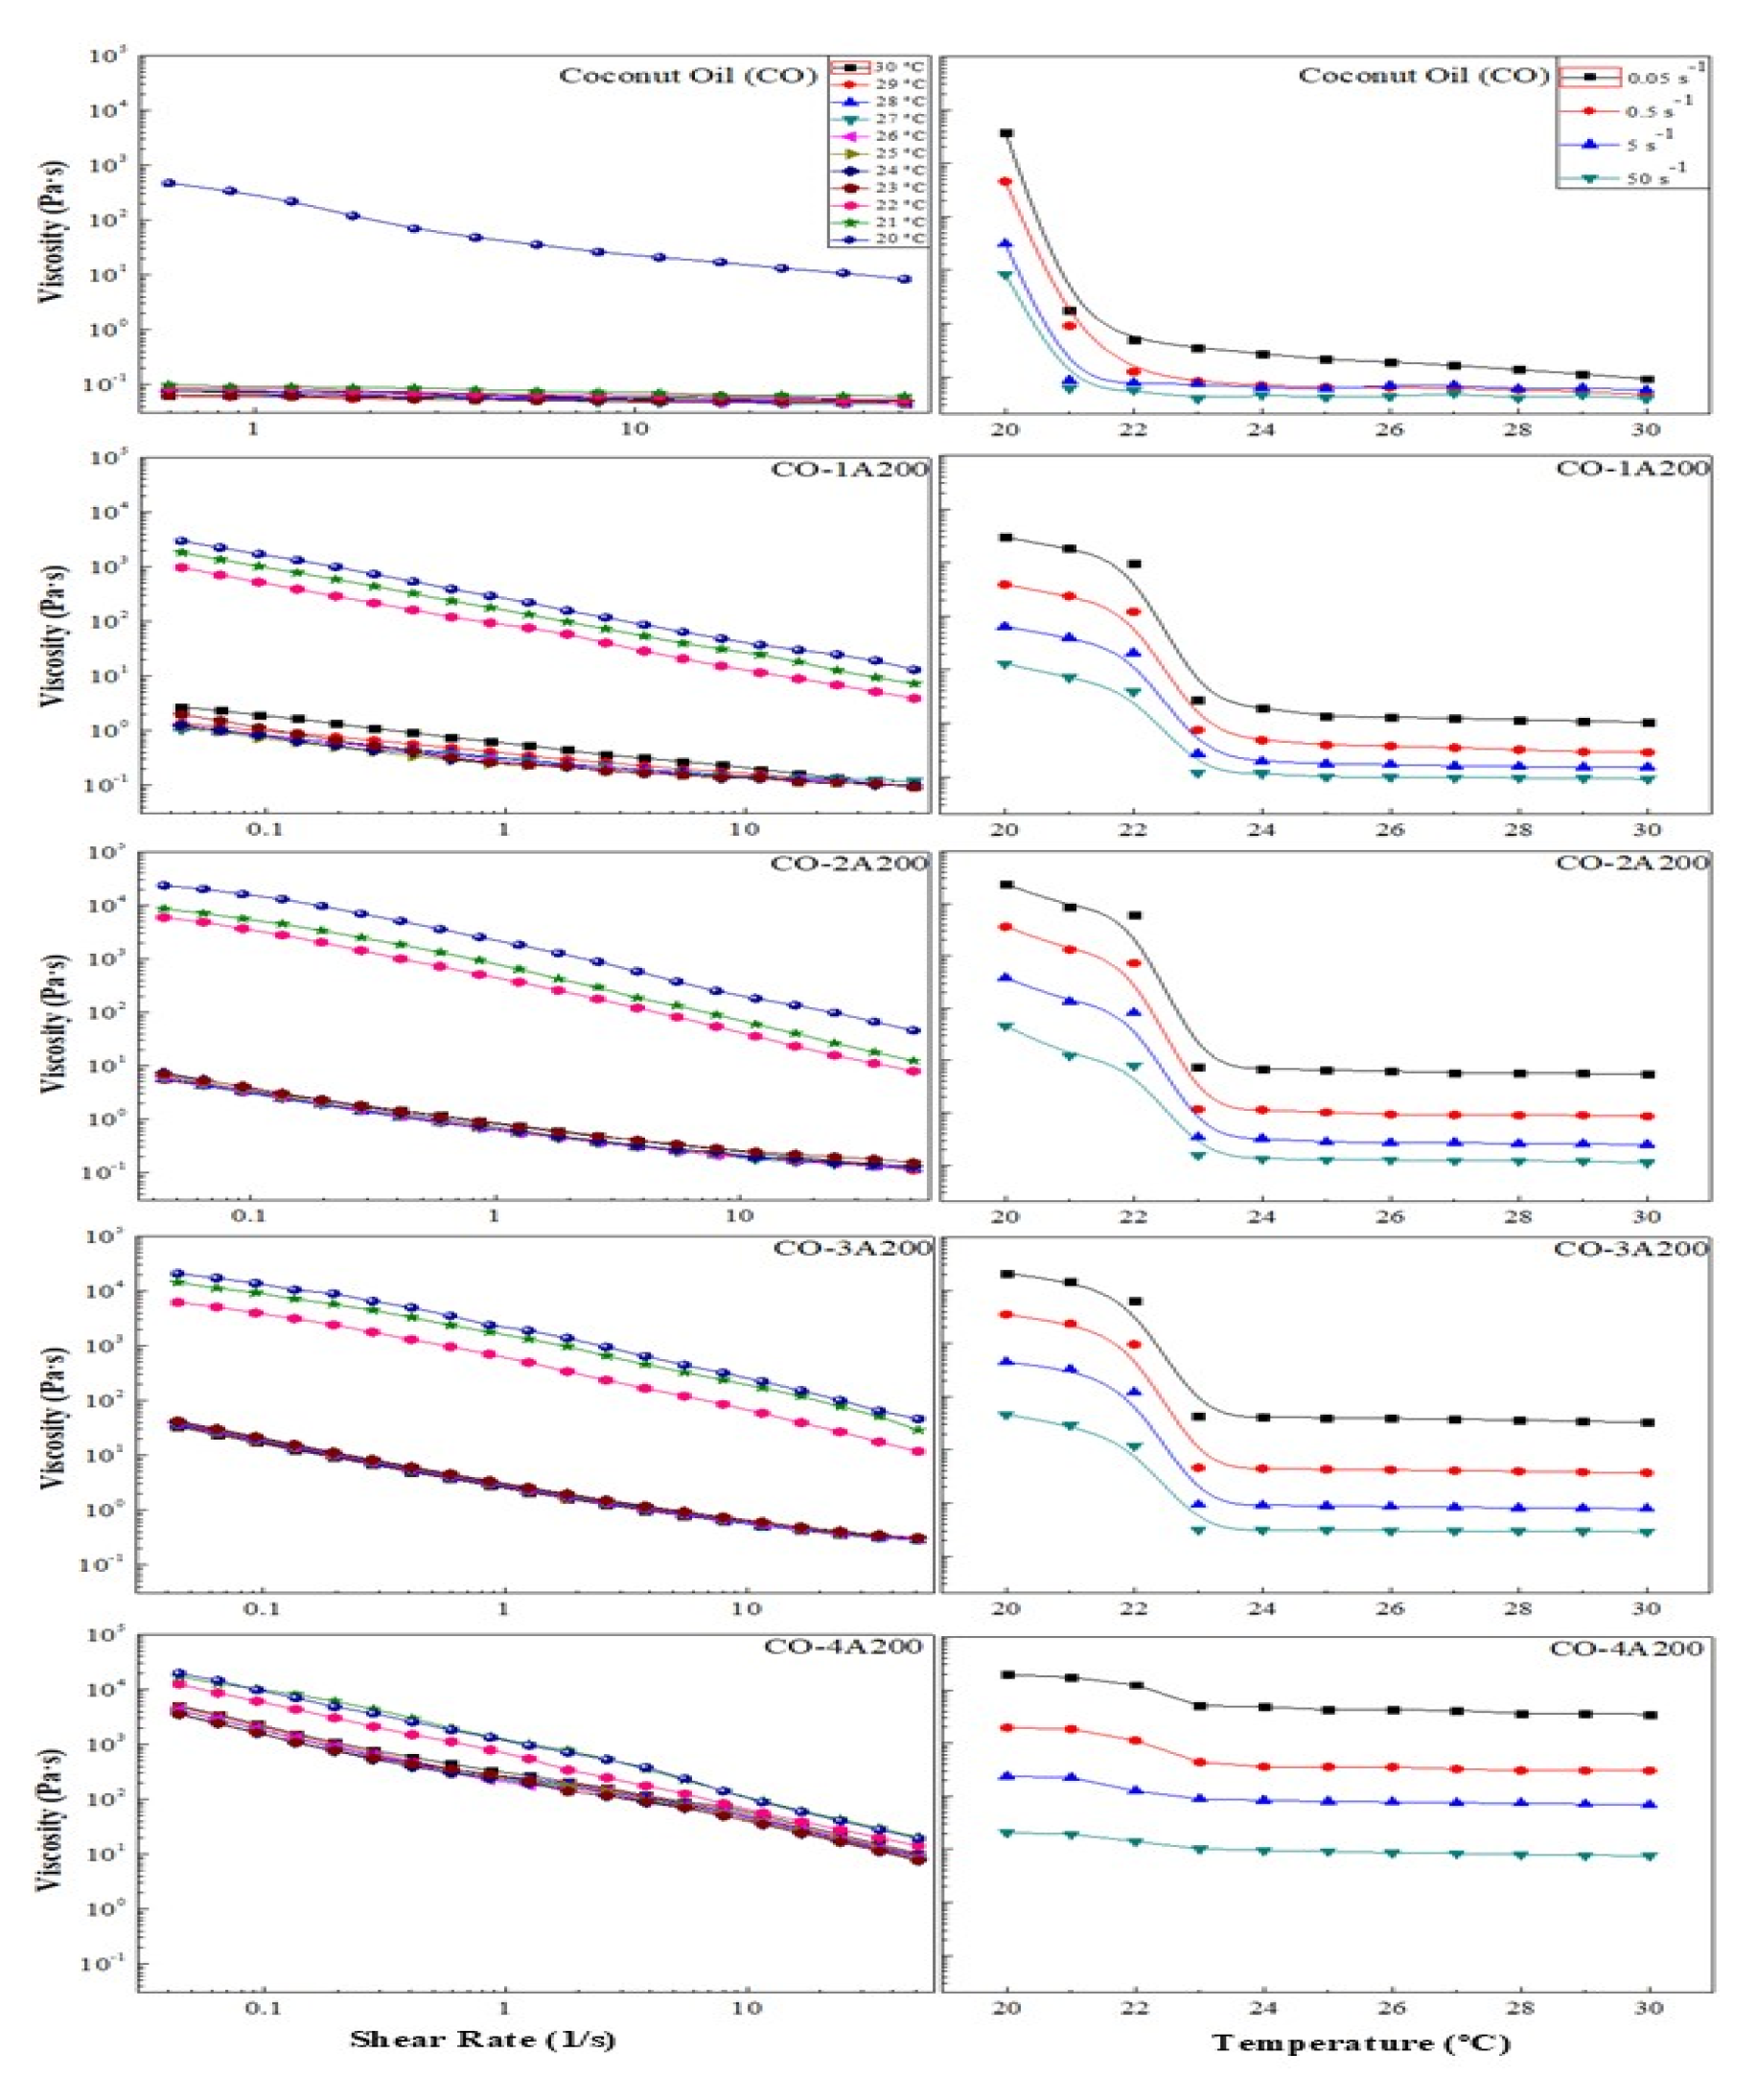
Figure 6.
(a) Flow consistency index of the CO-A200 suspensions versus temperature. Volume fraction effect. All the uncertainties are below 5 %. (b) Flow behavior index of the CO-A200 suspensions versus temperature. Volume fraction effect. Both indexes are related according to Equation (1). All uncertainties are below 2 %.
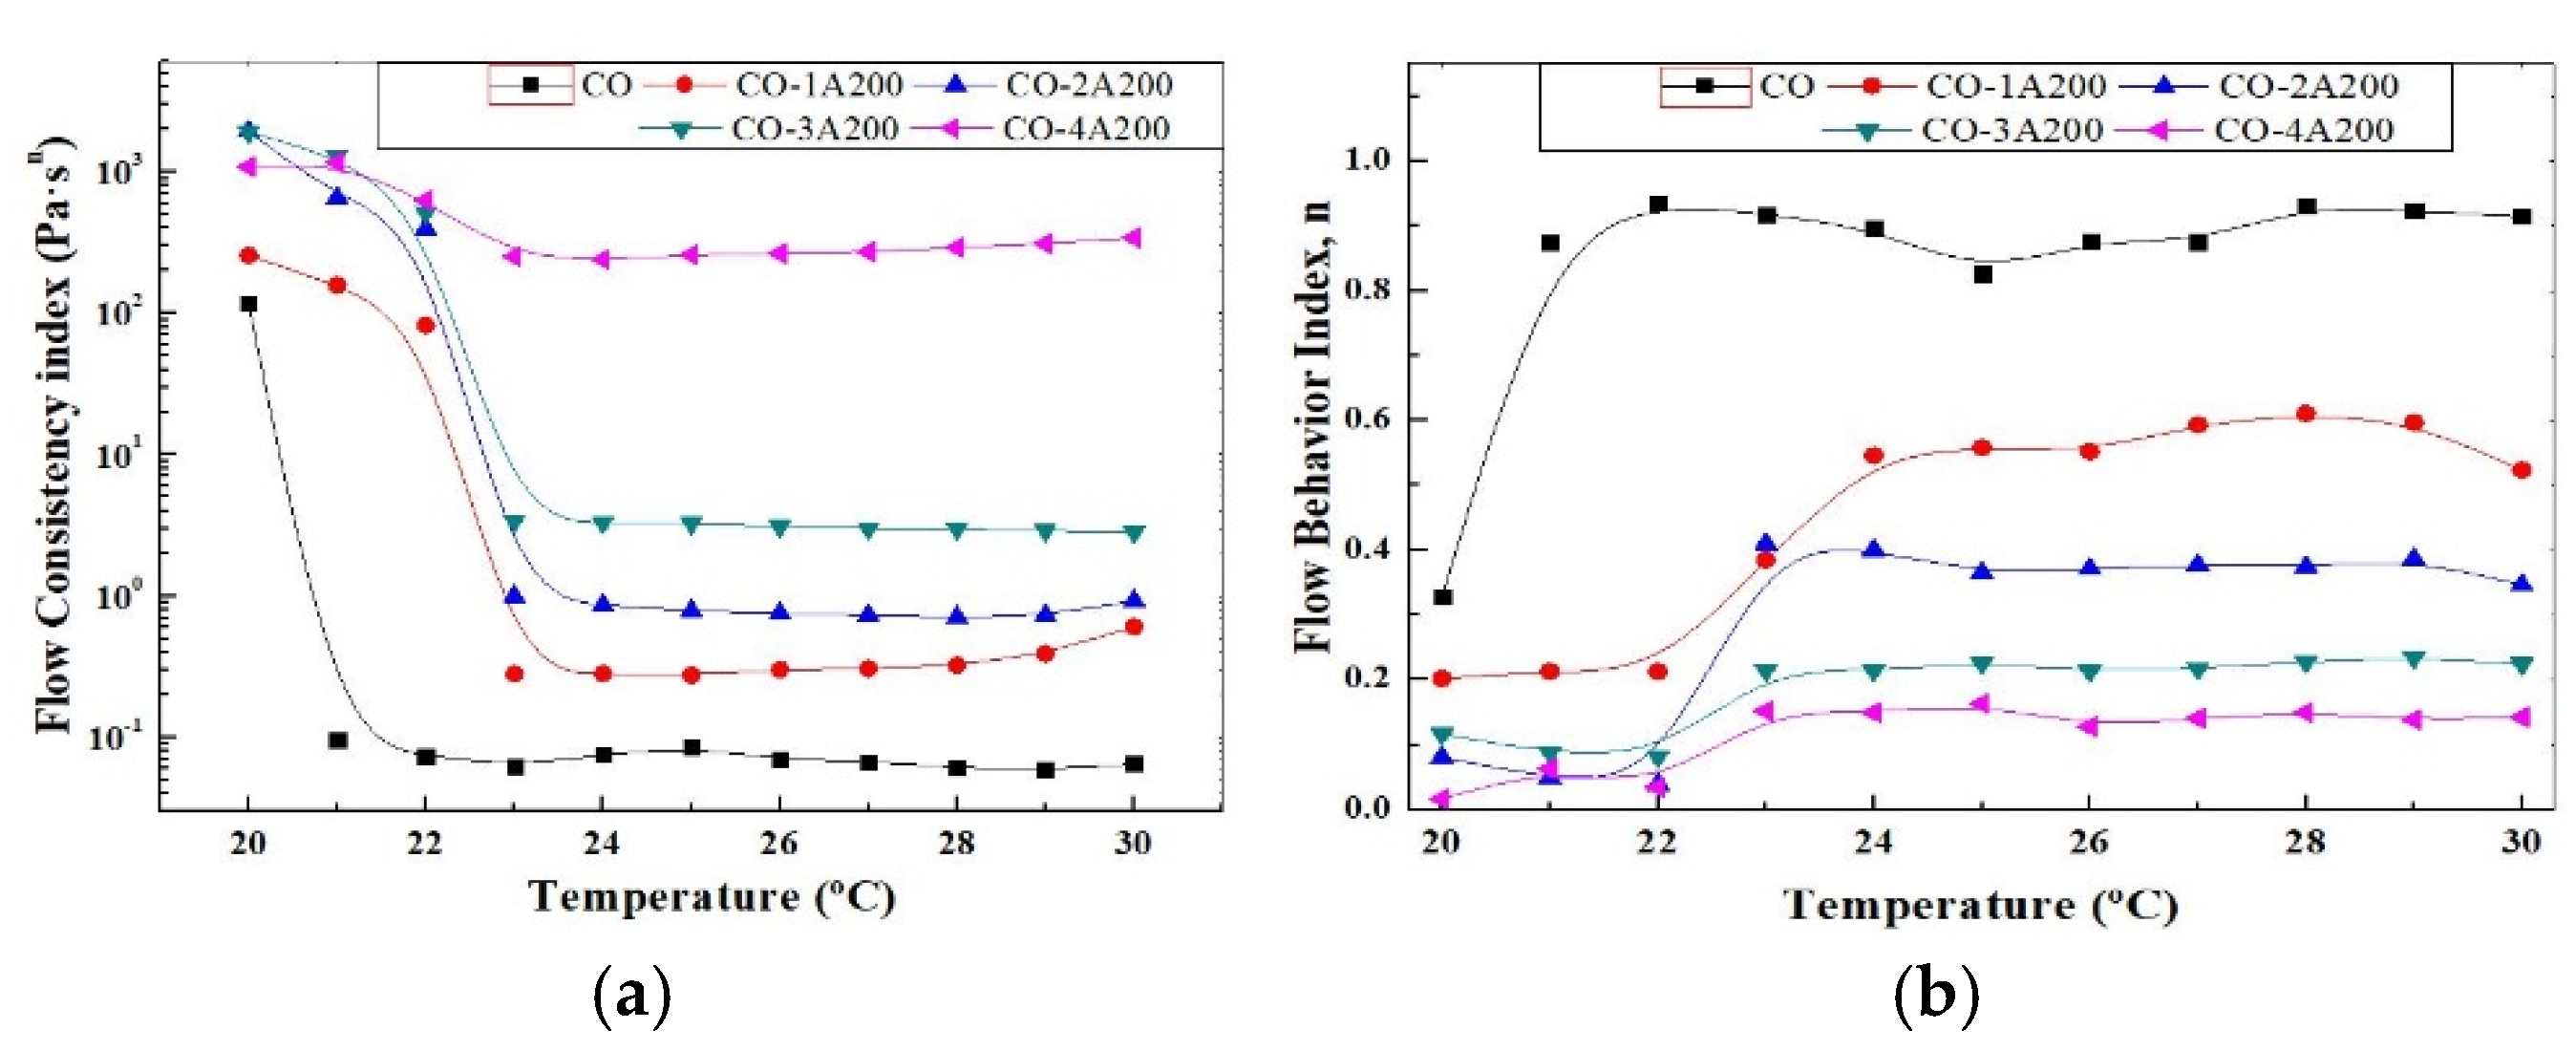
Figure 7.
Stepwise changes in shear rate in the CO-3A200 sample. (a) Stepwise increase test from rest to shear rate of 10 s-1, 30 °C and 35 °C curves. (b) Stepwise increase test from shear rate of 10 s-1 to shear rate of 50 s-1, 30 °C and 35 °C curves. (c) Stepwise decrease test from shear rate of 50 s-1 to 10 s-1, 30 °C and 35 °C curves.
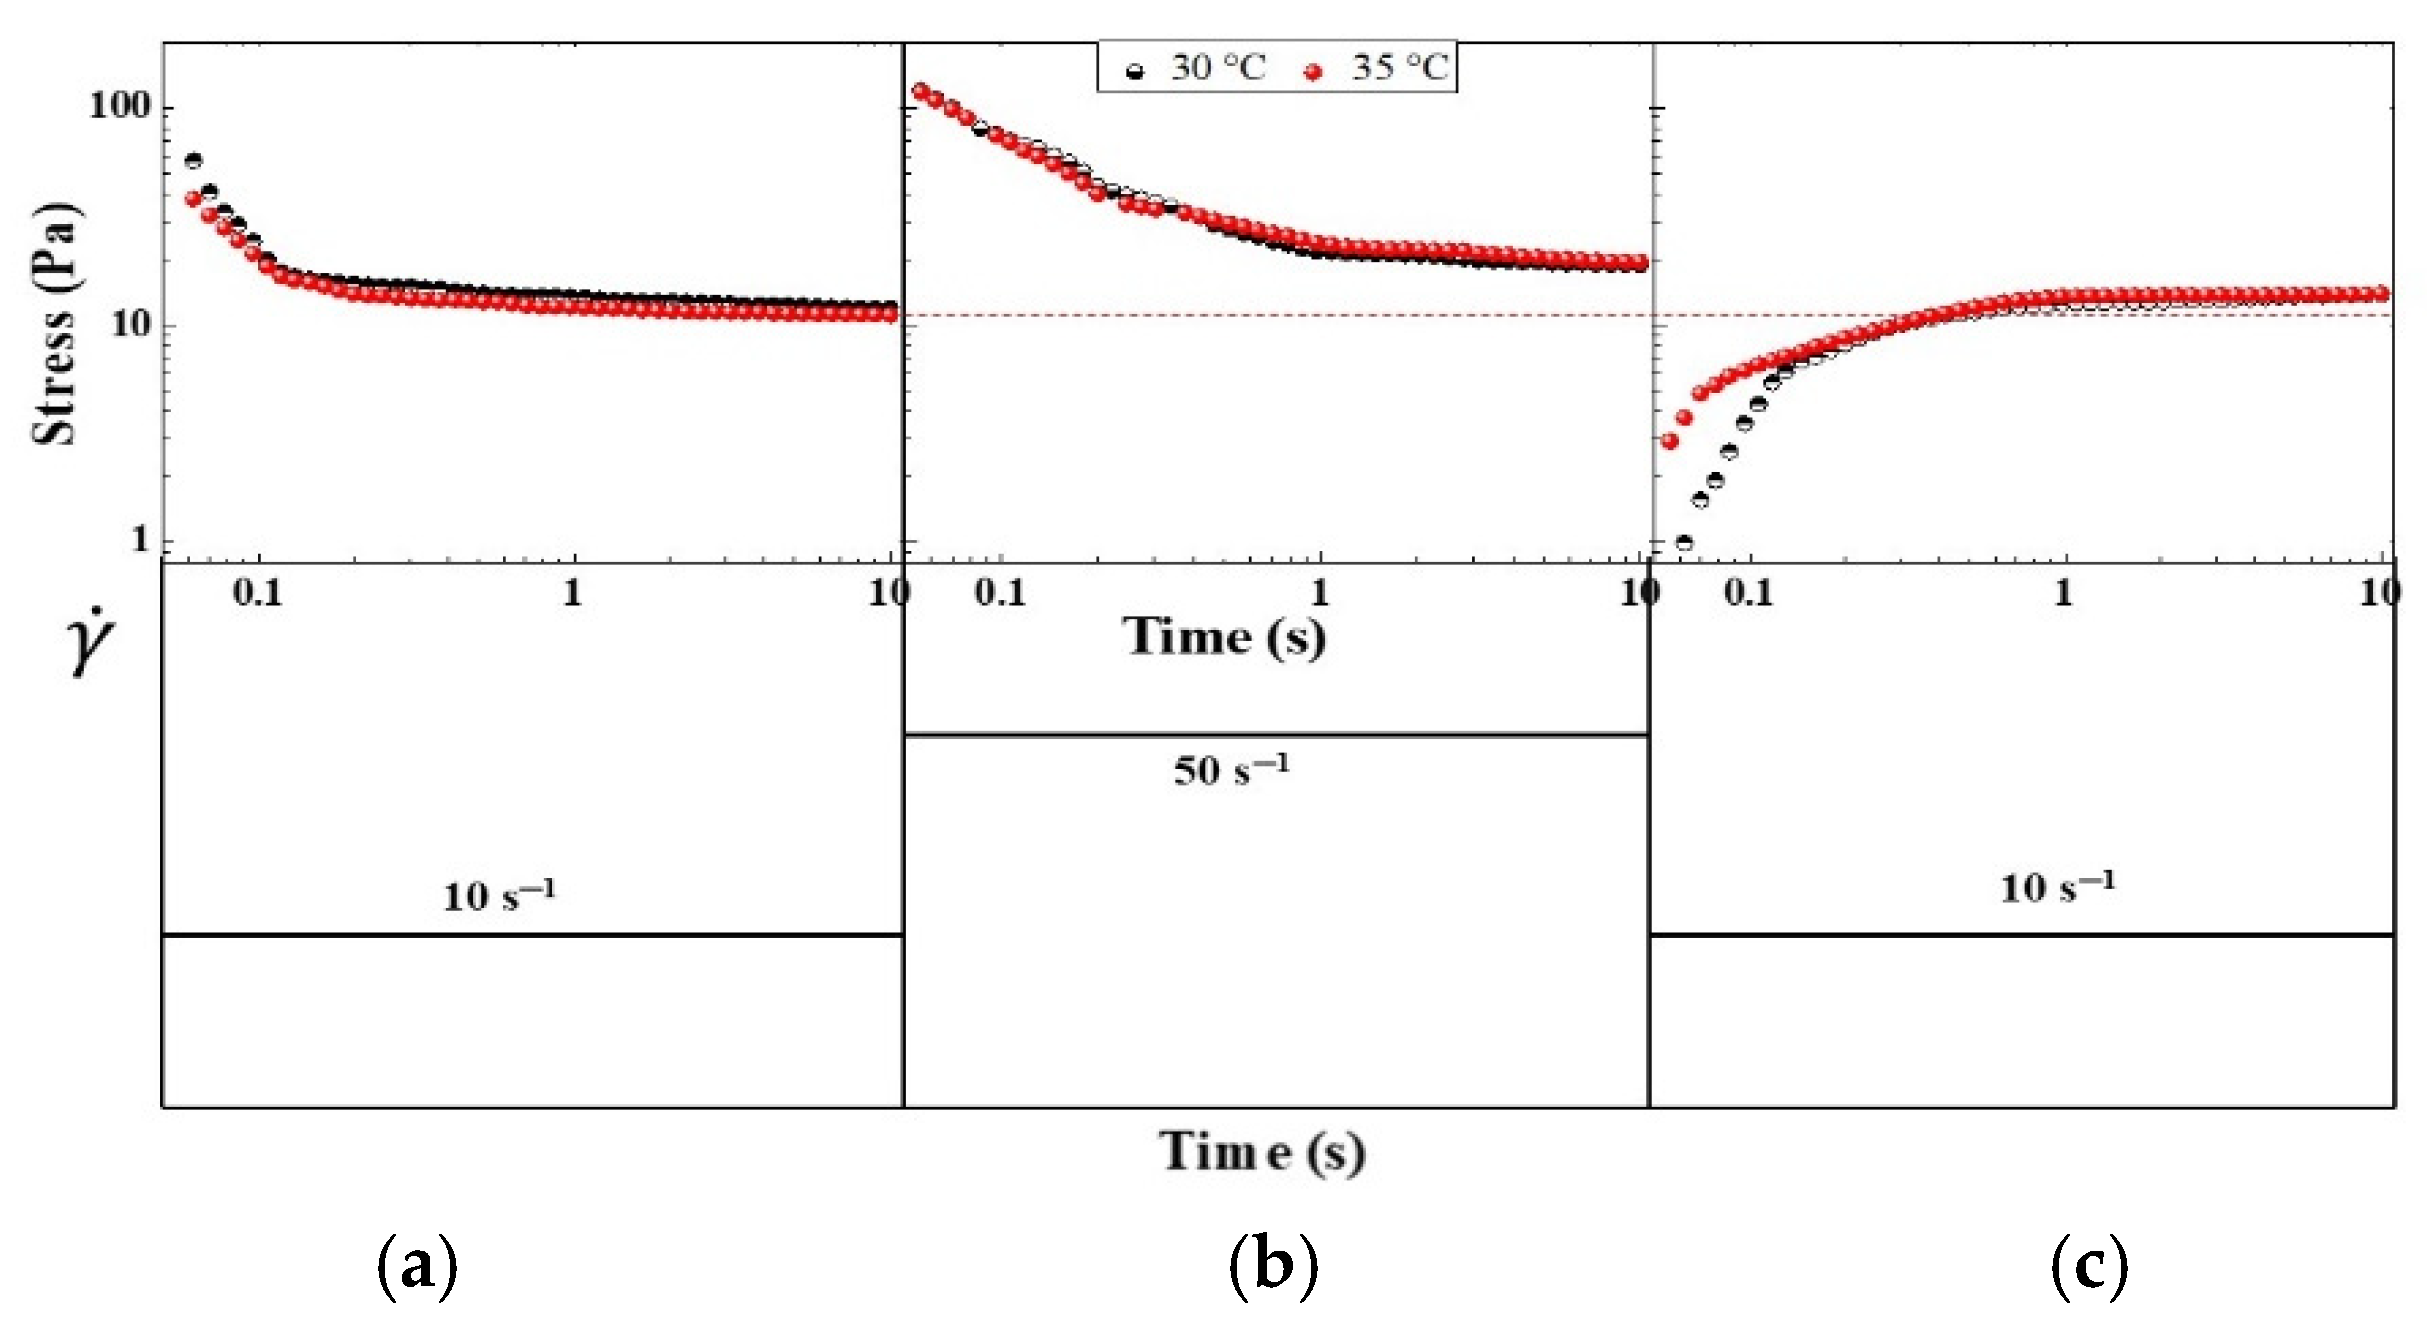
Figure 8.
(a) Ramp of shear test of CO-3A200 gel at 30 °C and 35 °C. The two ramps last 75 s, respectively and the plateau of shearing is performed at 100 1/s for 10 s. (b) Frequency sweep test of CO-3A200 gel at 30 °C and 35 °C.
Figure 8.
(a) Ramp of shear test of CO-3A200 gel at 30 °C and 35 °C. The two ramps last 75 s, respectively and the plateau of shearing is performed at 100 1/s for 10 s. (b) Frequency sweep test of CO-3A200 gel at 30 °C and 35 °C.
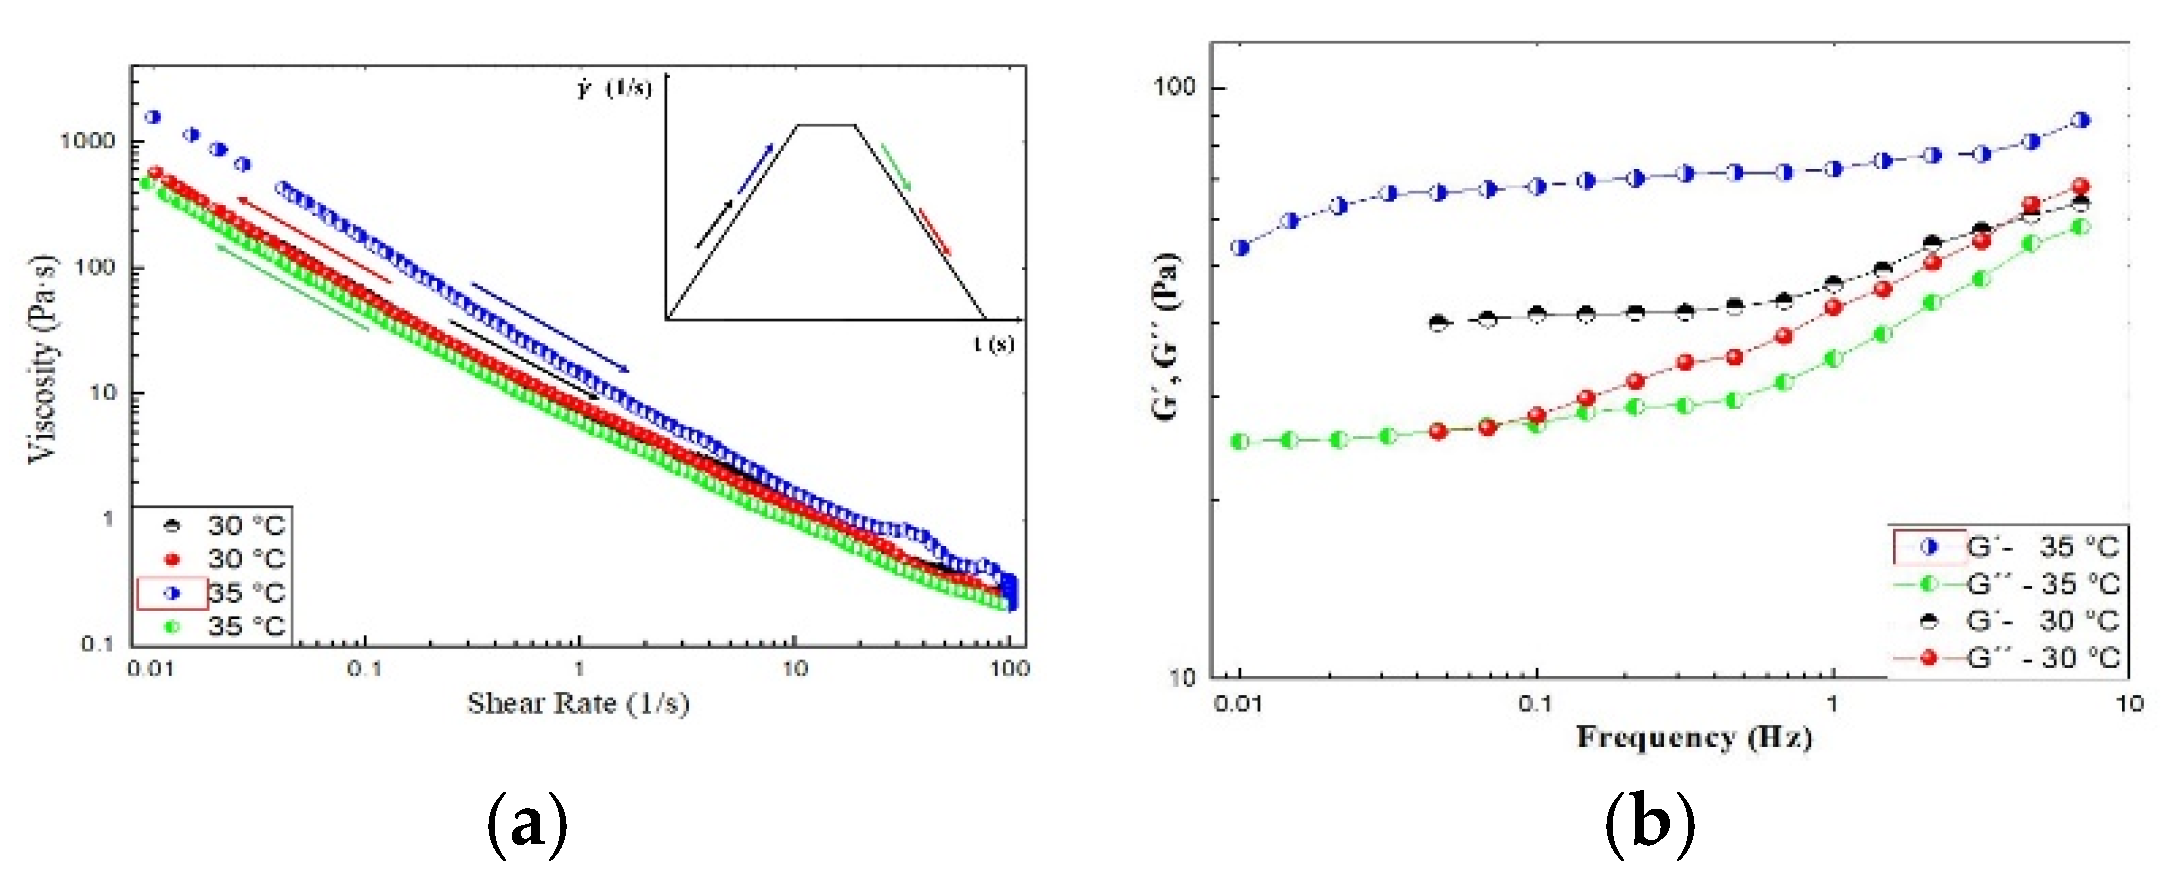
Figure 9.
(a) (Left) Image in the visible spectrum of the Charger in the Close Wrapper. (Right) Image in the infrared spectrum of the Charger in the Close Wrapper (CCW). (b) (Left) Image in the visible spectrum of the Charger in the Open Wrapper (COW). (Right) Image in the infrared spectrum of the Charger in the Open Wrapper (COW).
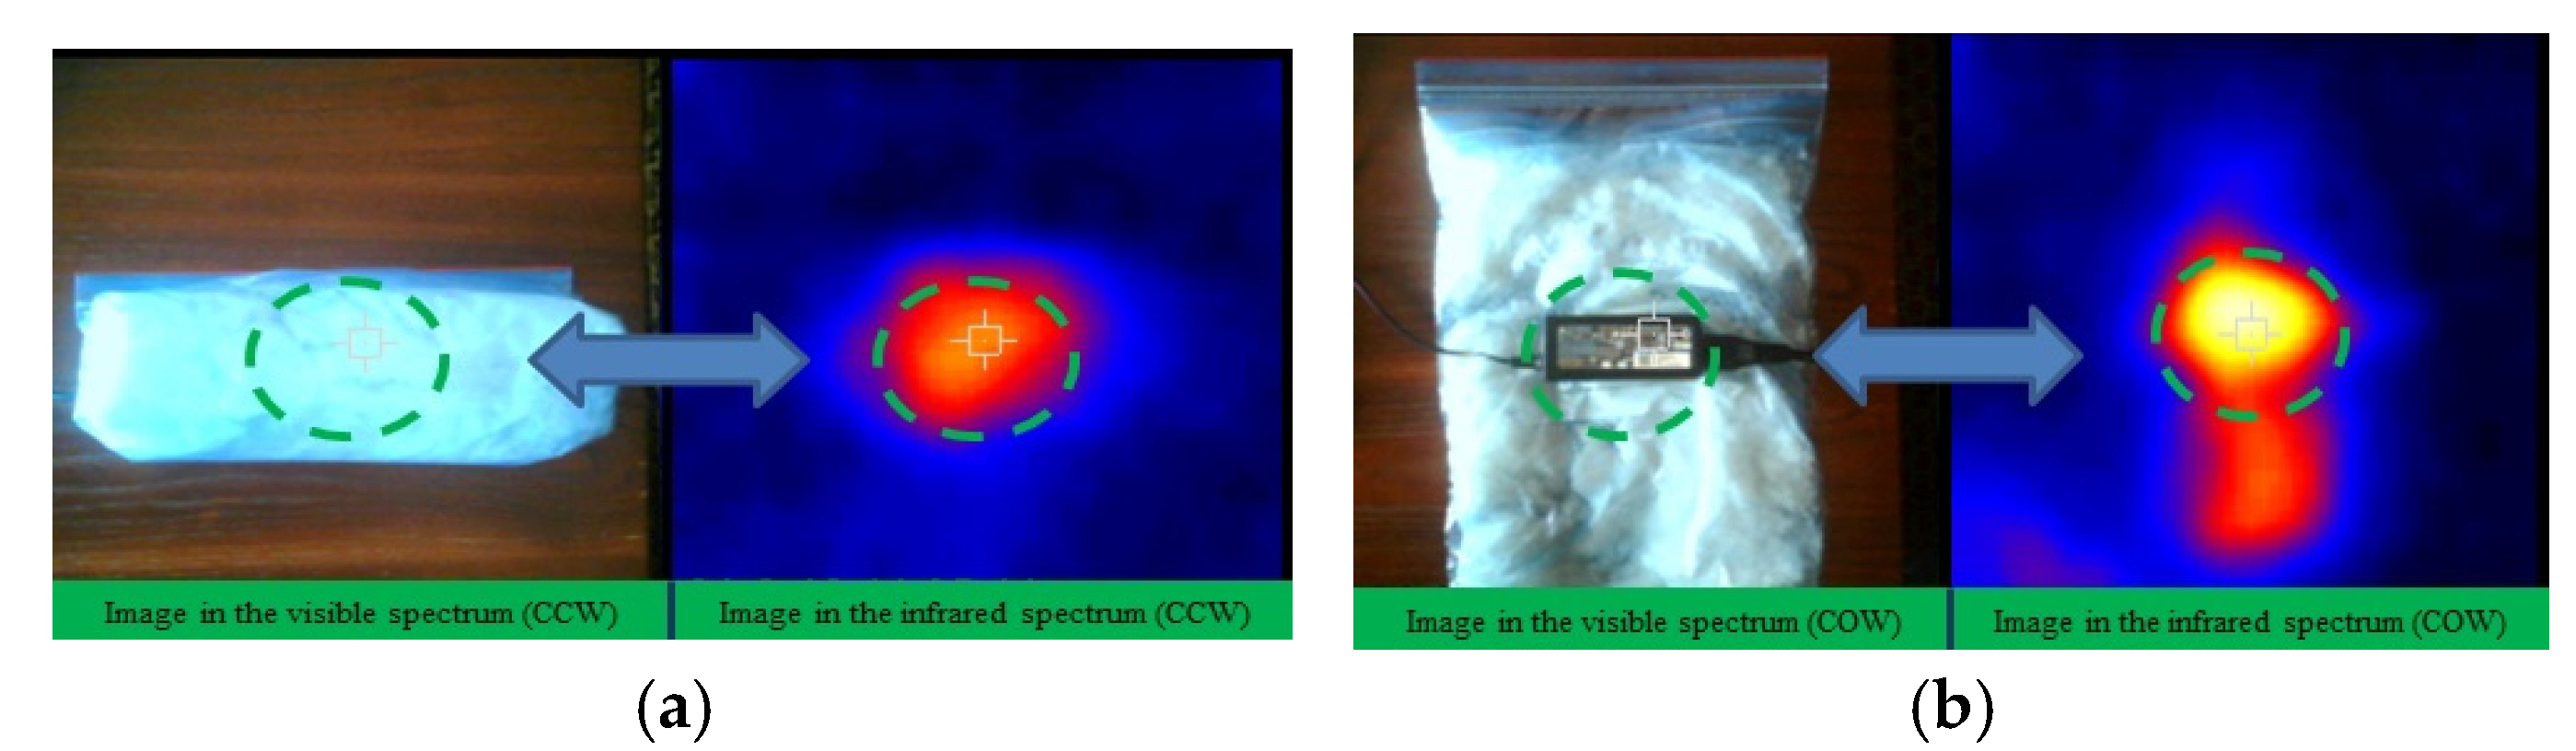
Figure 10.
(a) Curves representing the evolution of temperature versus time when the charger is connected to the electricity supply during 140 min. Comparison of the charge process in open air (COA) against the charger covered by a close wrap (COW), as shown in Figure 9a, and the charger covered by an open wrap (CCW), as shown in Figure 9b. (b) Visible and infrared images of the wrapper after enclosing the charger during 140 min. It can be appreciated how the heat of the charger melted the suspension which was inside the bag in contact with it.
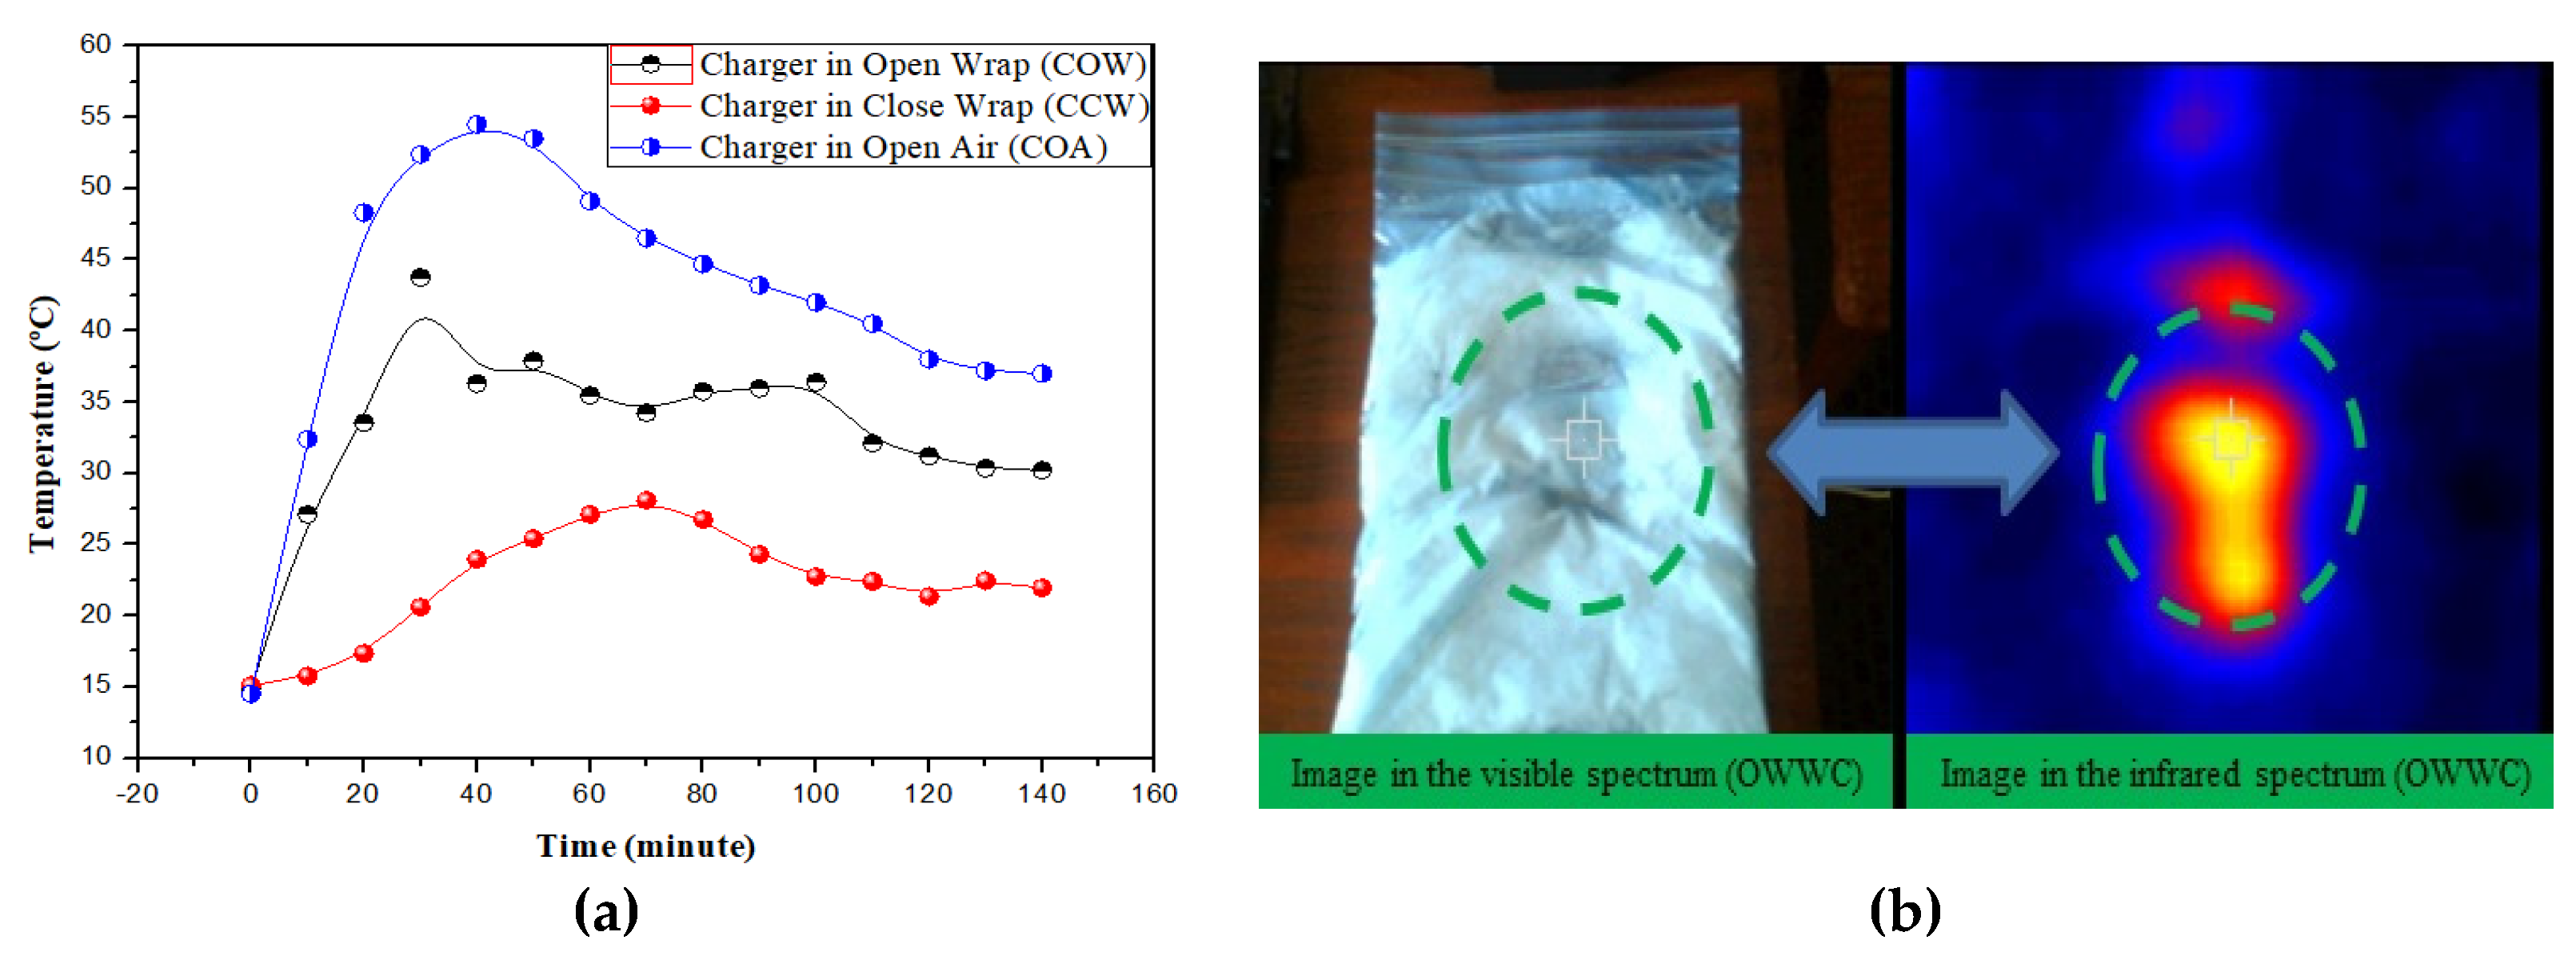

Table 1.
cp peak values of the CO─A200 suspensions. All the uncertainties are below 0.1 %.
| Latent Heat | 0 | 0.01 | 0.02 | 0.03 | 0.04 |
| ΔHMelting (J/g) | 102.4 | 98.8 | 94.5 | 89.15 | 84.26 |
| ΔHCrystal. (J/g) | 97.2 | 94.1 | 90.1 | 86.2 | 82.9 |
Disclaimer/Publisher’s Note: The statements, opinions and data contained in all publications are solely those of the individual author(s) and contributor(s) and not of MDPI and/or the editor(s). MDPI and/or the editor(s) disclaim responsibility for any injury to people or property resulting from any ideas, methods, instructions or products referred to in the content. |
© 2025 by the authors. Licensee MDPI, Basel, Switzerland. This article is an open access article distributed under the terms and conditions of the Creative Commons Attribution (CC BY) license (http://creativecommons.org/licenses/by/4.0/).
Copyright: This open access article is published under a Creative Commons CC BY 4.0 license, which permit the free download, distribution, and reuse, provided that the author and preprint are cited in any reuse.


