
Submitted:
28 February 2025
Posted:
03 March 2025
You are already at the latest version
Abstract
Prostate cancer (PC) is a leading cause of cancer-related deaths in men worldwide. PSMA-directed positron emission tomography (PET) has shown promising results in detecting recurrent PC and metastasis. We developed a deep-learning model to predict cancer recurrence from PSMA PET/CT images of prostate cancer patients after treatment. Different methods were used to improve the performance of the initial model, such as modifying the region of interest (ROI), including metadata as additional layers, or passing prostatectomy state to the model. A hyperparameter optimization of multiple parameters was performed to further increase the model's performance, which, combined with including metadata as additional image layers, resulted in the best validation accuracy of 77 %. Even though the final validation accuracy fell short of reaching 90 %, significant improvements were made to the model, and many approaches were tested that can be a basis for further research and improvements toward the performance of a model that can confidently detect cancer remission in the prostate or prostate bed.
Keywords:
Prostate Cancer
; PC
; PET/CT
; Positron emission Tomography
; 18F-PSMA
; Artificial Intelligence
; deep learning
; DenseNet
1. Introduction
Prostate cancer remains one of the leading causes of cancer-related deaths in men, with over 1.2 million new cases diagnosed and more than 350,000 deaths annually [1,2]. Early detection and accurate staging are critical for successful treatment, and monitoring therapy effectiveness is typically done by tracking serum prostate-specific antigen (PSA) levels. When PSA levels rise, indicating biochemical recurrence, patients are often referred for re-staging, a process that is crucial for determining the most appropriate treatment strategy. A key focus during re-staging is identifying whether there is a local recurrence of cancer in the prostate region. Several diagnostic methods are used for staging and detecting prostate cancer, including digital rectal examination, transrectal ultrasound (TRUS), magnetic resonance imaging (MRI), and positron emission tomography (PET) combined with computed tomography (CT). Among these, PET/CT has emerged as a reliable technique. In 18F-PSMA-PET, the radioactive tracer 18 F-PSMA-1007 binds selectively to prostate-specific membrane antigen (PSMA), a protein highly expressed on prostate cancer cells and is performed in combination with the CT scan allowing for precise anatomical imaging. Typically, a whole-body PET/CT scan is conducted to detect potential metastases. Specifically, for prostate cancer diagnosis and staging during remission, each PET/CT examination generates high-dimensional data, comprising hundreds of image slices with thousands of pixels per slice for both the PET and CT parts. Interpreting this complex data to answer the critical binary question—whether there is a local recurrence of prostate cancer in the prostate bed or not—requires trained experts.
Recently, artificial neural networks have shown great potential in assisting with similar tasks, such as tumor segmentation and outcome prediction in head and neck cancers [3], as well as the identification of pathological mediastinal lymph nodes in lung cancer [4]. These advancements highlight the promise of AI in improving diagnostic accuracy and efficiency in prostate cancer staging and treatment [5].
Therefore, the aim of this work was to develop a neural network capable of detecting local recurrence in the prostate or prostate bed with high accuracy of at least 90% using 18F-PSMA-1007 PET/CT examinations.
2. Materials and Methods
2.1. Study Population
Details concerning the study group are shown in Table 1. Briefly, 1074 patients with 1459 18F-PSMA-1007 PET/CT scans performed at the Department for Nuclear Medicine at the University Hospital Würzburg between 2019 and 2023 were included in this study. The training and validation set consists of 1259 PET/CT scans, while 200 scans were used for the test set.
We used hybrid PET/CT scanners with an extended field-of-view for the PET and a 64- or 128-slice spiral CT (Biograph64 or 128, Siemens Healthineers; Erlangen, Germany). All cases were re-evaluated explicitly for this project by a trained nuclear medicine physician (H.E.) to label each examination with 0 (no local recurrence in the prostate region, n=658), 1 (local recurrence in the prostate region, n=737), and 2 (uncertain whether there is local recurrence in the prostate region). Instances with label 2 were excluded from training. In summary, the following metadata were available for each examination besides the PET/CT scans: patient pseudo-ID, age, sex, staging, prostatectomy status, PSA level, and label.
Even though the question of local recurrence makes sense only at restaging we decided to include primary staging patients in the training as they are examples of scans with cancerous tissue in the prostate region. We assigned all primary staging scans to the training set. The remaining examinations were assigned randomly into training and validation sets, ensuring that all scans from the same patient ended up in the same set.
The test set comprises an additional 200 scans from 198 patients on the same scanners. This set contains re-staging examinations only. However, 83 patients (84 scans) already had scans in the training/validation set, while 115 patients (116 scans) were novel. Even for known patients, these are new examinations, and both metadata and the label might have changed. The parameters for measurement were identical to those from the training/validation set; the same metadata were supplied, and the same labeling procedure was employed.
2.2. Data Processing
Images were exported from the clinic PACS in DICOM format and converted to NIfTI via dcm2niix [7]. In 59 cases, the conversion failed, so these cases were excluded. Data loaders for deep learning in Python (version 3.12.3) were implemented using nibabel (version 5.2.1, [8]), PyTorch (version 2.3.0, [9]) and Monai (version 1.3.1, [10]). CT and PET images for each patient are measured at different resolutions but cover the same volume (Figure 1). Therefore, after reading both files individually, they are re-scaled to a standard resolution of 150x150x150. Additional transformations like cropping or augmentation transformations are applied depending on the model. Metadata and labels are provided as a simple csv file and loaded via Pandas (version 2.2.2, [11,12]).
2.3. Models
As part of this project, many models have been trained to explore the effects of including different kinds of data, pre-processing, and deep learning techniques. New models build on previous successful models. Besides initial experimentation [13], more than twenty models and variants were trained systematically. Here, we only focus on four models that show incremental improvements. All other models and their variants are described in Appendix A. Source code, and weights are shared in the GitHub repository and on Zenodo. All models use the DenseNet architecture [14] with 121 layers, as implemented in Monai [10]. All models used cross-entropy as the loss function, the Adam optimizer, and a learning rate of 10-5 for 15 epochs. The batch size was set to 16, except for Model A, where this exceeded the GPU memory; in this case, a batch size of 8 was used. After each epoch, the validation accuracy was logged, and the weights were saved. We report the maximum accuracy and provide the model weights from the epoch that reached this maximum. Training was performed on an NVIDIA GeForce RTX 4090 GPU with 24 GB of RAM.
2.3.1. Model A (1) – Base Model
The initial model is supposed to provide the baseline performance, with the most naïve approach, just passing the resized data to a DenseNet121 including moderate augmentation (random rotations by up to 0.2 radians).
2.3.2. Model B (2) – Cropped Around the Prostate
The data includes the whole body, while the specific question (local recurrence) can be answered by focusing on the area around the prostate (region). To automatically crop image volumes around the prostate, the location of the prostate is determined by TotalSegmentator (version 2.1.0, [15]). This worked in most cases, even for patients after radical prostatectomy. In the remaining cases, the position of the urinary bladder was used as a proxy (Figure 2). Images were cropped to a 10cm x 10cm x 10cm cube around the centroid of the prostate (or urinary bladder) in patient coordinates and re-scaled to 70x70x70 voxels. Variants with stronger cropping have been explored (Appendix A).
2.3.3. Model C (6c) – Adding Prostatectomy Status and PSA Level
The status of prostatectomy (px, 0 = no prostatectomy, 1= radical prostatectomy) and the PSA levels are potentially informative. Therefore, this information was added to the model as separate image layers with repeated values (0 or 1 for px and a floating-point number with the normalized PSA level). Training separate models for px = 0 and px = 1 had high accuracy but low balanced accuracy as it overfits the respective majority class (Appendix A).
2.3.4. Model D (7d) – More Extensive Augmentation and Hyperparameter Optimization
Training usually converged rather quickly. So, to increase data heterogeneity (without generating new training sets), we employed more extensive augmentation. With a growing number of augmentation transformations, the number of hyperparameters to tune also increased. Therefore, we applied the hyperparameter optimization toolkit Optuna [16] to find optimal hyperparameter combinations for spatial cropping around the center (CenterSpatialCropd), random flipping (RandFlipd), and random zooming (RandZoomd).
2.4. Evaluation
The classification performance of all models was evaluated using the accuracy and the balanced accuracy of the validation set. Accuracy is the number of correct predictions divided by the number of total predictions. This metric is susceptible to class imbalance. [17]. Therefore, this metric is complemented by the balanced accuracy, which is equivalent to the arithmetic mean of sensitivity and specificity in the case of binary classification.
Only the best-performing model was evaluated on the hold-out test set. Missing values were imputed before prediction in the few cases with missing metadata (two cases missing px, eleven cases missing PSA). For px, the majority class (px=1) and for PSA the mean value (30.1) were used. In addition to accuracy and balanced accuracy, the confusion matrix is reported. Furthermore, accuracy is separately determined for known patients and novel patients.
3. Results
The initial model A, which used the entire volume with moderate augmentation, reached an accuracy of 61.3% with a balanced accuracy of 48.7% (Table 2). Restricting the input data to a 70x70x70 volume around the prostate gland, model B reached an accuracy of 70.7% and a balanced accuracy of 66.9%. Including prostatectomy status and PSA levels as additional data layers (model C) further increased the accuracy to 75.9% with a balanced accuracy of 72.3%. Finally, using Optuna to optimize the hyperparameters and augmentation settings returned the following settings: CenterSpatialCropd with dimensions 65x46x69, RandFlipd along the spatial axis 1 with a probability of 1 (100%), and RandZoomd with a minimum and maximum zoom of 0.5 and a probability of 1 (100%). The model D trained with these settings had the highest accuracy (77.1%) with slightly reduced balanced accuracy (70.6%). Neither of these models comes close to our target accuracy of 90%. As the model with the highest validation accuracy (Table 2), we selected model 7d for evaluation on the hold-out test set.
Model D reached an accuracy of 68.5 % and a balanced accuracy of 70.3 % on the test set (Table 3). While the model had high specificity (86.5%), the sensitivity was poor (54.1%). In 116 cases, the patients were not previously known. Of these cases, 73.3% were correctly identified, while 61.9% of the 84 cases with previously known patients were correctly identified.
4. Discussion
This work aimed to develop a highly accurate neural network to predict local recurrence in prostate cancer patients from PSMA-PET/CT images. We iteratively refined our approach as the initial naïve model had insufficient accuracy. Specifically, we cropped the images around the prostate gland to focus on this region, included important metadata as separate image layers and performed a hyperparameter optimization of certain augmentations to increase the data heterogeneity (Table 1). Furthermore, we modified the dimensions of the region of interest as well as tried masking the PET channel in certain organs or everywhere except the prostate to let the model focus on the prostate alone (Appendix A). While these refinements generally increased the accuracy, the final test set accuracy of 68.5% is still far from acceptable in a clinical context. In particular, the poor sensitivity is concerning in this context as it corresponds to patients with local recurrence not being identified. Sensitivity can generally be increased using a weighted loss function or adapting the threshold for the predicted probability. However, this usually trades specificity for sensitivity. As the overall performance of our models was far from ideal, we did not attempt fine-tuning this trade-off. While we cannot postulate that we reached a theoretical accuracy limit for this task (given our data set), we employed many advanced techniques to improve our models iteratively and reached a comparable accuracy to the 71.4% previously reported for the prediction of prostate cancer recurrence based on 18F-FACBC PET [18]. By documenting this evolution and publishing all code and models, we provide a blueprint for approaching DL to answer a medical research question. While it is undoubtedly possible to marginally increase the accuracy of artificial neural networks by extending the hyperparameter space (e.g., by exploring different network architectures), we postulate that to reach accuracies above 90%, a completely different technique, sophisticated domain-specific adaptations (e.g. attenuation correction[19]) or much more data is required. Transfer learning is an interesting technique that lowers the necessary training data. [20]. A pre-trained model on a related task is required to perform transfer learning. Alternatively, a large dataset for a related task can be used to pre-train a model yourself. We could not find any suitable model or dataset, but now we provide our models as starting points for transfer learning by others. As datasets can usually not be shared because of data protection requirements, we hope our models will be used for TL and that the resulting models will be shared again. We plan to evaluate the performance of an iteratively re-trained model on the initial dataset.
5. Conclusions
For the presented task, 1259 examinations were insufficient to reach an accuracy of over 90% even when employing data augmentation, including additional metadata and performing automated hyperparameter optimization. We facilitate future research and the development of better models by openly sharing our source code and all pre-trained models for transfer learning.
Supplementary Materials
The following supporting information can be downloaded at the website of this paper posted on Preprints.org.
Author Contributions
Conceptualization, R.A.W., M.J.A. and W.S.; methodology, M.J.A.; software, M.K.; validation, M.K., R.D. and S.E.S.; formal analysis, M.K., M.J.A.; investigation, W.S.; resources, A.K.B.; data curation, H.E. and T.J.; writing—original draft preparation, M.K., W.S. and M.J.A.; writing—review and editing, K.M., T.J., A.K., P.E.H., A.K.B., R.A.W..; visualization, W.S.; supervision, W.S. and M.J.A.; project administration, W.S., M.J.A.; funding acquisition, W.S.. All authors have read and agreed to the published version of the manuscript.
Funding
This work was supported by the Interdisciplinary Center of Clinical Research (IZKF), University Hospital of Wuerzburg (grant Z-2/91 to W.S. and grant Z-3BC/08 to K.M.). The APC will be partially funded by the Open Access Publication Fund of the University of Wuerzburg.
Institutional Review Board Statement
Ethical review and approval were waived for this study due to purely retrospective data analysis (confirmed by the University Hospital Würzburg ethics committee on 2023/03/16 (application number 20220908_01)).
Informed Consent Statement
Patient consent was waived due to purely retrospective data analysis (confirmed by the University Hospital Würzburg ethics committee on 2023/03/16 (application number 20220908_01)).
Data Availability Statement
The datasets presented in this article are not readily available because of data protection regulations for routine clinical data. Requests to access the datasets should be directed to WS. All source code is available at https://github.com/BioMeDS/f18-psma-pet-ct-ai and archived at Zenodo https://doi.org/10.5281/zenodo.14944344. The pre-trained model weights are deposited on Zenodo https://doi.org/10.5281/zenodo.14944880.
Acknowledgments
Thanks to Alexandra Sprenger for setting up initial computational experiments with Optuna.
Conflicts of Interest
RAW and AKB have received speaker honoraria from Novartis/AAA and PentixaPharm. RAW reports advisory board work for Novartis/AAA and Bayer. AKB is a member of the advisory board of PentixaPharm. All other authors declare no conflicts of interest. The funders had no role in the design of the study; in the collection, analyses, or interpretation of data; in the writing of the manuscript; or in the decision to publish the results.
Appendix A
Detailed description and evaluation of all models, including those not presented in the main text.
References
- Bray, F.; Ferlay, J.; Soerjomataram, I.; Siegel, R.L.; Torre, L.A.; Jemal, A. Global Cancer Statistics 2018: GLOBOCAN Estimates of Incidence and Mortality Worldwide for 36 Cancers in 185 Countries. CA A Cancer J Clinicians 2018, 68, 394–424. [CrossRef]
- Sung, H.; Ferlay, J.; Siegel, R.L.; Laversanne, M.; Soerjomataram, I.; Jemal, A.; Bray, F. Global Cancer Statistics 2020: GLOBOCAN Estimates of Incidence and Mortality Worldwide for 36 Cancers in 185 Countries. CA A Cancer J Clinicians 2021, 71, 209–249. [CrossRef]
- Andrearczyk, V.; Oreiller, V.; Abobakr, M.; Akhavanallaf, A.; Balermpas, P.; Boughdad, S.; Capriotti, L.; Castelli, J.; Le Rest, C.C.; Decazes, P.; et al. Overview of the HECKTOR Challenge at MICCAI 2022: Automatic Head and Neck Tumor Segmentation and Outcome Prediction in PET/CT. Head Neck Tumor Chall (2022) 2023, 13626, 1–30. [CrossRef]
- Wallis, D.; Soussan, M.; Lacroix, M.; Akl, P.; Duboucher, C.; Buvat, I. An [18F]FDG-PET/CT Deep Learning Method for Fully Automated Detection of Pathological Mediastinal Lymph Nodes in Lung Cancer Patients. Eur J Nucl Med Mol Imaging 2022, 49, 881–888. [CrossRef]
- Lindgren Belal, S.; Frantz, S.; Minarik, D.; Enqvist, O.; Wikström, E.; Edenbrandt, L.; Trägårdh, E. Applications of Artificial Intelligence in PSMA PET/CT for Prostate Cancer Imaging. Seminars in Nuclear Medicine 2024, 54, 141–149. [CrossRef]
- Mingels, C.; Bohn, K.P.; Rominger, A.; Afshar-Oromieh, A.; Alberts, I. Diagnostic Accuracy of [18F]PSMA-1007 PET/CT in Biochemical Recurrence of Prostate Cancer. Eur J Nucl Med Mol Imaging 2022, 49, 2436–2444. [CrossRef]
- Li, X.; Morgan, P.S.; Ashburner, J.; Smith, J.; Rorden, C. The First Step for Neuroimaging Data Analysis: DICOM to NIfTI Conversion. J Neurosci Methods 2016, 264, 47–56. [CrossRef]
- Brett, M.; Markiewicz, C.J.; Hanke, M.; Côté, M.-A.; Cipollini, B.; McCarthy, P.; Jarecka, D.; Cheng, C.P.; Larson, E.; Halchenko, Y.O.; et al. Nipy/Nibabel: 5.2.1 2024.
- Paszke, A.; Gross, S.; Massa, F.; Lerer, A.; Bradbury, J.; Chanan, G.; Killeen, T.; Lin, Z.; Gimelshein, N.; Antiga, L.; et al. PyTorch: An Imperative Style, High-Performance Deep Learning Library 2019.
- Cardoso, M.J.; Li, W.; Brown, R.; Ma, N.; Kerfoot, E.; Wang, Y.; Murray, B.; Myronenko, A.; Zhao, C.; Yang, D.; et al. MONAI: An Open-Source Framework for Deep Learning in Healthcare. 2022. [CrossRef]
- team, T. pandas development Pandas-Dev/Pandas: Pandas 2024.
- McKinney, W. Data Structures for Statistical Computing in Python.; Austin, Texas, 2010; pp. 56–61.
- Schlötelburg, W.; Efetürk, H.; Jedamzik, T.; Hartrampf, P.; Michalski, K.; Kosmala, A.; Buck, A.; Werner, R.; Sprenger, A.; Dirk, R.; et al. Development of a Neural Network for PET-Based Detection of Local Recurrence in Prostate Cancer. Journal of Nuclear Medicine 2024, 65, 241280–241280.
- Huang, G.; Liu, Z.; Maaten, L. van der; Weinberger, K.Q. Densely Connected Convolutional Networks 2018.
- Wasserthal, J.; Breit, H.-C.; Meyer, M.T.; Pradella, M.; Hinck, D.; Sauter, A.W.; Heye, T.; Boll, D.T.; Cyriac, J.; Yang, S.; et al. TotalSegmentator: Robust Segmentation of 104 Anatomic Structures in CT Images. Radiology: Artificial Intelligence 2023, 5, e230024. [CrossRef]
- Akiba, T.; Sano, S.; Yanase, T.; Ohta, T.; Koyama, M. Optuna: A Next-Generation Hyperparameter Optimization Framework. In Proceedings of the Proceedings of the 25th ACM SIGKDD International Conference on Knowledge Discovery & Data Mining; Association for Computing Machinery: New York, NY, USA, July 25 2019; pp. 2623–2631.
- Maier-Hein, L.; Reinke, A.; Godau, P.; Tizabi, M.D.; Buettner, F.; Christodoulou, E.; Glocker, B.; Isensee, F.; Kleesiek, J.; Kozubek, M.; et al. Metrics Reloaded: Recommendations for Image Analysis Validation. Nat Methods 2024, 21, 195–212. [CrossRef]
- Lee, J.J.; Yang, H.; Franc, B.L.; Iagaru, A.; Davidzon, G.A. Deep Learning Detection of Prostate Cancer Recurrence with 18F-FACBC (Fluciclovine, Axumin®) Positron Emission Tomography. Eur J Nucl Med Mol Imaging 2020, 47, 2992–2997. [CrossRef]
- Ma, K.C.; Mena, E.; Lindenberg, L.; Lay, N.S.; Eclarinal, P.; Citrin, D.E.; Pinto, P.A.; Wood, B.J.; Dahut, W.L.; Gulley, J.L.; et al. Deep Learning-Based Whole-Body PSMA PET/CT Attenuation Correction Utilizing Pix-2-Pix GAN. Oncotarget 2024, 15, 288–300. [CrossRef]
- Ankenbrand, M.J.; Lohr, D.; Schlötelburg, W.; Reiter, T.; Wech, T.; Schreiber, L.M. Deep Learning-Based Cardiac Cine Segmentation: Transfer Learning Application to 7T Ultrahigh-Field MRI. Magnetic Resonance in Medicine 2021, 86, 2179–2191. [CrossRef]
Figure 1.
PSMA-PET/CT: A. maximum intensity projection; axial corresponding CT (B) and PET (C) slices; D. fused PET and CT slice. Example of a 78-year-old patient with osseus and lymphnodal metastases, as well as a local recurrence in the prostate bed (indicated by the arrow).
Figure 1.
PSMA-PET/CT: A. maximum intensity projection; axial corresponding CT (B) and PET (C) slices; D. fused PET and CT slice. Example of a 78-year-old patient with osseus and lymphnodal metastases, as well as a local recurrence in the prostate bed (indicated by the arrow).
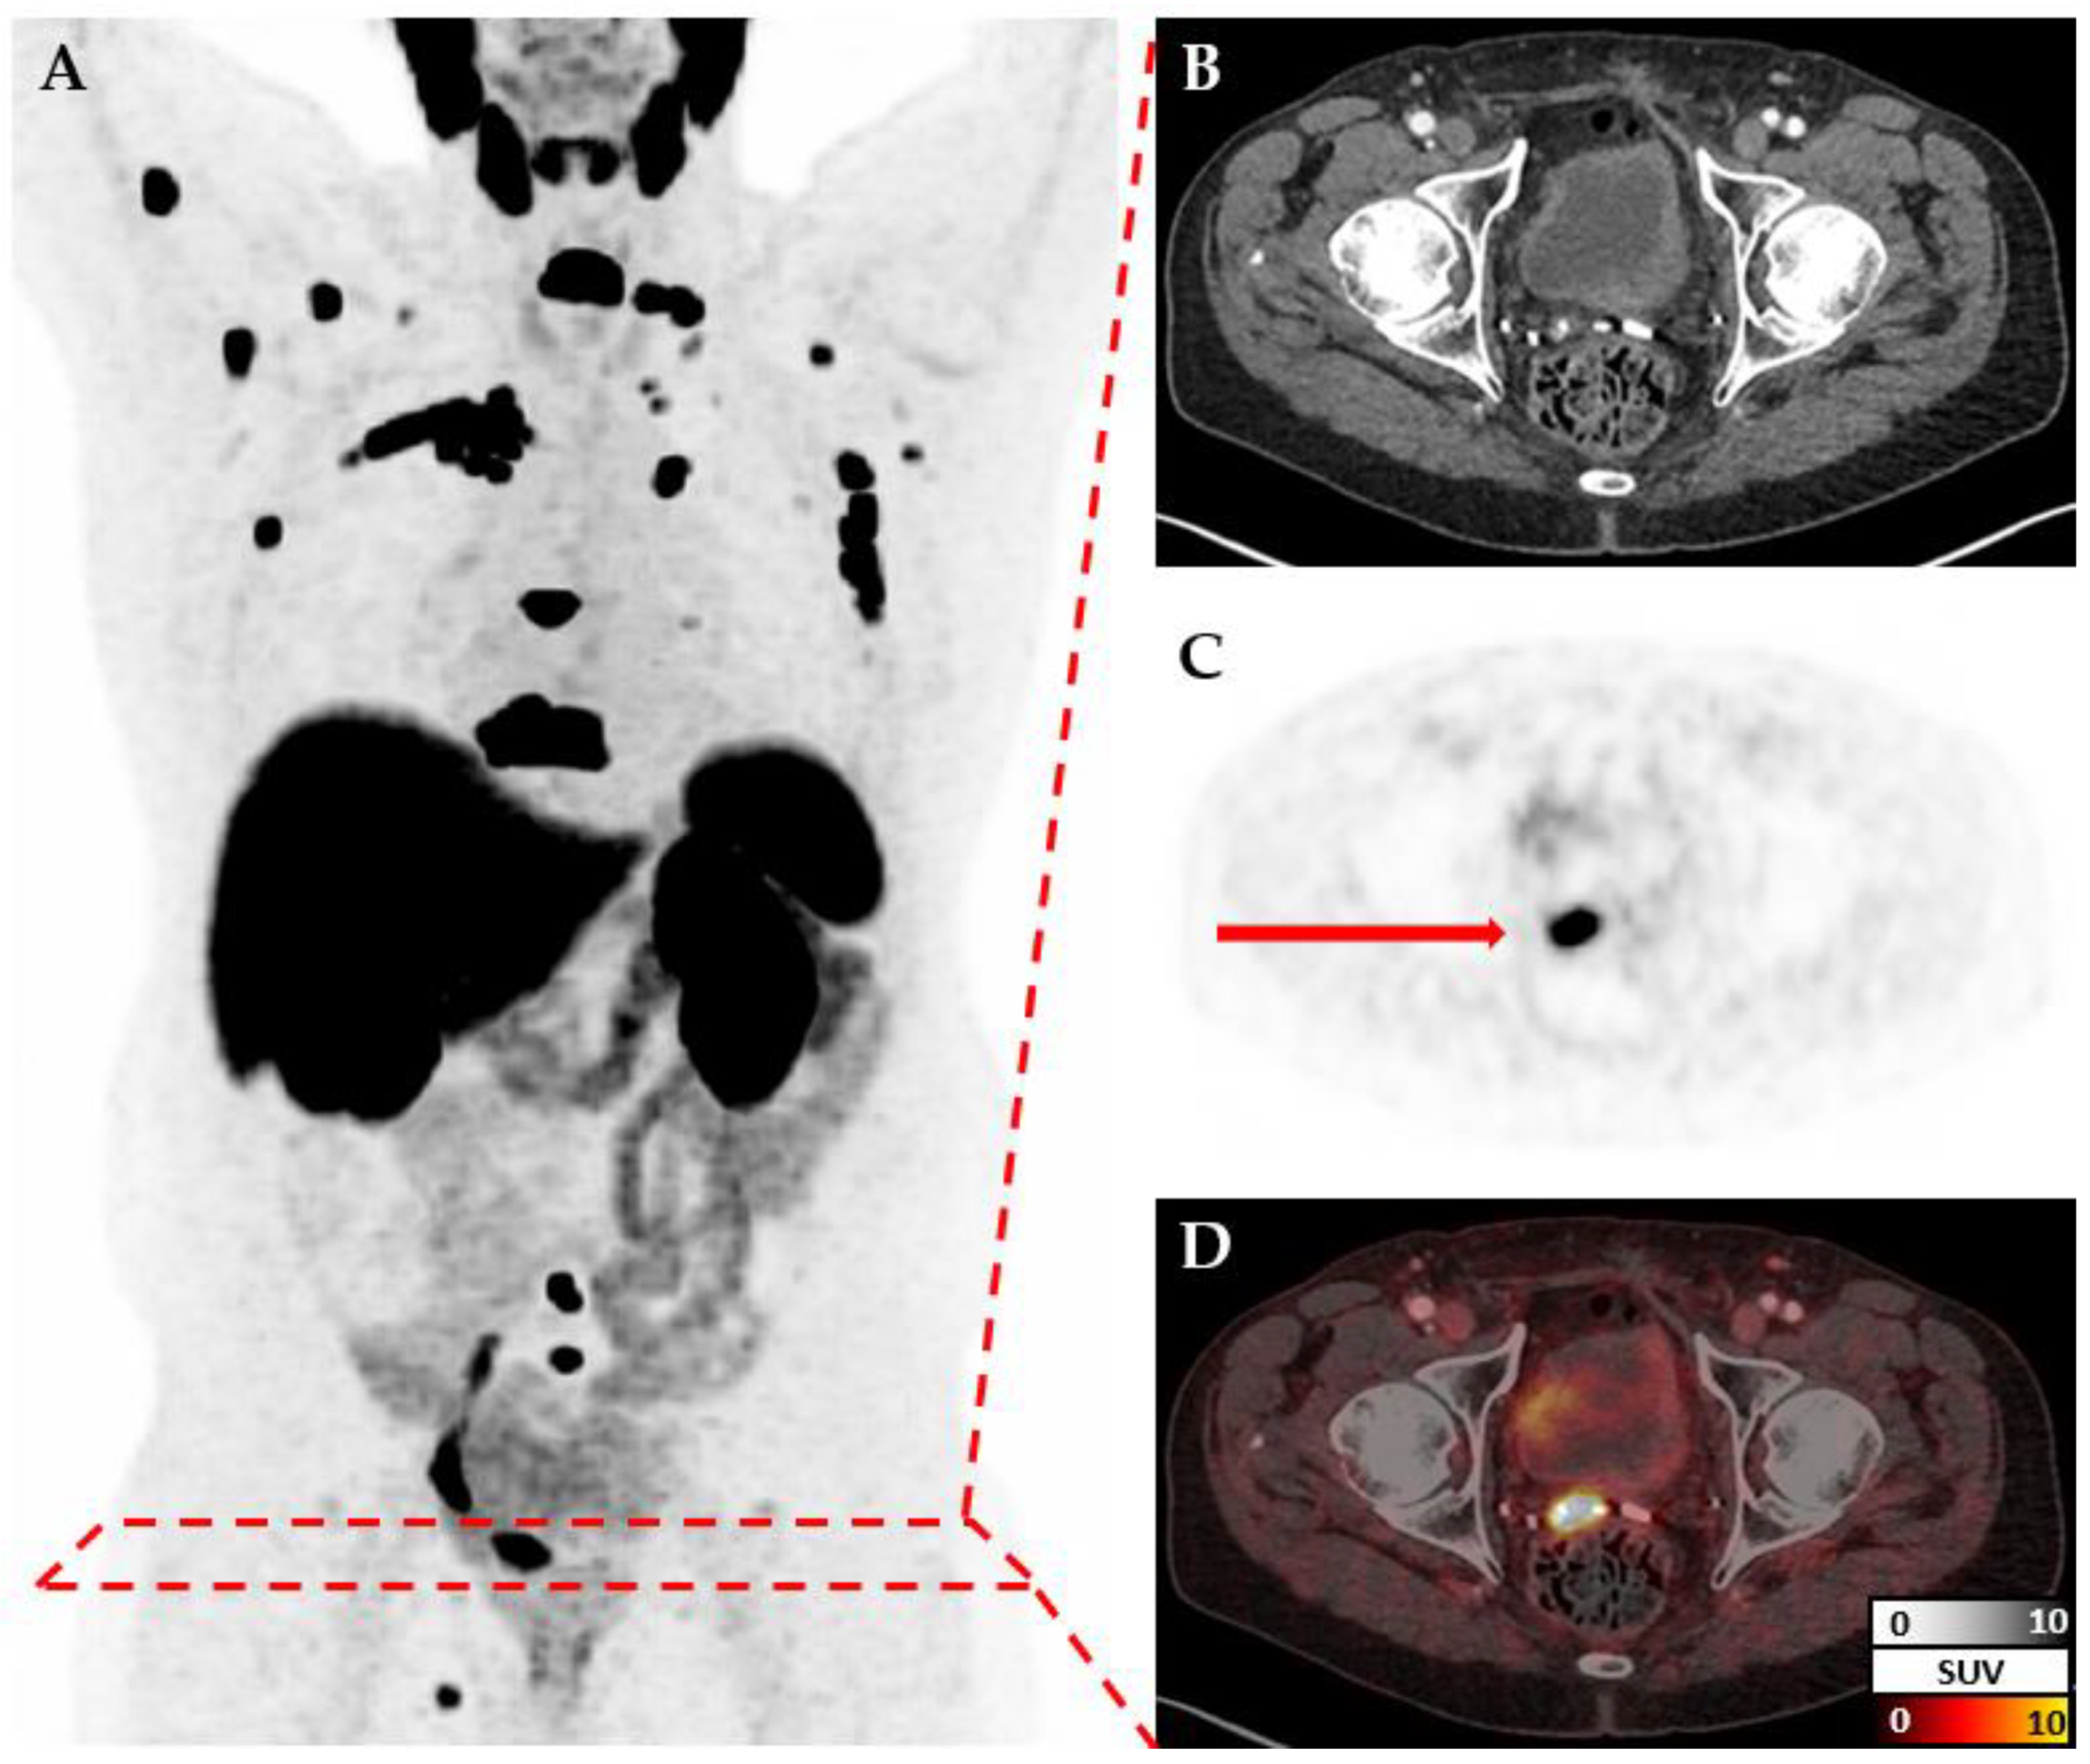
Figure 2.
Result of TotalSegmentator [15] On three patients. White arrows indicate the detected prostate gland in patients A and B, while the red rectangle indicates the absence of the prostate gland in patient C. The white asterisks indicate that the urinary bladder was successfully detected in all patients.
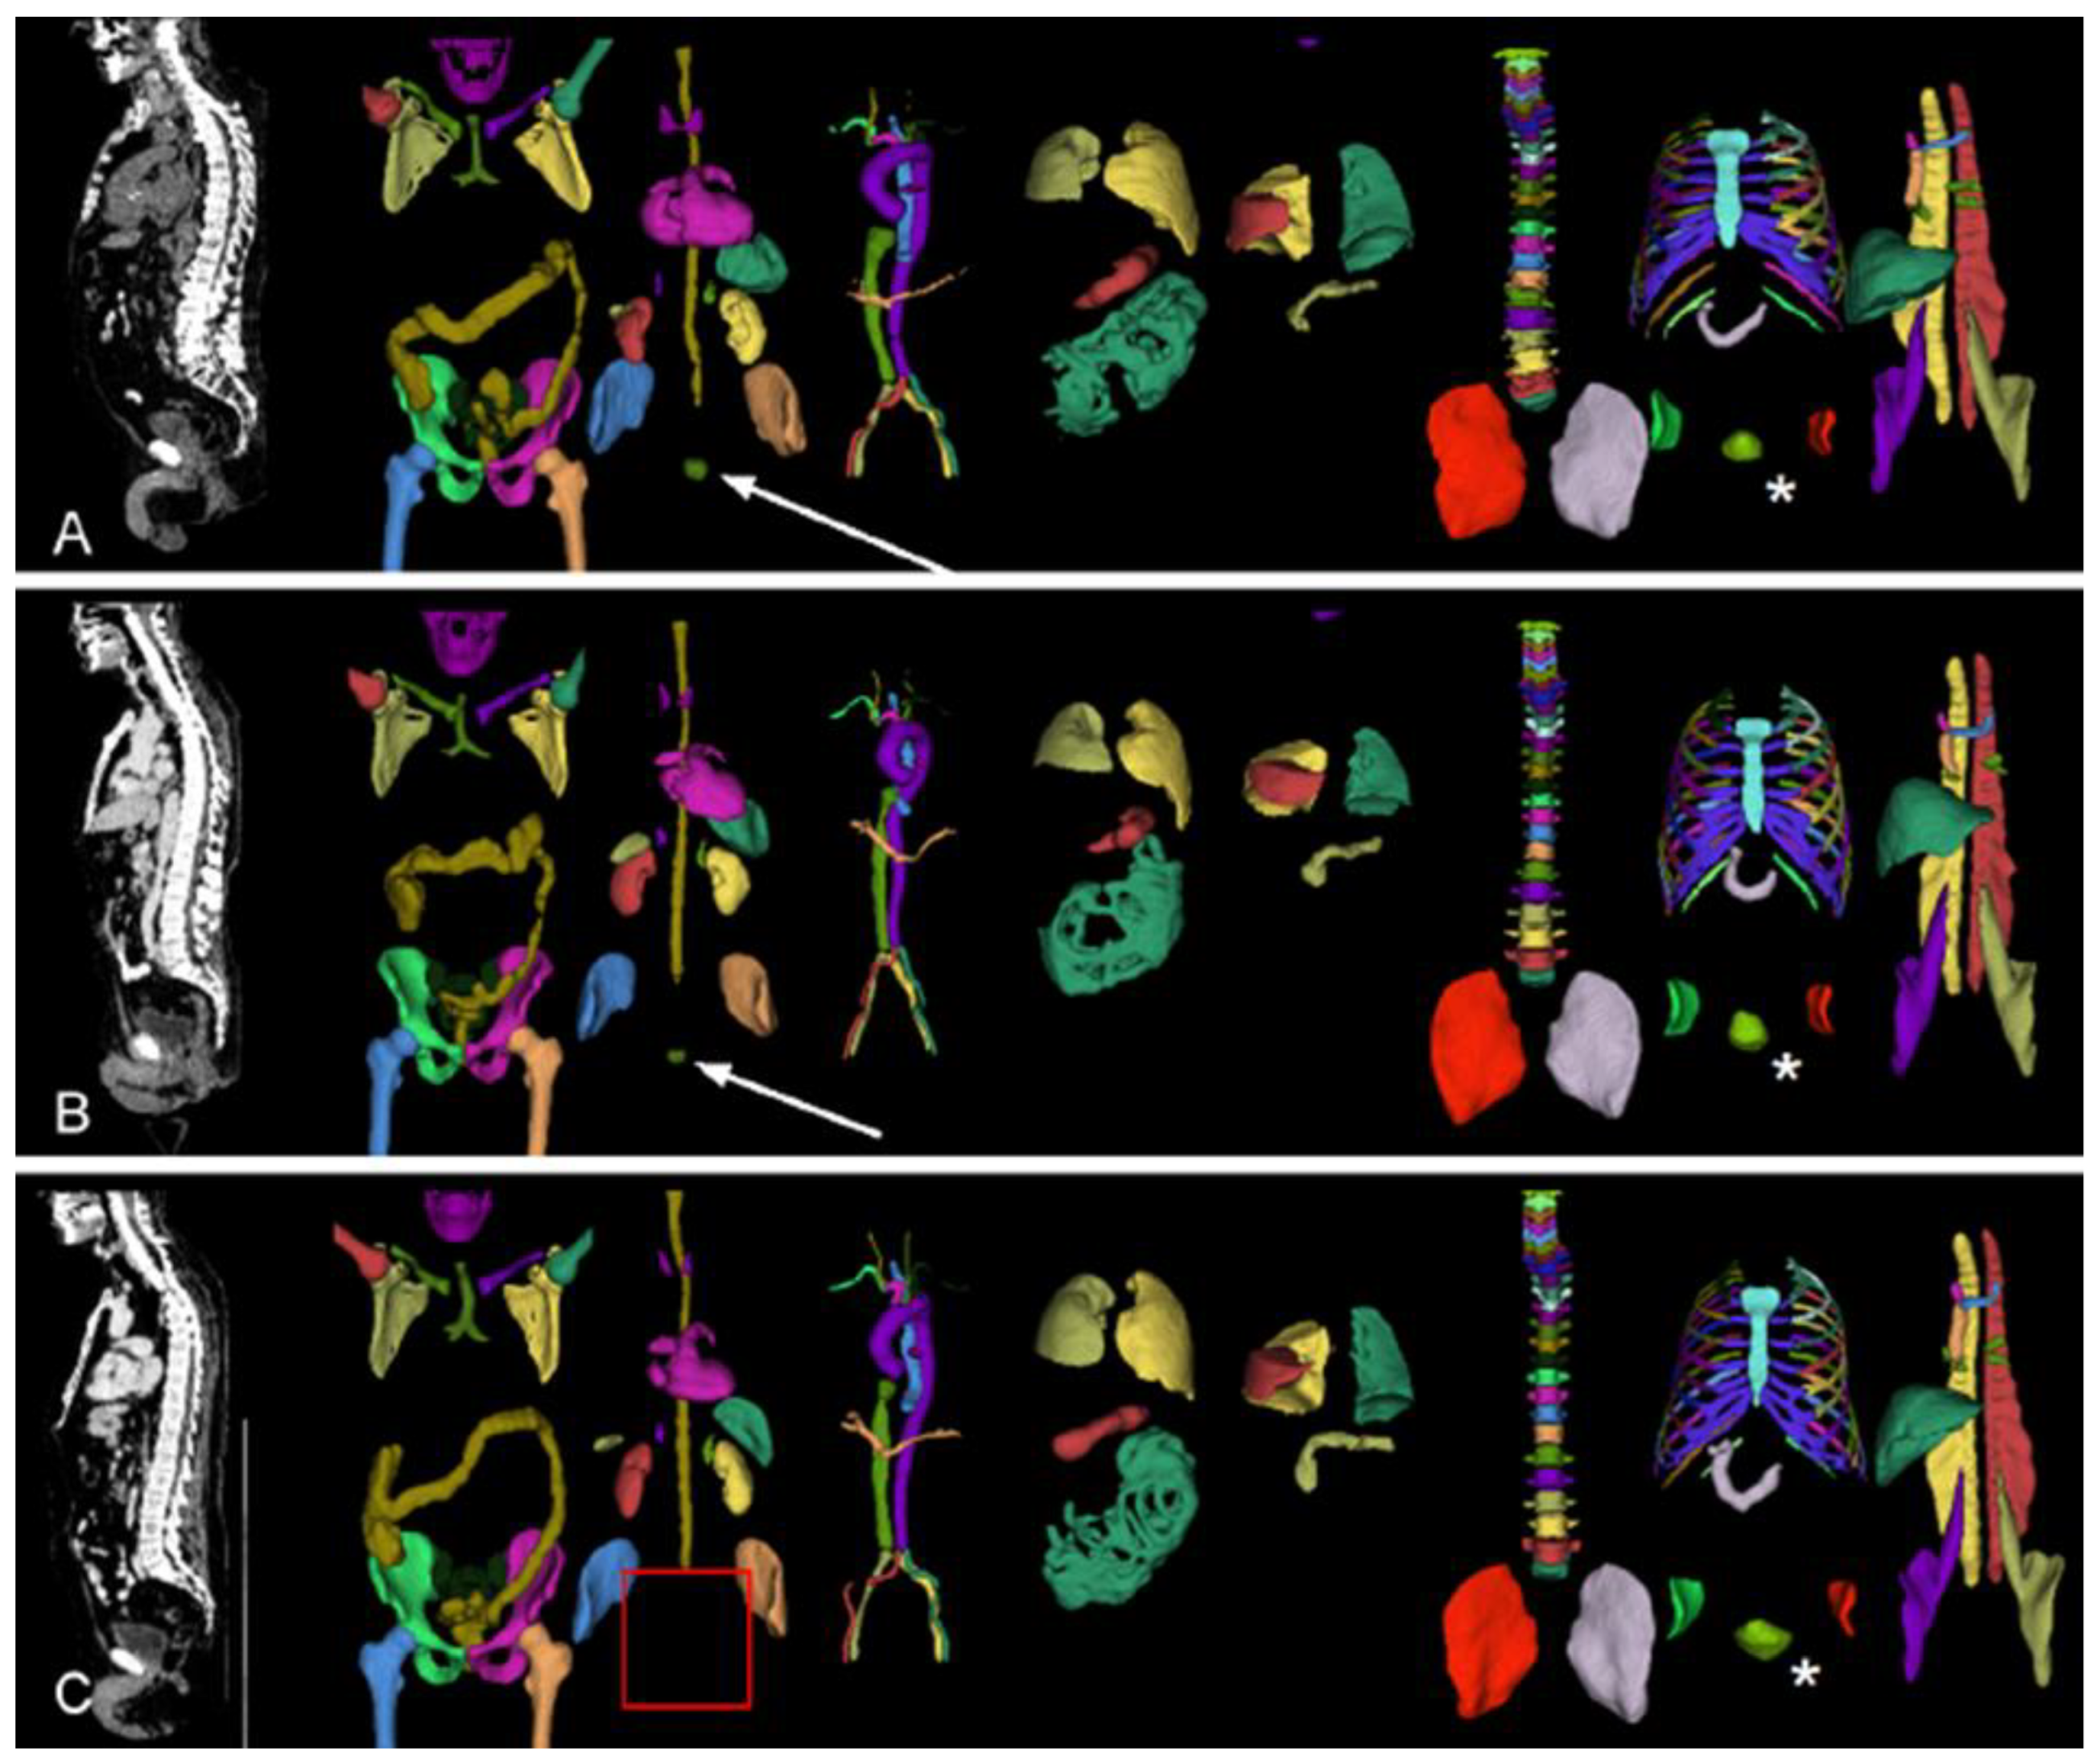

Table 1.
Study group characteristics.
| Total | Training | Validation | Test | |
|---|---|---|---|---|
| Patient number | 1189 | 904 | 170 | 198 |
| 18F-PSMA-PET/CT scan number | 1459 | 1059 | 200 | 200 |
| Indication for 18F-PSMA-PET/CT scan | ||||
| Primary staging | 222 | 222 | 0 | 0 |
| Restaging | 1237 | 837 | 200 | 200 |
| Patients’ characteristics | ||||
| Age, mean (range) | 70.5 (44-90) |
70.3 (44-90) |
71.0 (46-89) |
71.3 (53-86) |
| Scans with prior prostatectomy (%) | 825 (57%) | 568 (54%) | 134 (67%) | 123 (62%) |
| PSA-Level, mean (range) | 44.3 (0-7434) |
45.6 (0-3420) |
51.5 (0-7434) |
30.1 (0-932) |
| Label | ||||
| 0 (no local recurrence) | 658 | 460 | 109 | 89 |
| 1 (local recurrence) | 737 | 542 | 84 | 111 |
| 2 (uncertain case) | 64 | 57 | 7 | 0 |
Table 2.
Model validation accuracies.
| Model | Accuracy | Balanced Accuracy |
|---|---|---|
| Model A (1) – Base Model | 0.613 | 0.487 |
| Model B (2) – Cropped FOV | 0.707 | 0.669 |
| Model C (6c) – px and PSA | 0.759 | 0.723 |
| Model D (7d) – hyperparam. | 0.771 | 0.706 |
Table 3.
Confusion matrix of Model 7d on the test set.
| ↓ Truth \ Prediction → | recurrence | no recurrence |
|---|---|---|
| recurrence | 60 | 51 |
| no recurrence | 12 | 77 |
Disclaimer/Publisher’s Note: The statements, opinions and data contained in all publications are solely those of the individual author(s) and contributor(s) and not of MDPI and/or the editor(s). MDPI and/or the editor(s) disclaim responsibility for any injury to people or property resulting from any ideas, methods, instructions or products referred to in the content. |
© 2025 by the authors. Licensee MDPI, Basel, Switzerland. This article is an open access article distributed under the terms and conditions of the Creative Commons Attribution (CC BY) license (https://creativecommons.org/licenses/by/4.0/).
Copyright: This open access article is published under a Creative Commons CC BY 4.0 license, which permit the free download, distribution, and reuse, provided that the author and preprint are cited in any reuse.


