1. Introduction
For the last two decades, many recombinant proteins of pharmaceutical commercial interest have been approved by the FDA for different clinical indications. Currently there are more than 76 approved antibodies on the US market and an estimated 200 or more are in development [
1,
2]. It has been reported that there was a substantial increase in the total number of antibody therapeutics entering clinical studies during the 2015-17 (average 106/year) compared to 2010-2014 (average 64/year) [
3]. Therapeutic proteins have been implicated in inducing undesired immune reactions in patients. This is especially problematic, if the protein is prone to aggregation. Because of this, the presence of even low levels of aggregation has been identified as a significant factor in obviating immune tolerance [
2,
3,
4], the minute amounts of aggregated protein molecules can function as nuclei for severe aggregation [
5] or fibrillation [
6,
7,
8]. No single analytical method exists to span the entire size range over which aggregates may appear. Each analytical method has its specific advantages but also has its limitations [
9]
Therapeutic proteins or peptides need to be resistant against chemical and physical degradation in a given environment, while maintaining bioactivity. This physical and chemical damage of the biologic may lead to toxicity, immunogenicity and reduced bioactivity/bioavailability [
1,
2,
3,
4]. Formulation scientists have utilized various tools to evaluate the stability of biologics including fluorescence [
10], high pressure liquid chromatography (HPLC) [
11], gas chromatography GC [
12], electrophoresis [
13], circular dichroism [
14], Fourier-transform infrared spectroscopy (FTIR) [
15,
16], differential scanning calorimetry (DSC) [
17], etc. Even with these advanced analytical methods, it is impossible to provide complete conformational characteristics of proteins.
Recently, a high throughput protein formulation platform has been established based on accelerated stability incubating the formulations at room temperature for 7 days using 96 well plate formulations and analyzed by A280 measurement, intrinsic fluorescence of tyrosine, turbidometric analysis at 350 nm, extrinsic fluorescence utilizing Nile Red or Amino naphtha sulfanilic acid (ANS) dye [
10]. The authors have cautioned the draw back of each of these techniques also. Changes of intrinsic fluorescence of tryptophan have been used to study the conformational changes of protein [
18,
19]. Analysis of protein aggregates by extrinsic dyes that interact non-covalently with proteins and protein degradation products, e.g. via hydrophobic or electrostatic interactions are reviewed by several scientists [
10,
19,
20].
Right angle Light scattering (RALS) is one of the most useful tools in monitoring the aggregation state of proteins [
21,
22]. RALS can be employed to detect and monitor the subtle changes in associative behavior of stressed proteins in otherwise visually clear solutions and sometime not detectable even with SEC-HPLC analysis. Though, this technique does not provide much information on degradation, and chemical status of the molecule such as deamidation, oxidation, and hydrolysis, a significant advantage of RALS is that a protein’s aggregation state can be evaluated directly in solution. There is no requirement for pre-processing and measurements can be made in the formulation buffer matrix. In this way, insight into the protein’s aggregation state can be monitored without introducing artifacts due to buffer exchange, interaction with column matrix or changes in concentration which could affect the monomer-aggregate equilibrium.
A common approach to formulation development involves screening of excipients and excipient combinations, frequently by evaluating the proteins physical state by SE-HPLC after subjecting the formulated protein to a physical stress such as heat [
11]. This method provides considerable useful information about the protein’s response to stress formulations. It does, however, have a few shortcomings as well. HPLC can’t detect very large aggregates. The presence of large aggregates can be inferred by a reduction in the size of the main peak, however. Another perhaps more significant concern is that HPLC usually employs a mobile phase that is different from the formulation being evaluated. So, the actual analysis is being conducted in a mobile phase that could create artifacts.
In this paper, we outline a method for pre-formulation development, which is faster, more cost effective and offers unique advantages to conventional pre-formulation development. The method is a systematic iterative screening of formulations employing static RALS analysis and RALS analysis coupled with thermal ramping. The method is particularly useful in eliminating less promising excipient candidates from formulation development of proteins, peptides, biosimilars and non-protein polymers. Therefore, time spent in the laborious task of conventional formulation development can be restricted to only the most promising candidates. This saves time and valuable Active Drug Product (API). Additionally, evaluation of API in the actual formulation under consideration provides valuable insight than conventional methods which require preprocessing or buffer exchange.
2. Material and Methods
Three different antibodies used for this study were produced from either CHO cells (antibody 1 against tissue necrotic factor and antibody 2 against IL-13) or yeast cells (antibody 3 against IL-6) utilizing recombinant technology. The recombinant 60 kDa secretary protein is obtained from CHO cells. 3kda protein is from inclusion body of E.Coli. A polymer, which is known to deliver the small molecule was also evaluated. Humira and Clone 1 and 2 of Humira for bio-similar were produced from CHO cells. As all these API are proprietary, the source of these API are not disclosed. The formulations were kept at 50°C for different periods to study the thermal stability in sterile polypropylene Eppendorf tube. Acute thermal denaturation of antibodies was performed using an SLM/Aminco Bowman series fluorescence spectrophotometer. The right-angle light scattering was monitored by exciting the protein formulation at 320 nm and monitoring the emission at 320 nm. The emission signal was monitored continuously as the temperature of the cuvette was raised at a rate of 2°C / minute. Recirculation water from programmable VWR water bath controlled the cuvette temperature. Purity and recovery of antibodies were measured by SE-HPLC using TosoHass TSK 3000 SWXL HPLC column using a buffer of 200 mM sodium phosphate buffer at pH 7.5 or 100mM Sodium phosphate and 200mM Sodium chloride pH 6.5. The flow rate is 1 mL/ minute and the total running time is 20 minutes. 10-20µg of antibodies was injected. Purity and recovery of peptide was measured by SE-HPLC using TosoHass TSK Super SW 2000 HPLC column using 0.1% trifluoro acetic acid as mobile phase with a flow rate of 0.2 mL/ minute and running time of 36 minutes. 1 µg of peptide was injected. Absorbance is monitored either at 210 nm or 280 nm.
Effects of Ion on the stability of antibodies were evaluated at different concentrations of NaCl in the formulation. To check the effect of pH on the stability of antibody, pH adjusted CuriRx Base Buffer (CBB) system was used. CBB is made as a 2mM solution with Glycine, Citric acid, HEPES, MES, TRIS as buffer components, adjusted pH either with HCl or NaOH. After initial screening with CBB buffer, phosphate, pyrophosphate, sodium citrate, and sodium succinate and Histidine buffers at 10 mM concentrations were used to screen pH optimum at a narrow range. Effect of stabilizers/bulking agents (amino acids and carbohydrates) were also evaluated at different concentrations
To determine the Z average diameter of the protein, Malvern zetasizer Nano-ZS90 was used. The 0.4 mL of sample in quartz cuvette was used to determine the Z average of the particle size using the viscosity 0.8872 cp viscosity and redox index of 1.330.
3. Results
In order to understand the utility of the RALS method, Antibody 1 was evaluated with reference to pH, ionic strength and stabilizers. Only limited parameters were evaluated for Antibody2, Antibody 3, other protein and peptide.
Case Study 1:
pH:
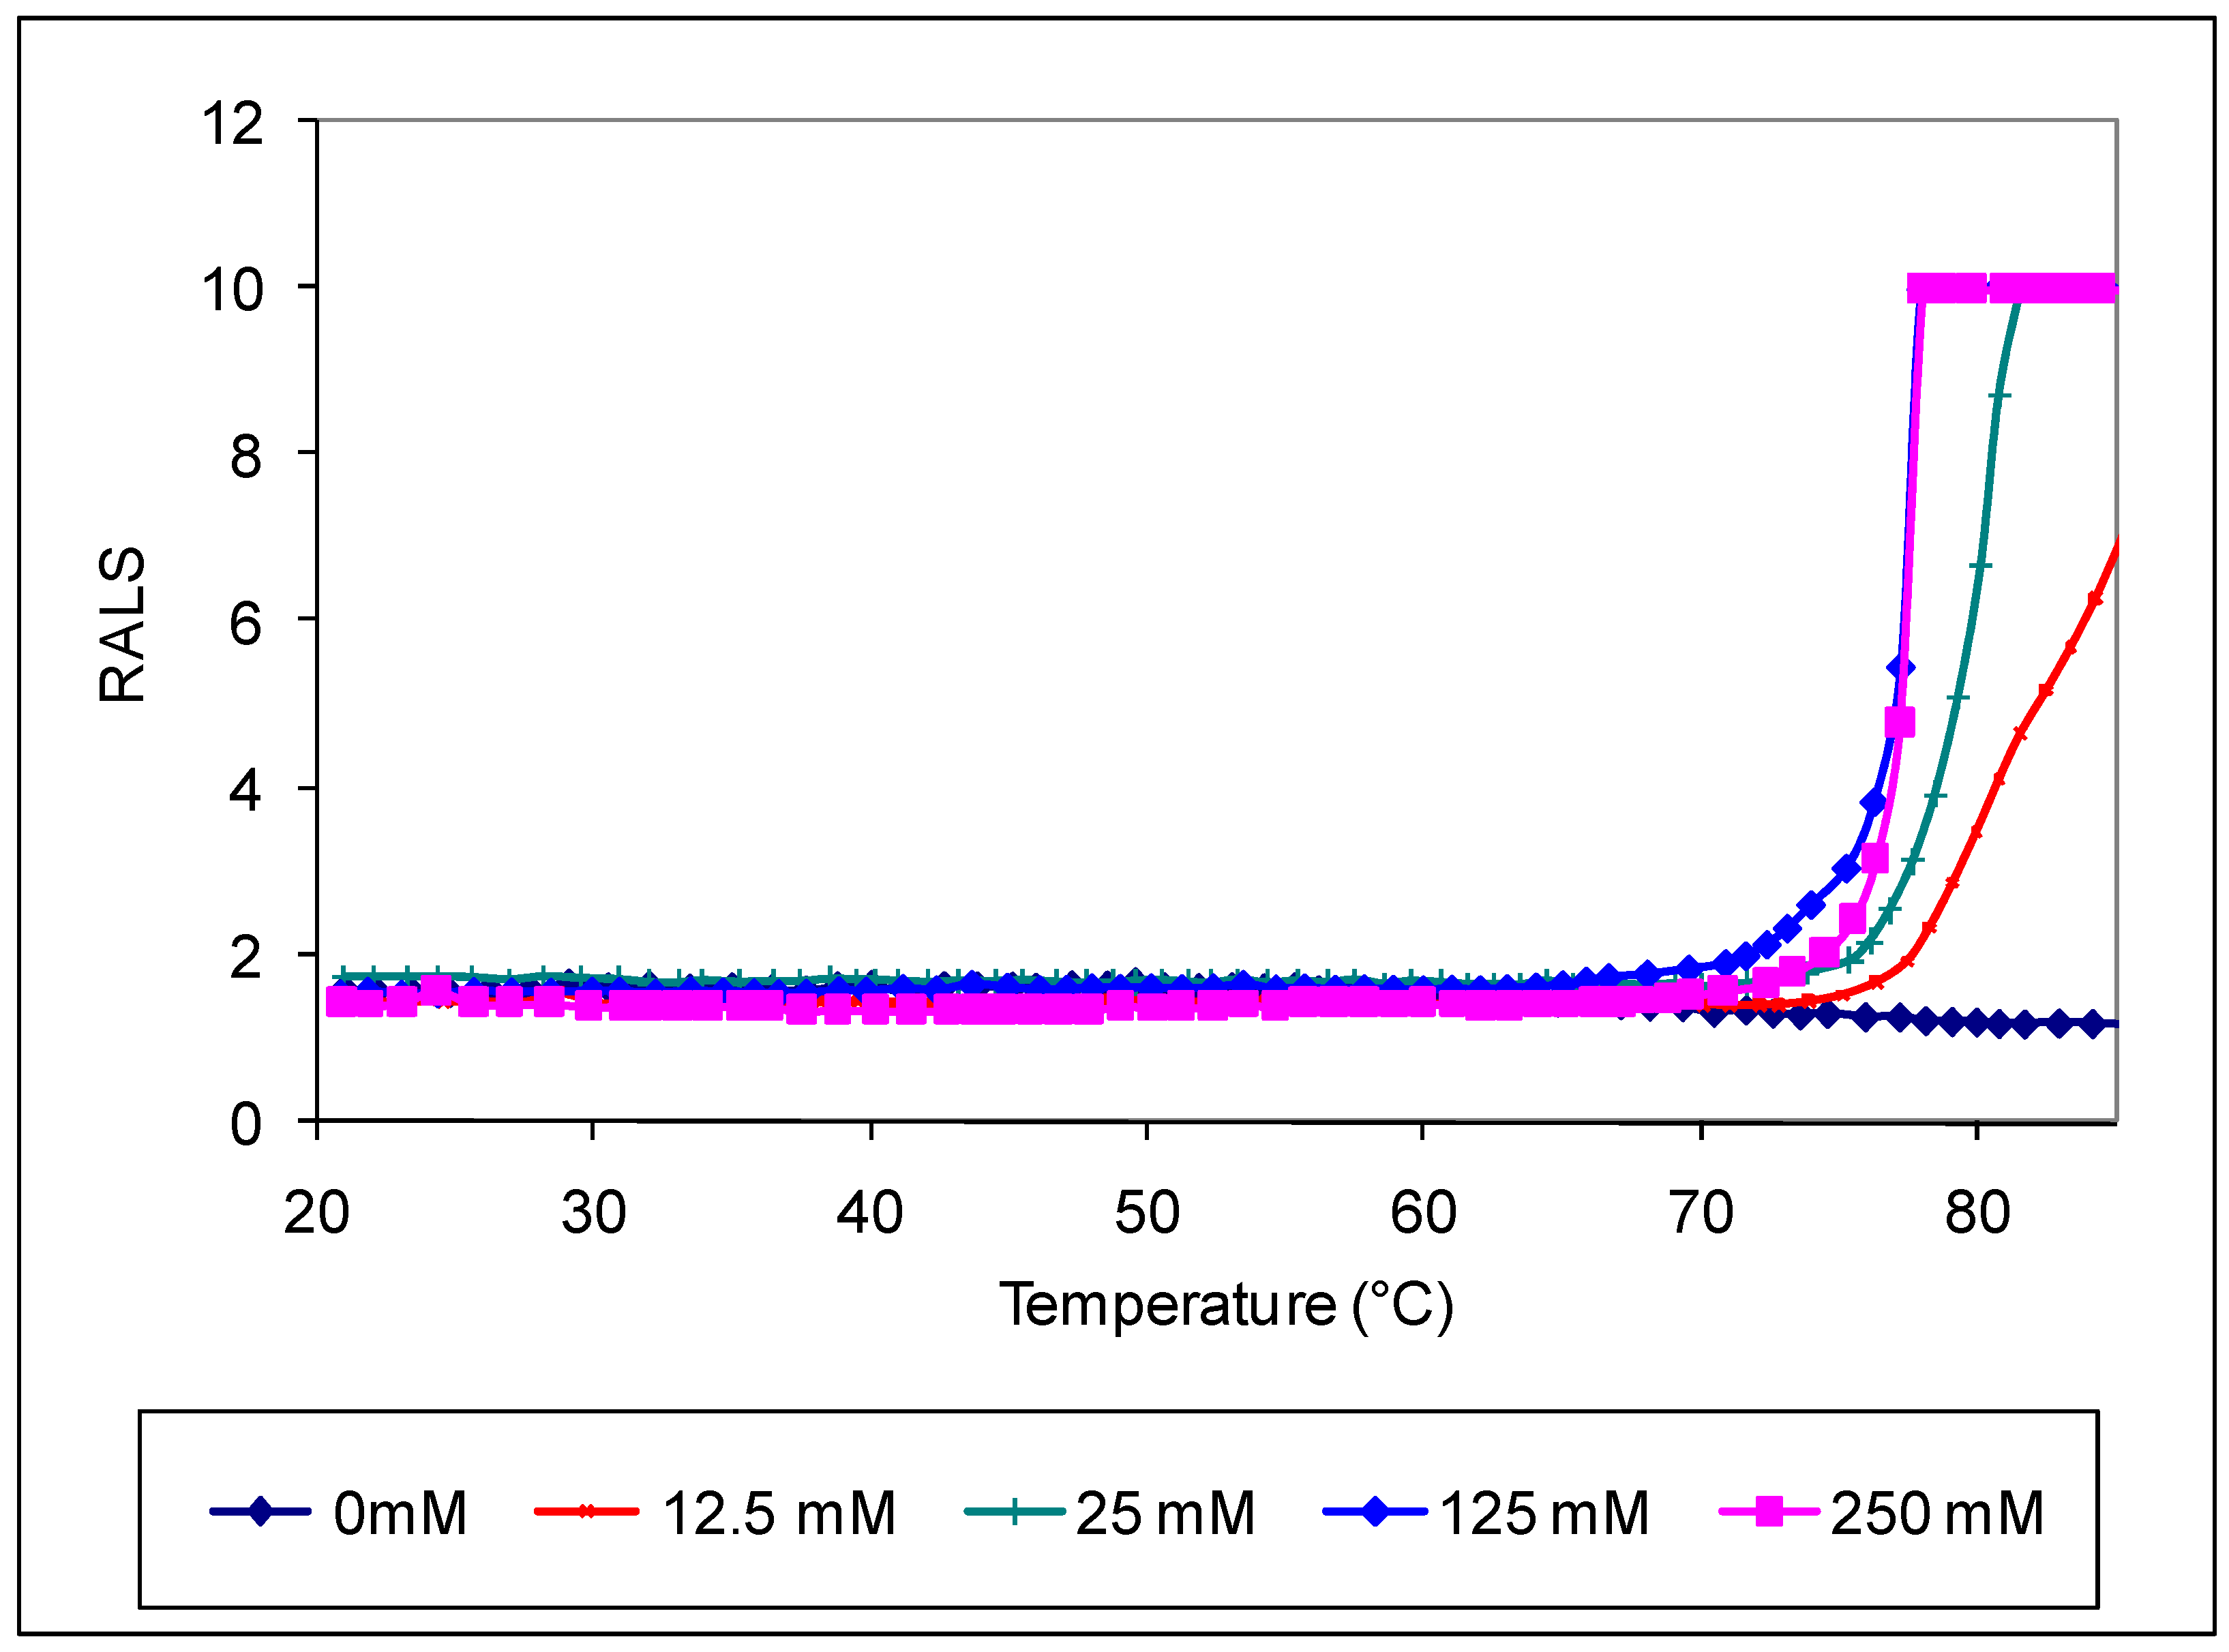
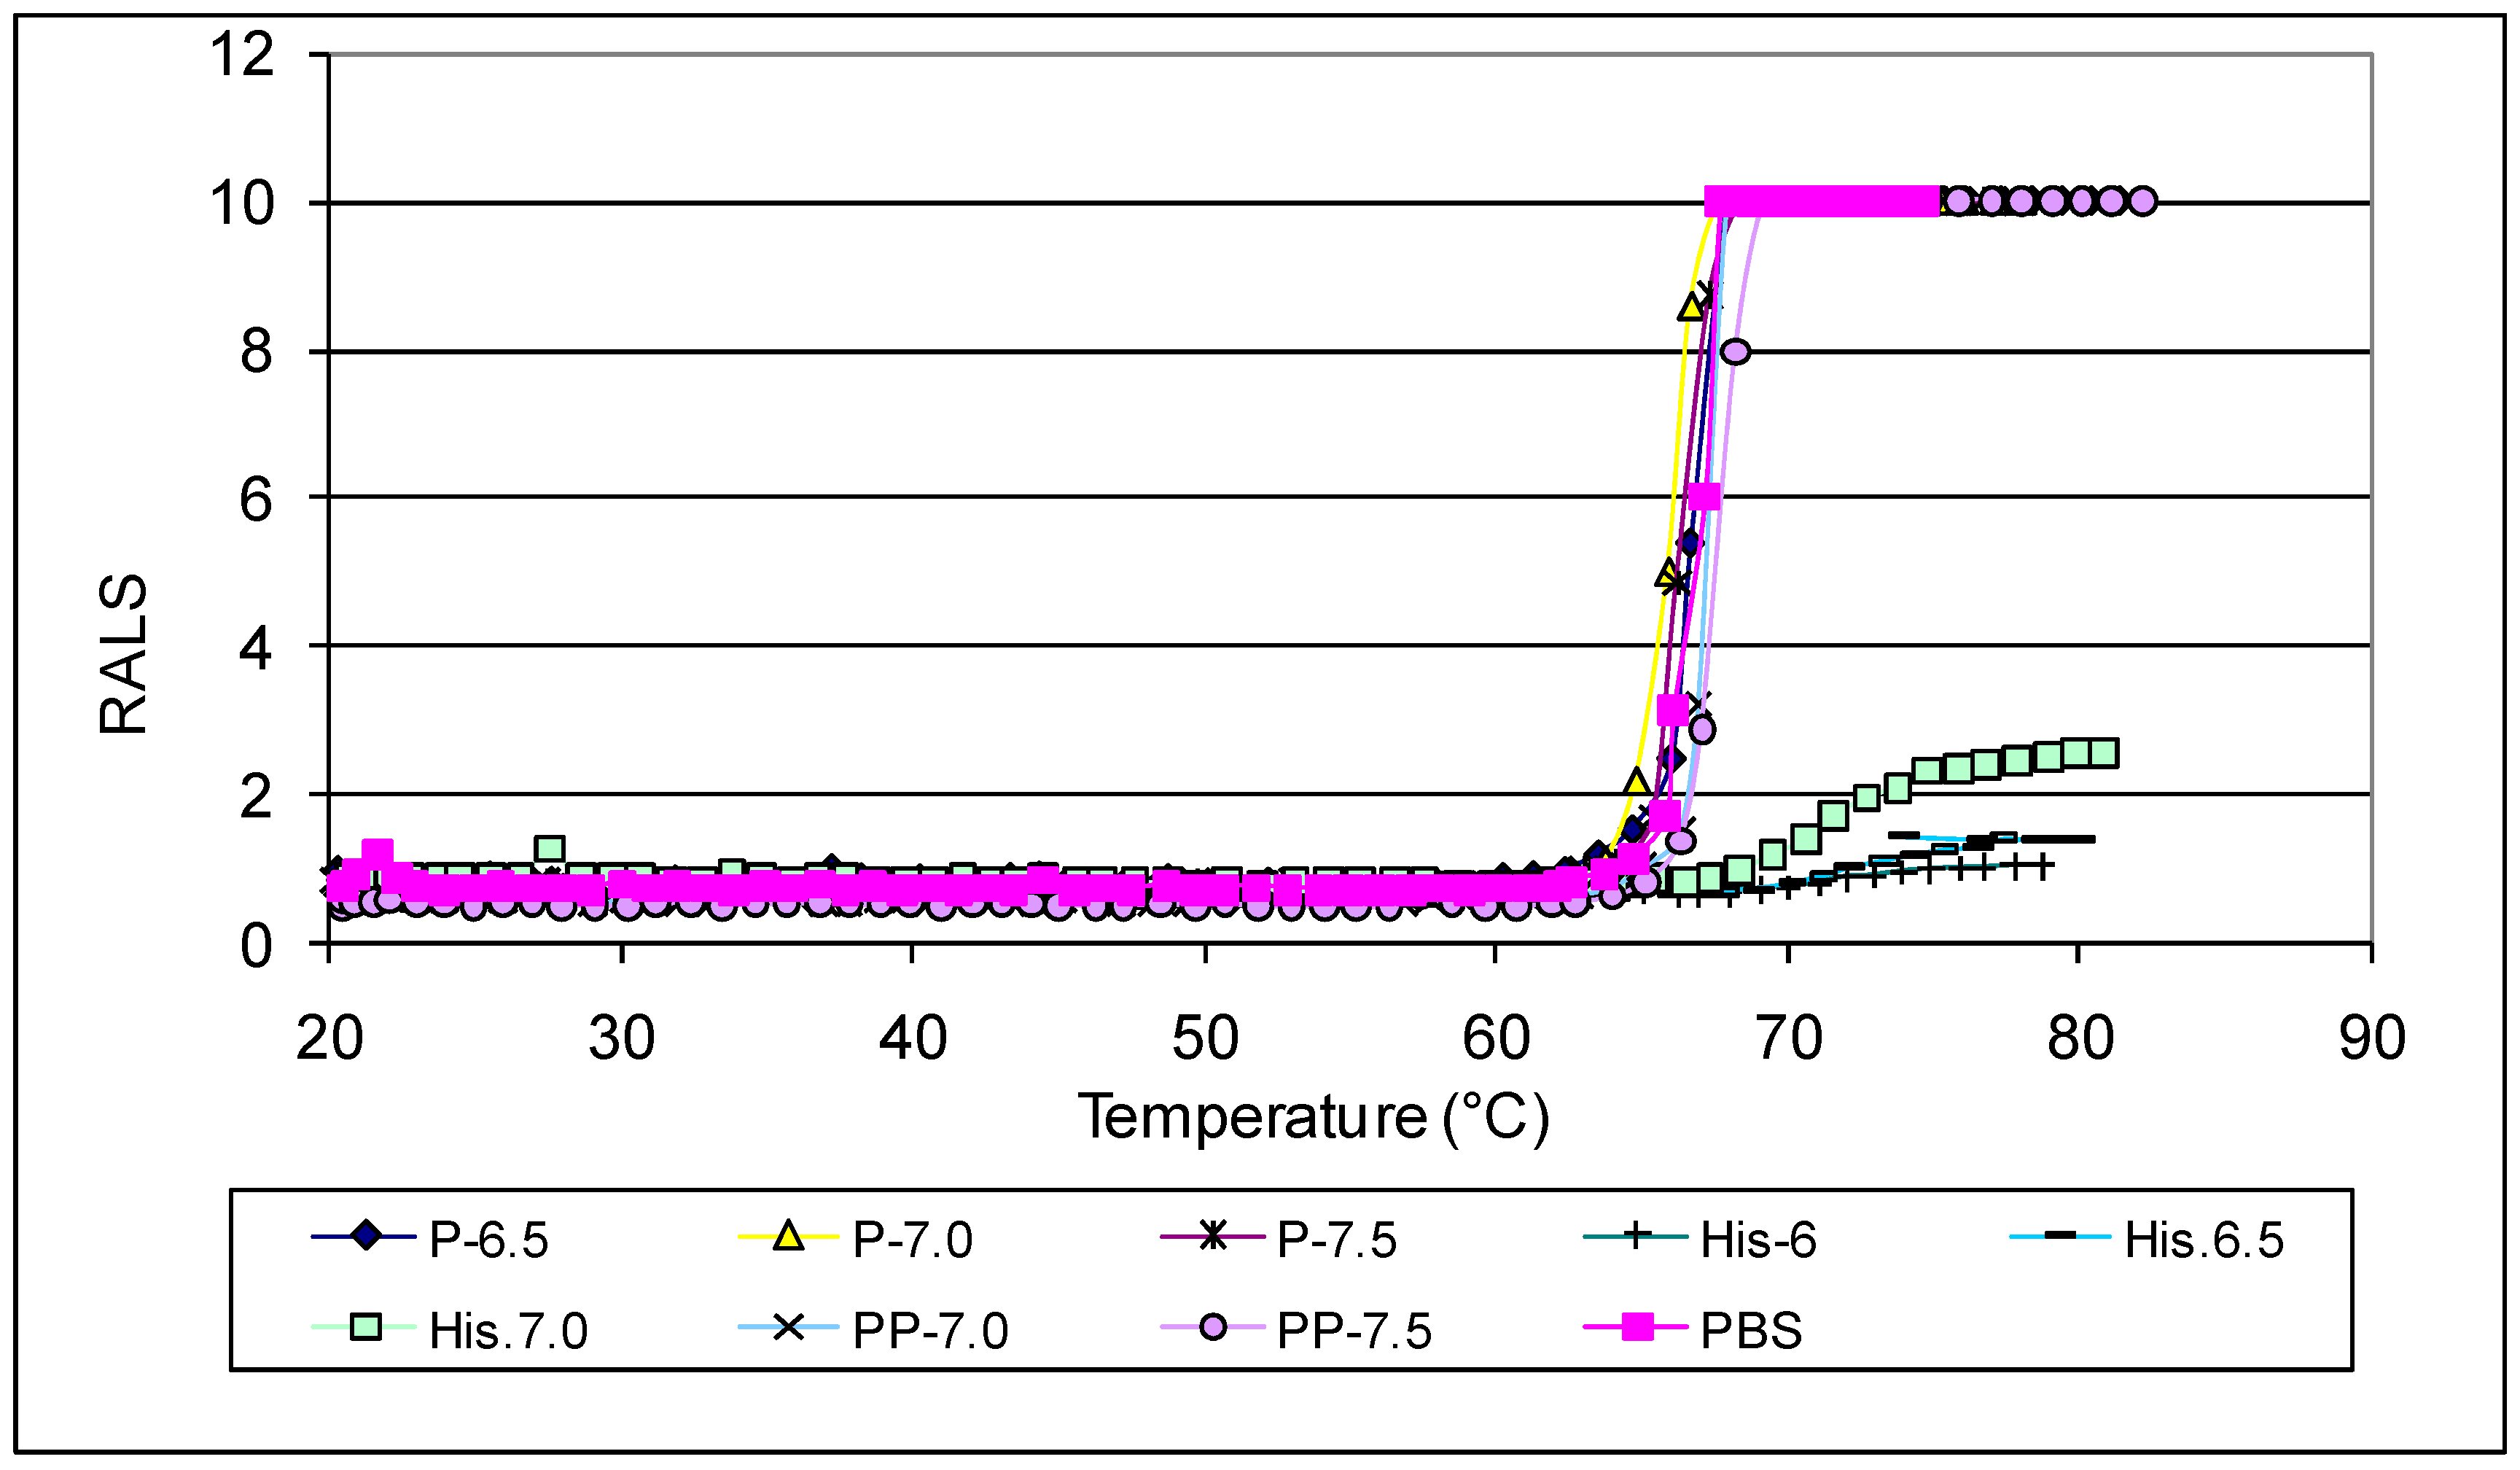
Antibodies like most proteins are very sensitive to pH and ions, hence it is critical to evaluate the optimal pH and ionic strength to maximize stability. We evaluated pH and ions followed by excipients to understand the strength and weekness of an antibody. RALS analysis supported with SE-HPLC data indicated that antibody 1 is stable at pH 6.0-7.5 based on initial pH studies with CBB buffer ranging from 3-9 (Data not shown). Suitable buffers at these pH ranges were further screened using 0.2mg/mL of antibody concentration. The data on initial RALS and temperature ramp clearly shows that phosphate or pyro phosphate buffer does not provide adequate thermal stability for antibody 1. In both buffers, the protein gets precipitated at 65°C, even though all formulations have the same initial RALS values at room temperature. Similar precipitation pattern is seen for the formulation containing Sodium citrate or sodium succinate buffer also (Data not shown). In Histidine buffer, the formulations are clear even after heating to 90°C. The data demonstrate that neither sodium nor phosphate buffer are suitable for this antibody (
Figure 1).
SE-HPLC analysis of samples heated at 50°C for 7 days also confirms that sodium or phosphate containing sample does not provide protection for this molecule (
Figure 2), though there is no difference in HPLC profile at T
0. Though most widely used techniques for analyzing protein aggregation is SE-HPLC, large immunogenic protein aggregates are filtered before separation [
11] causing problem for accurate aggregation measurement. In this case RALS data provide additional information such as temperature transition and relative aggregation than other analytical data such as HPLC and electrophoresis at T
0. Though DSC technique also can provide temperature transition of formulation [
23] at T
0, it does not provide initial status of aggregation. In order to save time and API, further screening of poorly performed excipients such as phosphate and pyrophosphate might have been eliminated.
Ionic strength:
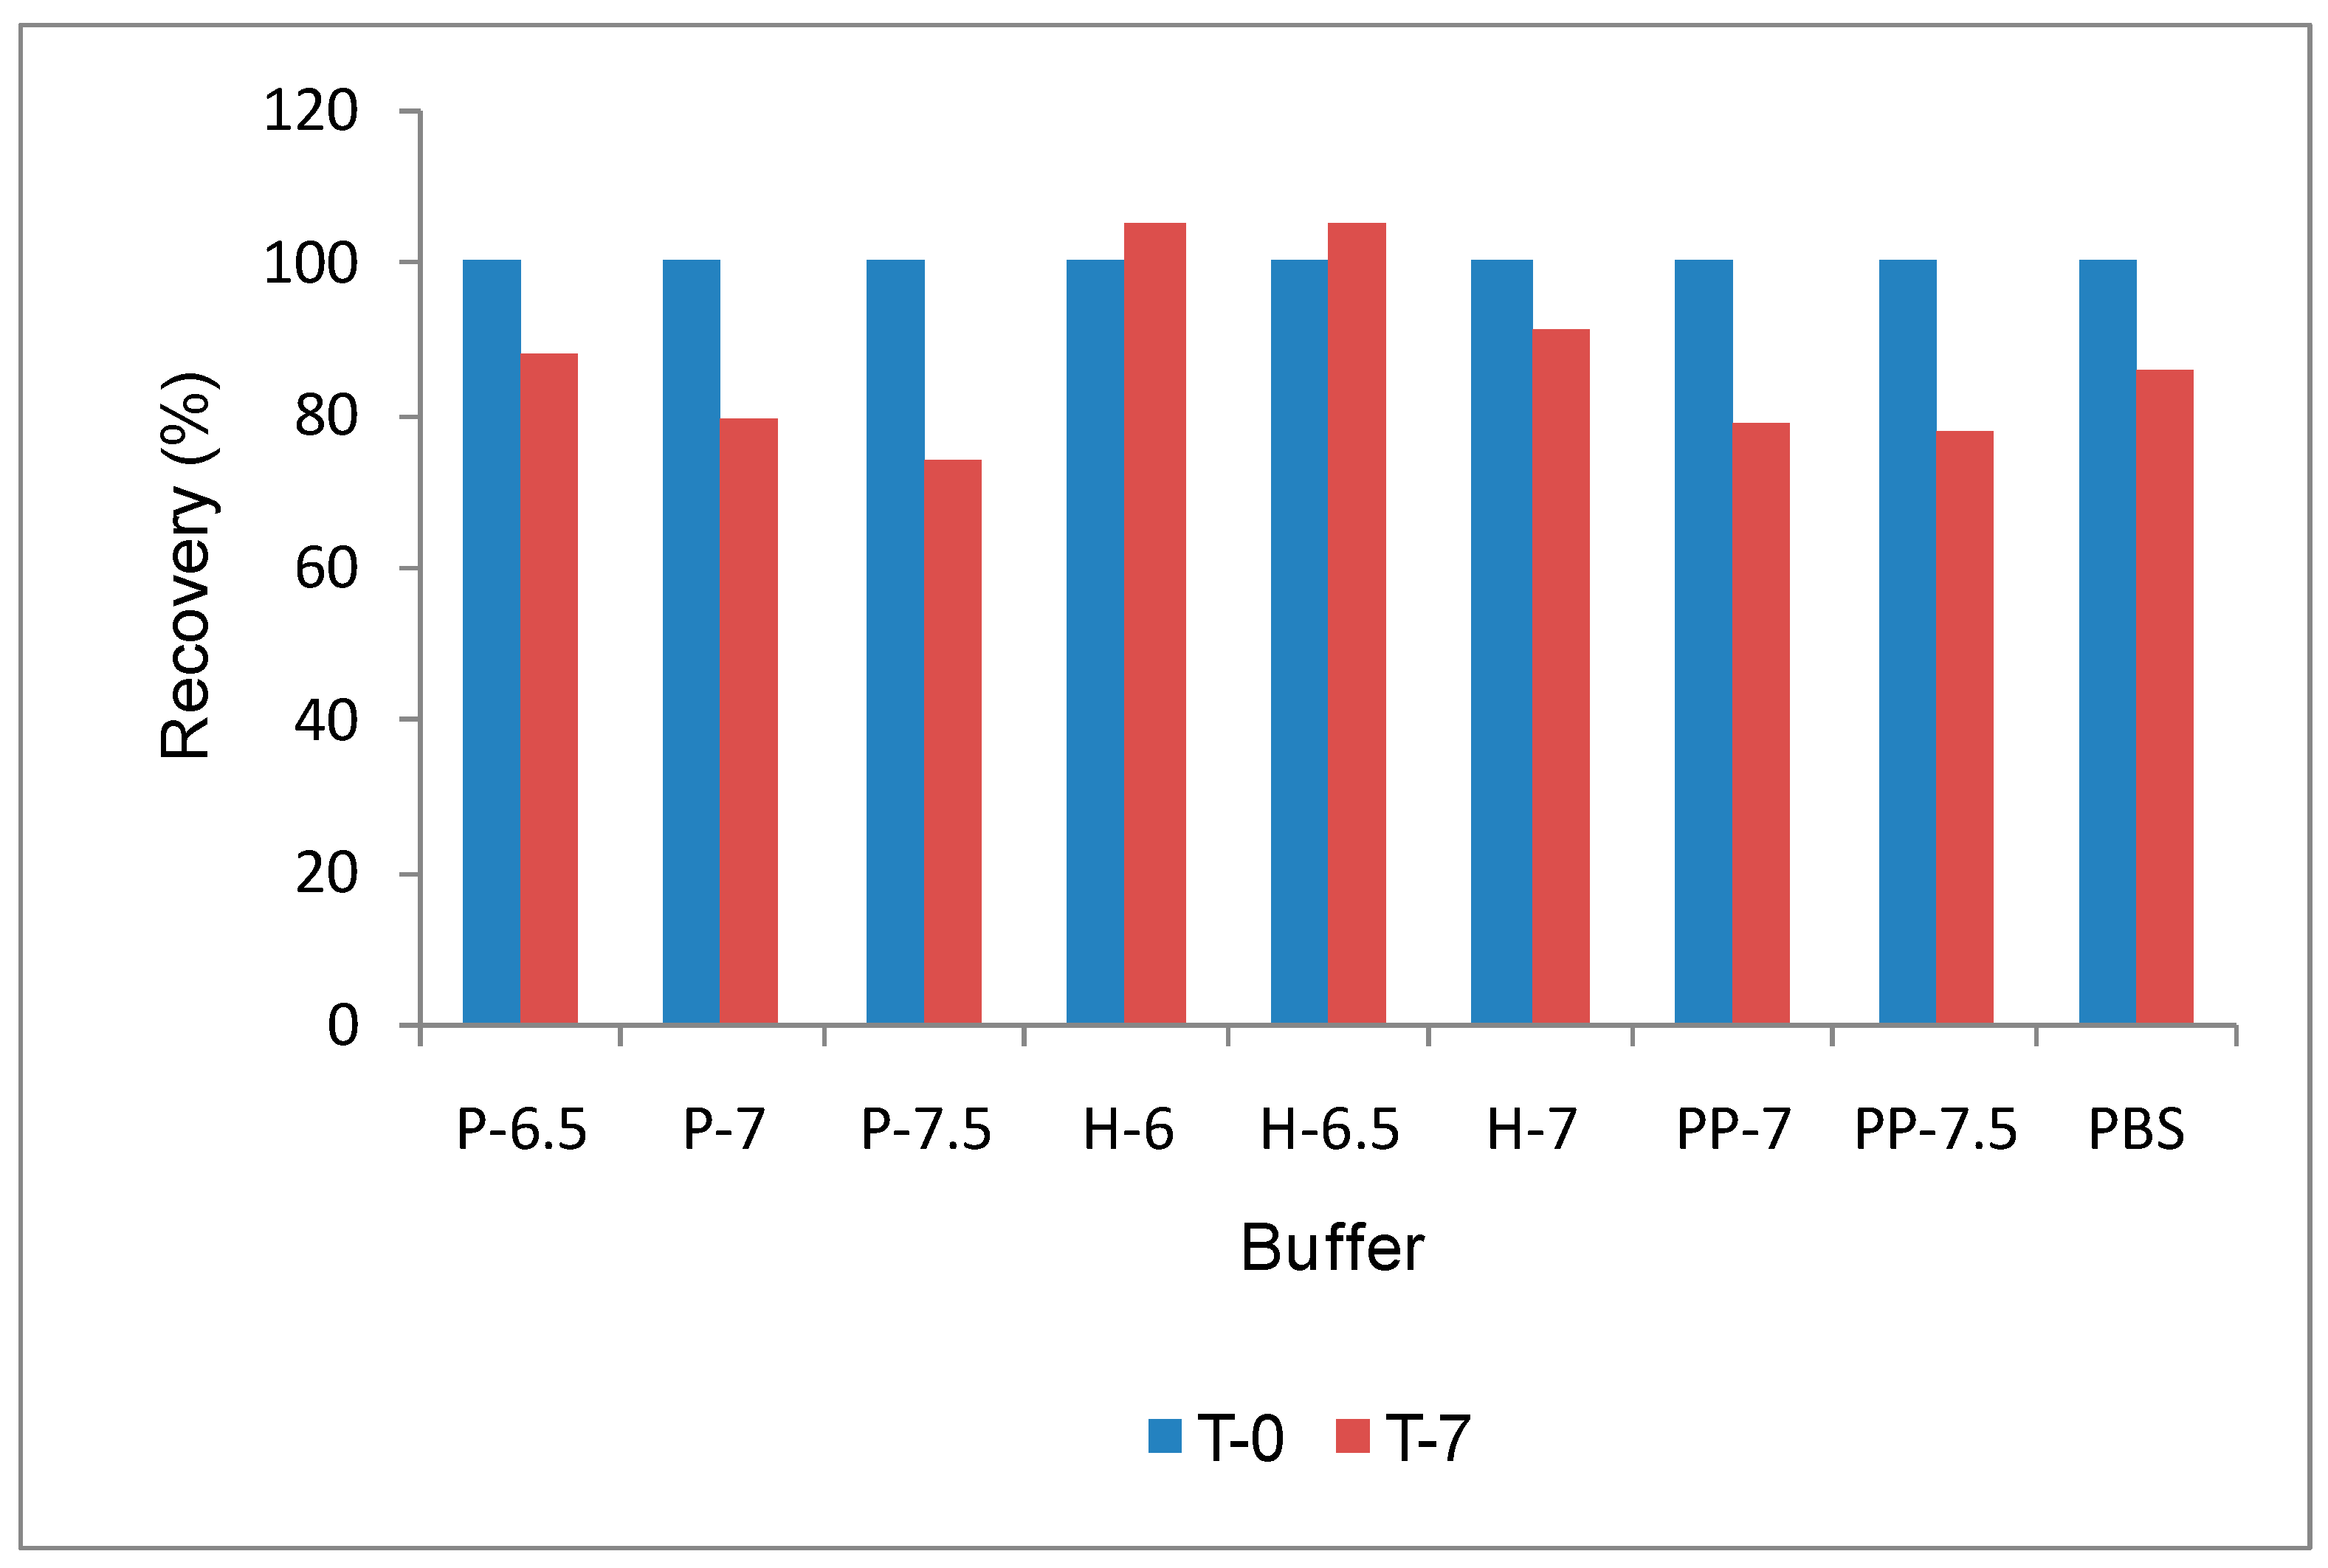
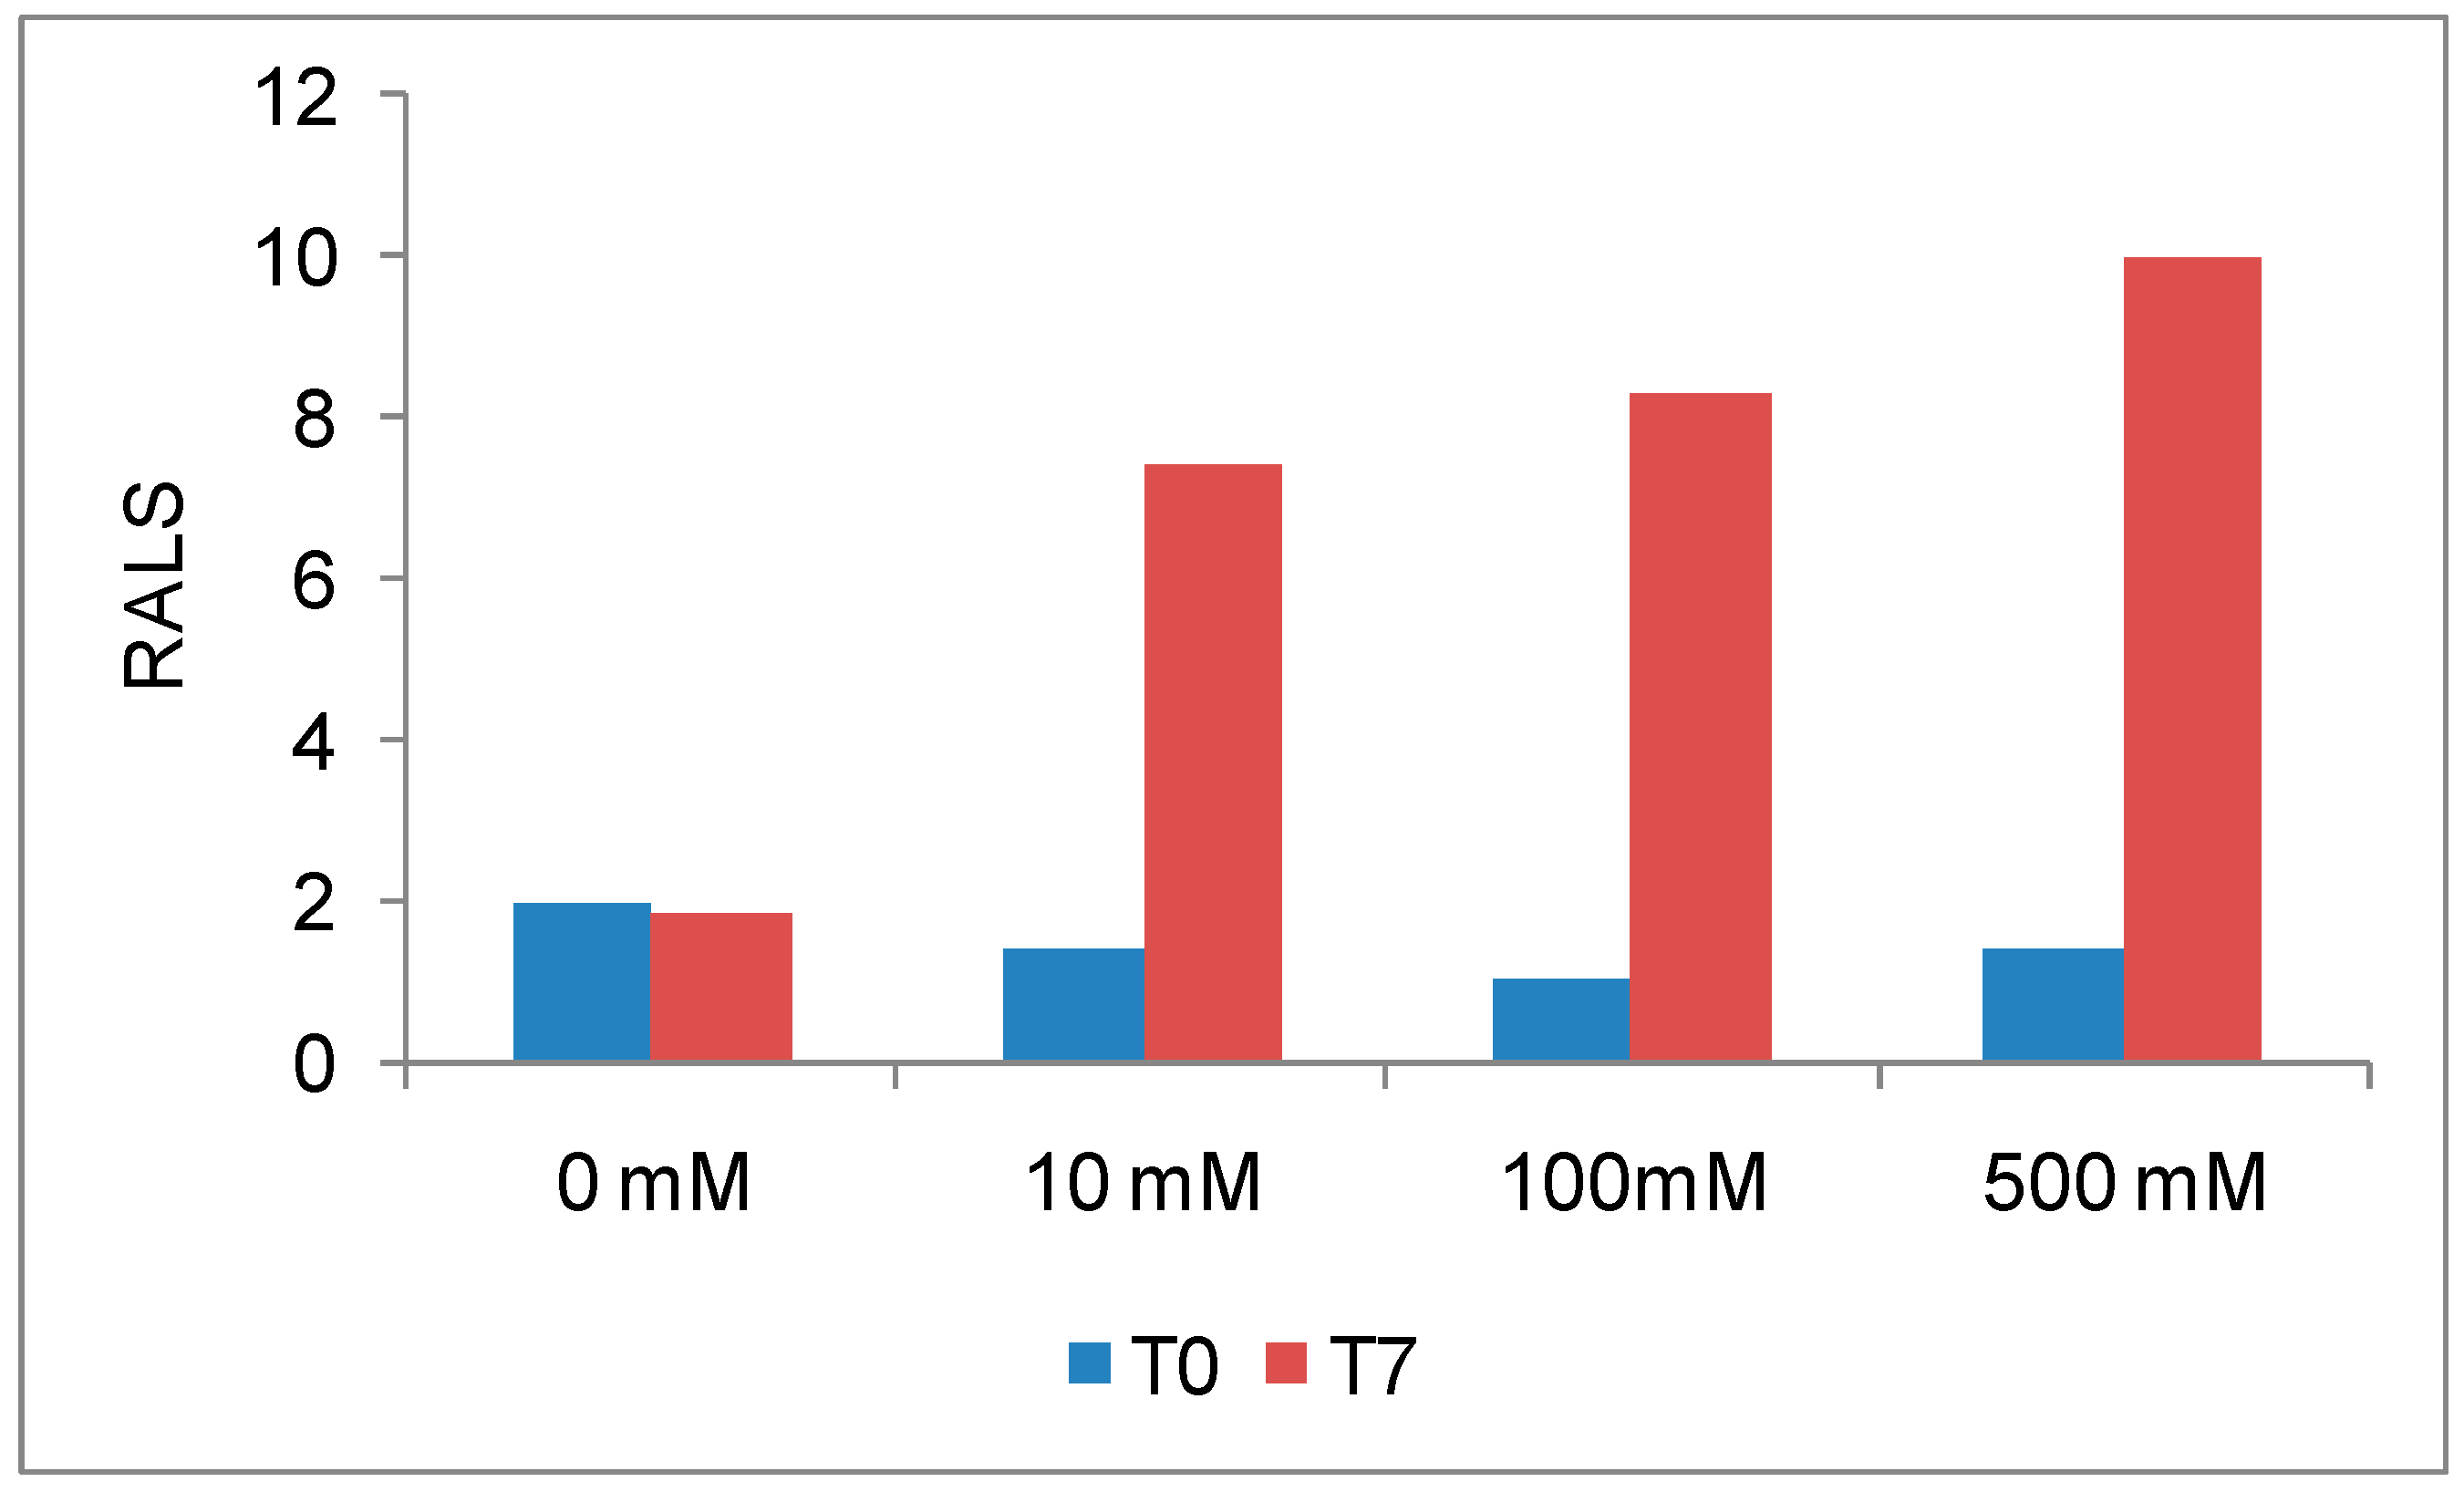
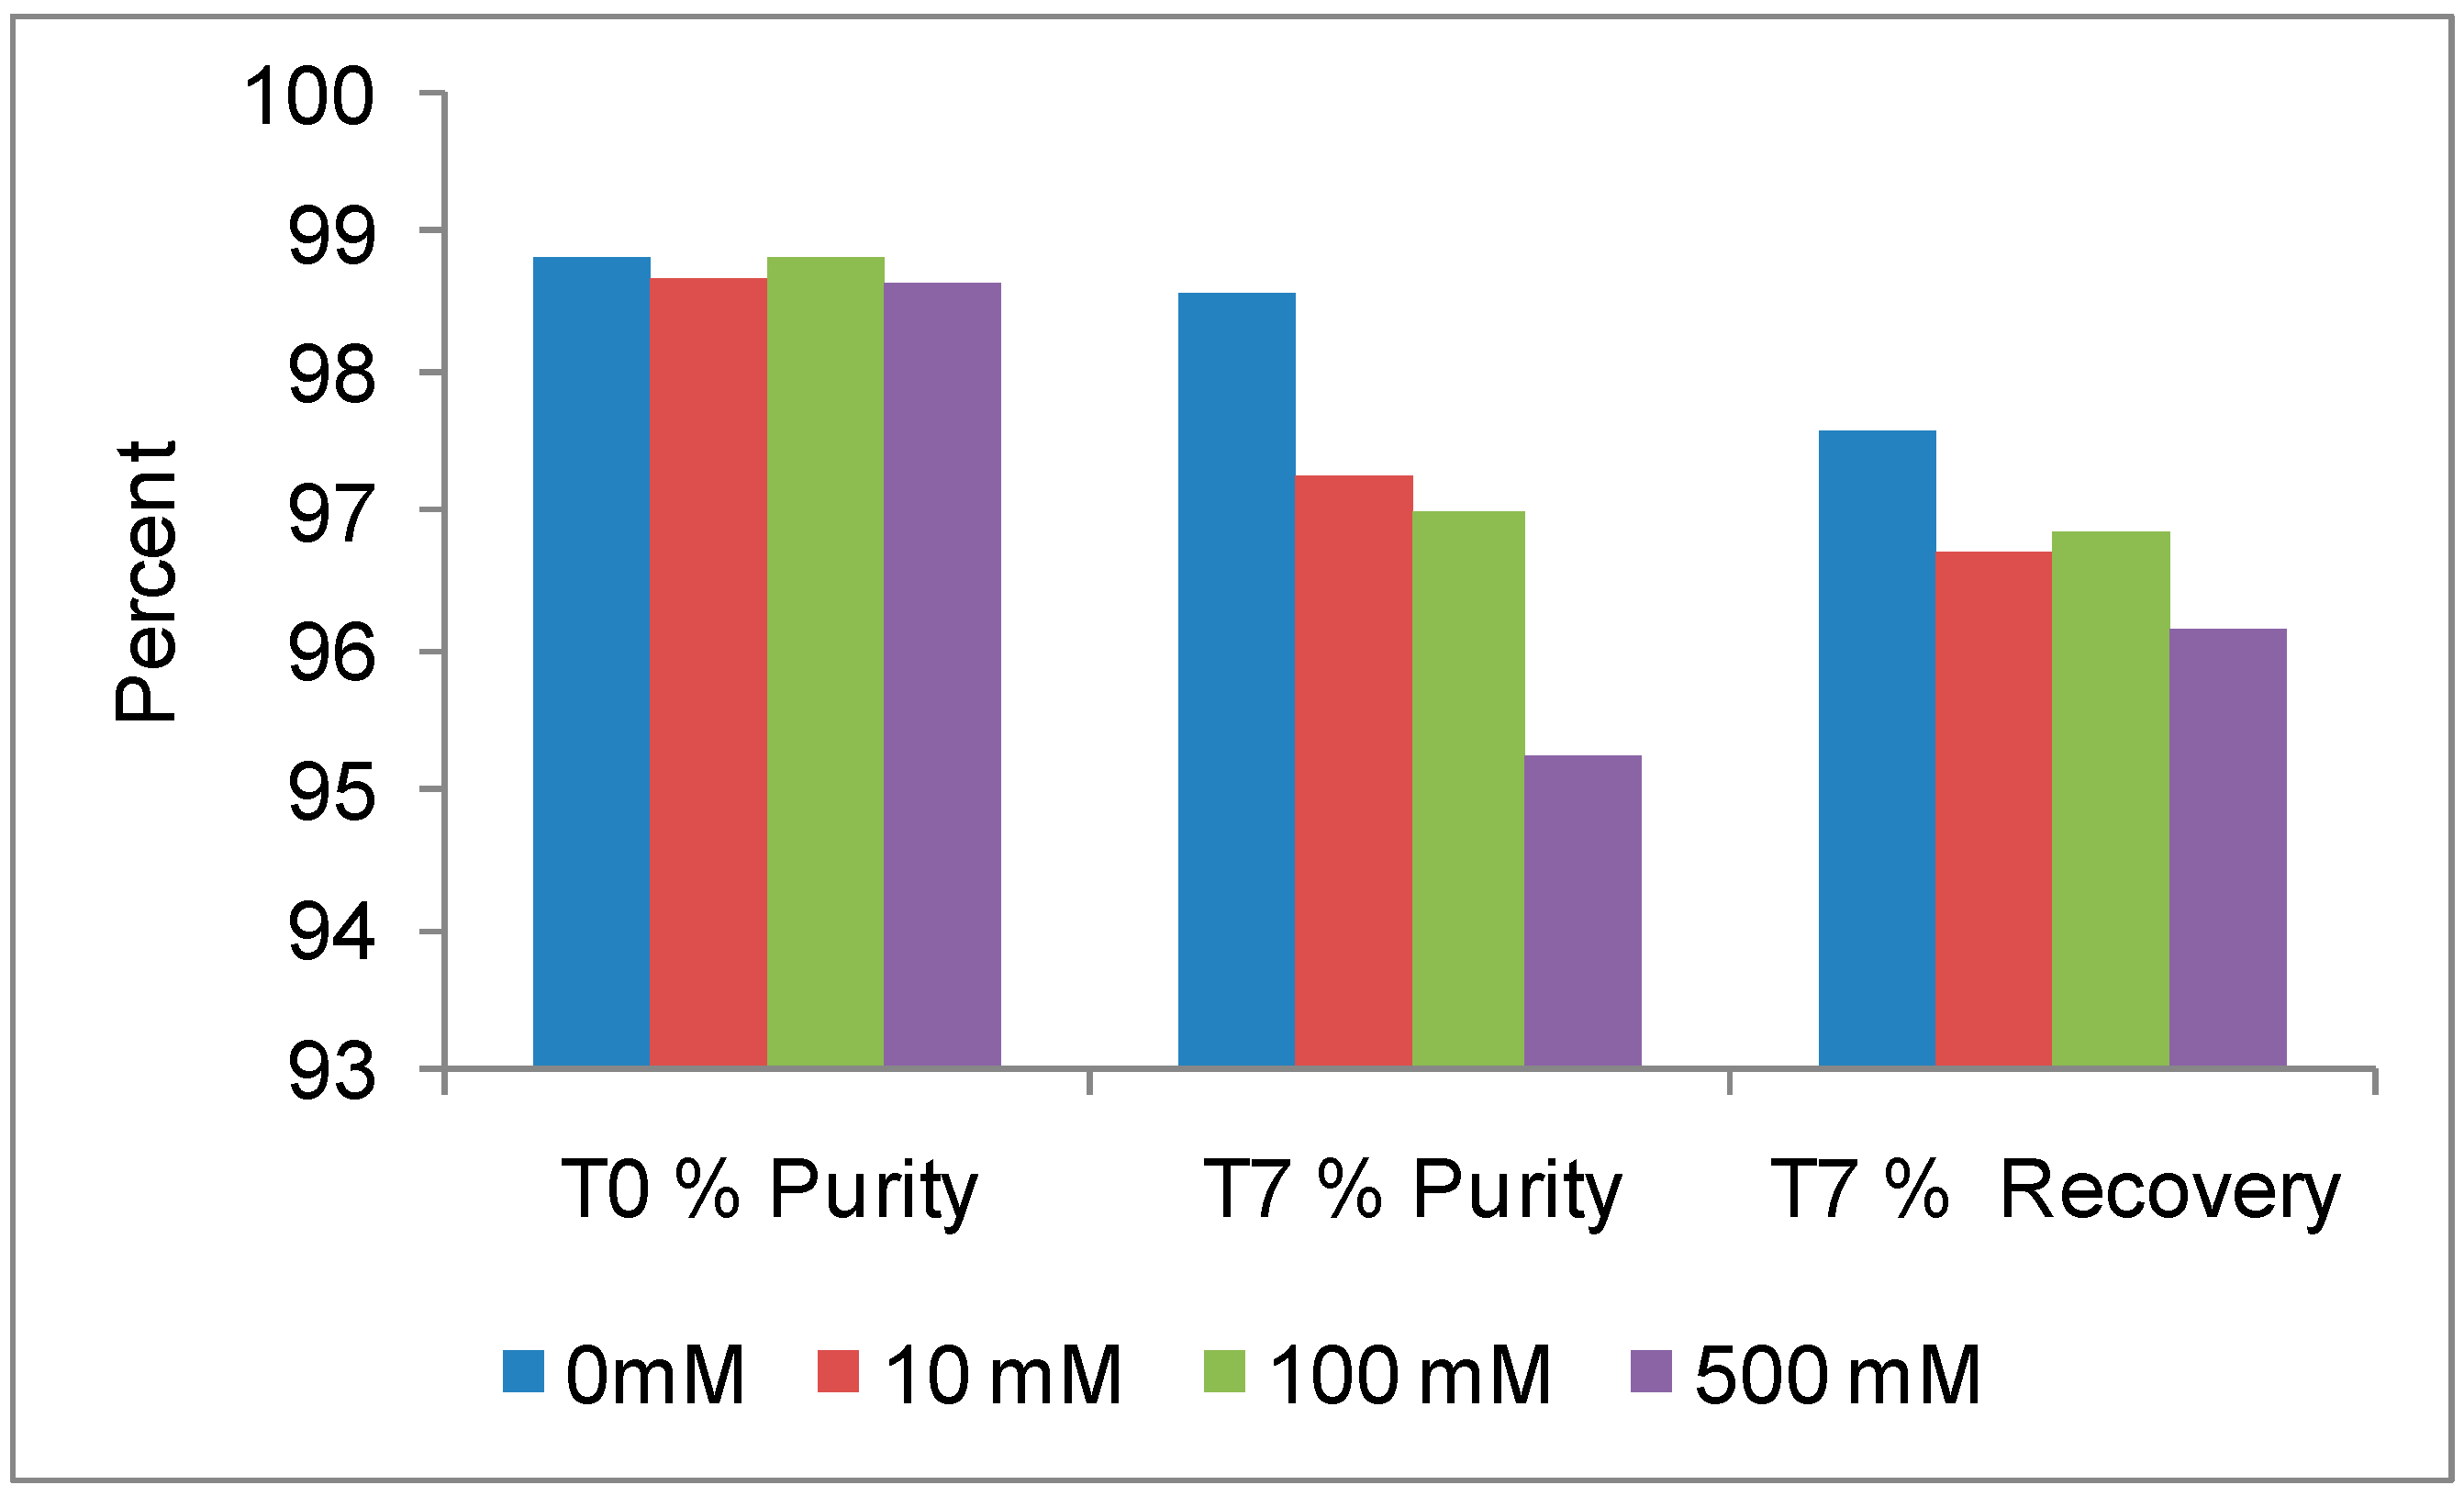
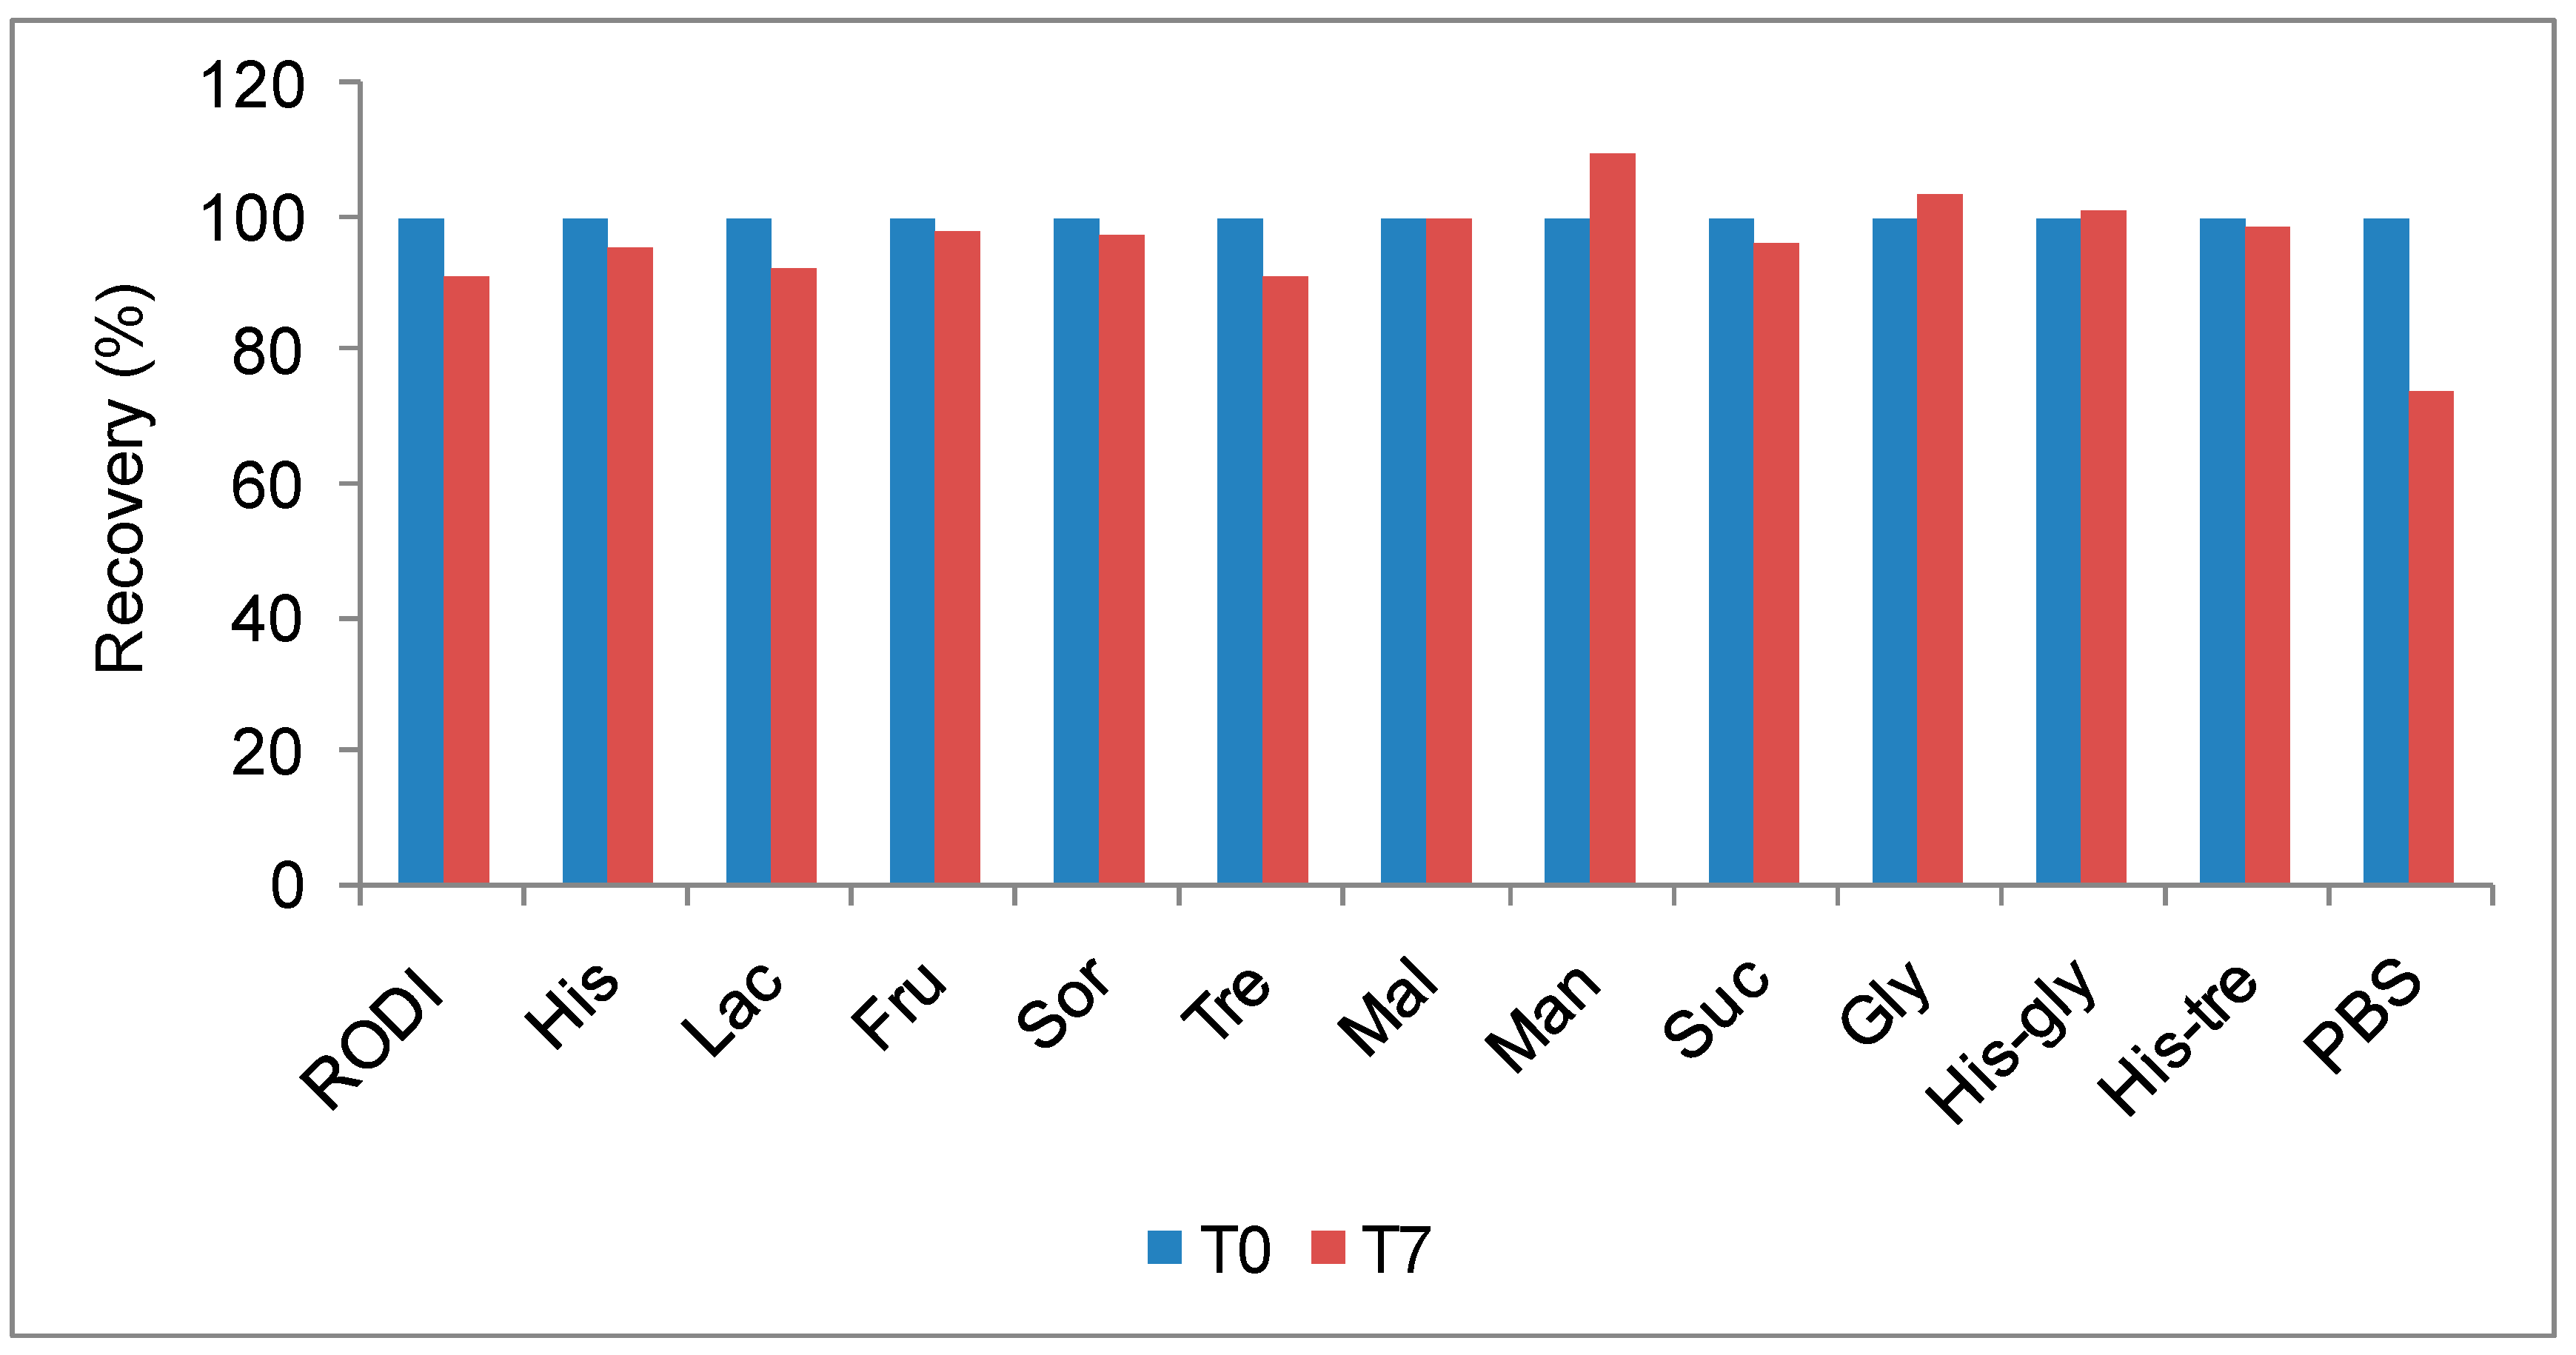
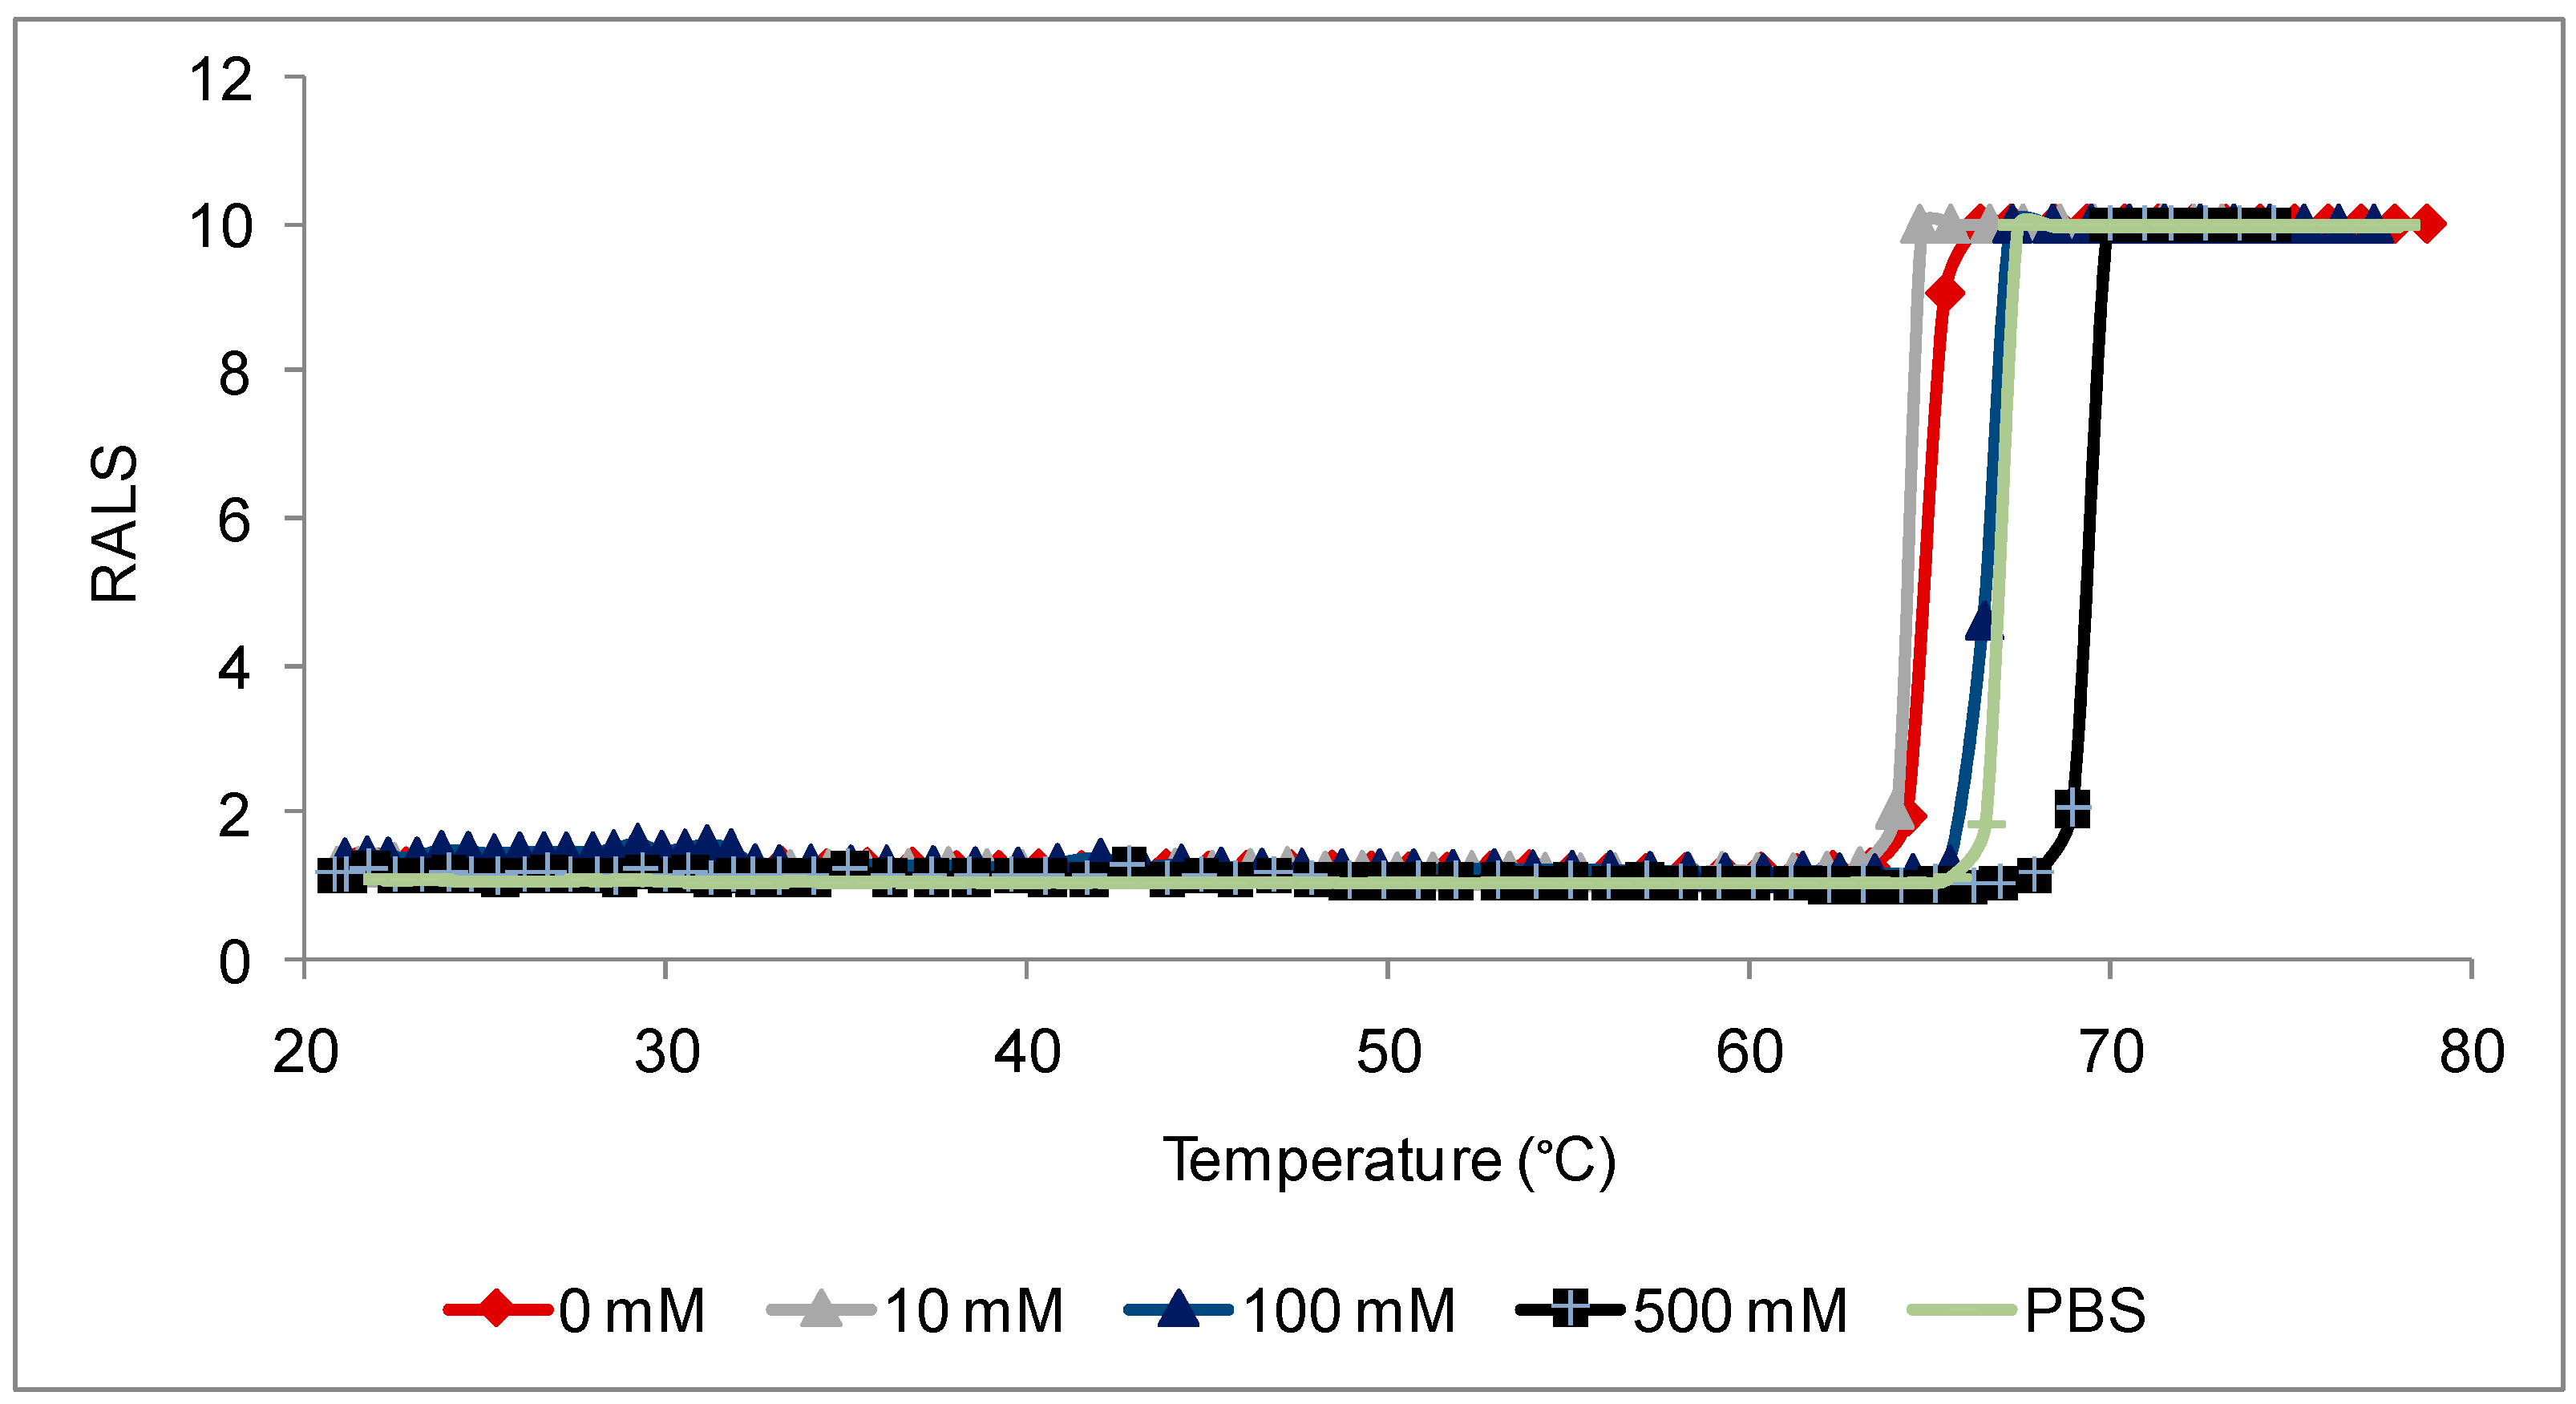
Antibodies are, like most proteins, very sensitive to ions also and it is essential to evaluate the optimal ions necessary to maximize stability. The initial RALS data demonstrates that this antibody at 0.2mg/mL concentration is destabilized by ions, which is confirmed by SE-HPLC also (
Figure 2A-2B). RALS data shows that there is more aggregation of proteins, even in 10 mM sodium chloride formulation as evidenced by increase in RALS values after incubating samples at 50°C for 7 days (
Figure 3), which is consistent with the SE-HPLC data showing less recovery and less purity after incubating the formulations containing sodium chloride at 50°C for 7 days (
Figure 4).
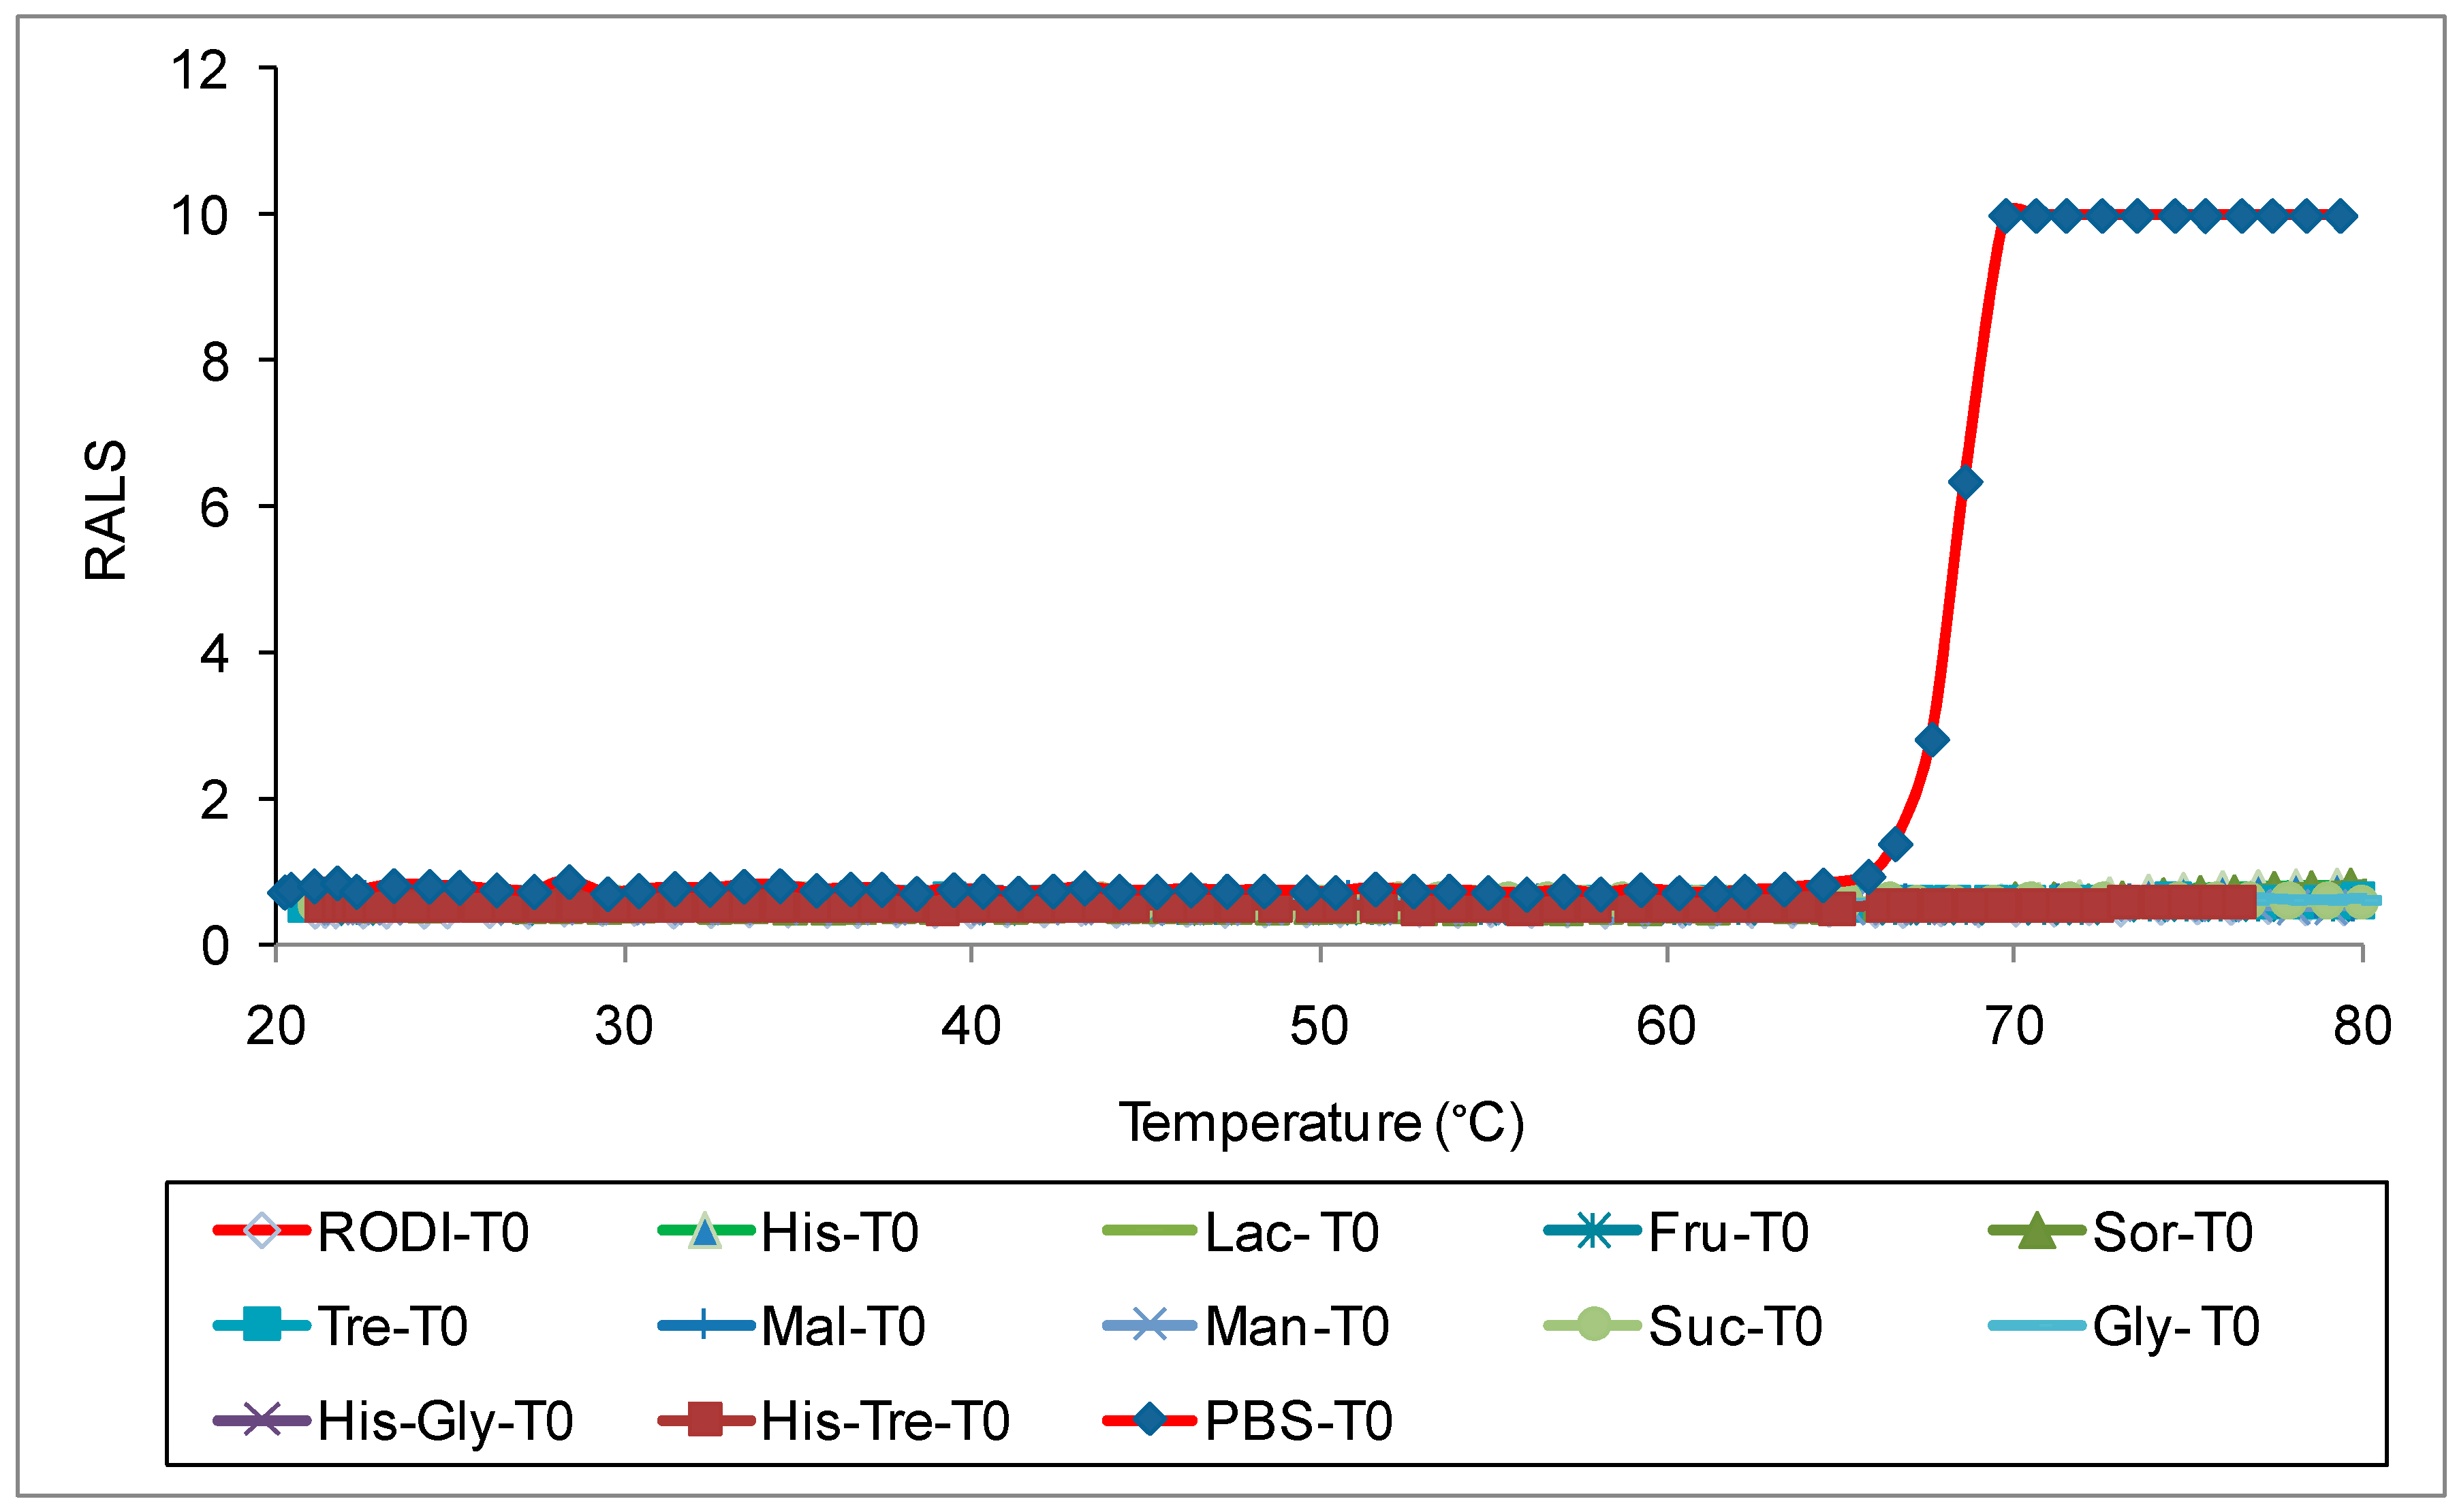
RALS has been found to be a better screening tool to optimize ionic concentration of antibodies without an extensive analytical work. If initial data (T
0) does not provide a firm conclusion, RALS data without temperature ramp may be used for temperature stability (
Figure 3). Initial RALS reading takes only few minutes, as there is no necessity for sample processing. In contrast other analytical technique such as HPLC and electrophoresis takes more time for sample processing and method running. Sample processing also alters the property of molecule.
Excipient Screening:
RALS technique is also useful for screening stabilizers such as amino acids and carbohydrates. RALS data indicates that the antibody1 at 5 mg/mL concentration is stabilized by neutral amino acids or sugars in water (
Figure 5). Consistent with the (T
0) RALS data, SE-HPLC data on formulations incubated at 50°C for 7 days supports the conclusion that the PBS does not provide stability to this molecule (
Figure 6). The antibody is stable in presence or absence of Histidine. This antibody has to be labeled with radio active Iodine, before infusion to patient. Although the histidine-based formulations are stable, a compound with imidazole ring may be a concern during radio labeling by competing the aromatic ring of tyrosyl group of antibody1. Based on RALS data and other analytical method, the final formulation of this antibody at 30 mg/mL concentration is 250 mM sucrose and 50 mM Glycine pH 5.8 (data not shown), which was suitable for radio active iodination before infusion to patient. The overall conclusion of the formulation of this antibody is that it can be formulated in buffers without ions and organic sugar without metal salt as a tonicity agent. Inorganic buffer such as aminoacid (Histidine, Glycine etc) may be used as buffering agent.
Other antibody formulations
RALS technique is useful for screening for other antibodies also as exampled by screening of ions on other two antibodies. Antibody 2 requires more ions to get it stabilized (
Figure 7) unlike antibody 1. As the ionic concentration increases there is increase in thermal stability as evidenced by Tagg (precipitation) temperature. This data is supported by analytical HPLC data also (
Figure 8). At T
0, there is no difference in HPLC profile. After incubating the formulations at 50°C for 7 days, more polymer peaks are visible for the formulation containing less sodium chloride.
In contrast to antibody 2, the antibodies 1 and 3 are destabilized in presence of ions). The thermal stability data (T
0) indicates that the formulation does not precipiate, when the antibody3 is in water. The precipitation temperature decreases, as the concentration of sodium choloride is increased (
Figure 9). The data suggest that optimum ionic concentration for antibodies stability varies.
Protein other than antibody
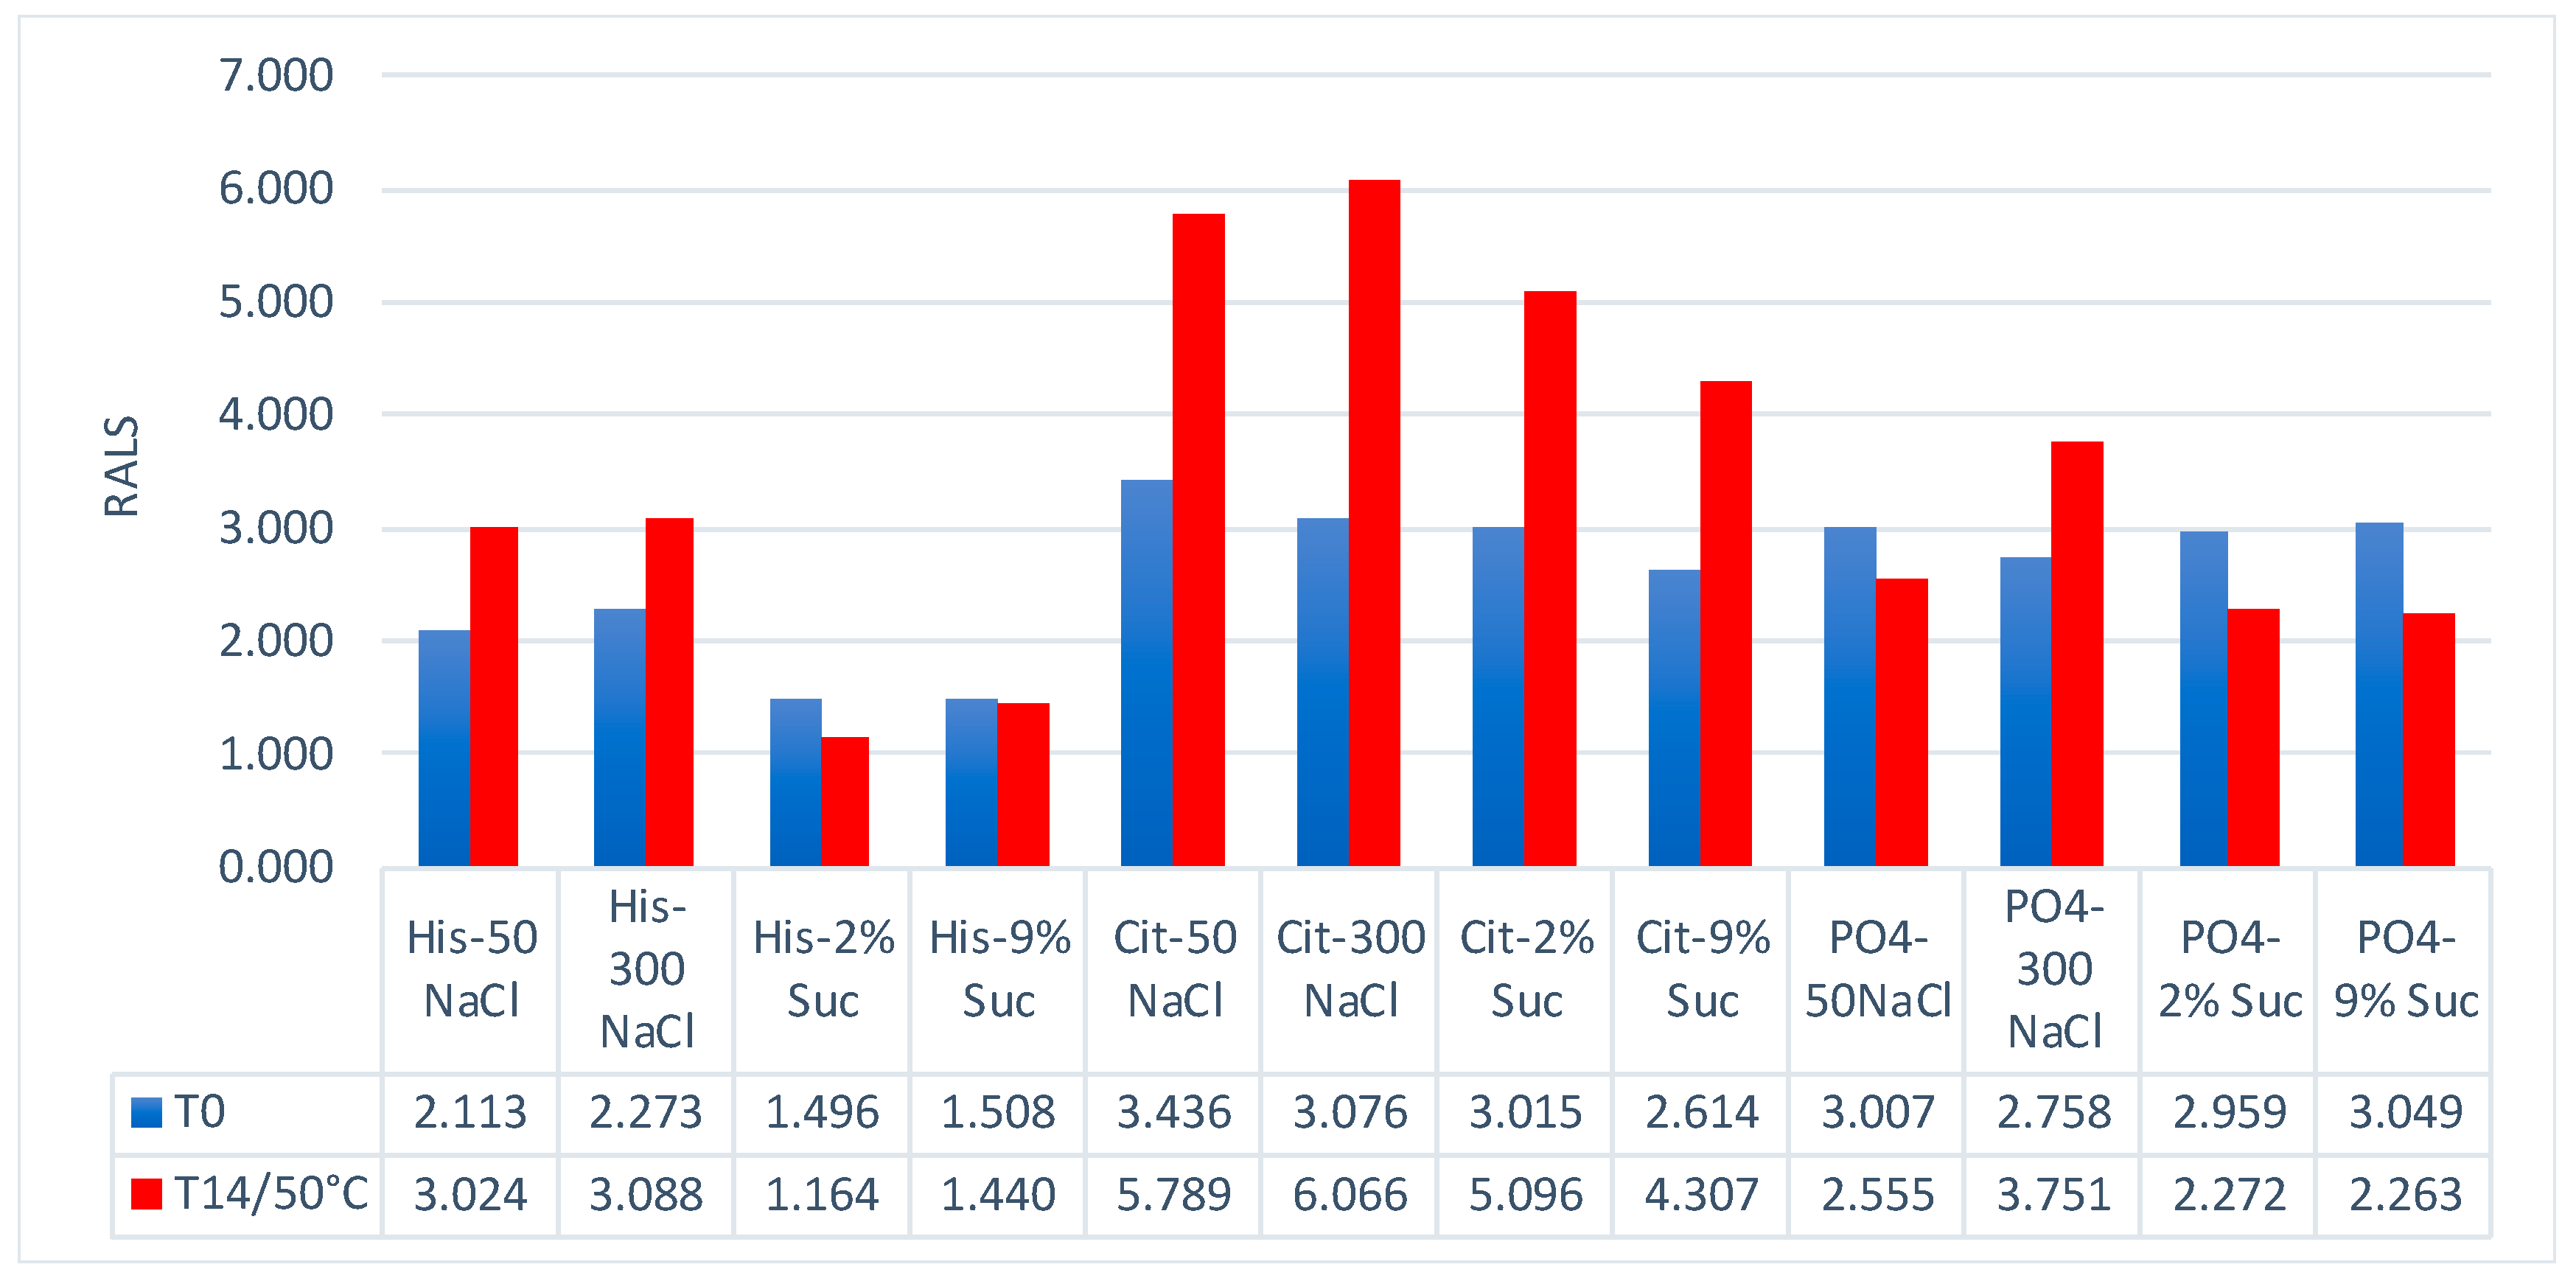
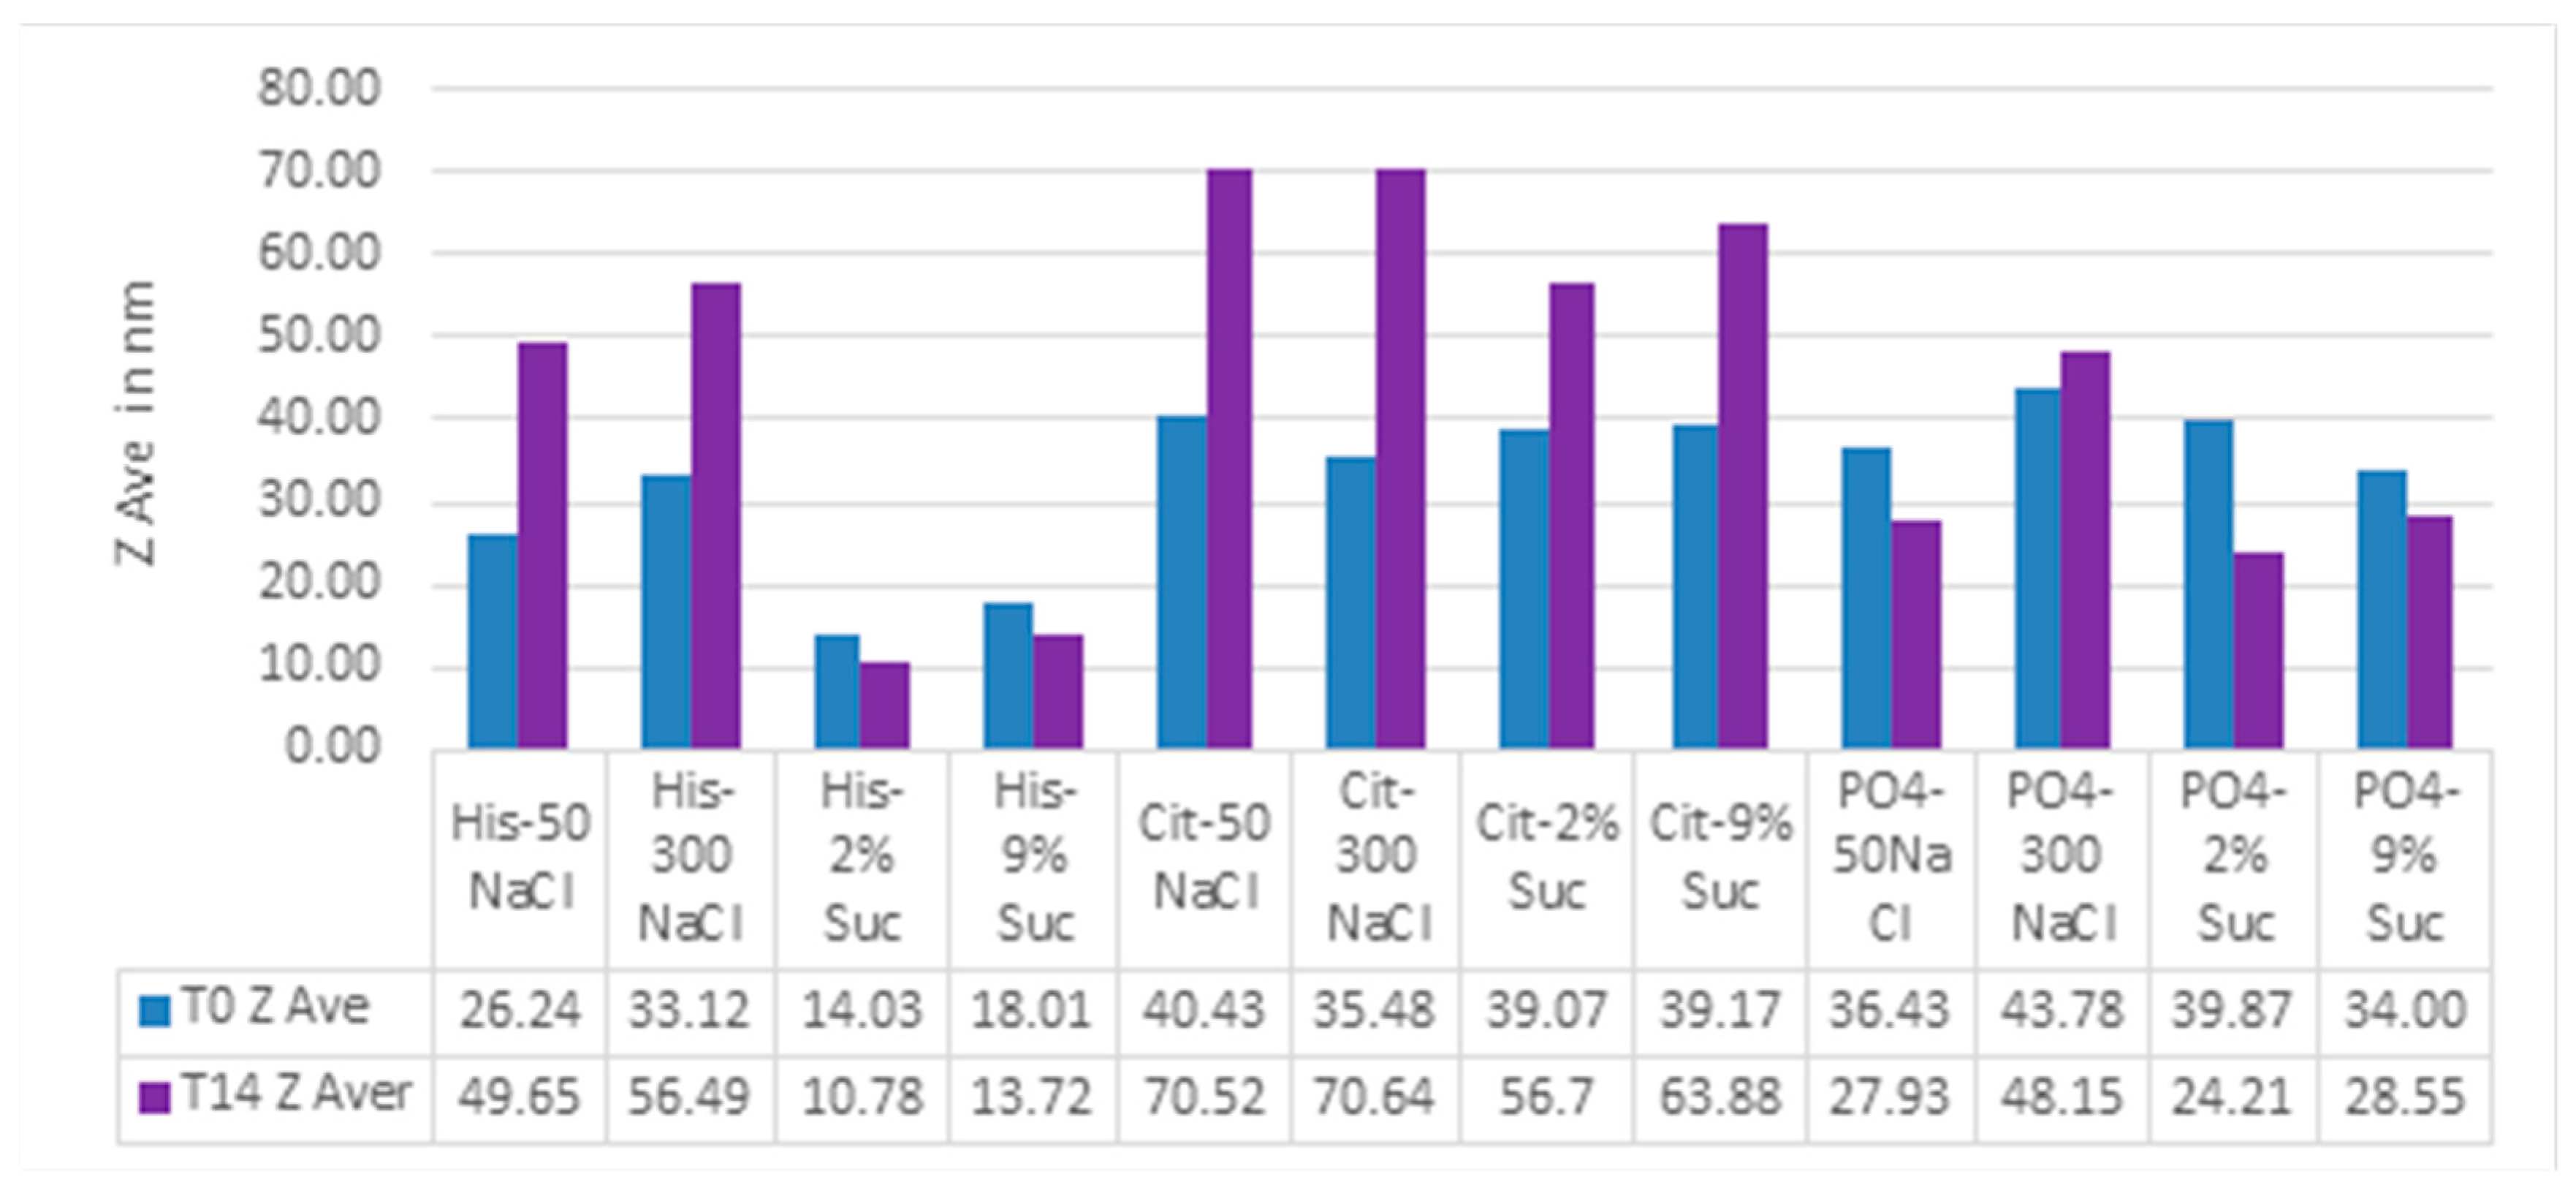
Besides protein formulation, RALS technique may also be used to screen other protein formulation. A 60 kDa protein at 1 mg/mL concentration was evaluated for pH , ion and excipient screening using RALS technique. The data indicated that this protein is more stable in Histidine buffer in presence of sucrose than sodium chloride, as evidenced by less RALS at these formulations (
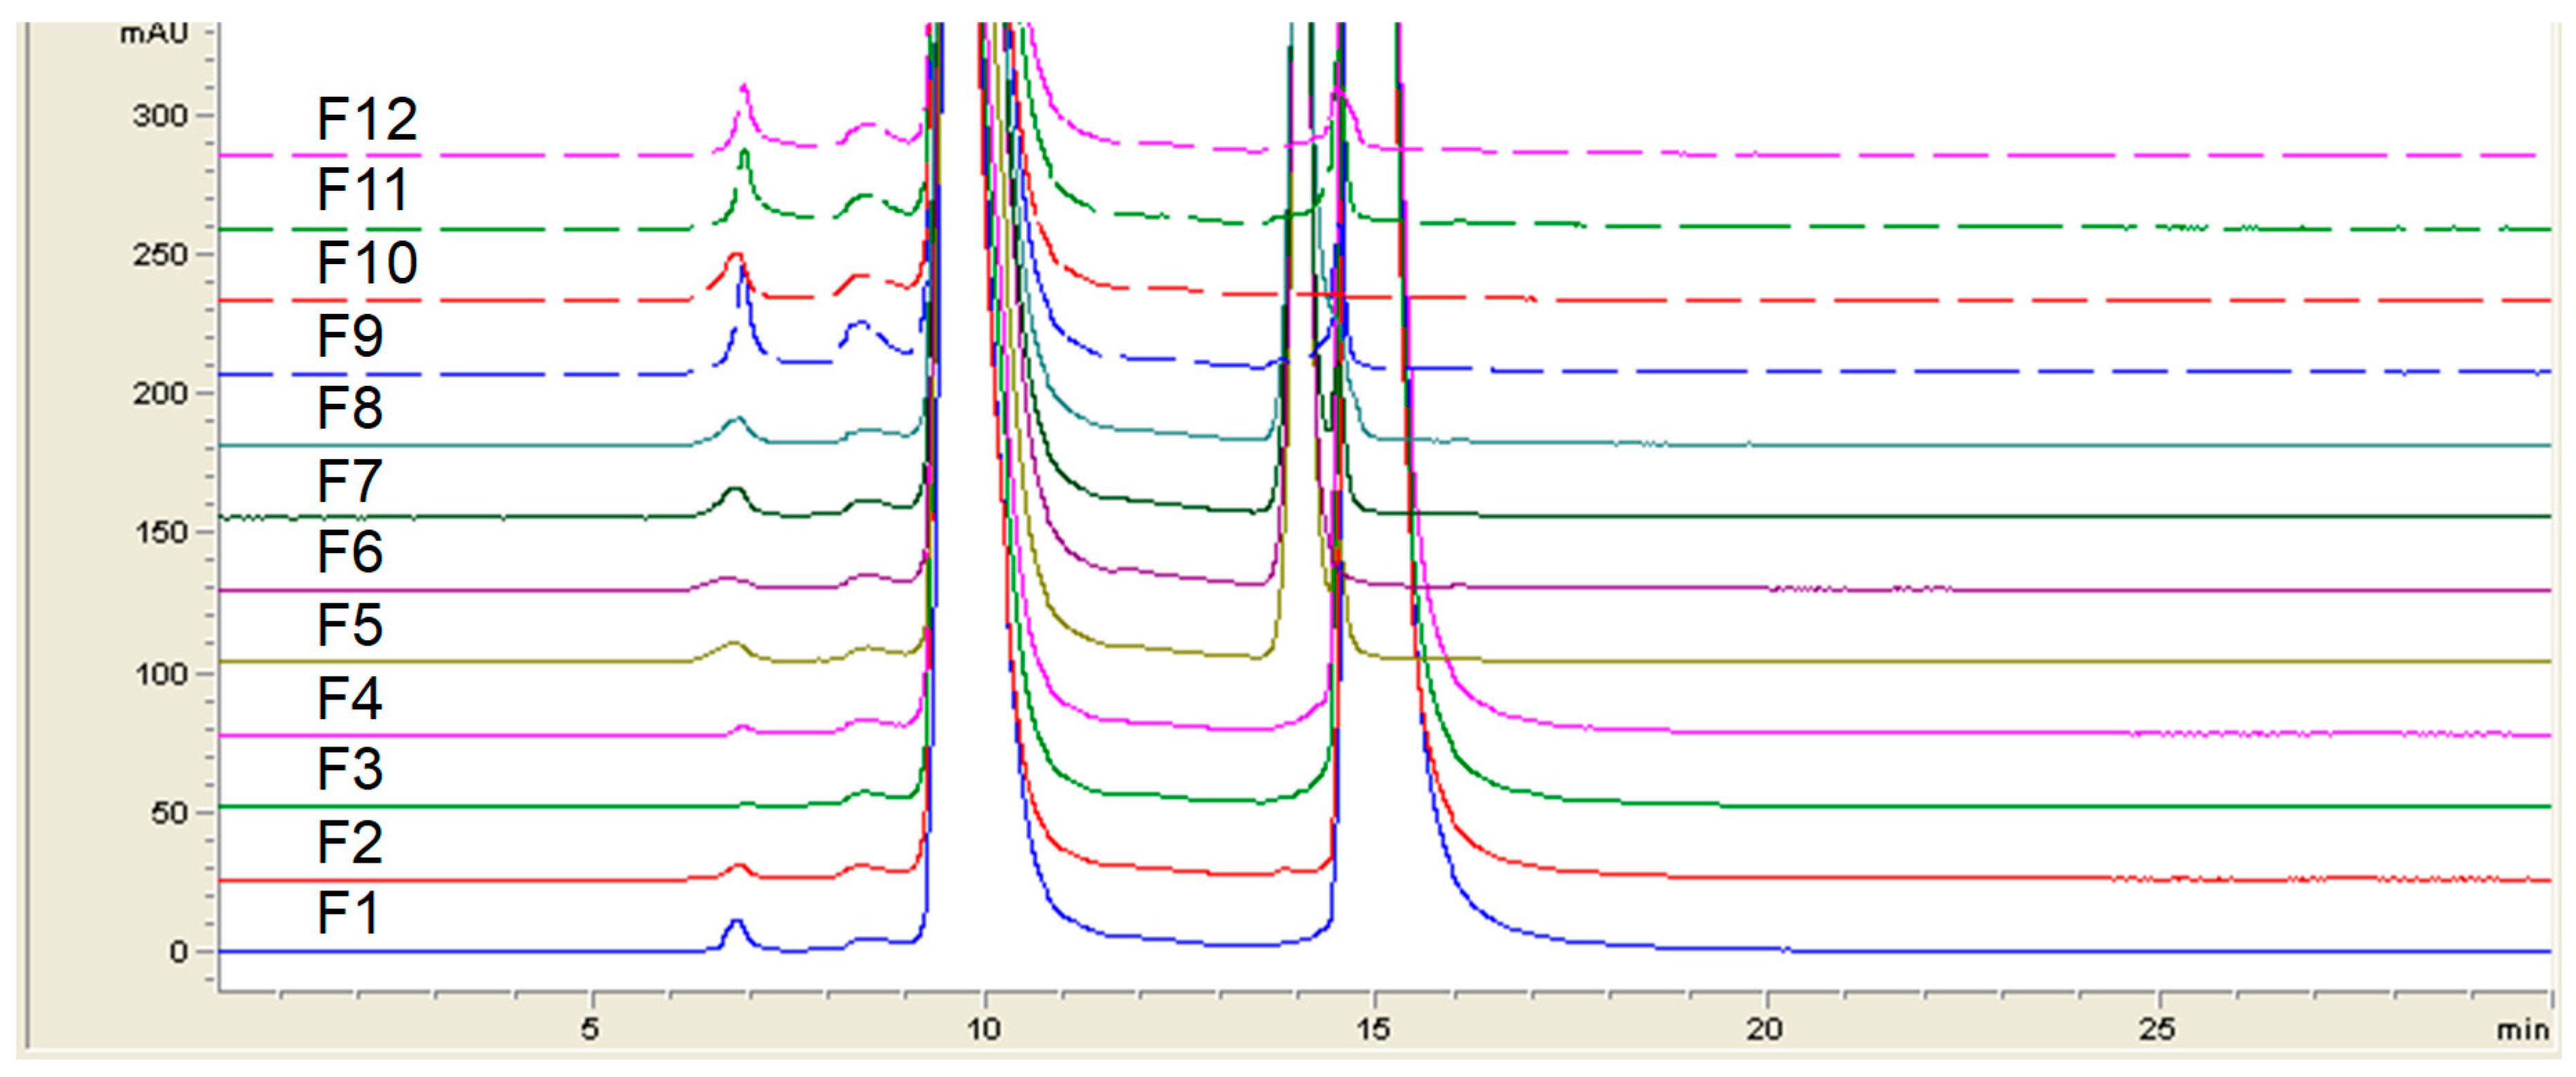
Figure 10). The SEC-HPLC data analysis also confirms that this protein is more stable in Histidine buffer in presence of Sucrose (
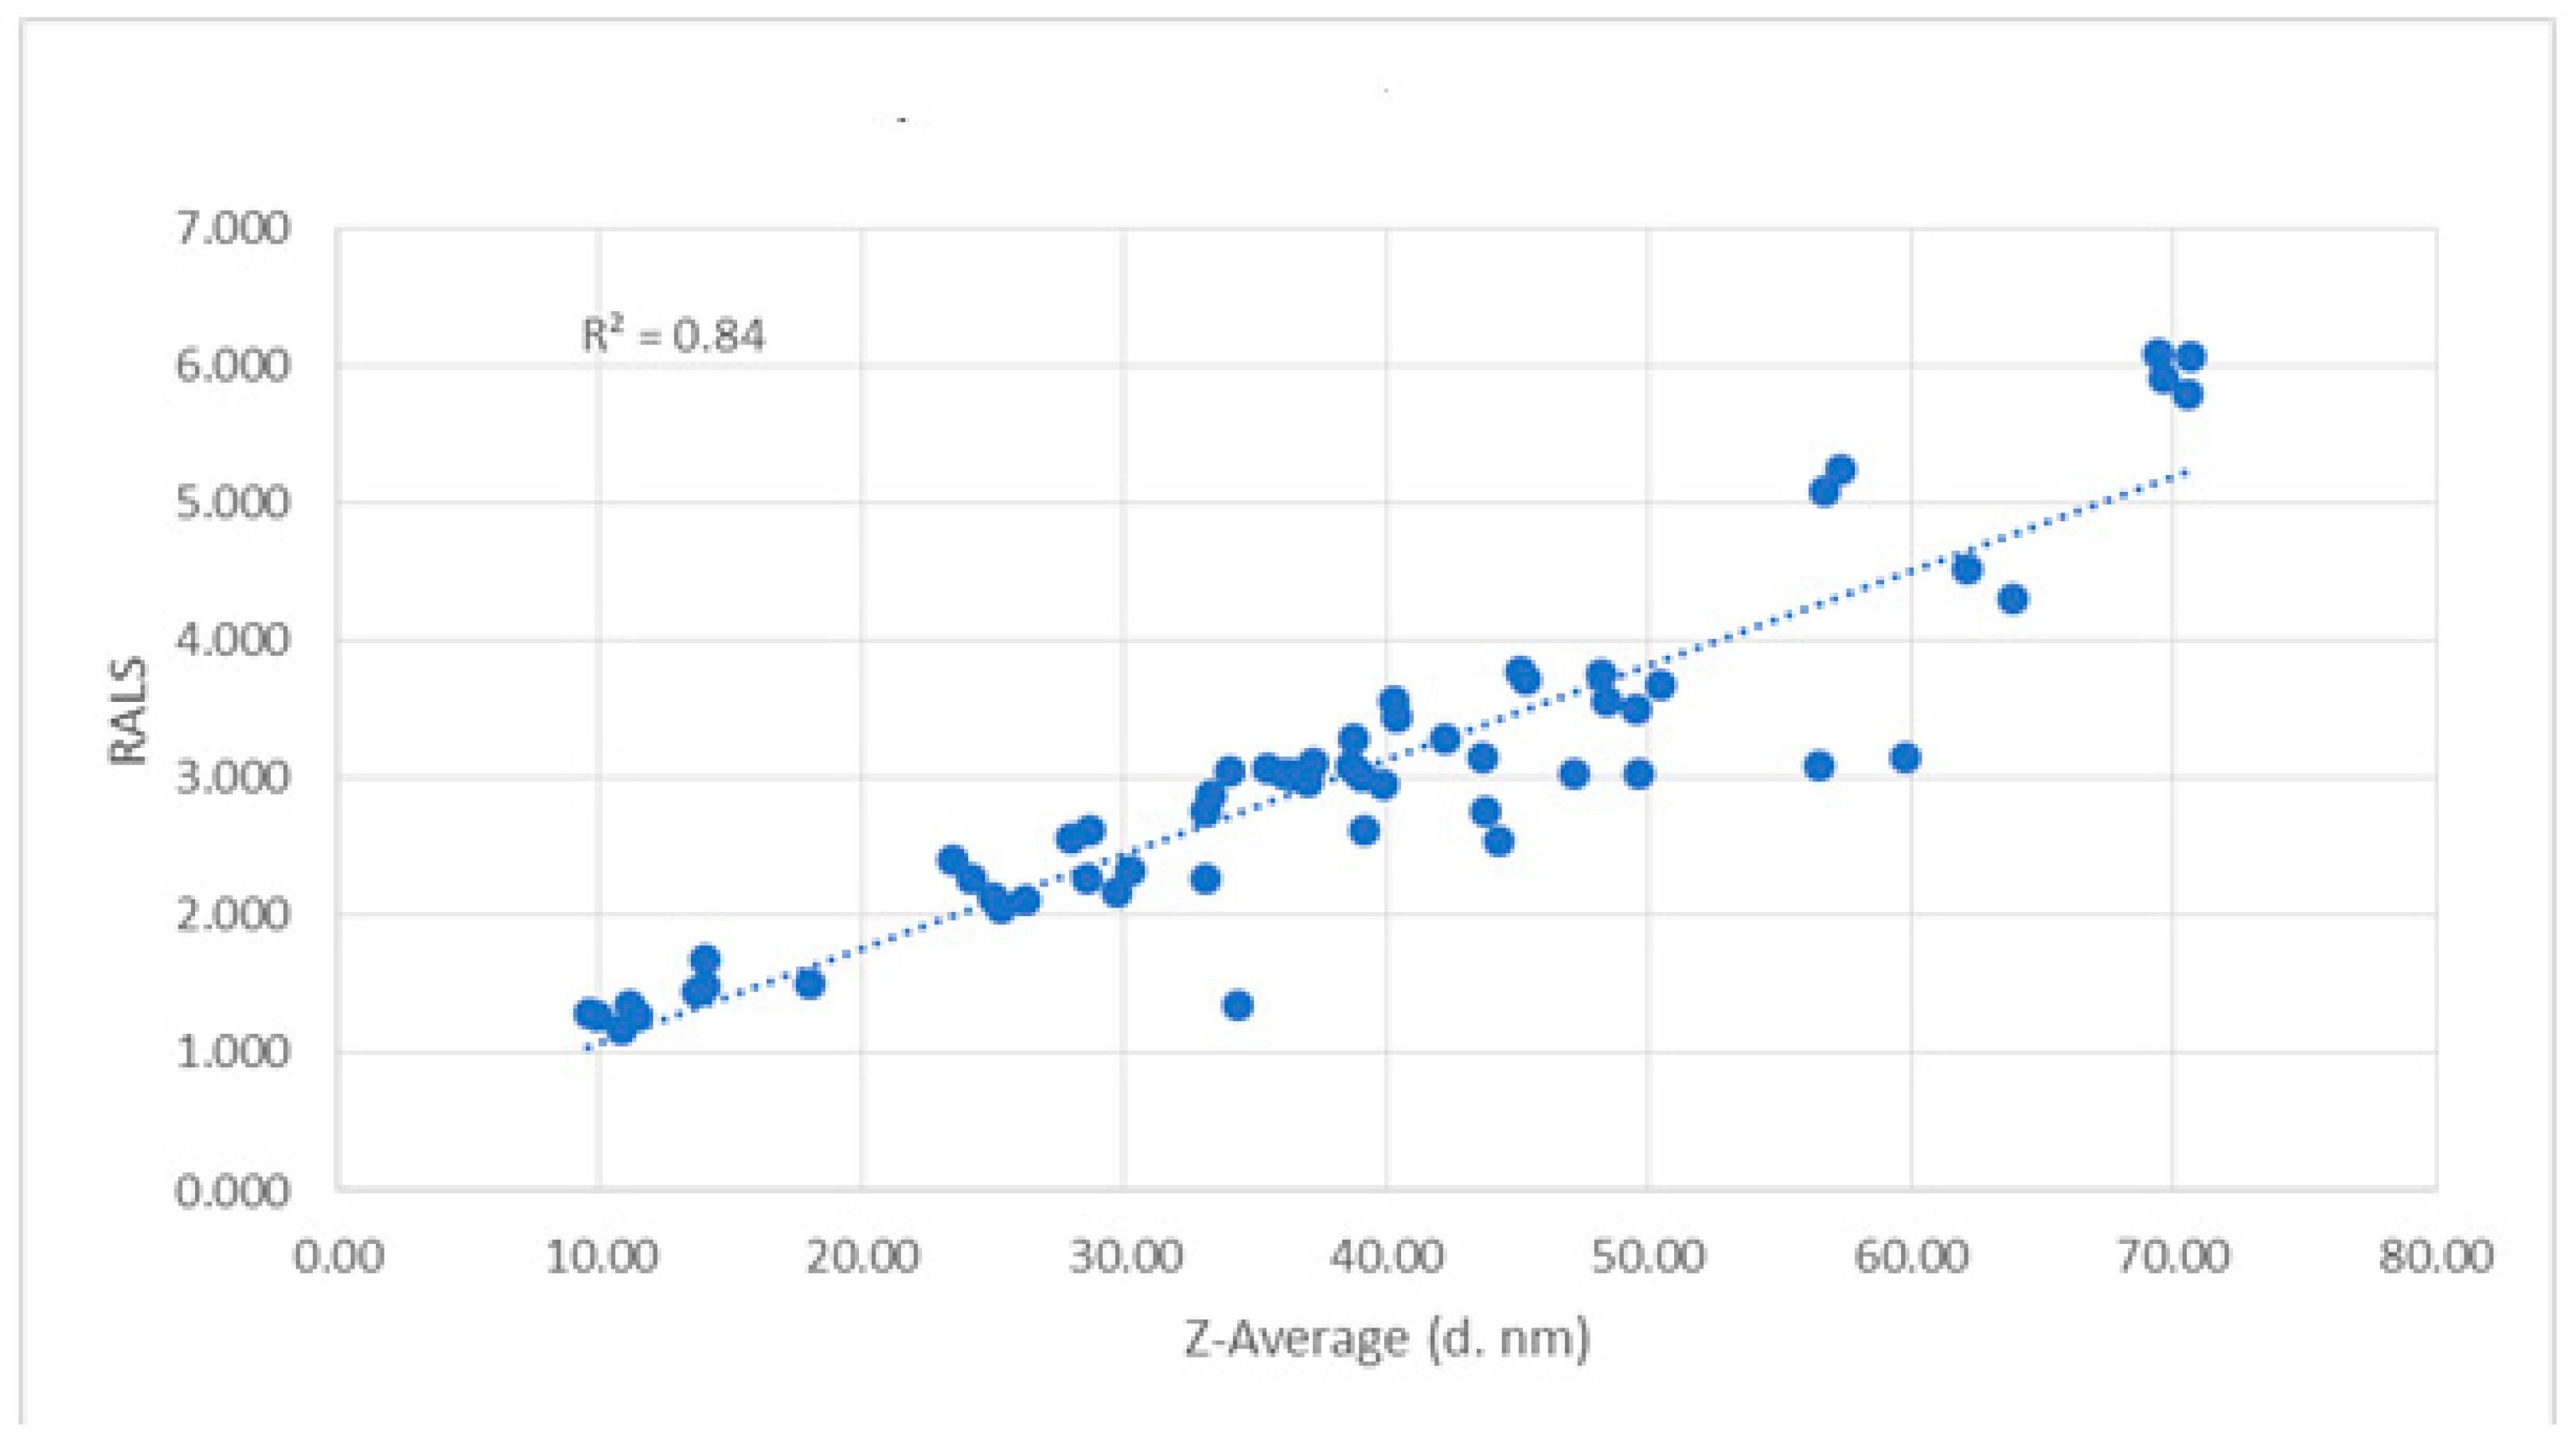
Figure 11). The time taken for RALS analysis of all formulations is less than 30 minutes, whereas SEC-HPLC analysis timing is more than 10 hrs, even though both analyses concluded that Histidine buffer with sucrose stabilizes this molecule. It is surprising to note that RALS values collected from excipient screening of buffers are corelating to the Z averages using DLS also (
Figure 8) and Z average buffer screening pattern is similar to RALS buffer screening pattern (
Figure 9)
Figure 9.
: Effect of temperature and ions on Antibody 3 as monitored by RALS.
Figure 9.
: Effect of temperature and ions on Antibody 3 as monitored by RALS.
Figure 10.
RALS profile on 60 kDa protein formulation containing different buffers.
Figure 10.
RALS profile on 60 kDa protein formulation containing different buffers.
Figure 11.
SEC-HPLC profile on 60 kDa protein formulation containing different buffers.
Figure 11.
SEC-HPLC profile on 60 kDa protein formulation containing different buffers.
Figure 12.
Correlation of Z average and RALS of 60 kDa protein formulation containing different buffers.
Figure 12.
Correlation of Z average and RALS of 60 kDa protein formulation containing different buffers.
Figure 13.
Z Average profile on 60 kDa protein formulation containing different buffers.
Figure 13.
Z Average profile on 60 kDa protein formulation containing different buffers.
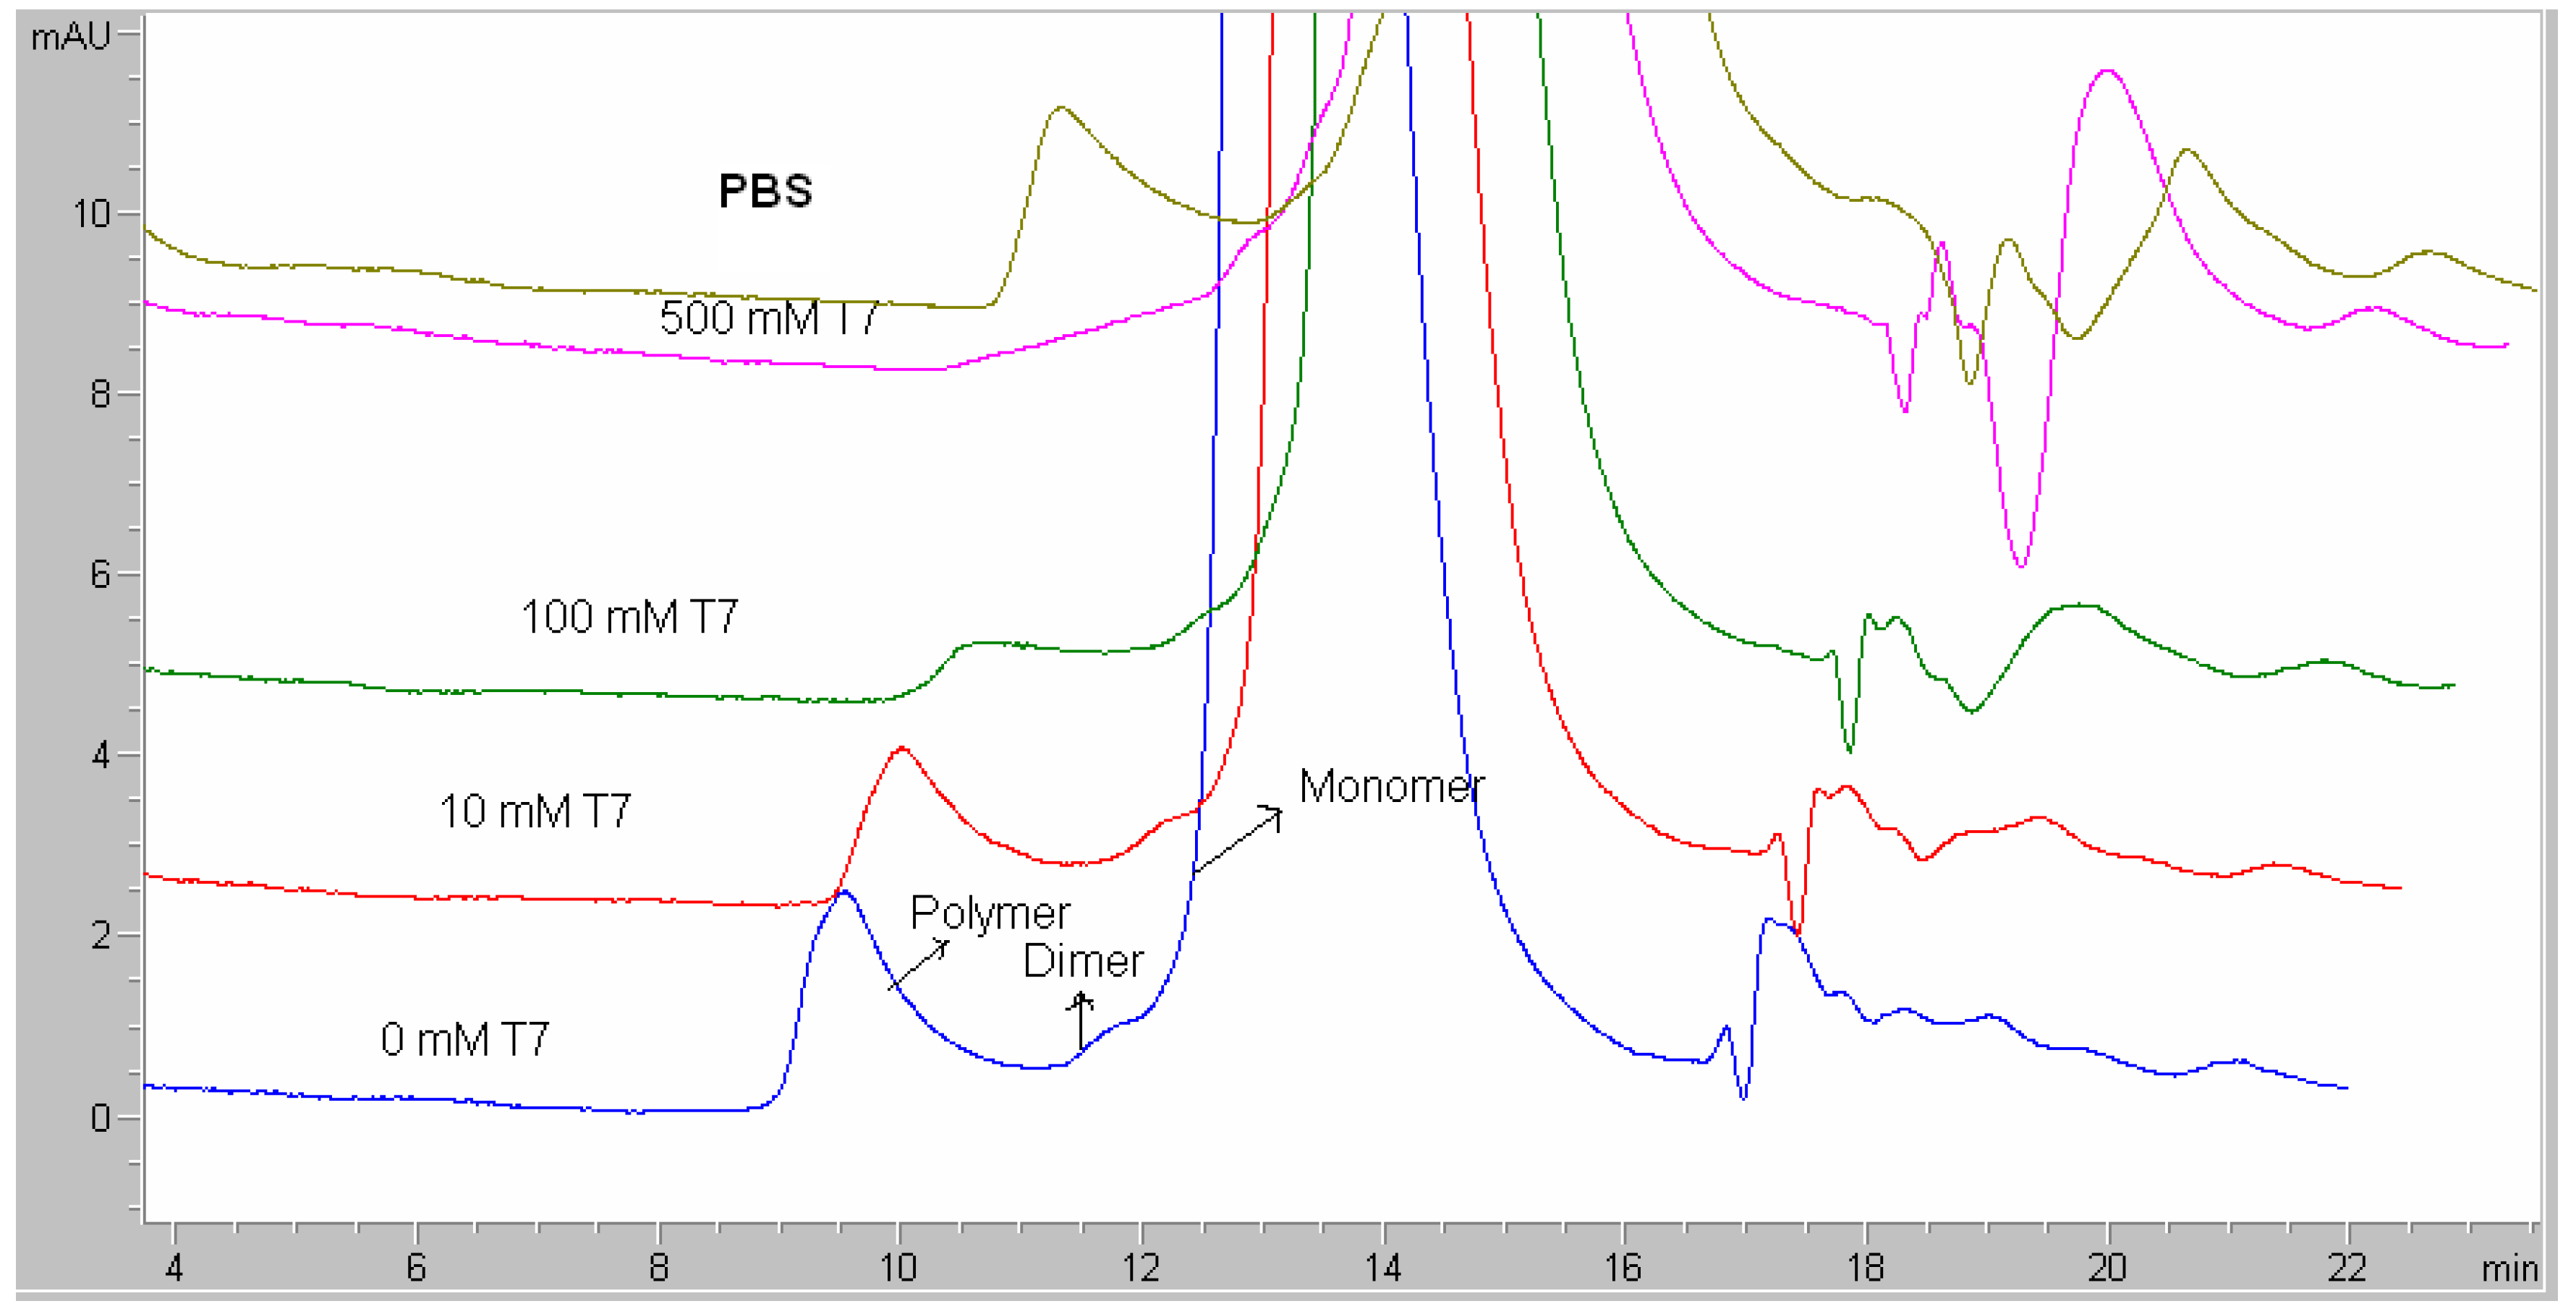
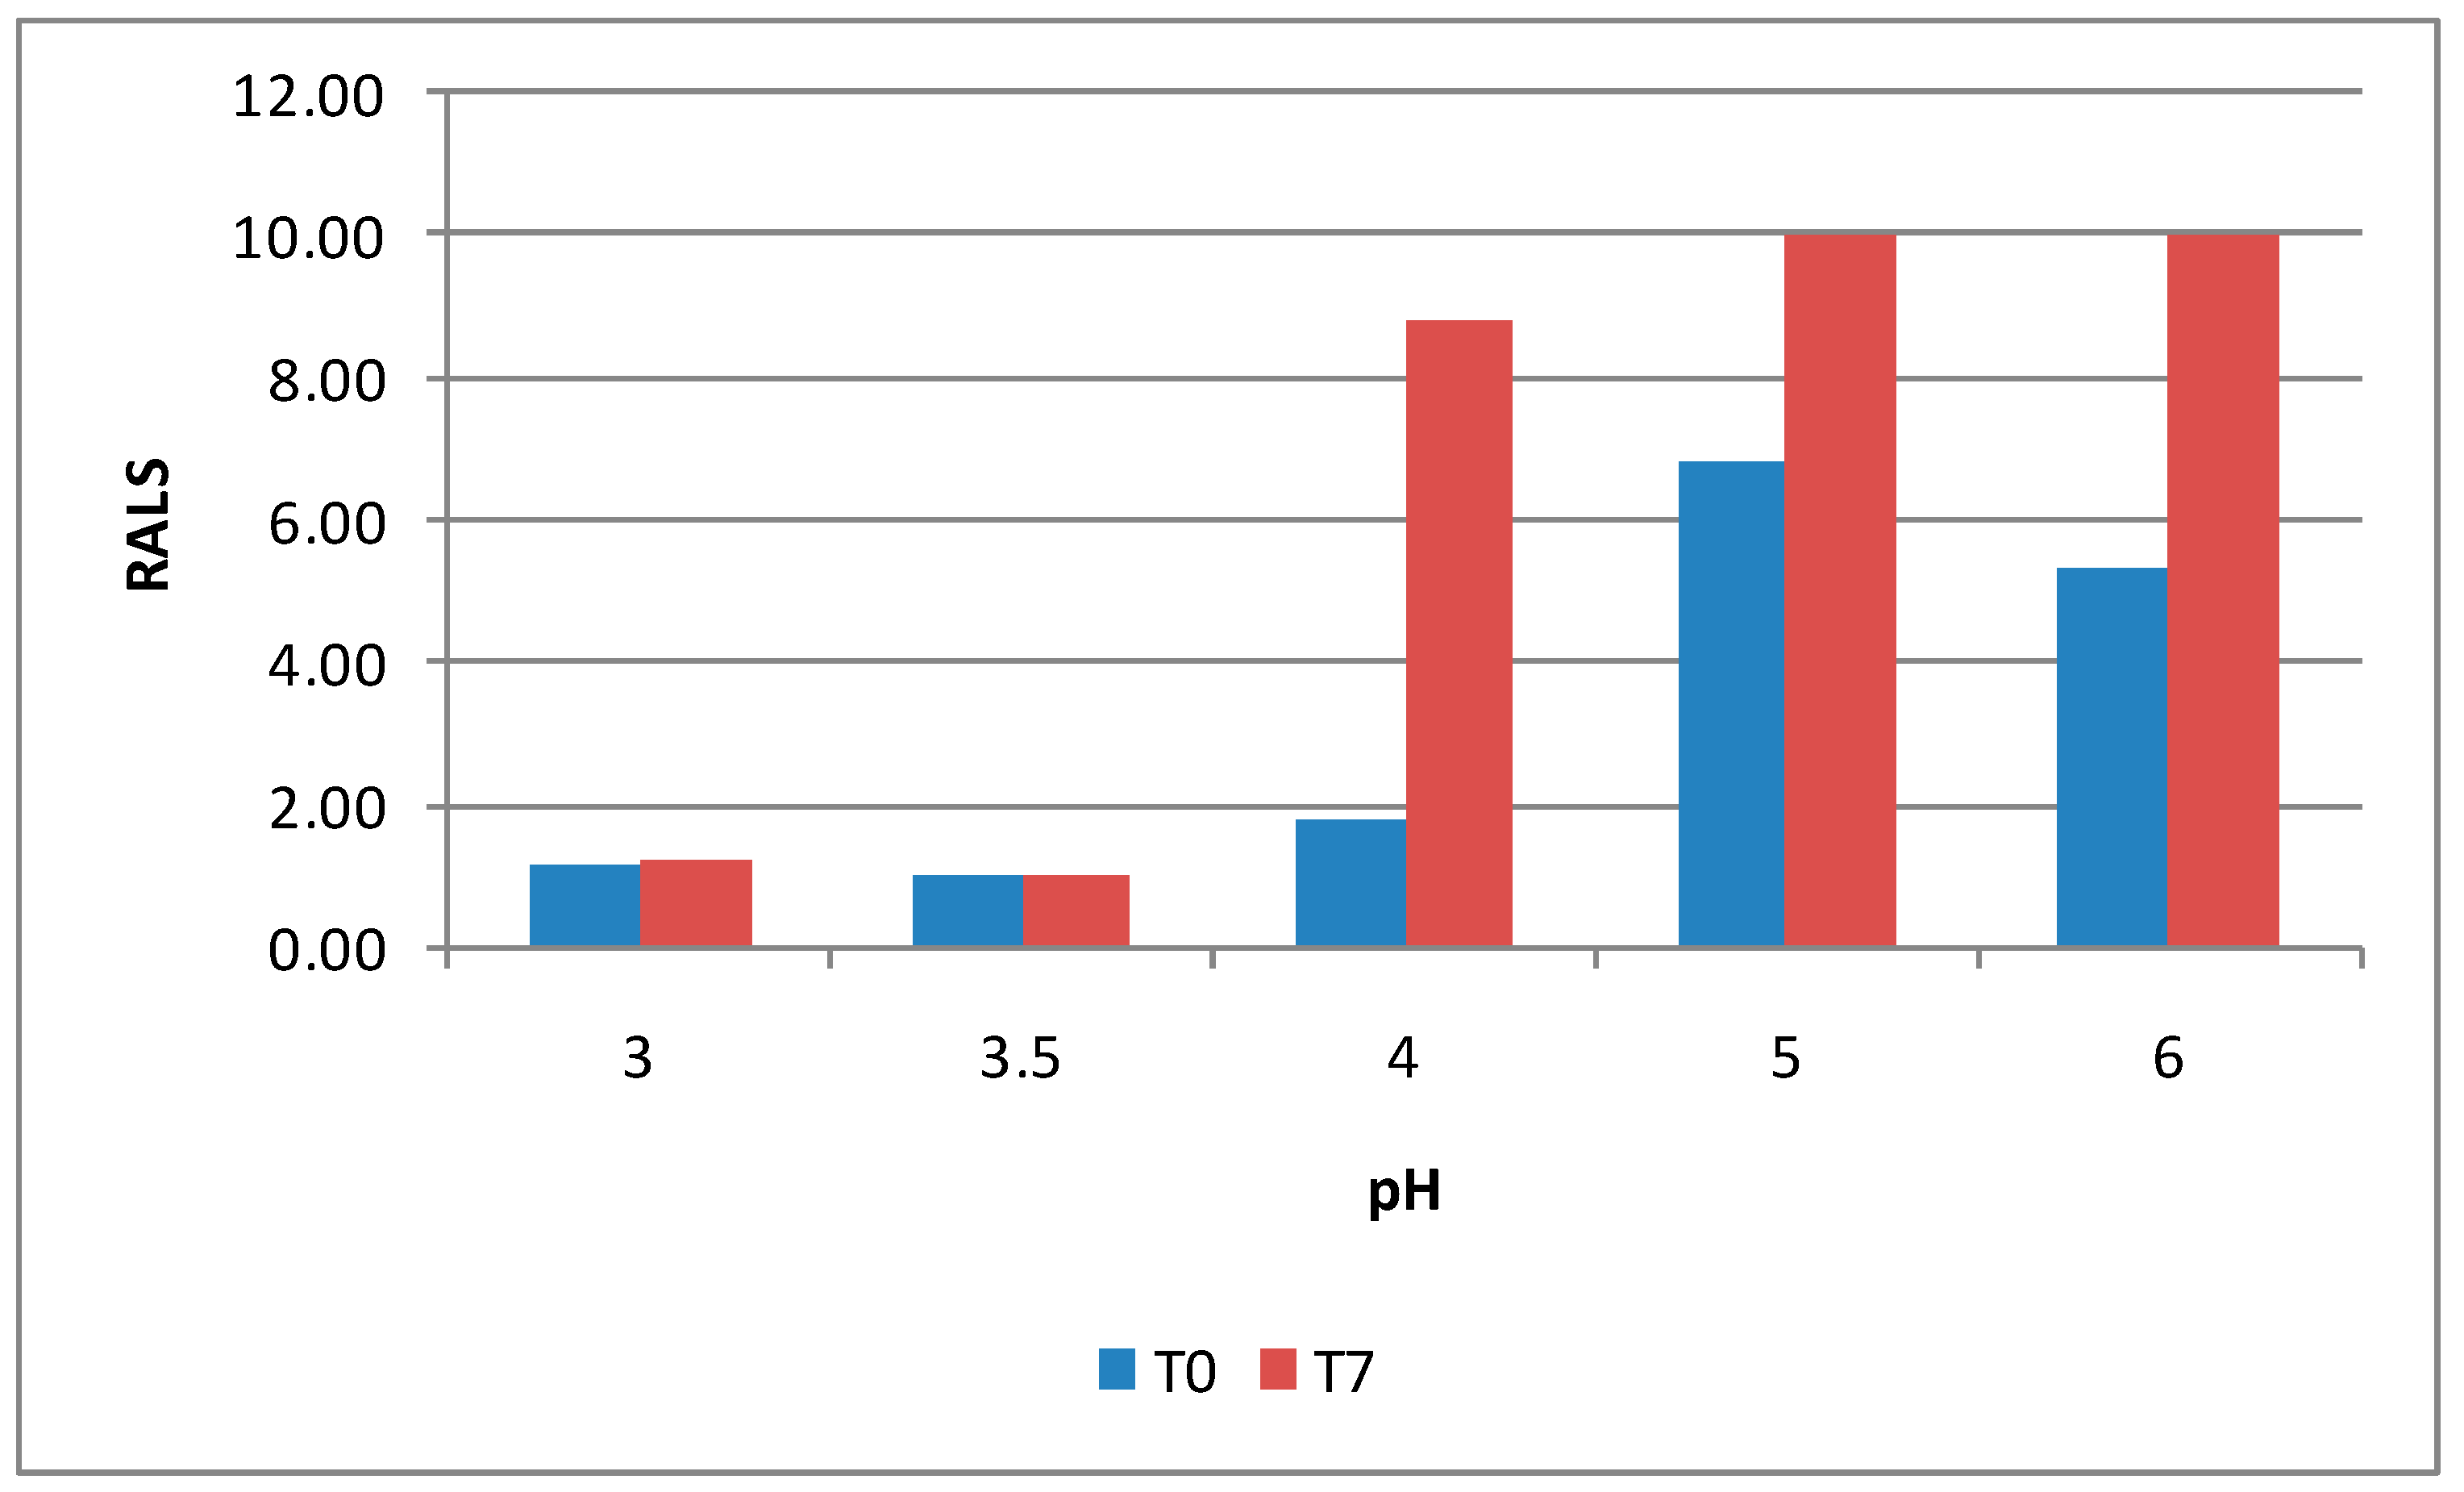
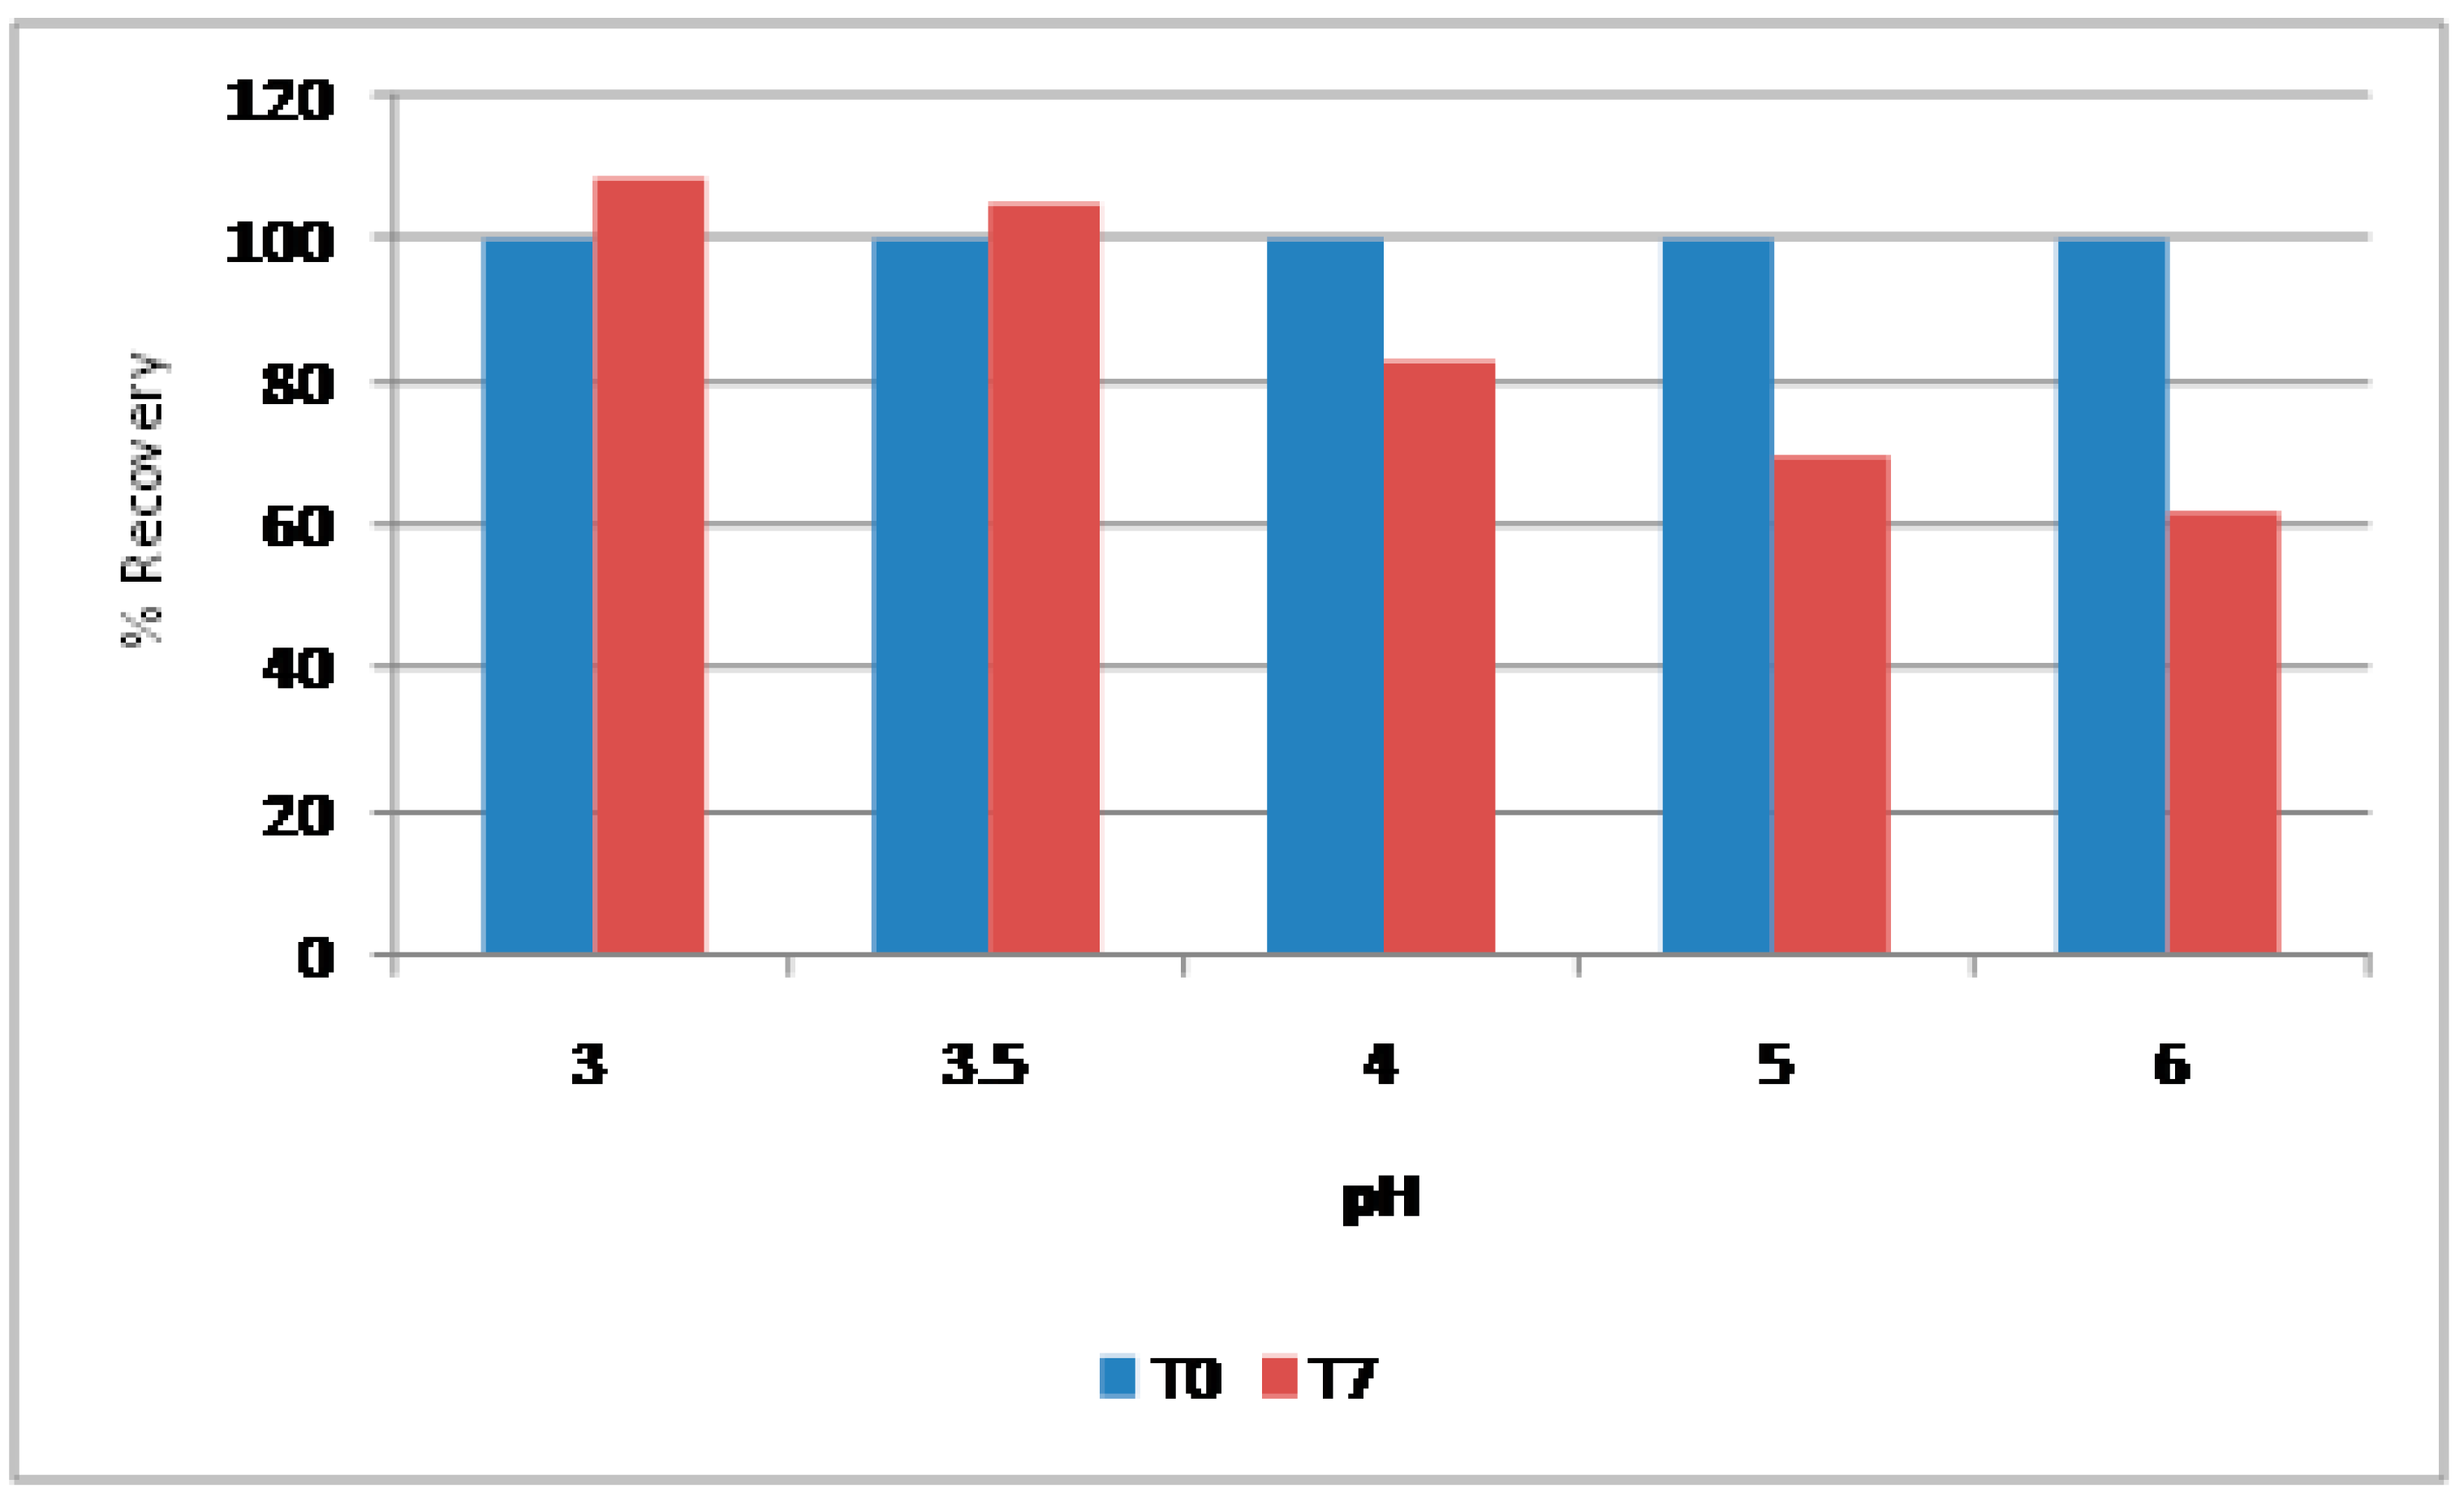
Peptide formulation
Besides protein formulation, RALS technique may also be used to screen peptide formulation. A synthetic dimer of two 13-mer cyclic disulfide peptides (MW 3104) at 10 mg/mL concentration was evaluated for pH screening using RALS technique. Acetate buffer at 5 mM concentration in the pH range of 3-6 was used. The data indicated that this peptide is more stable at pH 3.0-3.5, as evidenced by less RALS at these pH ranges (
Figure 14). RP-HPLC analysis also confirms that this peptide is more stable at the pH range of 3,0-3.5 (
Figure 15). The time taken for RALS analysis of all formulations is less than 30 minutes, where as RP-HPLC analysis timing is more than 22 hrs, even though both analyses came to a conclusion that pH 3.0-3.5 stabilizes this molecule.
4. Discussion
Most of the biopharmaceutics are sensitive to pH and ions. The strategy for formulation development of proteins or peptide involes optimization of pH and ions followed by excipients which are known to stabilize the molecule. The proper selection of buffer depends on solubility and stability of protein as a function of pH. The addition of a buffer is not necessary, if the formulation maintains desired pH [
32]. Present study shows that Antibody 1 is stable in water (
Figure 3A) and achieved a desired pH of 5.8 in water. This antibody was concentrated to 30 mg/mL in water by diafiltration and adjusted tonisity with glycine and sucrose, as this antibody is not compatible with salt (
Figure 2A) and the final pH was 5.8. Proteins are potent intracellular buffer, as side group of protein is capable of accept or donate protons [
33]. The stabilization or destabilization of protein by sodium chloride depends on interaction between salt ions and charged groups of the protein [
24]. Warne [
23] reported that the Tm of IL-1R continues to increase with increasing salt, even when NaCl is 1500 mM, well above the concentration needed to saturate all the charged sites and suggested that salt ions affect water structure, which also plays a role in protein conformational stability. Both charge-charge interactions, and changes in water structure, provide stability to native IL-1R [
23]. Increase in ionic concentration is known to increase the stability of recombinant alpha, antitrypsin [
25]. However, human growth hormone is destabilized by sodium chloride by increasing deamidation [
26]. RALS seems to be a better tool, to assess, the effect of ions on the stability of various proteins including antibody. The Debye-Huckel theory which predicts that increase ionic strength would be expected to decrease the rate of degradation of oppositely charged reactant and increase the rate of degradation of similarly charged reactant [
27] may be more relevant to antibodies also. Sodium ions may bind to similarly charged group of antibody 1 and 3 and bind to appositely charged group in Antibody 2.
Therapeutic proteins are sensitive molecules held together by weak physical interactions and chemical bonds. Presence of hydrophobic surfaces, shear, dehydration and a change in temperature or pH may change their three-dimensional structure. A change in a protein's structure leads to impact its therapeutic effect and triggers adverse immune reactions to the drug [
2,
3,
4]. Any effective formulation therefore must safeguard a protein's integrity while achieving the desired stability profile. To extend a protein's half life, the formulation developed must be resistant both to physical degradation, such as aggregation and denaturation, as well as chemical degradation, such as oxidation and deamidation of proteins [
28,
29,
30,
31].
Elucidating conformational characteristics of proteins in different formulations is difficult, even with the most advanced analytical equipment [
9]. Combinations of different analytical methods are desired in understanding the physical and chemical property of protein formulations. The challenge addressed to formulation scientist is to formulate protein/ peptide in a shorter period of time with lesser API. To meet this challenge, a rational approach in eliminating the analysis of poorly performed formulations by different analytical method is wanted. RALS is a simple sensitive technique, which analyses the status of aggregation and RALS in combination with temperature ramp provide, acute thermal stability of the molecule. Processing of sample is not needed for RALS analysis, like FTIR, DSC and circular dichroism analysis [
15,
16,
23]. However, the analysis of initial aggregation status of the molecule is difficult with most of the other analytical methods without processing the samples. Based on acute thermal stability and initial RALS, poorly performed formulations can be eliminated for further analysis. For example, further analysis of formulation containing phosphate, pyrophosphate, citrate and succinate buffer for antibody 1 by other analytical method could easily be avoided based on T
0 RALS acute thermal stability data of the molecule. Based on acute thermal stability using RALS analysis, Warne [
21] was able to demonstrate that glycine helps to stabilize Interleukin 11 in solution at T
0. This thrombopoietic growth factor in glycine formulation is available in market as NEUMEGA
® (Wyeth). After eliminating the poorly performed formulations at T
0, further elimination of relatively poorly performed formulations can be achieved by testing the formulations, which has under gone stability using static RALS analysis. This technique takes less time and there is no necessity of sample processing. This is exemplified by data on effect of ions in antibody 1 (
Figure 3) and effect of various excipient on peptide formulation (
Figure 6). After eliminating the poorly performed formulations, the best formulations can be further confirmed with other analytical techniques such as HPLC, electrophoresis, circular dichroism, FTIR, DSC, ultracentrifugation, etc, though there is no single analytical method exists to cover the entire size range or type of aggregates and each analytical method has its own limitations. It is surprising to note that dynamic light scattering (DLS) results are often expressed in terms of the Z-average and it directly correlates with the RALS data.
. A rational approach of eliminating poorly performed formulations using RALS or DLS as a tool in early formulation development will reduce time and save API.