Preprint
Article

This version is not peer-reviewed.

Two-Level Full Factorial Design and Central Composite Design for the Development of Laser Scribed Graphene Electrodes for Label-Free L-Histidine Detection in Artificial Sweat

Submitted:

28 February 2025

Posted:

03 March 2025

You are already at the latest version

Abstract

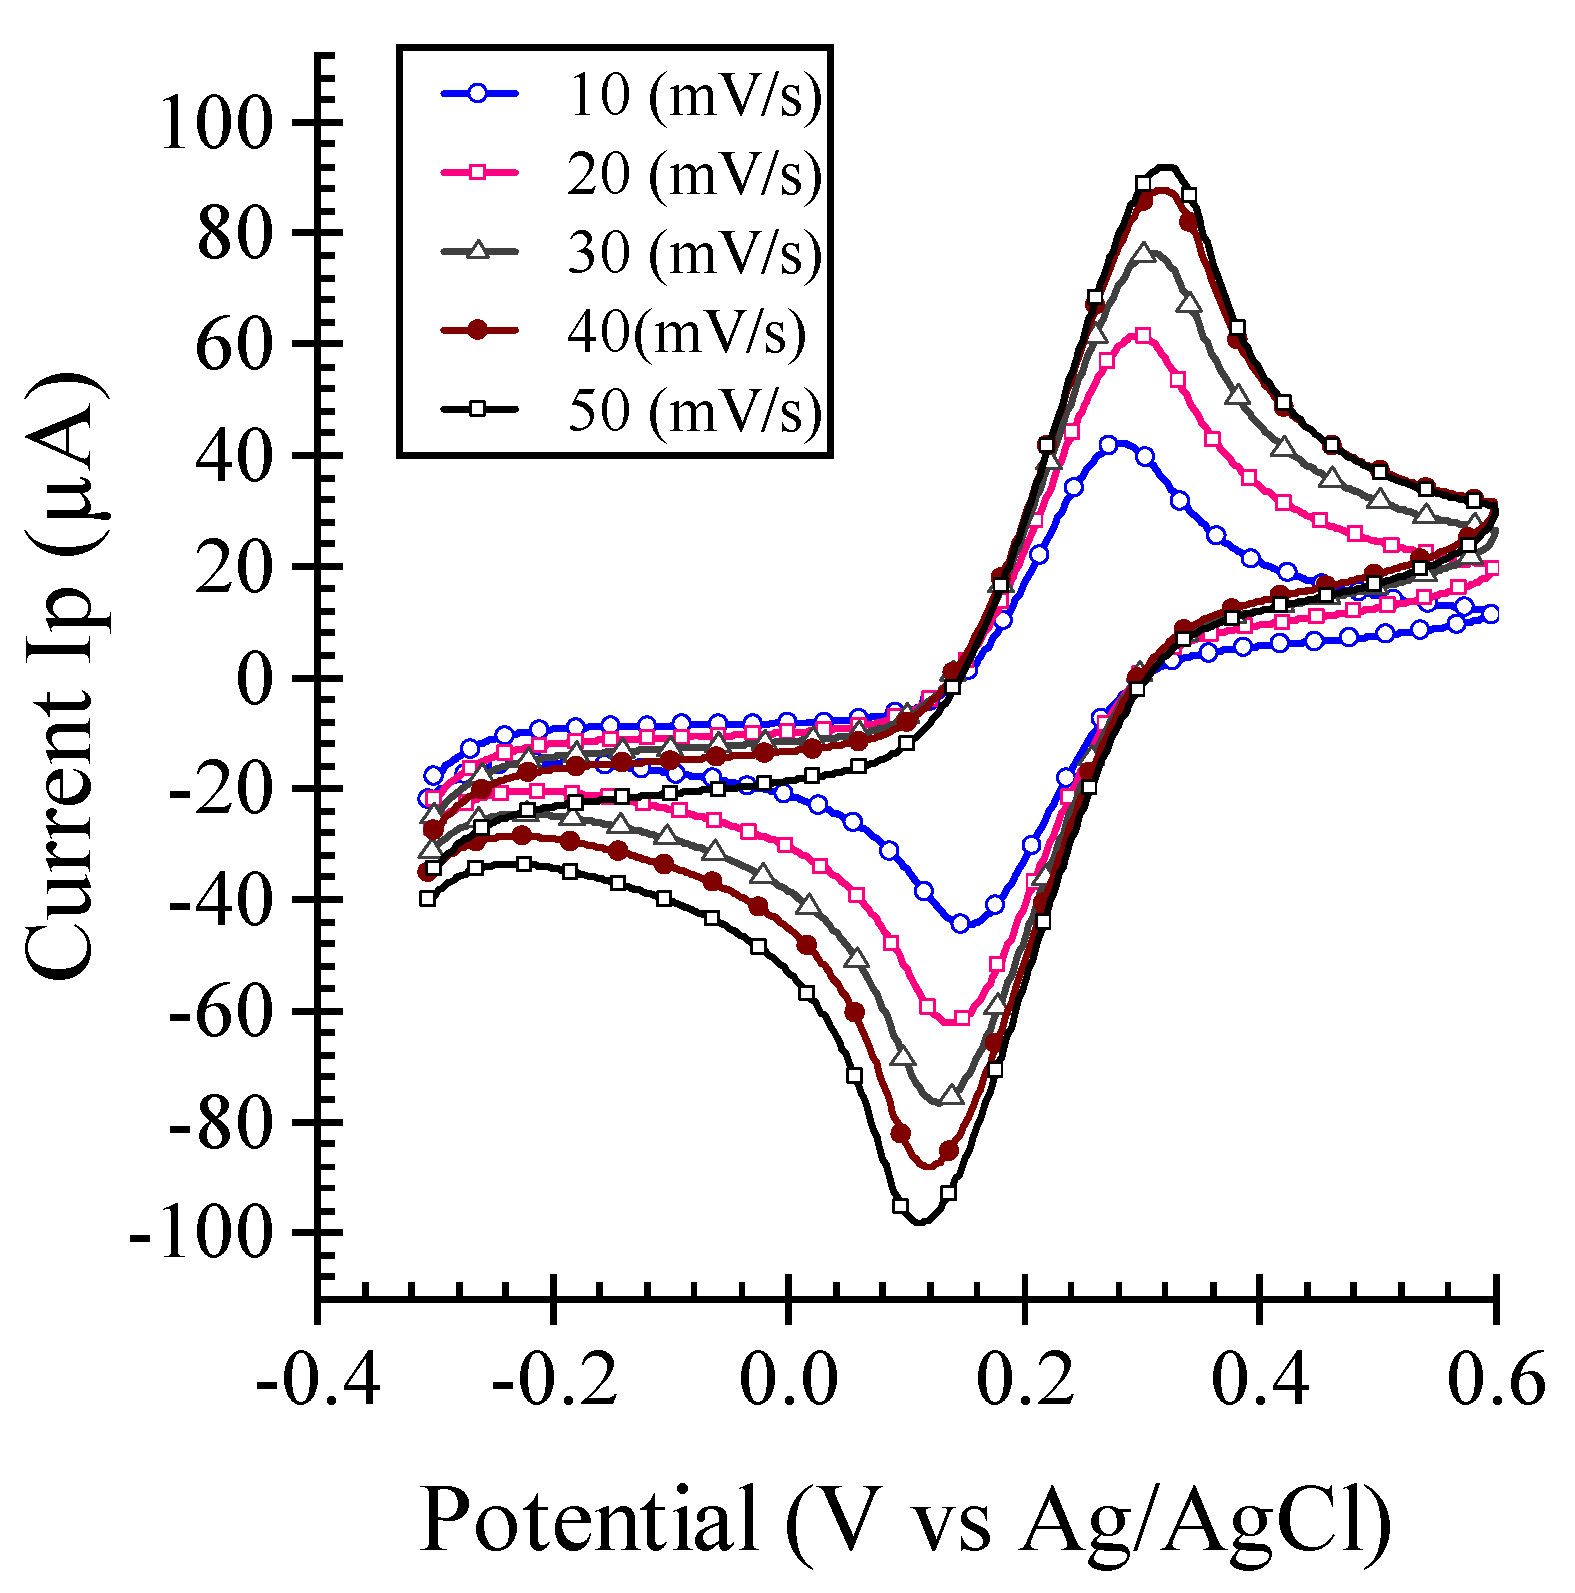
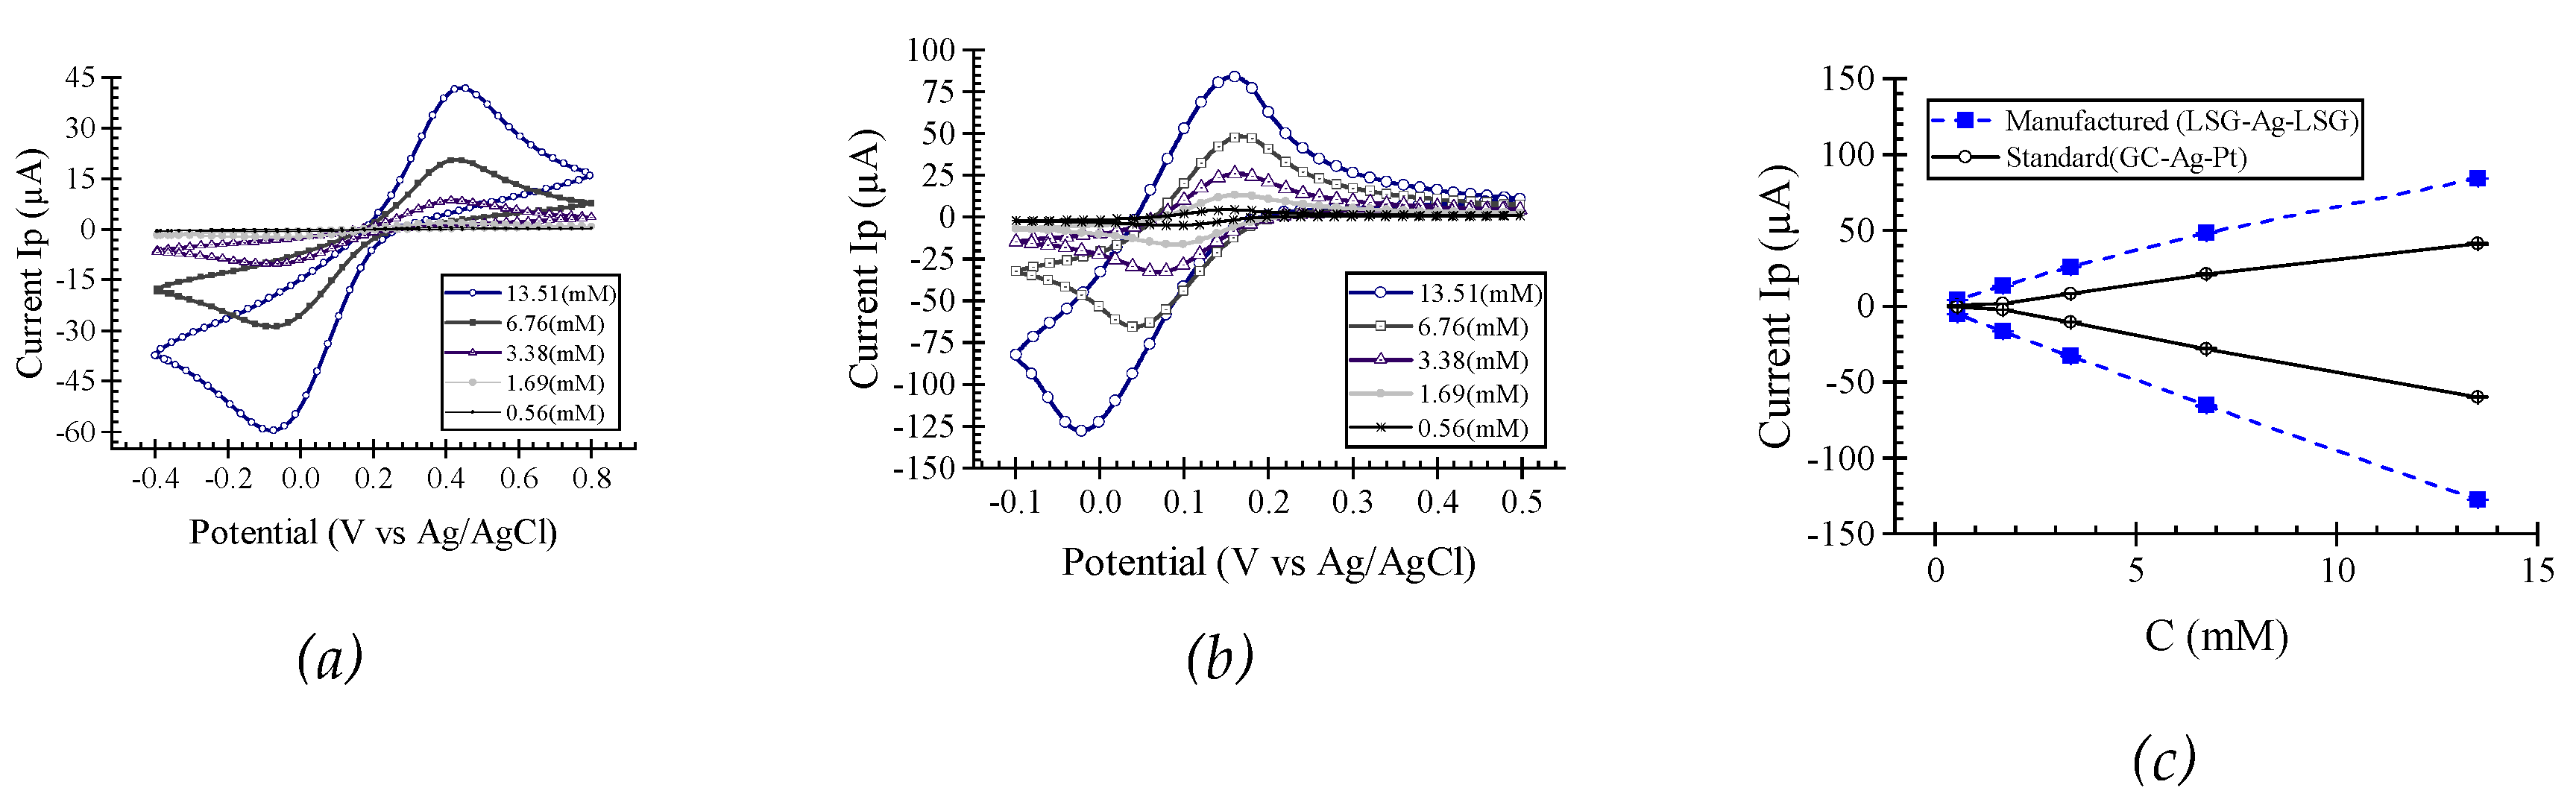
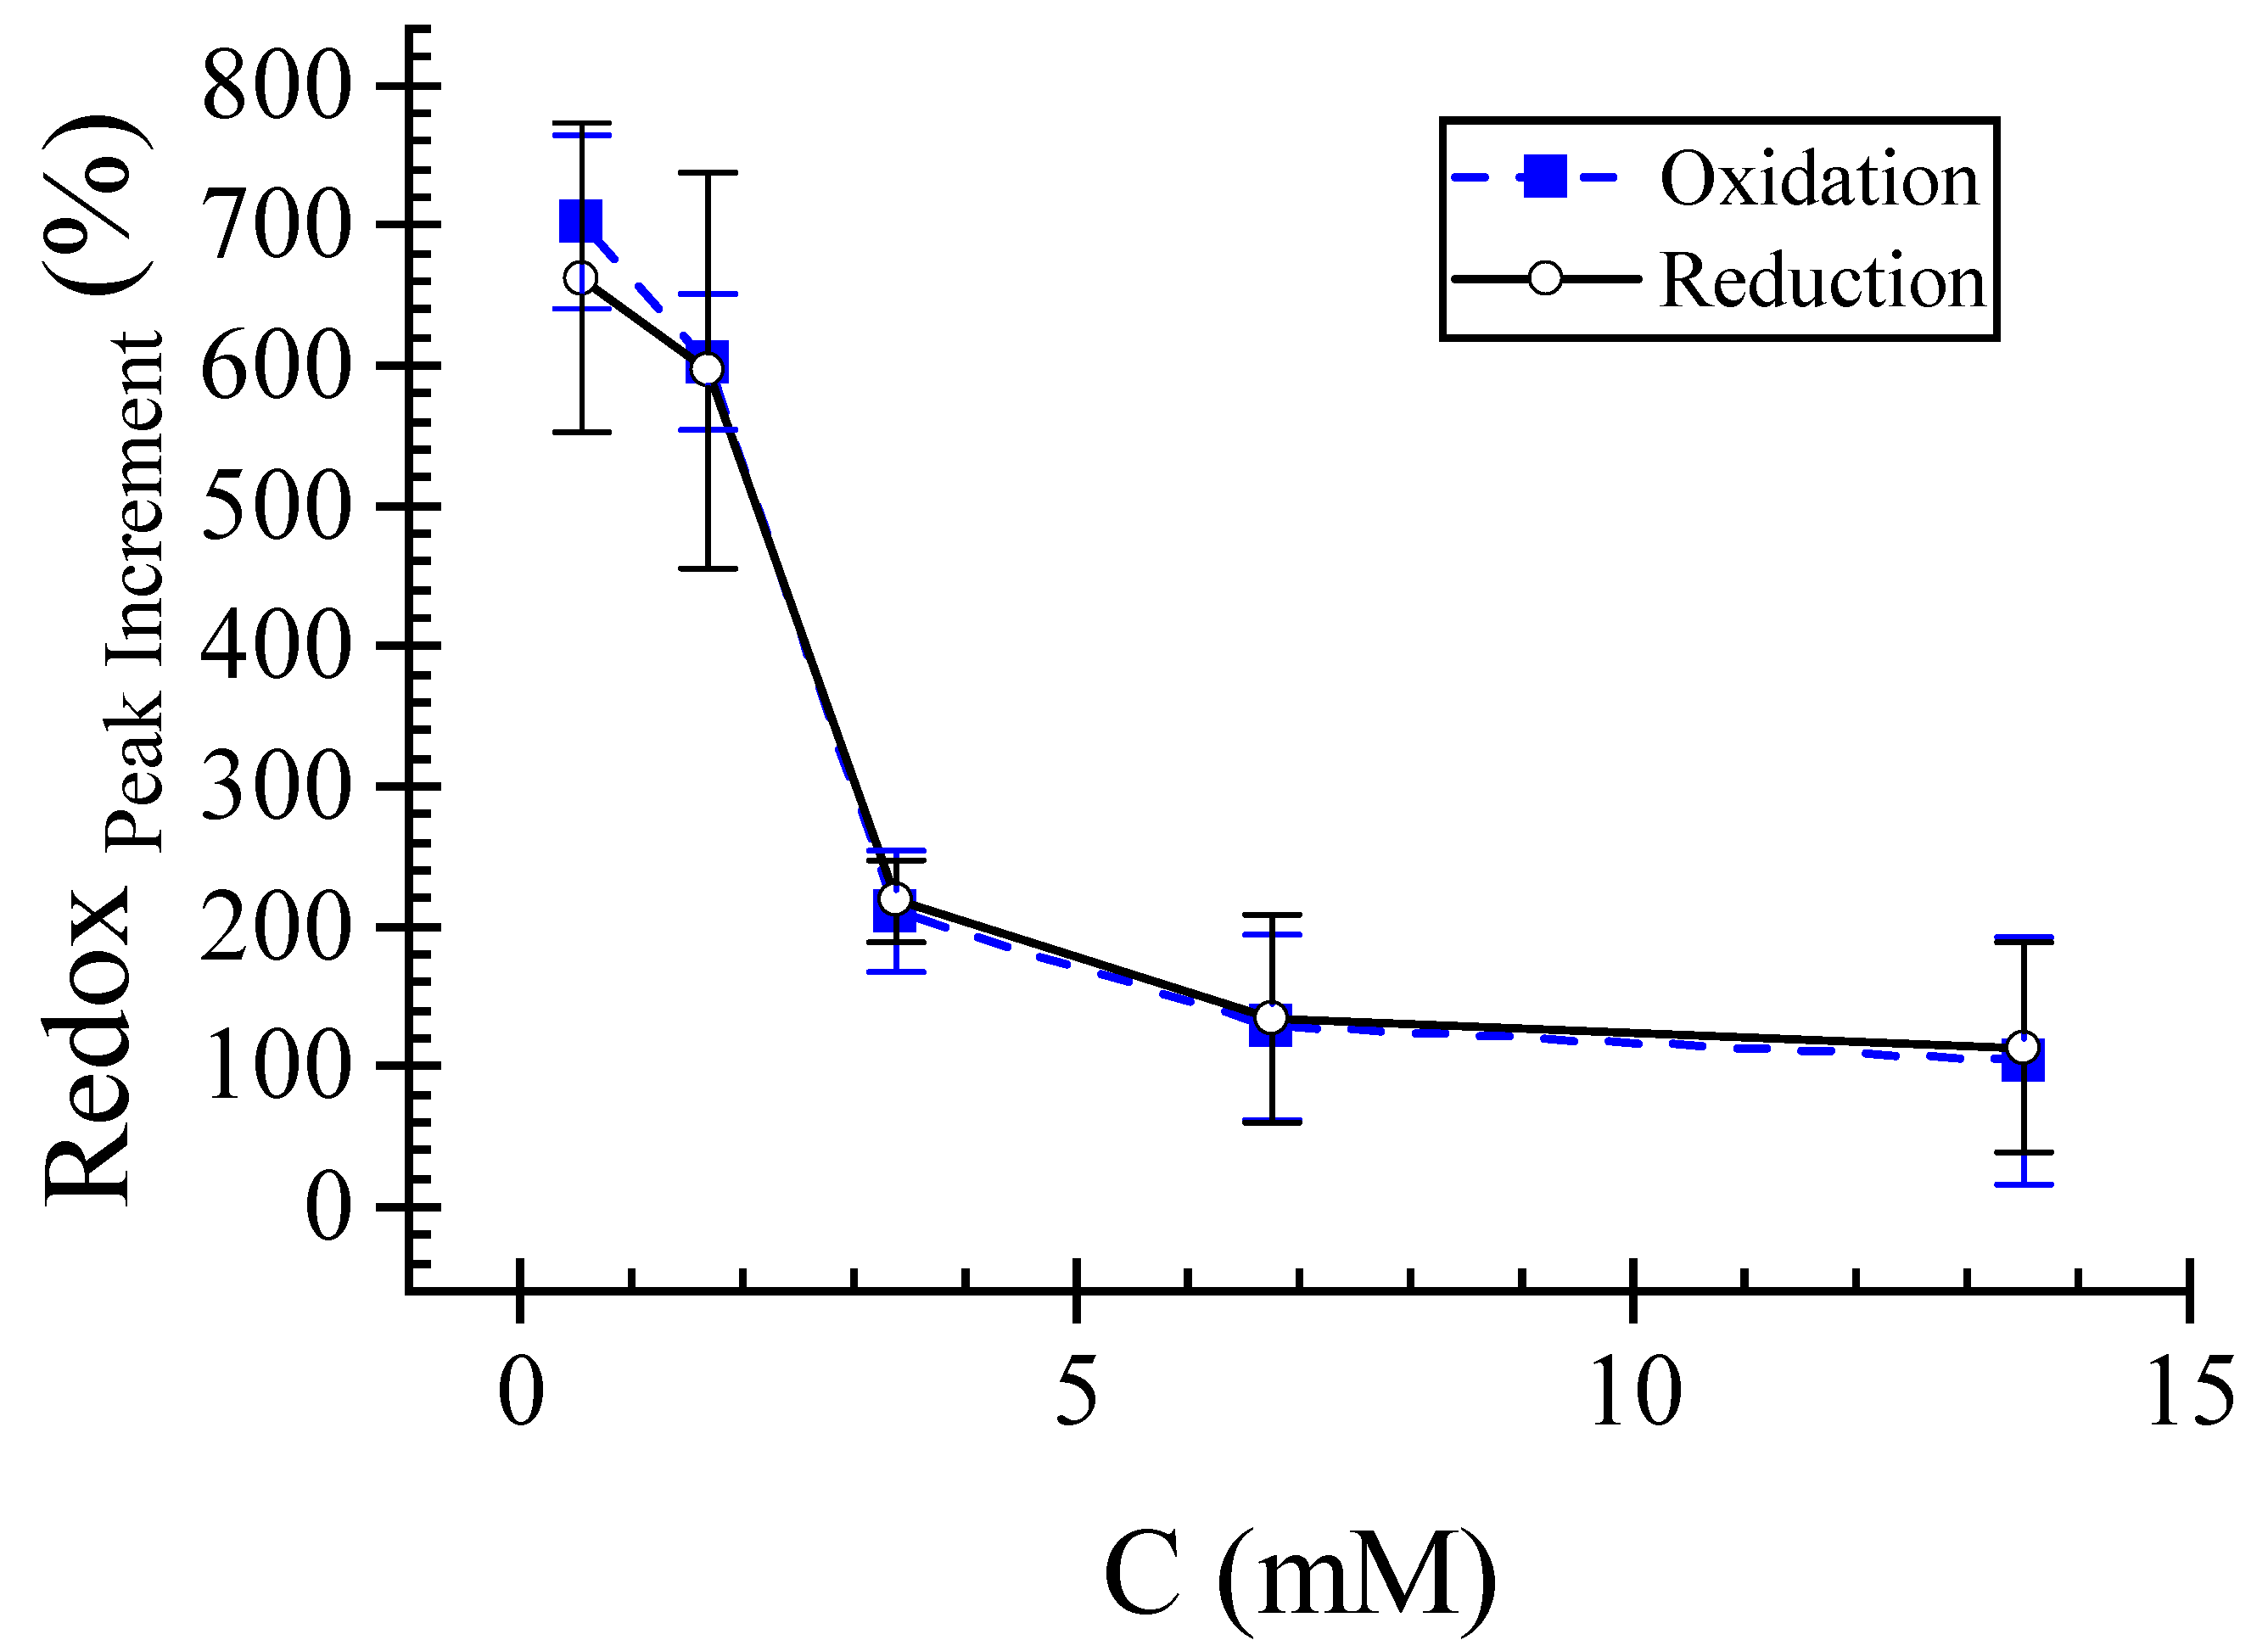
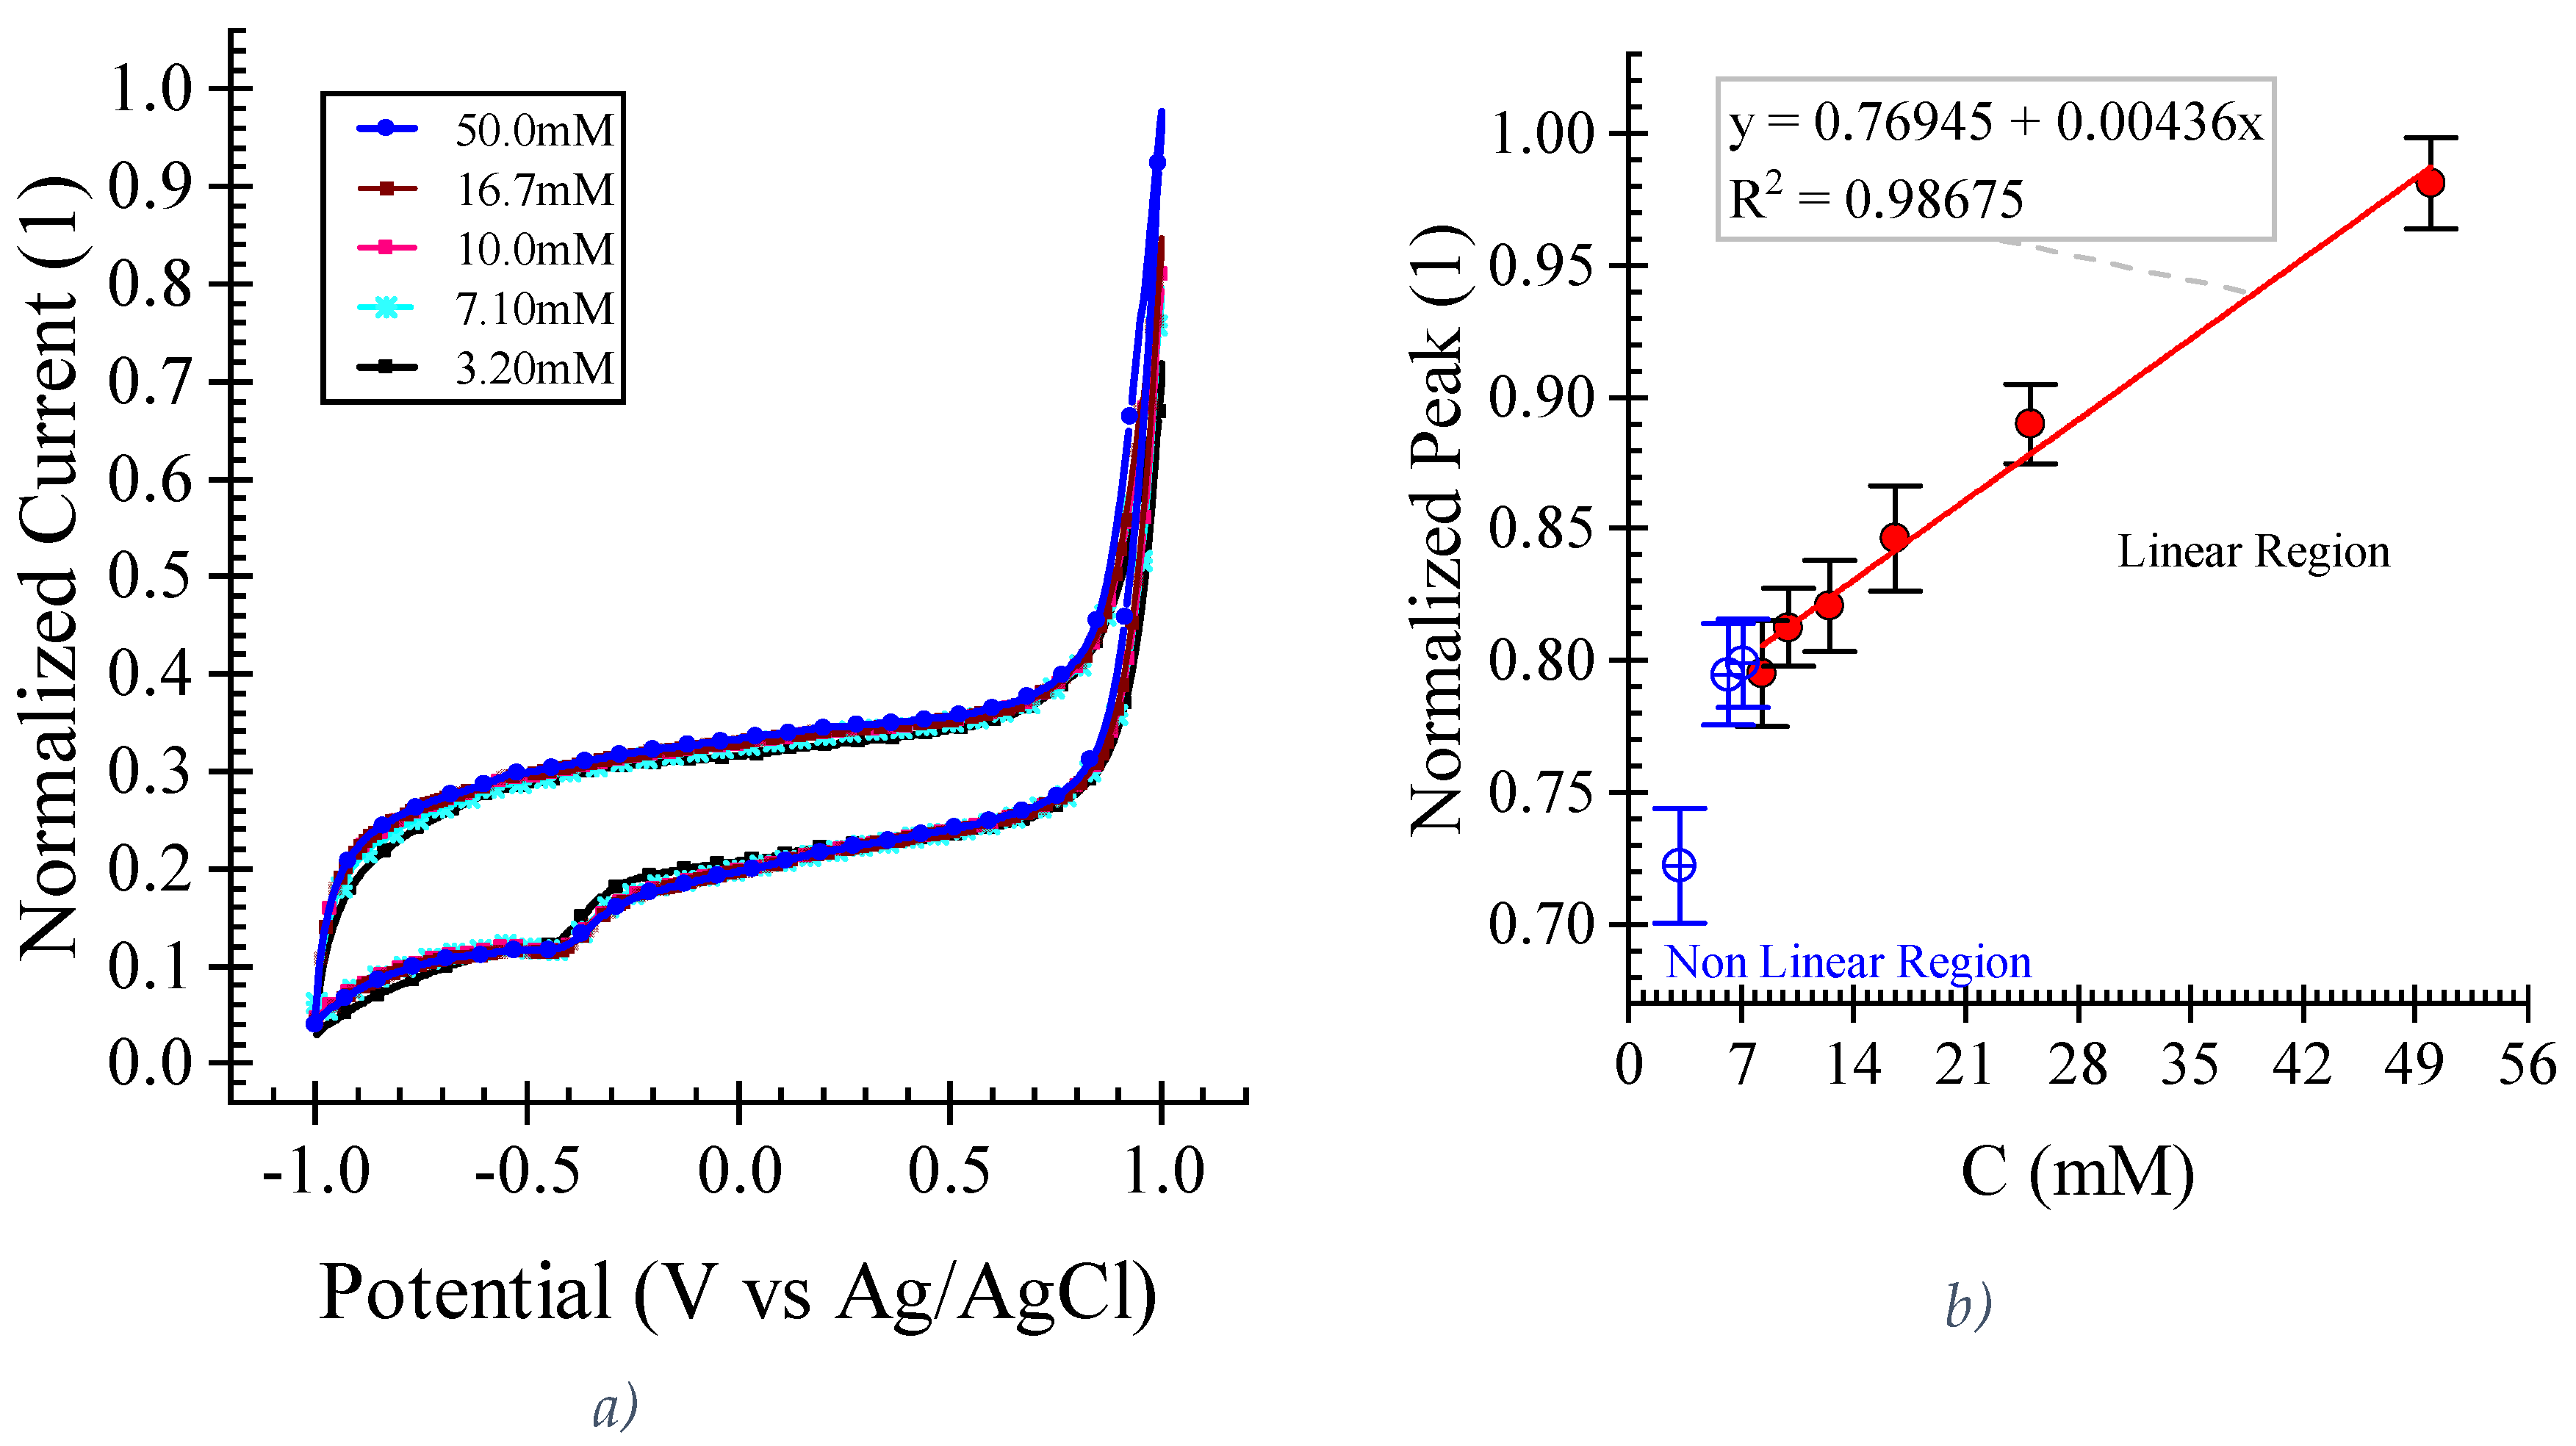
This study investigates the fabrication of laser-scribed graphene (LSG) electrodes on polyimide substrates using a CO2 laser cutter for label-free L-histidine detection in artificial sweat. Two-level full factorial and central composite designs were employed to optimize critical manufacturing parameters, including laser speed, power, and electrode width. Electrochemical characterization using cyclic voltammetry with K3Fe[CN]6 demonstrated superior LSG electrode performance compared to standard glassy carbon electrodes, exhibiting a 702 ± 62% higher oxidation current peak at 0.56 (mM) K3Fe[CN]6 in 0.1 M KCl. We successfully demonstrated the label-free electrochemical detection of L-histidine in artificial sweat using these LSG electrodes. The results show a linear relationship (R2 =0.987) between current peak and L-histidine concentration within the 8.3 (mM) to 50 (mM) range, demonstrating high sensitivity towards L-histidine. These findings highlight the potential of this optimized LSG electrode fabrication approach for developing high-performance, user-friendly, and disposable wearable biosensors for real-time, and non-invasive health monitoring applications in sweat analysis.

Keywords: 
;  ;  ;  ;  ;  ;  ;  

1. Introduction

Graphene, a 2D monolayer of carbon atoms arranged in a honeycomb lattice, possesses unique electronic properties, including high conductivity and large surface area, making it attractive for electronic applications [1,2]. While early graphene research explored exfoliation [3,4,5] and SiC thermal decomposition [6,7], Chemical Vapor Deposition (CVD) [8] and laser scribing [9,10,11] have emerged as scalable methods. Laser scribing, a process that produces laser-scribed graphene (LSG), offers a compelling alternative for biosensor fabrication due to its low-cost, rapid prototyping, and suitability for flexible substrates, making it particularly attractive for wearable biosensor development [12,13]. Biosensing applications are expanding beyond traditional targets to include neurochemicals, hydrogen peroxide, non-electroactive molecules (using enzyme-based methods), proteins (e.g., cancer biomarkers), immunoglobulins, and viral/bacterial DNA [14,15,16,17,18,19,20]. LSG has demonstrated promise in various biosensing applications, including the detection of biomolecules in complex matrices [14,21,22,23].
However, the electrochemical performance of LSG electrodes is highly dependent on manufacturing parameters. Several studies have investigated the impact of laser scribing parameters (power, speed, geometry) on the structural and morphological properties of LSG [24,25,26,27,28]. A consensus on optimal settings remains elusive, highlighting the need for systematic optimization to maximize the electrochemical signal and sensitivity of the LSG electrodes for analyte detection. Researchers have probed the effect of manufacturing parameters on the structural properties of graphene, including the number of lasing passes, laser focus at different speeds, and power levels. Results highlight problems with laser speed and power control in LSG electrode fabrication, which significantly affects the quality of the produced graphene [26,27]. These results open the door for studying how lasing parameters affect the electrochemical detection properties of LSGs and where the use of Design of Experiments (DoE) emerges as a valuable technique for efficiently managing measurement resources and time [26,27,28]. Full Factorial Design (FFD) and Central Composite Design (CCD) are two widely used DoE methods and are used to study the relative effect of various inputs on a system [29,30].
In this work, we employ a Design of Experiments (DoE) approach, specifically a 23 Full Factorial Design (FFD) followed by a Central Composite Design (CCD), to efficiently investigate the influence of laser speed, power, and electrode geometry on the electrochemical performance of LSG electrodes, allowing for the selection of the most appropriate manufacturing parameter values. The performance of the selected LSG electrode was then evaluated by comparing it with a standardized glassy carbon (GC) electrode, with both serving as working electrodes. Electrochemical measurements were conducted using K₃[Fe(CN)₆] in KCl as the electrolyte solution, alongside a platinum (Pt) counter electrode and an Ag/AgCl reference electrode. The results demonstrate the potential of LSG as a promising candidate for integration into wearable technology.
Wearable devices show great promise as non-invasive, real-time biosensors for health monitoring by detecting biomarkers in body fluids like urine, saliva, and sweat [14,18,22,31,32,33]. Sweat is a highly viable option for real-time monitoring of a wide range of analytes, including amino acids like L-Histidine [34,35,36,37,38,39]. Furthermore, label-free electrochemical detection is particularly advantageous for wearable sensing as it requires minimal sample preparation and enables continuous monitoring. L-Histidine, a precursor to histamine, a key mediator in allergic reactions, is a promising target for non-invasive, continuous monitoring of allergic responses using wearable biosensors. Its presence in sweat makes it particularly attractive for wearable biosensor applications. Studies report L-Histidine concentrations in human sweat ranging from 0.212 mM to 3.3 mM [36,37]. To evaluate the detection capability of the fabricated LSG electrode as a label-free sensor, a commercially available artificial sweat solution [38], consisting of 0.5% NaCl, 0.05% L-Histidine, and 0.50% Na₂HPO₄, was used. This standard formulation was chosen because it mimics the major inorganic components of human sweat, providing a controlled and reproducible matrix for electrochemical measurements. The study evaluates the LSG electrode’s performance across an L-Histidine concentration range from 3.2 mM to 50 mM, which encompasses and extends beyond the reported physiological range, allowing for a comprehensive characterization of the sensor’s performance. We anticipate that this optimized LSG electrode fabrication approach will enable the development of high-performance, user-friendly, and disposable wearable biosensors for real-time, non-invasive health monitoring applications in sweat analysis.

2. Materials and Methods

The experimental configurations are shown in Figure 1. LSG electrodes measuring 2 (cm) in length and featuring either 4 (pt), 1.4 (mm), or 2 (pt), 0.7 (mm), widths were manufactured using an Epilog Mini 12x24 60-Watt CO2 laser cutter (Epilog Corporation, CO, USA). The electrodes were inscribed on 5 (mil) thick Polyimide film (Polyimide Kapton Film). The Polyimide film was bonded to PET and vinyl films using clear polyester double-sided adhesive tape (ARcare® 90106, Adhesives Research, Glen Rock, PA), with the aim of avoiding temperature induced deformation of the film and changes in the focus plane during manufacturing. Electrode designs were created in CorelDraw (Corel Corporation, Ontario, CA) and transferred to the Epilog software (Epilog Job Manager 1.3.6). Electrochemical measurements were performed using a Squidstat Plus potentiostat (Admiral, USA). Raman spectroscopy measurements were performed using an i-Raman Plus 532S Raman spectrometer (B&W Tek, DE, USA). The first experimental setup employed a three-electrode system with LSG as the working (W), Pt (A115-digi-ivy) as the counter (C), and Ag/AgCl (A111-digi-ivy) as the reference (R) electrodes. Electrochemical measurements were taken in 10 (mL) of a 20 (mM) K3Fe[CN]6 solution in 0.1 (M) KCl (Millipore Sigma, Merck KGaA, Darmstadt, Germany) serving as the electrolyte for electrode characterization, Figure 1b. The second experimental set-up used two LSG electrodes, manufactured at the optimal settings, as both W and C electrodes, with silver ink (CW100P silver-based ink) as R, Figure 1c,d. In the second set-up, a cover with 2 (mm) diameter holes and a rectangular chamber were used in place of a laboratory flask to reduce and control the deposited electrolyte volume.

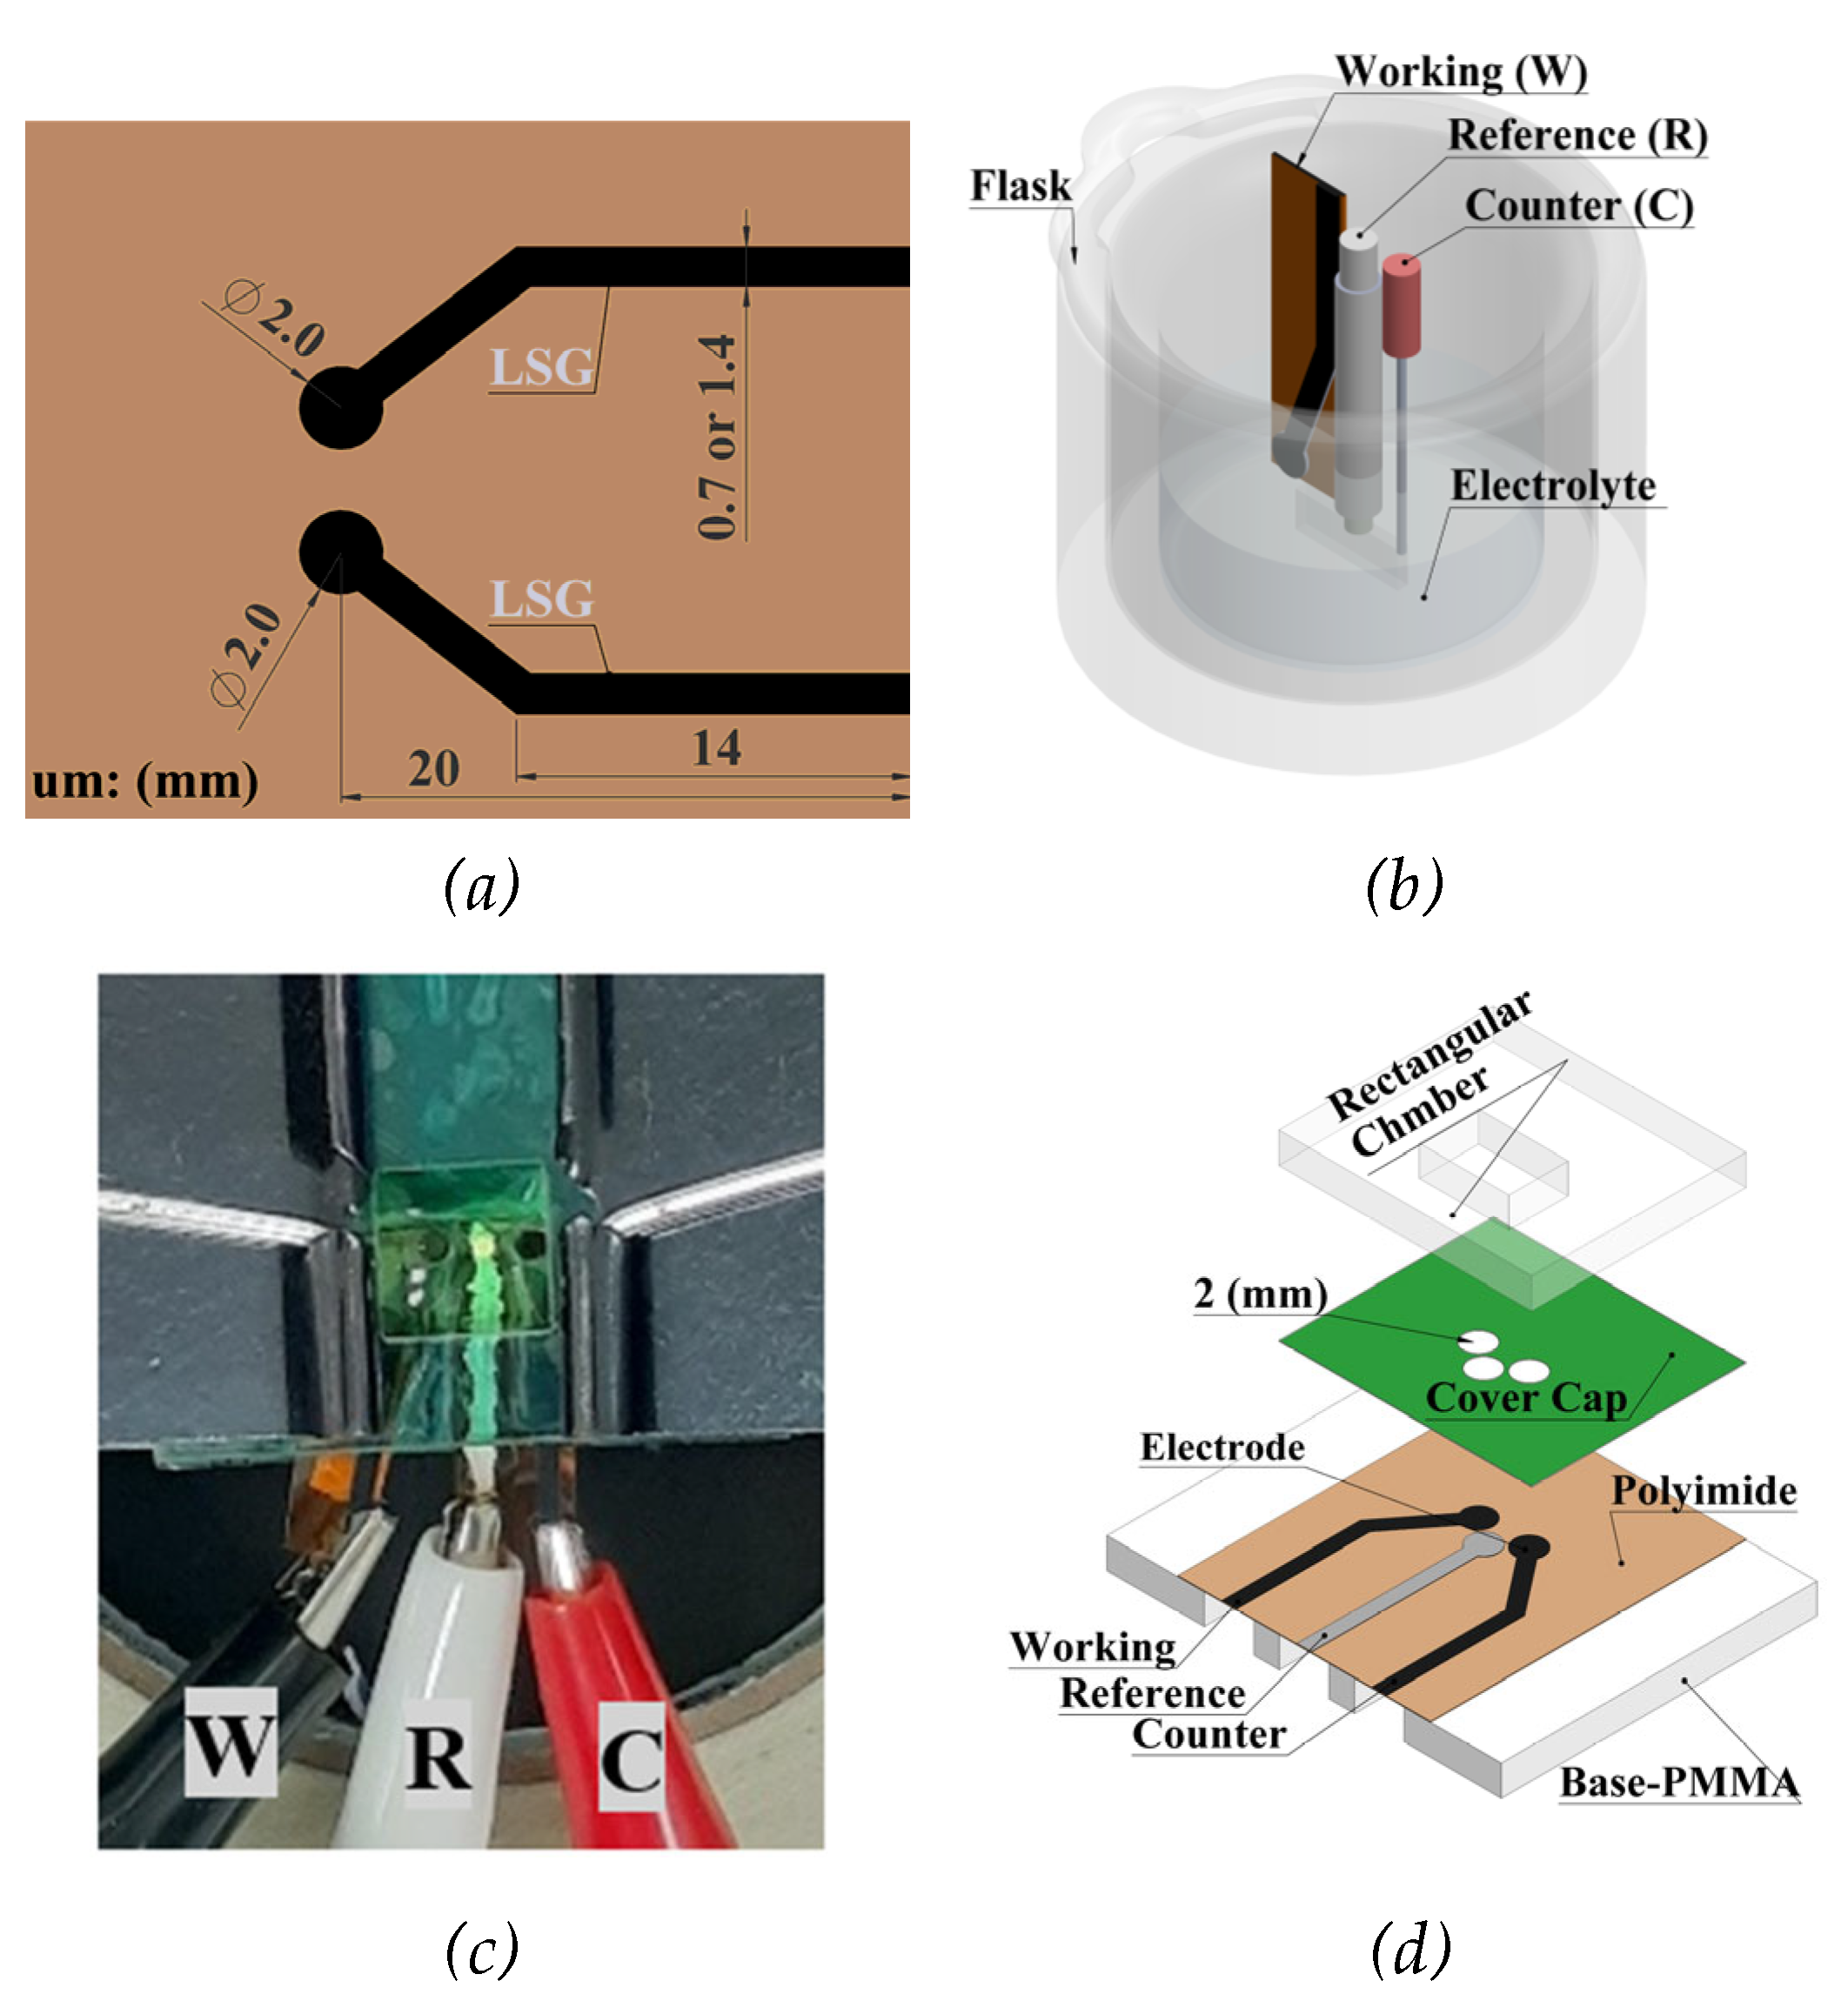
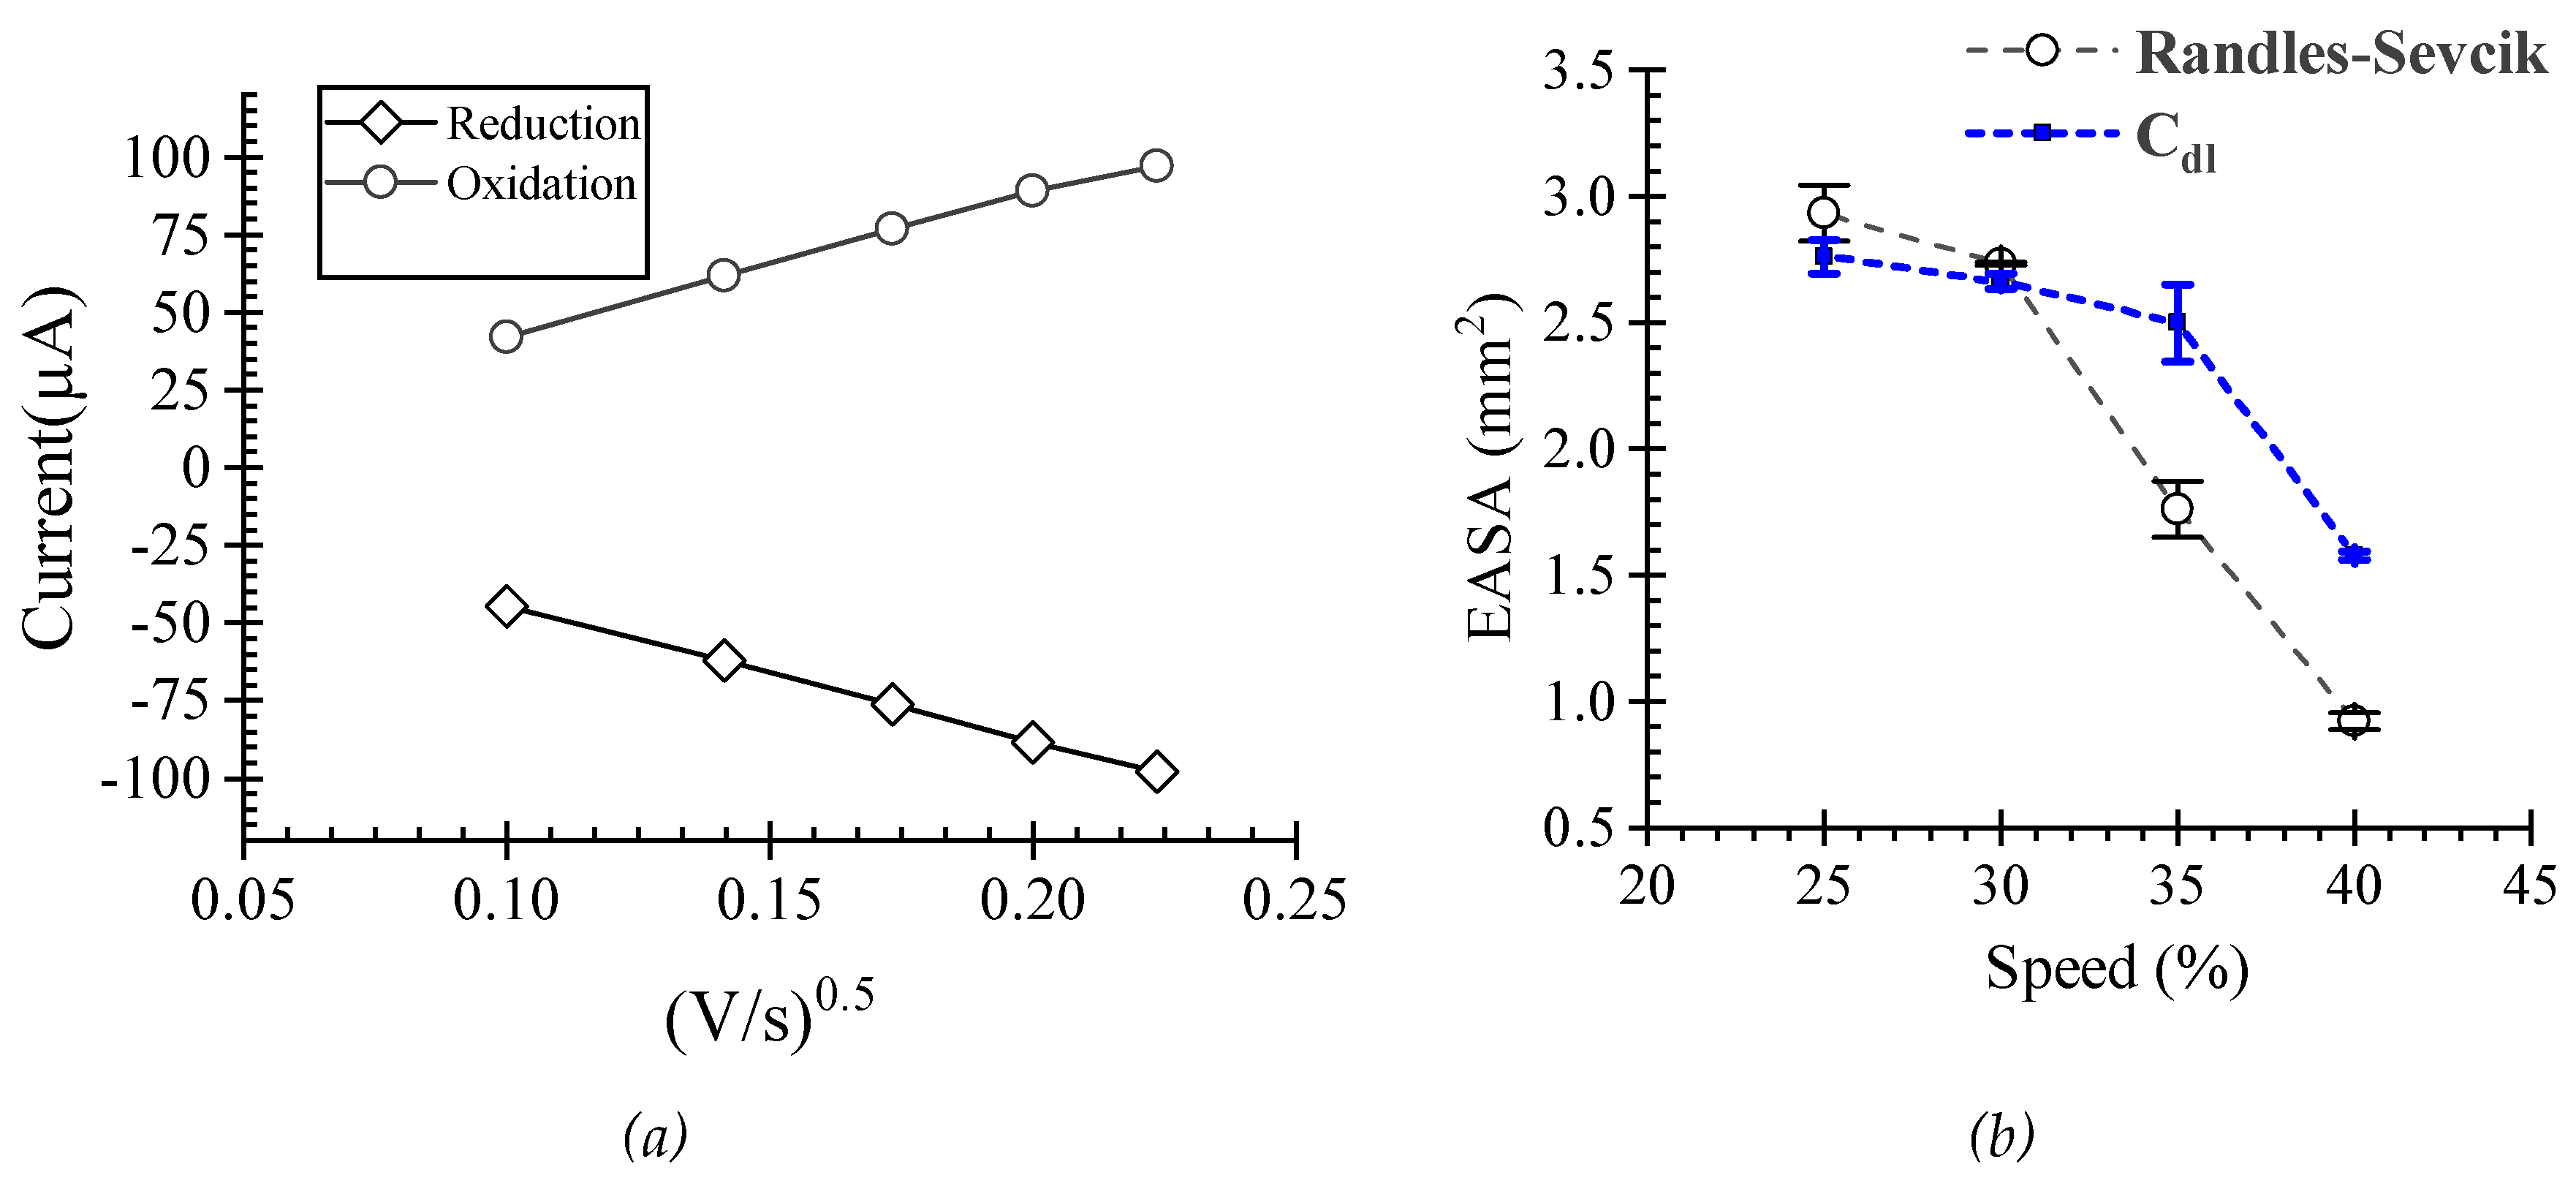
Electrochemical Characterization

Cyclic voltammetry measurements were conducted using a solution of 20 mM K3Fe[CN]6 in 0.1 M KCl as the electrolyte. Potential sweeps ranged from -0.4 V to 0.6 V at varying scan rates (10, 20, 30, 40, 50 mV/s) to determine the redox current Ip (A). These measurements facilitated the calculation of current density, Jp (A/m²), and the EASA. The Randles- Sevčik equation was used to approximate the EASA as described by Equation (1),
I p = 26.86 x 10 4 n 3 / 2 D 1 / 2 v 1 / 2 C A R S
where I p (Amperes) is the redox current peak, n is the number of electrons contributing to the redox reaction ( n = 1 in this case), D (cm2/s) is the diffusion coefficient (7.6x10⁻⁶ cm2/s ), v (V/s) is the scan rate, C (mol/cm3) is the concentration of the probe molecule and AR-S is the estimated EASA using the Randles-Sevčik equation.
The capacitance method using Equation (2) validated the EASA results,
A c = C d l C s
where C d l (F) is the double-layer capacitance, estimated from the slope of the capacitive current versus scan rate plot in the non-Faradaic region (-0.2 V to -0.1 V), C s (F/cm2) is the specific capacitance, calculated from the area under the voltammogram curve within the Faradaic window (-0.4 V to 0.6 V), and A c is the estimated EASA calculated using the capacitance method.

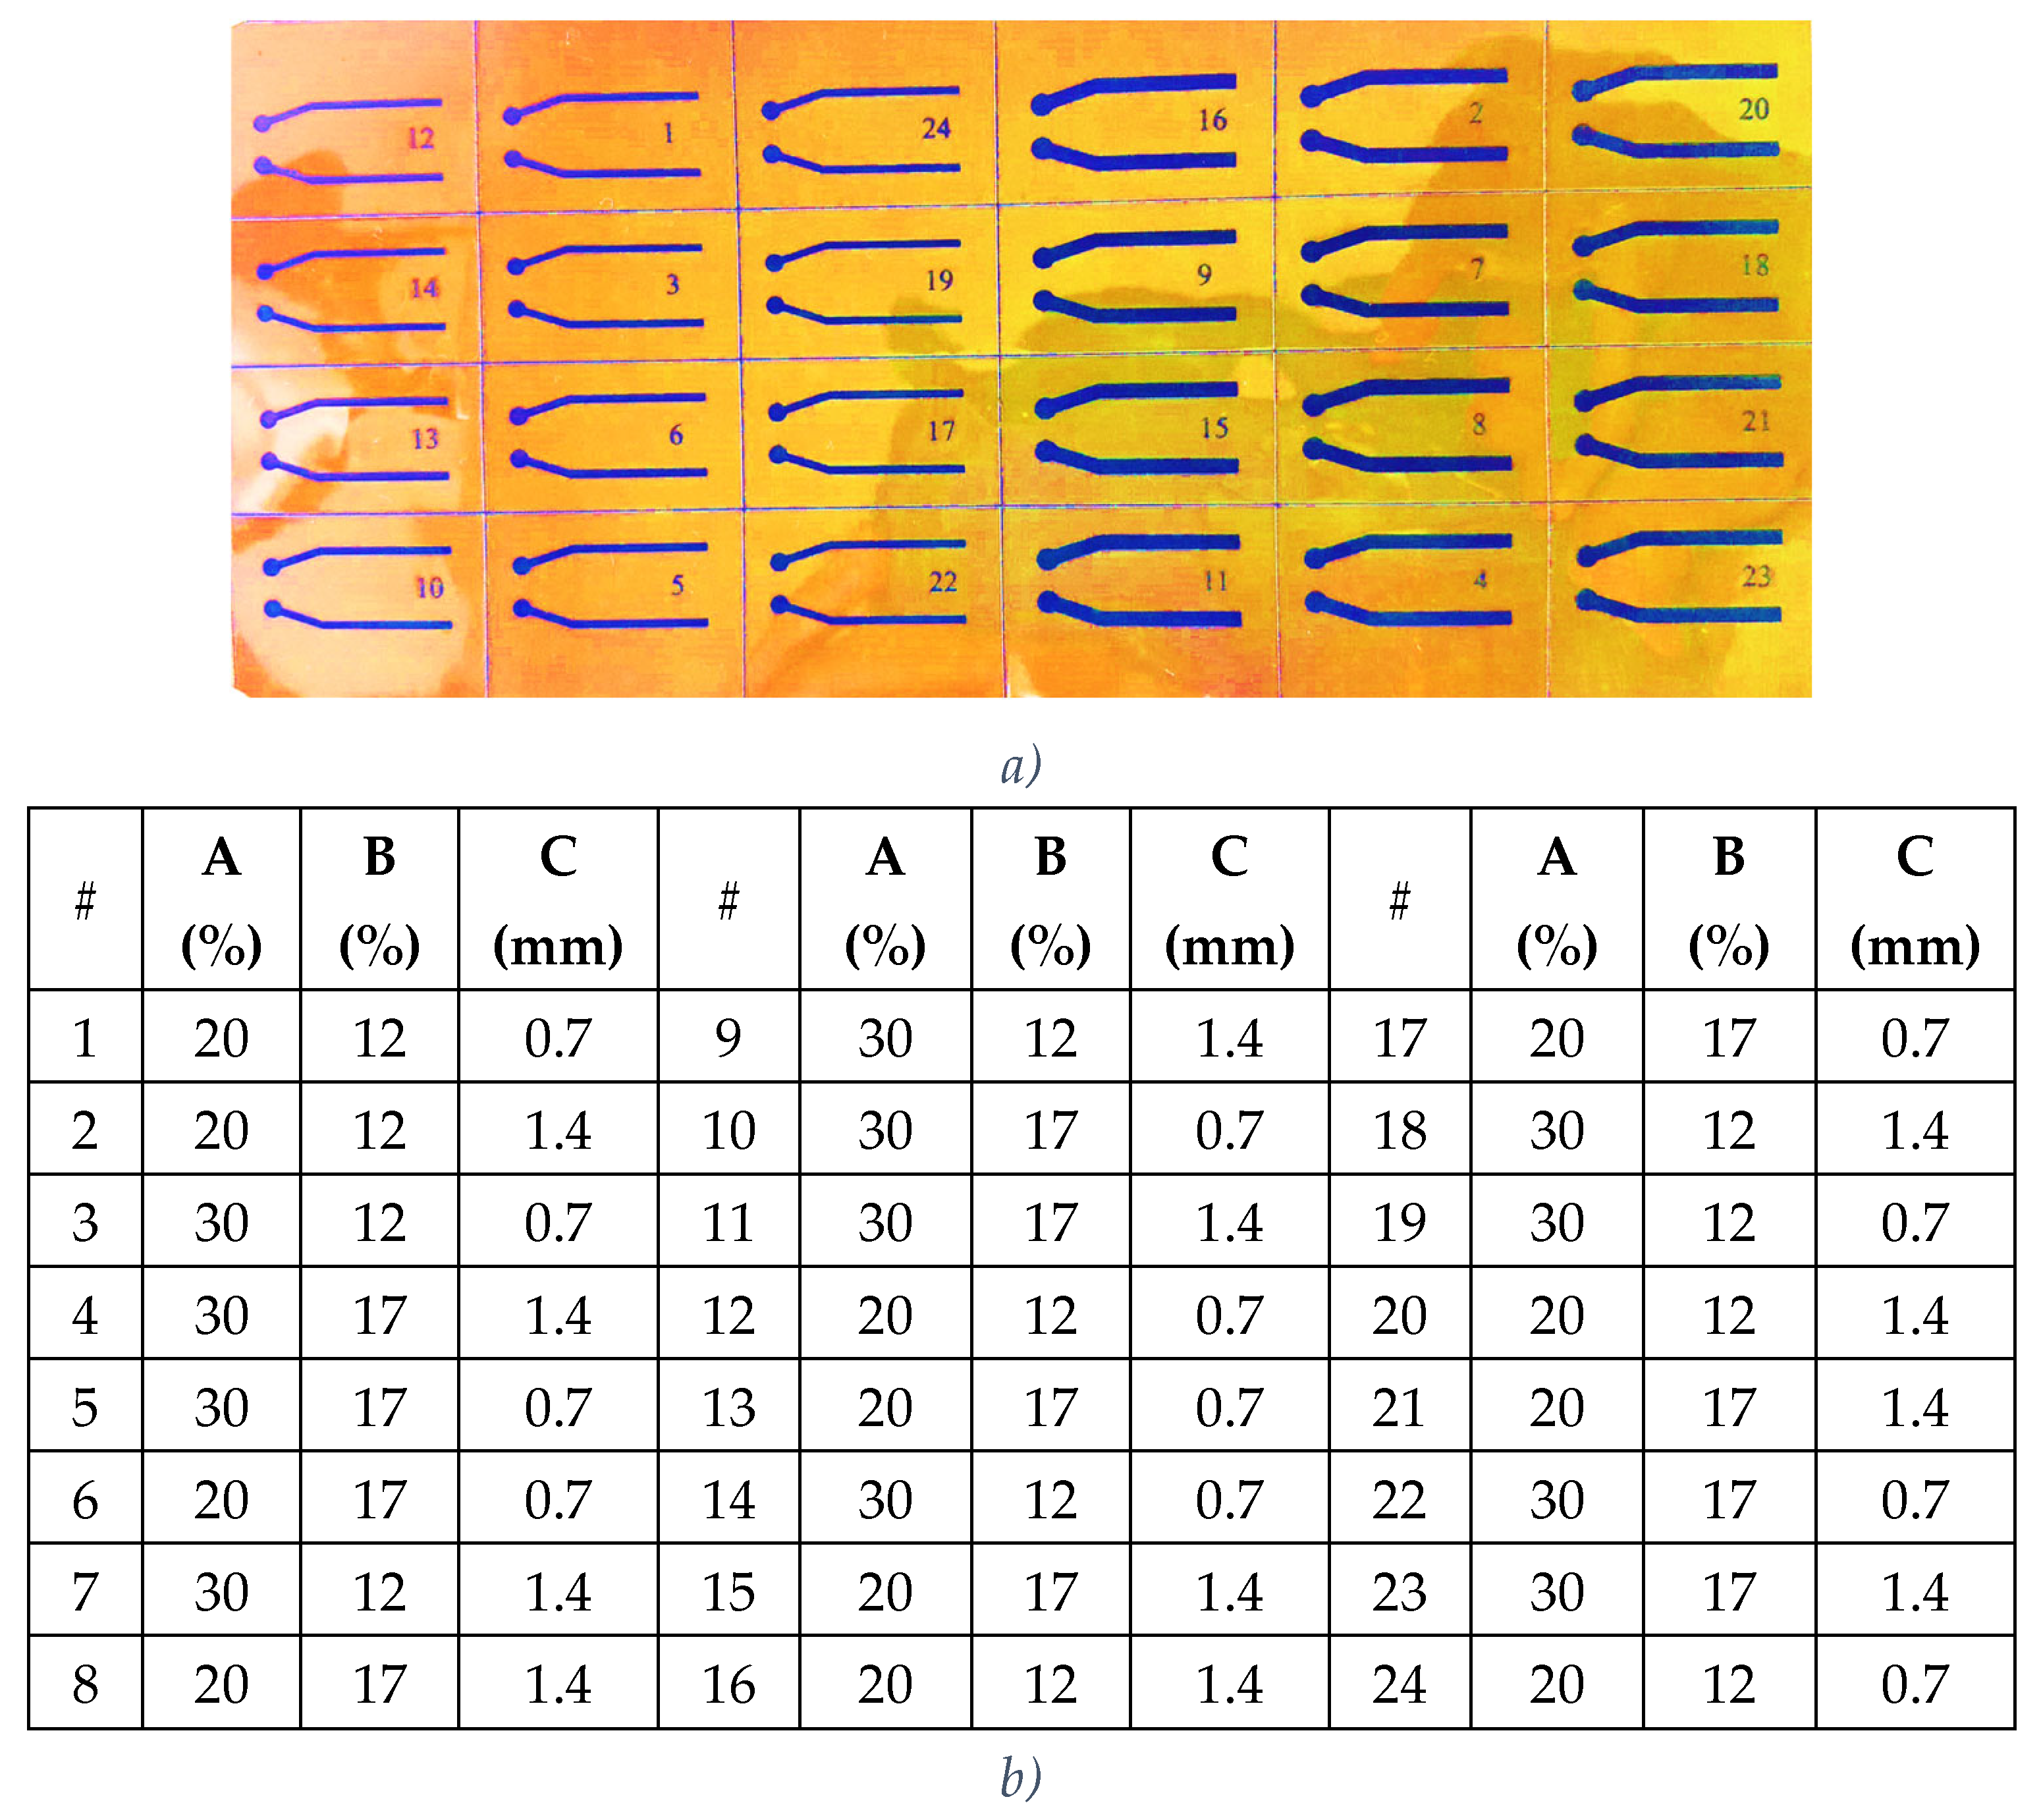
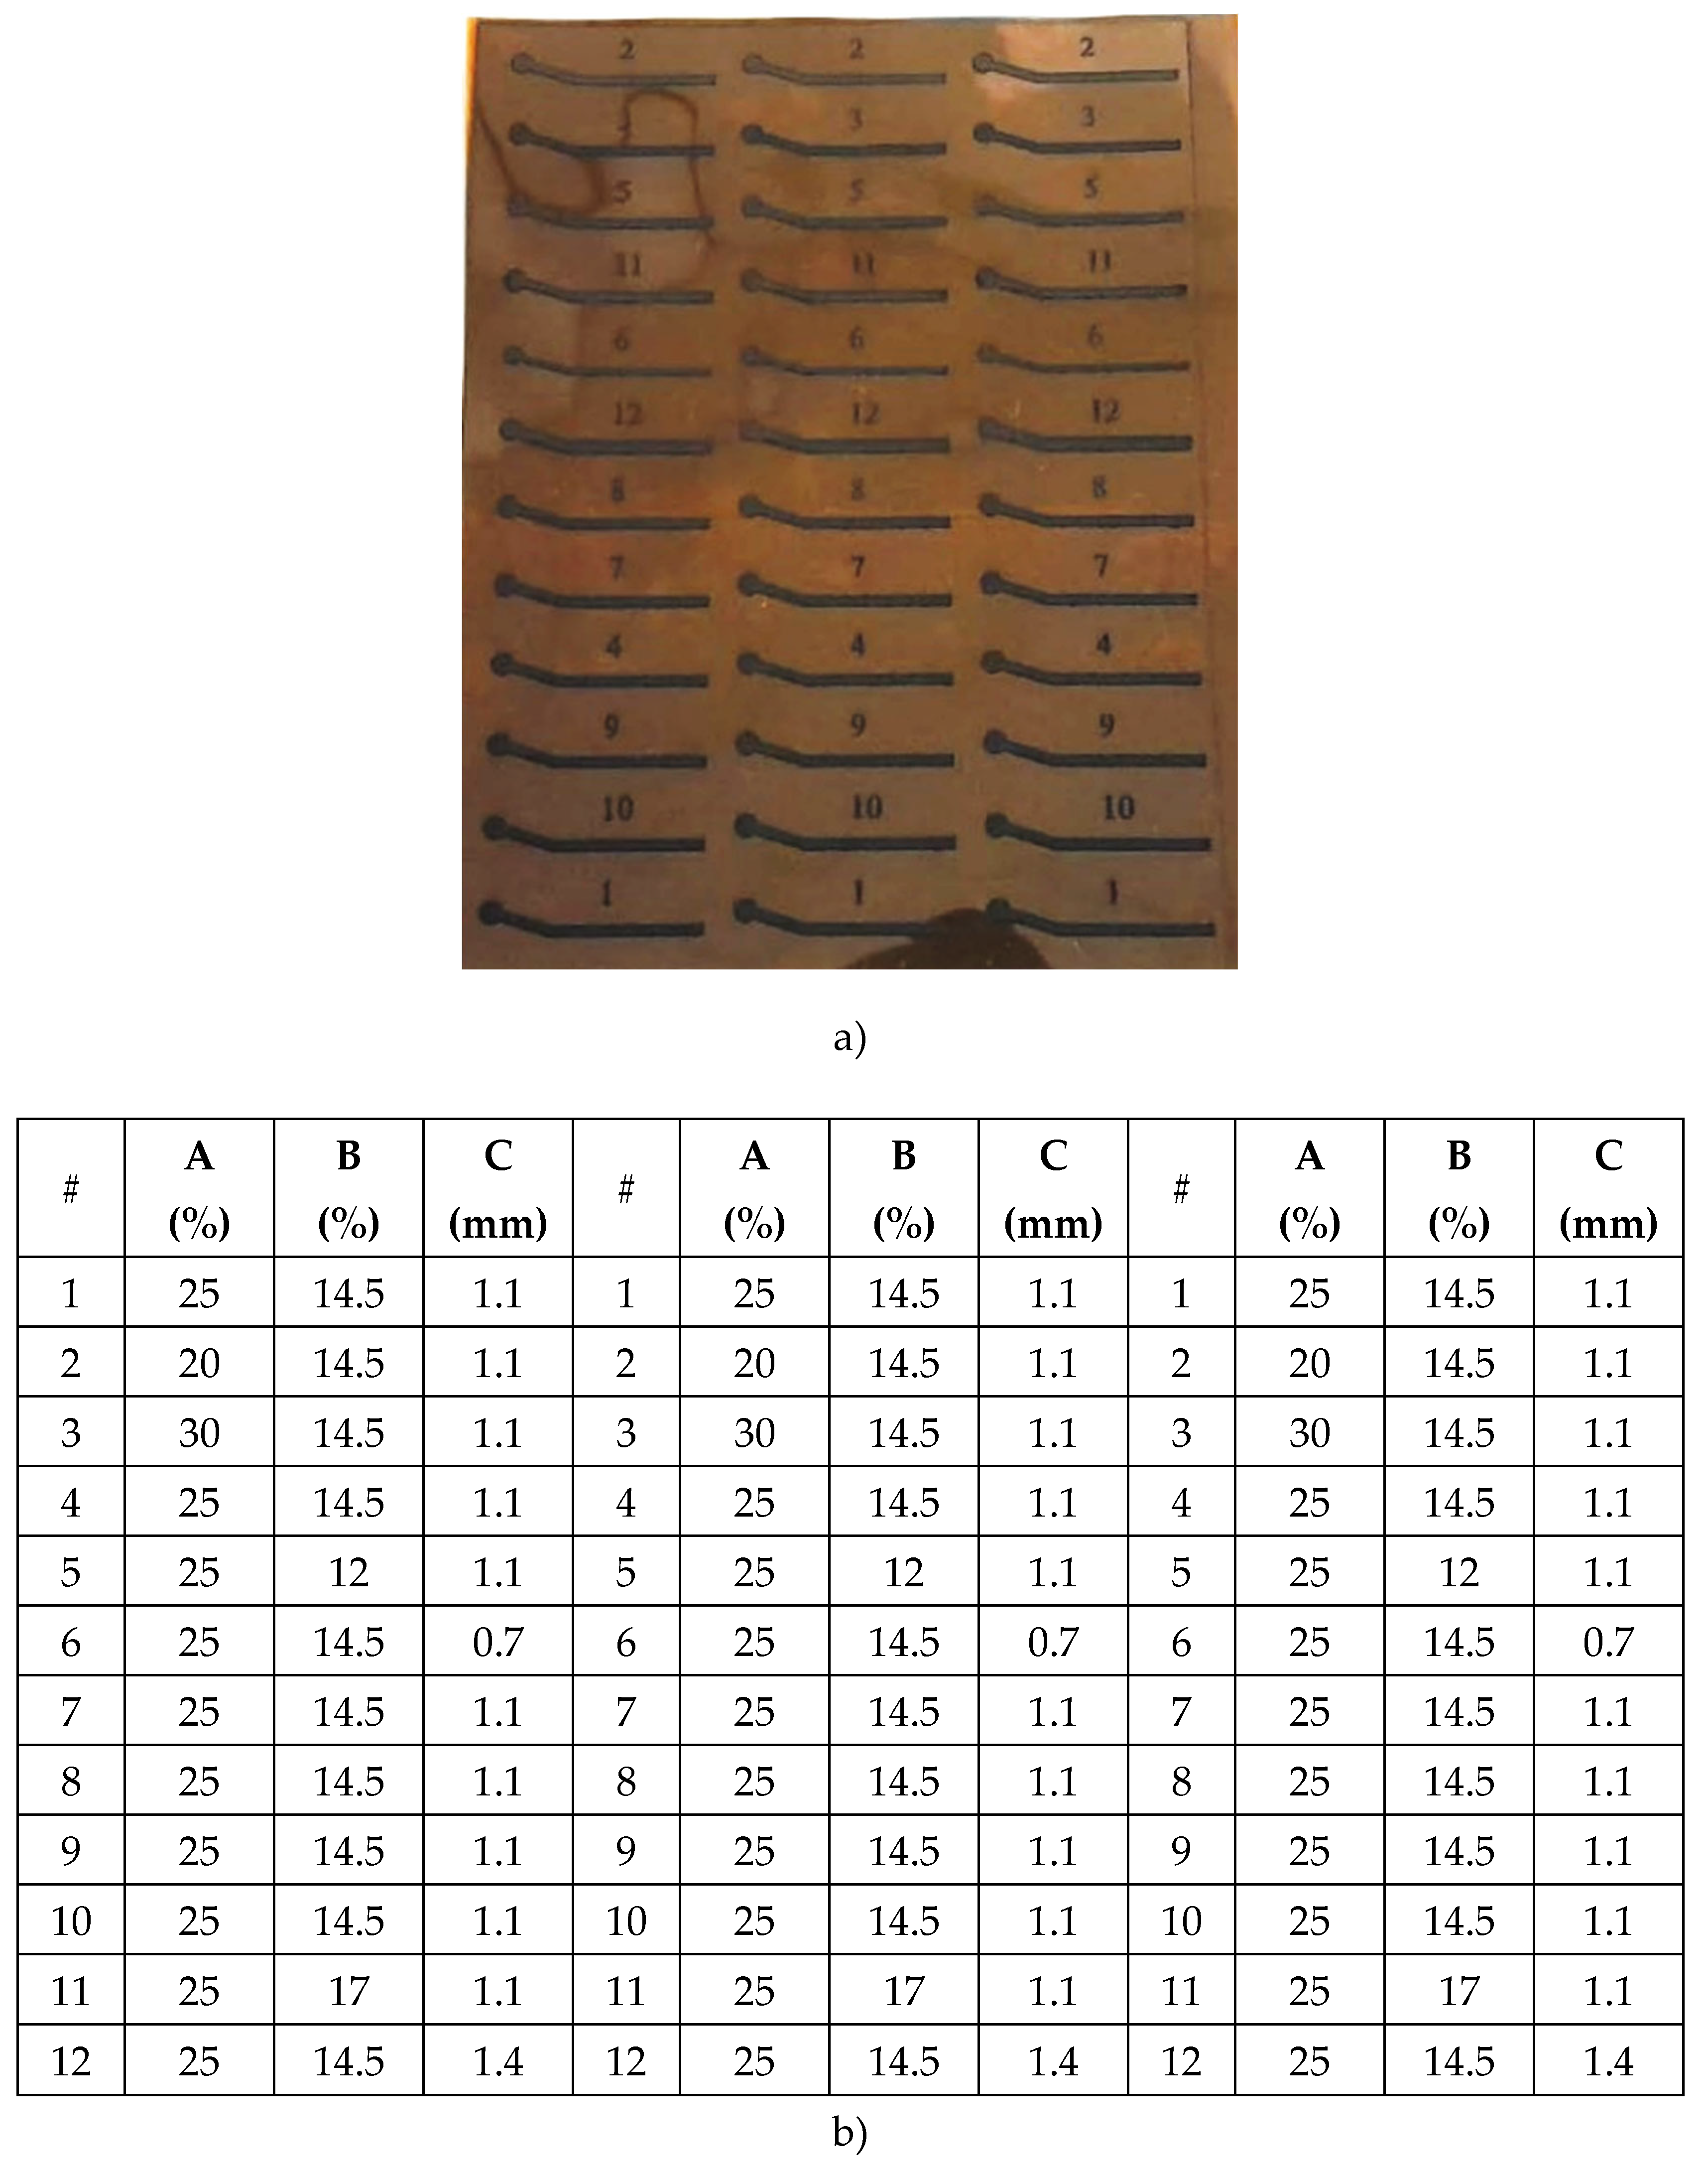
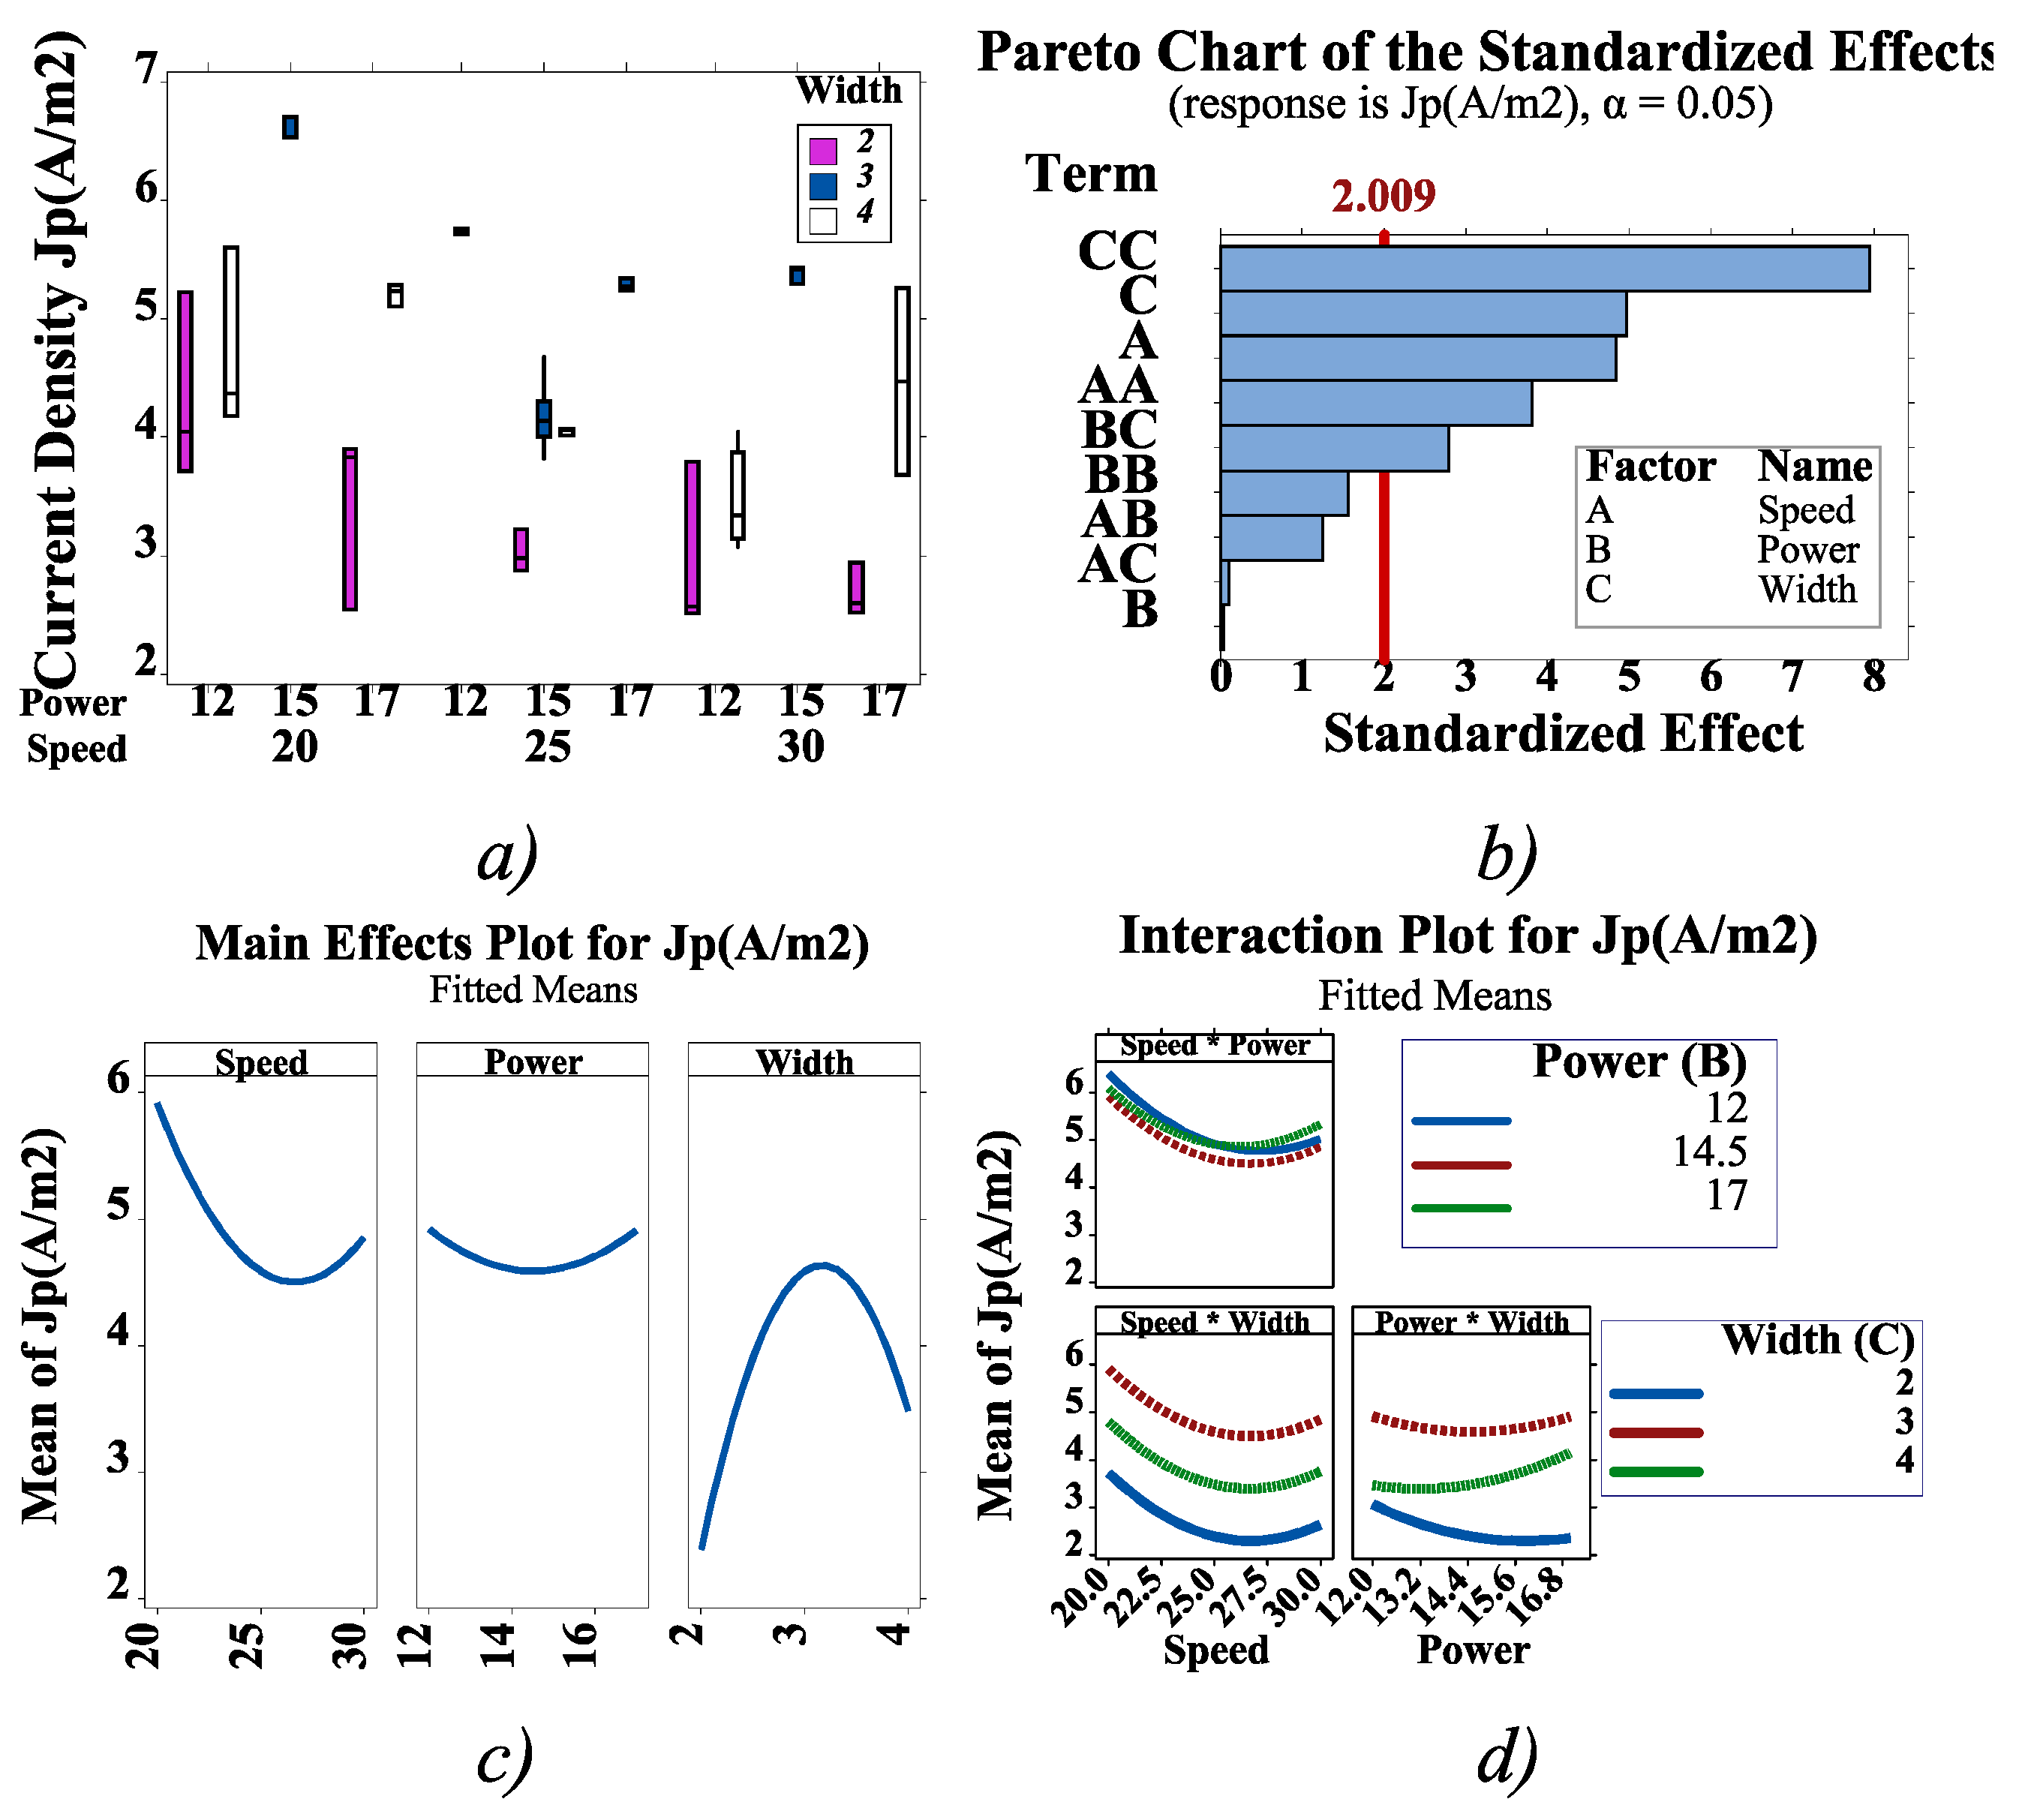
Design of Experiments Using FFD and CCD
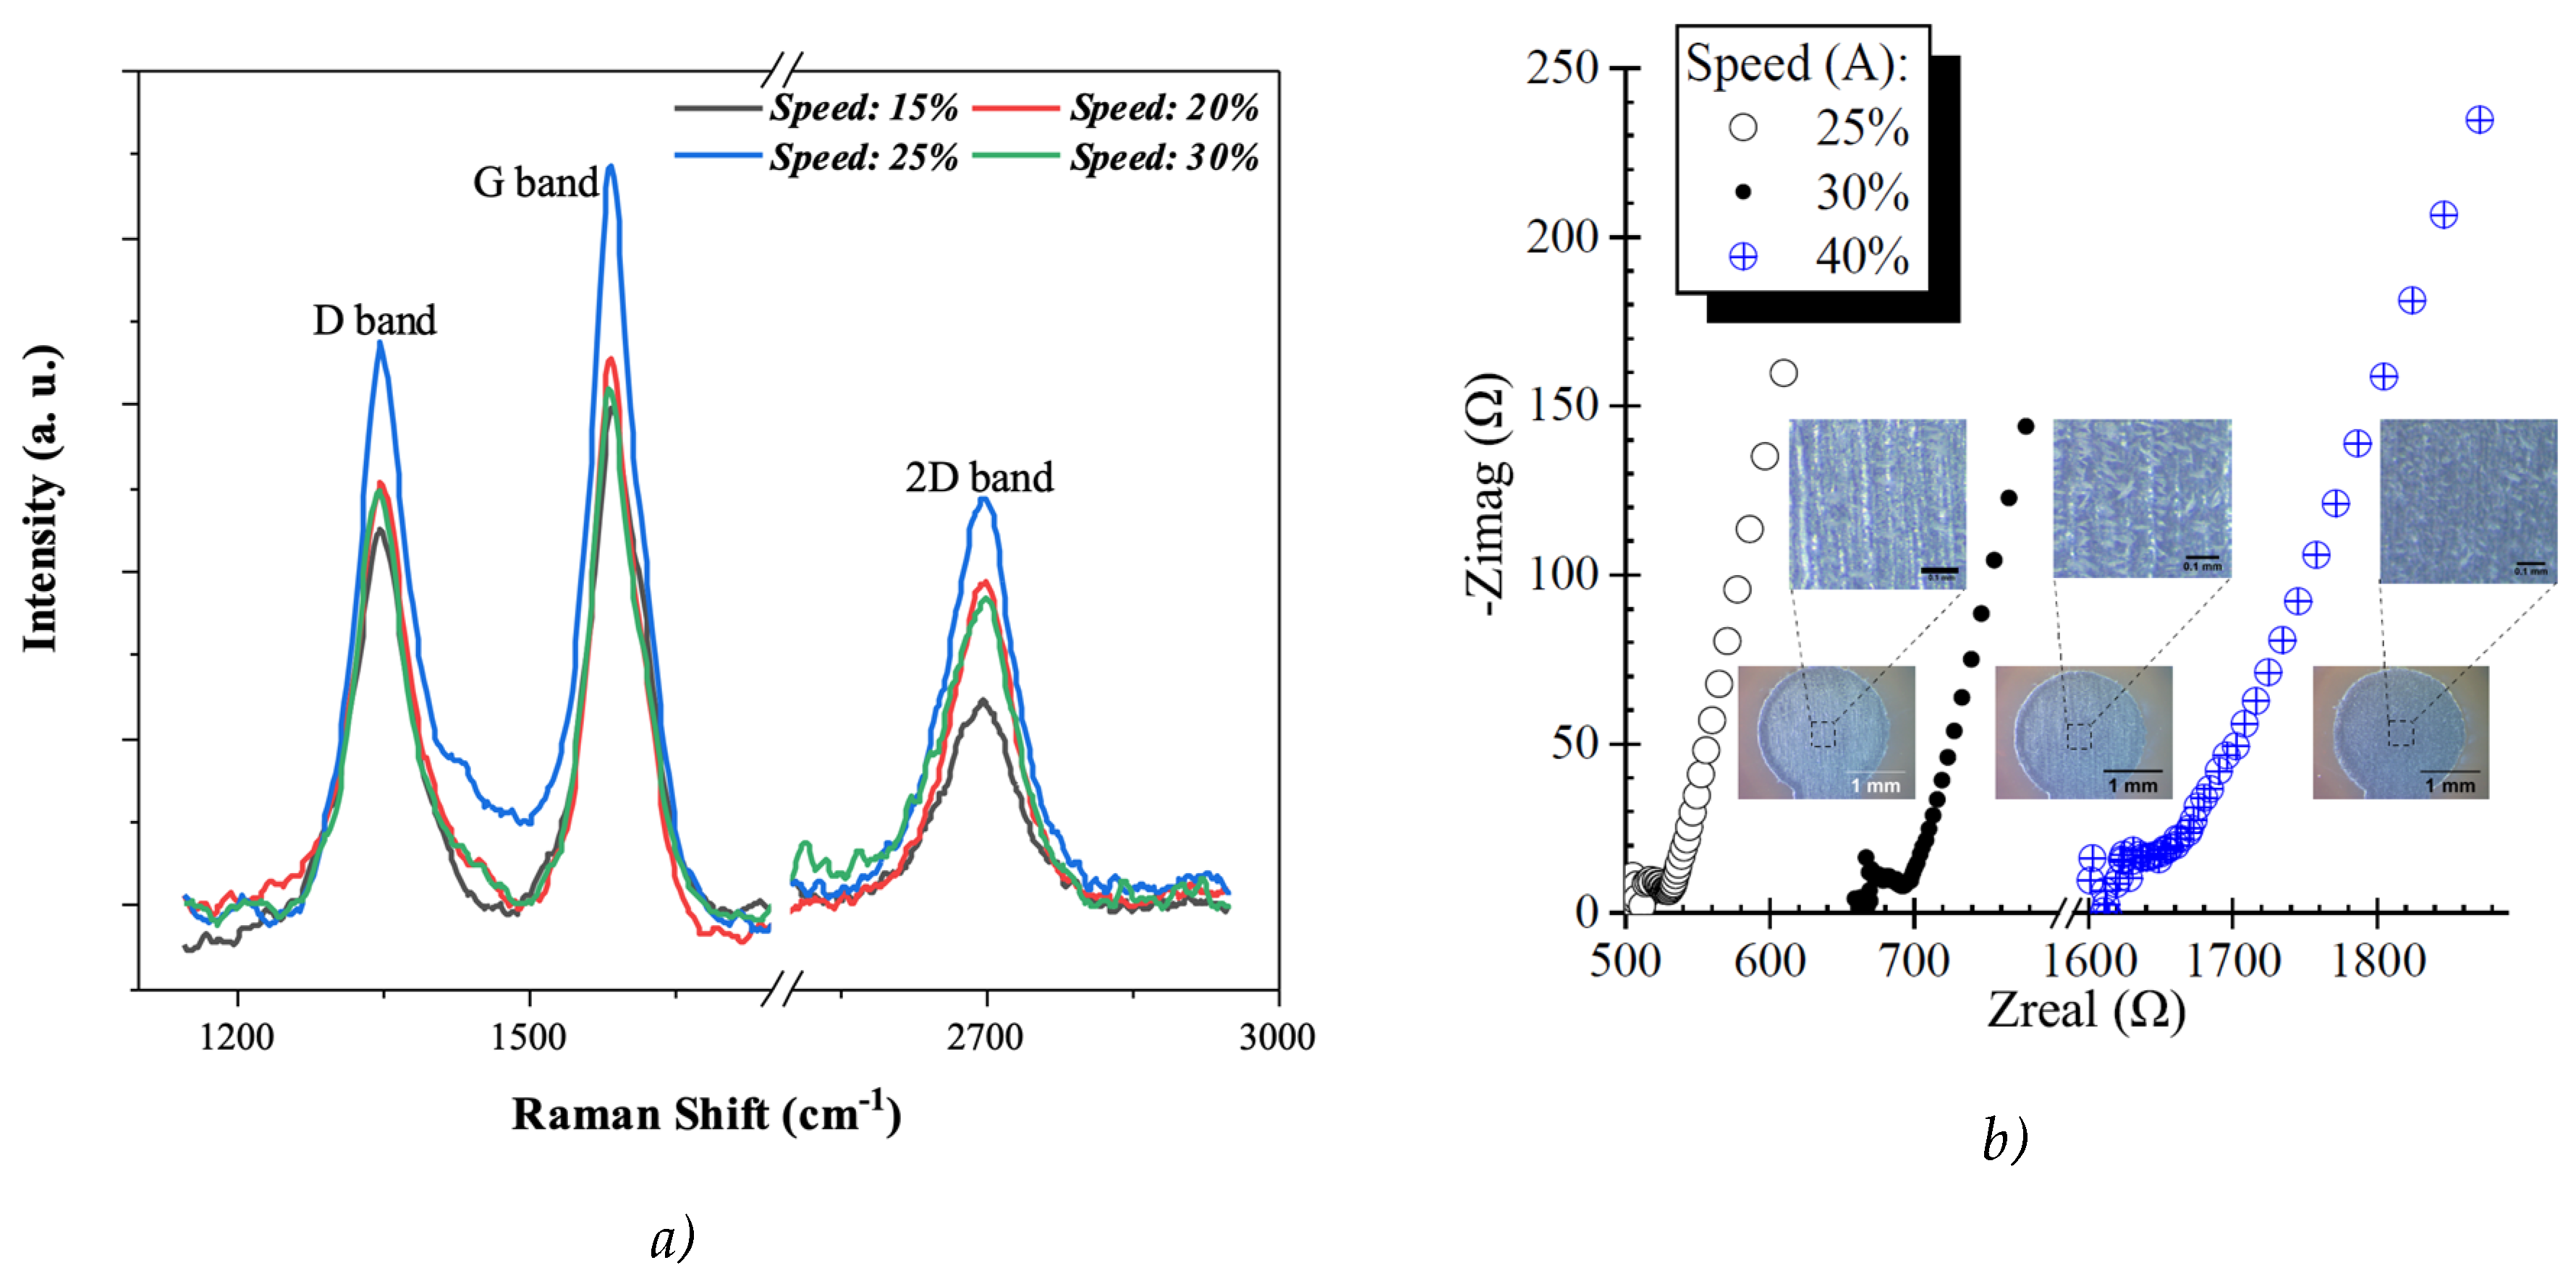
The Epilog laser cutter uses five parameters to control the manufacturing process: laser head speed (A), laser power (B), the drawing’s dots per inch (DPI), the electrode width (C) as drawn on CorelDraw, and laser focus (D). Identifying the most relevant manufacturing parameters was done by measuring the peak redox current (Ip), and EASA from electrodes made from different manufacturing parameter combinations. Two parameters were maintained constant; the DPI at 1200 DPI and D on the focus plane of the laser system (laser was focused manually using the Epilog focusing tool). Experiments were conducted by varying the three manufacturing parameters laser head speed (A), laser power (B) and electrode width (C) to “high” and “low” settings. The values for “high” and “low” for each parameter were chosen based on experience.
A 23 FFD was implemented using Minitab Statistical Software (Minitab, LLC, PA, USA) to determine the effect of A, B, and C for each configuration evaluated. The first configuration used laser head speeds (A) of 20% and 30% of maximum (83.33 mm/s maximum speed, measured experimentally), laser power (B) levels of 12% and 17% of maximum power (60 Watts), and electrode widths (C) of 2 (pt), 0.7 (mm), and 4 (pt), 1.4 (mm), yielding the electrode matrix shown in Figure 2. Electrodes were manufactured in randomly selected locations according to the labeled number, from 1 to 24. One of each pair was used as the working electrode to measure Ip using a scan rate of 10 (mV/s) from -0.4 (V) to 0.6 (V) for the first experimental set-up, shown in Figure 1b.
In a second analysis, central regions of the design are explored using CCD, which involves a total of 36 experiments. These experiments consist of six in the face-centered region and six in the central design, with three replicates for each one, as shown in Figure 3.

Raman Measurements

Raman measurements were obtained using an i-Raman Plus 532S Raman spectrometer with a laser of 532 (nm) and coupled to a microscope using a 20x objective, to focus on the electrodes and reduce the effect of the polyimide. The acquisition conditions were 30 (s) integration time, three scans, and 25 (mWatt) laser power. Spectra were preprocessed with smoothing using Savitzky-Golay with an 11-point window, then normalized with standard normal variate (SNV), and baseline corrected. Z. Xu et al. [40] presented the equation of penetration depth for different wavelengths (d_p= 2.3/2α), where α corresponds to the absorption coefficient (α= 4πk/λ), k is the extinction coefficient, and λ is the wavelength [41]. For graphene and graphite structures the extinction coefficient has a value of k=1 and k=1.3, respectively [42]. Therefore, for the 532 (nm) laser, the penetration depth of the carbon-based electrodes will be between 37 – 49 (nm).

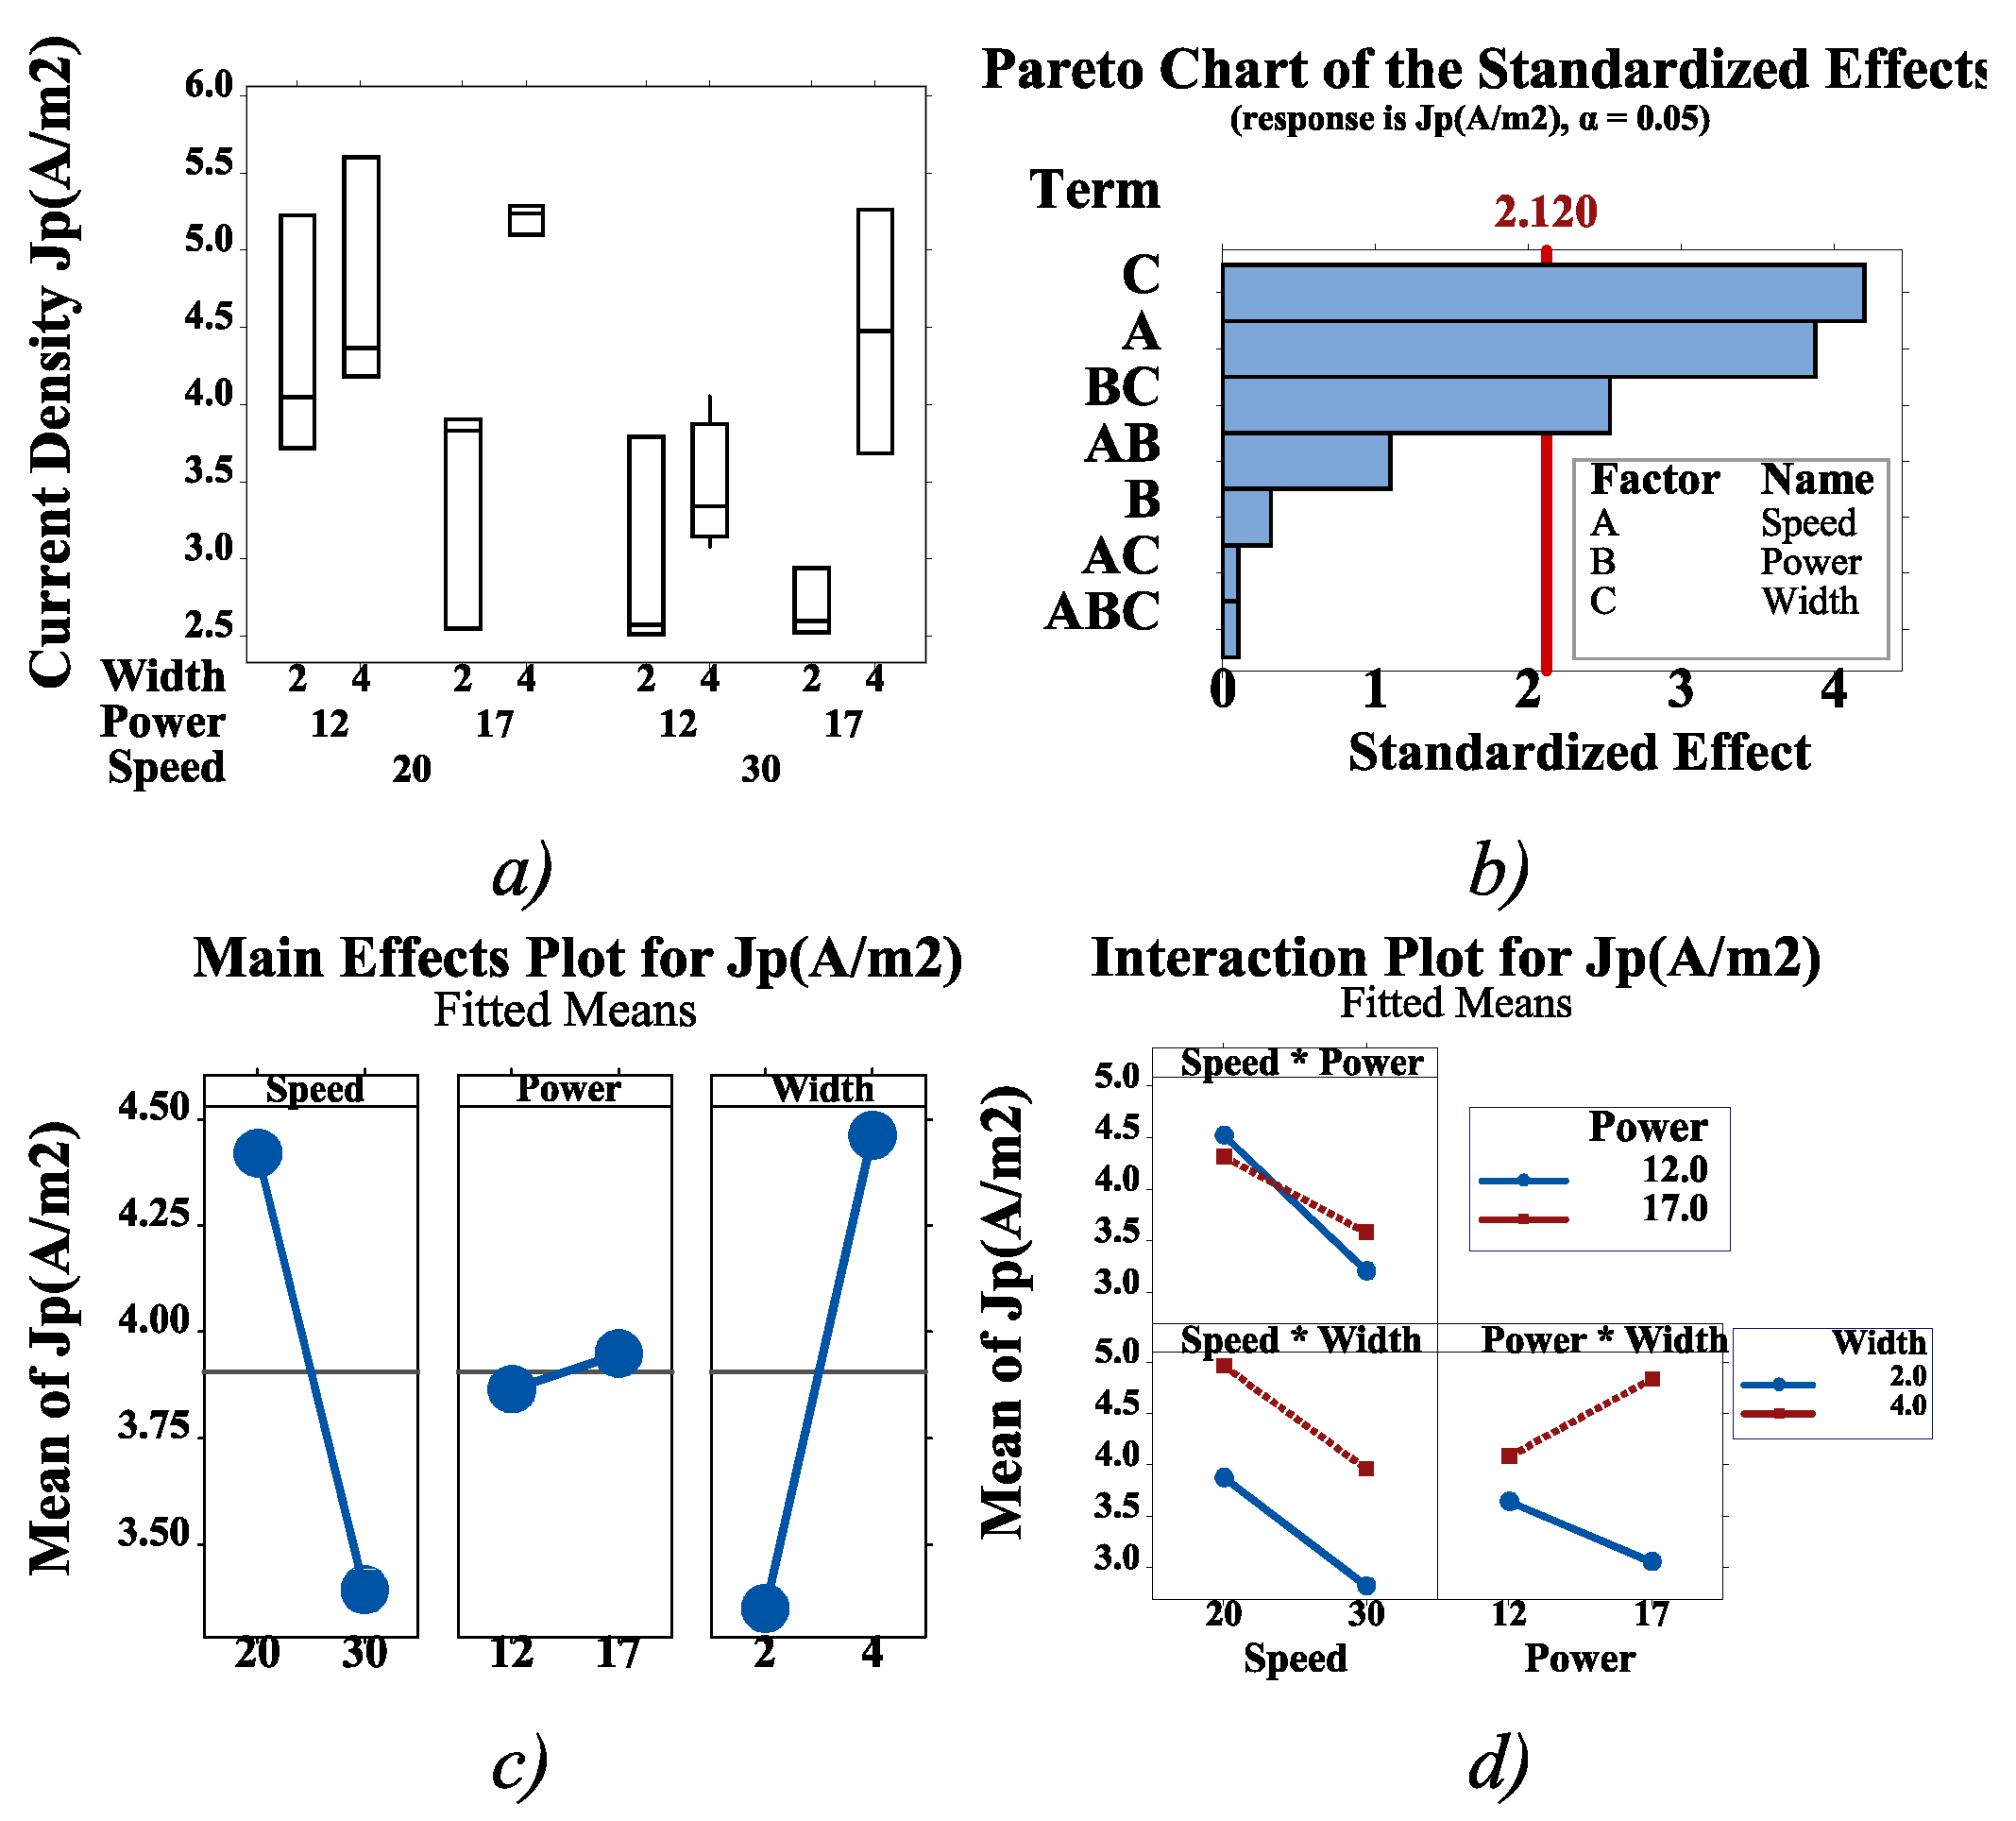
3. Results ad Discussion

Figure 4a shows a box plot illustrating the relationship between the manufacturing parameters and the normalized redox current density, denoted as Jp (A/m2). Jp is calculated by dividing Ip by the geometric area of the electrode that is in contact with the electrolyte. The absence of outliers in the data indicates consistent current density under the different manufacturing conditions. Using a 95% confidence level, the Pareto chart in Figure 4b identifies that the most significant manufacturing parameters were the electrode width (C), the manufacturing speed (A), and the interaction between power and width (BC). The relevance of speed, power, and width is further evaluated in Figure 4c revealing that a high C level and a low A level allow a high Jp. Power (B) was not a relevant manufacturing factor for the values used. However, power (B) becomes a relevant parameter when interacting with the electrode width (C), as demonstrated in Figure 4d. Therefore, a preliminary conclusion is that the best configuration corresponds to a high electrode width (C, 4pt) and low laser head speed (A, 20%). Changing the power levels from 12% to 17% did not have a significant effect. Therefore, laser speed seems to be a more relevant manufacturing parameter than power, at least for the values chosen.
Figure 5a shows a box plot illustrating the relationship between the manufacturing parameters and the measured current density, Jp (A/m2). The absence of outliers in the data indicates that the current density remains consistent across the different manufacturing conditions. Using a 95% confidence level, the Pareto chart in Figure 5b again identifies electrode width (C) and laser speed (A) as the most significant factors for electrodes manufacturing, validating the FFD analysis. Additionally, laser power (B) and the associated interactions show no statistically significant effects. Figure 5c identifies the main effects of speed, power, and width settings on Jp. The CCD identifies a low-speed setting, 20%, and a medium width, 3 (pt), as the values that achieve the highest Jp. Figure 5d shows the interaction effects between speed, power, and width. Varying the power from 12% to 17% seems to have little effect on Jp. A low speed, 20%, and a width of 3 (pt) achieve the highest Jp, for the ranges chosen.
The curvatures in Figure 5c show that the effect of the manufacturing parameters on Jp is nonlinear, suggesting that there are optimum parameters for optimizing electrode performance. In general terms, using the knowledge gained from the CCD and the FFD, we can state that slower and wider are better than faster and thinner, in terms of electrode performance. Therefore, the next experiment uses constant values of width, 4 (pt), and power, 12%, to further explore the effect of laser head speed on electrode performance.
Both FFD and CCD experiments show that laser head speed is the most important laser-related manufacturing parameter for producing electrodes having a high Jp. Therefore, a new set of experiments calculates the EASA for electrodes made using four different laser speeds (25%, 30%, 35%, and 40%) while maintaining the other parameters constant at power 12%, width 4 (pt), DPI at 1200, and laser focus on the focus plane. As an example, Figure 6 shows the cyclic voltammetry results for a value of 25% speed, evaluated using different voltage rates (10, 20, 30, 40, 50 (mV/s)).
The redox current peak magnitudes, Figure 7a, were obtained for each manufacturing speed at each scan rate, and used to compute the EASA, following equation ( 1). Additionally, the capacitive current, measured in the non-Faradaic region at the same scan rates, was used to determine the double-layer capacitance Cdl for each electrode manufactured at different laser speeds. Similarly, the specific capacitance Cs was estimated (74.1 µF/cm2). These values were applied in equation (2) to validate the EASA results obtained from equation (1). Figure 7b shows the EASA as a function of laser speed for both methods described in Equations (1) and (2) showing that the lowest laser speed achieves the highest EASA. The best results were, 2.93 ± 0.11 mm² and 2.76 ± 0.07 mm² for Equation (1) and (2) respectively, both obtained at a laser head speed of 25%. This finding aligns with the preliminary conclusion that lower laser speeds increase the redox current Ip, current density Jp, and, in this case, EASA. Given that the electrode width also plays an important role in EASA, a refined preliminary conclusion is to design “wider” electrodes at “slower” laser speeds to achieve a relatively high Ip, and EASA. The definition of “wider” and “slower” will depend on the laser equipment used and the intended application.
Raman spectroscopy experiments were carried out on the LSG electrodes to obtain information on the material properties, disorders, and defects produced in the electrodes by the laser ablation manufacturing process. Figure 8a shows the Raman spectroscopy measurements for electrodes manufactured at 15%, 20%, 25%, and 30% speed, 12% power, 4 (pt) width, 1200 DPI, and focused laser. Results show three characteristic peaks of graphene and graphite, known as the D, G, and 2D bands, located around 1349, 1586, and 2700 (cm-1), respectively. Peaks D and G are characteristic of graphite materials. Peak D is not present in bulk graphite, the detection of this band indicates imperfections in the material, which are associated with defects in carbonaceous systems with sp2 hybridization [43,44]. The G band indicates that there is a structure derived from graphite and is associated with the vibrations of the sp2 carbon atoms [41]. The 2D band is produced by the second-order resonance of the D band [44]. This band is used as a simple and efficient method to confirm the presence of a single graphene layer [41]. The work by Abdulhafez et al. [45] suggest that the Raman spectra shown indicate the formation of graphene domains in an anisotropic cellular network of 3D graphene. The ID/IG ratio for the different speeds was approximately 0.8, which may indicate that the electrodes present a crystalline structure [44]. The I2D/IG ratios were less than 1, suggesting the presence of high defects and disorders in its crystal structure [41], in concordance with Abdulhafez et al. [45]. Overall, results suggest that these LSGs are mostly made of multiple graphene-based nanocarbon layers containing a high number of defects and lattice disorders. This can also be somewhat visually perceived by observing the carburized texture of the LSG electrode surface. Interestingly, the electrode manufactured with a 25% speed showed a greater intensity in the D, G, and 2D bands. This electrode also exhibited the lowest Jp in Figure 5c. Structural changes are expected to influence the electrochemical properties of the electrodes. Figure 8b shows electrochemical impedance spectroscopy (EIS) results for the three different laser speeds used. The electrodes measured were made using a constant power, 12%, and width, 3 (pt), while varying the speed (25%, 30%, 40%). The electrical resistance for the electrodes is the x-axis intercept in the Nyquist plot. Resistance decreases from 1.6 kΩ to 0.52 kΩ while decreasing the laser speed, concurring with the FFD and CCD that lower laser speeds improve electrode performance.
In the subsequent series of experiments, the setup depicted in Figure 1b was used to compare the performance of LSG electrodes with a standard electrode configuration. The manufactured LSG electrodes served as both the Working (W) and Counter (C) electrodes, while silver ink was employed as the Reference (R) electrode. The W and C electrodes were manufactured using 25% speed, 12% power, and a 4 (pt) width, based on the results from Figure 7b and Figure 8b. This electrode arrangement (LSG, Ag ink, LSG) was compared to a standard setup, featuring Pt as C, Ag/AgCl as R, and Glassy Carbon (GC) as W electrodes. Cyclic voltammetry experiments were conducted using K3Fe[CN]6 as the electrolyte at five different concentrations (0.56, 1.59, 3.38, 6.76, 13.51 (mM)) in 0.1 (M) KCl, with a scan rate of 50 (mV/s). The voltammogram obtained with standard electrodes (Pt, Ag/AgCl, GC) is presented in Figure 9a,b shows the voltammogram obtained with manufactured electrodes (LSG, Ag ink, LSG). The results underscore the capability of LSG electrodes to measure various electrolyte concentrations, as evidenced by the increase in Ip with concentration. Notably, LSG electrodes exhibit a more substantial increase in amplitude at each higher electrolyte concentration compared to the standard electrodes. Figure 9c provides a detailed comparison between the two experimental setups through a plot depicting the linear relationship between Ip and concentration. The data from Figure 9c reveals a higher redox current amplitude for LSG compared to GC at each measured concentration. Figure 10 displays the percentage increment of the manufactured electrodes compared to the standard electrode at each concentration. The percentage increments are computed according to the following relationship.
R e d o x P e a k   I n c r e m e n t = I L S G I G C I G C x 100
Where: R e d o x P e a k   I n c r e m e n t , is the percentage of Redox peak. I L S G , is the Redox peak measured with LSG as working electrode. I G C , is the Redox peak measured with GC as working electrode.
According to the Equation (3), the percentage increments in the reduction region are 662%, 596%, 218%, 134%, and 113%, while for the oxidation region are 702%, 602%, 210%, 127%, and 103% for the concentrations used, 0.56, 1.59, 3.38, 6.76, and 13.51 (mM), respectively. This suggests that LSG electrodes are particularly suited for detecting low analyte concentrations.
Finally, the selected LSG electrode, manufactured with a power of 12%, a speed of 25%, and a width of 4 pt, was employed to obtain voltammograms of artificial sweat for detecting varying concentrations of a single component (L-Histidine) without the need of a biorecognition molecule. These voltammograms were analyzed to investigate how the responses varied as a function of L-Histidine concentration within a range of 3.2 mM to 50 mM. Figure 11a displays voltammograms obtained at a scan rate of 50 mV/s for raw basic sweat, consisting of a mixture of 0.5% NaCl, 0.05% L-Histidine, and 0.50% Na2HPO₄. Voltage and current data, extracted from the acquired voltammograms, were normalized using maximum-minimum current scaling for analysis. The analysis revealed distinct current peaks for each L-Histidine concentration, as illustrated in Figure 11b. This figure demonstrates a linear relationship (R² = 0.987) between the current peak and L-Histidine concentration within the range of 8.3 mM to 50 mM. Concentrations below 8.3 mM exhibited non-linear behavior. Detection in this range could be carried out using other electrochemical techniques such as linear sweep voltammetry (LSV), pulse voltammetry (PV) and electrochemical impedance spectrometry (EIS).

5. Conclusions

This research focused on investigating the influence of laser cutter manufacturing parameters on the electrochemical and Raman characteristics of LSG electrodes. Initially, current density (Jp) served as the dependent variable while laser head speed, laser power, and electrode width were considered as independent variables. Experiments employing FFD and CCD revealed that electrode width is the most critical factor for achieving a high Jp, which is a key electrochemical parameter associated with Electrochemical Active Surface Area (EASA). Among the laser equipment parameters, laser head speed emerged as the most influential. The results demonstrated that a lower laser head speed (20%) led to the highest values of EASA. Therefore, we recommend manufacturing “wider” electrodes at “slower” speeds to obtain “better” electrochemical properties. However, it’s important for readers to consider size constraints specific to their applications, as well as the speed and power ranges of their laser equipment. The effect of varying the laser speed (25%, 30%, 35%, and 40%) was studied while maintaining the other settings constant; power 12%, electrode width 4 (pt), 1200 DPI, and a focused laser. Once again, the findings confirmed that the optimal configuration for achieving a high EASA is a lower laser speed. Raman Spectroscopy measurements suggest the production of graphene-based nanocarbon layers in a 3D anisotropic cellular network. Using the best manufacturing combination for obtaining high EASA, a pair of LSG electrodes was manufactured with a speed of 25%, power of 12%, electrode width of 4 (pt), DPI of 1200, and focused laser. The LSG electrodes were tested as working and counter in an electrochemical cell filled with K3Fe[CN]6 solution at varying concentrations (0.56, 1.59, 3.38, 6.76. 13.51 (mM)) in 0.1 (M) KCl. The results demonstrated a direct relationship between the redox current (Ip) and concentration, as expected. Notably, the LSG exhibited higher amplitudes for reduction compared to oxidation, as illustrated in Figure 9a,b. This indicates a greater flow of electrons from the electrode to the electrolyte at the electrode surface during the reduction process compared to the oxidation process. Consequently, the reduction reaction is favored and occurs more readily than the oxidation reaction under the experimental configurations employed. Another noteworthy observation is the percentage increase in the Ip signal of the LSG electrodes when compared to the standard electrodes, as depicted in Figure 9c and detailed in Figure 10. This effect is more pronounced at lower concentrations, with a peak increase of 698% observed at 0.56 (mM), compared to an increase of approximately 100% at the highest concentration tested, 13.51 (mM). This implies that LSG electrodes hold significant potential as biosensing electrodes for applications demanding high detection sensitivity or for detecting or monitoring low analyte concentrations. Building on this finding, the LSG electrode was tested to detect varying concentrations of L-Histidine in artificial sweat. The results demonstrate that L-Histidine can be detected proportionally to the current peak within a range of 8.3 mM to 50 mM. However, further analysis is required for detecting lower concentrations, such as using linear sweep voltammetry (LSV), pulse voltammetry (PV) and electrochemical impedance spectrometry (EIS) for accurate detection in this lower concentration range.

Author Contributions

Conceptualization,W.G.-R. and P.J.R.; methodology, W.G.-R., J.L.-R., K.E.-A, and P.J.R.; software, W.G.-R.; validation, W.G.-R.; formal analysis, W.G.-R.; investigation, W.G.-R., J.L.-R., K.E.-A, and P.J.R.; resources, E.N. and P.J.R.; data curation, W.G.-R.; writing—original draft preparation, W.G.-R.; writing—review and editing, W.G.-R. and P.J.R.; supervision, P.J.R. All authors have read and agreed to the published version of the manuscript.

Funding

This work was supported by the Center for the Advancement of Wearable Technologies (CAWT) through the NSF Award No. OIA-1849243.

Institutional Review Board Statement

Not applicable.

Data Availability Statement

The data presented in this study are available on request from the corresponding author.

Conflicts of Interest

The authors declare no conflict of interest

References

  1. Geim, A.K. Graphene: Status and Prospects. Science 2009, 324, 1530–1534. [Google Scholar] [CrossRef] [PubMed]
  2. Schwierz, F. Graphene Transistors: Status, Prospects, and Problems. Proc. IEEE 2013, 101, 1567–1584. [Google Scholar] [CrossRef]
  3. Novoselov, K.S.; Geim, A.K.; Morozov, S.V.; Jiang, D.; Katsnelson, M.I.; Grigorieva, I.V.; Dubonos, S.V.; Firsov, A.A. Two-Dimensional Gas of Massless Dirac Fermions in Graphene. Nature 2005, 438, 197–200. [Google Scholar] [CrossRef]
  4. Novoselov, K.S.; Geim, A.K.; Morozov, S.V.; Jiang, D.; Zhang, Y.; Dubonos, S.V.; Grigorieva, I.V.; Firsov, A.A. Electric Field Effect in Atomically Thin Carbon Films. Science 2004, 306, 666–669. [Google Scholar] [CrossRef] [PubMed]
  5. Boehm, H.; Clauss, A.; Fischer, G.; Hofmann, U. Surface Properties of Extremely Thin Graphite Lamellae; Pergamon Press: New York, NY, USA, 1962; Volume 1, pp. 73–80. [Google Scholar]
  6. Deligeorgis, G.; Konstantinidis, G.; Dragoman, M.; Plana, R. Fabrication of Graphene Devices, Issues and Prospects. In Proceedings of the CAS 2010 Proceedings (International Semiconductor Conference); IEEE: Sinaia, October, 2010; pp. 21–25. [Google Scholar]
  7. Berger, C.; Song, Z.; Li, T.; Li, X.; Ogbazghi, A.Y.; Feng, R.; Dai, Z.; Marchenkov, A.N.; Conrad, E.H.; First, P.N.; et al. Ultrathin Epitaxial Graphite: 2D Electron Gas Properties and a Route toward Graphene-Based Nanoelectronics. J. Phys. Chem. B 2004, 108, 19912–19916. [Google Scholar] [CrossRef]
  8. Li, X.; Cai, W.; An, J.; Kim, S.; Nah, J.; Yang, D.; Piner, R.; Velamakanni, A.; Jung, I.; Tutuc, E.; et al. Large-Area Synthesis of High-Quality and Uniform Graphene Films on Copper Foils. Science 2009, 324, 1312–1314. [Google Scholar] [CrossRef] [PubMed]
  9. Wen, F.; Hao, C.; Xiang, J.; Wang, L.; Hou, H.; Su, Z.; Hu, W.; Liu, Z. Enhanced Laser Scribed Flexible Graphene-Based Micro-Supercapacitor Performance with Reduction of Carbon Nanotubes Diameter. Carbon 2014, 75, 236–243. [Google Scholar] [CrossRef]
  10. Lee, S.-H.; Kim, J.H.; Yoon, J.-R. Laser Scribed Graphene Cathode for Next Generation of High Performance Hybrid Supercapacitors. Sci Rep 2018, 8, 8179. [Google Scholar] [CrossRef]
  11. Yang, Y.; Song, Y.; Bo, X.; Min, J.; Pak, O.S.; Zhu, L.; Wang, M.; Tu, J.; Kogan, A.; Zhang, H.; et al. A Laser-Engraved Wearable Sensor for Sensitive Detection of Uric Acid and Tyrosine in Sweat. Nat Biotechnol 2020, 38, 217–224. [Google Scholar] [CrossRef]
  12. Liu, X.; Zhang, F.; Zhang, Q.; Wan, Z.; Chen, X. Laser-Scribed Graphene for Sensors: Preparation, Modification, Applications, and Future Prospects. gxjzz 2023, 4, 1. [Google Scholar] [CrossRef]
  13. Ameku, W.A.; Negahdary, M.; Lima, I.S.; Santos, B.G.; Oliveira, T.G.; Paixão, T.R.L.C.; Angnes, L. Laser-Scribed Graphene-Based Electrochemical Sensors: A Review. Chemosensors 2022, 10, 505. [Google Scholar] [CrossRef]
  14. Choi, D.-H.; Thaxton, A.; Jeong, I.C.; Kim, K.; Sosnay, P.R.; Cutting, G.R.; Searson, P.C. Sweat Test for Cystic Fibrosis: Wearable Sweat Sensor vs. Standard Laboratory Test. Journal of Cystic Fibrosis 2018, 17, e35–e38. [Google Scholar] [CrossRef]
  15. Oshin, O.; Kireev, D.; Hlukhova, H.; Idachaba, F.; Akinwande, D.; Atayero, A. Graphene-Based Biosensor for Early Detection of Iron Deficiency. Sensors 2020, 20, 3688. [Google Scholar] [CrossRef] [PubMed]
  16. Robinson, D.L.; Venton, B.J.; Heien, M.L.A.V.; Wightman, R.M. Detecting Subsecond Dopamine Release with Fast-Scan Cyclic Voltammetry in Vivo. Clinical Chemistry 2003, 49, 1763–1773. [Google Scholar] [CrossRef] [PubMed]
  17. Husmann, S.; Nossol, E.; Zarbin, A.J.G. Carbon Nanotube/Prussian Blue Paste Electrodes: Characterization and Study of Key Parameters for Application as Sensors for Determination of Low Concentration of Hydrogen Peroxide. Sensors and Actuators B: Chemical 2014, 192, 782–790. [Google Scholar] [CrossRef]
  18. Lee, H.; Song, C.; Hong, Y.S.; Kim, M.; Cho, H.R.; Kang, T.; Shin, K.; Choi, S.H.; Hyeon, T.; Kim, D.-H. Wearable/Disposable Sweat-Based Glucose Monitoring Device with Multistage Transdermal Drug Delivery Module. Sci. Adv. 2017, 3, e1601314. [Google Scholar] [CrossRef]
  19. Cai, B.; Wang, S.; Huang, L.; Ning, Y.; Zhang, Z.; Zhang, G.-J. Ultrasensitive Label-Free Detection of PNA–DNA Hybridization by Reduced Graphene Oxide Field-Effect Transistor Biosensor. ACS Nano 2014, 8, 2632–2638. [Google Scholar] [CrossRef]
  20. Fenzl, C.; Nayak, P.; Hirsch, T.; Wolfbeis, O.S.; Alshareef, H.N.; Baeumner, A.J. Laser-Scribed Graphene Electrodes for Aptamer-Based Biosensing. ACS Sens. 2017, 2, 616–620. [Google Scholar] [CrossRef]
  21. Low, S.S.; Tan, M.T.T.; Loh, H.-S.; Khiew, P.S.; Chiu, W.S. Facile Hydrothermal Growth Graphene/ZnO Nanocomposite for Development of Enhanced Biosensor. Analytica Chimica Acta 2016, 903, 131–141. [Google Scholar] [CrossRef]
  22. Torrente-Rodríguez, R.M.; Lukas, H.; Tu, J.; Min, J.; Yang, Y.; Xu, C.; Rossiter, H.B.; Gao, W. SARS-CoV-2 RapidPlex: A Graphene-Based Multiplexed Telemedicine Platform for Rapid and Low-Cost COVID-19 Diagnosis and Monitoring. Matter 2020, 3, 1981–1998. [Google Scholar] [CrossRef]
  23. Griffiths, K.; Dale, C.; Hedley, J.; Kowal, M.D.; Kaner, R.B.; Keegan, N. Laser-Scribed Graphene Presents an Opportunity to Print a New Generation of Disposable Electrochemical Sensors. Nanoscale 2014, 6, 13613–13622. [Google Scholar] [CrossRef] [PubMed]
  24. Nayak, P.; Kurra, N.; Xia, C.; Alshareef, H.N. Highly Efficient Laser Scribed Graphene Electrodes for On-Chip Electrochemical Sensing Applications. Adv Elect Materials 2016, 2, 1600185. [Google Scholar] [CrossRef]
  25. Tai, M.J.Y.; Vasudevan, M.; Perumal, V.; Liu, W.W.; Mohamed, N.M. Synthesis of Laser Scribed Graphene Electrode with Optimized Power for Biosensing. In Proceedings of the 2019 IEEE Regional Symposium on Micro and Nanoelectronics (RSM); IEEE: Genting Highland, Pahang, Malaysia, August, 2019; pp. 102–104. [Google Scholar]
  26. De La Roche, J.; López-Cifuentes, I.; Jaramillo-Botero, A. Influence of Lasing Parameters on the Morphology and Electrical Resistance of Polyimide-Based Laser-Induced Graphene (LIG). Carbon Lett. 2023, 33, 587–595. [Google Scholar] [CrossRef]
  27. Liu, M.; Wu, J.; Cheng, H. Effects of Laser Processing Parameters on Properties of Laser-Induced Graphene by Irradiating CO2 Laser on Polyimide. Sci. China Technol. Sci. 2022, 65, 41–52. [Google Scholar] [CrossRef]
  28. Murray, R.; Burke, M.; Iacopino, D.; Quinn, A.J. Design of Experiments and Optimization of Laser-Induced Graphene. ACS Omega 2021, 6, 16736–16743. [Google Scholar] [CrossRef]
  29. Design and Analysis of Experiments; Montgomery, D. C., Ed.; Eighth edition.; John Wiley & Sons, Inc: Hoboken, NJ, 2013; ISBN 978-1-118-14692-7. [Google Scholar]
  30. Antony, J. Design of Experiments for Engineers and Scientists; Elsevier, 2023; ISBN 0-443-15174-1.
  31. Senf, B.; Yeo, W.-H.; Kim, J.-H. Recent Advances in Portable Biosensors for Biomarker Detection in Body Fluids. Biosensors 2020, 10, 127. [Google Scholar] [CrossRef]
  32. Khachornsakkul, K.; Dungchai, W. Rapid Distance-Based Cardiac Troponin Quantification Using Paper Analytical Devices for the Screening and the Follow-Up of Acute Myocardial Infarction, Using a Single Drop of Human Whole Blood. ACS Sens. 2021, 6, 1339–1347. [Google Scholar] [CrossRef]
  33. Delgado-Rivera, R.; García-Rodríguez, W.; López, L.; Cunci, L.; Resto, P.J.; Domenech, M. PCL/PEO Polymer Membrane Prevents Biofouling in Wearable Detection Sensors. Membranes 2023, 13, 728. [Google Scholar] [CrossRef]
  34. Holeček, M. Histidine in Health and Disease: Metabolism, Physiological Importance, and Use as a Supplement. Nutrients 2020, 12, 848. [Google Scholar] [CrossRef]
  35. Tan, S.P.; Brown, S.B.; Griffiths, C.; Weller, R.; Gibbs, N.K. Feeding Filaggrin: Effects of L-Histidine Supplementation in Atopic Dermatitis. CCID 2017, Volume 10, 403–411. [Google Scholar] [CrossRef]
  36. Dunstan, R.H.; Sparkes, D.L.; Dascombe, B.J.; Macdonald, M.M.; Evans, C.A.; Stevens, C.J.; Crompton, M.J.; Gottfries, J.; Franks, J.; Murphy, G.; et al. Sweat Facilitated Amino Acid Losses in Male Athletes during Exercise at 32-34°C. PLoS ONE 2016, 11, e0167844. [Google Scholar] [CrossRef]
  37. Hier, S.W.; Cornbleet, T.; Bergeim, O. THE AMINO ACIDS OF HUMAN SWEAT. Journal of Biological Chemistry 1946, 166, 327–333. [Google Scholar] [CrossRef] [PubMed]
  38. Callewaert, C.; Buysschaert, B.; Vossen, E.; Fievez, V.; Van De Wiele, T.; Boon, N. Artificial Sweat Composition to Grow and Sustain a Mixed Human Axillary Microbiome. Journal of Microbiological Methods 2014, 103, 6–8. [Google Scholar] [CrossRef]
  39. García-Rodríguez, W.; Saavedra-Ruiz, A.; Resto-Irizarry, P.J. Label-Free Classification of L-Histidine Vs Artificial Human Sweat Using Laser Scribed Electrodes and a Multi-Layer Perceptron Neural Network. In Proceedings of the 2024 46th Annual International Conference of the IEEE Engineering in Medicine and Biology Society (EMBC); July 2024; pp. 1–4. [Google Scholar]
  40. Xu, Z.; He, Z.; Song, Y.; Fu, X.; Rommel, M.; Luo, X.; Hartmaier, A.; Zhang, J.; Fang, F. Topic Review: Application of Raman Spectroscopy Characterization in Micro/Nano-Machining. Micromachines 2018, 9, 361. [Google Scholar] [CrossRef]
  41. Ni, Z.; Wang, Y.; Yu, T.; Shen, Z. Raman Spectroscopy and Imaging of Graphene. Nano Res. 2008, 1, 273–291. [Google Scholar] [CrossRef]
  42. Wang, X.; Chen, Y.P.; Nolte, D.D. Strong Anomalous Optical Dispersion of Graphene: Complex Refractive Index Measured by Picometrology. Opt. Express 2008, 16, 22105. [Google Scholar] [CrossRef] [PubMed]
  43. Okafor, P.A.; Huxel, B.; Iroh, J.O. Electrochemical Behavior of Multifunctional Graphene–Polyimide Nanocomposite Film in Two Different Electrolyte Solutions. J of Applied Polymer Sci 2015, 132, app.42673. [Google Scholar] [CrossRef]
  44. Romero, F.J.; Salinas-Castillo, A.; Rivadeneyra, A.; Albrecht, A.; Godoy, A.; Morales, D.P.; Rodriguez, N. In-Depth Study of Laser Diode Ablation of Kapton Polyimide for Flexible Conductive Substrates. Nanomaterials 2018, 8, 517. [Google Scholar] [CrossRef]
  45. Abdulhafez, M.; Tomaraei, G.N.; Bedewy, M. Fluence-Dependent Morphological Transitions in Laser-Induced Graphene Electrodes on Polyimide Substrates for Flexible Devices. ACS Appl. Nano Mater. 2021, 4, 2973–2986. [Google Scholar] [CrossRef]
Figure 1. Experimental set-up used for electrode characterization and testing. (a) Geometry for manufacturing laser-scribed electrodes. (b) The first experimental setup utilizes an LSG as the working electrode, Ag/AgCl as the reference electrode, and Pt as the counter electrode. All three electrodes are connected to a potentiostat and submerged in an electrolyte solution of K₃[Fe(CN)₆] in 0.1 M KCl within a glass flask. (c) The second experimental setup employs two LSG electrodes as the working and counter electrodes, along with a reference electrode prepared using silver ink. (d) Exploded geometry providing a detailed view of the second experimental setup. This configuration features LSG and silver electrodes fabricated on a polyimide substrate, mounted on a polymethyl methacrylate (PMMA) film, and covered with a vinyl layer to confine contact between the electrodes and the electrolyte. Additionally, a rectangular PMMA chamber is incorporated on the surface to control the volume of the deposited electrolyte.
Preprints 150890 g001
Figure 2. Electrode matrix manufactured using CO2 Laser Cutter for 23 full factorial design. a) Electrodes manufactured in random order, using High and Low levels for each parameter: A (20%, 30%), B (12%, 17%), and C (0.7mm, 1.4 mm). b) Manufacturing parameter matrix showing three replicates for each manufacturing configuration.
Preprints 150890 g002
Figure 3. Electrodes used for Central Composite Design a) Electrodes manufactured in random order, using three levels for each parameter: A (20%, 25%, 30%), B (12%, 14.5%, 17%), and C (0.7mm, 1.1 mm, 1.4 mm). b) Manufacturing parameter matrix showing three replicates for each manufacturing configuration.
Preprints 150890 g003
Figure 4. 23 Full Factorial Design results. a) Box Plot for current density to identify the changes in each manufacturing parameter combination. b) Pareto chart using 95% of confidence level. c) Main effect for each speed, power, and width. d) Interaction plot for each combination.
Preprints 150890 g004
Figure 5. Central Composite Design results. a) Box Plot for current density to identify the changes in each manufacturing parameter combination. b) Pareto chart using 95% of confidence level. c) Main effect for each speed, power, and width. d) Interaction plot for each combination.
Preprints 150890 g005
Figure 6. Cyclic Voltammetry measurements for LSG electrodes manufactured using 25% speed (A), 12% Power (B), 4pt width (C), and 1200 DPI at voltage rates 10, 20, 30, 40, 50 (mV/s).
Preprints 150890 g006
Figure 7. (a) Oxidation and reduction peak magnitudes for LSGs manufactured at 25% speed (A), 12% power (B), 4pt width (C), and 1200 DPI. (b) EASA for electrodes made using four different laser head speeds (25%, 30%, 35%, 40%).
Preprints 150890 g007
Figure 8. Comparison between structural and electrical properties. a) Raman spectroscopy measurements of electrodes manufactured using power 12% and speed settings 15%, 20%, 25%, and 30%. b) Nyquist plot obtained from electrodes made using three different speeds (25%, 30%, 40%), at a power of 12% and an electrode width of 3 (pt).
Preprints 150890 g008
Figure 9. Cyclic voltammetry measurements comparing standard and manufactured electrodes. (a) Voltammogram for various molar concentrations using standard electrodes: Pt (counter electrode), Ag/AgCl (reference electrode), and Glassy Carbon (GC, working electrode). (b) Voltammogram for various molar concentrations using manufactured electrodes: LSG (counter electrode), Ag ink (reference electrode), and LSG (working electrode). (c) Evaluation of the redox current peak for each concentration, comparing standard and manufactured electrodes.
Preprints 150890 g009
Figure 10. Percentage of signal increment for various molar concentrations using manufactured electrodes (LSG, Ag, LSG) compared to standard electrodes (Pt, Ag/AgCl, GC).
Preprints 150890 g010
Figure 11. L-histidine detection in Artificial Sweat at concentrations ranging from 3.2 mM to 50 mM. a) L-histidine voltammograms for five representative concentrations (3.2, 7.1, 10, 16.7, 50 mM). b) A linear relationship between L-histidine concentration and normalized peak current was observed.
Preprints 150890 g011
Disclaimer/Publisher’s Note: The statements, opinions and data contained in all publications are solely those of the individual author(s) and contributor(s) and not of MDPI and/or the editor(s). MDPI and/or the editor(s) disclaim responsibility for any injury to people or property resulting from any ideas, methods, instructions or products referred to in the content.
Copyright: This open access article is published under a Creative Commons CC BY 4.0 license, which permit the free download, distribution, and reuse, provided that the author and preprint are cited in any reuse.
Prerpints.org logo

Preprints.org is a free preprint server supported by MDPI in Basel, Switzerland.

Subscribe

Disclaimer

Terms of Use

Privacy Policy

Privacy Settings

© 2025 MDPI (Basel, Switzerland) unless otherwise stated