
Submitted:
02 March 2025
Posted:
03 March 2025
You are already at the latest version
Abstract
Genotype × environment interactions (GEIs) play an important role in the selection of suitable germplasm in breeding programs. In this study we evaluated GEI effects on 36 lentil genotypes and to identify genotypes with good performance and high stability under different environmental stresses. Entries were grown in a randomized complete block design with two replications under six test environmental conditions at two different locations in Morocco. Harvested seeds were assessed for different quality traits including cooking time, phytic acid, and iron, zinc and protein contents. Combined analysis of variance revealed that the GEI was significantly (p 0.001) evident for seed yield and quality traits. Additive main effects and multiplicative interaction (AMMI) analysis was used to examine genotype variation and GEI effects. Our results indicated environment as the main source of variation for all evaluated traits. Furthermore, multiple AMMI-based statistical models were used to rank genotypes for their performance across tested environments. A two-dimensional GGE biplot was generated using the first two principal components. The GGE-biplot analysis revealed different discriminating and representativeness abilities among the environments. Different environments showed optimal values for each trait, environment E1 was the most desirable for seed yield and cooking time. Environments E4 and E2 were ideal for high iron and zinc. Similarly, environment E5 was the most desirable for protein content and phytic acid. Different mega-environments were also identified with relevant winning genotypes for each trait. Which can be recommended as elite climate-resilient parents that can aid breeders in improving lentil yield and nutritional quality potential and stability across multiple stresses.
Keywords:
Seed yield
; iron
; zinc
; protein content
; cooking time
; phytic acid
; AMMI
; GGE biplot
; G x E
; stability analysis
1. Introduction
Lentil (Lens culinaris Medikus) is an important staple food crop. It is a rich source of protein (20–36%) and contains essential micronutrients and vitamins in a highly bioavailable form to human body. In addition to its nutritional value, lentils generally have a fast-cooking time compared to other legumes, due to its smaller seed size and thin seed coat [1]. Cooking time duration holds a significant importance in breeding programs, a prolonged cooking time for a new variety could lead to market penalties due to lower demand. Conversely, a fast-cooking variety may achieve higher prices due to the convenience it offers in cooking and reduced energy costs [2]. Lentil is grown on 5.5 million ha with over 6.6 million tonnes production worldwide [3]. Lentil is a highly adaptable plant that grows under varying climate and soil conditions. It is commonly cultivated in the Mediterranean and subtropical dryland regions, where synthetic fertilizers are typically not needed for cultivation due to their ability to fix atmospheric nitrogen (N2) by the lentil crop. However global lentil productivity has been reported to decline over the last decades due to fluctuations in climate such as extreme temperatures, flooding, droughts, and a rise in the prevalence of pests and diseases [4]. Multiple stresses such as high temperature and drought during the seed filling stage adversely affect lentil productivity. On the other hand, increased heat intensity and water deficits have a substantial impact on lentil nutritional quality. Several studies have reported that iron and zinc concentration in lentil seed was reduced due to high temperature and drought conditions [5,6,7,8]. Protein content in the seeds was also affected. To attain global food security under changing climate, lentil breeders face a significant challenge of simultaneously enhancing both yield and nutritional quality.
Several studies reported a negative correlation between seed yield and different quality traits including iron, zinc and protein content in lentil [7,9]. The genetic and environmental factors result in differences in both agronomic performance and seed nutritional properties in lentils [10,11]. Several research underlined that genotype and growing environment largely affect micronutrient, protein content and cooking time of lentil varieties evaluated in multilocation trials.
Multi-environment trials (MET) play a pivotal role in the evaluation process carried out by plant breeders to assess the performance of new or/and enhanced genotypes across a range of test environments. The key objective of these trials is to determine the level of genotype-environment (GE) interaction, which entails evaluating the performance of different genotypes across diverse environmental conditions. Considering genotype-environment interaction (GEI) enables breeders to enhance their recommendations and improve the development of genotypes that meet the requirements of growers. Therefore, breeders must utilize tools that can effectively and accurately gauge the performance of the lines across various test environments [12]. Several biometric models have been proposed to examine GEI and investigate adaptability and stability including AMMI [13] and GGE bi-plot models [12]. The objectives of this study were: (i) to investigate the environmental and genotypic effect on seed yield, crude protein (CP), micronutrients (iron and zinc), phytic acid and cooking time of 36 lentil genotypes grown at two diverse locations under three treatments (normal, heat and drought stresses), (ii) to identify superior genotypes with higher seed yield and nutritional values which could be further suggested as parental material in breeding programs.
2. Results
2.1. AMMI Analysis of Variance
ANOVA for AMMI showed that the genotype, environment, and GEI effects were highly significant (P<0.001) for all the traits under evaluation (Table 1). Environment played a prominent role, explaining over 50% of the total variation for almost all the parameters (Figure 1). For protein content, genotypic variance accounted 0.58 % of the total variance whilst the environment and the GEI contributed 98.95% and 0.37% to the total variation, respectively. The proportion of the total variance explained by genotype, environment and GEI for Fe were 2.49%, 96.60% and 0.85%, respectively. Similarly, the genotype, environment and GEI for Zn explained 3.20%, 92.86% and 3.25%, respectively. In the case of cooking time (CT), the genotype, environment and GEI accounted for 3.37%, 95.36%, and 1.13%, respectively. Phytic acid (PA variation was influenced by genotype (1.97%), environment (96.71%), and GEI (1.19%). For PA/Fe, the genotype, environment and GEI accounted for 1.87%, 97.48%, and 0.60%, respectively. However, genotype, environment and GEI explained 3.20%, 92.86% and 3.25% for PA/Zn ratio, respectively. The total variation for seed yield and hundred-seed yield explained 3.02% and 3. 34% for genotype, 94.95% and 93.92% for environment, while the GEI accounted for 1.89% and 2.52%, respectively. As for the seed size components, the total variation for seed eccentricity (SE), seed thickness (ST), Feret’s diameter (SFD), seed circularity (SC), seed rugosity (SR) and seed perimeter (SP) was mainly explained by environment effect, which was over 50%. The GEI contributed 26.30%, 26.84%, 27.11% and 27.56% to the total variation for seed width (SW), seed diameter (SD), seed length (SL) and seed area (SA), respectively.
2.2. Genotype Main Effects: AMMI Biplots
2.2.1. Additive Main Effects and Multiplicative Interaction 1 Biplot
AMMI 1 biplots illustrated the first principal component analysis (PCA1) term (ordinate) and trait main effects (abscissa) for seed yield, iron, zinc, phytic acid, protein content, and cooking time (Figure 2: Patterns A–F). The PCA1 values were 40.8%, 48.3%, 30.1%, 37.9%, 42.6%, and 40.3%, respectively. For seed yield (Pattern A), genotypes G23, G12, G35, G19, G18, and G36 were near the origin (low PCA1 scores), while G24, G14, G5, G32, and G11 were distant. Similarly, genotypes far from the origin included G27, G25, G33, G6, G20, G1, G32, G14, G29, G9, and G24 for iron (Pattern B); G6, G16, G11, G9, and G23 for zinc (Pattern C); G33, G3, G34, G35, G24, G32, and G36 for phytic acid (Pattern D); G22, G15, G24, G3, G21, G31, and G6 for crude protein (Pattern E); and G18, G16, G24, G11, G29, G33, G19, G25, G10, G27, G13, G28, and G32 for cooking time (Pattern F). Conversely, genotypes near the origin included G17, G5, G10, G4, G30, G35, and G7 for iron; G3, G19, G21, G12, G13, G21, G28, and G22 for zinc; G5, G17, G2, G25, G17, G30, and G12 for phytic acid; G14, G29, G4, G19, and G33 for crude protein; and G36, G12, G15, G31, and G35 for cooking time.
2.2.2. Additive Main Effects and Multiplicative Interaction 2 Biplot
Additive main effects and multiplicative interaction model 2 (AMMI 2) biplot of lentil genotypes are illustrated in Figure 3. The PCA2 values for the evaluated traits were 27.4%, 26.2%, 28.4%, 23.9%, 21.1% and 36.2% for seed yield, iron, zinc, phytic acid, crude protein, and cooking time, respectively. For seed yield, genotypes G35, G16, G26, G19, and G12 were positioned near the biplot origin, indicating low PCA scores, while G7, G11, G34, G36, G29, G27, G28, G17, G14, and G5 were farther from the center. Environments E1, E2, and E4 exhibited high scores on both principal components, whereas E5, E3, and E6 showed lower scores. For iron, genotypes G33, G22, G13, G35, G14, G29, G9, G2, G11, G32, G19, G6, G27, and G20 were distant from the origin, while G24, G36, G30, G8, G21, G17, G7, and G3 were closer. Similarly, E1, E4, and E5 had high scores, whereas E2, E3, and E6 recorded lower scores. Regarding zinc, genotypes G1, G9, G17, G34, G25, G12, G2, and G22 clustered near the center, while G20, G14, G16, G32, G10, G6, and G23 were more distant. Environments E1 and E5 showed higher scores, while E5, E4, E3, and E6 scored lower. For phytic acid, genotypes G28, G17, G30, G21, G13, G23, G6, and G25 were close to the origin, whereas G1, G5, G10, G24, G35, G34, G22, G33, G31, G36, and G7 were farther. High scores were observed in E1, E2, and E4, while E3, E5, and E6 had lower scores. For protein content, genotypes G16, G9, G4, G28, G20, G19, and G12 were near the center, whereas G1, G35, G18, G13, G15, G22, G11, G25, G21, and G3 were far from the origin. Similarly, E1, E2, and E4 exhibited the highest scores, while E3, E5, and E6 had lower scores. Lastly, for crude protein, genotypes G1, G8, G6, G27, G17, G21, and G34 were near the origin, while G32, G24, G18, G16, G3, G9, G33, G5, and G2 were distant. Environments E1, E2, and E4 had high scores, whereas E3, E5, and E6 revealed lower scores.
2.2.3. Estimation of AMMI-Based Stability Indexes
The AMMI-based stability analysis ranked genotypes based on their performance across environments using multiple statistical models, including ASTAB, ASI, ASV, AVAMGE, DA, DZ, EV, FA, MASI, MASV, SIPC, ZA, and WAAS (Table S1). For seed yield, G19 was the most stable, followed by G23, except for ASI, ASV, ZA, and WAAS, where G16 ranked first and G35 second. For iron content, G4 showed the highest stability under ASTAB, AVAMGE, DA, DZ, EV, and FA, while G16 was most stable using ASI, ASV, MASI, MASV, ZA, and WAAS. For zinc content, G34 ranked first and G25 second under most models, but ASI and ASV placed G19 first and G34 second. Phytic acid stability was highest for G6, followed by G4, based on ASTAB, AVAMGE, DA, DZ, EV, FA, MASV, SIPC, and ZA. For protein content, G19 ranked first and G34 second under ASTAB, DA, DZ, EV, and FA, whereas AVAMGE, MASI, MASV, and SIPC placed G34 first and G19 second. For cooking time, G13 was the most stable, followed by G6, based on ASTAB, DA, DZ, EV, FA, SIPC, and WAAS.
2.3. GGE Biplots Based Analysis
2.3.1. Mean vs. Stability
The mean vs. stability pattern explained 59.55% for seed yield, 69.62% for iron, 50.43% for zinc, 56.64% for phytic acid, 59.02% for crude protein, and 77.11% for cooking time. For seed yield, G32, G27, G28, G10, G31, G26, G33, G24, G18, and G29 performed well in E1 and E2, while G9, G36, and G29 yielded the most in E3 and E6. G17, G24, G21, G14, G20, G22, and G12 excelled in E4 and E5, while G5, G7, and G3 were most stable despite lower yields. High-yielding genotypes such as G24, G27, and G32 exhibited instability. For iron, G14, G34, G11, G29, G32, G3, G15, and G6 had the highest concentrations in E4 and performed well in E5 and E6. In E1, E2, and E3, G6, G20, G33, G1, G32, G19, G22, G3, G4, and G12 excelled. Stable genotypes included G3, G32, G36, G10, and G4, whereas G29, G9, G14, and G34 were less stable. For zinc, G32, G10, G36, G3, G4, and G13 had high levels in E1, E5, and E6. In E2 and E3, G16, G11, G14, G33, G5, G9, G34, and G12 performed best, while in E4, G23, G8, G7, G6, G26, G30, G2, and G25 had higher levels. G34 and G19 were the most stable, while G25 was stable but had lower zinc content. For phytic acid, G13, G34, G33, G2, G1, G10, G36, G30, G22, and G21 had lower levels in E1, E5, and E6, with G30, G21, G2, and G13 being the most stable. In E2 and E3, G13, G1, G2, G9, G32, G11, G36, and G22 had lower levels, while in E4, G34, G10, G15, G5, G33, G7, G8, and G16 performed best. G13 and G5 showed the highest stability across E2, E3, and E4. For protein content, G21, G11, G25, G8, G29, G14, G33, and G15 had higher levels in E1, E2, and E4. In E6 and E5, G15, G24, G31, G23, G22, G5, G28, G32, and G13 showed higher levels, while E3 saw moderately higher levels in G7, G12, G26, G1, G16, G3, G9, and G2. G3 was the most stable genotype with high protein content. For cooking time, G25, G33, G9, G10, G23, G19, G27, and G2 cooked faster in E4, E5, and E6. In E1, E2, and E4, G28, G32, G2, G22, G27, and G5 had shorter cooking times. Across environments, G29, G8, G12, and G30 were more stable but exhibited longer cooking time.
2.3.2. Ranking Genotypes
The biplot facilitated the identification of superior and ideal genotype from the pool of 36 tested genotypes. An ideal genotype is localized within the innermost circle, positioned close to the arrowhead at the center of the circular ring. However, in case no genotype was located inside the inner circle, genotypes next to the inner circle are ideal ones. For seed yield, genotypes G28, G31, G26 and G33 were regarded as the best genotypes. Similarly, genotypes G32, G3, G4 and G36 are ideal for iron content. For zinc content, G17, G3, G36, G11, G32 and G9; for phytic acid, G23, G21, G27. Genotypes G24, G18, G16 and G11 were identified best genotypes for protein content across tested environments. As for cooking time, only Genotype G15 were suitable for evaluated environments (Figure 5).
2.3.3. Discriminativeness vs. Representativeness and Ranking Environment
Discriminativeness vs. representativeness of the GGE biplot study is illustrated by Figure 6. The discriminativeness (the ability of an environment to distinguish genotype) of the environment is revealed by vector length for each environment, while the angle formed by each vector with the abscissa indicates representativeness (the ability of an environment to represent all other evaluated environment). Environment E5 was the ideal environment for seed yield as it was the closest to the center of concentric circles and having the smallest angles with AEA. Environment E3 was ideal for both iron and protein contents, while E5 was identified as an ideal Environment for zinc content. Environment E6 was an ideal test location for cooking time. Similarly, Environment E1 is considered suitable for phytic acid. However, environments with long vector and form small angle with the AEC abscissa line are also considered ideal for selecting superior genotypes, thus Environment E1, for seed yield, iron content and cooking time; environment E5 for phytic acid and protein content; environment E4 for zinc content and cooking time had long vector alongside small angle indicating that the test environments were greater representative and discriminative for the mentioned traits. On the other hand, the longest angles formed by the environment were observed to be environment E6 for seed yield, iron content and protein content; environment 4 for seed yield and phytic acid; environment E2 for cooking time, iron content, phytic acid and crude protein; environment E1 for protein content, cooking time and zinc content; environment E3 for zinc content; environment E5 for cooking time. Figure 5 illustrates the ranking biplot for contrasting the environments with the ideal environment. This figure helps identifying the most appropriate and inappropriate environments. Environment E1 was the closest to the ideal environment, and therefore, the most desirable for both seed yield and cooking time. Similarly, E5 was the most desirable environment for phytic acid and crude protein. For iron and zinc contents, environments E4 and E2 were regarded as the ideal environment respectively. In contrast, for seed yield and cooking time environment E6 was noted as the poorest environment. Similarly, for zinc and phytic acid environment E4 was the least desirable environment. As for iron content and crude protein, environment E4 was an undesirable environment.
2.3.4. Which-Won-Where and Mega-Environment Identification
Crossover GEI, mega-environment differentiation and specific adaptation of genotypes are graphically represented by GGE biplot for which-won-where (Figure 7). In this graph a polygon is drawn joining the genotypes that are located distant from the biplot origin so that all other genotypes are contained in the polygon. The vertex genotypes are characterized by the longest vectors in their respective directions, serving as an indicator of their responsiveness to environments. For seed yield, the polygon is formed by connecting the following vertex genotypes G5, G7, G3, G9, G29, G27, G32, G24, G17, and G14. For iron content the polygon is formed by genotype G14, G29, G9, G24, G27, G33 and G6. For zinc content, genotype G32, G10, G6, G23, G20, G14 and G16 are joining together to form the polygon. Similarly, for phytic acid, the vertex genotypes were identified as genotypes G33, G34, G35, G24, G32, G23, G1, G7, G36 and G31. For protein content, genotypes G9, G3, G11, G24, G32, G28, G25 and G33 were connected to form the polygon. As for cooking time, the vertex genotypes G21, G15, G24, G34, G16, G12, G7, G3 and G21 formed the polygon. The equality lines to the sides of the polygon divide the biplot into sectors, and thereby the biplot subdivides the target environment into subregions (mega-environments). Mega-environments are those sectors which include one or more environments. The perpendicular lines divided the biplot into eight sectors for seed yield, iron content and cooking time. Six sectors for zinc content, ten sectors for phytic acid, seven sectors for protein content. For seed yield, test environments were grouped into three mega-environments, where E1, E2 and E3 as well as genotypes G27, G29 and G32 fell into the first mega-environment, these genotypes were the most adapted and highest yielding across the three environments. Similarly, E4 and E5 fell into the second mega-environment with G17 and G24 the most adapted, while E6 fell along with G9 into one mega-environment. For iron content, the first mega-environments included environment E1, E2, E3 as well as G6 and G33, while the second one included environments E4, E5 and E6 along with G14 as the nominal winner. Three mega-environments were identified for zinc content, with environment E3, E2 and E5 grouped together in a mega-environment with G16 as the best performing genotype. Environment E1 and E6 were in the second mega-environment along with G32 and G10 ranking higher in zinc content, while the third mega-environment included E4 and G23. Similarly, there were three mega-environments for phytic acid, the first one contained environment E5, E6, E1 and G23 as winner genotype. Environments E2, E3 G32 and G24 constituted the second mega-environment, whereas E4 and G1 fell into the third mega-environment. As for protein content, the first mega-environment comprised E4, E5 and E6 along with genotypes G24 and G15, the second mega-environment contained E1, E2 and genotypes G21, while environment E3 fell into the third mega-environment beside G12. Regarding cooking time, two mega-environments were identified, E4, E5, E6 and G32 were presented in one mega-environment, the second mega-environment involved E1, E2 and E3 as well as genotypes G11, G3 and G24 (Figure 7).
2.4. Mean Performance for Seed Yield, Seed Size and Shape Parameters
According to the mean comparison presented in Table S2. Seed yield differ significantly across tested environment (p < 0.001). Under E1 condition, seed yield ranged from 2.97 to 6.93g with a mean of 5.15g. When subjected to high temperature condition under E2, seed yield showed a reduction of 24% while under high temperature combined with drought conditions seed yield was significantly reduced by 46 %. Similarly, under E4 condition (normal planting in Announcer), the mean seed yield was 4.04g. High temperature under E5 conditions resulted in a reduction of 20%, with seed yield varying from 1.76 to 4.73g. Whereas, seed yield under E6 condition showed a reduction of 38%. For HSW under E1, the range was from 1.80g to 4.93g, with a mean of 3.50g. This environment demonstrated relatively higher HSW compared to other environments (E2 and E3). In E2, HSW experienced a reduction of 25%, while in E3, this reduction was even more pronounced at 51%.
The impact of the environment varied significantly for different seed-related traits. Some traits, such as seed circularity, seed rugosity, and seed thickness, remain relatively stable across environments. In contrast, traits like seed eccentricity, seed width, and seed length are more sensitive to environmental conditions, resulting in evident variation and reduction in mean values.
2.5. Mean Performance of Nutritional Quality and Micronutrient Bioavailability
The range and mean values for nutritional traits in each environment are provided in Table S3
Iron content varied significantly across environments, in E1 the range was from 7.27 to 11.08 g/100g, with a mean of 8.72 g/100g. Compared to the other environments, Fe content showed a wide range of variation in E4, ranging from 7.14 to 11.86 g/100g, with a the highest mean of 10.22 g/100g. High temperature conditions in both E2 and E5 resulted in a reduction in Iron content (24% and 18% respectively). The mean iron content was 7.61 g/100g in E2, while in E5 the mean was 8.46 g/100g. On the other hand, E3 exhibited a lower Fe content compared to both E1 and E2. The Fe content ranged from 5.33 to 8.03 g/100g, with a mean of 6.57 g/100g. High temperature combined with drought conditions in this environment (E3) led to a reduction of 25% in iron content, while it showed a substantial reduction of 34% in E6.
The zinc content in E1 ranged from 5.04 to 6.79g/100g, with a mean of 5.89 g/100g. Comparatively, E4 displayed a wide range of zinc content, varying from 4.83 to 6.71 g/100g with a mean of 5.66 g/100g. The incidence of high temperature conditions in both E2 and E5 resulted in reductions in zinc content, with decreases of 4% and 3%, respectively. E2 had a mean zinc content of 5.66 g/100g, while E5 had a mean of 5.11 g/100g. In contrast, E3 exhibited lower zinc content compared to E1 and E2, ranging from 4.47 to 6.61 g/100g, with a mean of 5.24g/100g. In this environment, the combination of high temperature and drought conditions led to a reduction of 28% in zinc content. Similarly, E6 experienced a reduction of 7% in iron content.
Cooking time was significantly reduced (28%) under E2 condition, the mean was 7.05 min, varying from 4.82 to 9.98 min. Similarly, in E3 cooking time showed a decrease of 48%. The mean CT was 5.04 min only. Cooking time in E1, showed the longest duration, ranging from 6.17 to 14.94 min, with a mean of 9.82 min. In E4 the range of CT was between 5.30 and 14.21 min, with a mean of 9.68 minutes. Similar to E1, E4 has a relatively wide range of CT, suggesting significant variation in cooking time. On the other hand, cooking time showed a reduction of 37% in E5, the range was from 4.15 to 8.71 min, with a mean of 6.05 min. Similarly, cooking time was further decreased (54%) under E6. The range of cooking time was from 2.54 to 6.21 minutes, with a mean of 4.43 minutes in E6.
The protein content exhibited a notable variation across the six tested environments (E1 to E6). Environment E1 demonstrated the highest average protein content, with a mean of 29.66 ± 0.85 and a range from 28.75 to 31.98, closely followed by E4, which had a mean of 28.96 ± 1.15 and a range of 27.13 to 31.24. These environments provided the most favorable conditions for protein synthesis and accumulation in lentil seeds. In contrast, E6 showed the lowest protein content, with a mean of 21.74 ± 1.37 and a narrower range of 19.61 to 23.71, indicating less favorable conditions. E2 and E3 exhibited moderate protein levels with means of 27.41 ± 0.85 and 25.67 ± 0.93, respectively, and slightly overlapping ranges. E5 presented a lower mean protein content of 24.54 ± 1.51, within a broader range of 22.12 to 28.31.
The range of PA content in E1 was 0.54-0.98 g/100g, with a mean of 0.82 g/100g. This environment exhibited relatively low PA levels. E2 environment has increased PA content compared to E1, with a range from 0.82 to 1.20 g/100g and a mean of 0.99 g/100g. Similarly, E3 demonstrated further increase of PA level, the range was 0.98 to 1.39 g/100g with a mean of 1.20 g/100g.
A similar pattern was also observed across E4, E5 and E6. In E4, the range of PA content was between 0.62 and 1.10, with a mean of 0.93. Lentil seeds from this environment have a relatively lower range of PA content. Similarly, E3 and E5 showed an increase of 14% in PA levels, the range was between 0.82 and 1.44 g/100g, with a mean of 1.10 g/100g. In E6, the PA levels range from 0.92 and 1.33 g/100g, with a mean of 1.15 g/100g.
In E1 and E4, phytic acid/micronutrients molar ratios of both Fe and Zn showed reduced value compared to high temperature conditions in E3 and E5, where PA/Fe and PA/Zn molar ratios showed an increase of 38% and 25% respectively. Under E3, both molar ratios showed a significant increase of 95% for PA/Fe and 66% for PA/Zn. Similarly, E6 conditions resulted in an increase of 89% in PA/Fe molar ratio, while PA/Zn ratio showed an increase of 34% (Figure 8).
2.6. Correlation Between Seed Yield, Seed Size/Shape, and Nutritional Quality Traits
Significant positive and negative correlations were detected between studied traits. Under E1 conditions, seed yield showed positive and highly significant correlation with hundred seed weight (r=0.69; p <0.001), and significant negative correlation with protein content (r=-0.29; p <0.5). Iron content revealed a significant positive correlation with zinc (r=-0.49; p <0.001), whereas there was a significant negative correlation between iron content and both PA/Fe (r=-0.75; p <0.001) and PA/Zn (r=-0.36; p <0.1) ratios. PA/Fe ratio showed a positive and highly significant correlation with both phytic acid (r=0.71; p <0.001) and PA/Zn ratio (r=0.79; p <0.001), while PA/Fe was negatively correlated with zinc content (r=-0.38; p <0.001). Zinc content was also negatively correlated with PA/Zn ratio (r=-0.62; p <0.001). Similarly, PA/Zn was negatively correlated with phytic acid (r=0.80; p <0.001). In contrast, phytic acid revealed a significant negative correlation with cooking time (r=-0.33; p <0.01). Another positive and highly significant correlation was observed between cooking time and protein content (r=0.33; p <0.01). Under E2 conditions, seed yield showed a positive and significant correlation with the hundred seed weight (r=0.68; p <0.001) and significant negative correlation with iron content (r=-0.28; p <0.05). Similarly, hundred seed yield was also negatively correlated with iron content (r=-0.38; p <0.001). A significant positive association was obtained between the hundred seed weight and the PA/Fe ratio (r=0.37; p <0.01). With respect to iron content, a negative and significant correlation was obtained with PA/Fe (r=-0.83; p <0.001).and PA/Zn (r=-0.36; p <0.01). On the other hand, iron content revealed a highly positive and significant correlation with zinc content (r=0.48; p <0.001). PA/Fe ratio showed a highly positive and significant correlation with phytic acid (r=0.58; p <0.001) and PA/Zn ratio (r=0.68; p <0.001), while there was a negative correlation zinc content (r=-0.31; p <0.01). As for the PA/Zn ratio, a highly significant positive correlation was observed with phytic acid (r=0.70; p <0.001), while the association with zinc was negative and highly significant (r=-0.60; p <0.001). Interestingly, phytic acid showed a positive correlation with protein content (r=-0.28; p <0.5), while the correlation with cooking time was positive but not significant. Coming to E3, there was a significant positive correlation between seed yield and hundred seed weight (r=0.80; p <0.001) as well as with PA/Fe (r=0.24; p <0.05), whereas seed yield was negatively correlated with iron content (r=-0.29; p <0.01). Hundred seed weight revealed a negative significant correlation with iron content (r=-0.40; p <0.001) and positive correlation with PA/Fe ratio (r=0.38; p <0.01). A significant negative association was identified between iron and PA/Fe (r=-0.83; p <0.001), phytic acid (r=-0.32; p <0.01), PA/Zn (r=-0.51; p <0.001) and protein content (r=-0.26; p <0.05). Zinc content revealed a positive correlation between iron content (r=0.42; p <0.001) and cooking time (r=0.26; p <0.05), while a highly significant negative correlation was observed with PA/Zn ratio (r=-0.70; p <0.001). The correlation between phytic acid and PA/Zn was positive and highly significant (r=-0.75; p <0.001), however non-significant correlation was observed between phytic acid and cooking time. For E4, seed yield was positively correlated with the hundred seed weight (r=0.80; p <0.001) and cooking time (r=0.31; p <0.01). Iron content showed a positive correlation with cooking time (r=0.29; p <0.05), while there was no significant correlation with zinc content. In contrast, zinc content was positively correlated with phytic acid (r=0.25; p <0.05) When looking at phytic acid/ micronutrient molar ratio, PA/Fe showed a highly significant positive correlation with phytic acid (r=0.80; p <0.001)and PA/Zn ratio (r=0.63; p <0.001), whereas this ratio showed a significant negative correlation with iron (r=-0.75; p <0.001) and cooking time (r=-0.25; p <0.05). PA/Zn ratio displayed a highly significant positive correlation with phytic acid (r=0.72; p <0.001), and a highly significant negative correlation with zinc content (r=-0.49; p <0.001). For E5, seed yield was highly and positively correlated with the hundred seed yield only (r=0.70; p <0.001). Another positive correlation was observed between iron content and both zinc content (r=0.33; p <0.01) and cooking time (r=0.29; p <0.05). On the other hand, PA/Fe displayed a significant negative correlation with iron content (r=-0.75; p <0.01) and cooking time (r=-0.31; p <0.01). while there was a highly significant positive correlation with phytic acid (r=0.73; p <0.001) and PA/Zn ratio (r=0.73; p <0.001). Similarly, PA/Zn ratio also showed a highly significant positive correlation with phytic acid (r=0.73; p <0.01), whereas there was a significant negative correlation with iron (r=-0.34; p <0.01) and zinc content (r=-0.57; p <0.001). In E6, seed yield was positively correlated with hundred seed yield (r=0.76; p <0.001) and iron content (r=-0.44; p <0.001). The hundred seed yield also showed a positive correlation with iron content (r=0.33; p <0.01). As for phytic acid/micronutrients, PA/Fe revealed a highly significant positive correlation with phytic acid (r=0.66; p <0.001) and PA/Zn ratio (r=0.59; p <0.001), while this ratio showed a highly significant negative association with iron content. Similarly, PA/Zn ratio demonstrated a highly significant positive correlation with phytic acid (r=0.70; p <0.001). Under this environment conditions cooking time displayed a positive but non-significant correlation with phytic acid (Figure 9).
3. Discussion
Abiotic stresses, such as heat and heat combined with drought, are the major challenges to agriculture in various production regions. Heat and combined heat and drought stress conditions, accruing during reproductive stage of lentil, revealed significant negative impact on morphological and agronomical traits, which negatively impact grain yield and nutritional quality. Developing high yielding nutrient dense cultivars combined with high stability across varying heat and heat combined with drought levels is the primary goal of modern breeding programs. Our previous studies reported that heat and heat combined with drought conditions induced a significant reduction in seed yield, seed size, nutritional quality traits [5,7]. Moreover, high temperatures have been linked to a significant accumulation of phytic acid in lentil seeds [5]. However, promising genotypes have been identified, under controlled conditions, and were characterized by high yielding short cooking time, high iron and moderate zinc bioavailability [5]. In this study, 36 lentil genotypes were tested at two different locations, the late planting technique was used to expose flowering and pod filling period to high temperatures (E2 and E5), to maintain heat stress conditions, high-temperature treatment was accompanied by frequent irrigation (E4 and E6). Varied weather conditions were observed in tested environments, the highest rainfall was recorded during January (42 mm) in Marchouch station, whereas higher temperatures (36 °C) were recorded during July in Announcer station. The recorded precipitation and temperatures were found to be different across environments and eventually had a significant effect on the seed yield and nutritional quality parameters of tested genotypes.
The nutritional traits of lentil genotypes varied significantly across environments. Iron content ranged from 5.33 to 11.86 g/100g, with the highest mean (10.22 g/100g) in E4 and the lowest (6.57 g/100g) in E3. High temperature and drought stress reduced iron content by up to 34% in E6. Zinc content followed a similar trend, with E1 showing the highest mean (5.89 g/100g) and E3 experiencing a 28% reduction. Cooking time varied significantly, with the longest duration in E1 (9.82 min) and the shortest in E6 (4.43 min), indicating a 54% reduction under extreme heat and drought. Protein content was highest in E1 (29.66%) and lowest in E6 (21.74%), reflecting the impact of environmental stress on protein accumulation. Phytic acid (PA) levels increased under high temperatures, particularly in E3 and E5, where PA/Fe and PA/Zn molar ratios rose by 95% and 66%, respectively. Our previous findings have also highlighted the impact of high temperature and drought stress on iron, zinc, protein content, cooking time and phytic acid [5,6,7].
Correlation analysis in our study revealed that seed yield was highly correlated with hundred-seed yield across all tested environments. Iron content showed non-significant correlation with seed yield under E1 (No stress) conditions. Similarly, the association between iron content and seed yield remained non-significant under both E4 (No stress) and E5 (Heat stress) environmental conditions which is consistent with our previous findings [5,7]. Conversely, seed yield showed a significant negative correlation with iron content in E2 (Heat stress) and E3 (Heat-drought stress), while a significant positive correlation was observed under E6 (Heat-drought stress) growing conditions. Across tested environmental conditions, seed yield showed a non-significant correlation with zinc content which is in agreement with our findings. In the same way, many researchers reported similar observation in lentil. Similar to our previous outcomes, phytic acid also demonstrated a non-significant correlation with grain yield under all environmental conditions. A positive significant correlation was noticed between seed yield and protein content under environment E1, while under other environment the correlation was non-significant. Seed yield also revealed a positive correlation with cooking time under environment E4, however there was a non-signification correlation under other environments. A positive correlation was observed between seed iron and zinc concentrations under environment E1, E2, and E3, similar results were also reported in lentil (Kumar et al. 2018; Kumar et al. 2019), whereas non-significant correlation was detected under E4, E5 and E6. The presence of phytic acid is a major constraint to iron and zinc intake, our results in this regard showed non-significant correlation with both iron and zinc content under environments E1, E2, E4, E5 and E6, which supports our previous findings. Interestingly, under E3 growing conditions phytic acid revealed a significant negative correlation with iron. Both phytic acid/Micronutrient ratios revealed a significant negative association with iron and zinc, while both ratios were positively and significantly correlated with phytic acid. These correlation patterns explain the reduction in iron and zinc bioavailability in lentil seed. In agreement with our findings, cooking time demonstrated a non-significant correlation with phytic acid under environments E2, E3, E4, E5 and E6. Supporting outcomes were published in lentil [16], In contrast to our earlier findings, cooking time showed a significant negative correlation under environment E1 conditions.
The current study revealed a wide genetic variation among the evaluated genotypes for micronutrients (iron and zinc), protein content, cooking time and antinutrient (phytic acid) under both normal and stress conditions, indicating a promising potential for selecting high levels of these quality traits. Grain yield variation under normal and stress conditions across the tested environments also demonstrated the chance for the selection of higher yielding genotypes with increased Fe, Zn, and protein concentration in the seeds, in addition to low phytic acid level and short cooking.
Selecting stable genotypes through assessment in diverse environments under specific stress conditions is crucial for varietal development. AMMI analysis of variance demonstrated that the genotype (G) and environmental (E) main effects were highly significant differences (P ≤ 0.01) for all evaluated traits, Similarly, the GEI was highly significant (P ≤ 0.001), implying that tested genotypes responded differently across environments. In this present study, a larger proportion of variation was attributed to the environment, indicating that the environment used was different, which resulted in a significant variation of seed yield and nutritional quality traits. The mean yield varied significantly across environments, ranging from 5.15g in E1 to 2.52g E6, this variation reflected the difference in climatic conditions. Mean environment yield was positively related to both temperature and seasonal rainfall. E3 and E6, the lowest yielding environments, whereas E1 and E4, the highest yielding environments, had much seasonal rainfall. A large contribution of the environment was reported in lentil seed yield in earlier studies [17,18,19,20,21]. The variation in nutritional quality traits was also attributed to the effect of environmental conditions. In this study the largest proportion of the total variance in protein content was explained by environmental factors (98.95%), Consequently, lower proportions of total variance were explained by the G and G × E interaction (0.58% and 0.37%, respectively). However, genotype (G) effect was highly significant for CP indicating contrastive performance among genotypes tested across environments. Several studies have also reported the impact of environment on lentil protein content [22,23,24]. Seed iron and zinc contents were also influenced by the environmental effect explaining 96.60% and 92.86% of the total variation respectively. Our results are partially in agreement with those reported by Darai et al., 2020, who indicated that iron and zinc are highly sensitive to environmental fluctuations. Similar studies reported that both micronutrients exhibited considerable environmental interactions [26,27]. On the other hand, our results revealed that genotype (G) contributed less to the total variance for iron and zinc contents. Our results are consistent with previous finding, where genotype (G) explained the least of the total variance for micronutrients including iron and zinc [22]. Long cooking time is one of major limitations to the consumption and utilization of legumes in Africa (Wang et al. 2003). Storage conditions, particularly high temperature and high relative humidity were previously reported to cause the hard-to-cook (HTC) defect (Ndungu et al. 2012). Our results revealed that cooking time in lentil was widely influenced by environmental effect, accounting for 95.36%. Similarly, environment explained 96.71% of the total variation of the phytic acid in lentil. Thavarajah et al. (2010) reported that rising temperatures induced a significant increase of phytic acid in lentil seeds, which is consistent with our result. In addition, a highly significant increase in phytic acid was also observed in response to water scarcity regime in lentil [31]. In our study, G × E interaction explained the least of total variation for all tested quality traits suggesting the potential to develop stables genotypes with a combination of desirable nutritional quality traits. Furthermore, little variation in the genotype was observed due to factors such as variations in rainfall and temperature, resulting in distinct patterns of genotypic performance.
The AMMI stability parameters, including ASTAB, ASI, ASV, AVAMGE, DA, DZ, EV, FA, MASI, MASV, SIPC, and ZA, were calculated to evaluate their efficacy in assessing genotype stability and to determine if they provided consistent comparisons. A genotype is considered more stable in any stability parameter when it has a lower score, and conversely, less stable when it has a higher score. Overall, the stability parameters exhibited a similar trend in identifying stable genotypes. Our results revealed that genotypes displaying high stability remained consistent across nearly all cases, regardless of the specific index used. Similar results were also reported using the same set of stability indices [32]. Interestingly, some of the evaluated genotypes exhibited higher stability for multiple quality traits. Genotype G19 showed higher stability for seed yield, zinc and protein contents. Similarly, Genotype G34 was the most stable for both zinc and protein contents. Genotype G6 demonstrated the highest stability for phytic acid and cooking time.
AMMI (AMMI Model 1 biplot and AMMI Model 2 biplot) and GGE are the most prevalent and highly effective multivariate models utilized for assessing the stability, adaptability and genotypes ranking as well as selecting suitable mega environments (Gauch et al. 2013; Jamshidmoghaddam et al. 2013; Yan et al. 2006). Both models combine the principal component analysis (PCA) and biplot for describing the genotype by environment interaction (G×E). AMMI analysis can effectively identify GEI across diverse environments with varying characteristics by using a biplot model. On the other hand, the GGE biplot allows us to better understand the complex GEI. The GGE model examines genotypes performance under both abiotic and biotic stresses, identifies optimal genotypes and mega-environments from a range of environmental conditions and diverse testing locations (Karimizadeh et al. 2013). In the present study, the 36 lentil accessions responded differently in the diverse environments of E1, E2, E3, E4, E5 and E6. Therefore, the GEI effects are based on the 36 accessions and the six environments assessment using representativeness and discriminativeness abilities, stability vs. mean performance, “which-won-where” pattern, ranking genotypes, and relationship among environments. In this study we identified the optimum genotype using the mean versus stability view of the GGE biplot. The mean performance and stability of 36 genotypes was assessed through the two PCAs and the projections from the abscissa toward the average environment coordinate ordinates (AEC). The abscissa and the ordinate of the average environment coordinate (AEC) are the two lines passing through the origin of the biplot based on singular value partitioning (SVP = 1). The average environment coordination abscissa showed a single direction arrow indicating the ideal genotype’s main effect, while the average environment coordination ordinate with single arrow though outside the biplot illustrated greater mean performance for each (Figure 4). The projection magnitude into the AEC ordinate determines the stability of the genotypes, consequently, a greater projection regardless of the direction signifies greater instability in the genotype.
For seed yield, iron, zinc, phytic acid, crude protein and cooking time the shortest projection was identified for genotypes G26, G3, G19, G2, G3, and G12, respectively, and consequently identified as the most stable. Genotypes G9, G11, G6, G24, G21, and G32 had the longest projection and were therefore recognized as the most unstable. According to Alam et al. (2015) an ideal genotype is characterized by both high mean of tested trait and considerable environmental stability. In the discriminativeness vs. representativeness of the GGE biplot graphs, the environment that forms the smallest angle with the AEA is considered the most representative. Conversely, an environment that lacks discrimination and is positioned near the origin of the biplot yields limited information, making it unsuitable for inclusion in plant breeding studies aimed at cultivar release. Instead, the most informative and discriminative environment occupies a distinct position in the graph [33,35]. In our study, the most discriminating and representative environment was E1 for seed yield, iron content and cooking time, E5 for phytic acid and protein content, E4 for zinc content and cooking time. Our findings revealed that E1 was the most desirable environment for seed yield and cooking time, while E4 and E2 were regarded as the ideal environment for iron and zinc content. Similarly, E5 was the most desirable environment for phytic acid and crude protein. Considering the representativeness and discriminative capacity of tested environments, the evaluated genotype identified the most appropriate environment for evaluating the mega-environment. The “which-won-where” biplot distinguishes variations in mega-environments, indicating environments suitable for genotype adaptability, the top-performing genotypes within each mega-environment, and the ideal genotype exhibiting both high agronomic performance and stability [38]. In this study, different mega-environments were identified for each trait, each mega-environment has different winning genotypes. This helps in understanding the complex genotype-environment interaction within a specific region. Additionally, genotypes specifically adapted to a particular mega-environment make it easier for breeders to develop environment-specific genotypes [39]. Both AMMI and GGE analyses demonstrated to be helpful in investigating genotype-environment interaction (GEI) in this study. As stability analysis for yield becomes integral to plant breeding programs, the development of new and advanced models aims to enhance our understanding of genotype-environment interactions. Interestingly, the results from GGE and AMMI analyses were largely consistent in identifying stable genotypes for each mega-environment, which is in consistence with previous study on using AMMI and GGE biplot to estimate G × E interaction of lentil Genotypes [20].
4. Materials and Methods
4.1. Plant Material
A total of 36 lentil genotypes were used in this study, previously tested for nutritional quality traits and yield components. Seeds were obtained from the International Center of Agricultural Research in the Dry Areas genebank, Rabat, Morocco.
4.2. Field Experiment
Experiment was conducted during 2019-2020 cropping season under two diverse environments in Morocco, corresponding to the following research station: ICARDA experimental research station at Merchouch and INRA research station at Announcer. The bioclimatic variation at the two locations offers differences in soil type, precipitation, and maximum and minimum temperature. Merchouch station is located 70 km south-east of Rabat (33.36°N 6.43° W, 390 m altitude). This station is characterized by a semi-arid environment, low rainfall and moderate temperature during winter and spring seasons. Daily weather data was recorded at the site. The annual average temperature was 16°C, while the annual average rainfall was 323 mm. The soil at Merchouch is Vertisol and deficient in nitrogen with a pH level of 8.50. Annoucer station is drought and cold station, winter in this station is characterized by cold and wet climate. The annual average temperature was 13°C and ranged from -8°C to 22°C. The average annual precipitation was 337.4 mm, and the soils is lime-clay with a pH of 8.35.
At both locations, experiments were conducted in a randomized complete block design (RCBD) with two replications. Each genotype was grown in a 2-row plot of 1 m length, with a spacing of 30 cm between rows. In each row, 25 seeds were sown by hand at a 2-cm depth maintaining 10-cm space between plants. In each site, three separate experiments involving the same set of genotypes were planted side by side on two sowing dates. Normal sowing (treatment A) was carried out during the last week of December 2019, while late sowing took place in the first week of February 2020 at all the experimental locations to impose heat stress during the flowering stage. For the late, two different experiments were conducted, namely late planting with irrigation (treatment B) at field capacity throughout the crop period, and late planting without irrigation (treatment C) during the reproductive phase. All recommended agronomic packages of practices were followed to raise a successful crop, including nutrient and weed management throughout the growing season.
4.3. Mineral Concentration
Five hundred milligrams from each sample were decomposed in a digestion block (QBlock series, Ontario, Canada) using 6 mL concentrated (70%) nitric acid (HNO3). The mixture was heated for 60 min at 90 °C. Three millilitres of 30% hydrogen peroxide (H2O2) were added, and samples were further heated for 15 min at 90°C until a colourless liquid was obtained. Then, 3 mL of 6 M hydrochloric acid (HCl) was added. After cooling to room temperature, the volume was filtered and diluted to 1:10 using deionized water. Fe and Zn concentrations were measured using inductively coupled plasma-optical emission spectroscopy (ICP-OES); (ICAP-7000 Duo, Thermo Fisher Scientific, France). Calibration curves for Fe and Zn were made using serial dilution from 0.1 to 10 mg L-1. Measurements of total Fe and Zn concentration were validated using NIST standard reference material.
4.4. Protein Concentration
Total nitrogen in seeds was determined by micro-Kjeldahl method as per the procedure suggested by [40]. Three hundred grams of lentil flour was digested with a mixture of concentrated sulfuric acid (H2SO4), salicylic acid and selenium (catalyst) at 300C for five hours. Seed protein contents were calculated by multiplying the nitrogen values by 6.25. Triplicate analyses were carried out on each sample.
4.4. Phytic Acid Concentration
The concentration of phytic acid in lentil seeds was determined using a Megazyme kit following the provided protocol (Megazyme). One gram of ground lentil seed was digested with 20 mL of HCl (0.66 M) solution in 50 ml flacon tubes and placed in a shaker overnight (15 h) at room temperature. Afterward, 1 mL of the resulting extract was subjected to several enzymatic reactions to release inorganic phosphorus (Pi) from phytic acid. The inorganic phosphorus (Pi) was then reacted with ammonium molybdate to form 12-molybdophosphoric acid, which is subsequently reduced under acidic conditions to molybdenum blue. The amount of molybdenum blue formed in this reaction is proportional to the amount of Pi present in the original sample and hence to phytic acid. A UV-Visible spectrophotometer (T80 series, pg instruments, UK) was used to measure the absorbance of molybdenum blue at 655 nm. The phosphorus solutions were prepared as described by the Megazyme manual, using a standard phosphorus solution (24 mL, 50 µg/mL), and treated as samples for the colorimetric determination of phosphorus.
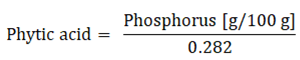
The amount of inorganic phosphorus (Pi) was calculated from the generated calibration curve, and the phytic acid content was estimated assuming that the measured phosphorus was exclusively released from phytic acid and accounted for 28.2% of phytic acid.
4.5. Seed Siaze and Seed Shape Parameters
The hundred-seed weight and seed geometry were assessed through image analysis using a high-speed seed counting device known as OptoAgri2, developed by Optomachine in France. The OptoAgri2 system integrates a high-resolution camera depending on the grain size, a laboratory balance, and specialized software equipped with an algorithm developed by OPTOmachine for image processing. This software facilitates the measurement of several seed attributes, including area, perimeter, length, width, circularity, diameter, thickness, and rugosity. Furthermore, it also computes the hundred-seed weight.
4.5. Cooking Time
An automated Mattson Cooker was used to determine the cooking time for lentil seeds. This device featured a cooking rack with 25 holes, each accommodating a 2 mm tip diameter weighted plunger weighing 80 g. Before the cooking process, 2 g of lentil seeds were soaked in 50 mL of distilled water for 12 hours at room temperature. Following the soaking period, 25 soaked lentil seeds were randomly distributed, with one placed in each of the 25 perforations on the rack. The tips of the plungers were positioned atop the seeds. The loaded Mattson Cooker was then immersed in a 2 L beaker filled with 1.5 L of boiling distilled water, and the beaker was covered to minimize evaporation. The entire setup was heated directly using a hot plate at 390°C, and the cooking time was tracked using the Easy CT program.
Cooking time represented the duration required for 80% of the lentil seeds to be pierced, indicating they were adequately cooked. As the plungers penetrated the seeds and encountered the sensor on the fourth rack, the program automatically recorded the cooking time.
4.6. Statistical Analyses
Statistical analyses and data visualization were performed utilizing R version 4.2.1. Summary data was reported as range and mean values ± standard deviation. Boxplots of seed yield and nutritional quality traits were visualized using the ‘ggplot2’, ‘dplyr’ packages. The mean significance of seed yield and nutritional quality traits was determined via one-way analysis of variance (ANOVA) with Tukey’s test for mean comparison (p ≤ 0.05) using the ‘multcompview’ package. Network correlations between seed yield and nutritional quality traits were analysed via Pearson’s correlation coefficient (p ≤ 0.05) using the ‘corrr’ package. Analysis of variance (ANOVA) was used to test the effects of genotypes (G), environment (E) and genotype x environment interaction (GEI) on the measured traits.
The Additive Main Effects and Multiplicative Interaction (AMMI) model was employed to evaluate the impact of genotype by environment interaction assess adaptability and stability of the lentil genotypes across environments. The AMMI model dissects the sum of squares into principal component axes known as interaction principal component (IPC) axes.
AMMI partitions the sum of squares into interaction principal component (IPC) axes. The AMMI analysis of variance summarizes most of the magnitude of GEI into one or few interactions principal component axes (IPCA). The AMMI model equation is given a:
Yij= µ + Gi + Ej + (∑KnVniSni) + Qij + eij
Where Yij = the observed traits of genotype i in environment j, µ = the grand mean, Gi = the additive effect of the ith genotype (genotype means minus the grand mean), Ej = the additive effect of the jth environment (environment mean deviation), Kn = the eigenvalue of the interaction principal component (IPCA) axis n, Vni and Sni = scores for the genotype i and environment j for the PCA axis n, Qij = the residual for the first n multiplicative components, eij = the error.
The Genotype main effect, in addition to the Genotype-by-Environment Interaction (GGE), was used to evaluate genotypes for their average performance and stability. This approach also facilitated an environmental assessment, allowing the determination of each genotype’s ability to distinguish itself in the specific target environment.
4.7. Estimation of AMMI-Based Stability Indexes
The AMMI-based stability parameters (ASTABs), such as averages of the squared eigenvector values (EV) [42], Annicchiarico’s D parameter (D) [43], sums of absolute value of the interaction principal component scores (SIPC) [44] ASV [45], AMMI statistical coefficient or AMMI distance or ASI or Zhang’s D parameter (DZ) [46], ASTAB [47], sum across environments of the absolute value of GEI modelled by AMMI (AVAMGE) [48], stability measure based on fitted AMMI model (FA) [48], absolute value of the relative contribution of IPCs to the interaction (Za) [48], ASI [49], MASI [50], weighted average of absolute scores (WAAS) [51] and MASV [52] were computed.
5. Conclusions
The 36 lentil genotypes used in the present study displayed varying responses for seed yield, seed size and seed nutritional quality across the six test environments due to the effect of genotype-environment interactions (GEI). Exploring genotype adaptability and stability through multi-environment trials (METs) of lentil genotypes yielded valuable insights into their performance across different environmental conditions. In this study, both AMMI and GGE models were particularly effective in quantifying the magnitude of genotype, environment, and genotype-environment interaction, providing a clearer understanding of stability and adaptability. Accordingly, the combined analysis of variance revealed highly significant variation for seed yield, seed size and nutritional quality traits among genotypes, environments, and genotype × environment interaction. The AMMI analysis of variance in this study showed that the performances of evaluated traits were predominantly influenced by environmental effects, followed by genotype and genotype × environment interaction. Different AMMI-based stability parameters used in this study, such as ASTAB, ASI, ASV, AVAMGE, DA, DZ, EV, FA, MASI, MASV, SIPC, ZA and WAAZ, proved equally effective in identifying stable genotypes. All AMMI-based statistical models showed similar effectiveness in identifying stable, high-yielding genotypes and desirable nutritional quality traits, suggesting that any of these methods can be used as an alternative approach. Based on the analysis, genotypes G19 and G1 have demonstrated higher stability for grain yield. Genotypes G4 and G16 exhibit promise for iron content improvement, while genotypes G34 and G25 show potential for enhancing zinc content. Genotype G19 and G34 were the most stable for protein content. Considering our results, a crossing program between these genotypes appears to be a promising strategy for developing high-yielding varieties with improved nutritional quality traits. However, additional lentil trials over locations and over years may be initiated to clearly identify and decide possible mega environments and breeding approaches.
Supplementary Materials
The following supporting information can be downloaded at the website of this paper posted on Preprints.org, Table S1: AMMI-based stability indexes estimation of thirty-six lentil genotypes; Table S2: Range and mean performance for seed yield, seed size and shape parameters of thirty-six lentil genotypes tested across six environments; Table S3: Range and mean performance for seed nutritional quality traits and micronutrient bioavailability of thirty-six lentil genotypes tested across six environments.
Author Contributions
“Conceptualization, S.K. and H.C.; methodology, H.C; software, H.C.; validation, S.K., A.S., and H.C.; statistical analysis, H.C.; investigation, H.C., K.A., and K.H.; data curation, S.K.; H.C., and N.H.; writing—original draft preparation, H.C.; writing—review and editing, S.K.; N.H., A.S., and H.C.; supervision, S.K., and A.S. All authors have read and agreed to the published version of the manuscript.
Funding
The partial funding support provided by the CGIAR Research Program on Grain Legumes and Dryland Cereals (GLDC) and Government of India is duly acknowledged.
Data Availability Statement
The data are available within the article and the Supplementary Materials.
Conflicts of Interest
The authors declare no conflicts of interest.
References
- J. Tang, S. Sokhansanj, and F. W. Sosulski. Moisture-absorption characteristics of laird lentils and hardshell seeds. Cereal Chem. 1994, 71, 423–427. [Google Scholar]
- J. A. Wood. Evaluation of cooking time in pulses: A review. Cereal Chem. 2017, 94, 32–48. [Google Scholar] [CrossRef]
- FAOSTAT. Food and Agriculture Organization Corporate Statistical Database.
- M. Habib-ur-Rahman et al. Impact of climate change on agricultural production; Issues, challenges, and opportunities in Asia. Front. Plant Sci. 2022, 13, 925548. [Google Scholar] [CrossRef]
- H. Choukri et al. Effect of high temperature stress during the reproductive stage on grain yield and nutritional quality of lentil (Lens culinaris Medikus). Front. Nutr. 2022, 9, 857469. [Google Scholar] [CrossRef]
- N. El Haddad et al. High-temperature and drought stress effects on growth, yield and nutritional quality with transpiration response to vapor pressure deficit in lentil. Plants 2021, 11, 95. [Google Scholar] [CrossRef]
- H. Choukri et al. Heat and drought stress impact on phenology, grain yield, and nutritional quality of lentil (Lens culinaris Medikus). Front. Nutr. 2020, 7, 596307. [Google Scholar] [CrossRef]
- K. Sita et al. Impact of heat stress during seed filling on seed quality and seed yield in lentil (Lens culinaris Medikus) genotypes. J. Sci. Food Agric. 2018, 98, 5134–5141. [Google Scholar] [CrossRef]
- D. Sen Gupta et al. Lentils (Lens culinaris Medik): Nutritional Profile and Biofortification Prospects BT - Compendium of Crop Genome Designing for Nutraceuticals. C. Kole, Ed., Singapore: Springer Nature Singapore, 2023, 1–27. [CrossRef]
- R. Shrestha et al. Genotypic variability and genotype× environment interaction for iron and zinc content in lentil under Nepalese environments. Crop Sci. 2018, 58, 2503–2510. [Google Scholar] [CrossRef]
- W. Erskine, P. C. Williams, and H. Nakkoul. Genetic and environmental variation in the seed size, protein, yield, and cooking quality of lentils. F. CroRes. 1985, 12, 153–161. [Google Scholar] [CrossRef]
- W. Yan, M. S. Kang, B. Ma, S. Woods, and P. L. Cornelius. GGE biplot vs. AMMI analysis of genotype-by-environment data. Crop Sci. 2007, 47, 643–653. [Google Scholar] [CrossRef]
- H. G. Gauch. Model Selection and Validation for Yield Trials with Interaction. Biometrics 1988, 44, 705–715. [Google Scholar] [CrossRef]
- H. Kumar et al. Genetic dissection of grain iron and zinc concentrations in lentil (Lens culinaris Medik.). J. Genet. 2019, 98, 1–14. [Google Scholar] [CrossRef]
- J. Kumar, D. Thavarajah, S. Kumar, A. Sarker, and N. P. Singh. Analysis of genetic variability and genotype× environment interactions for iron and zinc content among diverse genotypes of lentil. J. Food Sci. Technol. 2018, 55, 3592–3605. [Google Scholar] [CrossRef]
- R. S. Bhatty. Comparisons of good-and poor-cooking lentils. J. Sci. Food Agric. 1995, 68, 489–496. [Google Scholar] [CrossRef]
- H. Dehghani, S. H. Sabaghpour, and N. Sabaghnia. Genotype× environment interaction for grain yield of some lentil genotypes and relationship among univariate stability statistics. Spanish J. Agric. Res. 2008, 6, 385–394. [Google Scholar] [CrossRef]
- S. R. E. Abo-Hegazy, T. Selim, and A. A. M. Ashrie. Genotype× environment interaction and stability analysis for yield and its components in lentil. J. Plant Breed. Crop Sci 2013, 5, 85–90. [Google Scholar] [CrossRef]
- N. K. Yadav, S. K. Ghimire, B. P. Sah, A. Sarker, S. M. Shrestha, and S. K. Sah. Genotype x environment interaction and stability analysis in lentil (Lens culinaris Medik.). Int. J. Environ. Agric. Biotechnol. 2016, 1, 238539. [Google Scholar] [CrossRef]
- M. Ghaffar, M. J. M. Ghaffar, M. J. Asghar, M. Shahid, and J. Hussain. Estimation of G× E Interaction of Lentil Genotypes for Yield using AMMI and GGE Biplot in Pakistan. J. Soil Sci. Plant Nutr. 2023, 1–15. [Google Scholar] [CrossRef]
- G. Abbas, M. J. Asghar, M. Shahid, J. Hussain, M. Akram, and F. Ahmad. Yield performance of some lentil genotypes over different environments. Agrosystems, Geosci. Environ. 2019, 2, 1–3. [Google Scholar] [CrossRef]
- M. Tziouvalekas et al. Seed Yield, Crude Protein and Mineral Nutrients of Lentil Genotypes Evaluated across Diverse Environments under Organic and Conventional Farming. Plants 2022, 11, 3328. [Google Scholar] [CrossRef]
- M. H. Sellami, C. Pulvento, and A. Lavini. Selection of suitable genotypes of lentil (Lens culinaris Medik.) under rainfed conditions in south Italy using multi-trait stability index (MTSI). Agronomy 2021, 11, 1807. [Google Scholar] [CrossRef]
- C. Chen et al. Evaluation of environment and cultivar impact on lentil protein, starch, mineral nutrients, and yield. Crop Sci. 2022, 62, 893–905. [Google Scholar] [CrossRef]
- R. Darai, A. Sarker, M. P. Pandey, K. Dhakal, S. Kumar, and R. Sah. Genetic variability and genotype X environment interactions effect on grain iron (Fe) and zinc (Zn) concentration in lentils and their characterization under Terai environments of Nepal. Adv. Nutr. Food Sci. 2020, 5, 1–12. [Google Scholar] [CrossRef]
- S. Gupta et al. Genotype by environment interaction effect on grain iron and zinc concentration of indian and mediterranean lentil genotypes. Agronomy 2021, 11, 1761. [Google Scholar] [CrossRef]
- S. Bhattacharya, A. Das, J. Banerjee, S. N. Mandal, S. Kumar, and S. Gupta. Elucidating genetic variability and genotype× environment interactions for grain iron and zinc content among diverse genotypes of lentils (Lens culinaris). Plant Breed. 2022, 141, 786–800. [Google Scholar] [CrossRef]
- N. Wang, J. K. Daun, and L. J. Malcolmson. Relationship between physicochemical and cooking properties, and effects of cooking on antinutrients, of yellow field peas (Pisum sativum). J. Sci. Food Agric. 2003, 83, 1228–1237. [Google Scholar] [CrossRef]
- K. E. Ndungu, M. N. Emmambux, and A. Minnaar. Micronisation and hot air roasting of cowpeas as pretreatments to control the development of hard-to-cook phenomenon. J. Sci. Food Agric. 2012, 92, 1194–1200. [Google Scholar] [CrossRef]
- P. Thavarajah, C.-T. See, and A. Vandenberg. Phytic acid and Fe and Zn concentration in lentil (Lens culinaris L.) seeds is influenced by temperature during seed filling period. Food Chem. 2010, 122, 254–259. [Google Scholar] [CrossRef]
- R. Bansal et al. Seed nutritional quality in lentil (Lens culinaris) under different moisture regimes. Front. Nutr. 2023, 10, 1141040. [Google Scholar] [CrossRef]
- N. Anuradha et al. Comparative study of AMMI-and BLUP-based simultaneous selection for grain yield and stability of finger millet [Eleusine coracana (L.) Gaertn.] genotypes. Front. Plant Sci. 2022, 12, 786839. [Google Scholar] [CrossRef]
- M. Jamshidmoghaddam and S. S. Pourdad. Genotype× environment interactions for seed yield in rainfed winter safflower (Carthamus tinctorius L.) multi-environment trials in Iran. Euphytica 2013, 190, 357–369. [Google Scholar] [CrossRef]
- H. G. Gauch Jr. A simple protocol for AMMI analysis of yield trials. Crop Sci. 2013, 53, 1860–1869. [Google Scholar] [CrossRef]
- W. Yan and N. A. Tinker. Biplot analysis of multi-environment trial data: Principles and applications. Can. J. plant Sci. 2006, 86, 623–645. [Google Scholar] [CrossRef]
- R. KARIMIZADEH et al. GGE biplot analysis of yield stability in multi-environment trials of lentil genotypes under rainfed condition. Not. Sci. Biol. 2013, 5, 256–262. [Google Scholar] [CrossRef]
- M. A. Alam et al. Yield stability of newly released wheat varieties in multi-environments of Bangladesh. Int. J. Plant Soil Sci. 2015, 6, 150–161. [Google Scholar] [CrossRef]
- W. Yan. GGEbiplot—A Windows application for graphical analysis of multienvironment trial data and other types of two-way data. Agron. J. 2001, 93, 1111–1118. [Google Scholar] [CrossRef]
- W. Yan, D. Pageau, J. Frégeau-Reid, and J. Durand. Assessing the representativeness and repeatability of test locations for genotype evaluation. Crop Sci. 2011, 51, 1603–1610. [Google Scholar] [CrossRef]
- W. E. Baethgen and M. M. Alley. A manual colorimetric procedure for measuring ammonium nitrogen in soil and plant Kjeldahl digests. Commun. Soil Sci. Plant Anal. 1989, 10, 961–969. [Google Scholar] [CrossRef]
- Megazyme. Phytic acid assay kit.
- R. W. Zobel. Stress resistance and root systems. in Proceedings of the Workshop on Adaptation of Plants to Soil Stress. Institute of Agriculture and Natural Resources, University of Nebraska-Lincoln, NE, USA, 1994, 80–99.
- P. Annicchiarico. Joint regression vs AMMI analysis of genotype-environment interactions for cereals in Italy. Euphytica, vol. 1997, 94, 53–62. [Google Scholar] [CrossRef]
- H. F. Smith. A discriminant function for plant selection. Ann. Eugen. 1936, 7, 240–250. [Google Scholar] [CrossRef]
- J. L. Purchase. Parametric analysis to describe genotype x environment interaction and yield stability in winter wheat. University of the Free State, 1997.
- Z. Ze, L. Cheng, and X. Zhonghuai. Analysis of variety stability based on AMMI model. Zuo wu xue bao 1998, 24, 304–309. [Google Scholar]
- R. Rao and V. T. Prabhakaran. Use ofAMMI in Simultaneous selection of genotypes for yield and stability. J. Indian Soc. Agric. Stat. 2005, 76–82. [Google Scholar]
- H. Zali, E. Farshadfar, S. H. Sabaghpour, and R. Karimizadeh. Evaluation of genotype× environment interaction in chickpea using measures of stability from AMMI model. Ann. Biol. Res. 2012, 3, 3126–3136. [Google Scholar]
- N. N. Jambhulkar et al. Stability analysis for grain yield in rice in demonstrations conducted during rabi season in India. Oryza-An Int. J. Rice 2017, 54, 234–238. [Google Scholar] [CrossRef]
- C. Ajay et al. Modified AMMI Stability Index (MASI) for stability analysis. ICAR-DGR Newsl 2018, 18, 4–5. [Google Scholar]
- T. Olivoto, A. D. C. Lúcio, J. A. G. da Silva, V. S. Marchioro, V. Q. de Souza, and E. Jost. Mean performance and stability in multi-environment trials I: combining features of AMMI and BLUP techniques. Agron. J. 2019, 111, 2949–2960. [Google Scholar] [CrossRef]
- A. Chandrashekar et al. Rectification of modified AMMI stability value (MASV). Indian J. Genet. Plant Breed. 2019, 79, 726–731. [Google Scholar] [CrossRef]
Figure 1.
Proportion of total variance explained by genotype, environment and GxE interaction for evaluated traits.
Figure 1.
Proportion of total variance explained by genotype, environment and GxE interaction for evaluated traits.
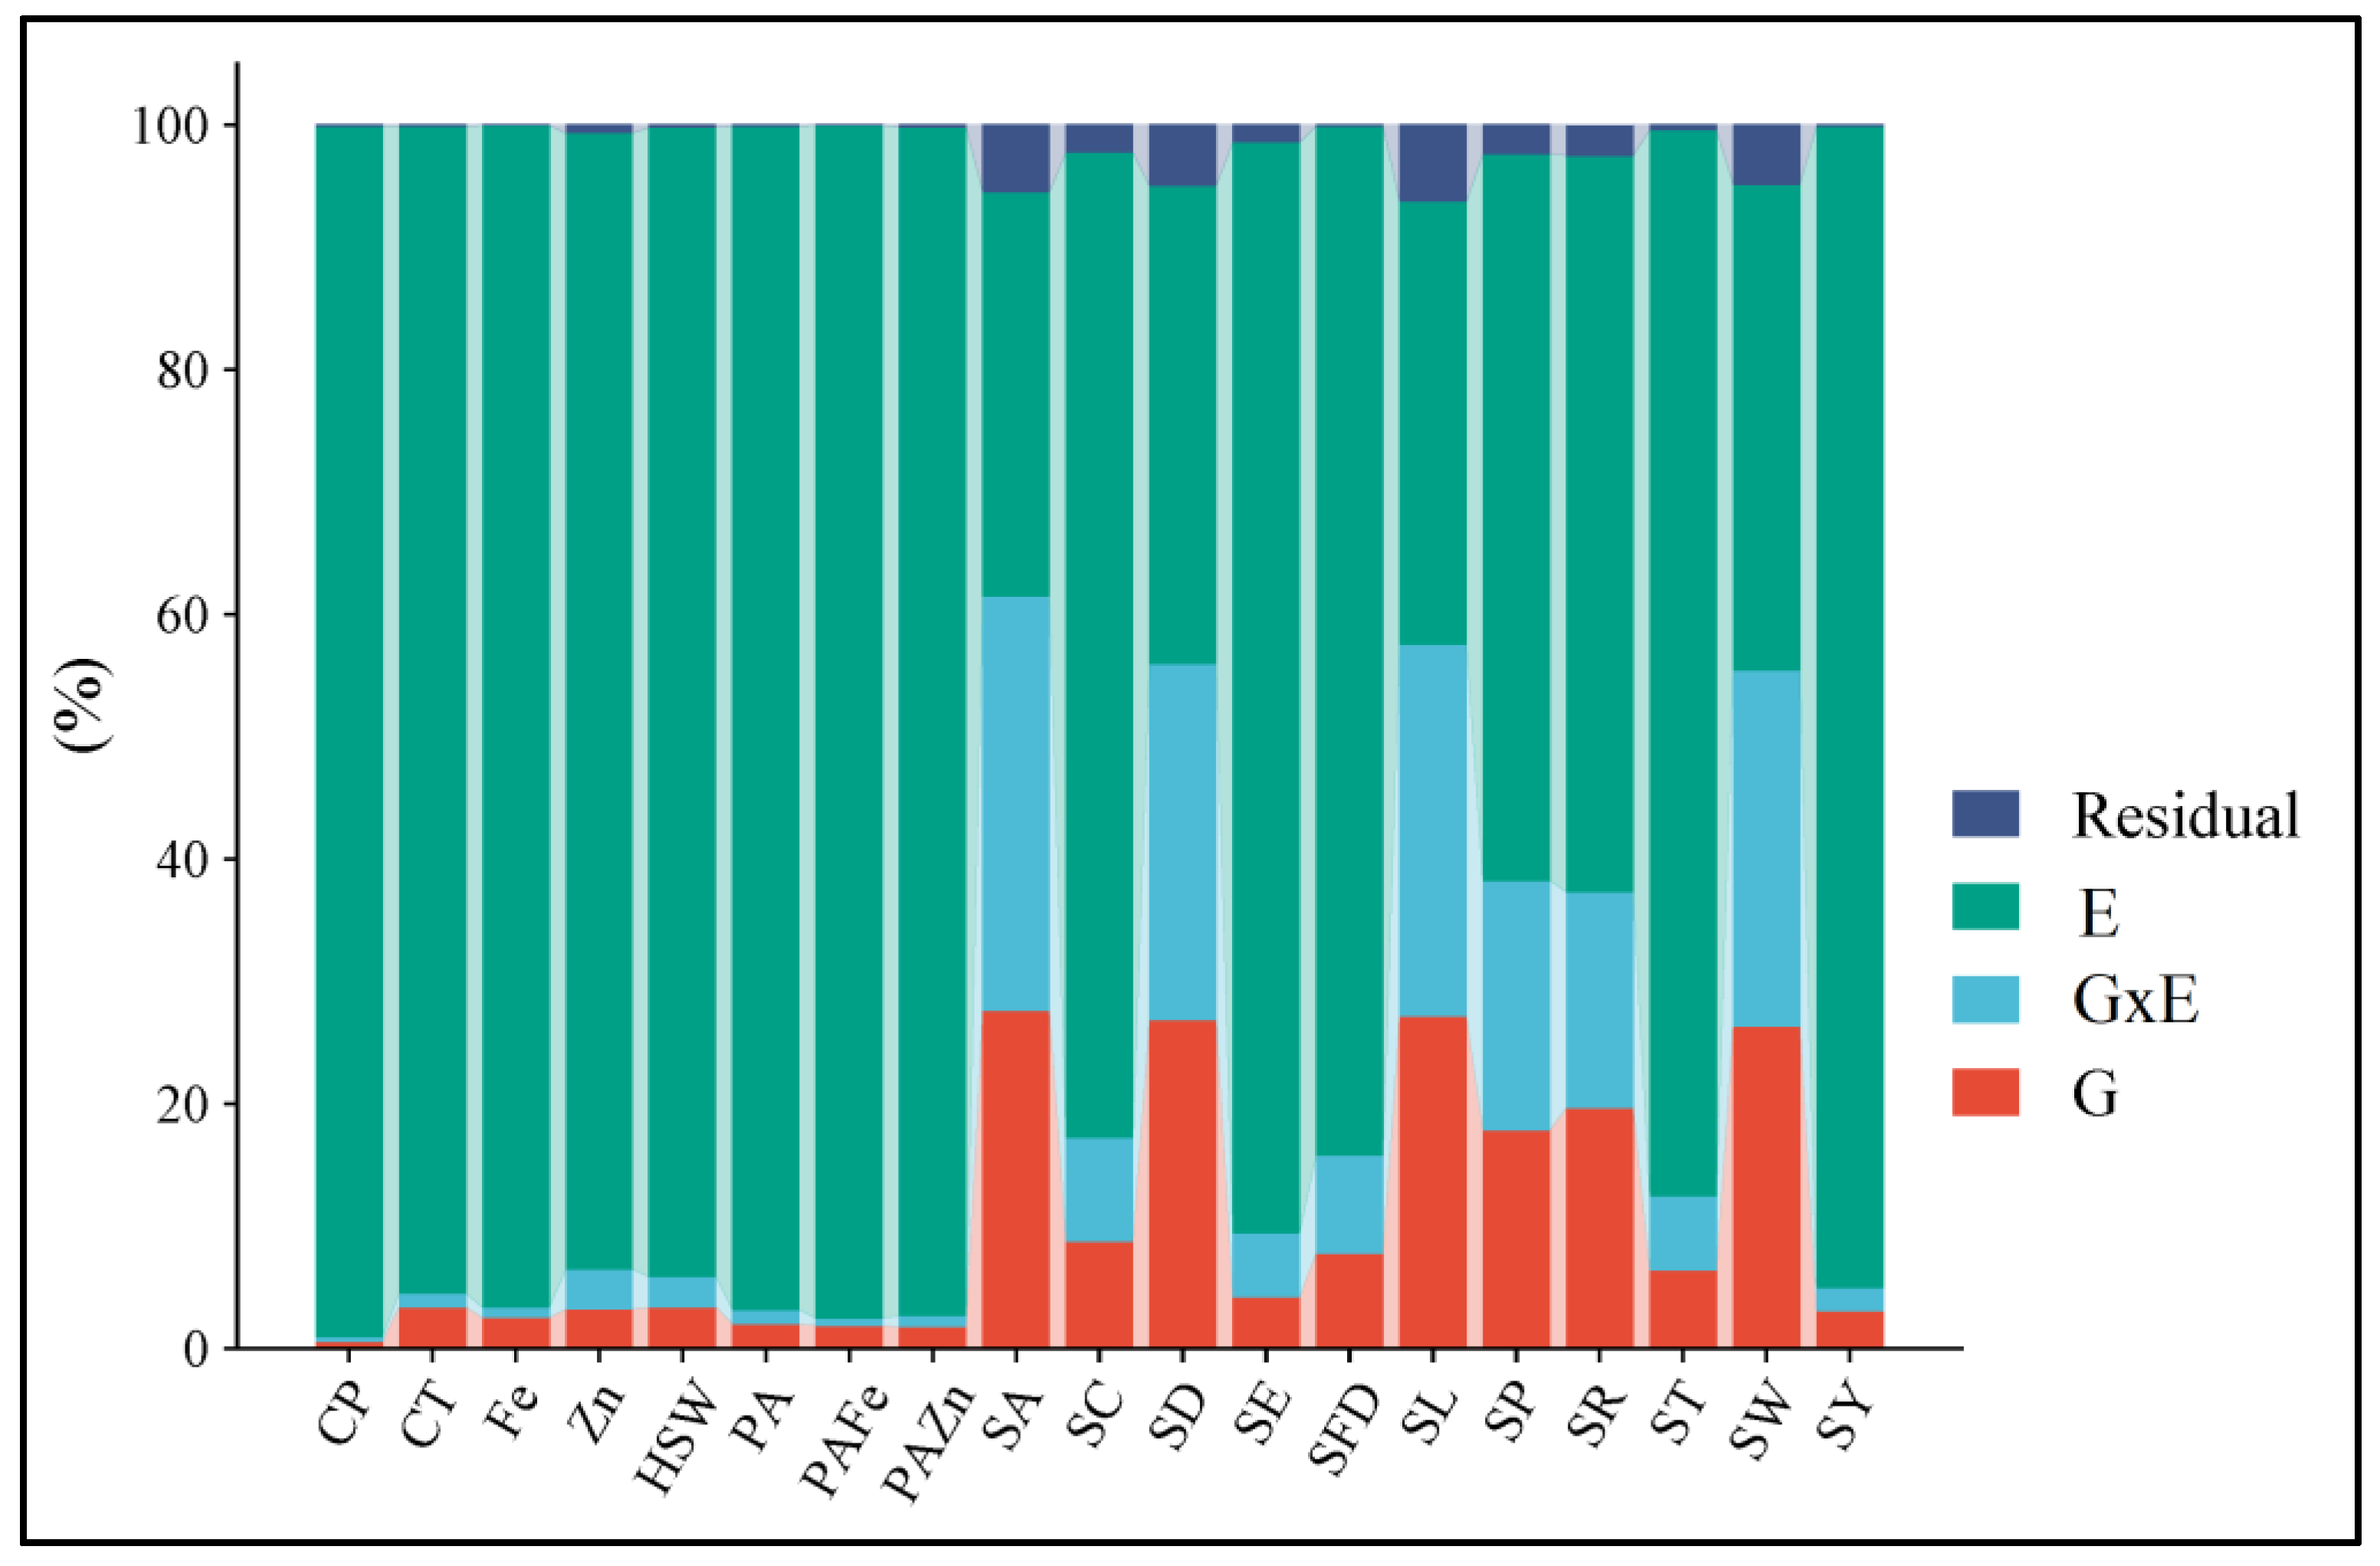
Figure 2.
Patterns (a–f). Additive main effects and multiplicative interaction 1 (AMMI 1) biplots based on PC1 illustrating G × E interactions of the 36 lentil accessions under six environments. (a) SY, Seed yield (g); Fe, (b) Iron content (mg/100 g); (c) Zn, Zinc content (mg/100 g); (d) PA, Phytic acid (g/100 g); (e) CP, Crude protein (g/100 g); (f) CT, Cooking time (min).
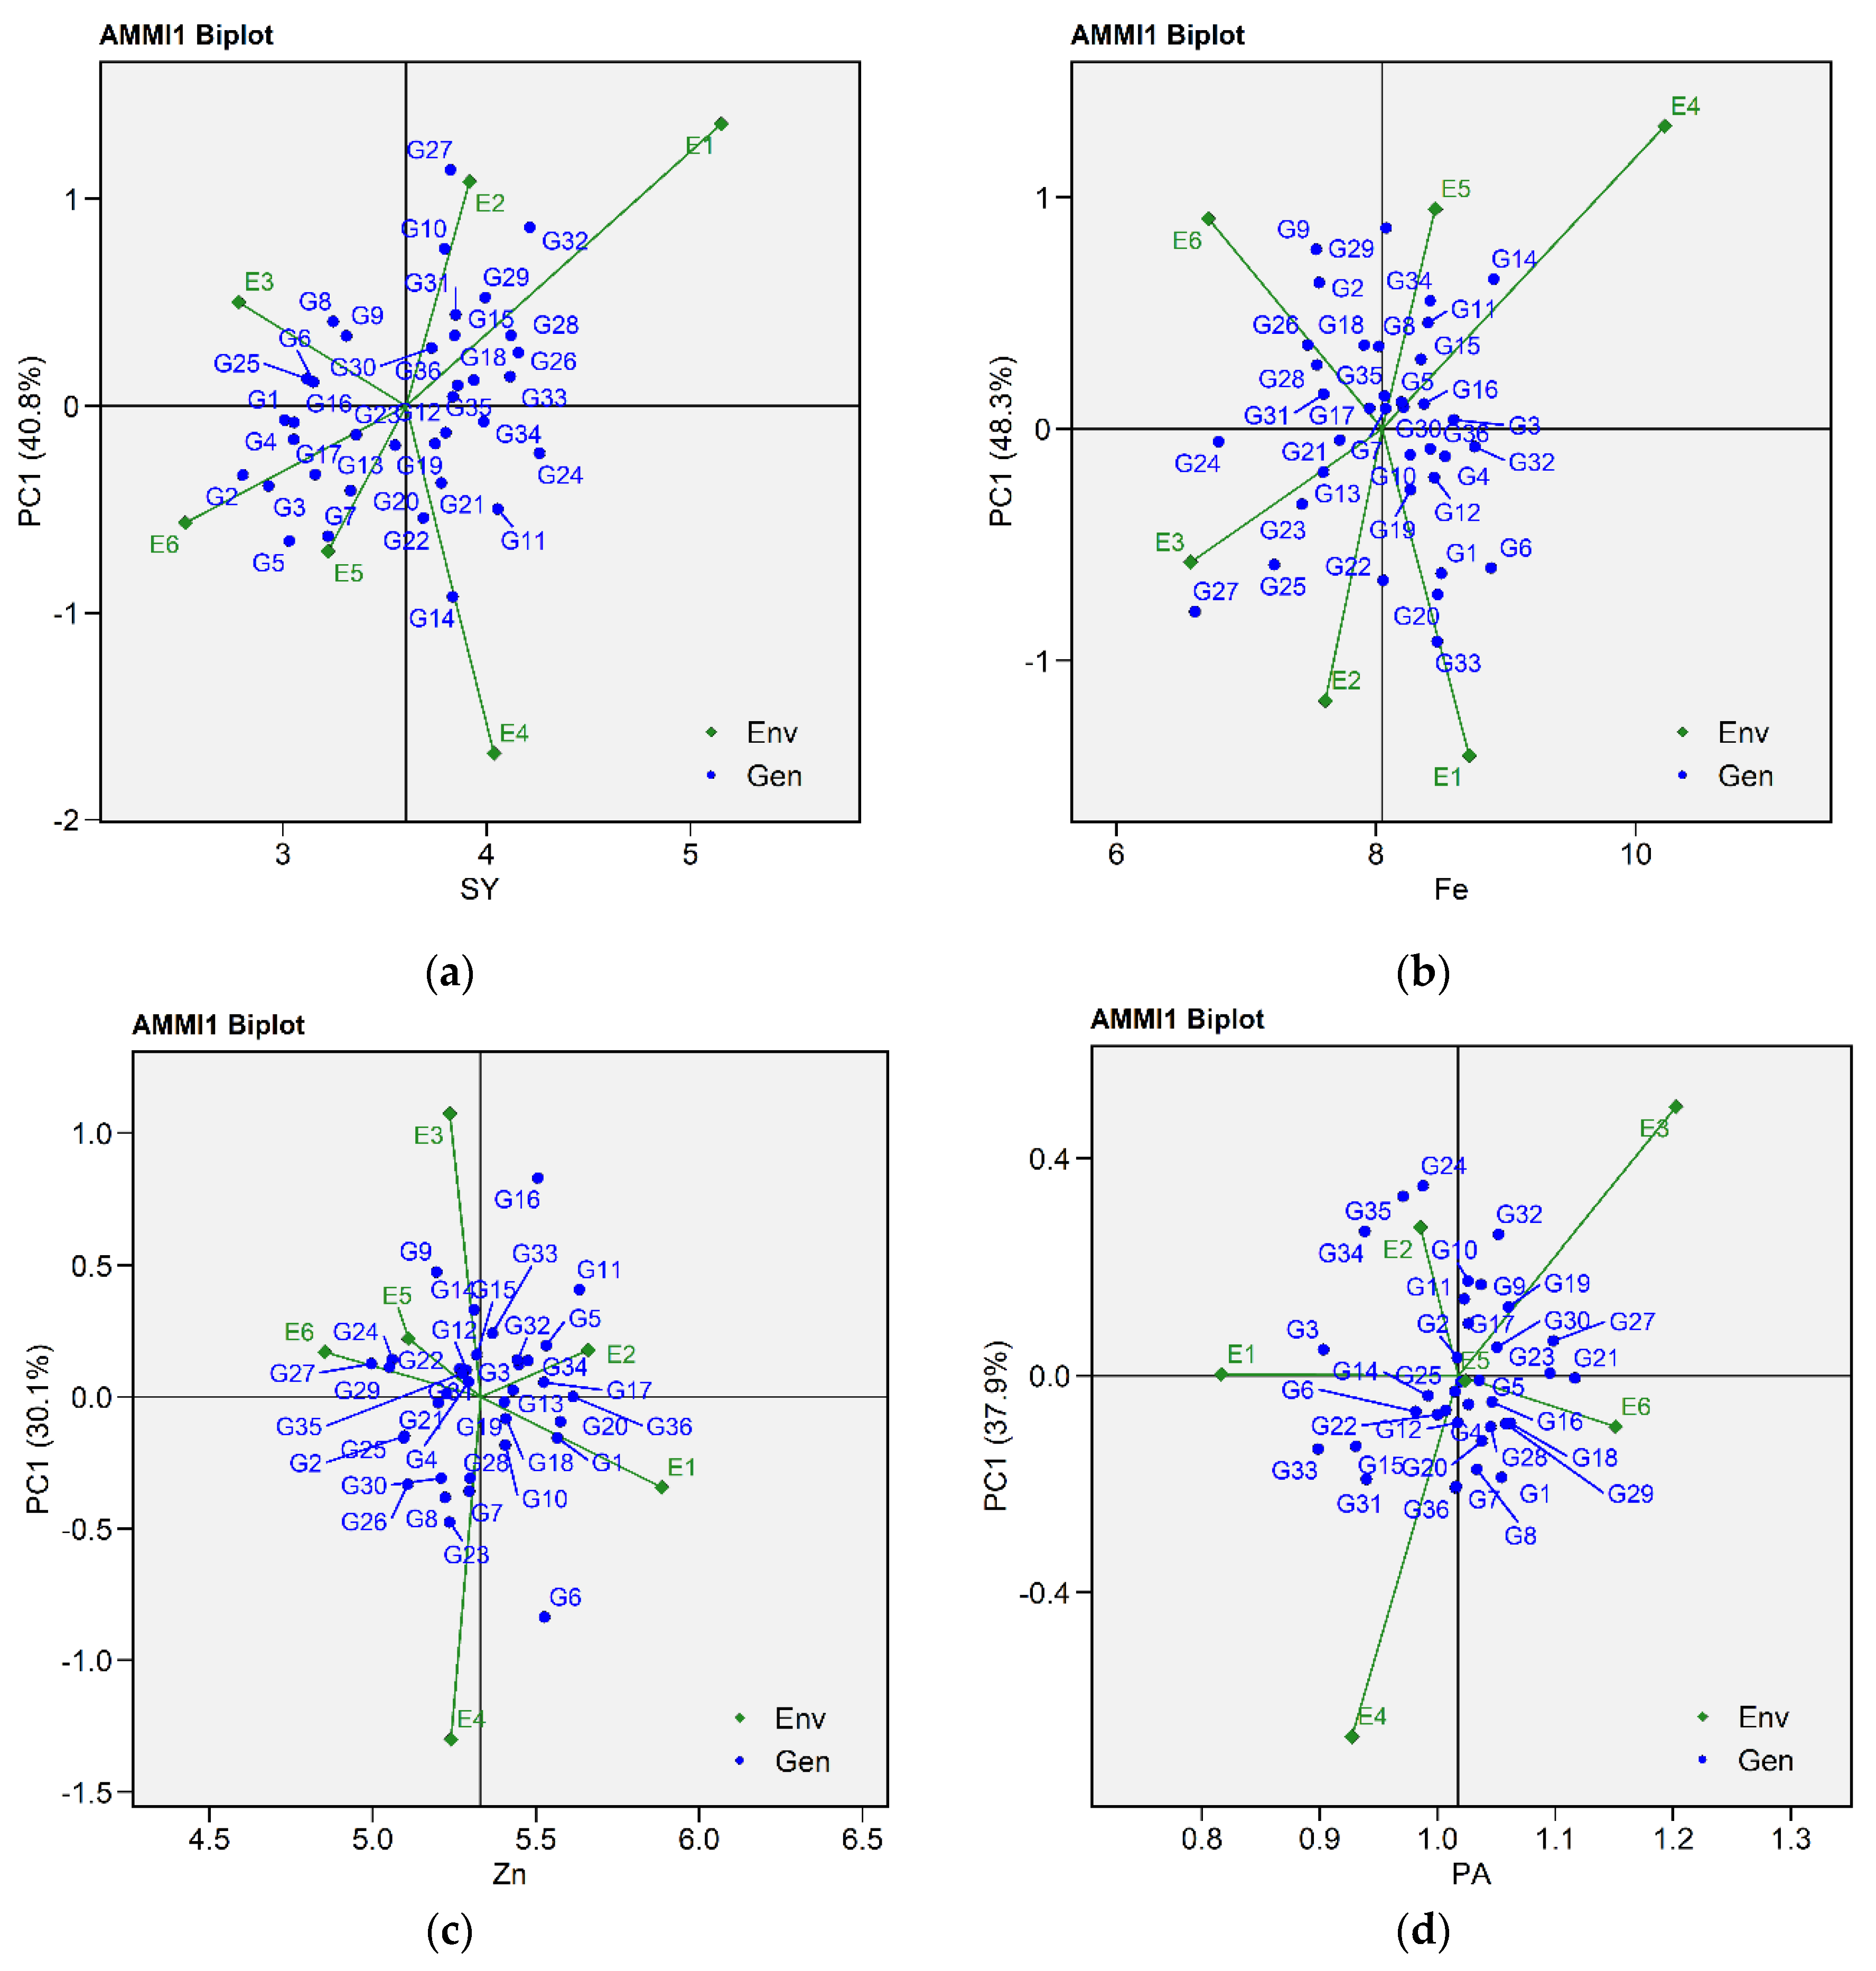
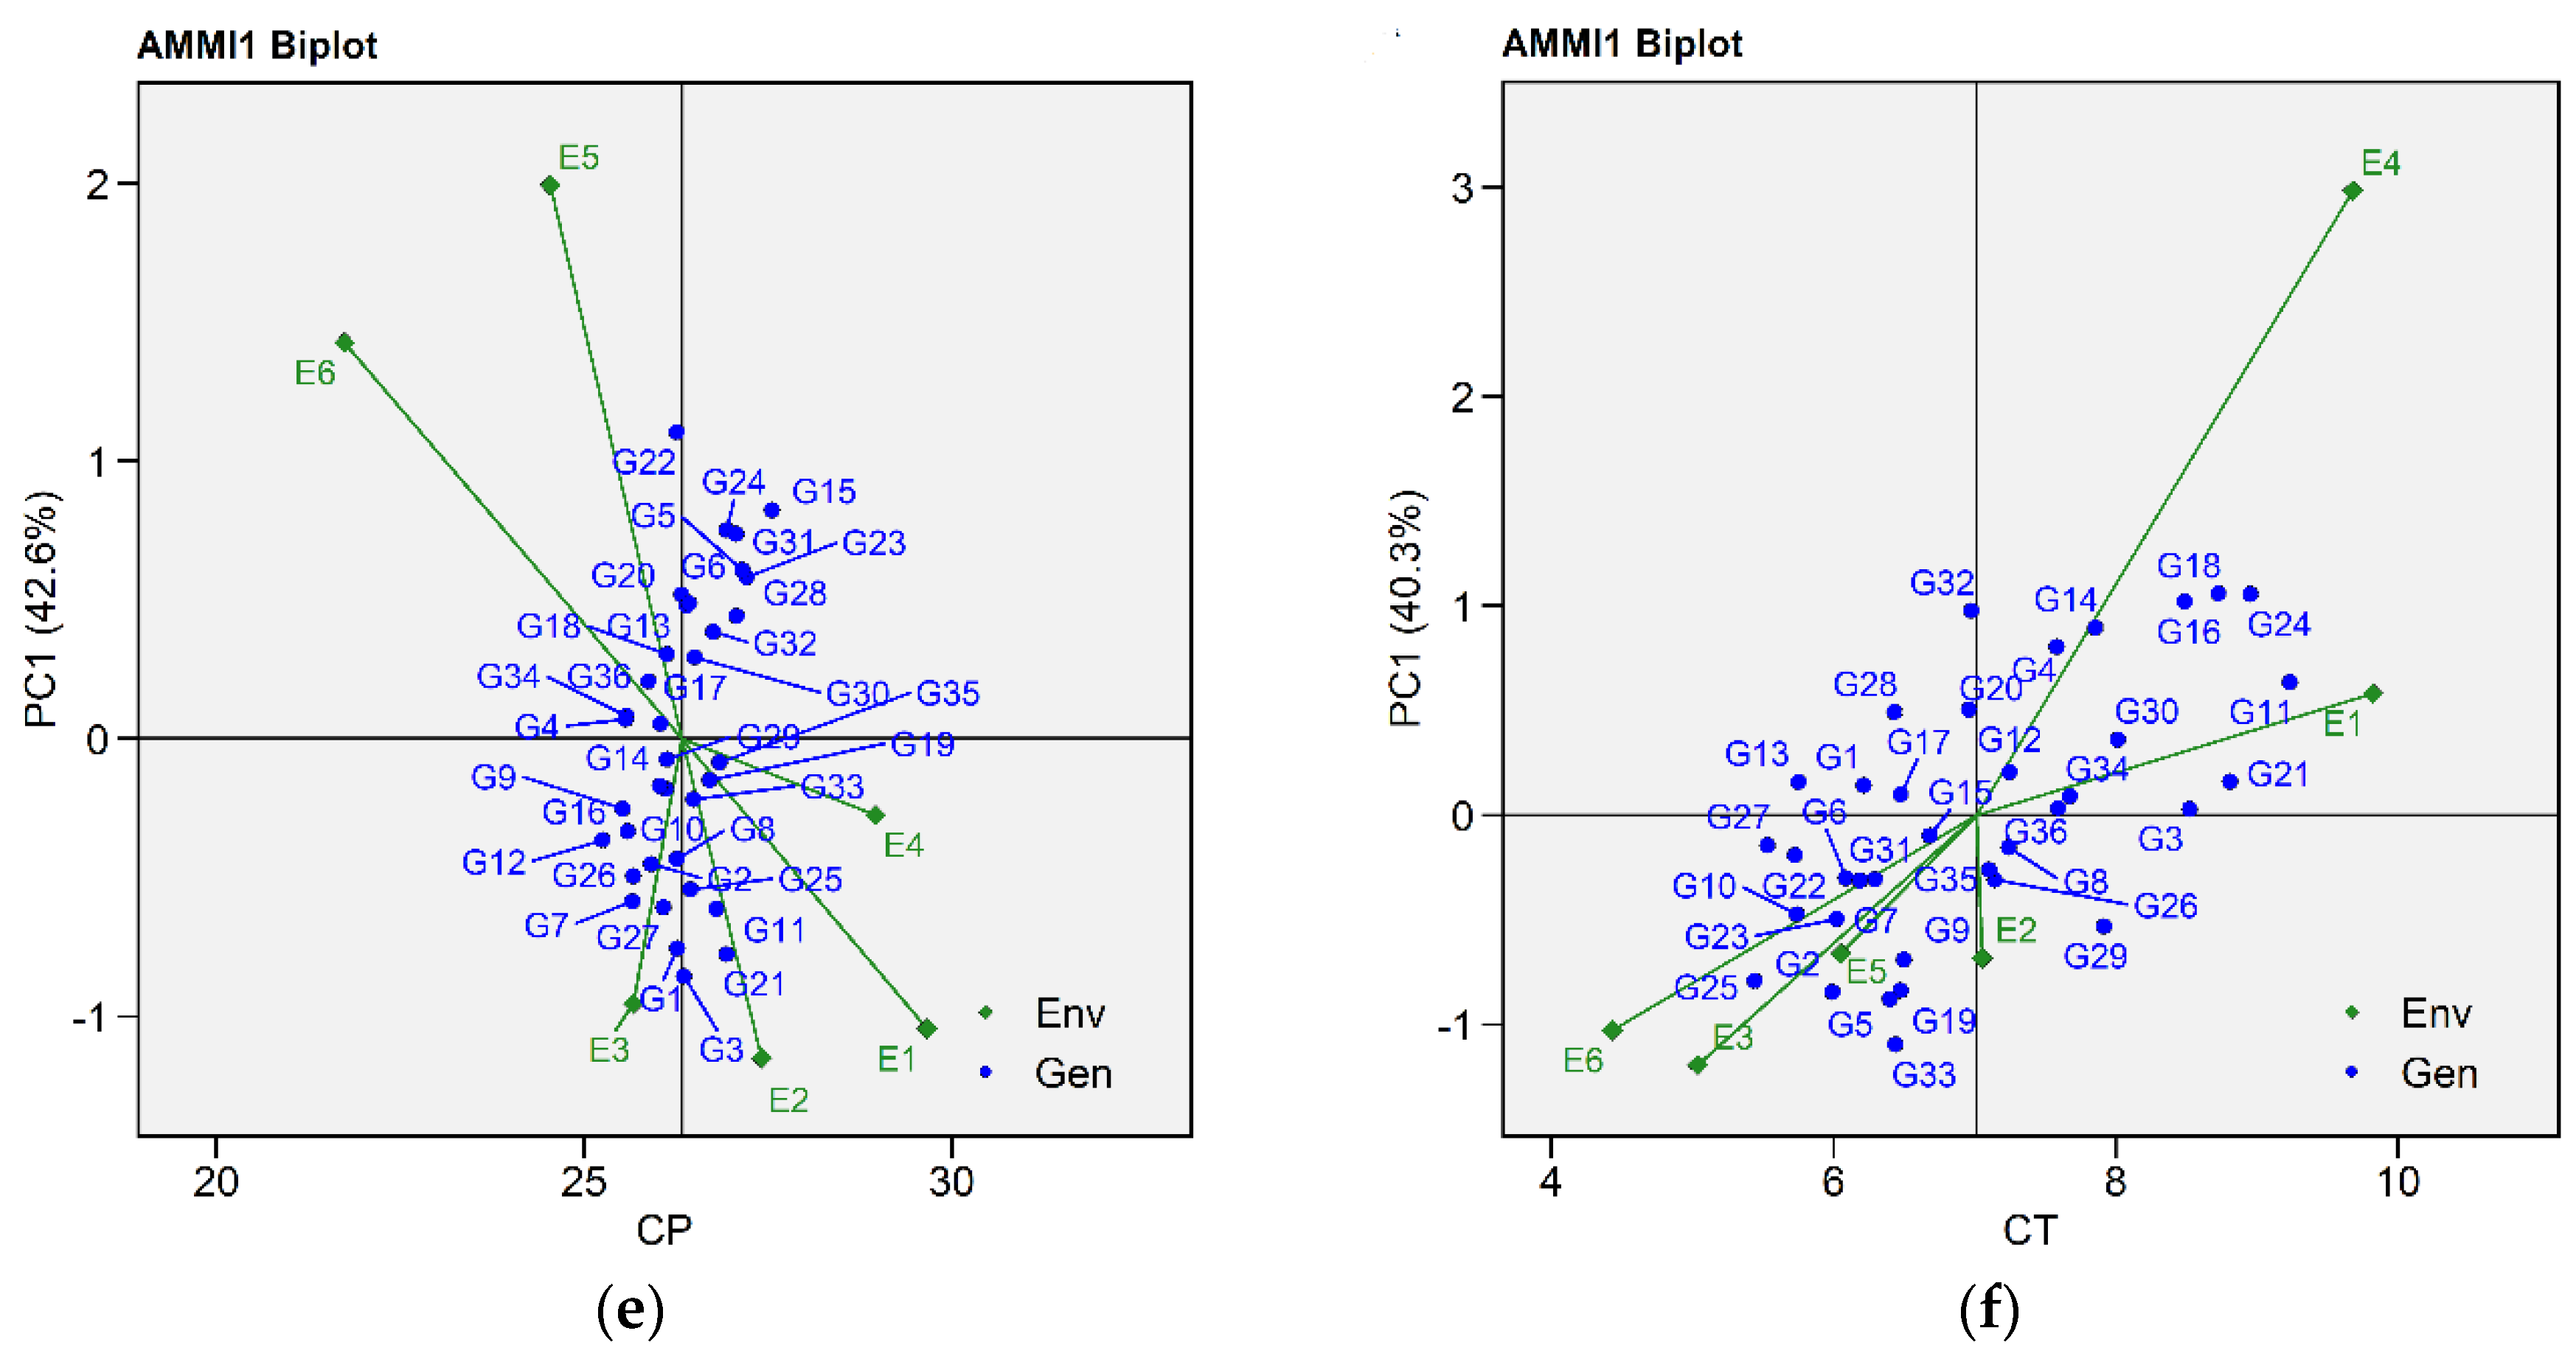
Figure 3.
Patterns (a–f). Additive main effects and multiplicative interaction 2 (AMMI 2) biplots based on PC1 and PC2 illustrating G × E interactions of the 36 lentil accessions under six environments. (a) SY, Seed yield (g); Fe, (b) Iron content (mg/100 g); (c) Zn, Zinc content (mg/100 g); (d) PA, Phytic acid (g/100 g); (e) CP, Crude protein (g/100 g); (f) CT, Cooking time (min).
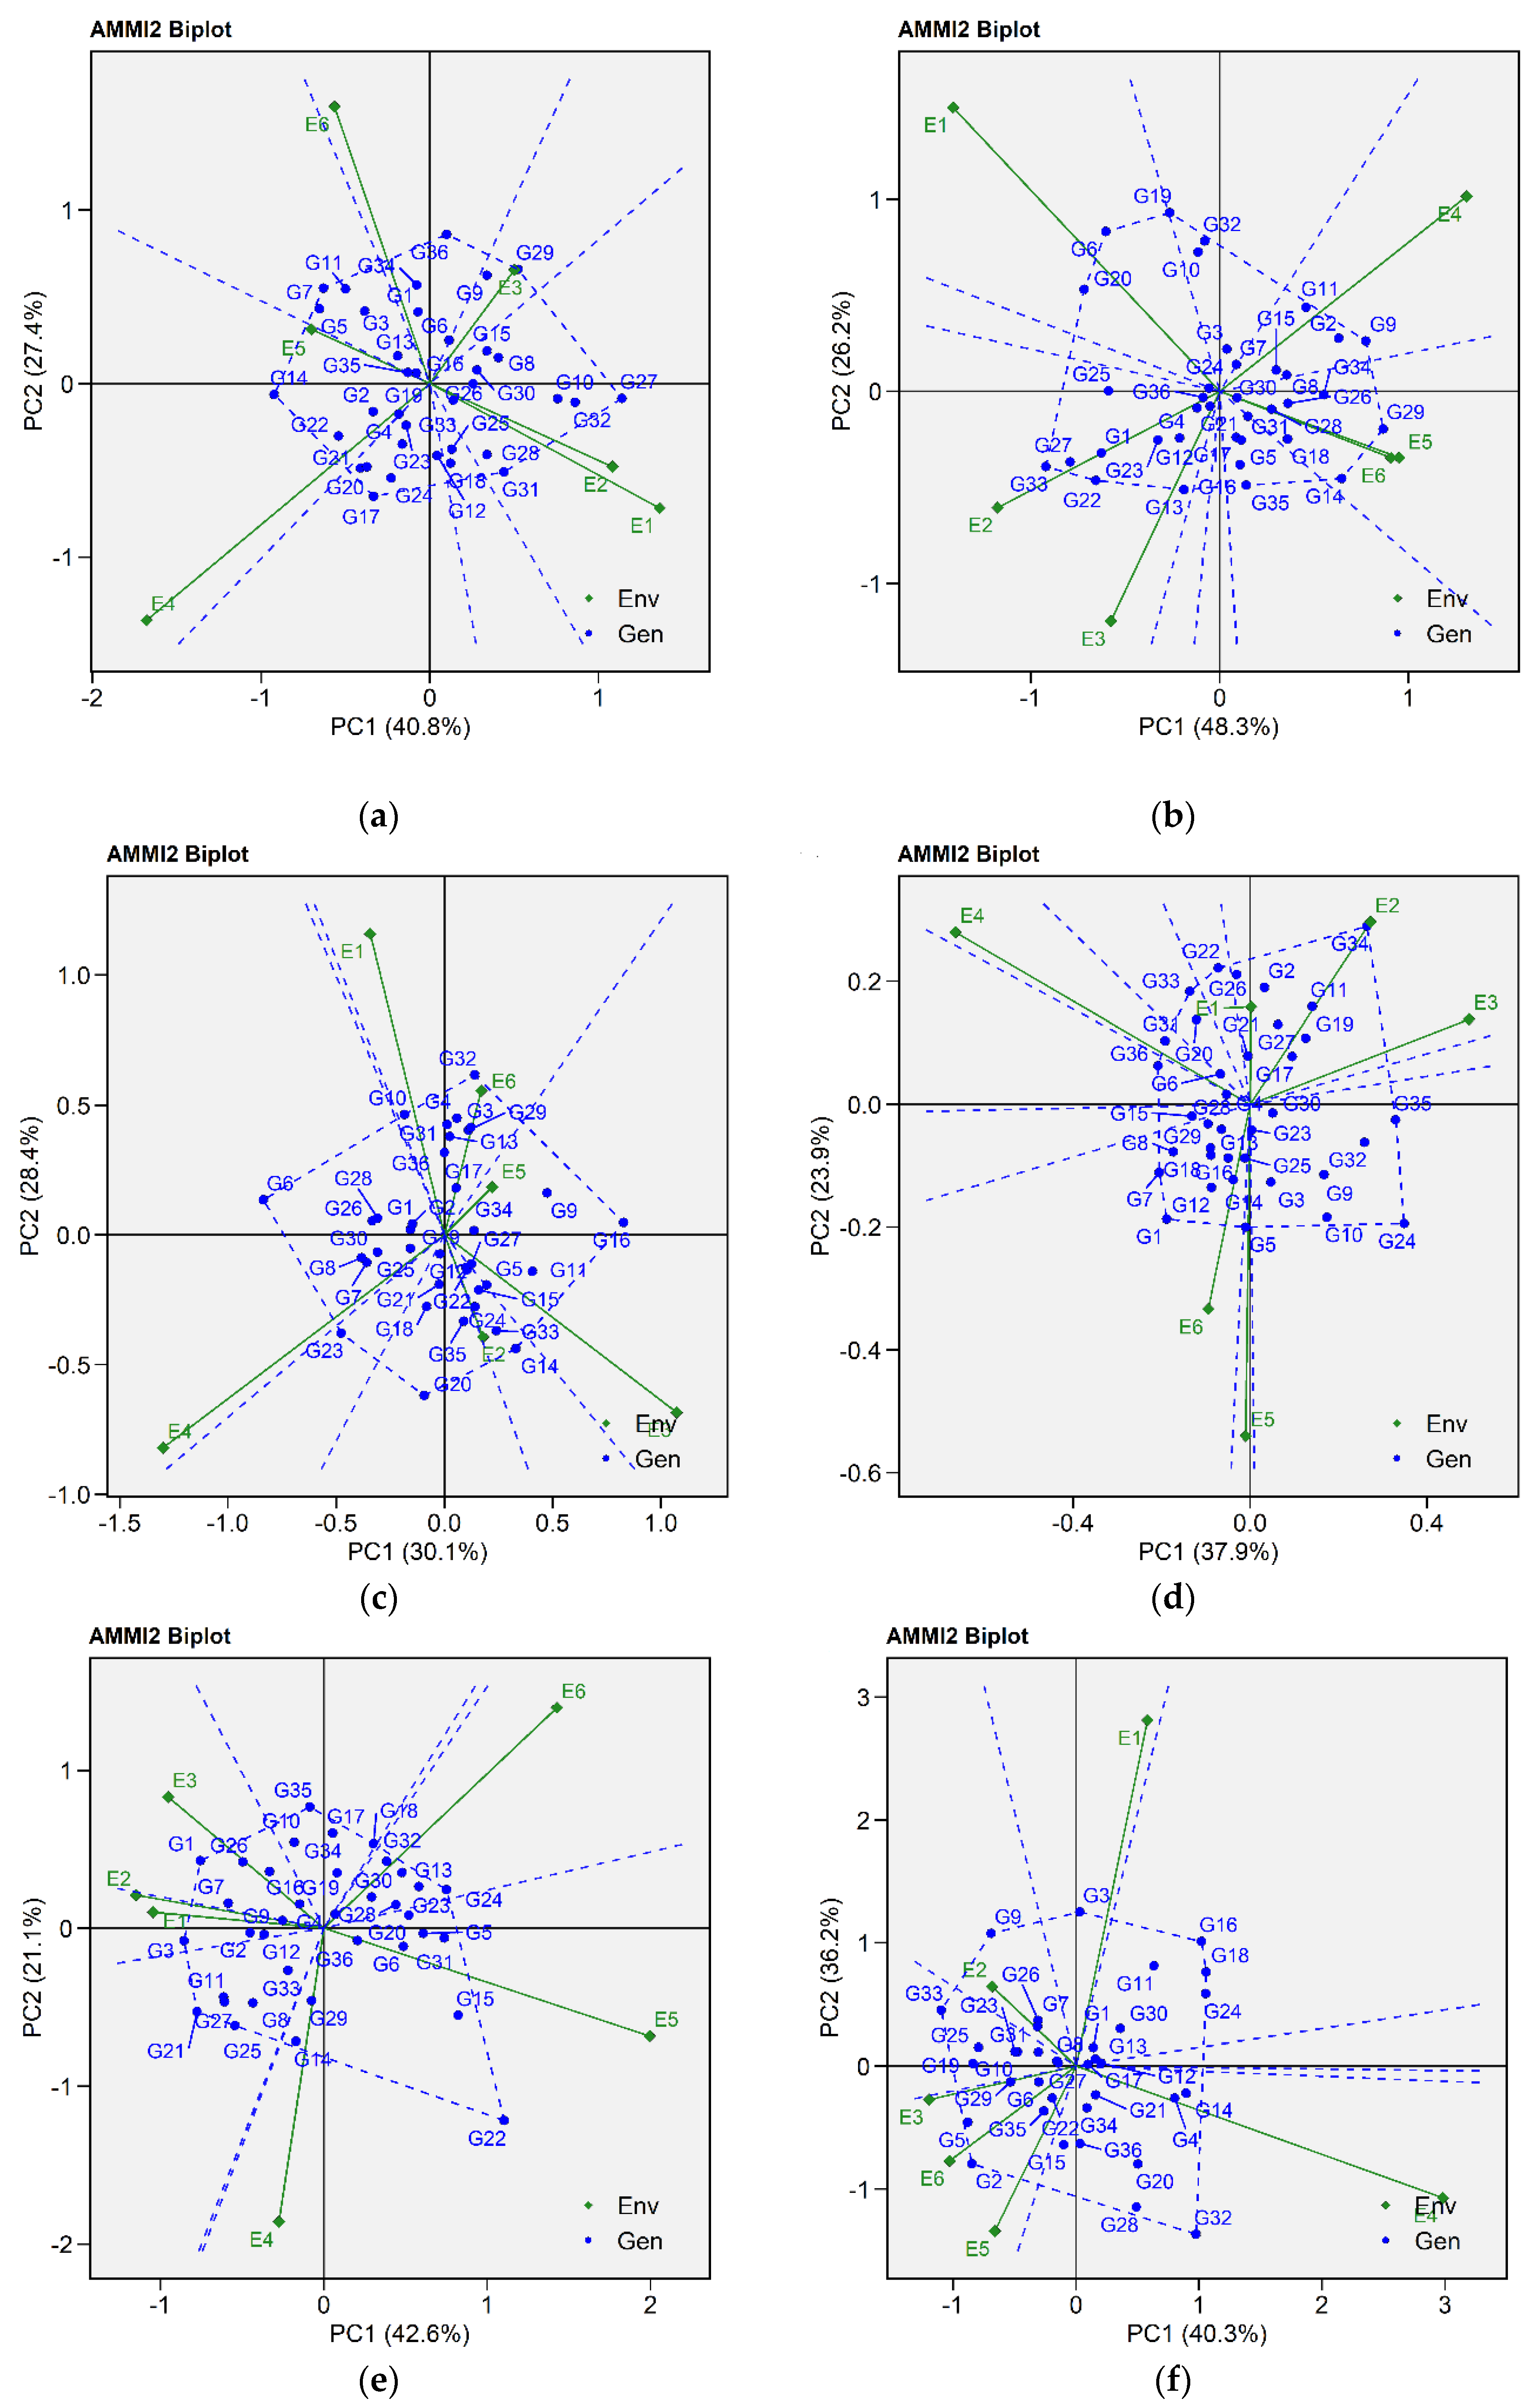
Figure 4.
Patterns (a–f). Mean vs. stability based on based on PC1 and PC2 illustrating G × E interactions of the 36 lentil accessions under six environments. (a) SY, Seed yield (g); Fe, (b) Iron content (mg/100 g); (c) Zn, Zinc content (mg/100 g); (d) PA, Phytic acid (g/100 g); (e) CP, Crude protein (g/100 g); (f) CT, Cooking time (min). The mean vs. stability was based on scaling = 0, centering = 2, and singular value partitioning (SVP) = 1.
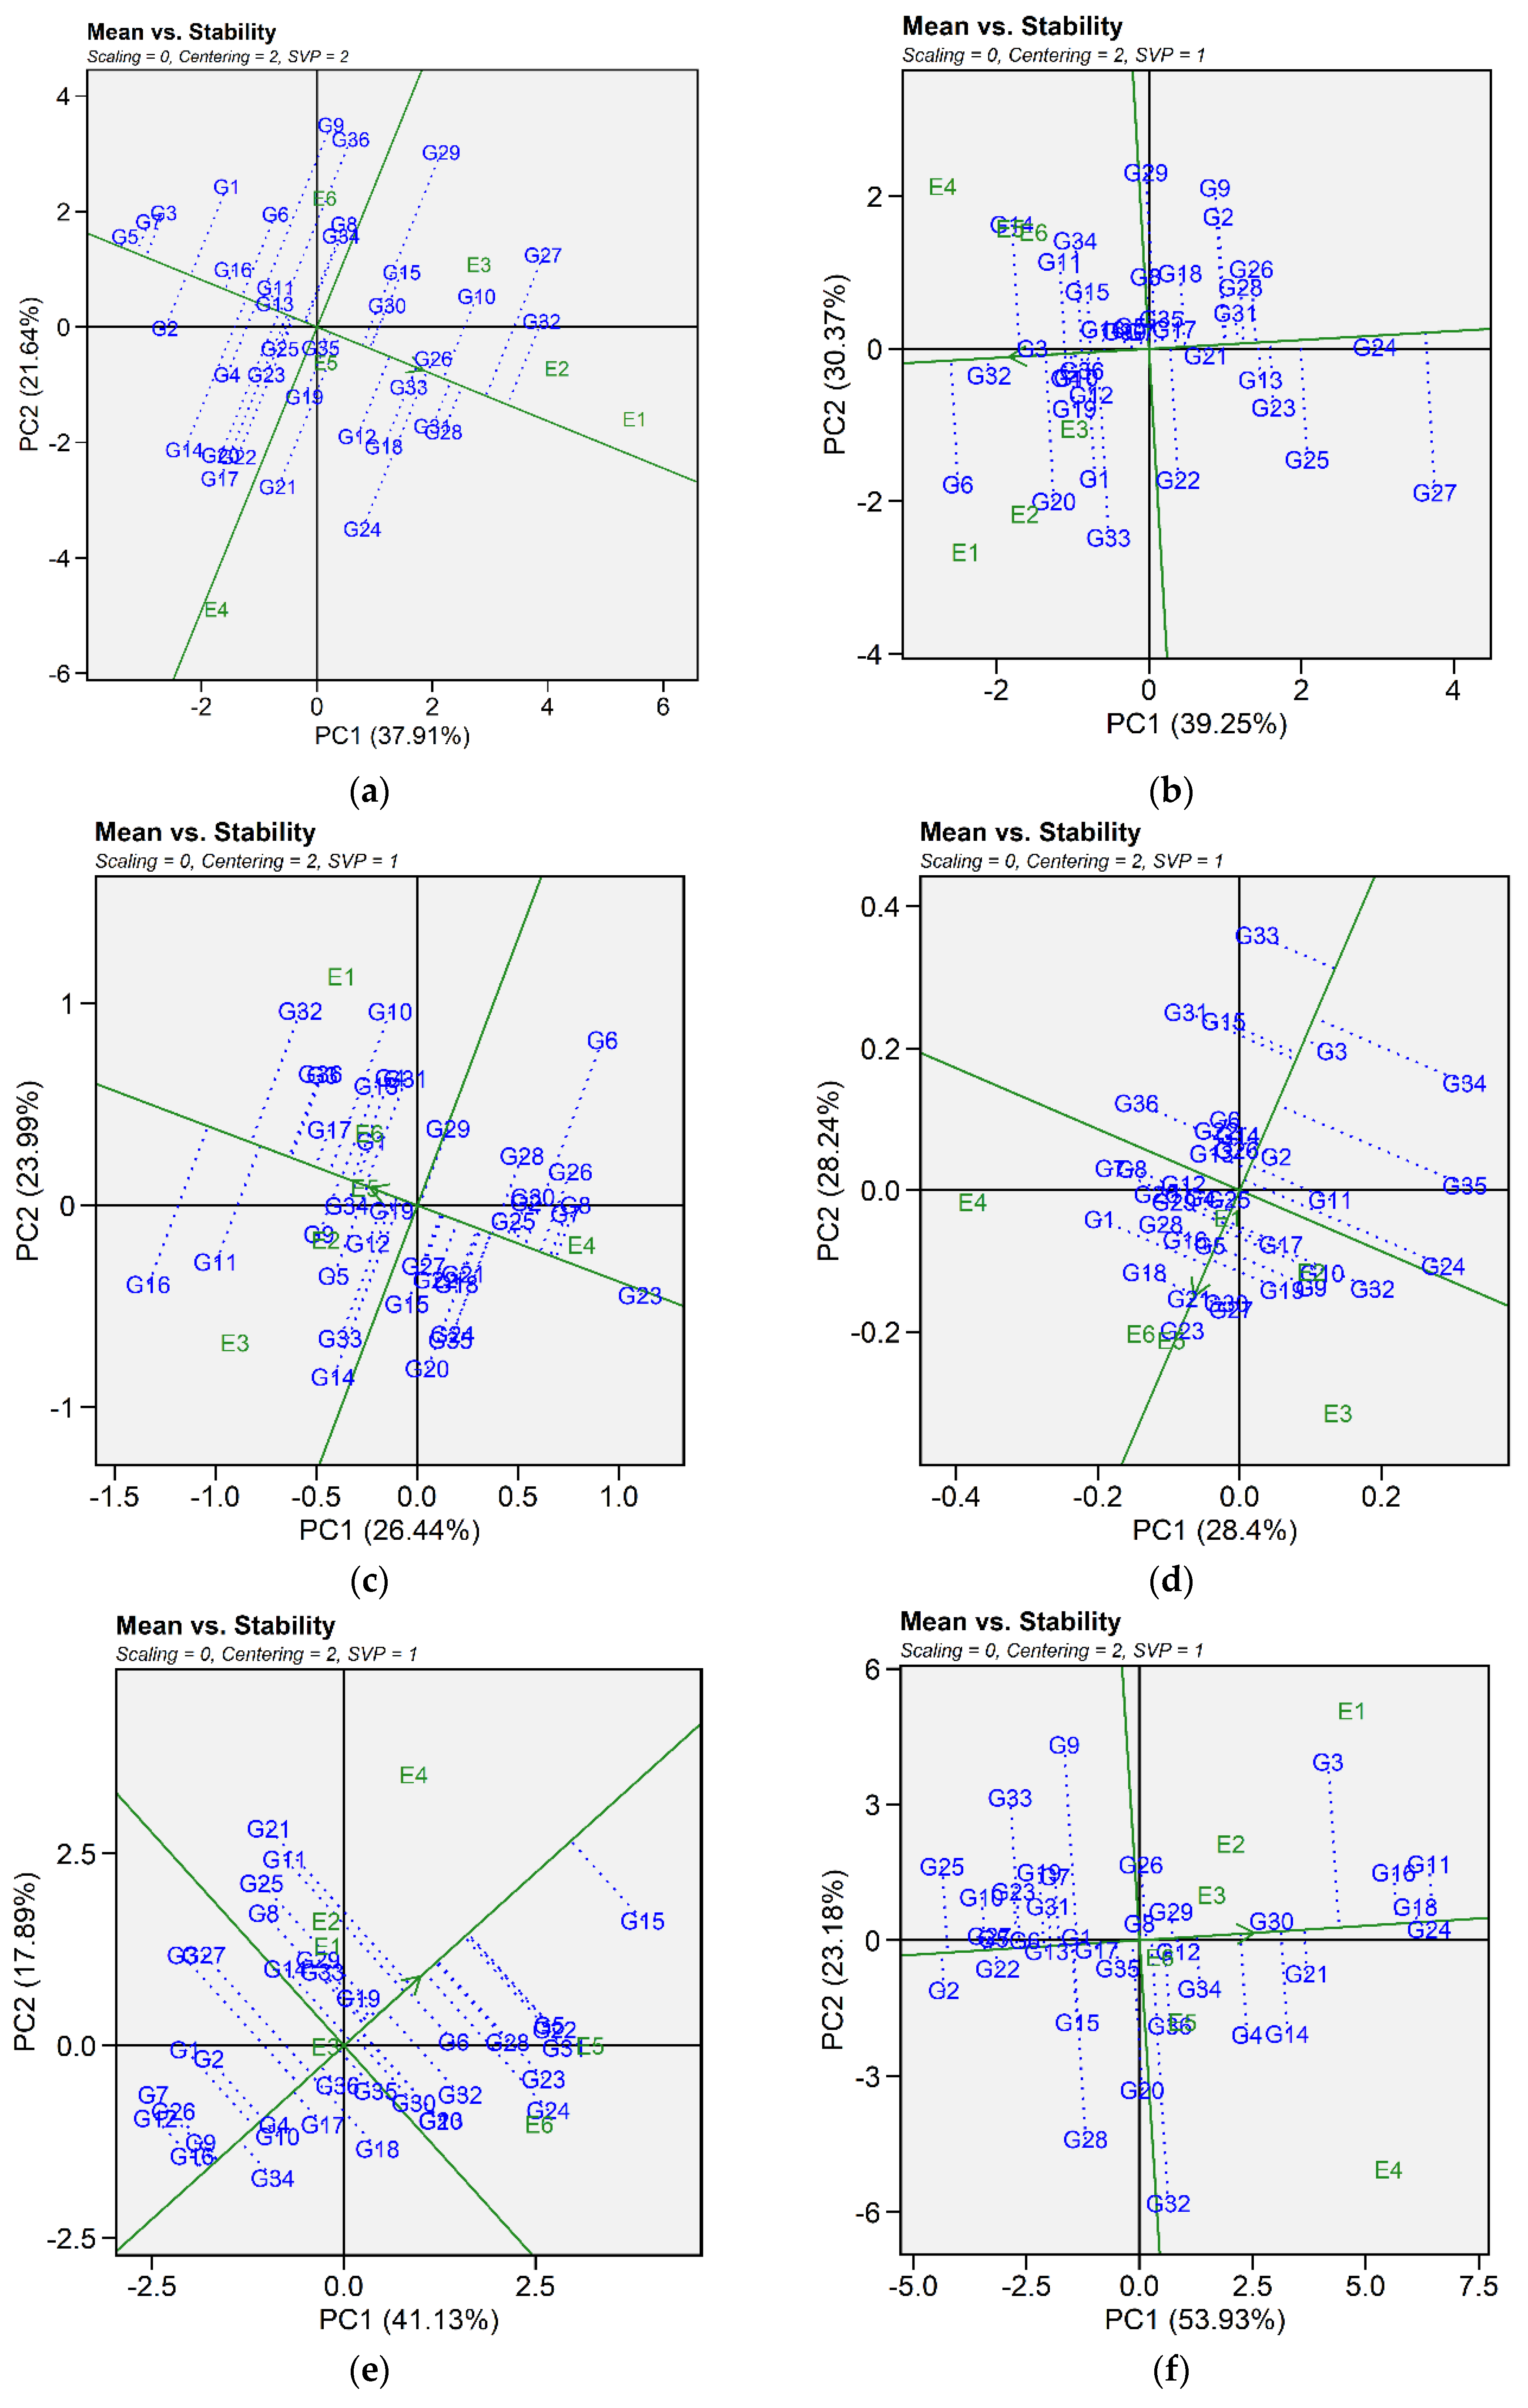
Figure 5.
Patterns (a–f). Ranking genotypes biplots based on based on PC1 and PC2 illustrating G × E interactions of the 36 lentil accessions under six environments. (a) SY, Seed yield (g); Fe, (b) Iron content (mg/100 g); (c) Zn, Zinc content (mg/100 g); (d) PA, Phytic acid (g/100 g); (e) CP, Crude protein (g/100 g); (f) CT, Cooking time (min). The mean vs. stability was based on scaling = 0, centering = 2, and singular value partitioning (SVP) = 1.
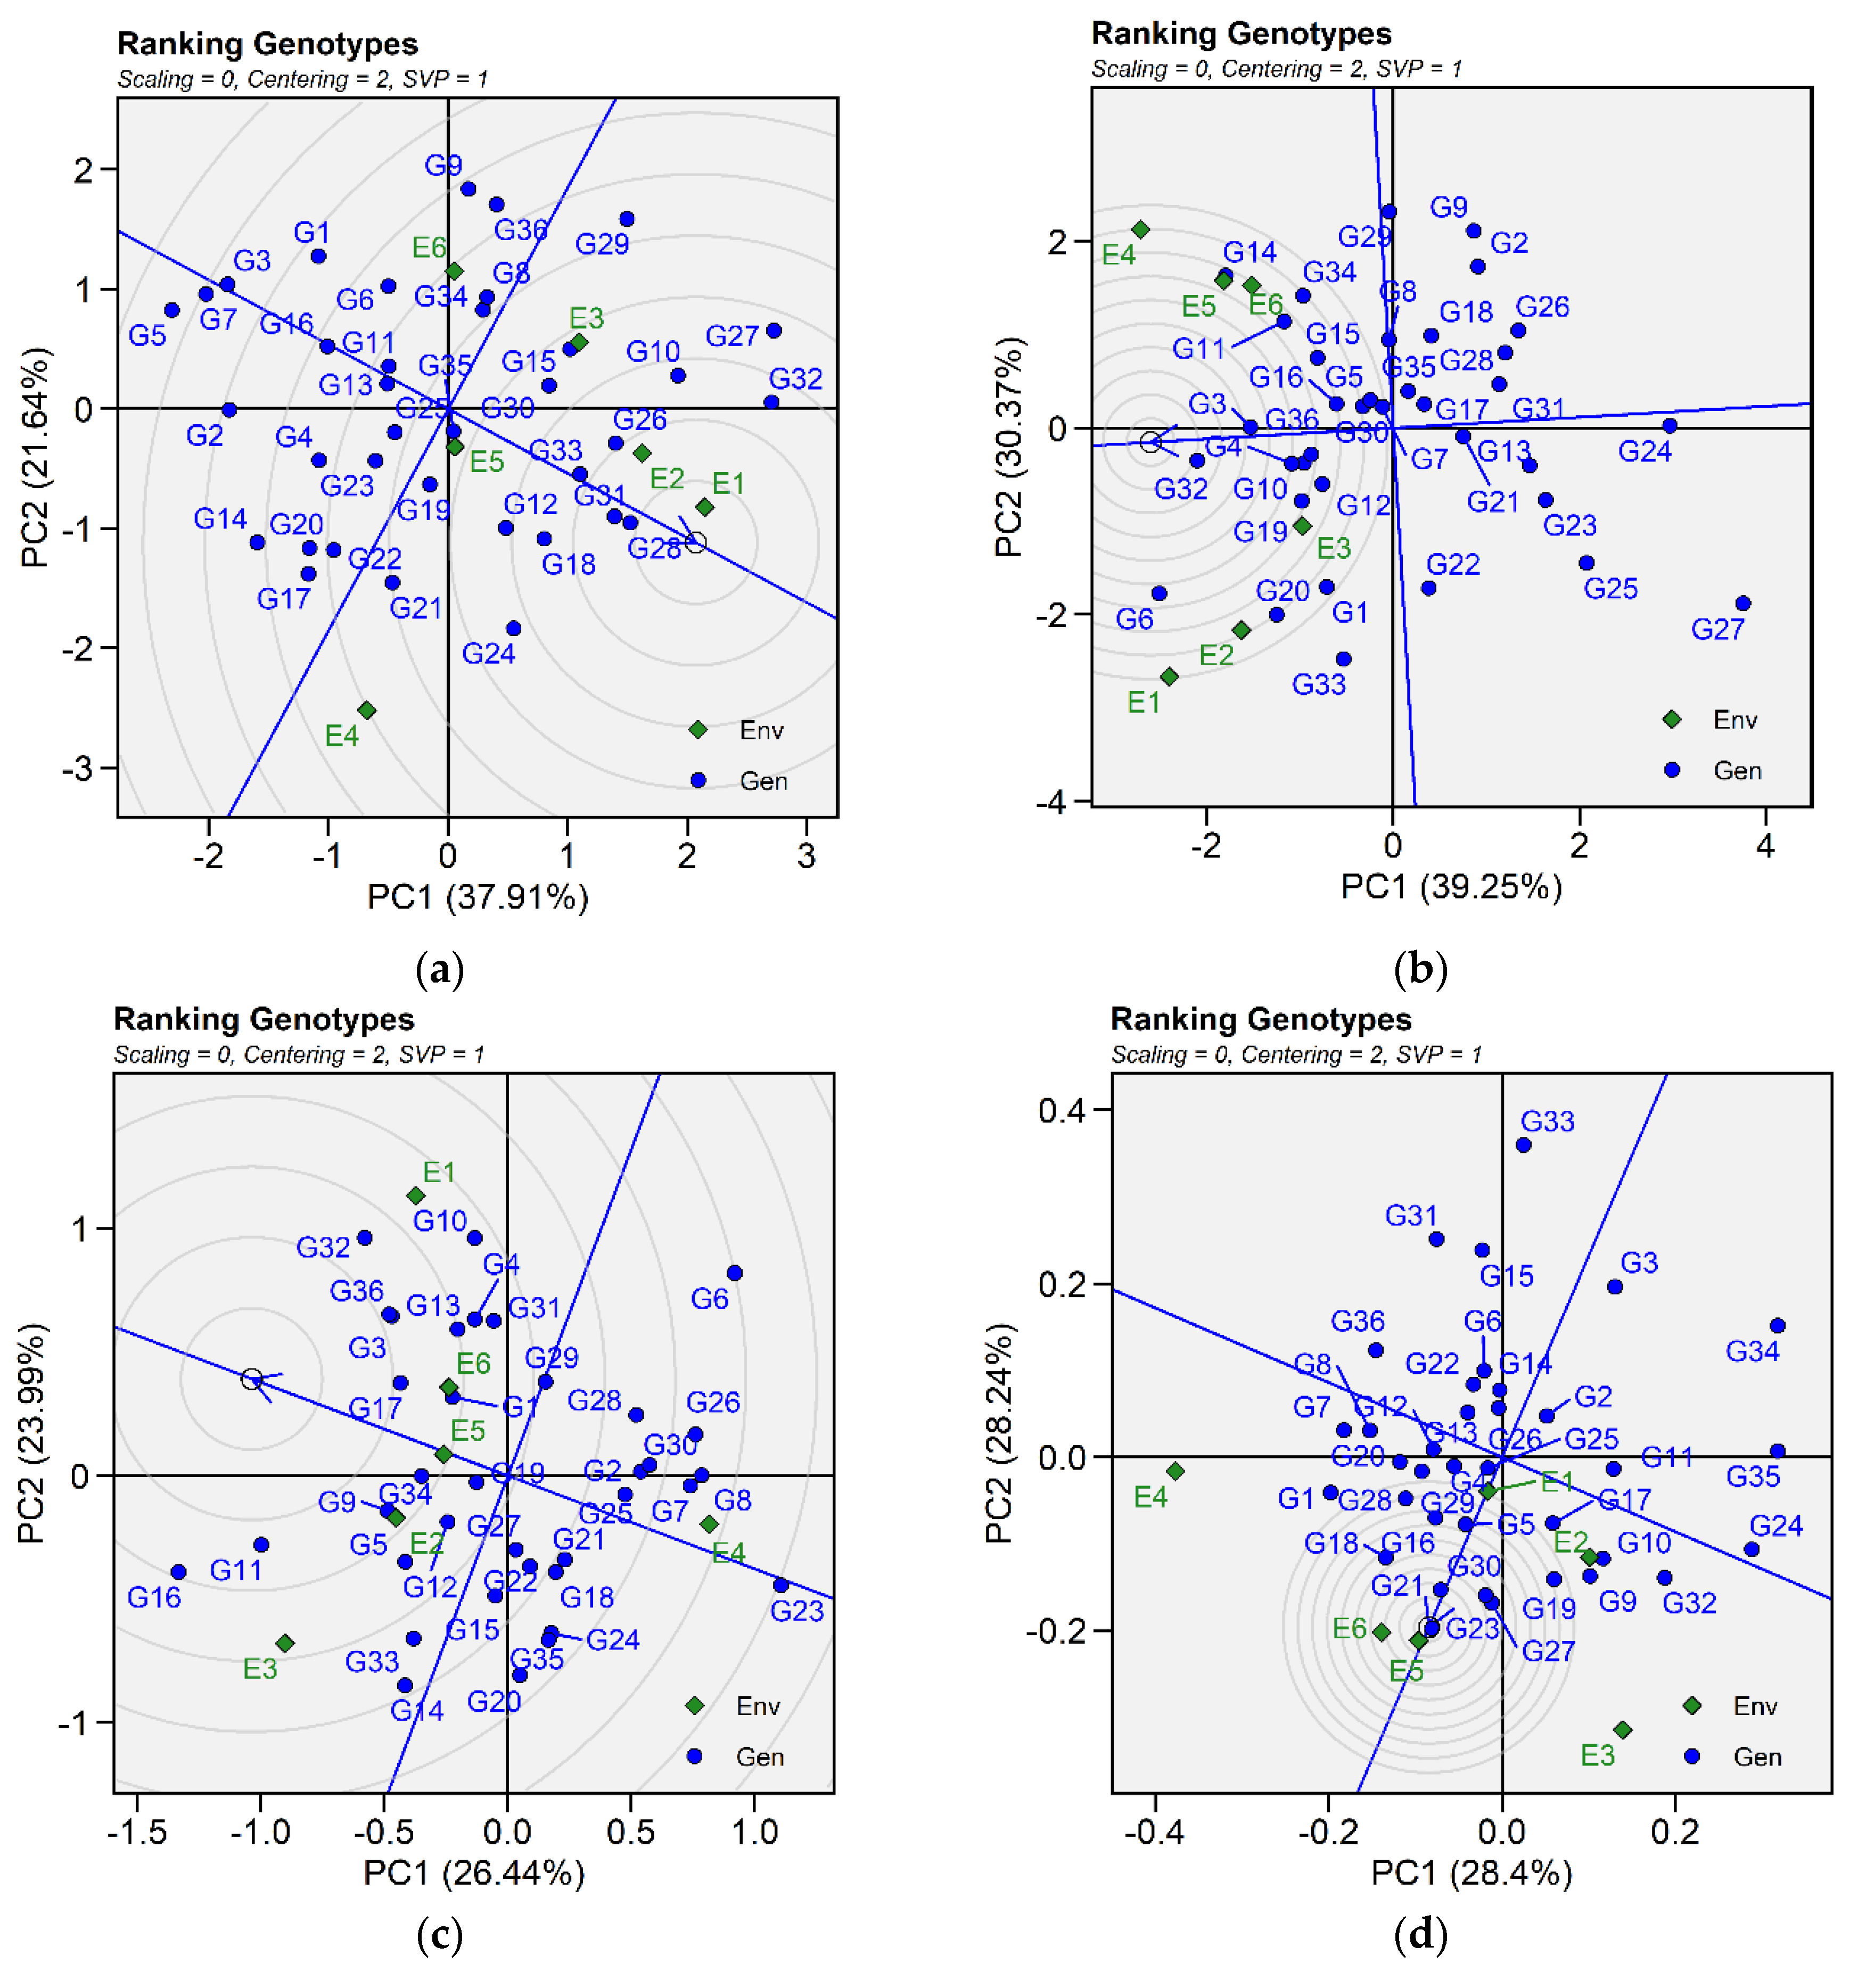
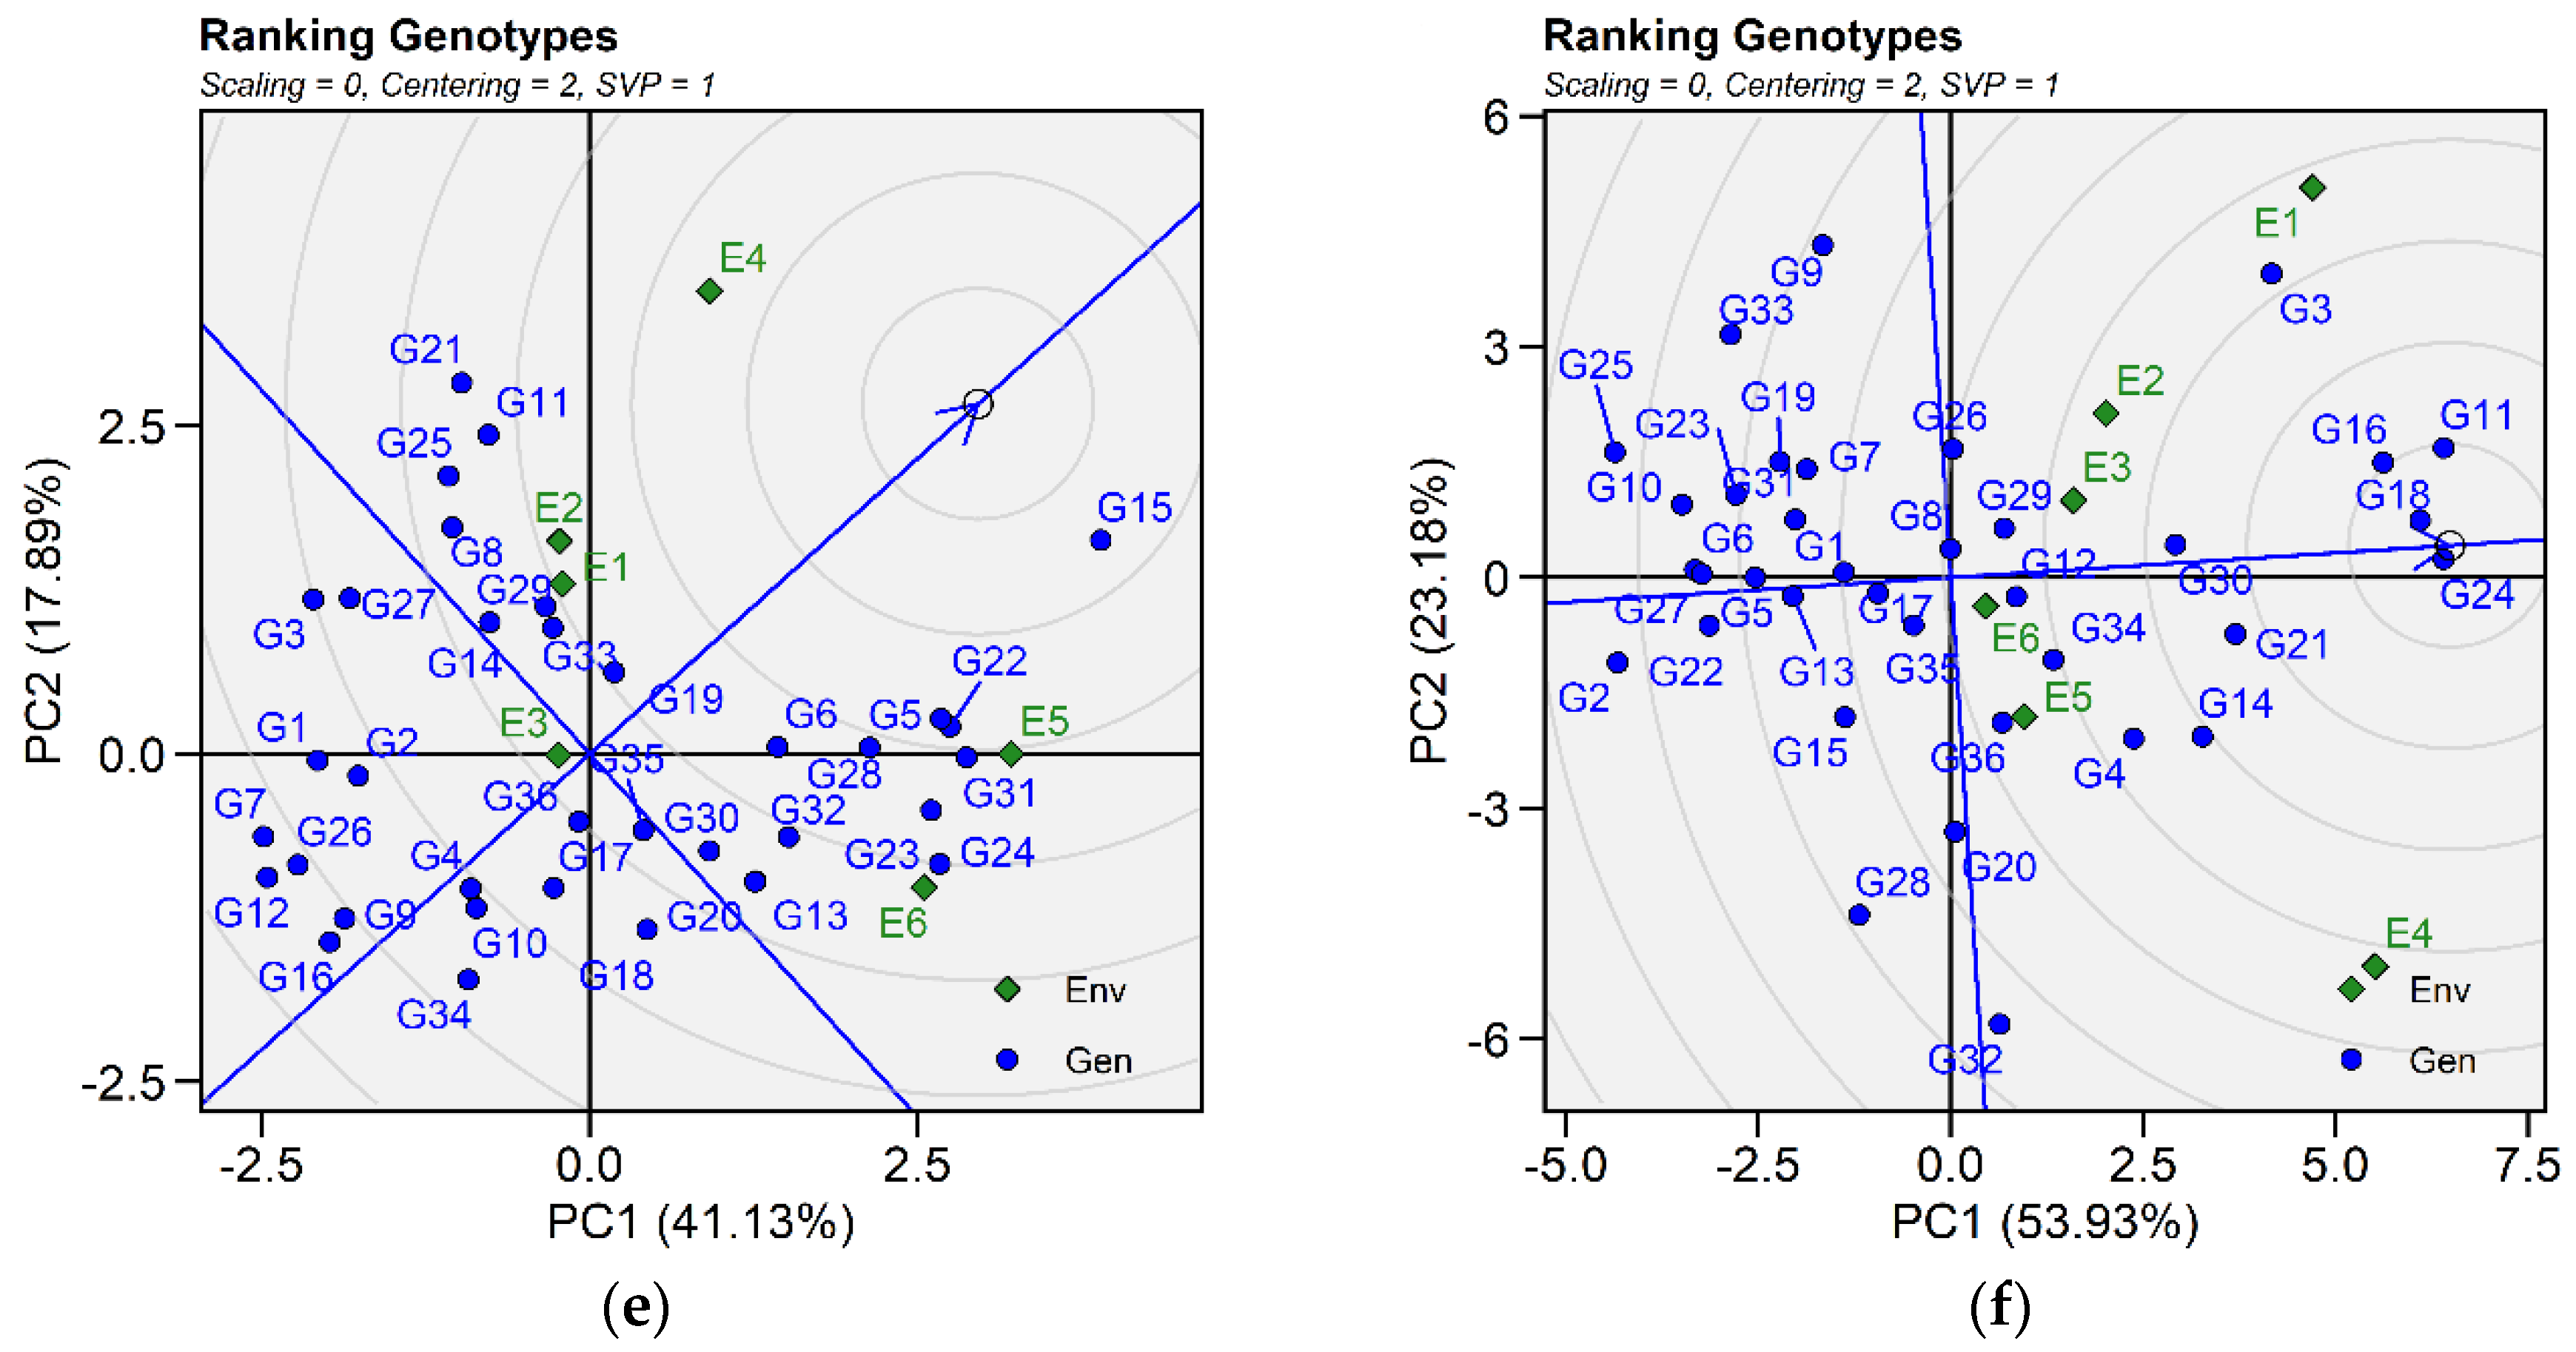
Figure 6.
Patterns (a–f). Discriminativeness and representativeness biplots based on based on PC1 and PC2 illustrating G × E interactions of the 36 lentil accessions under six environments. (a) SY, Seed yield (g); Fe, (b) Iron content (mg/100 g); (c) Zn, Zinc content (mg/100 g); (d) PA, Phytic acid (g/100 g); (e) CP, Crude protein (g/100 g); (f) CT, Cooking time (min). The mean vs. stability was based on scaling = 0, centering = 2, and singular value partitioning (SVP) = 2.
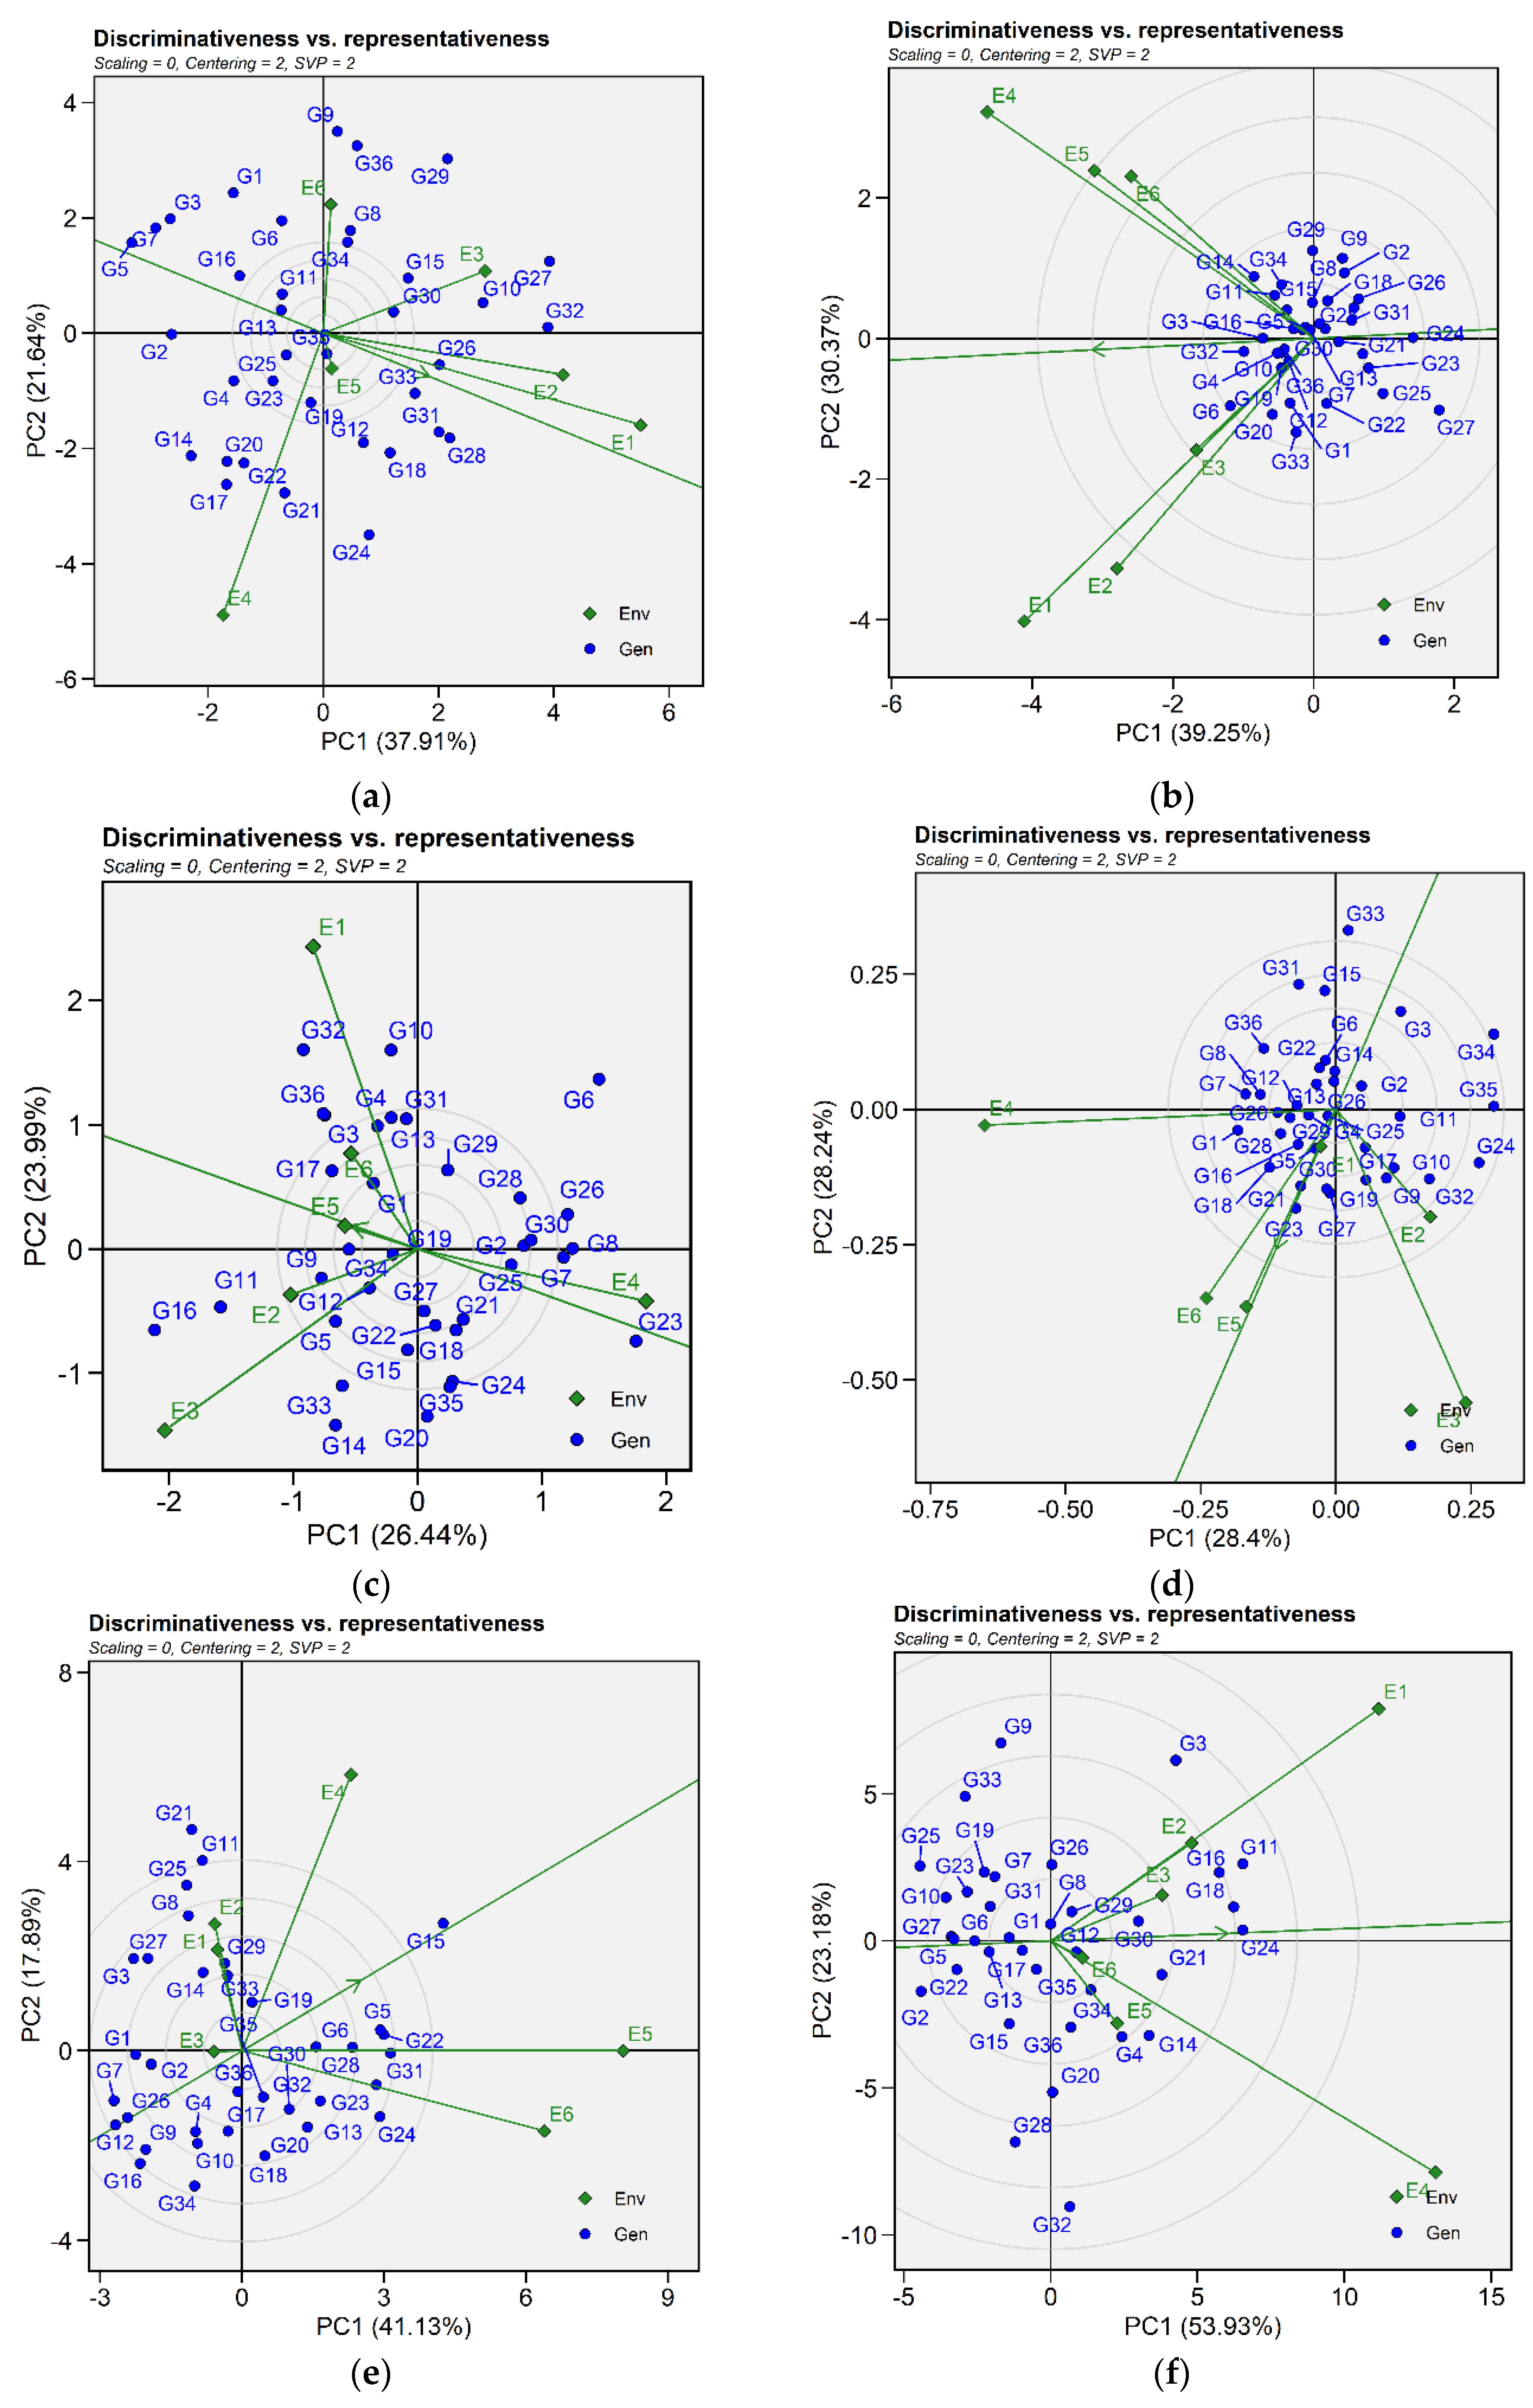
Figure 7.
Patterns (a–f). Which-won-where view of GGE biplots based on based on PC1 and PC2 illustrating G × E interactions of the 36 lentil accessions under six environments. (a) SY, Seed yield (g); Fe, (b) Iron content (mg/100 g); (c) Zn, Zinc content (mg/100 g); (d) PA, Phytic acid (g/100 g); (e) CP, Crude protein (g/100 g); (f) CT, Cooking time (min). The mean vs. stability was based on scaling = 0, centering = 2, and singular value partitioning (SVP) = 3.
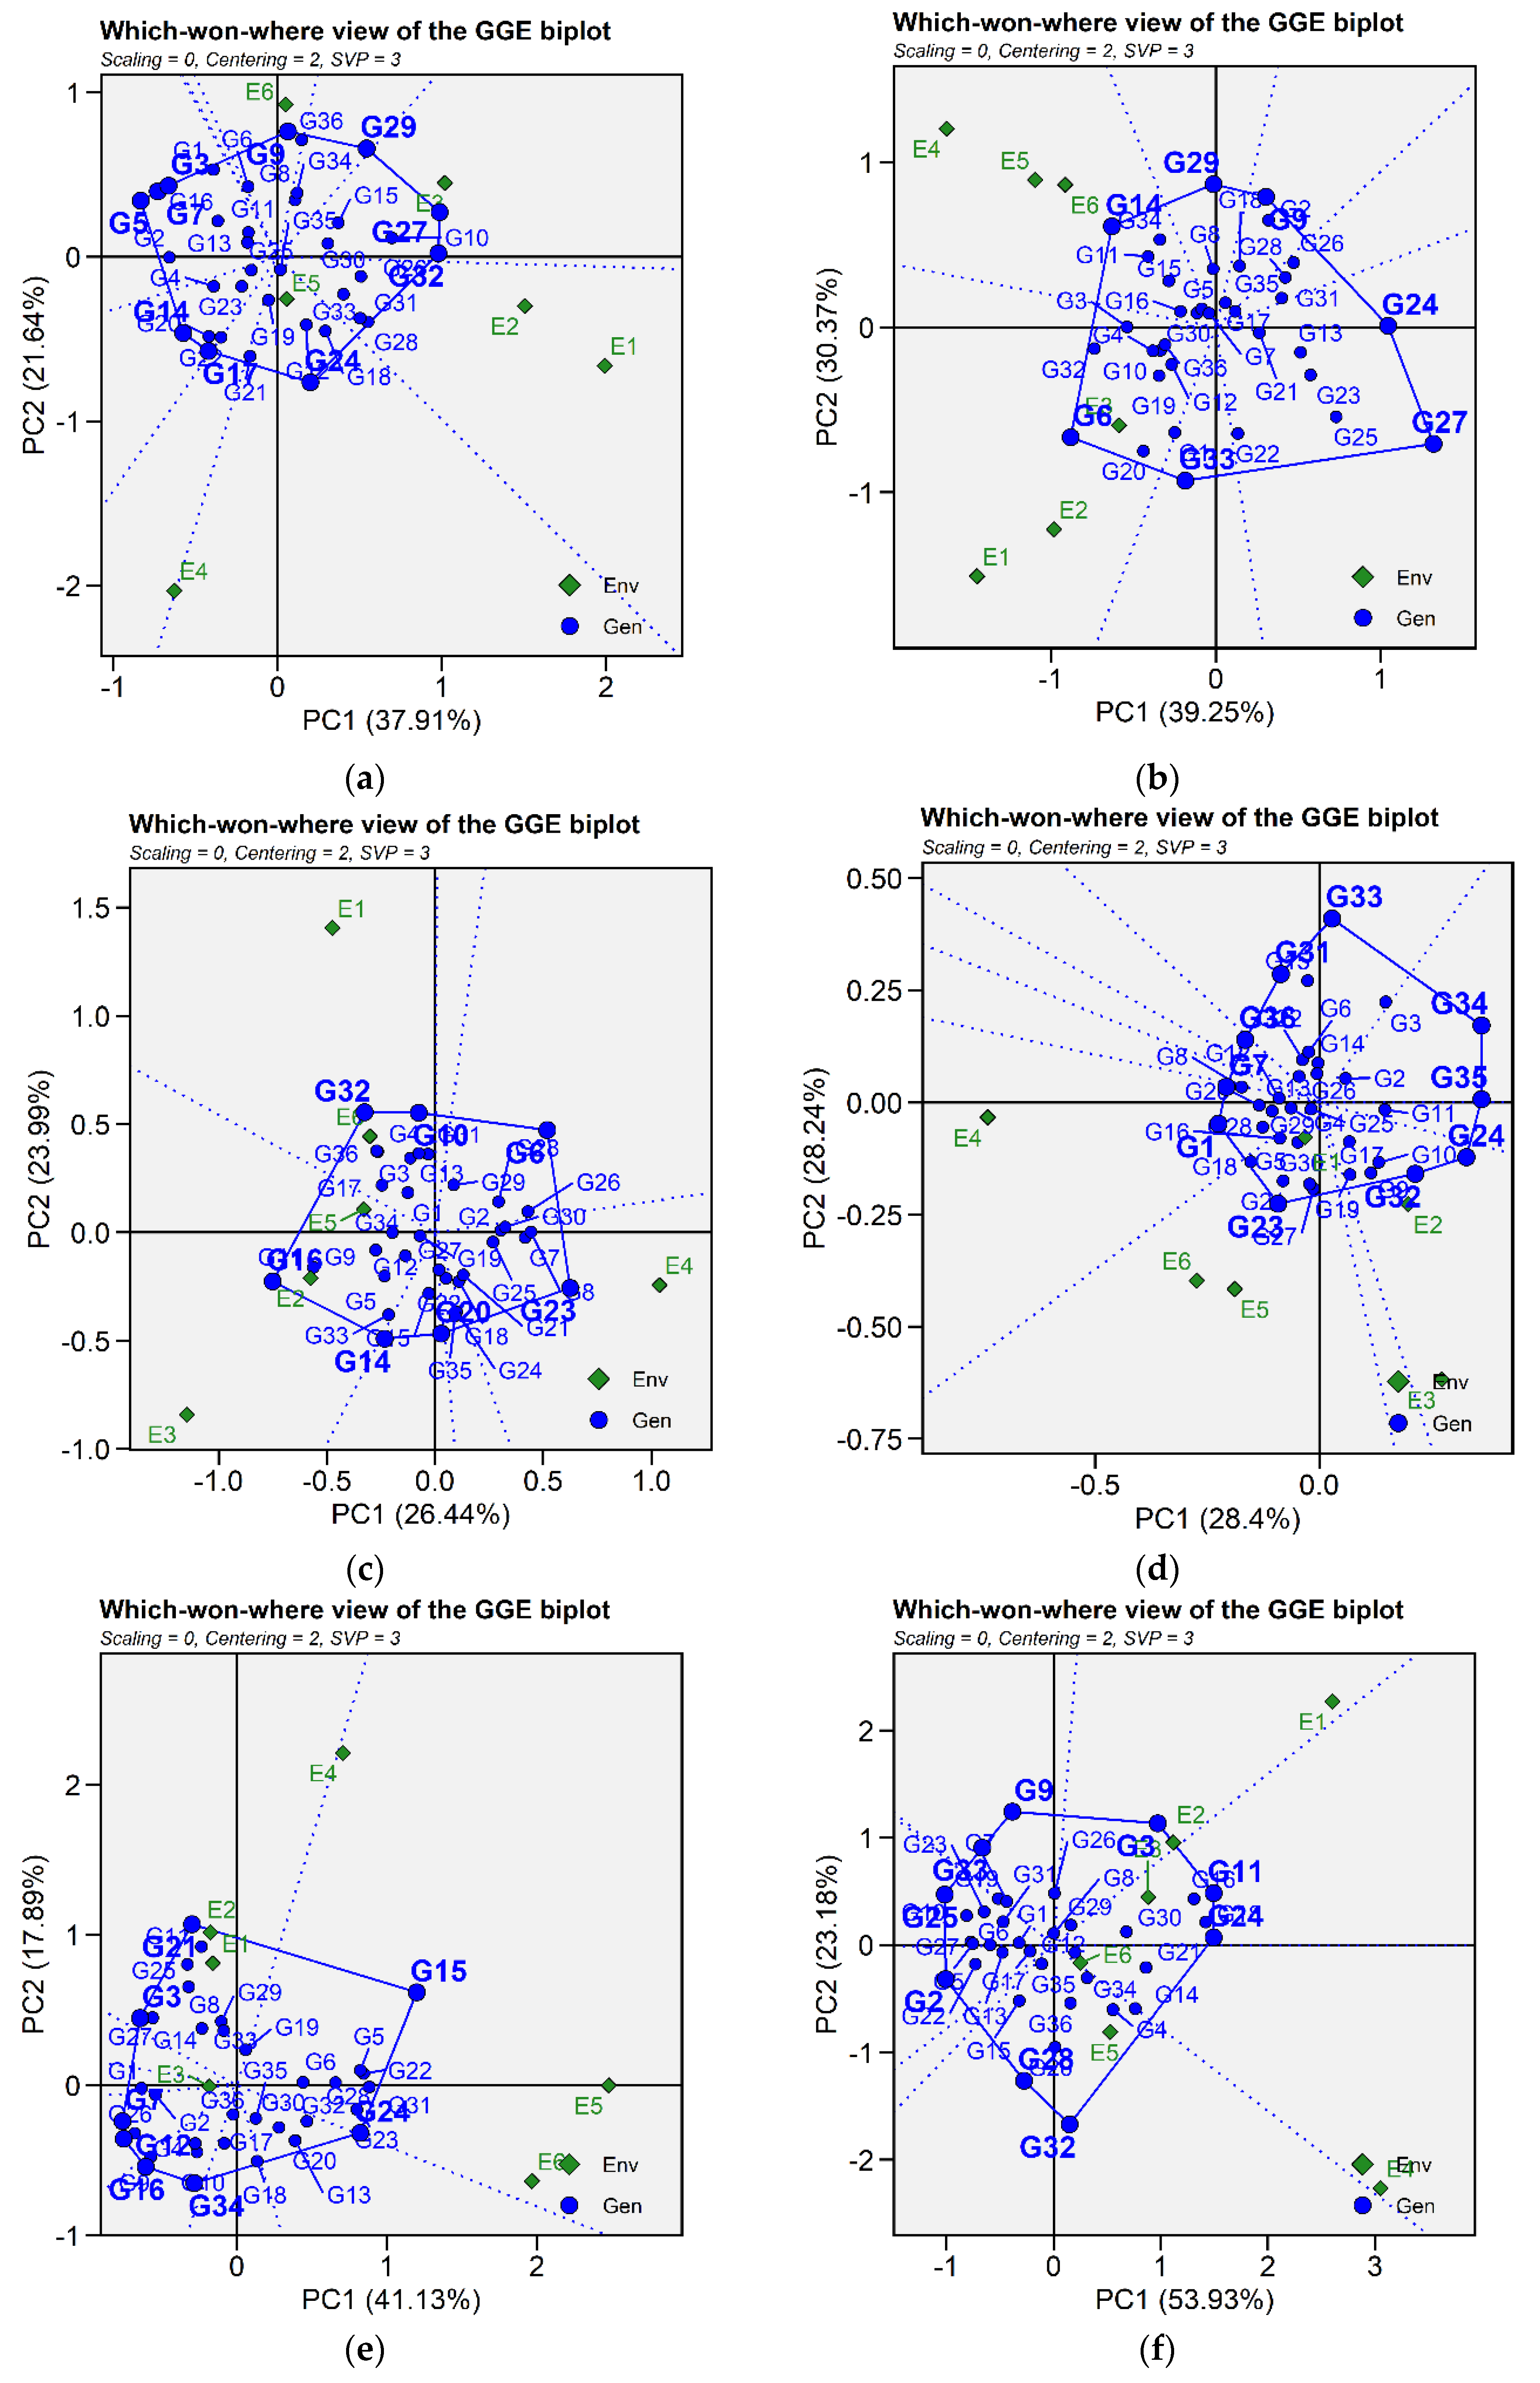
Figure 8.
Box plot illustrating the descriptive statistics of seed yield, nutritional quality traits, phytic acid and cooking time in 36 lentil genotypes across six growing environments. The letters donate significant mean variation between the six environments. (a) SY, Seed yield (g); (b) HSW, hundred-seed weight (g); (c) CT, Cooking time (min); (d) CP, Crude protein (g/100 g); (e) PA, Phytic acid (g/100 g); (f) Zn, Zinc content (mg/100 g); (g) PA/Zn, Phytic acid/Zinc ratio; (h) Fe, Iron content (mg/100 g); (i) PA/Fe, Phytic acid/Iron ratio.
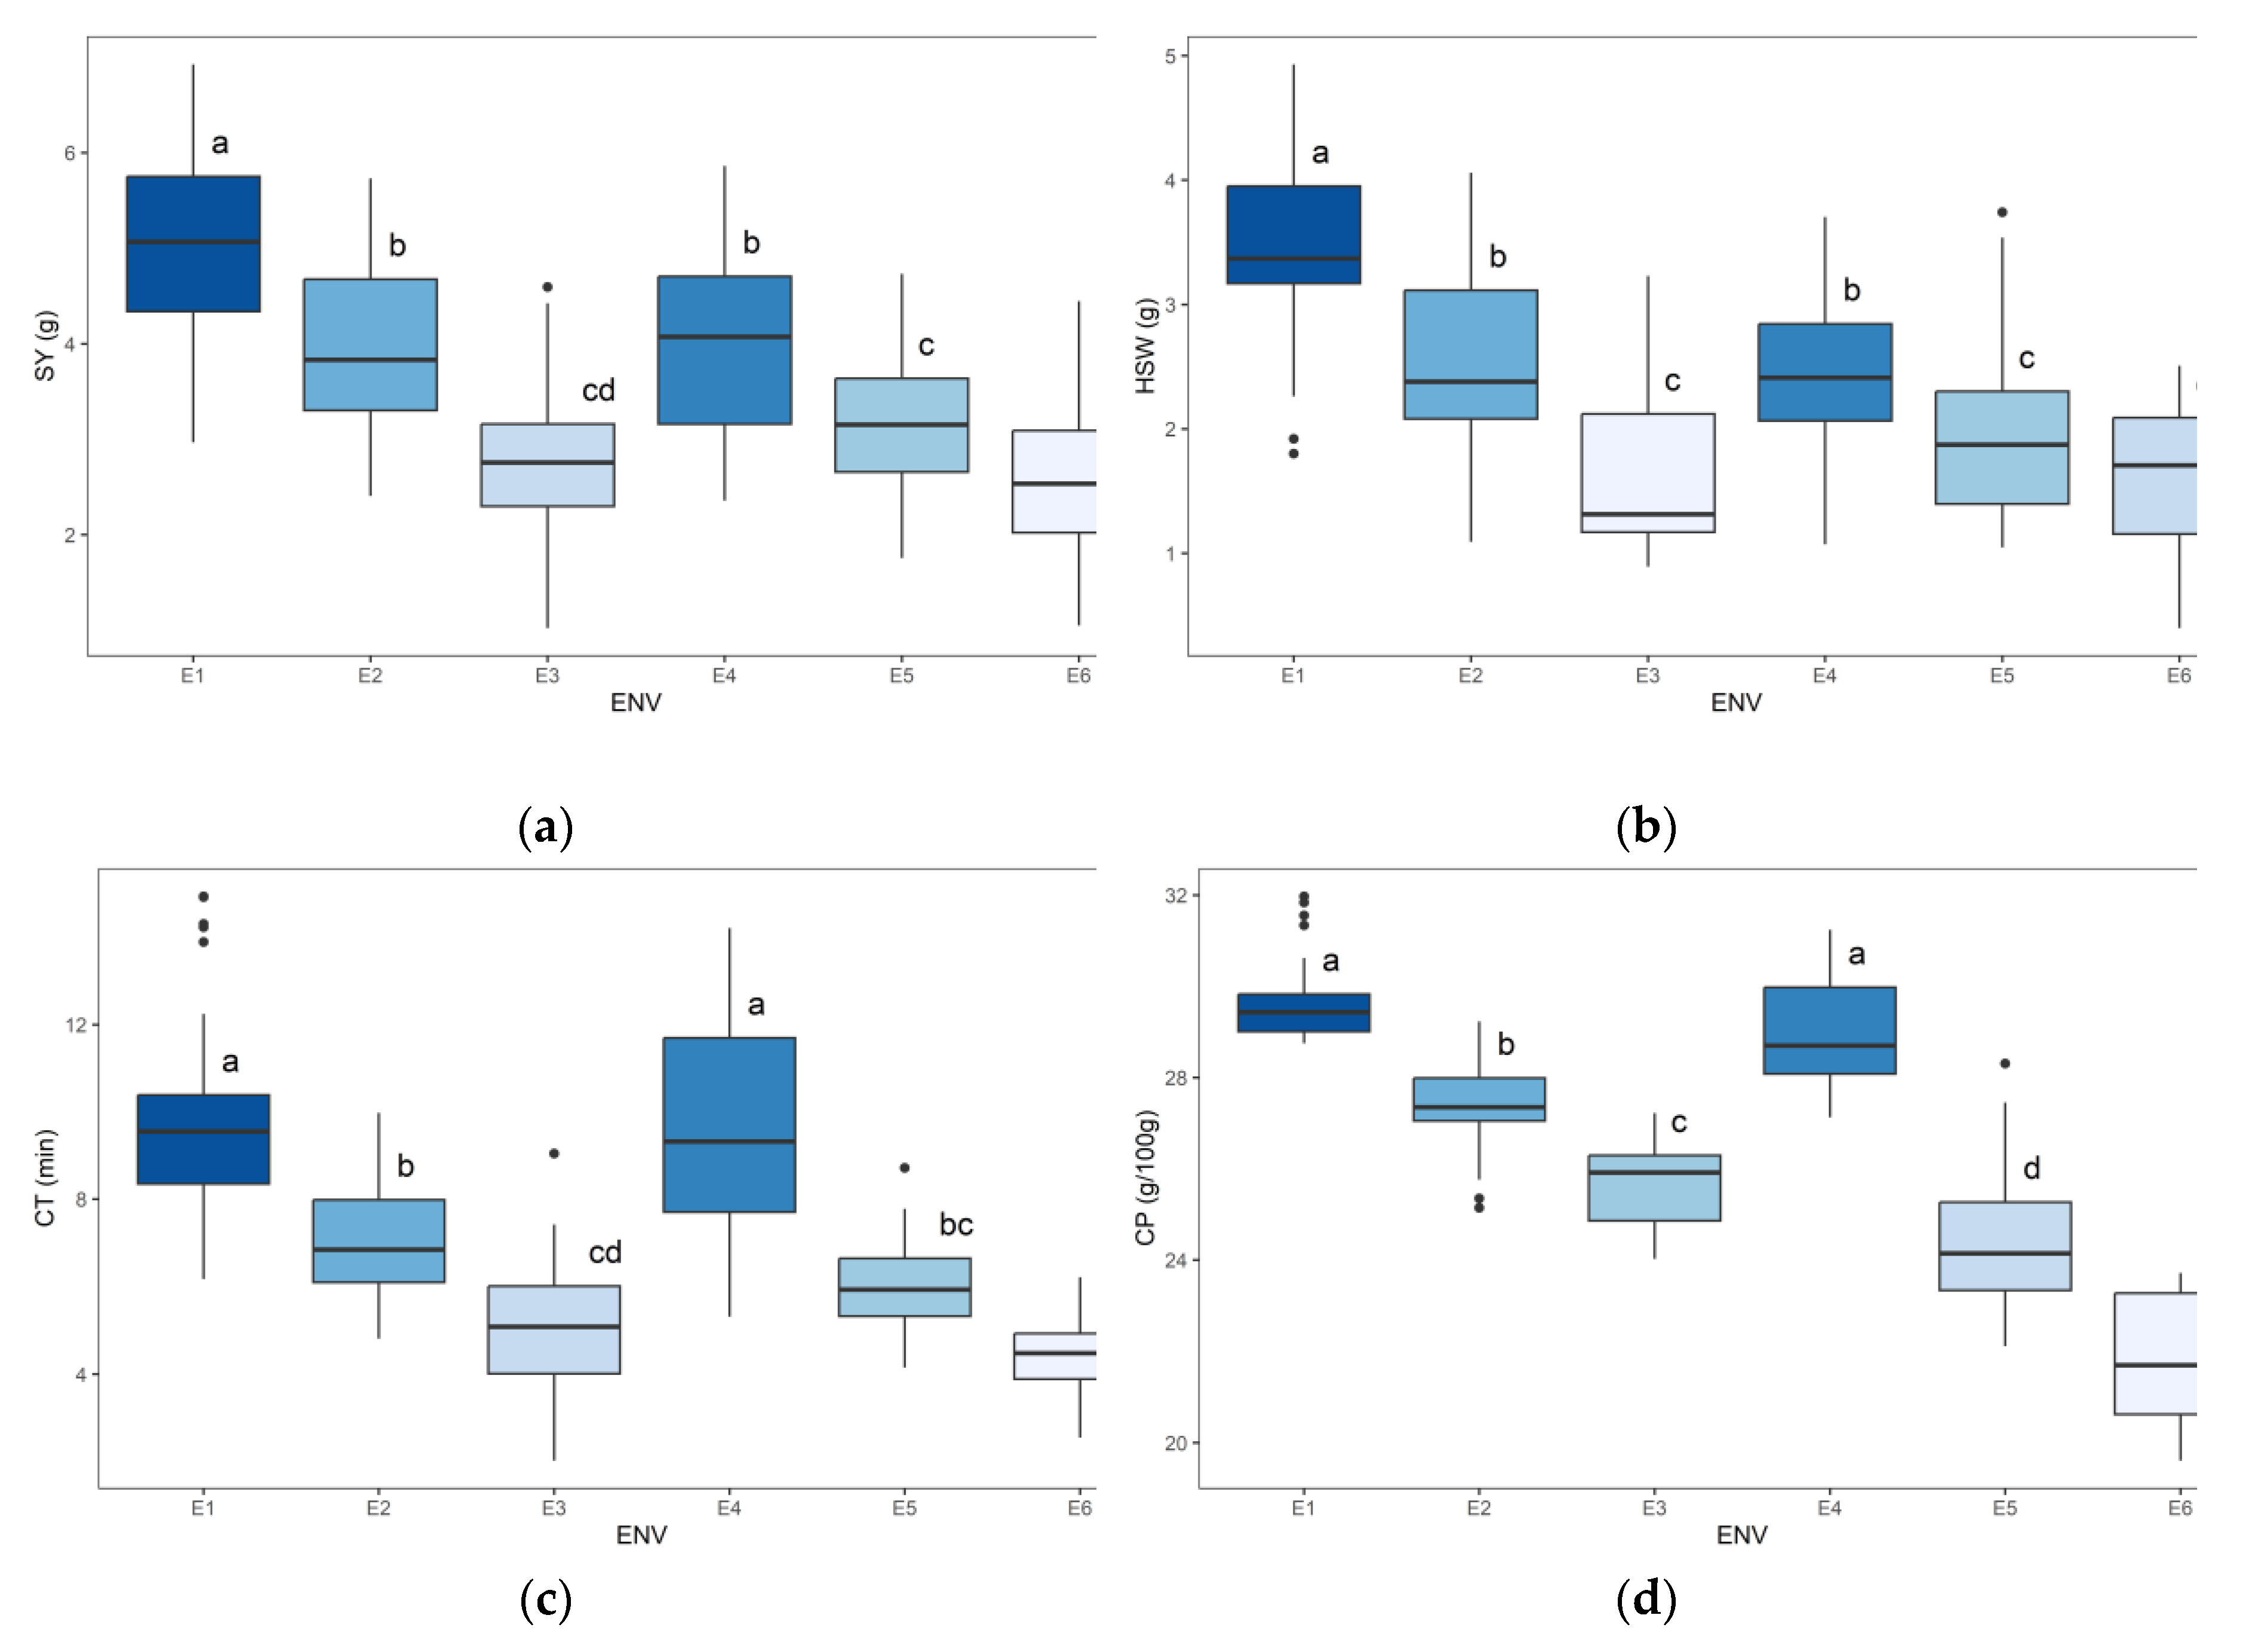
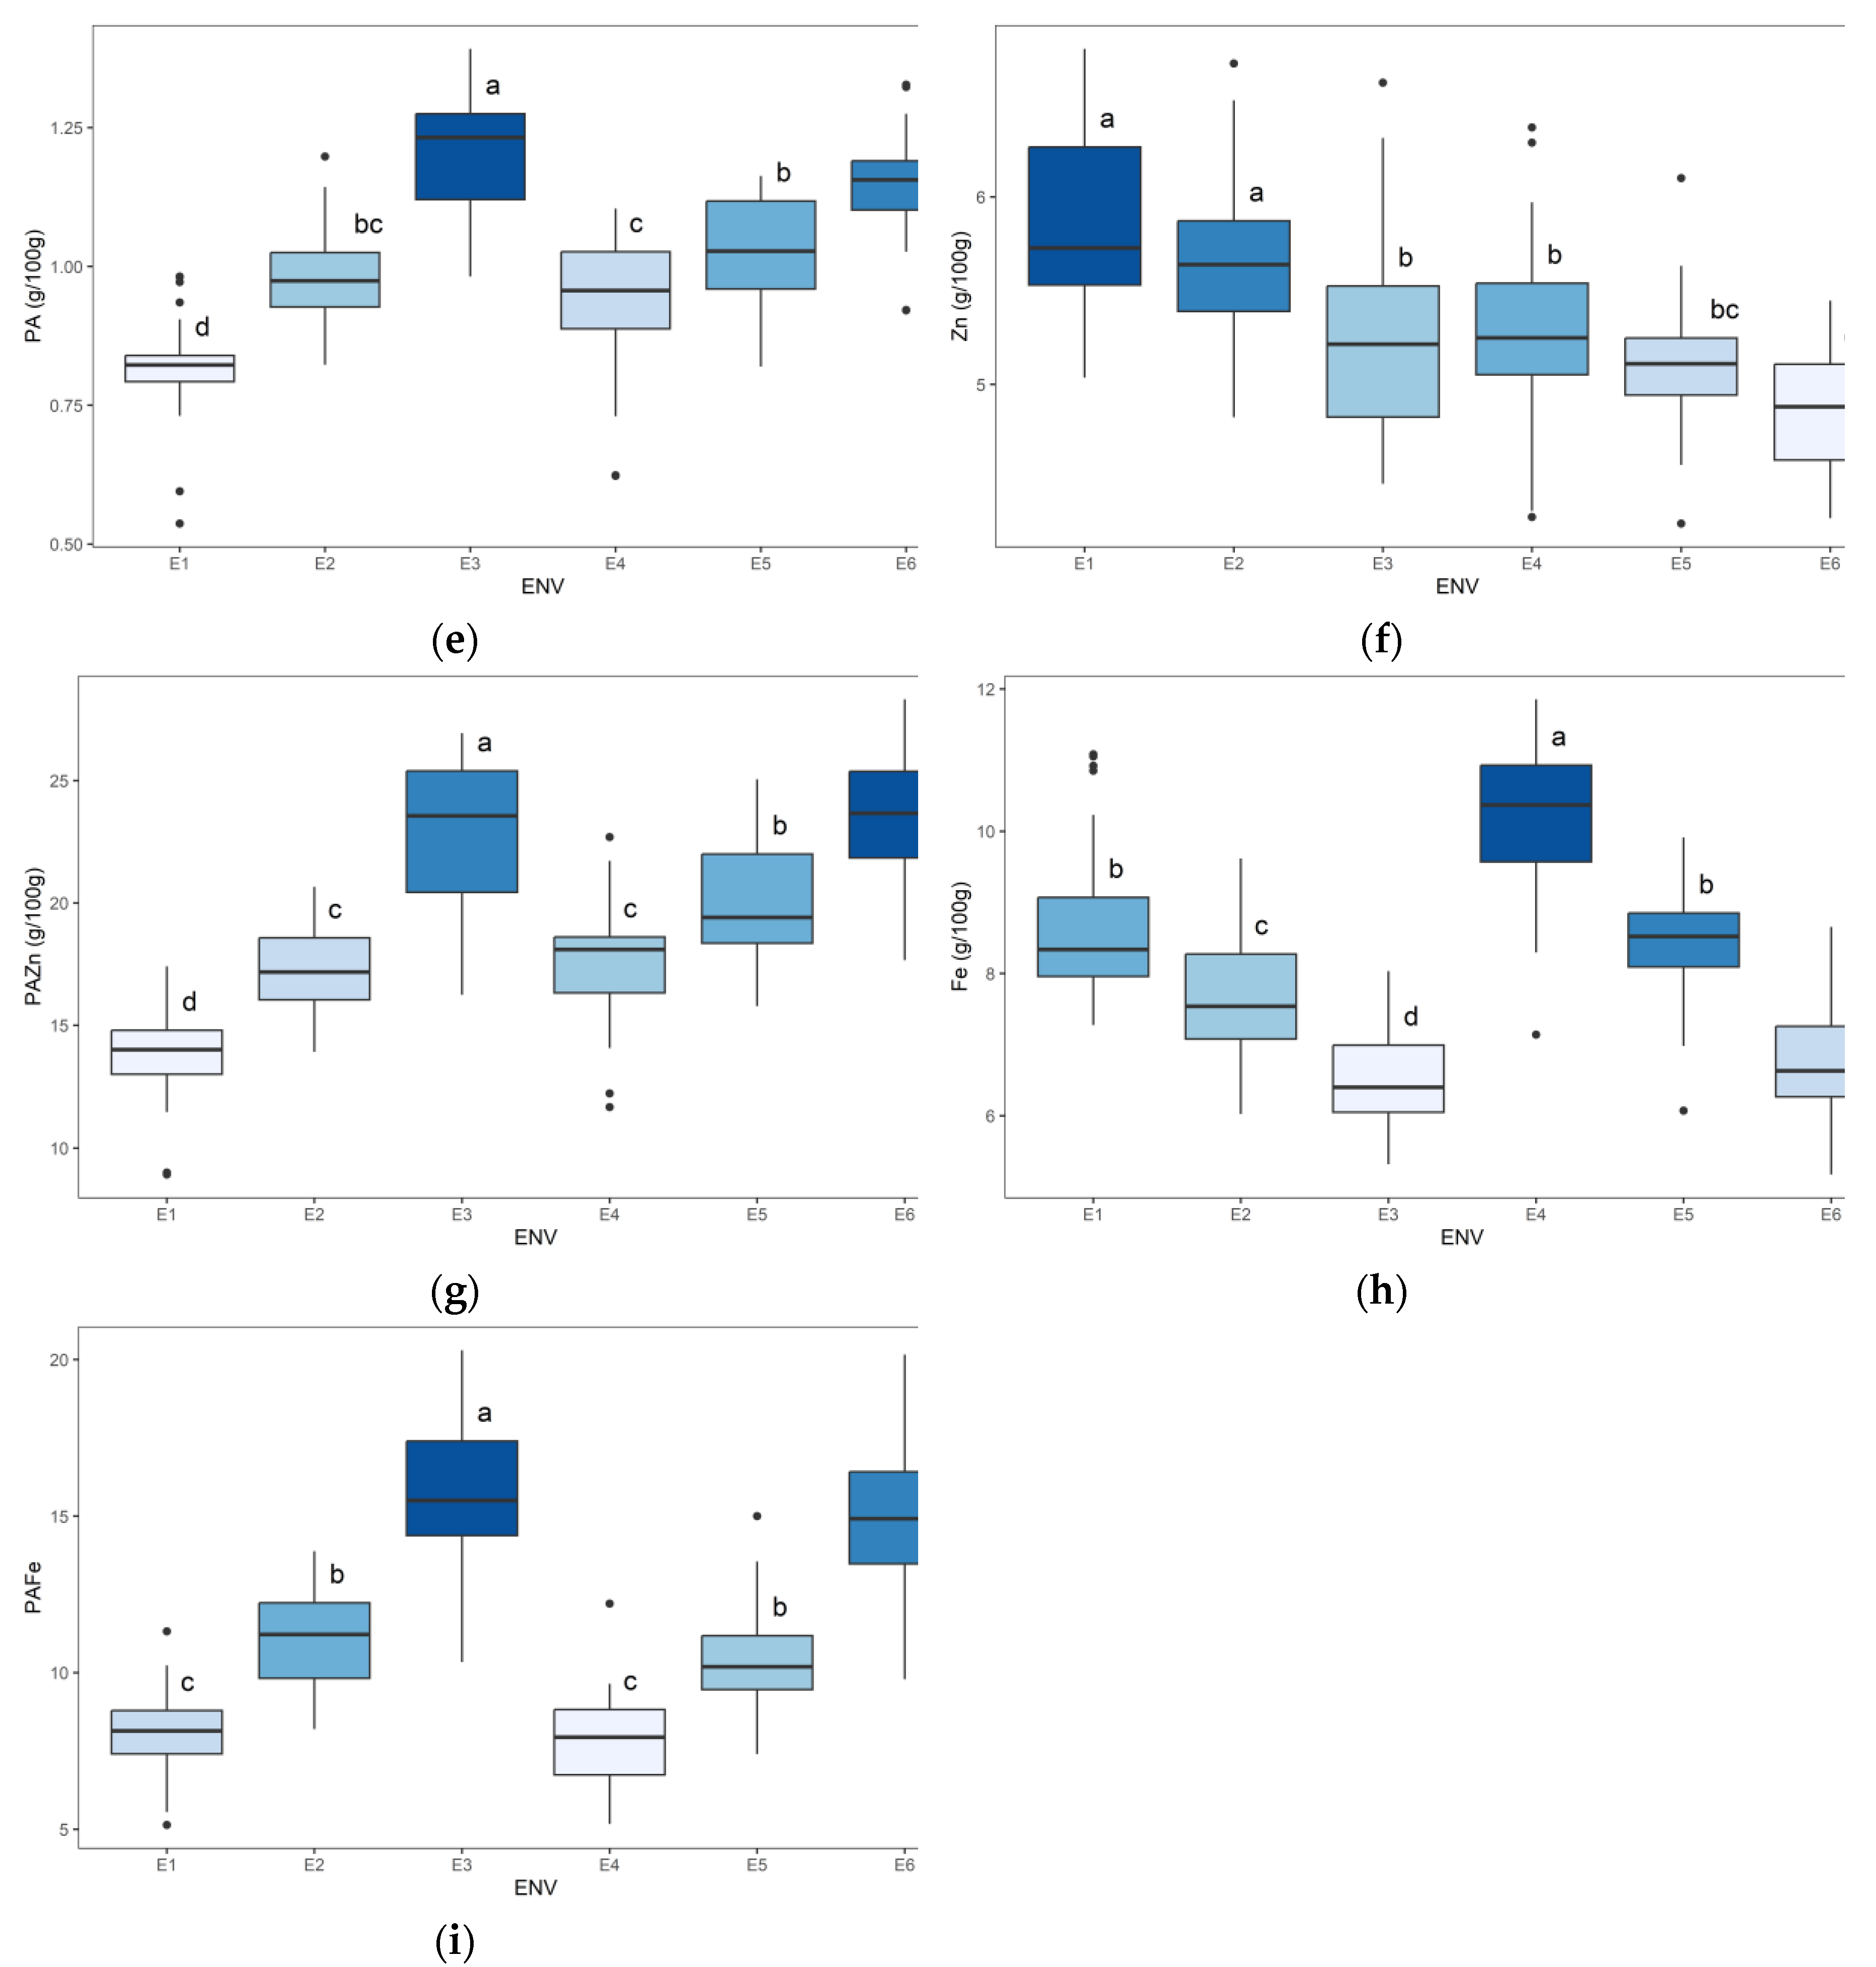
Figure 9.
Pearson correlations between grain yield and seed quality traits. The diagonal panels show histograms for each trait. The lower and upper triangular panels, respectively, show scatter plots and Pearson correlation coefficients between grain yield and seed quality traits under Environment E1 (a), Environment E2 (b), Environment E3 (c), Environment E4 (d), Environment E5 (e) and Environment E6 (f) growing conditions. SY, Seed yield (g); HSW, hundred-seed weight (g); CT, Cooking time (min); CP, Crude protein (g/100 g); PA, Phytic acid (g/100 g); Zn, Zinc content (mg/100 g); PA/Zn, Phytic acid/Zinc ratio; Fe, Iron content (mg/100 g); PA/Fe, Phytic acid/Iron ratio. *, **, and *** indicate significance at 0.05, 0.01, and 0.001 probability levels, respectively.
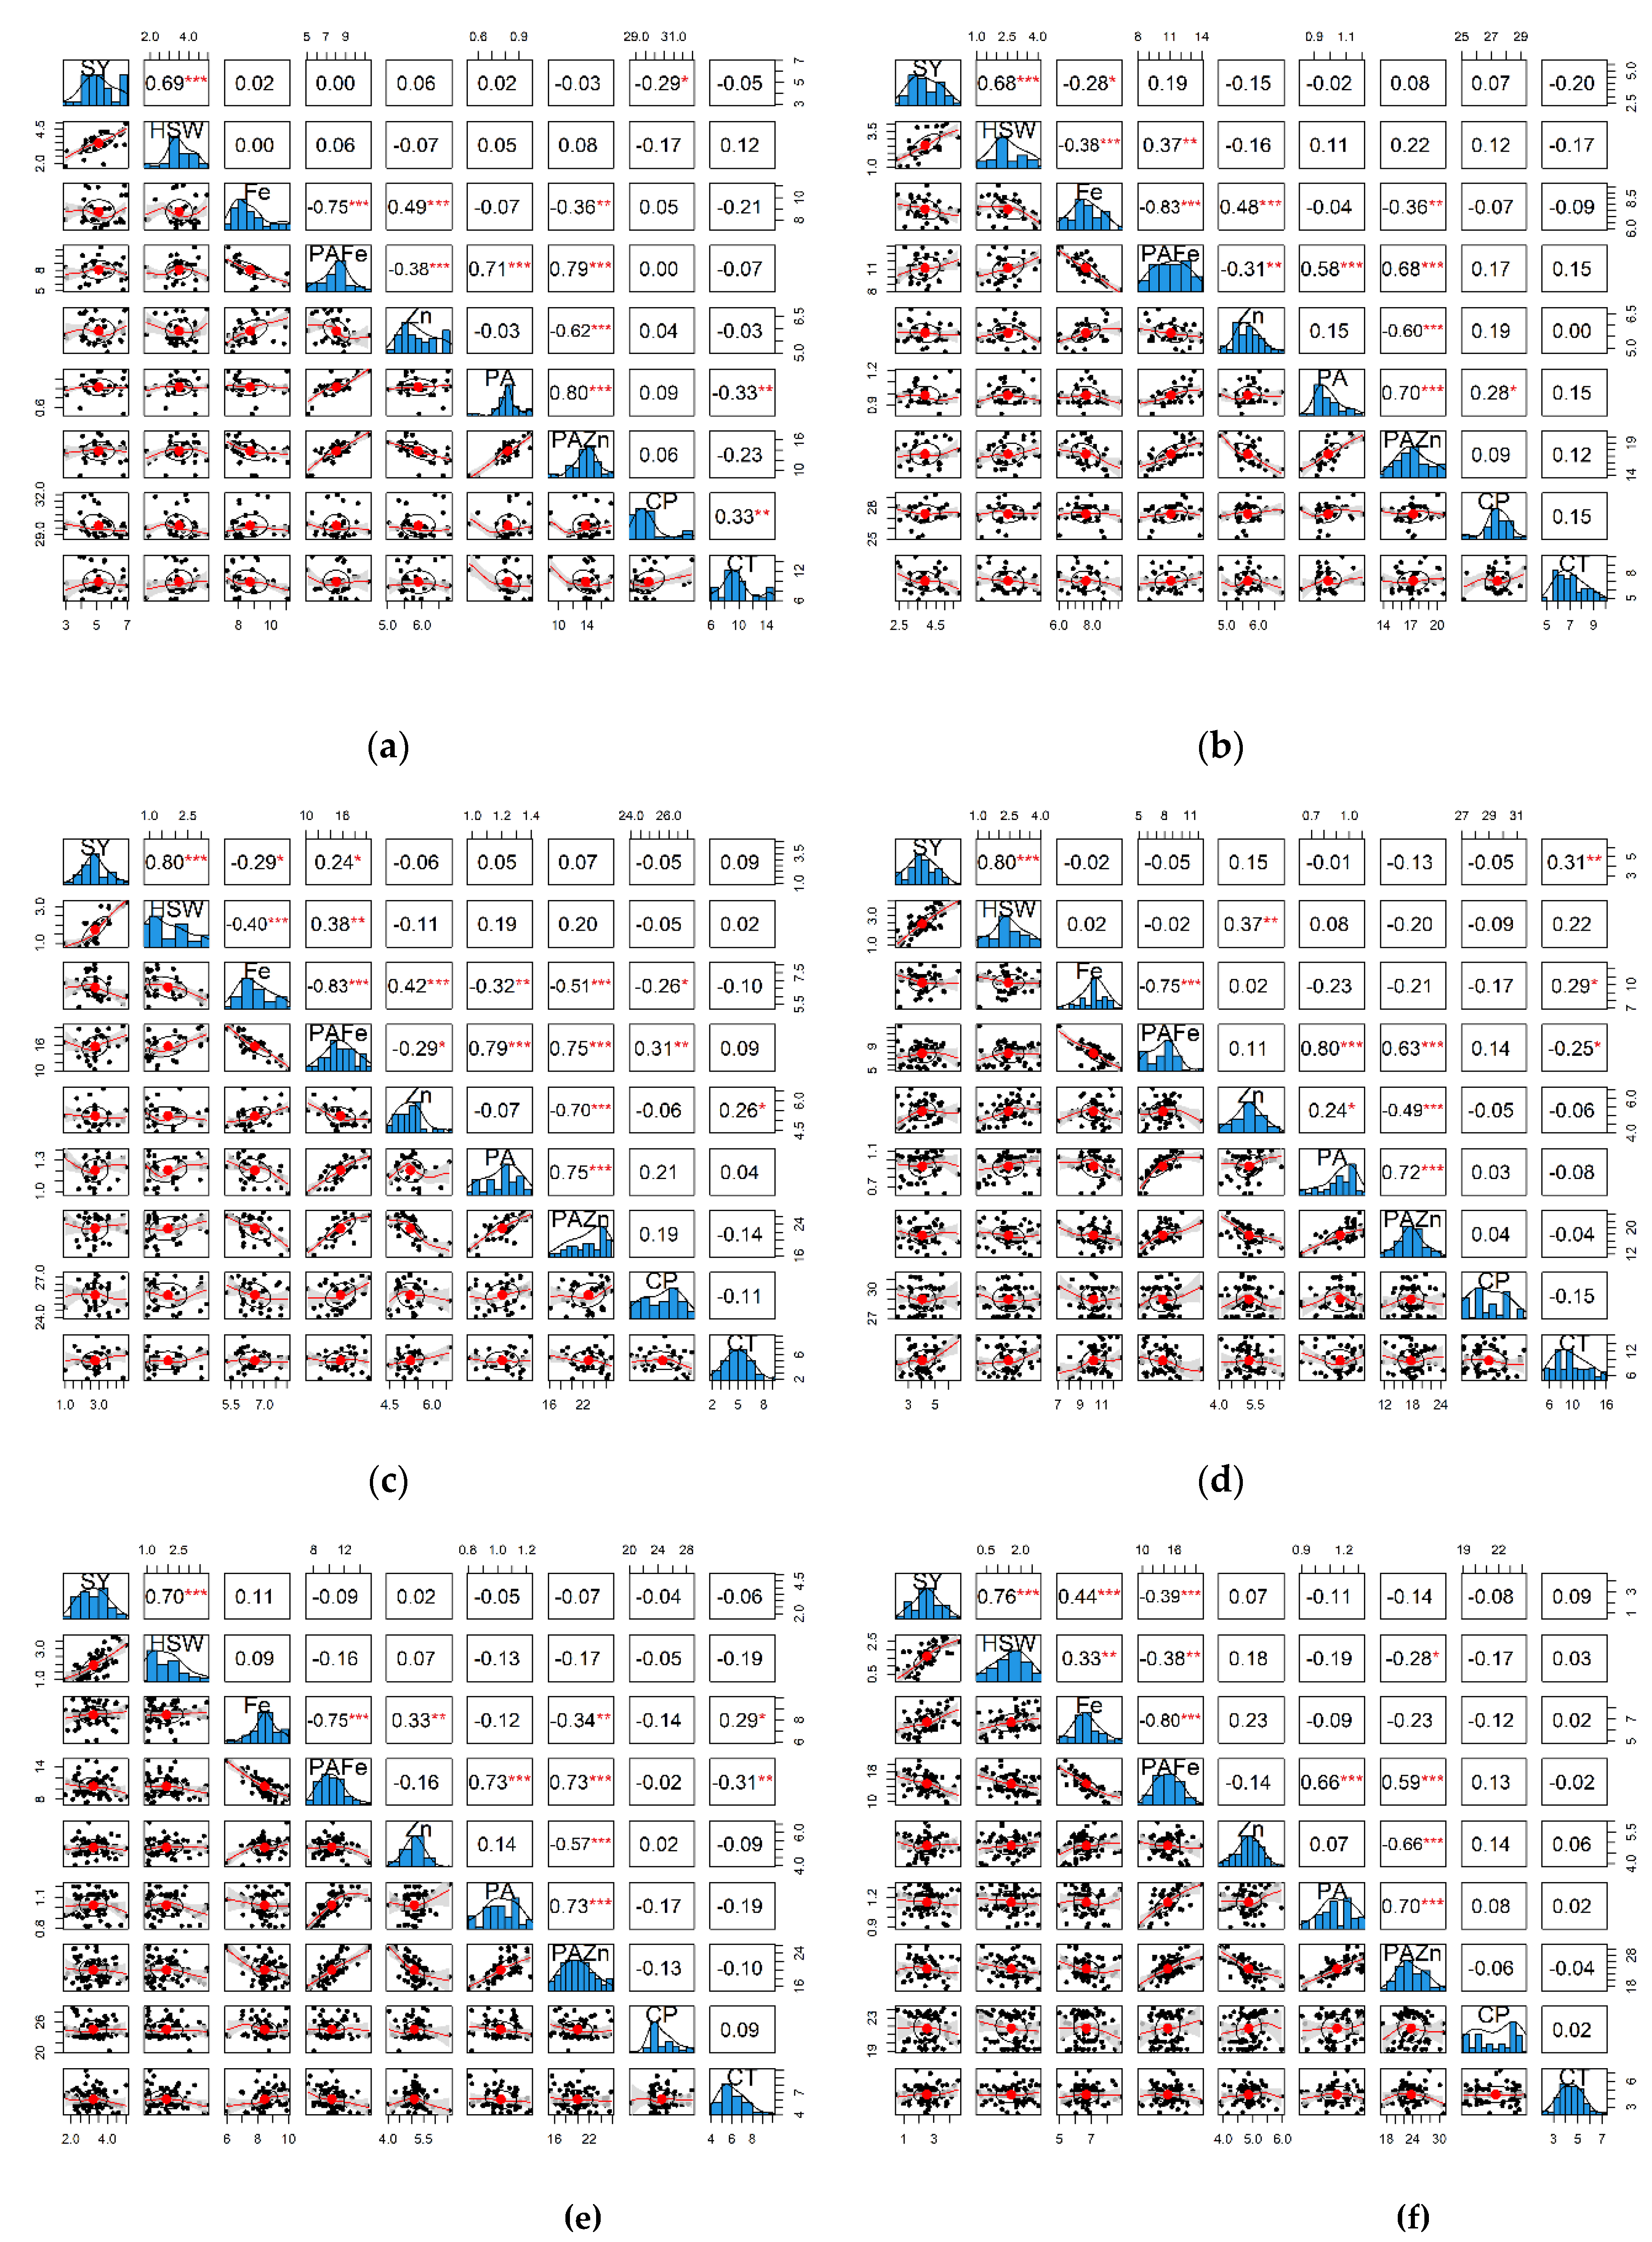

Table 1.
Additive main effects, multiplicative interaction (AMMI) and analysis of variance for grain yield and nutritional quality of 36 lentil genotypes tested across six environments.
Table 1.
Additive main effects, multiplicative interaction (AMMI) and analysis of variance for grain yield and nutritional quality of 36 lentil genotypes tested across six environments.
| Source of variation | df | SY | HSW | Fe | Zn | PA | PA/Fe | PA/Zn | CP | CT |
| G | 35 | 2.14** | 1.27** | 3.54** | 0.35** | 0.03** | 15.15** | 17.85** | 3.71** | 13.49** |
| E | 5 | 67.31** | 35.62** | 137.08** | 10.22** | 1.46** | 791.19** | 995.32** | 631.79** | 381.57** |
| GEI | 175 | 1.34** | 0.95** | 1.20** | 0.36** | 0.02** | 4.83** | 9.25** | 2.37** | 4.51** |
| IPCA 1 | 39 | 2.45 | 1.74 | 2.60 | 0.48 | 0.03 | 10.36 | 13.70 | 4.54 | 8.16 |
| IPCA 2 | 37 | 1.74 | 1.05 | 1.49 | 0.48 | 0.02 | 6.37 | 13.08 | 2.37 | 7.71 |
| Residuals | 0.10 | 0.09 | 0.09 | 0.08 | 0.00 | 0.43 | 2.05 | 0.63 | 0.58 | |
| R (%) | 96.70 | 95.40 | 98.20 | 88.60 | 96.50 | 98.20 | 94.10 | 96.50 | 96.30 | |
1SY, Seed yield; HSW, hundred-seed weight; Fe, Iron content; Zn, Zinc content; PA, Phytic acid; PA/Zn, Phytic acid/Zinc ratio; PA/Fe, Phytic acid/Iron ratio; CT, Cooking time; CP, Crude protein. 2*, **, and NS indicate significance at 0.05 and 0.001 probability levels, and non-significant, respectively.
Table 1.
Cont.
| Source of variation | df | SL | SW | SA | SP | SD | SE | SC | ST | SR |
| G | 35 | 0.46** | 0.47** | 22.96** | 10.23** | 0.48** | 0.00** | 0.00** | 0.00** | 0.00** |
| E | 5 | 0.61** | 0.71** | 27.53** | 34.12** | 0.70** | 0.03** | 0.00** | 0.01** | 0.00** |
| GEI | 175 | 0.51** | 0.52** | 28.24** | 11.74** | 0.52** | 0.00** | 0.00** | 0.00** | 0.00** |
| IPCA 1 | 39 | 0.70 | 0.71 | 37.16 | 23.18 | 0.71 | 0.00 | 0.00 | 0.00 | 0.00 |
| IPCA 2 | 37 | 0.58 | 0.60 | 36.52 | 11.82 | 0.59 | 0.00 | 0.00 | 0.00 | 0.00 |
| Residuals | 0.11 | 0.09 | 4.66 | 1.40 | 0.09 | 0.00 | 0.00 | 0.00 | 0.00 | |
| R (%) | 82.70 | 85.60 | 85.70 | 89.70 | 85.40 | 83.20 | 82.00 | 94.80 | 88.30 | |
1SL, Seed length; SW, Seed width; SA, Seed area; SP, Seed perimeter; SD, Seed diameter; SE, Seed eccentricity; FD, Feret’s diameter; SC, Seed circularity; ST, Seed thickness; SR, Seed rugosity. 2*, **, and NS indicate significance at 0.05 and 0.001 probability levels, and non-significant, respectively.
Disclaimer/Publisher’s Note: The statements, opinions and data contained in all publications are solely those of the individual author(s) and contributor(s) and not of MDPI and/or the editor(s). MDPI and/or the editor(s) disclaim responsibility for any injury to people or property resulting from any ideas, methods, instructions or products referred to in the content. |
© 2025 by the authors. Licensee MDPI, Basel, Switzerland. This article is an open access article distributed under the terms and conditions of the Creative Commons Attribution (CC BY) license (http://creativecommons.org/licenses/by/4.0/).
Copyright: This open access article is published under a Creative Commons CC BY 4.0 license, which permit the free download, distribution, and reuse, provided that the author and preprint are cited in any reuse.


