Submitted:
02 March 2025
Posted:
03 March 2025
You are already at the latest version
Abstract
Environmental DNA (eDNA) is an increasingly popular tool for detection, monitoring and characterising biodiversity. However, implementing eDNA-based approaches in terrestrial environments is more complex than in aquatic environments due to the many potential substrates, low and variable detection probabilities, lack of standardised sampling and laboratory protocols, contamination and detection biases, and interpretation challenges. Here, we provide tips to help terrestrial vertebrate biologists and natural resource managers better implement terrestrial eDNA (non-aquatic eDNA) techniques. We focus on sampling, laboratory protocols and interpretation because of their direct impact on the robustness of eDNA studies. Each point we discuss identifies potential sources of errors and provides recommendations to redress and fast-track the use of eDNA approaches in terrestrial biomonitoring.
Keywords:
Terrestrial eDNA
; Environmental DNA
; Guidelines
; monitoring
; non-aquatic
1. Introduction
Environmental DNA (eDNA) is changing how wildlife surveys and conservation decisions are implemented in the Anthropocene. Through the analysis of DNA fragments present in environmental samples (e.g., soil, water, air, ice), biologists have successfully identified single target species (rare, endangered or invasive) (Ficetola et al., 2008; Rojahn et al., 2021; Serrao et al., 2021), studied entire communities (Boussarie et al., 2018; Rourke et al., 2022; Ruiz- et al., 2023), assessed ecosystem health and functioning (Cordier et al., 2021), revealed biogeographic patterns (Dibattista et al., 2022; Holman et al., 2021), obtained population genetic metrics (Andres et al., 2023; Sigsgaard et al., 2020) and estimated biomass (Klymus et al., 2015; Rourke et al., 2022; Spear, Embke, Krysan, & Vander, 2021). New innovations and perspectives continue to be regularly documented (Adams et al., 2019; Bracken et al., 2019; Thakur & Roy, 2020).
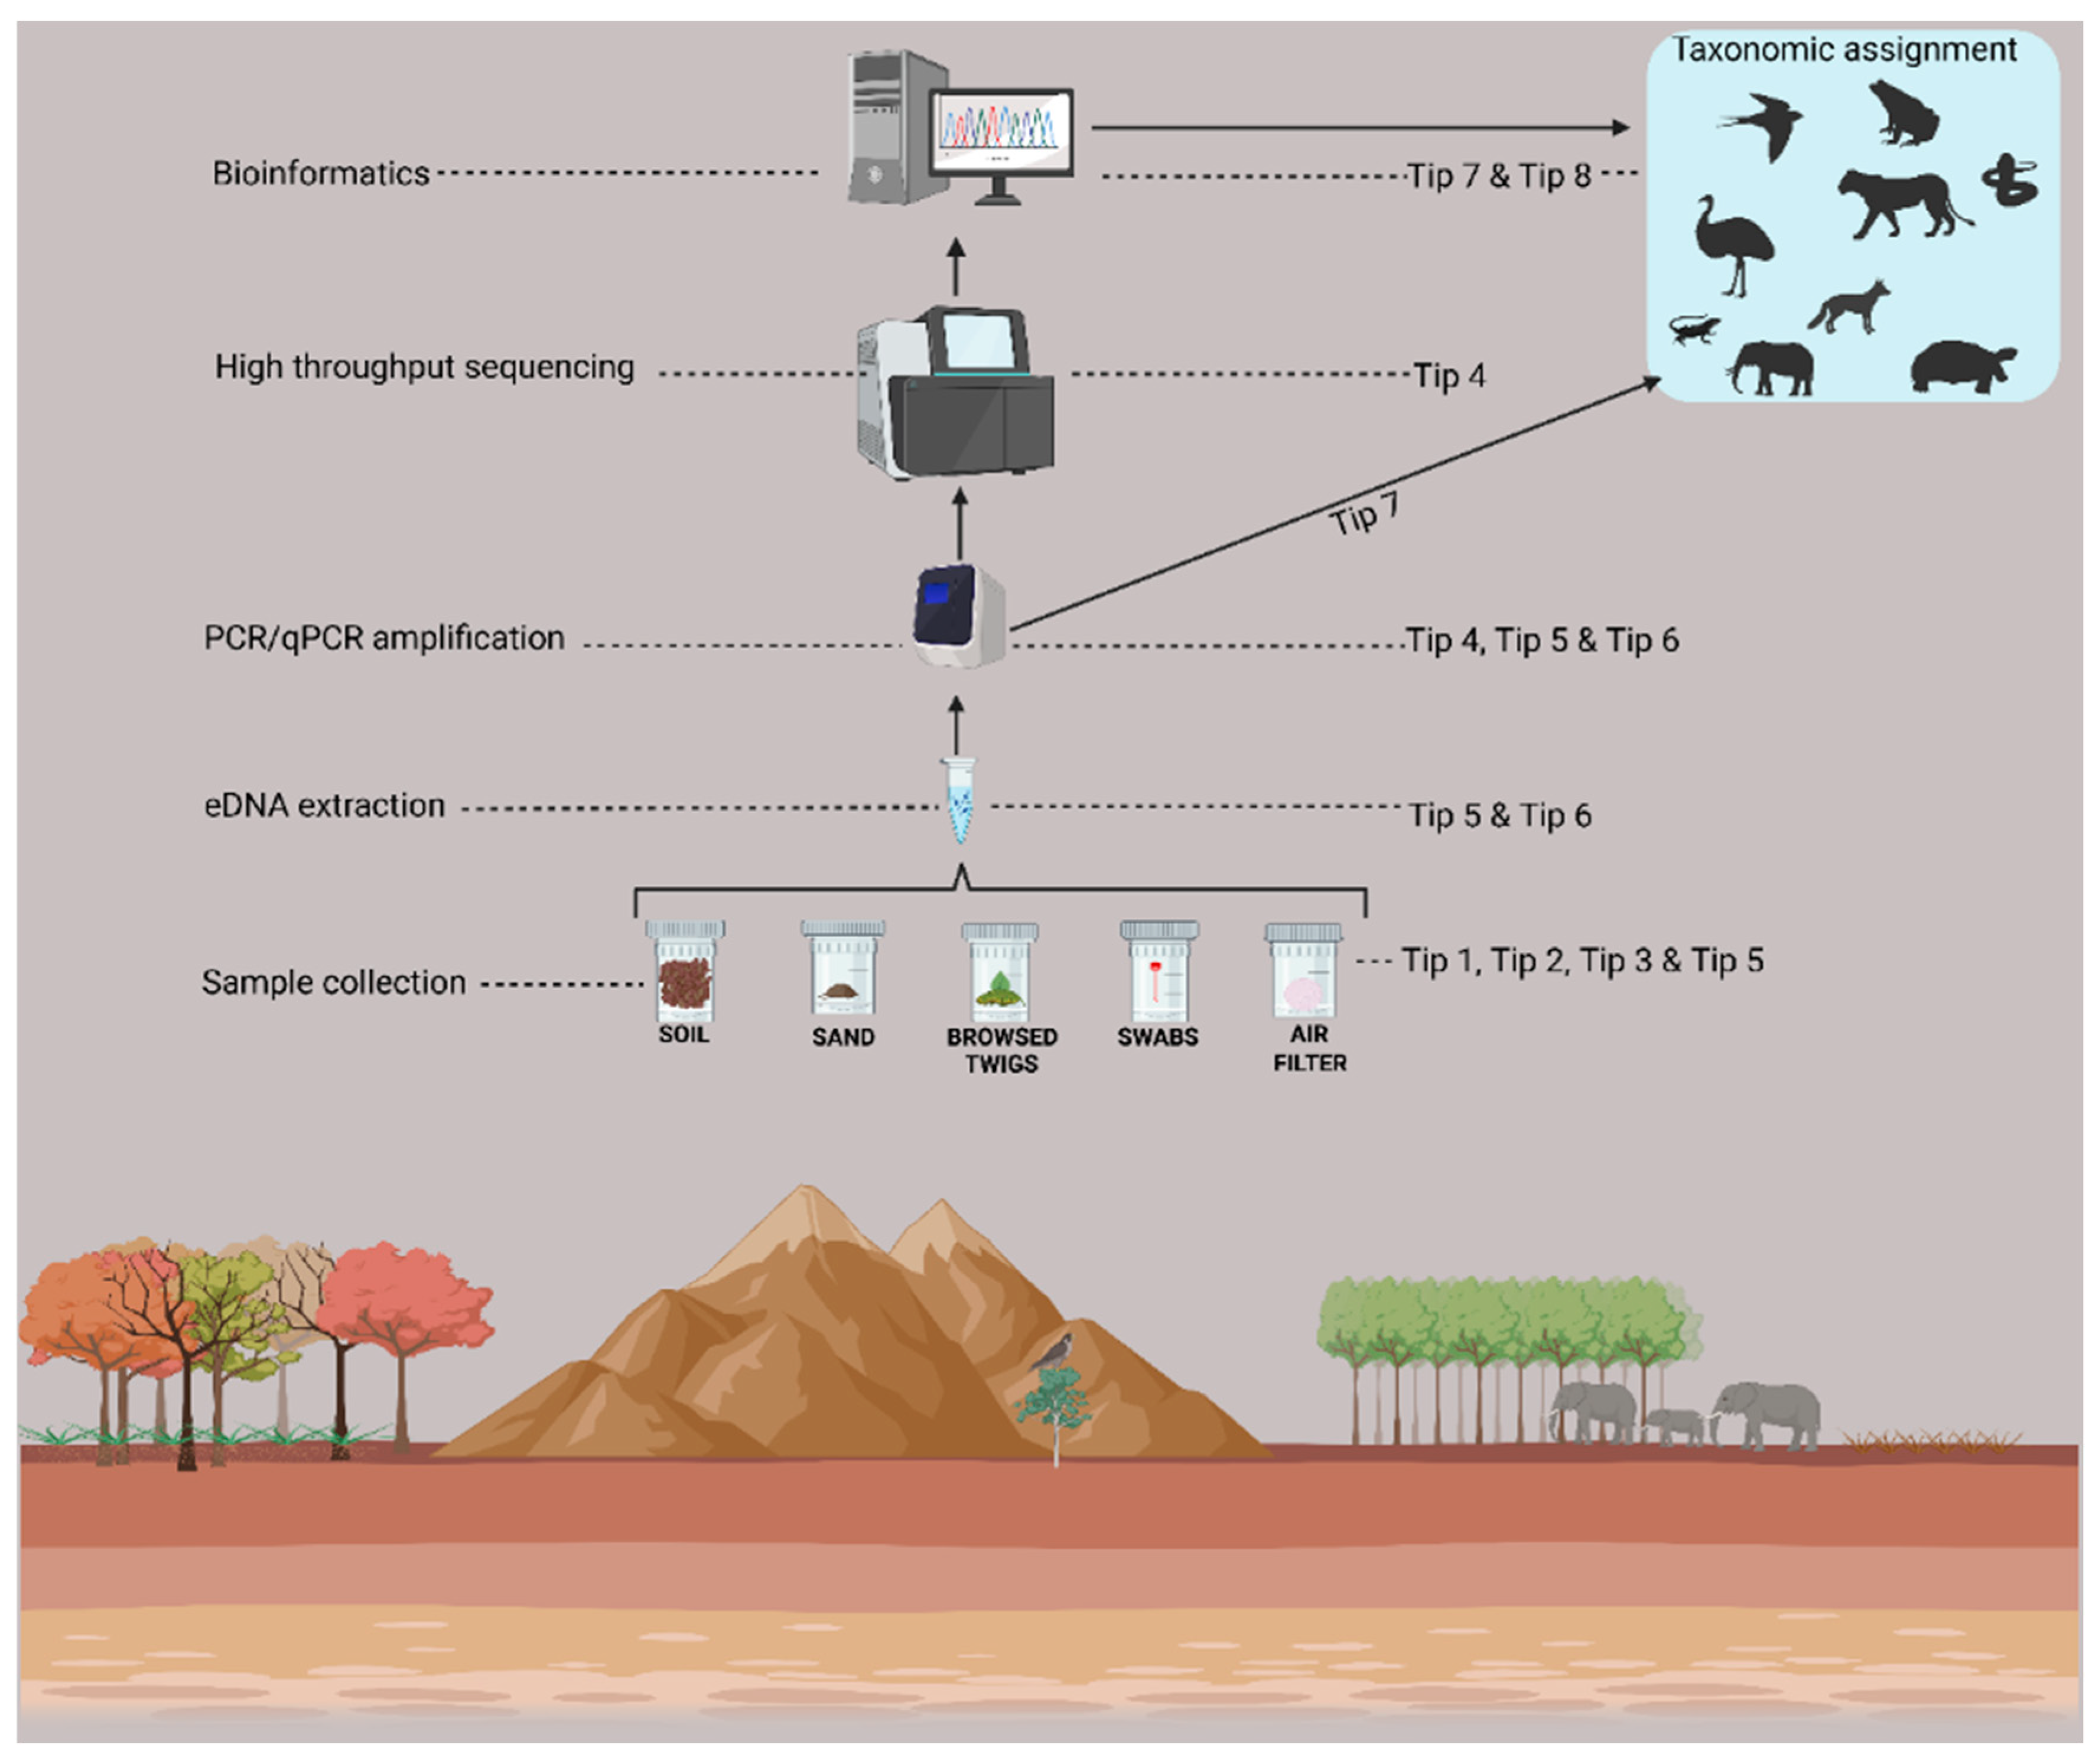
Although eDNA approaches began with terrestrial studies in the 1980s (Ogram et al., 1987), they have since been applied much more extensively in aquatic environments (Boussarie et al., 2018; Stat et al., 2017; Suarez-bregua et al., 2022; Zhang et al., 2022). Only a handful of studies have exclusively used terrestrial samples (Aucone et al., 2023; Kyle et al., 2022; Leempoel et al., 2020; Neice & McRae, 2021; Nichols et al., 2015) or provided a general framework for terrestrially derived eDNA in vertebrate research (but see Brauwer et al., 2023; Bruce et al., 2021). Since not all aquatic eDNA guidelines are replicable in terrestrial samples due to spatial heterogeneity of DNA, substrate composition, target species and their ecology, the application of these techniques to terrestrial environments has lagged and could be intimidating to terrestrial vertebrate biologists or natural resource managers with no previous experience in this area. In this article, we provide eight tips to make eDNA research more accessible to terrestrial vertebrate researchers and managers and to help them avoid some of the most common pitfalls. These tips follow the sequence of eDNA processing steps, from field sampling to interpretation of results (Figure 1).
We focus our tips on the analytical workflow because the choice of method and protocol at each stage can significantly influence the accuracy, reliability and detection probabilities (Bessey et al., 2022; Djurhuus et al., 2017; Kwok et al., 2020; Macé et al., 2022). For instance, Erickson et al., (2019) demonstrated that insufficient eDNA sampling (≤15 samples for common species and ≤45 samples for rare species) can easily result in false-negative detection (i.e., failure to detect target eDNA that is actually in the sample). Each of the eight tips presented here points out recurrent errors and traps and provides recommendations to enable seamless application of eDNA in terrestrial vertebrate biomonitoring.
Tip 1: Select the Sampling Substrate Carefully.
The rationale behind eDNA is twofold: organisms naturally shed cell fragments and exogenous DNA into their surroundings and these genetic signals can be extracted from a variety of environmental substrates (water, soil, leaf litter, sediments or air) to provide information about the organism (Ficetola et al., 2008; Taberlet et al., 2012, 2018; Thomsen & Willerslev, 2015c). Substrate type can bias DNA recovery and also lead to the detection of eDNA originating from outside the study area or time frame and may therefore be a source of errors in eDNA research (Hermans et al., 2018; Koziol et al., 2019; van der Heyde et al., 2020). Currently, there is no general rule for selecting the optimal eDNA substrate for terrestrial vertebrate research, and the mechanism that influences the presence, concentration and persistence of eDNA in each terrestrial substrate through time and space remains unclear. However, a body of evidence has shown that soil (Andersen et al. 2012; Ryan et al. 2022a), air (Clare et al. 2021; Lynggaard et al. 2022; Roger et al. 2022), tree bark (Allen et al. 2023), browsed twigs (Kudoh 2020; Nichols et al. 2012), artificial covers (Kyle et al. 2022) (Matthias et al., 2021) and natural saltlick (Ishige et al. 2017) can reliably provide information about the occurrence, distribution and diversity of terrestrial vertebrates.
A pragmatic way to determine the suitability and availability of substrate in terrestrial environments is to consider: (i) the biology and ecology of the target organism, since the DNA shedding rates vary between organisms, large-bodied animals often shedding more DNA compared to small-bodied animals and DNA concentration increasing in the environment during a reproductive bout or acute stress (Maruyama et al., 2014), (ii) the degree to which organisms interact with the potential substrate, as ample evidence shows high DNA recovery on substrate collected at the area of animal frequentation (Pilliod et al., 2014), (iii) chemical and enzymatic composition in a substrate because substrates such as soil contain chemical compounds that bind to DNA molecules thus affecting the amount of DNA that can be extracted (Cai et al., 2006), and (iv) environmental conditionscan influence DNA decay and degradation such as substrates that are directly exposed to high temperatures and ultra-violet light (e.g., desert environments) having a reduced likelihood of DNA recovery (Levy-booth et al., 2007; Stewart, 2019). In cases where a priori information about the organism is missing, we suggest collecting and simultaneously analysing multiple substrate types (also see Tip 2) from locations where the study organisms are thought to occur.
Tip 2: Sample Size Matters
Appropriate sampling is critical for obtaining accurate biodiversity metrics (e.g., species richness, community composition etc) in ecological surveys. It can be a serious problem in terrestrial eDNA-based studies since it confers replication errors and retains a false null hypothesis in case of small sample size (Erickson et al., 2019; Guerra-castro et al., 2021) or leads to wastage of resources when an unnecessarily large number of samples are analysed (Burgess, Jackson, and Murrell 2022). Sample size calculation for terrestrial eDNA can be complicated because wild terrestrial vertebrates exhibit a high level of spatial heterogeneity leading to the patchy distribution of eDNA across the habitat. Many eDNA-based studies normally base their sample size on the available budget or the assumption that larger sample numbers or volume increase detection probability (Spear, Embke, Krysan, & Vander Zanden, 2021; Thomas et al., 2018). To avoid inherent errors associated with over/under-sampling, we recommend the use of power analysis or other estimators such as rarefaction and asymptotic richness to estimate the appropriate sample size or range (Gotelli and Colwell 2001). The selected calculation method should aim to account for the variation that could be introduced by environmental conditions, i.e. the biomass of the target species and the dispersion of DNA in the environment (Furlan & Gleeson, 2016).
When working with harmonizable substrates such as soil or artificial surfaces, multiple samples can be collected within sites, pooled, and then homogenized to produce a final sample that is “homogeneous”. Then a smaller subsample can be taken and analysed as a representative of the entire mixed sample or site (Allen et al. 2023; Ryan et al. 2022b). Sample pooling can bias the ability to detect rare species and local endemics by masking their DNA (Manter, Weir, and Vivanco 2010). Conversely, it may be useful in reducing the sample number, variability and cost of analysis, especially when using DNA metabarcoding approaches to obtain total taxonomic inventories and diversity estimates (Sato et al., 2017; Wainer et al., 2020).
Sample volume (i.e., the bulk of the sample collected) also needs to be considered during sample size calculation (Nascimento et al., 2018). The volume can influence the reproducibility of the eDNA detection. For example, a small soil mass (e.g., 0.25g) has high detection potential for rare species as well as high reproducibility for target species relative to larger soil volumes (e.g., 10g)(Morita & Akao, 2021). Larger sample volumes (>10g) are also expensive to handle as most DNA extraction kits can handle a maximum of 10g (Qiagen PowerMax Soil kit). Therefore, a trade-off between sample number and sample volume should be considered based on the goal of the study and the abundance of the target species (Sepulveda et al., 2019). Generally, two to ten samples per site have been sufficient for >95% detections of target organisms (Aylward et al. 2018; C. Goldberg 2017; Neice and McRae 2021). When targeting rare and cryptic species or sampling in remote and inaccessible areas, however, we recommend collecting as many samples as possible to increase the detection probability or conducting a pilot study where species presence or abundance is known.
Tip 3: Choose the Sample Preservation Method Thoughtfully.
Sample preservation is an important step in the eDNA workflow as it can significantly impact eDNA recovery rates and the probability of false negative results. Ideally, field sampling and preservation followed by rapid eDNA extraction is recommended for environmental samples. This minimises DNA degradation and leads to optimal DNA concentrations of target taxa. However, this is sometimes not possible due to some eDNA substrate types or logistical constraints (e.g., remote field sites). Sample pre-treatment is required to allow long-term sample storage with minimal eDNA degradation. Various methods are frequently used to preserve and transport terrestrial eDNA samples (Aylward et al. 2018; Leempoel, Hebert, and Hadly 2020; Neice and McRae 2021). These methods vary depending on the substrate type and availability of resources.
When collecting soil samples in the field for eDNA analysis we suggest researchers use existing methods such as freezing in liquid nitrogen or placement in buffers (e.g., DNA shield, RNAlater®, DMSO–EDTA–salt) for ambient storage. Alternatively, soil samples can be mixed with sterile water and filtered using a fine porous medium that is stable at room temperature(Tsuji et al., 2019). For substrates such as swabs, air filters and twigs we suggest using absolute ethanol for storing eDNA if freezing options are unavailable (Erdozain et al., 2019). Researchers should avoid using 75% ethanol as studies have found a considerable reduction of DNA yield in environmental samples stored at this concentration (Rissanen et al. 2010).
Once samples are transported to the laboratory, they should be frozen at -80°C or in liquid nitrogen (-196°C) for long-term storage or at -20°C for short-term preservation. It is also worth noting that repeated freeze-thaw cycles may compromise the integrity of DNA by altering the structural integrity of the DNA molecule and should be minimised. Besides considering the quality of sample preservation, it may be necessary to calculate all costs and risks that are involved with transport, especially if transport requires several days.
Tip 4: Determine the Analytical Approaches with Care.
There are two primary eDNA analytical approaches: (i) species-specific method (PCR, qPCR, ddPCR, dPCR) that uses specific barcodes for species identification, and (ii) metabarcoding which enables simultaneous high-throughput multi-taxa identification using conserved gene regions and next-generation sequencing. The choice of analytical approach should vary depending on the goal of the study. A species-specific approach is more sensitive and thus recommended for detecting rare (Wilcox et al., 2013), endangered (Day et al., 2019), cryptic and invasive terrestrial species (Williams et al., 2018). Alternatively, eDNA metabarcoding is robust and cost-efficient for community composition studies, characterizing past and present biodiversity patterns and when targets are many or unknown (e.g., biosecurity) (Ji et al., 2013; Yoccoz et al., 2012).
Marker choice (i.e., gene type, gene region and size) is another important technical consideration for both approaches because different gene markers have contrasting resolution, coverage and bias between taxonomic groups (Ruppert, Kline, and Rahman 2019). Short mitochondrial DNA (mtDNA) markers have so far dominated eukaryotic eDNA research due to their high copy numbers per cell and high availability in reference databases (also see Tip 6) compared to nuclear genes. Although mtDNA markers are effective for species identification they have limited resolution for population genetics, reproductive events and body size estimation, all of which are key aspects of terrestrial vertebrate conservation programs (Funk, 2021; Holt & Brown, 2014). Multicopy nuclear DNA markers such as the internal transcribed spacer (ITS) regions in ribosomal RNA genes can provide higher resolution and have shown high detectability and yield. We suggest their incorporation during study design. Two caveats, however, for ITS are that there are very few vertebrate sequences currently available for assay development and that the copies of the ITS within an individual may not be identical. These can lead to complications during the interpretation of results (Navajas et al., 1999; Xu et al., 2017). Where possible we recommend the combined use of multi-copy nuclear and mtDNA markers, especially if the goal of the study is to assess how species and populations are interacting in a given environment.
A further analytical approach to consider is whether to include a probe and/or blocking primers during assay development (Klymus et al., 2020; Vestheim & Jarman, 2008). Adding these technical sequences to the assays can increase the specificity of the selected gene markers or prevent the amplification and sequencing of non-target molecules.
A major problem in the interpretation of eDNA results is that of accurately knowing when the eDNA was shed or whether it was shed from dead or living organisms. This is because eDNA is generally stable and in a substrate, such as soil it can be adsorbed and detected after a long period. That impacts the precise estimation of the current distribution and abundance of species (Ariza et al., 2023; Bairoliya et al., 2022). To circumvent this, we suggest trialling eRNA biomarkers as they have a high turnover or decay rate compared with eDNA and they can be expressed only by living organisms. They are thus highly effective in inferring real-time occupancy with higher spatial and temporal resolution (Cristescu, 2019). However, eRNA should be considered only when the target organisms are known to occur a priori so as to avoid wasting resources (Yates et al., 2021).
Other considerations include the choice of bioinformatic software to analyse the eDNA metabarcoding data. Most common software uses clustering of operational taxonomic units (Boyer et al., 2016; Edgar, 2010; Schloss et al., 2009) or inference of amplicon sequence variants to in turn infer sample sequences (Callahan et al., 2016). The clustering-based approach groups read into operational taxonomic units (OTUs) based on sequence similarity thresholds, typically 97%, while amplicon sequence variants (ASVs) infer reads that differ from as little as one single nucleotide using a set error model for sequencing run (Callahan et al., 2017; Kozich et al., 2013). Although the clustering-based approach is efficient in reducing the impact of sequencing errors, retaining rare sequences and reducing the computational burden on the analysis (Schloss & Westcott, 2011), ASV-based methods are more accurate and generate more desirable results especially when estimating alpha and beta diversities (Callahan et al., 2017; Chiarello et al., 2022; Joos et al., 2020). In addition, ASV results can be readily compared between studies using the same gene region as they are generated without clustering or the use of reference databases (Nearing et al., 2018). As eDNA studies move towards approaches with increased reproducibility, accuracy, sensitivity and ease of comparison between studies we recommend the utility of ASV-based software or pipelines like PEMA that support both OTU clustering and ASV inferences (Zafeiropoulos et al., 2020).
Tip 5: Be Mindful of Contamination.
Sporadic and systemic sample contamination by exogenous DNA is a key challenge in eDNA-based studies. eDNA approaches utilize the polymerase chain reaction (PCR) to target relatively short DNA fragments (< 200bp), and so can be highly prone to co-amplification of any contaminant DNA in the sample. This is a significant issue. It not only leads to false-positive results but may also lead to false-negative results due to competition or bias during PCR amplification (Furlan et al., 2020; Sepulveda et al., 2020; Thomsen & Willerslev, 2015a).
Contamination occurs subtly and inadvertently and so it can be hard to detect and eliminate in real-time. However, the risk of contamination can be significantly reduced by establishing a clean and consistent protocol for every stage of the workflow (i.e., from sample acquisition to laboratory analysis). In the field, single-use disposable supplies should preferentially be used. Decontamination with standard laboratory-grade chemicals (e.g., 10% commercial bleach) is typically ineffective (Aitken 2019; C. S. Goldberg et al. 2016; Wilcox et al. 2016) especially in removing modern DNA (Gilbert et al. 2006). Reusable field equipment should be cleaned with 50% bleach solution and rinsed thoroughly using sterilised water or ethanol (C. S. Goldberg et al. 2016). To ascertain sample point independence and quantify potential contamination, negative field controls (i.e., eDNA substrate collected using the same protocol and equipment, preserved and processed in the same way as field samples) should be included for every sampling point (Dickie et al. 2018). DNA can be carried from one sampling location to the next on clothing (e.g., on boots) and sampling gear. Therefore, the sampling researcher should, when and where possible, avoid using the same unwashed clothing at different localities (Herder et al. 2014). To prevent sample-to-sample contamination, the outside of the sample tube should be cleaned with bleach post-collection and placed individually in a sealed bag.
Terrestrial eDNA samples should be stored and processed in a dedicated facility (hereafter Trace DNA laboratory) that is physically separated from rooms where high-quantity DNA extraction and PCR products are handled. Ideally, the room should be fitted with positive air pressure (Taberlet 1999). Movements in the Trace DNA laboratory should strictly be ‘one-way’ i.e., a researcher should not enter the trace lab if they have, on the same day (or since they last showered), been in laboratories containing biological samples, DNA extracts or PCR products. To reduce the chances of introducing contaminant DNA, all supplies and equipment should not leave the lab and appropriate Personal Protection Equipment should always be worn. Further, disposable shoe covers, lab coats, face masks and hair nets should be worn inside the PCR setup and DNA extraction areas and replaced after each use (J M Young, Austin, and Weyrich 2017). No supplies or equipment in the Trace DNA laboratory should leave the room. Any surface coming into contact with DNA samples or PCR products should be sterilized using UV or 50% bleach. It is advisable to wipe clean the benchtop work surface using 6 -10% bleach or DNA AWAYTM Surface Decontaminant before and after using the workstations.
The researcher should always include positive controls, extraction blank controls and non-template controls (Jennifer M Young, Weyrich, and Cooper 2014) in each step of eDNA extraction and PCR. Experimental controls are crucial in monitoring user-introduced contamination. They also help in detecting any contamination introduced by commercial reagents and in monitoring the increase in background DNA levels in reagents over time, as new reagents are susceptible to contamination upon opening. When negative controls test positive for a species, all associated samples testing positive for that species should be discarded to remove false positives.
Tip 6: Strategize on How to Handle Inhibition.
Virtually all environmental samples contain biological particulates and organic compounds such as acids (i.e., humic, fulvic and tannic), proteins and salts which can directly affect the efficiency of both DNA extraction and PCR amplification. Inhibition is likely to be more prevalent in soil/terrestrial substrates than in water samples because they contain high levels of organic matter and inorganic particles (Amador et al., 1990; Machado et al., 2020). These contaminants are usually bound to eDNA molecules (Romanowski et al., 1991). They interfere with cell-lysing enzymes during DNA extraction and impede PCR amplification by reducing DNA polymerase activity, changing buffer composition, binding to nucleic acids, or quenching the fluorescence signal of the DNA binding dyes when using qPCR assays (Bachoon, Otero, and Hodson 2001; Hunter et al. 2019; Prosser 2002). Various methods to minimise this inhibition already exist (Castle et al. 2018; Hu et al. 2015; Schrader et al. 2012) but the choice of the method may lead to insufficient removal of inhibitors as inhibition tends to vary between substrates and inhibitory substances (Albers et al. 2013; Hu et al. 2015). For example, sample dilution, addition of Bovine Serum Albumin or physical removal of inhibitors using removal kit columns may be sufficient for substrates with low humic compounds such as airborne eDNA but significantly inefficient for substrates with highly inhibitory activity e.g., soil (Albers et al. 2013). When the target substrate has high levels of organic and inorganic matters, we recommend incorporating a washing step (i.e., with EDTA or PBS) before the lysis step as this facilitates the desorption of contaminants and improves the recovery of amplifiable DNA (Braid, Daniels, and Kitts 2003; Watson and Blackwell 2000).
Another strategy to recommend for deal with inhibition is to include an exogenous internal positive control (IPC) during PCR amplification (Hoofar et al 2004). IPCs are very efficient in qualitatively detecting the presence of inhibitory substances and identifying false negatives (Kavlick 2018). IPC amplification in the reaction is reduced or completely inhibited by the presence of inhibitors and this is a useful indicator when monitoring amplification and detection limits. Although IPC may sometimes cause spurious amplification or compete with the primary target gene for amplification primers (Hartman, Coyne, and Norwood 2005; Ni et al. 2012), it remains one of the most effective options for detecting false positive signals caused by either non-targeted exogenous or endogenous DNA sequences, or false negative signals caused by impurities that inhibit PCR.
Tip 7: Build a Custom Reference Database.
Taxonomic assignments of eDNA sequences rely heavily on the quality, completeness and comprehensiveness of the reference databases. The procedural approach after sequencing and raw data filtration is usually to compare the retrieved eDNA sequences against a reference database. This transforms the molecular operational taxonomic units into taxonomically described species for data interpretation (Dormontt et al. 2018). However, databases of vertebrates that are custom-designed for a given gene or comply with the FAIR principle (Findable, Accessible, Interoperable Reusable) are still scarce (Berry et al., 2021; van der Heyde et al., 2022; Wilkinson, 2016). For example, the cytochrome oxidase 1 (COI) gene has over 3.6 million animal sequences publicly available in GenBank while other common markers such as the 12s and 18s gene have roughly 300000 animal sequences (http://www.ncbi.nlm.nih.gov). Therefore, selecting a gene region that is not adequately represented in the database may result in the misidentification of the sequences. To increase the reliability and breadth of species detection researchers should first verify that the potential target species are represented in the reference databases (e.g., the European Molecular Biology Laboratory database (EMBL; http://www.ebi.ac.uk/embl), National Biodiversity DNA Library (NBDL; https://research.csiro.au/dnalibrary/), Barcode of Life databases (BOLD; https://boldsystems.org/) and the National Centre for Biotechnology Information database (NCBI; http://www.ncbi.nlm.nih.gov) for that locus. Alternatively, multiple genes could be used in cases where they may confer greater taxonomic coverage in genetic databases (Drummond et al. 2015). Multigene analyses can also help in reducing taxonomic bias that may exist in a single assay (Clarke et al. 2014) as well as decrease the time and cost spent for species identification (De Mattia et al. 2012).
Another way of dealing with incomplete reference databases is to build a custom local reference database (Schenekar et al. 2020). This entails collecting well-identified annotated target samples from the field or museum collections, DNA extraction, and then sequencing using either amplicon approaches or shallow shotgun sequencing. Building a custom reference database is highly recommended in cases where the taxa are substantially missing from the existing databases or when the target species may have substantial intra-specific variation. That could render taxonomic identification problematic despite the species being represented, albeit incompletely, in the database. Even though building a reference database significantly improves the taxonomic identification at species-level resolution, it can be cost-prohibitive especially when the number of samples to be analysed for building a local reference database is high. Depending on the goal of the study and the number of samples to be analysed, the researcher may consider using the Sanger sequencing approach (Sanger et al. 1977) which is relatively cheaper.
Species coverage continues to improve in reference databases due to the decreasing cost of sequencing and rapid generation of reference barcodes by international consortia such as the International Barcode of Life Consortium (iBOL; https://ibol.org/ ). Researchers should take time before using the databases to audit sequences in case there is a recent taxonomic revision or there was a human error.
Tip 8: Interpret the Sequence Read Counts Wisely.
eDNA combined with high-throughput sequencing (HTS) generates millions of sequence reads, which are then computationally turned into distinct taxonomic units (Taberlet et al., 2012). Ordinarily, these read counts are used as the default option for diagnosing occurrence (i.e., presence/absence of species) or calculating the proportion of DNA for each species as a proxy for its relative abundance in a sample or area. However, sequencing data contain many inaccuracies emanating from workflow errors, PCR primer mismatches, analytical software (see Tip 4) and/or even HTS flow cell design (Skelton et al., 2022; Thomsen & Willerslev, 2015b). This means the resultant read counts may not necessarily correlate with true species indices (Kelly et al., 2019; Singer et al., 2019).
While there is no one-size-fits-all approach when dealing with read counts, a rigorous quality control (QC) of the raw sequencing data is highly recommended before any downstream analysis. QC filter out sequencing errors, PCR artefacts, duplicated reads and sequencing adaptors (Schmieder & Edwards, 2011). During QC it is important to keep in mind that one’s minimum filtering threshold for sequence reads may discard rare sequences and obscure the detection of rare species (Deagle et al., 2018; Quéméré et al., 2013).
2. Concluding Remarks
Anthropogenic pressures are causing biodiversity loss. Their impacts on terrestrial biodiversity are predicted to increase this century (Cardinale et al., 2012; Newbold et al., 2015; Strona & Bradshaw, 2022). Data shows that the abundance of terrestrial species has fallen by at least 21% and, a conservative estimate is that 17 vertebrate species have become extinct in the last 100 years (Ceballos et al., 2020; WWF, 2020). Effective management and conservation efforts of the remaining terrestrial vertebrates are substantially reliant on our understanding of their population structure and distribution and, most importantly, on our ability to promptly detect which species are most exposed to extinction risk and where they occur (Bongaarts, 2019; Hohenlohe et al., 2021; Myers et al., 1998). Environmental DNA is an efficient, robust and scalable tool to detect and catalogue species at spatial and temporal scales (Deiner et al., 2021; Thomsen & Willerslev, 2015b). In this article, we have provided eight general tips to help terrestrial biologists and natural resource managers circumvent common errors and traps facing eDNA approaches in terrestrial vertebrate biomonitoring.
Acknowledgments
The author would like to thank all the eDNA experts that have provided valuable feedback on the previous drafts.
References
- Adams, C. I. M., Knapp, M., Gemmell, N. J., Jeunen, G., Bunce, M., Lamare, M. D., & Taylor, H. R. (2019). Beyond Biodiversity : Can Environmental DNA ( eDNA ) Cut It as a Population Genetics Tool ? Genes. [CrossRef]
- Amador, J., Milne, P. J., Moore, C. A., & Zika, R. G. (1990). Extraction of chromophoric humic substances from seawater. Marine Chemistry, 29(C), 1–17. [CrossRef]
- Andres, K. J., Lodge, D. M., Sethi, S. A., & Andrés, J. (2023). Detecting and analysing intraspecific genetic variation with eDNA : From population genetics to species abundance. April, 1–15. [CrossRef]
- Ariza, M., Fouks, B., Mauvisseau, Q., Halvorsen, R., Alsos, I. G., & de Boer, H. J. (2023). Plant biodiversity assessment through soil eDNA reflects temporal and local diversity. Methods in Ecology and Evolution, 14(2), 415–430. [CrossRef]
- Aucone, E., Kirchgeorg, S., Valentini, A., Pellissier, L., Deiner, K., & Mintchev, S. (2023). Drone-assisted collection of environmental DNA from tree branches for biodiversity monitoring. 5762(January), 1–14. [CrossRef]
- Bairoliya, S., Zhi Xiang, J. K., & Cao, B. (2022). Extracellular DNA in Environmental Samples: Occurrence, Extraction, Quantification, and Impact on Microbial Biodiversity Assessment. Applied and Environmental Microbiology, 88(3), 1–13. [CrossRef]
- Berry, O., Jarman, S., Bissett, A., Hope, M., Paeper, C., Bessey, C., Schwartz, M. K., Hale, J., & Bunce, M. (2021). Making environmental DNA ( eDNA ) biodiversity records globally accessible. July 2020, 699–705. [CrossRef]
- Bessey, C., Gao, Y., Bach, Y., Haylea, T., Jarman, S. N., & Berry, O. (2022). Comparison of materials for rapid passive collection of environmental DNA. November 2021, 2559–2572. [CrossRef]
- Bongaarts, J. (2019). IPBES, 2019. Summary for policymakers of the global assessment report on biodiversity and ecosystem services of the Intergovernmental Science-Policy Platform on Biodiversity and Ecosystem Services. In Population and Development Review (Vol. 45, Issue 3). [CrossRef]
- Boussarie, G., Bakker, J., Wangensteen, O. S., Mariani, S., Bonnin, L., Juhel, J., Kiszka, J. J., Kulbicki, M., Manel, S., Robbins, W. D., Vigliola, L., & Mouillot, D. (2018). Environmental DNA illuminates the dark diversity of sharks. May.
- Boyer, F., Mercier, C., Bonin, A., Le Bras, Y., Taberlet, P., & Coissac, E. (2016). obitools: inspired software package for DNA metabarcoding. Molecular Ecology Resources, 16(1), 176–182. [CrossRef]
- Bracken, F. S. A., Carlsson, J., Rooney, S. M., Kelly, M., & James, Q. (2019). Identifying spawning sites and other critical habitat in lotic systems using eDNA “ snapshots ”: A case study using the sea lamprey Petromyzon marinus L . November 2018, 553–567. [CrossRef]
- Brauwer, M. De, Clarke, L. J., Chariton, A., Cooper, M. K., Bruyn, M. De, Furlan, E., Macdonald, A. J., Rourke, M. L., Sherman, C. D. H., Suter, L., Rath, C. V.-, Zaiko, A., & Trujillo-, A. (2023). Best practice guidelines for environmental DNA biomonitoring in Australia and New Zealand. August 2022, 417–423. [CrossRef]
- Bruce, K., Blackman, R. C., Bourlat, S. J., Hellström, M., Bakker, J., Bista, I., Bohmann, K., Bouchez, A., Brys, R., Clark, K., & Elbrecht, V. (2021). A practical guide to DNA-based methods for biodiversity assessment.
- Cai, P., Huang, Q., & Zhang, X. (2006). Interactions of DNA with Clay Minerals and Soil Colloidal Particles and Protection against Degradation by DNase. 2971–2976.
- Callahan, B. J., McMurdie, P. J., & Holmes, S. P. (2017). Exact sequence variants should replace operational taxonomic units in marker-gene data analysis. ISME Journal, 11(12), 2639–2643. [CrossRef]
- Callahan, B. J., McMurdie, P. J., Rosen, M. J., Han, A. W., Johnson, A. J. A., & Holmes, S. P. (2016). DADA2: High-resolution sample inference from Illumina amplicon data. Nature Methods, 13(7), 581–583. [CrossRef]
- Cardinale, B. J., Duffy, J. E., Gonzalez, A., Hooper, D. U., Perrings, C., Venail, P., Narwani, A., MacE, G. M., Tilman, D., Wardle, D. A., Kinzig, A. P., Daily, G. C., Loreau, M., Grace, J. B., Larigauderie, A., Srivastava, D. S., & Naeem, S. (2012). Biodiversity loss and its impact on humanity. Nature, 486(7401), 59–67. [CrossRef]
- Ceballos, G., Ehrlich, P. R., & Raven, P. H. (2020). Vertebrates are on the brink as indicators of biological annihilation and the sixth mass extinction. 1–7. [CrossRef]
- Chiarello, M., Jackson, C. R., & Mccauley, M. (2022). Ranking the biases : The choice of OTUs vs . ASVs in 16S rRNA amplicon data analysis has stronger effects on diversity measures than rarefaction and OTU identity threshold. 1–19. [CrossRef]
- Cordier, T., Alonso-, T. C. L., Apothéloz-, S. L., Aylagas, E., Bohan, D. A., Bouchez, A., Chariton, A., Creer, S., Frühe, L., Keck, F., Keeley, N., Laroche, O., Leese, F., Pochon, X., Stoeck, T., & Pawlowski, J. (2021). Ecosystems monitoring powered by environmental genomics : A review of current strategies with an implementation roadmap. October 2019, 2937–2958. [CrossRef]
- Cristescu, M. E. (2019). Can Environmental RNA Revolutionize Biodiversity Science? Trends in Ecology and Evolution, 34(8), 694–697. [CrossRef]
- Day, K., Campbell, H., Fisher, A., Gibb, K., Hill, B., Rose, A., & Jarman, S. N. (2019). Development and validation of an environmental DNA test for the endangered Gouldian finch. Endangered Species Research, 40, 171–182. [CrossRef]
- Deagle, B. E., Thomas, A. C., McInnes, J. C., Clarke, L. J., Vesterinen, E. J., Clare, E. L., Kartzinel, T. R., & Eveson, J. P. (2018). Counting with DNA in metabarcoding studies: How should we convert sequence reads to dietary data? Molecular Ecology, 1–28. [CrossRef]
- Deiner, K., Yamanaka, H., & Bernatchez, L. (2021). The future of biodiversity monitoring and conservation utilizing environmental DNA. Environmental DNA, 3(1), 3–7. [CrossRef]
- Dibattista, J. D., Berumen, M. L., Priest, M. A., Brauwer, M. De, Coker, D. J., Hay, A., Bruss, G., Mansour, S., Bunce, M., Goatley, C. H. R., Power, M., & Marshell, A. (2022). Environmental DNA reveals a multi- taxa biogeographic break across the Arabian Sea and Sea of Oman. August 2021, 206–221. [CrossRef]
- Djurhuus, A., Port, J., Closek, C. J., Yamahara, K. M., Romero-maraccini, O., Walz, K. R., Goldsmith, D. B., Michisaki, R., Breitbart, M., Boehm, A. B., & Chavez, F. P. (2017). Evaluation of Filtration and DNA Extraction Methods for Environmental DNA Biodiversity Assessments across Multiple Trophic Levels. 4(October), 1–11. [CrossRef]
- Edgar, R. C. (2010). Search and clustering orders of magnitude faster than BLAST. 26(19), 2460–2461. [CrossRef]
- Erdozain, M., Thompson, D. G., Porter, T. M., Kidd, K. A., Kreutzweiser, D. P., Sibley, P. K., Swystun, T., Chartrand, D., & Hajibabaei, M. (2019). Metabarcoding of storage ethanol vs. conventional morphometric identification in relation to the use of stream macroinvertebrates as ecological indicators in forest management. Ecological Indicators, 101(January), 173–184. [CrossRef]
- Erickson, R. A., Merkes, C. M., & Mize, E. L. (2019). Sampling Designs for Landscape - level eDNA Monitoring Programs. Integrated Environmental Assessment and Management, 15(5), 760–771. [CrossRef]
- Ficetola, G. F., Miaud, C., Pompanon, F., & Taberlet, P. (2008). Species detection using environmental DNA from water samples. March, 423–425. [CrossRef]
- Funk, W. C. (2021). Population genomics for wildlife conservation and management. October 2020, 62–82. [CrossRef]
- Furlan, E. M., Davis, J., & Duncan, R. P. (2020). Identifying error and accurately interpreting environmental DNA metabarcoding results: A case study to detect vertebrates at arid zone waterholes. Molecular Ecology Resources, 20(5), 1259–1276. [CrossRef]
- Furlan, E. M., & Gleeson, D. (2016). A framework for estimating the sensitivity of eDNA surveys. 641–654. [CrossRef]
- Guerra-castro, E. J., Cajas, J. C., Simões, N., Cruz-motta, J. J., & Mascaró, M. (2021). SSP: an R package to estimate sampling effort in studies of ecological communities. 561–573. [CrossRef]
- Hermans, S. M., Buckley, H. L., & Lear, G. (2018). Optimal extraction methods for the simultaneous analysis of DNA from diverse organisms and sample types. Molecular Ecology Resources, 18(3), 557–569. [CrossRef]
- Hohenlohe, P. A., Funk, W. C., & Rajora, O. P. (2021). Population genomics for wildlife conservation and management. Molecular Ecology, 30(1), 62–82. [CrossRef]
- Holman, L. E., Bruyn, M. De, Creer, S., Carvalho, G., Robidart, J., & Rius, M. (2021). biogeographic patterns. Nature Ecology & Evolution, 5(June). [CrossRef]
- Holt, W. V, & Brown, J. L. (2014). Reproductive Sciences in Animal Conservation.
- Ji, Y., Ashton, L., Pedley, S. M., Edwards, D. P., Tang, Y., Nakamura, A., Kitching, R., Dolman, P. M., Woodcock, P., Edwards, F. A., Larsen, T. H., Hsu, W. W., Benedick, S., Hamer, K. C., Wilcove, D. S., Bruce, C., Wang, X., Levi, T., Lott, M., … Yu, D. W. (2013). Reliable, verifiable and efficient monitoring of biodiversity via metabarcoding. Ecology Letters, 16(10), 1245–1257. [CrossRef]
- Joos, L., Beirinckx, S., Haegeman, A., Debode, J., Vandecasteele, B., Baeyen, S., Goormachtig, S., Clement, L., & Tender, C. De. (2020). Daring to be differential : metabarcoding analysis of soil and plant-related microbial communities using amplicon sequence variants and operational taxonomical units. 1–17.
- Kelly, R. P., Shelton, A. O., & Gallego, R. (2019). Understanding PCR Processes to Draw Meaningful Conclusions from Environmental DNA Studies. 1–14. [CrossRef]
- Klymus, K. E., Richter, C. A., Chapman, D. C., & Paukert, C. (2015). Quantification of eDNA shedding rates from invasive bighead carp Hypophthalmichthys nobilis and silver carp Hypophthalmichthys molitrix q. Biological Conservation, 183, 77–84. [CrossRef]
- Klymus, K. E., Ruiz Ramos, D. V., Thompson, N. L., & Richter, C. A. (2020). Development and Testing of Species-specific Quantitative PCR Assays for Environmental DNA Applications. Journal of Visualized Experiments, 165, 1–25. [CrossRef]
- Kozich, J. J., Westcott, S. L., Baxter, N. T., Highlander, S. K., & Schloss, P. D. (2013). Development of a dual-index sequencing strategy and curation pipeline for analyzing amplicon sequence data on the miseq illumina sequencing platform. Applied and Environmental Microbiology, 79(17), 5112–5120. [CrossRef]
- Koziol, A., Stat, M., Simpson, T., Jarman, S., DiBattista, J. D., Harvey, E. S., Marnane, M., McDonald, J., & Bunce, M. (2019). Environmental DNA metabarcoding studies are critically affected by substrate selection. Molecular Ecology Resources, 19(2), 366–376. [CrossRef]
- Kwok, M., Wong, S., Nakao, M., & Hyodo, S. (2020). Field application of an improved protocol for environmental DNA extraction , purification , and measurement using Sterivex filter. Scientific Reports, 0123456789, 1–13. [CrossRef]
- Kyle, K. E., Allen, M. C., Dragon, J., Bunnell, J. F., Reinert, H. K., Zappalorti, R., Jaffe, B. D., Angle, J. C., & Lockwood, J. L. (2022). Combining surface and soil environmental DNA with artificial cover objects to improve terrestrial reptile survey detection. Conservation Biology, 36(6), 1–9. [CrossRef]
- Leempoel, K., Hebert, T., & Hadly, E. A. (2020). A comparison of eDNA to camera trapping for assessment of terrestrial mammal diversity. Proceedings of the Royal Society B: Biological Sciences, 287(1918). [CrossRef]
- Levy-booth, D. J., Campbell, R. G., Gulden, R. H., Hart, M. M., Powell, R., Klironomos, J. N., Pauls, K. P., Swanton, C. J., Trevors, J. T., & Dunfield, K. E. (2007). Cycling of extracellular DNA in the soil environment. 39, 2977–2991. [CrossRef]
- Macé, B., Hocdé, R., Marques, V., Guerin, E., Valentini, A., Arnal, V., Pellissier, L., & Manel, S. (2022). Evaluating bioinformatics pipelines for population- level inference using environmental DNA. November 2021, 674–686. [CrossRef]
- Machado, W., Franchini, J. C., de Fátima Guimarães, M., & Filho, J. T. (2020). Spectroscopic characterization of humic and fulvic acids in soil aggregates, Brazil. Heliyon, 6(6). [CrossRef]
- Maruyama, A., Nakamura, K., Yamanaka, H., & Kondoh, M. (2014). The Release Rate of Environmental DNA from Juvenile and Adult Fish. 1–13. [CrossRef]
- Matthias, L., Allison, M. J., Maslovat, C. Y., Hobbs, J., & Helbing, C. C. (2021). Improving ecological surveys for the detection of cryptic , fossorial snakes using eDNA on and under artificial cover objects. Ecological Indicators, 131, 108187. [CrossRef]
- Morita, H., & Akao, Is. (2021). The effect of soil sample size , for practical DNA extraction , on soil microbial diversity in different taxonomic ranks. 1–15. [CrossRef]
- Myers, N., Mittermeier, R. A., Mittermeier, C. G., Fonseca, G. A. B. da, & Kent, J. (1998). A critically endangered new species of nectophrynoides (anura: Bufonidae) from the kihansi gorge, udzungwa mountains, tanzania. African Journal of Herpetology, 47(2), 59–67. [CrossRef]
- Nascimento, F. J. A., Lallias, D., Bik, H. M., & Creer, S. (2018). Sample size effects on the assessment of eukaryotic diversity and community structure in aquatic sediments using high-throughput sequencing. Scientific Reports, 8(1), 1–12. [CrossRef]
- Navajas, M., Lagnel, J., Fauvel, G., & De Moraes, G. (1999). Sequence variation of ribosomal Internal Transcribed Spacers (ITS) in commercially important Phytoseiidae mites. Experimental and Applied Acarology, 23(11), 851–859. [CrossRef]
- Nearing, J. T., Douglas, G. M., Comeau, A. M., & Langille, M. G. I. (2018). Denoising the Denoisers : an independent evaluation of microbiome sequence error- correction approaches. 1–22. [CrossRef]
- Neice, A. A., & McRae, S. B. (2021). An eDNA diagnostic test to detect a rare, secretive marsh bird. Global Ecology and Conservation, 27, e01529. [CrossRef]
- Newbold, T., Bennett, D. J., Choimes, A., Collen, B., Day, J., Palma, A. De, Dı, S., Edgar, M. J., Feldman, A., Garon, M., Harrison, M. L. K., Alhusseini, T., Echeverria-london, S., Ingram, D. J., Itescu, Y., Kattge, J., Kemp, V., Kirkpatrick, L., Kleyer, M., … Mace, G. M. (2015). Global effects of land use on local terrestrial biodiversity. [CrossRef]
- Nichols, R. V., Cromsigt, J. P. G. M., & Spong, G. (2015). DNA left on browsed twigs uncovers bite-scale resource use patterns in European ungulates. Oecologia, 178(1), 275–284. [CrossRef]
- Ogram, A., Sayler, S., & Barkay, T. (1987). The extraction and purification of microbial D N A from sediments. 7, 57–66.
- Pilliod, D., CARENS.GOLDBERG, R. A., & WAITS, L. P. (2014). Factors influencing detection of eDNA from a stream-dwelling amphibian. 109–116. [CrossRef]
- Quéméré, E., Hibert, F., Miquel, C., Lhuillier, E., Rasolondraibe, E., Champeau, J., Rabarivola, C., Nusbaumer, L., Chatelain, C., Gautier, L., Ranirison, P., Crouau-Roy, B., Taberlet, P., & Chikhi, L. (2013). A DNA Metabarcoding Study of a Primate Dietary Diversity and Plasticity across Its Entire Fragmented Range. PLoS ONE, 8(3). [CrossRef]
- Rojahn, J., Gleeson, D. M., Bylemans, J., & Haeusler, T. (2021). Improving the detection of rare native fish species in environmental DNA metabarcoding surveys. October 2020, 990–997. [CrossRef]
- Romanowski, G., Lorenz, M. G., & Wackernagel, W. (1991). Adsorption of plasmid DNA to mineral surfaces and protection against DNase I. Applied and Environmental Microbiology, 57(4), 1057–1061. [CrossRef]
- Rourke, M. L., Fowler, A. M., Hughes, J. M., Broadhurst, M. K., Dibattista, J. D., Fielder, S., Wilkes, J., & Elise, W. (2022). Environmental DNA ( eDNA ) as a tool for assessing fish biomass : A review of approaches and future considerations for resource surveys. January 2021, 9–33. [CrossRef]
- Ruiz-, D. V, Meyer, R. S., Toews, D., Stephens, M., Kolster, M. K., & Sexton, J. P. (2023). Environmental DNA ( eDNA ) detects temporal and habitat effects on community composition and endangered species in ephemeral ecosystems : A case study in vernal pools. June 2022, 85–101. [CrossRef]
- Sato, H., Sogo, Y., Doi, H., & Yamanaka, H. (2017). Usefulness and limitations of sample pooling for environmental DNA metabarcoding of freshwater fish communities. Scientific Reports, May, 1–12. [CrossRef]
- Schloss, P. D., & Westcott, S. L. (2011). Assessing and Improving Methods Used in Operational Taxonomic Unit-Based Approaches for 16S rRNA Gene Sequence Analysis ᰔ †. 77(10), 3219–3226. [CrossRef]
- Schloss, P. D., Westcott, S. L., Ryabin, T., Hall, J. R., Hartmann, M., Hollister, E. B., Lesniewski, R. A., Oakley, B. B., Parks, D. H., Robinson, C. J., Sahl, J. W., Stres, B., Thallinger, G. G., Van Horn, D. J., & Weber, C. F. (2009). Introducing mothur: Open-source, platform-independent, community-supported software for describing and comparing microbial communities. Applied and Environmental Microbiology, 75(23), 7537–7541. [CrossRef]
- Schmieder, R., & Edwards, R. (2011). Quality control and preprocessing of metagenomic datasets. Bioinformatics, 27(6), 863–864. [CrossRef]
- Sepulveda, A. J., Chokhachy, R. Al, Schabacker, J., Smith, S., Luikart, G., & Amish, S. J. (2019). Improved detection of rare , endangered and invasive trout in using a new large - volume sampling method for eDNA capture. May, 227–237. [CrossRef]
- Sepulveda, A. J., Hutchins, P. R., Forstchen, M., Mckeefry†, M. N., & Swigris, and A. M. (2020). The Elephant in the Lab (and Field): Contamination in Aquatic Environmental DNA Studies. Frontiers in Ecology and Evolution, 8(December), 1–12. [CrossRef]
- Serrao, N. R., Weckworth, J. K., Mckelvey, K. S., & Dysthe, J. C. (2021). Molecular genetic analysis of air , water , and soil to detect big brown bats in North America Molecular genetic analysis of air , water , and soil to detect big brown bats in North America. Biological Conservation, 261(September), 109252. [CrossRef]
- Sigsgaard, E. E., Jensen, M. R., Winkelmann, I. E., Møller, P. R., Hansen, M. M., & Thomsen, P. F. (2020). Population-level inferences from environmental DNA—Current status and future perspectives. Evolutionary Applications, 13(2), 245–262. [CrossRef]
- Singer, G. A. C., Fahner, N. A., Barnes, J. G., Mccarthy, A., & Hajibabaei, M. (2019). Comprehensive biodiversity analysis via ultra-deep patterned flow cell technology : a case study of eDNA metabarcoding seawater. Scientific Reports, April, 1–12. [CrossRef]
- Skelton, J., Cauvin, A., & Hunter, M. E. (2022). Environmental DNA metabarcoding read numbers and their variability predict species abundance, but weakly in non-dominant species. Environmental DNA, August, 1–13. [CrossRef]
- Spear, M. J., Embke, H. S., Krysan, P. J., & Vander, M. J. (2021). Application of eDNA as a tool for assessing fish population abundance. March 2020, 83–91. [CrossRef]
- Spear, M. J., Embke, H. S., Krysan, P. J., & Vander Zanden, M. J. (2021). Application of eDNA as a tool for assessing fish population abundance. Environmental DNA, 3(1), 83–91. [CrossRef]
- Stat, M., Huggett, M. J., Bernasconi, R., Dibattista, J. D., Newman, S. J., Harvey, E. S., Bunce, M., & Tina, E. (2017). Ecosystem biomonitoring with eDNA : metabarcoding across the tree of life in a tropical marine environment. Scientific Reports, September, 1–11. [CrossRef]
- Stewart, K. A. (2019). Understanding the effects of biotic and abiotic factors on sources of aquatic environmental DNA. Biodiversity and Conservation, 28(5), 983–1001. [CrossRef]
- Strona, G., & Bradshaw, C. J. A. (2022). Coextinctions dominate future vertebrate losses from climate and land use change. 4345.
- Suarez-bregua, P., Miguel, A., Parsons, K. M., Rotllant, J., Pierce, G. J., Saavedra, C., Robinson, C. V., & Doyle, J. (2022). Environmental DNA ( eDNA ) for monitoring marine mammals : Challenges and opportunities. September, 1–9. [CrossRef]
- Taberlet, P., Bonin, A., Zinger, L., & Coissac, E. (2018). Environmental DNA: For biodiversity research and monitoring. Environmental DNA: For Biodiversity Research and Monitoring, 1–253. [CrossRef]
- Taberlet, P., COISSAC, E., HAJIBABAEI, M., & RIESEBERG, L. H. (2012). Environmental DNA. Molecular Ecology, 21(22), R1250–R1252. [CrossRef]
- Thakur, I. S., & Roy, D. (2020). Environmental DNA and RNA as Records of Human Exposome , Including Biotic / Abiotic Exposures and Its Implications in the Assessment of the Role of Environment in Chronic Diseases.
- Thomas, A. C., Howard, J., Nguyen, P. L., Seimon, T. A., & Goldberg, C. S. (2018). ANDeTM: A fully integrated environmental DNA sampling system. Methods in Ecology and Evolution, 9(6), 1379–1385. [CrossRef]
- Thomsen, P. F., & Willerslev, E. (2015a). Environmental DNA - An emerging tool in conservation for monitoring past and present biodiversity. Biological Conservation, 183, 4–18. [CrossRef]
- Thomsen, P. F., & Willerslev, E. (2015b). Environmental DNA - An emerging tool in conservation for monitoring past and present biodiversity. Biological Conservation, 183, 4–18. [CrossRef]
- Thomsen, P. F., & Willerslev, E. (2015c). Environmental DNA – An emerging tool in conservation for monitoring past and present biodiversity. Biological Conservation, 183, 4–18. [CrossRef]
- Tsuji, S., Takahara, T., Doi, H., Shibata, N., & Yamanaka, H. (2019). The detection of aquatic macroorganisms using environmental DNA analysis—A review of methods for collection, extraction, and detection. Environmental DNA, 1(2), 99–108. [CrossRef]
- van der Heyde, M., Bunce, M., & Nevill, P. (2022). Key factors to consider in the use of environmental DNA metabarcoding to monitor terrestrial ecological restoration. Science of the Total Environment, 848(July), 157617. [CrossRef]
- van der Heyde, M., Bunce, M., Wardell-Johnson, G., Fernandes, K., White, N. E., & Nevill, P. (2020). Testing multiple substrates for terrestrial biodiversity monitoring using environmental DNA metabarcoding. Molecular Ecology Resources, 20(3), 732–745. [CrossRef]
- Vestheim, H., & Jarman, S. N. (2008). Blocking primers to enhance PCR amplification of rare sequences in mixed samples - a case study on prey DNA in Antarctic krill stomachs. Frontiers in Zoology, 5, 12. [CrossRef]
- Wainer, R., Ridgway, H., Jones, E., Peltzer, D., & Dickie, I. (2020). Consequences of environmental DNA pooling. 1–11.
- Wilcox, T. M., McKelvey, K. S., Young, M. K., Jane, S. F., Lowe, W. H., Whiteley, A. R., & Schwartz, M. K. (2013). Robust Detection of Rare Species Using Environmental DNA: The Importance of Primer Specificity. PLoS ONE, 8(3). [CrossRef]
- Wilkinson, M. D. (2016). Comment : The FAIR Guiding Principles for scienti fi c data management and stewardship. 1–9. [CrossRef]
- Williams, K. E., Huyvaert, K. P., Vercauteren, K. C., Davis, A. J., & Piaggio, A. J. (2018). Detection and persistence of environmental DNA from an invasive, terrestrial mammal. Ecology and Evolution, 8(1), 688–695. [CrossRef]
- WWF. (2020). Living Planet Report 2020 - Bending the curve of biodiversity loss. In Wwf.
- Xu, B., Zeng, X. M., Gao, X. F., Jin, D. P., & Zhang, L. B. (2017). ITS non-concerted evolution and rampant hybridization in the legume genus Lespedeza (Fabaceae). Scientific Reports, 7(January), 1–15. [CrossRef]
- Yates, M. C., Derry, A. M., & Cristescu, M. E. (2021). Environmental RNA: A Revolution in Ecological Resolution? Trends in Ecology and Evolution, 36(7), 601–609. [CrossRef]
- Yoccoz, N. G., Bråthen, K. A., Gielly, L., Haile, J., Edwards, M. E., Goslar, T., Von Stedingk, H., Brysting, A. K., Coissac, E., Pompanon, F., Sonstebo, J. H., Miquel, C., Valentini, A., De Bello, F., Chave, J., Thuiller, W., Wincker, P., Cruaud, C., Gavory, F., … Taberlet, P. (2012). DNA from soil mirrors plant taxonomic and growth form diversity. Molecular Ecology, 21(15), 3647–3655. [CrossRef]
- Zafeiropoulos, H., Viet, H. Q., Vasileiadou, K., Potirakis, A., Arvanitidis, C., Topalis, P., Pavloudi, C., & Pafilis, E. (2020). PEMA: A flexible Pipeline for Environmental DNA Metabarcoding Analysis of the 16S/18S ribosomal RNA, ITS, and COI marker genes. GigaScience, 9(3), 1–12. [CrossRef]
- Zhang, S., Zheng, Y., Zhan, A., Dong, C., Zhao, J., & Yao, M. (2022). Environmental DNA captures native and non-native fish community variations across the lentic and lotic systems of a megacity. 0097(February), 1–14.
Figure 1.
Conceptual workflow showing eDNA steps and corresponding tip(s) for terrestrial vertebrate research.
Figure 1.
Conceptual workflow showing eDNA steps and corresponding tip(s) for terrestrial vertebrate research.
Disclaimer/Publisher’s Note: The statements, opinions and data contained in all publications are solely those of the individual author(s) and contributor(s) and not of MDPI and/or the editor(s). MDPI and/or the editor(s) disclaim responsibility for any injury to people or property resulting from any ideas, methods, instructions or products referred to in the content. |
© 2025 by the authors. Licensee MDPI, Basel, Switzerland. This article is an open access article distributed under the terms and conditions of the Creative Commons Attribution (CC BY) license (http://creativecommons.org/licenses/by/4.0/).
Copyright: This open access article is published under a Creative Commons CC BY 4.0 license, which permit the free download, distribution, and reuse, provided that the author and preprint are cited in any reuse.


