
Submitted:
28 February 2025
Posted:
28 February 2025
You are already at the latest version
Abstract
This study presents a novel biosensor for non-invasive glucose detection in saliva, using sol colloids with erbium phthalocyanine and polyvinyl acetate particles. Erbium phthalocyanine, a green, fluorescent pigment synthesized with a solar reactor, was characterized using various techniques, confirming its successful preparation. Thin films of erbium phthalocyanine in polyvinyl acetate colloids were deposited on glass substrates to manufacture the sensors. These films were characterized by ultraviolet-visible spectroscopy, revealing distinctive absorption bands. The biosensors effectively detected glucose in saliva from individuals with different health conditions. The study demonstrates the potential of these biosensors as practical and non-invasive tools for glucose monitoring, contributing to non-invasive diabetes monitoring technologies. The findings suggest that organic semiconductors, particularly erbium phthalocyanine, are significant in biosensor development, promising improved early detection and management of diabetes.
Keywords:
diabetes
; non-invasive glucose monitoring
; sol colloids of erbium phthalocyanine
; biosensors
; organic semiconductors
1. Introduction
Since the first diabetes detection in an individual was carried out by Thomas Cawley in 1788 [1] until today, glucose measurement has mainly relied on blood analysis [2,3,4]. A momentous milestone in the clinical diagnostic landscape was marked with the manufacture of the first glucometer by Anton H. Clemens in 1970 [5] due to its significant role in managing diabetes. Diabetes, a chronic condition of high entity, arises when the pancreas fails to secrete enough insulin to regulate blood glucose levels [6]. The disease can lead to long-term damage in the body involving organs such as the eyes, kidneys, nervous system, and heart.
On the other hand, in a global context, the burden of this disease affects a considerable number of individuals [7] amounting, by the year 2017 to 415 million people. In this figure, 90% corresponds to the type II diabetes variant [8]. Current projections establish that almost a third of the world population could suffer from diabetes by the year 2050 [9]. Moreover, according to the "2019 Global Burden of Disease Study", the number of individuals with diabetes worldwide increased from 108 million in 1980 to 422 million in 2017 [10], representing an increase of 292%. Currently, diabetes continues to prevail as a challenge of global magnitude in the field of public health.
On the other hand, the predominant tool in approaching this problem is the point-of-care glucometer, which provides accurate blood glucose measurements [11]. In general, the operation principle of glucometers is based on blood readings obtained from a small blood sample, taken from fingers. Another technique to quantify glucose involves performing a blood test in a laboratory setting [8]. More recently, non-invasive techniques have emerged to detect glucose levels from biological fluids other than blood.; particularly, saliva which contains a panoply of essential components [11], glucose being one of them. Glucose levels present in saliva can fluctuate depending on nutrition and individual dietary patterns [12]. Furthermore, the glycemic content of saliva may also be susceptible to variations depending on the age and gender of the individual [13]. According to various studies, glycemic figures in saliva fluctuate in a range between 0.1 and 8.5 mmol/L [14]. The highest rates are detected in those on carbohydrate-rich diets. Given its potential, salivary glucose levels have been outlined as indicators for non-invasive diabetes monitoring, demonstrating their ability to predict blood glucose levels [15,16,17].
To develop investigations into glucose monitoring in saliva, using a diverse range of compounds and materials, is essential. In this regard, organic semiconductors as electronic components designed to detect or measure a physical or chemical property of an organic compound [18] play a leading role in this process. These semiconductors find application in a wide range of fields ranging from air [19,20] and water quality monitoring to detecting contaminants in soil [19,20], among others. These technological innovations have empowered researchers to conceive various sensor devices, ranging from electrochemical-based gaseous sensors to capacitance-based liquid sensors [21].
Erbium phthalocyanine (ErPc) belongs to the family of organic semiconductors with a green, fluorescent pigmentation commonly used in dyes [22]. The physical properties that characterize ErPc include its high affinity for oxygen, spin orientation, high thermal stability, and oxidation resistance [23]. As a result of these chemical, optical, and photochemical virtues, ErPc has been used in sensors [24], optical devices [25], and catalysts [26].
On the other hand, polyvinyl acetate (PVAc) is a synthetic thermoplastic polymer derived from vinyl acetate and polyvinyl chloride that has become a central material. PVAc has been presented as an ideal option in various industrial applications. Its heat resistance, high solubility in different materials, and light stability make it a material of choice for the manufacturing of adhesives, coatings, films, tapes, and other substrates.
Nevertheless, polyvinyl acetate (PVAc) is a thermoplastic synthetic polymer derived from vinyl acetate and polyvinyl chloride that has emerged as a central material in this context. PVAc has been presented as an ideal choice in various industrial applications [24]. It is characterized by its high chemical stability, flexibility, resistance to wear and abrasion, as well as its ability to form thin and transparent films. These qualities make PVA a material of choice for the manufacturing of adhesives, coatings, films, tapes, and other substrates. [24]. Gurol et al. in their research [27] report the use of PVAc with phthalocyanine because of their antibacterial properties and mention that the choice of polyvinyl acetate to create composites with phthalocyanines is based on its ability to form stable mixtures during its simple processing [28].
This research focuses on producing a biosensor using sol colloids composed of erbium phthalocyanine (ErPc) particles dispersed in polyvinyl acetate (PVAc) capable of detecting the presence of glucose in saliva. We investigated two types of biosensors to optimize their resolution and detection capacity. To accomplish this task, various strategies were undertaken to materialize a device capable of detecting glucose levels in patients with the minimum possible invasion. The results obtained from the optical and morphological characterizations of the biosensors indicate the significant influence that PVAc and ErPc have on glucose measurements in saliva. These findings highlight the importance of the composition and structure of the biosensors in their ability to accurately detect and measure glucose levels in biological samples, which could have significant implications in the development of non-invasive and precise monitoring technologies for diabetes control.
2. Materials and Methods
For the synthesis of ErPc powder, a novel approach employing a solar reactor prototype was undertaken [17]. The precursor materials mentioned subsequently were mixed thoroughly in an agate mortar, ensuring a uniform mixture. The precursor compounds, along with their respective quantities encompassed, are 2 g of 1,2-dicyanobenzene (C6H4(CN)2), 1.8 g of erbium acetate (Er(OOCCH3)), 0.5 g of urea (H2NCONH2) as the nitrogen source, and 100 µL of 1,8-diazabicyclo(5.4.0) undeca-7-ene ≥ 98.0 % (C5H10NCNC4H6) commonly known as DBU, a catalyst for the macrocycle formation. The homogenized solid mixture was introduced into a 100 mL round-bottom flask, supplemented with 100 µL of DBU. Subsequently, the flask was positioned within a Fresnel lens solar reactor under an inert atmosphere to increase the temperature to 180 °C for 5 and a half minutes. Post-reaction cooling followed by a Soxhlet extraction purification process with various solvents, completed the removal of all soluble impurities. The resultant ErPc powder was analyzed using the established analytical methodologies such as FT-IR, UV-Vis spectroscopy, and Fast Atom Bombardment (FAB) mass spectrometry.
The preparation of the first heterostructure, c-Si/ErPc, was carried out using the ultrasonic spray pyrolysis (USP) technique, with a liquid dispersion of ErPc-MeOH obtained with 2 mg of ErPc powder combined with 20 mL of methanol (CH3OH). The deposition process was completed after 6.0 minutes and the substrate, placed on a hot plate, reached a 68.0 °C temperature. For the preparation of the sol colloids with erbium phthalocyanine (PVAc-ErPc), it is necessary to make first a dispersion of MeOH-ErPc mixing 10 mg of ErPc and 100 mL of CH3OH with an ultrasonic bath for 10 minutes until a homogeneous mixture is obtained. Then 5 mL of this MeOH-ErPc dispersion are mixed with 1 mL of PVAc, and 5 mL of deionized water until a homogeneous mixture free of lumps is obtained.
Two types of mixtures with PVAc-ErPc were used to obtain the biosensor. The first solution is PVAc-ErPc without any modification, and the second is PVAc-ErPc mixed with 1 mL of the MeOH-ErPc dispersion. The two mixtures are deposited on glass substrates with the following dimensions: 0.5 cm long X 0.5 cm wide X 1.2 mm thick. The drip technique was employed with 150 µL of solution per deposit. To expedite the evaporation of the solution, a hot plate at 45°C was utilized for 20 minutes (see Table 1).
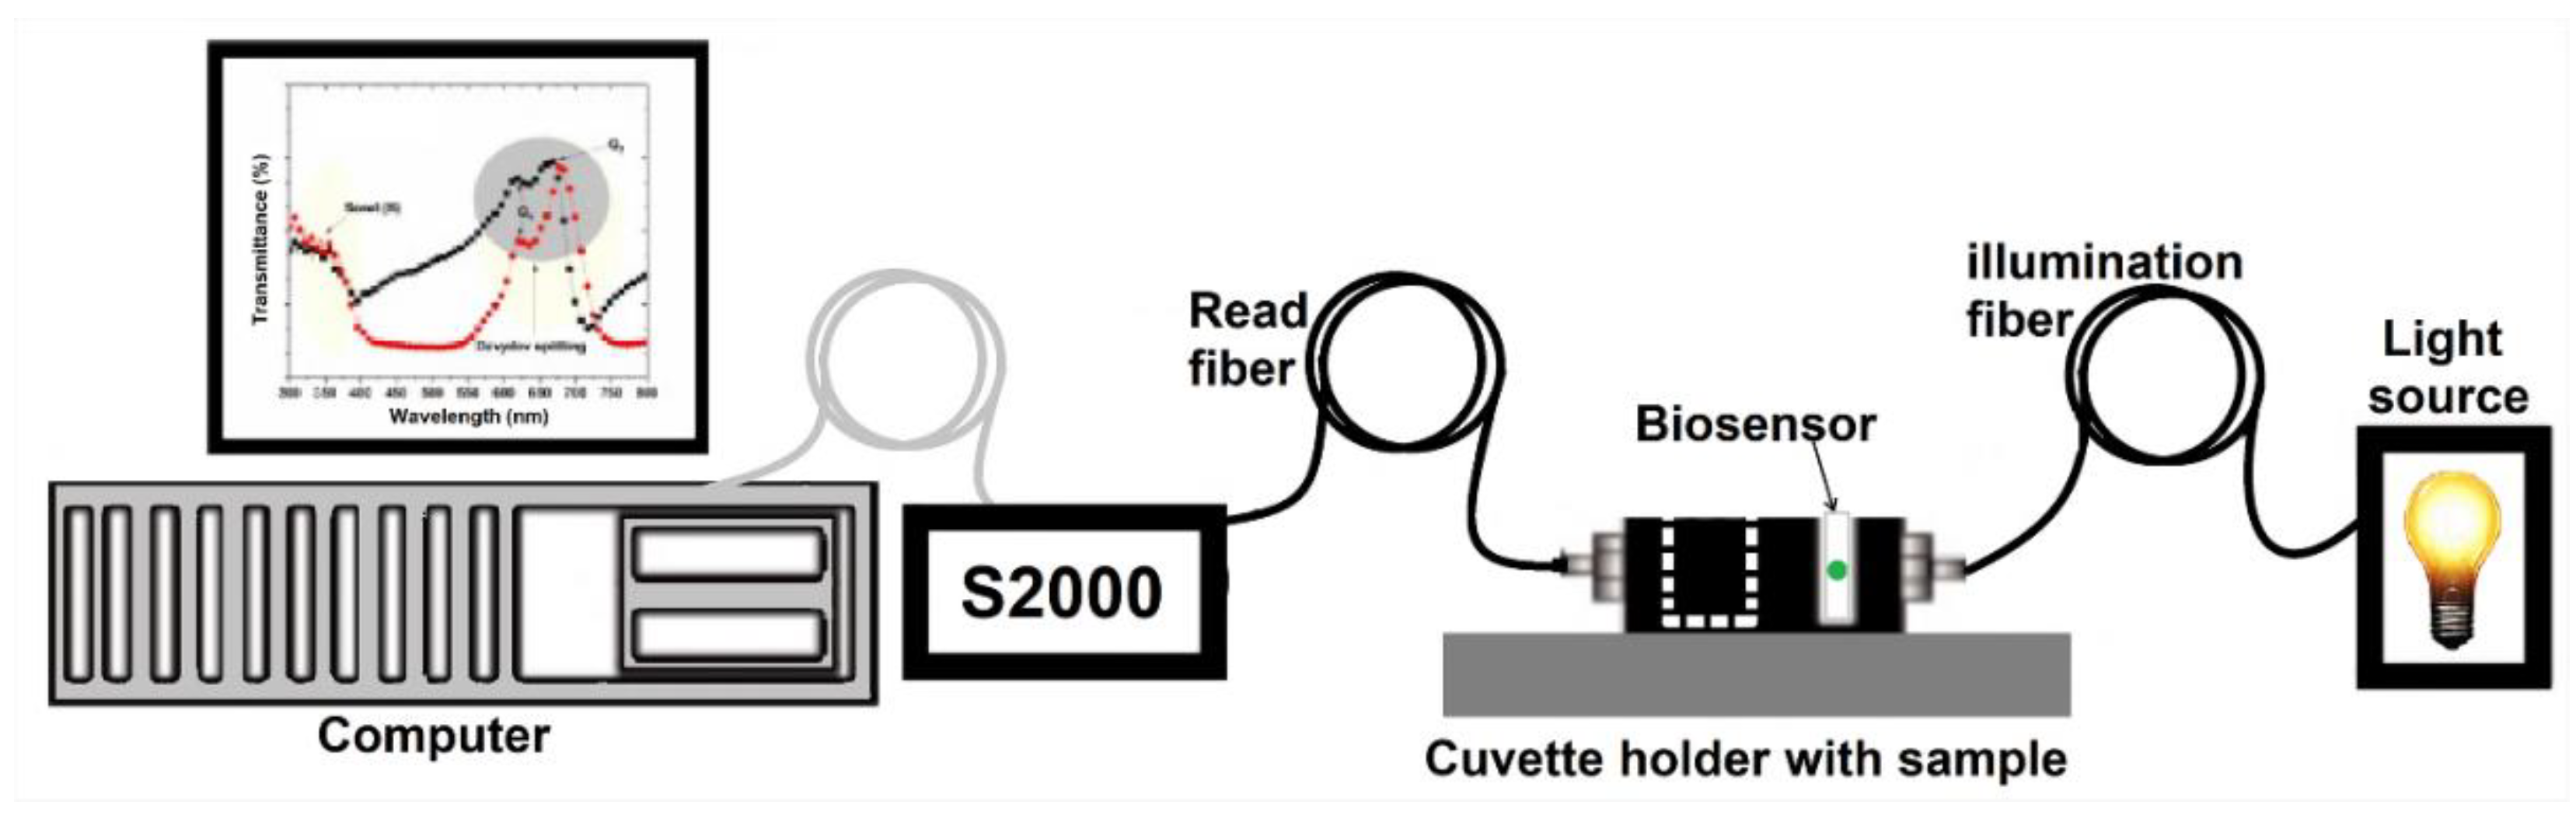
Mass spectrometry analysis of the ErPc powder was performed using a JEOL-JMS-700 M station in the FAB+ ion mode with a dual-focus magnetic sensor. The c-Si/ErPc and biosensor samples were characterized by Field Emission Scanning Electron Microscopy (FE-SEM) using a FEI-SCIOS Dual Beam equipment operated at 10 kV to observe the morphology of the ErPc. Absorption spectra of the c-Si/ErPc and biosensor samples at room temperature were measured using a Cary 5000 UV-vis-NIR system (Agilent Technologies Inc., Santa Clara, CA, USA). The spectra were recorded from 200 to 800 nm with a resolution of 1 nm. Finally, a fiber-coupled optical setup in transmission configuration was used to characterize the biosensor samples with glucose in saliva. Light from a wideband source from 400 to 800 nm was used to characterize the light spectrum profile from the samples by using a transmission spectrometer (Ocean Optics s2000) with a V-groove optical system that allows placing the sample between the input and the output fibers. The obtained transmission spectra profile data are recorded by a computer (See Figure 1).
Before commencing the saliva glucose test, the subjects were briefed on the procedure and requested to sign the informed consent. There are three test subjects (2 males and 1 female).
The process of carrying out the characterization of glucose in saliva followed several steps (see scheme 1). The biosensor test began at 1:00 p.m. and ended at 1:45 p.m. since a gap of 5 minutes was left between each measurement. The three patients for the biosensor test were chosen considering their lifestyles and medical conditions. Patient 1 is a regular person who drinks soda daily, has a high carbohydrate diet, does little exercise per week, and does not have diabetes. Patient 2 has prediabetes, is undergoing medical treatment, has a high carbohydrate diet, and exercises thrice a week. Patient 3 is an athlete (cyclist) with a diet rich in protein and low in carbohydrates, he exercises daily and is in excellent health.
3. Results and Discussion
The new synthesis protocol to obtain erbium phthalocyanine using a solar reactor was developed successfully as confirmed by the results using the standard analytical techniques for phthalocyanine compounds. In Figure 2, the mass spectroscopy plot, a SEM micrograph, and the UV-Vis and FTIR spectra that confirm the molecular structure of the ErPc product are shown. In Figure 2a), the mass spectrometry analysis reveals the presence of the molecular ion (679 m/z) corresponding to ErPc [22,23]. In parallel, Figure 2b) shows the scanning electron microscopy (SEM) micrograph where the morphology of the thin film derived from the ErPc powder can be observed. Within this micrographic representation, the formation of tiny nanospheres characterized by dimensions ranging between 69 and 306 nm is evident. Agglomerations can be observed in this micrograph, and they are attributed to the deposition mechanism by ultrasonic spray pyrolysis (USP). Figure 2c) presents the absorption spectrum of the ErPc deposited as a thin film on a glass substrate. The spectrum shows the Soret band (B) in a wavelength range of 339 to 391 nm and the Q band between 550 and 750 nm which are the characteristic absorption in the UV.Vis range for a phthalocyanine molecule. The resulting Q band corresponds to π-π* transitions [25,28,29,30]. This band occasionally undergoes a subdivision identified as Davydov splitting, producing in this case two maxima located at 608–639 nm (Q1), and 654–677 nm (Q2) [31,32]. Figure 2d) displays the Fourier Transform Infrared (FT-IR) spectrum of ErPc. FT-IR spectrum absorption bands associated with phthalocyanine macrocycles are readily evident and span the spectral range from 400 to 1800 cm-1. These characteristic peaks, presented in Figure 2d) effectively constitute the infrared fingerprint of phthalocyanines, offering different markers for its identification [33]. The peaks near 400-600 cm-1 are attributed to out-of-plane C-C-C bending vibrations and the peaks in the range of 700-735 cm-1 correspond to the out-of-plane C-H vibration modes. Other spectral zones, spanning 750-1040 cm-1correspond to the bending modes of the outer C-H plane, while the band at 1050-1080 cm-1 is attributed to the bending C-H plane vibration. The C=C–N group vibration, associated with pyrrole fragments and interatomic nitrogen appears as a low intensity band at 1396–1407 cm-1 [34]. Furthermore, discernible bands emerge at 1300-1350 cm-1 and 1400-1500 cm-1 which are attributed to stretching vibrations of the isoindole segment, including pyrrole and benzene residues [35].
Once the characterization of the phthalocyanine material was confirmed we proceeded to obtain the absorption spectra of the materials required to prepare the active layer of the sensor. Figure 3a) shows the absorption spectrum of PVA deposited on a glass substrate. The spectrum obtained corresponds to that of PVA [36]. The origins of PVA, synthesized through the polymerization of vinyl acetate, give it its capacity as a vinyl adhesive. Furthermore, its transparency, depending on the thickness of the material, is manifested in the spectrum by an effectively imperceptible degree of absorption. Figure 3b shows the spectra of the two different biosensors on glass substrates (glass/PVAc-ErPc and glass/PVAc-ErPc + 1 ml of MeOH-ErPc). These spectra exhibit the characteristic Q bands in the 600 to 700 nm range and the B bands in the 277 nm range. The bands in the biosensor are similar to those shown in Figure 2c, corresponding to the ErPc film. Surprisingly, the Q1 band experiences an attenuation due to the influence of PVA. BS-1 shows a decreased absorption level compared to its counterpart, BS-2, due to the higher concentration of erbium phthalocyanine from the methanol solution in the BS-2 sample (+1,0 ml de MeOH-ErPc).
Regarding the characterization of the two biosensors obtained, their SEM micrographs are presented in Figure 4. Figure 4a and Figure 4b correspond to theBS-1 (PVAc-ErPc) structure. In Figure 4a, the appearance of different bright regions due to the presence of ErPc can be observed, while the dark areas are attributed to PVAc. Additionally, circular ErPc clusters in thin films become evident. Figure 4b provides a magnification of the central region of the structure, revealing the most pronounced agglomeration and underlining the formation of flake-like structures resulting from the ErPc agglomeration. Furthermore, due to the use of PVAc to make the composite film a better compaction is observed. This feature solves a recurring challenge in phthalocyanine thin films: their adhesion to substrates after their deposition in powder form on substrates.
Figure 4c and Figure 4d the SEM micrographs associated with the BS-2 biosensor (PVAc-ErPc + 1.0 mL MeOH-ErPc) are shown. In Figure 4 c, an increase in the ErPc concentration is evident and this is a direct result of the higher proportion of ErPc from the methanol solution (1.0 mL MeOH-ErPc) added to the film. In addition, Figure 4d reveals a magnified perspective of one of the conglomerates identified in the micrograph of Figure 4cshowing a morphology and compression similar to that observed in the case of BS-1. Within this film, a reduction in the number of clusters and a broader distribution of ErPc within the PVAc matrix is observed.
As described in the materials and methods sections, the methodology employed for saliva glucose characterizations is outlined, and the ensuing results are presented below. The transmission characterization for biosensor BS-1, obtained by UV-Vis spectroscopy from 400 to 850 nm, is shown in Figure 5. The steps to carry out this characterization in a regular person are as follows: Step 1: a glucose measurement was taken using a glucometer, resulting in a reading of 101.0 mg/dL. Step 2, a characterization was performed on the UV-Vis equipment of BS-1, which will serve as a reference. Step 3, characterization of glucose in saliva using BS-1. In step 4, the person was given 335 ml of soda with a sugar concentration of 35.5 grams. Step 5: After waiting 20 minutes, the person was given 100 ml of purified water to remove soda residues from their mouth. Step 6, blood glucose was characterized using a glucometer, resulting in a reading of 108.0 mg/dL. Finally, in Step 7, a new BS-1 characterization of glucose in saliva was performed. Figure 5a shows the transmission spectra of the regular person from BS-1 before and after soda intake. Figure 5b and Figure 5c show the results obtained for an athlete and a prediabetic person using the BS-1 biosensor. The same procedure was completed for the prediabetic person, with blood glucose measurements of 128 mg/dL and 148 mg/dL before and after 20 minutes of soda intake, respectively, and finally, for the athlete, with measurements of 81 mg/dL and 114 mg/dL. As observed in the case of BS-1, the optical spectra show an increase in the transmitted signal from the baseline saliva state to the saliva measurement when soda is ingested. Additionally, different amplitude levels are observed for each case study (regular persona, athlete, and prediabetic person).
In order to characterize the transmition spectra amplitude variation with the blood glucose measurement (related to the process with the body glucose synthesis), the relative transmission was obtained as the ratio between the initial spectrum measurement for saliva and the saliva measurement twenty minutes before soda ingestion, for each study case, as it is shown in Figure 6a. The results were obtained in a wavelength range of 450 to 850 nm, with significant amplitude variations. It can be noticed that the relative transmission for a regular person exhibits a low increase, lower than the observed for an athlete. Finally, the ratio drastically increases for a prediabetic person compared to the other two cases.
From the results obtained, it can be inferred that a healthy person with a diet that regularly includes sugars and carbohydrates can synthesize glucose quickly, and therefore the relative transmittance is low. In the case of the athlete, regulating the diet with a reduction in carbohydrates and sugars makes glucose synthesis slower compared to the average healthy person. However, the favorable reaction corresponds to a low relative transmittance change. Finally, in the case of a prediabetic person, the synthesis capacity of glucose is highly inhibited, so the relative transmittance observed through the BS-1 biosensor is shown to be significantly high. Figure 6b shows the relation between the relative transmission observed in saliva with the biosensor BS-1 and the blood glucose measurement with the commercial glucometer before and after soda ingestion. The average relative transmission for each case was obtained in the appropriate wavelength range. The blood glucose difference () was calculated for each case as the difference between the glucose measurement after and before the soda ingestion. Linear dependence of as a function of the average relative transmission () measured was used for BS-1 with sensitivity of 12.091 [mg/dL]/ Tavg.u., and .
In the same manner, the characterization of biosensor BS-2 was carried out. Figure 7a, Figure 7b, and Figure 7c show the transmitted signal for regular, athlete, and prediabetic persons, respectively, measured before and after soda ingestion. Contrary to what was observed with BS-1, in the case of the biosensor BS-2, the amplitude of the spectra decreases for the measurements after the soda ingestion. The spectrum amplitude for measurements before and after soda ingestion is similar for regular people. The decrease is relatively low for the athlete compared to that of the prediabetic person.
The relative transmission allows to determine the transmission level comparison for each study case, as it is shown in Figure 8a. The results for BS-2 exhibit a decreasing of relative transmission when the person is less able to synthesize glucose. Although for a regular person the relative transmission seems to be non-conclusive, the average transmission is in a range near to the unit, which corroborates rapidly glucose synthesis in a regular person, as it is depicted in the as a function of shown in Figure 8b. The dependence of was linearly fitted with a low sensitivity slope of -0.0207 [mg/dL]/ Tavg.u., and .
From the obtained results it can be observed that the BS-1 bio sensor has higher sensitivity to saliva glucose than BS-2. Moreover, the behavior of the sensitivity slope is contrary in BS-2 compared with BS-1. As can be observed from Figure 3b, for a PVAc-ErPC film, the absorbance is highly increased when a dopant of 1 mL of MeOH is included, also modifying the optical transmission characteristics of the biosensor. In this regard, we attribute the low sensitivity and slope change in BS-2 to the dopant concertation in the film deposition. As a result, more attractive results in saliva glucose estimation were obtained with the biosensor BS-1, where the minimum absorbance peak was observed.
4. Conclusions
A high-purity erbium phthalocyanine (ErPc) powder suitable for an optical biosensor was obtained using the novel synthetic protocol as evidenced by the standard characterization analysis of phthalocyanine materials. They show corresponding absorption bands in the UV-Vis and FT-IR spectra, and the characteristic mass spectrometry peaks of the ErPc.
The combination of PVAc and the MeOH solution with ErPc has a strong influence on the characteristic bands of ErPc. The SEM micrographs reveal the structural morphology of ErPc in the biosensors making more apparent the effects of the ErPc concentration in the thin film depending on the deposition processes. The morphological insights shown in these micrographs give an insight of the effect of the amount of ErPc in the compression and density of the films and this can help to optimize de performance of the biosensor.
Finally, transmission spectra captured at different stages of glucose measurements in saliva compared to a conventional blood glucose measurement device demonstrate the biosensors' sensitivity to individuals' varying glucose levels. This research contributes to a broader understanding of organic materials such as phthalocyanines for use as biosensors and promises advances in non-invasive glucose monitoring technologies.
Author Contributions
DHCG carried out the experimental setup, characterization and wrote the manuscript. JMLQ, RDM, AGR, and JLSS read, and approved the final manuscript.
Funding
This research received no external funding
Institutional Review Board Statement
The procedures performed in this study involving human participants were in accordance with the ethical standards of the institutional research committee and with the 1964 Helsinki declaration and its later amendments or comparable ethical standards. Informed consent was obtained from all individual participants, include in the study. The study was conducted in accordance with the Declaration of Helsinki, and the protocol was approved by the Ethics committee of Instituto Tecnológico Superior Progreso. Written informed consent by the patients was waived due to a retrospective nature of our study (April 12th, 2023).
Informed Consent Statement
Informed consent was obtained from all subjects involved in the study. Written informed consent has been obtained from the patient(s) to publish this paper.
Acknowledgments
The authors thank CONAHCYT for its financial support through the researchers for Mexico program with number 700475.
Conflicts of Interest
The authors declare no conflicts of interest
Abbreviations
| ErPc | Erbium phthalocyanine |
| PVAc | polyvinyl acetate |
| DBU | 1,8-diazabicyclo(5.4.0) undeca-7-ene ≥ 98.0 % (C5H10NCNC4H6) |
| FAB | Fast Atom Bombardment |
| USP | ultrasonic spray pyrolysis |
| MeOH | Methanol |
| FE-SEM | Field Emission Scanning Electron Microscopy |
| average relative transmission | |
| blood glucose difference |
References
- Porta, M. Diabetes in Ancient Times: The Long and Winding Road to Insulin, 2020, p. 1–13. [CrossRef]
- Fiedorova, K.; Augustynek, M.; Kubicek, J.; et al. Review of present method of glucose from human blood and body fluids assessment. Biosens Bioelectron 2022, 211, 114348. [Google Scholar] [CrossRef]
- Chang, T.; Li, H.; Zhang, N.; et al. Highly integrated watch for noninvasive continual glucose monitoring. Microsyst Nanoeng 2022, 8, 25. [Google Scholar] [CrossRef] [PubMed]
- Zafar, H.; Channa, A.; Jeoti, V.; et al. Comprehensive Review on Wearable Sweat-Glucose Sensors for Continuous Glucose Monitoring. Sensors 2022, 22, 638. [Google Scholar] [CrossRef] [PubMed]
- Prerna, P.; Tripathy, S.S. Glucometer: A Survey, 2020, p. 463–71. [CrossRef]
- Peschke, E. Melatonin, endocrine pancreas and diabetes. J Pineal Res 2007, 0, 071115084913002. [Google Scholar] [CrossRef]
- Chatterjee, S.; Khunti, K.; Davies, M.J. Type 2 diabetes. The Lancet 2017, 389, 2239–2251. [Google Scholar] [CrossRef]
- Zhang, X.; Huang, X.; Wang, Z.; et al. Bioinspired nanozyme enabling glucometer readout for portable monitoring of pesticide under resource-scarce environments. Chemical Engineering Journal 2022, 429, 132243. [Google Scholar] [CrossRef]
- Albala, C. EL ENVEJECIMIENTO DE LA POBLACIÓN CHILENA Y LOS DESAFÍOS PARA LA SALUD Y EL BIENESTAR DE LAS PERSONAS MAYORES. Revista Médica Clínica Las Condes 2020, 31, 7–12. [Google Scholar] [CrossRef]
- Murray, C.J.L.; Aravkin, A.Y.; Aboyans, V.; et al. Global burden of 87 risk factors in 204 countries and territories, 1990–2019: a systematic analysis for the Global Burden of Disease Study 2019. The Lancet 2020, 396, 1223–1249. [Google Scholar] [CrossRef]
- Pham, M.; Underwood, J.; Oliva Chávez, A.S. Changing the Recipe: Pathogen Directed Changes in Tick Saliva Components. Int J Environ Res Public Health 2021, 18, 1806. [Google Scholar] [CrossRef]
- Goh, A.T.; Yao, J.; Chua, X.H.; et al. Associations between oral processing, saliva, and bolus properties on daily glucose excursions amongst people at risk of type-2 diabetes. Food Funct 2023, 14, 2260–2269. [Google Scholar] [CrossRef]
- Teruya, T.; Goga, H.; Yanagida, M. Human age-declined saliva metabolic markers determined by LC–MS. Sci Rep 2021, 11, 18135. [Google Scholar] [CrossRef] [PubMed]
- Deshpande, A.D.; Harris-Hayes, M.; Schootman, M. Epidemiology of Diabetes and Diabetes-Related Complications. Phys Ther 2008, 88, 1254–1264. [Google Scholar] [CrossRef] [PubMed]
- Wang, D.; Zheng, C.; Li, Y.; et al. Sensitive non-invasive electrochemical sensing of glucose in saliva using amorphous SnOx decorated one-dimensional CuO nanorods rich in oxygen vacancy defects. Appl Surf Sci 2022, 592, 153349. [Google Scholar] [CrossRef]
- Lin, M.-H.; Gupta, S.; Chang, C.; et al. Carbon nanotubes/polyethylenimine/glucose oxidase as a non-invasive electrochemical biosensor performs high sensitivity for detecting glucose in saliva. Microchemical Journal 2022, 180, 107547. [Google Scholar] [CrossRef]
- Arakawa, T.; Tomoto, K.; Nitta, H.; et al. A Wearable Cellulose Acetate-Coated Mouthguard Biosensor for In Vivo Salivary Glucose Measurement. Anal Chem 2020, 92, 12201–12207. [Google Scholar] [CrossRef]
- Scaccabarozzi, A.D.; Basu, A.; Aniés, F.; et al. Doping Approaches for Organic Semiconductors. Chem Rev 2022, 122, 4420–4492. [Google Scholar] [CrossRef]
- Yang, B.; Lu, Y.; Jiang, D.; et al. Bioinspired Multifunctional Organic Transistors Based on Natural Chlorophyll/Organic Semiconductors. Advanced Materials 2020, 32, 2001227. [Google Scholar] [CrossRef]
- Mariani, F.; Gualandi, I.; Tonelli, D.; et al. Design of an electrochemically gated organic semiconductor for pH sensing. Electrochem Commun 2020, 116, 106763. [Google Scholar] [CrossRef]
- Chang, W.-L.; Sun, I.-M.; Tsai, J.-A.; et al. Rapid quality test for drinking water by vertical-channel organic semiconductor gas sensor. Anal Chim Acta 2022, 1206, 339729. [Google Scholar] [CrossRef]
- Garzon-Roman, A.; Cuate-Gomez, D.H.; Zuñiga-Islas, C.; et al. Erbium phthalocyanine on porous silicon: Morphological, optical, and electrical characterization, for its possible application as a photodetector. Sens Actuators A Phys 2020, 315, 112309. [Google Scholar] [CrossRef]
- Cuate-Gomez, D.H.; Garzon-Roman, A.; Sosa-Sánchez, J.L.; et al. Polycrystalline Erbium Phthalocyanine Thin Films Deposited on Silicon and Porous Silicon by Ultrasonic Spray Pyrolysis: Optical, Morphological, and Electrical Characterizations. J Electron Mater 2021, 50, 6951–6963. [Google Scholar] [CrossRef]
- Kolter, K.; Dashevsky, A.; Irfan, M.; et al. Polyvinyl acetate-based film coatings. Int J Pharm 2013, 457, 470–479. [Google Scholar] [CrossRef]
- Hauffe, K.; Ionescu, N.I.; Meyer-Laack, A.; et al. Electrophotographic Properties of Copper Phthalocyanine-Zinc Oxide Systems. In: Berg WF, Hauffe K, editors. Current problems in electrophotography, Berlin, Boston: De Gruyter; 1972, p. 271–86. [CrossRef]
- Zhao, J.; Lyu, H.; Wang, Z.; et al. Phthalocyanine and porphyrin catalysts for electrocatalytic reduction of carbon dioxide: Progress in regulation strategies and applications. Sep Purif Technol 2023, 312, 123404. [Google Scholar] [CrossRef]
- Gurol, I.; Altinkok, C.; Agel, E.; et al. Phthalocyanine functionalized poly(vinyl alcohol)s via CuAAC click chemistry and their antibacterial properties. J Coat Technol Res 2020, 17, 1587–1596. [Google Scholar] [CrossRef]
- Prabakaran, R.; Fortunato, E.; Martins, R.; et al. Fabrication and characterization of hybrid solar cells based on copper phthalocyanine/porous silicon. J Non Cryst Solids 2008, 354, 2892–2896. [Google Scholar] [CrossRef]
- Neamtu, M.; Nadejde, C.; Brinza, L.; et al. Iron phthalocyanine-sensitized magnetic catalysts for BPA photodegradation. Sci Rep 2020, 10, 5376. [Google Scholar] [CrossRef] [PubMed]
- Mei, L.; Cui, X.; Wei, J.; et al. Metal phthalocyanine-based conjugated microporous polymer/carbon nanotube composites as flexible electrodes for supercapacitors. Dyes and Pigments 2021, 190, 109299. [Google Scholar] [CrossRef]
- Müller, H.; Eckhardt, C.J. Observation of Davydov splitting in PTS polydiacetylene crystal spectra. J Chem Phys 1977, 67, 5386–5387. [Google Scholar] [CrossRef]
- Kim, K.; Lee, J.-U.; Nam, D.; et al. Davydov Splitting and Excitonic Resonance Effects in Raman Spectra of Few-Layer MoSe 2. ACS Nano 2016, 10, 8113–8120. [Google Scholar] [CrossRef]
- Ramírez-Hernández, A.; Aguilar-Flores, C.; Aparicio-Saguilán, A. Fingerprint analysis of FTIR spectra of polymers containing vinyl acetate. Dyna (Medellin) 2019, 86, 198–205. [Google Scholar] [CrossRef]
- Liu, Z.; Zhang, X.; Zhang, Y.; et al. Theoretical investigation of the molecular, electronic structures and vibrational spectra of a series of first transition metal phthalocyanines. Spectrochim Acta A Mol Biomol Spectrosc 2007, 67, 1232–1246. [Google Scholar] [CrossRef] [PubMed]
- Fujisawa, J. Definitive assignment and mechanistic study of interfacial charge-transfer transitions between ZnO and benzenethiol. Chem Phys Lett 2021, 778, 138774. [Google Scholar] [CrossRef]
- LSheqnab, M.; S Alnayli, R. Effect Of Cdte Nanoparticles On Linear And Nonlinear Optical Property Of Polyvinyl Alcohols PVA Film. JOURNAL OF COLLEGE OF EDUCATION FOR PURE SCIENCE 2019, 9, 259–268. [Google Scholar] [CrossRef]
Figure 1.
Scheme for the absorbance/transmission spectra measurement.
Scheme 1.
Characterization procedure of glucose in saliva.
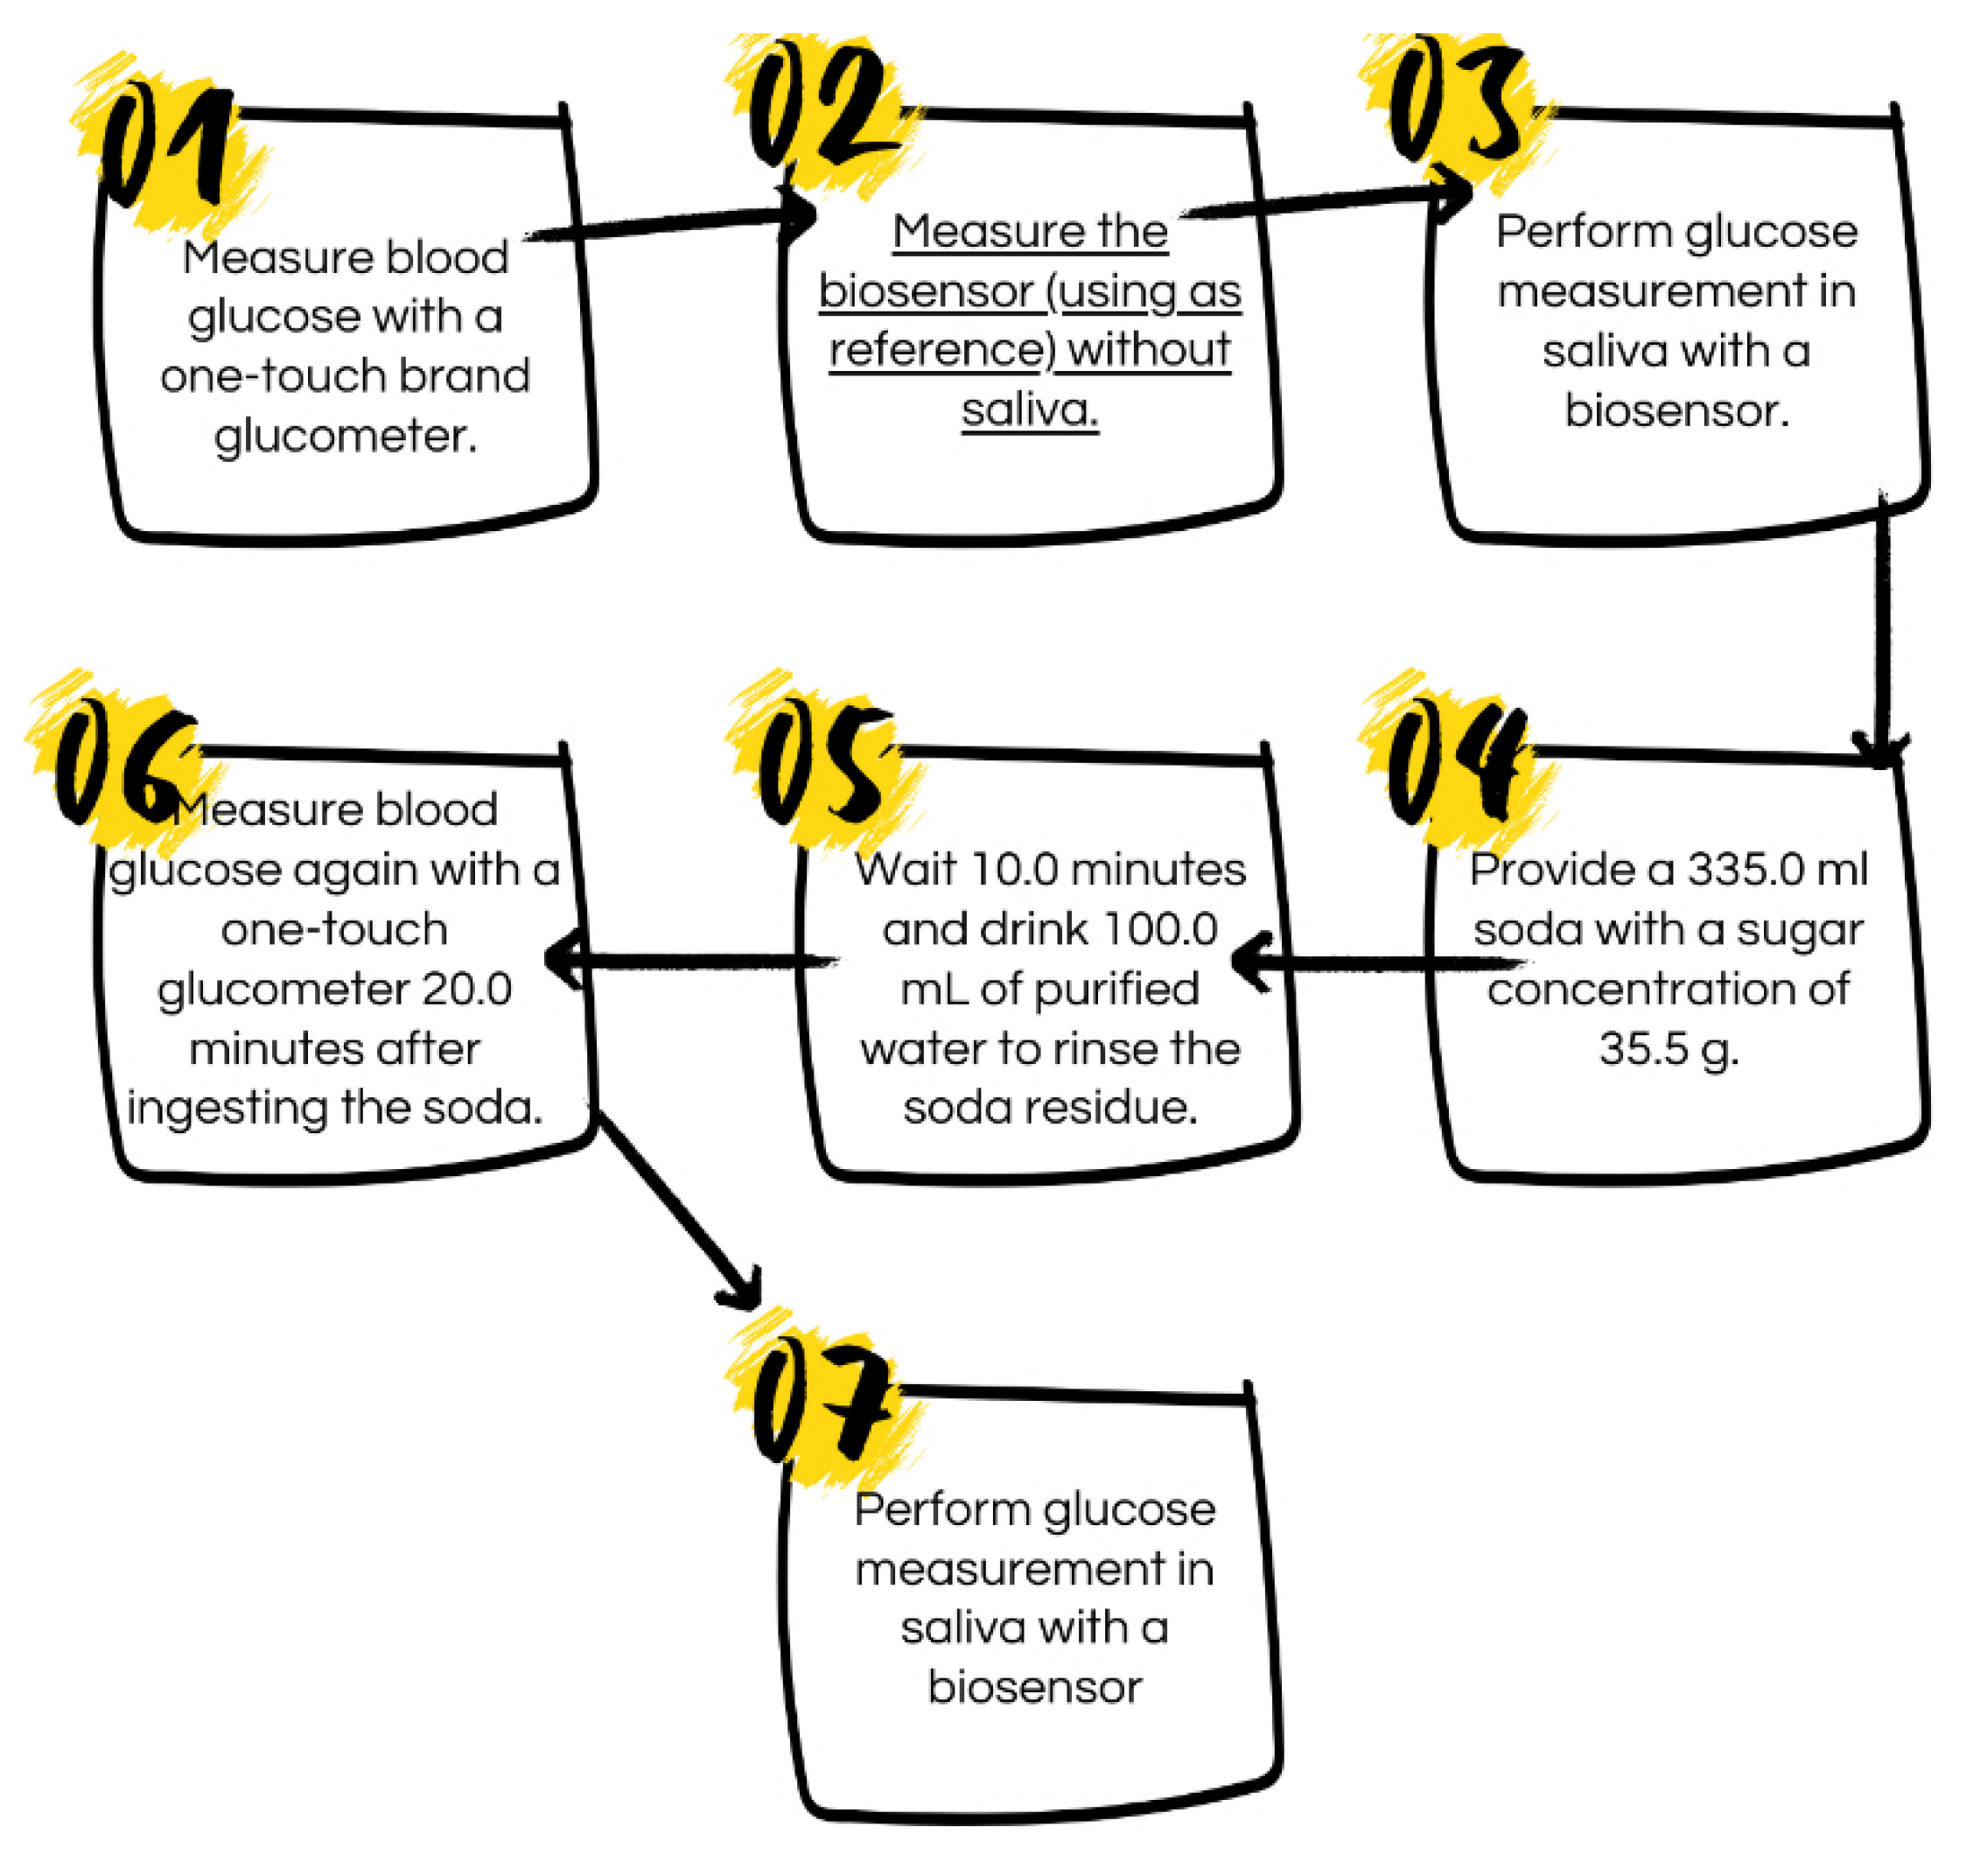
Figure 2.
a) Mass spectrum of ErPc Powder, b) SEM micrograph of c-Si/ErPc, c) absorption spectra of c-Si/ErPc, and d) FT-IR spectra of c-Si/ErPc.
Figure 2.
a) Mass spectrum of ErPc Powder, b) SEM micrograph of c-Si/ErPc, c) absorption spectra of c-Si/ErPc, and d) FT-IR spectra of c-Si/ErPc.
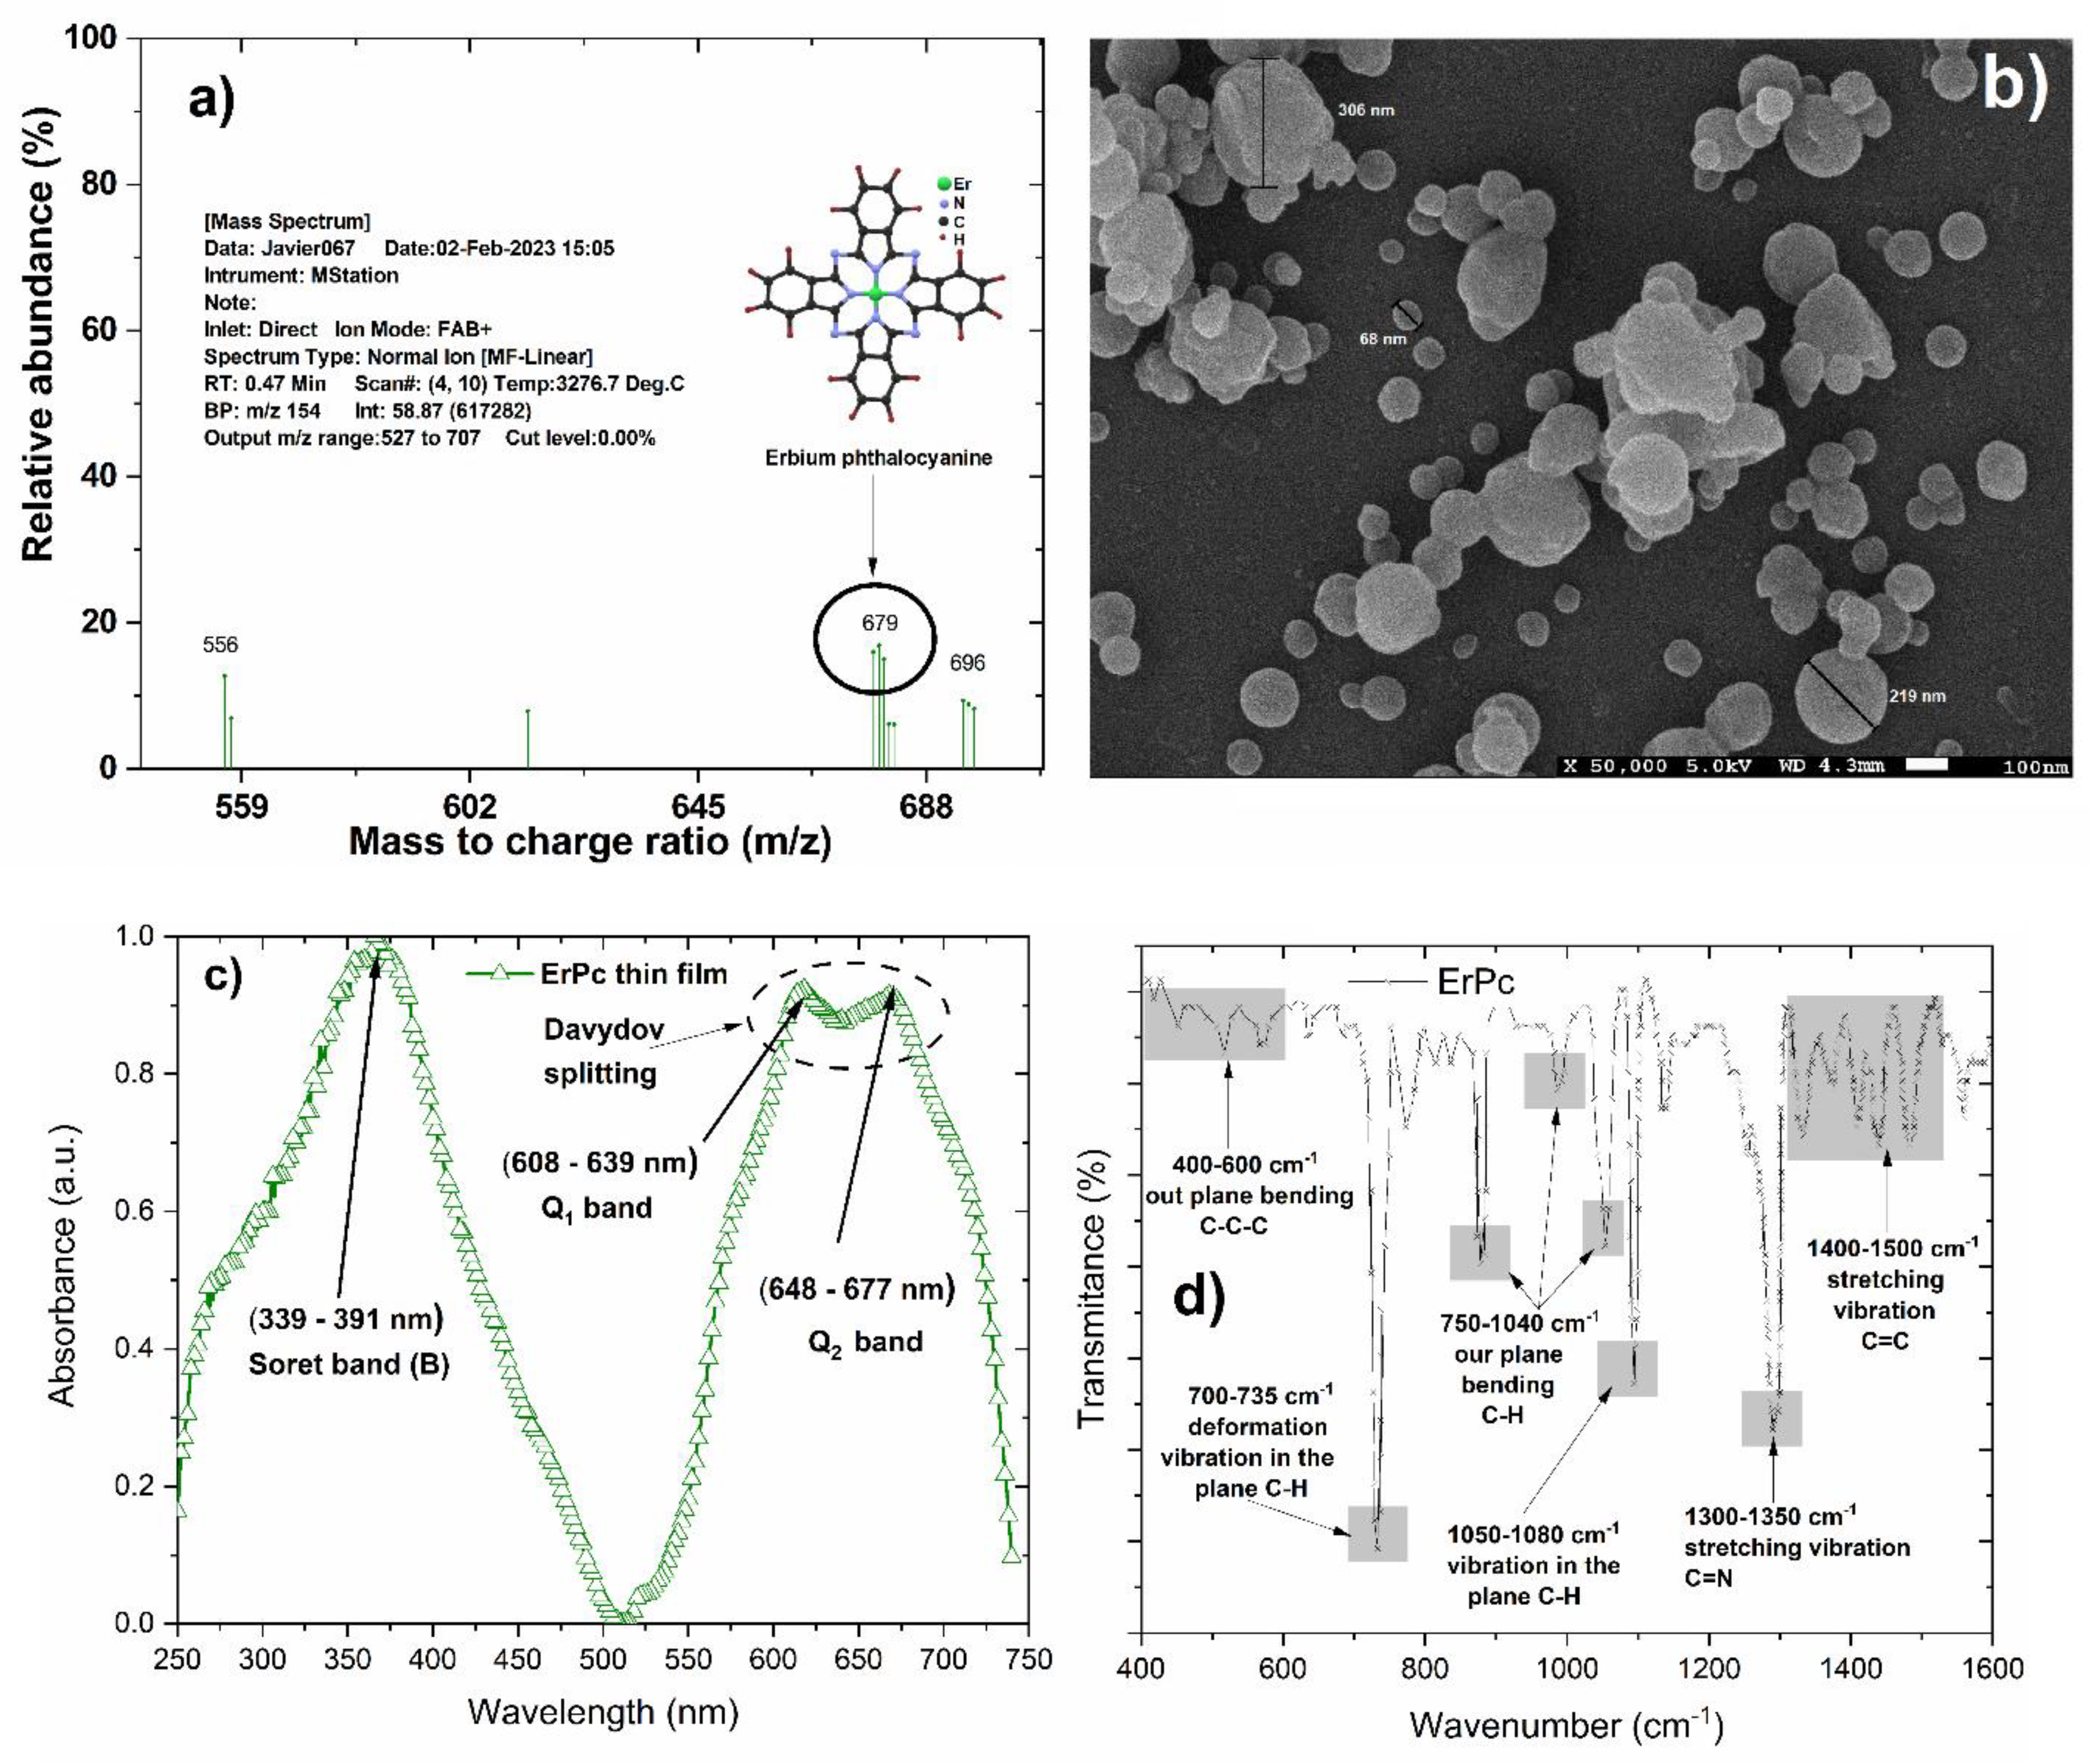
Figure 3.
Absorption spectra of a) polyvinyl acetate (PVAc) b) PVAc-ErPc (BS-1), and PVAc-ErPc + 1 mL MeOH-ErPc (BS-2 T).
Figure 3.
Absorption spectra of a) polyvinyl acetate (PVAc) b) PVAc-ErPc (BS-1), and PVAc-ErPc + 1 mL MeOH-ErPc (BS-2 T).
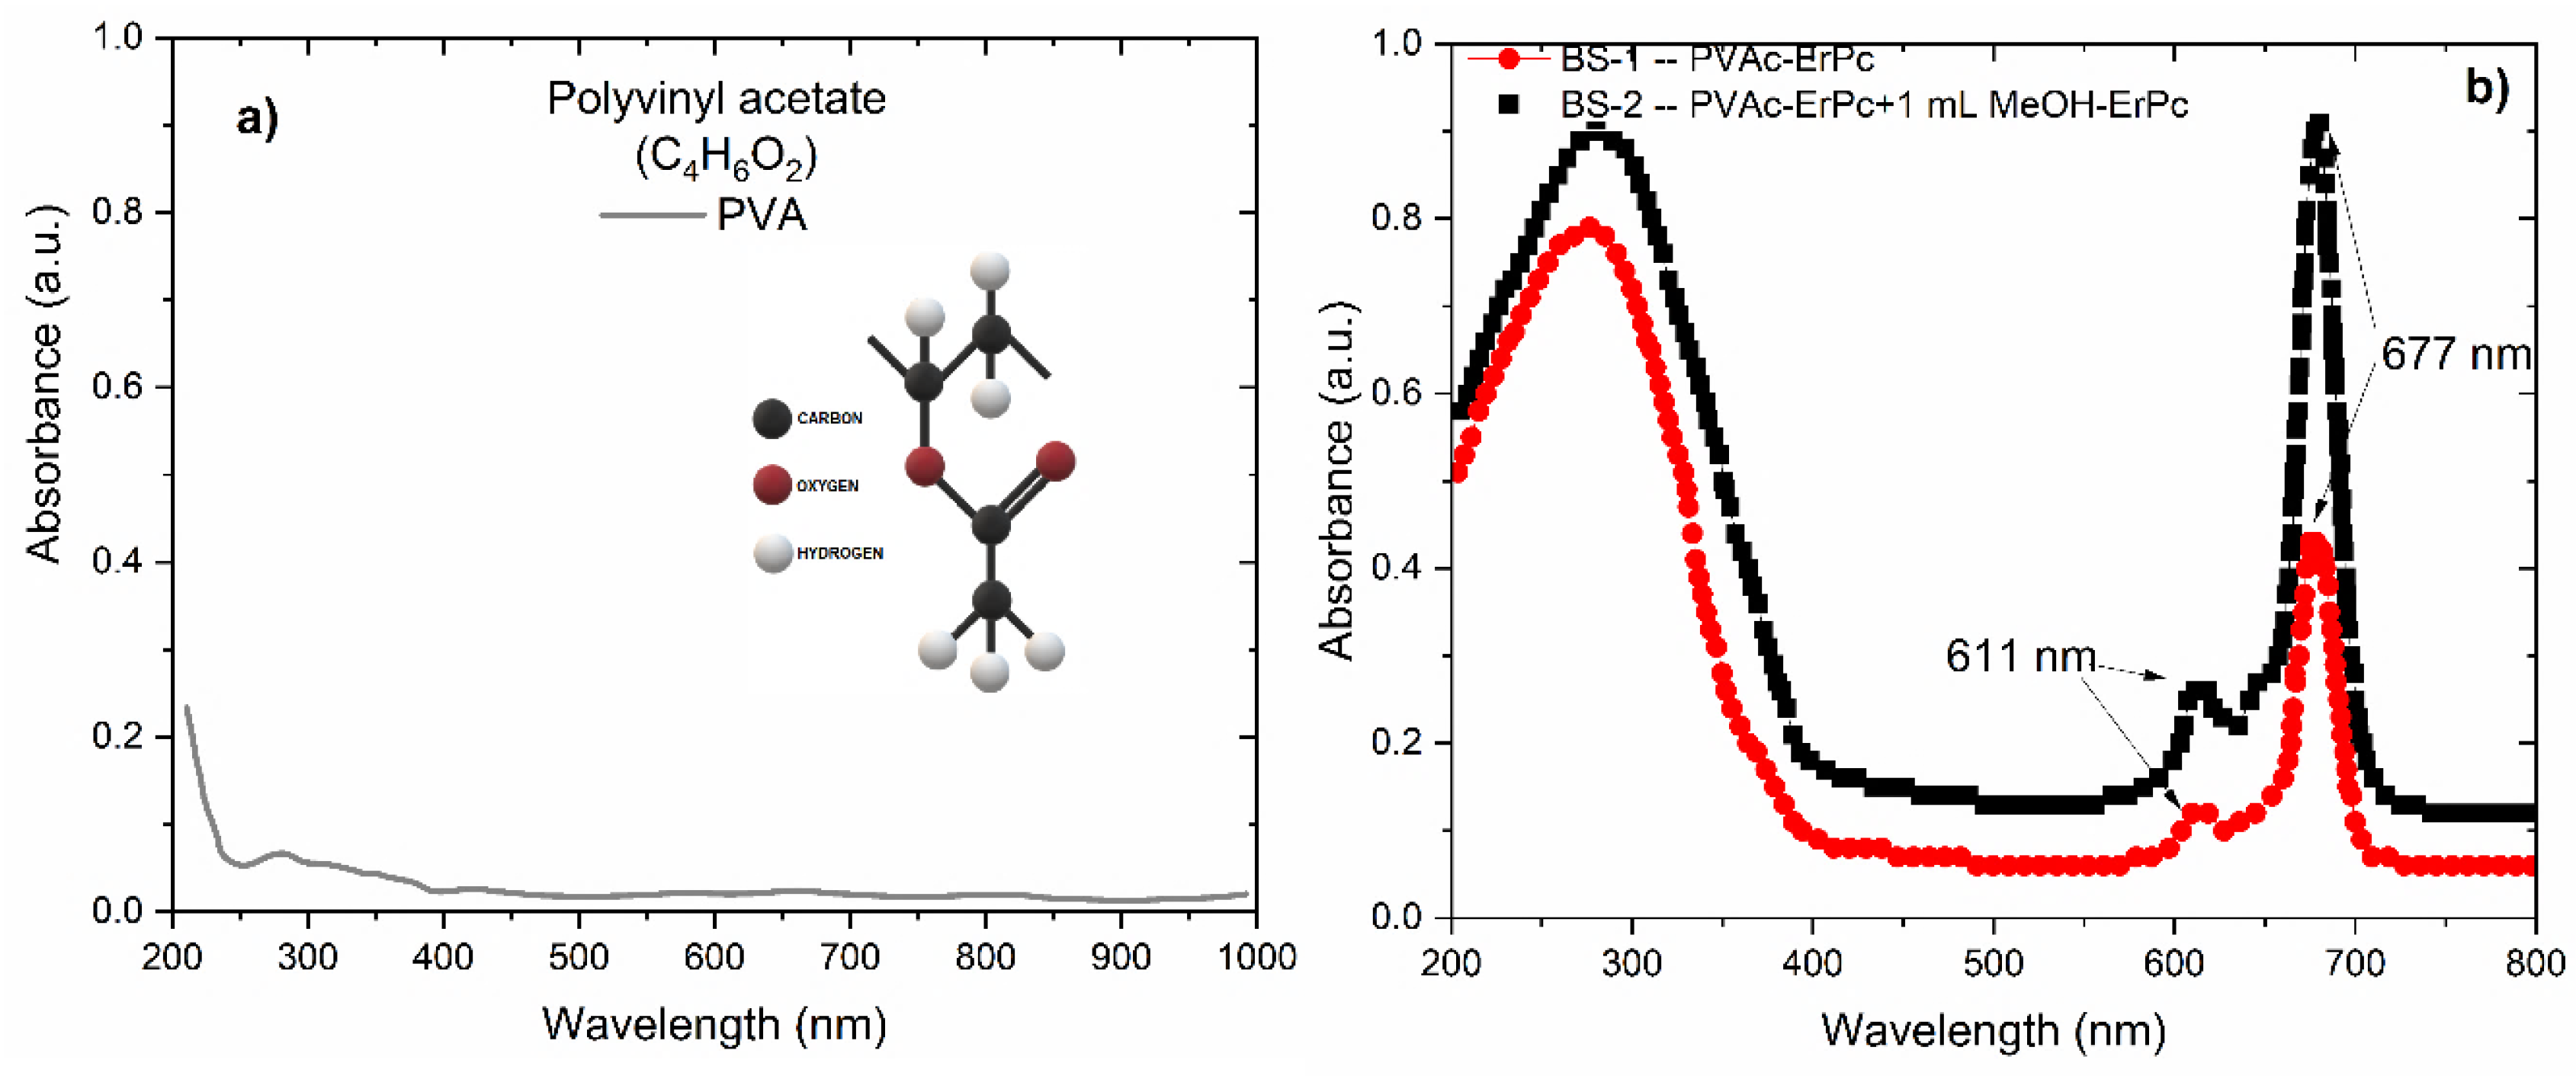
Figure 4.
SEM micrographs of thin films of a) BS-1 (PVAc-ErPc), b) BS-1 (PVAc-ErPc)-zoom 1µm, c) BS-2 (PVAc-ErPc + 1 mL MeOH-ErPc) and d) BS-2 (PVAc-ErPc + 1 mL MeOH-ErPc)-zoom 1µm.
Figure 4.
SEM micrographs of thin films of a) BS-1 (PVAc-ErPc), b) BS-1 (PVAc-ErPc)-zoom 1µm, c) BS-2 (PVAc-ErPc + 1 mL MeOH-ErPc) and d) BS-2 (PVAc-ErPc + 1 mL MeOH-ErPc)-zoom 1µm.
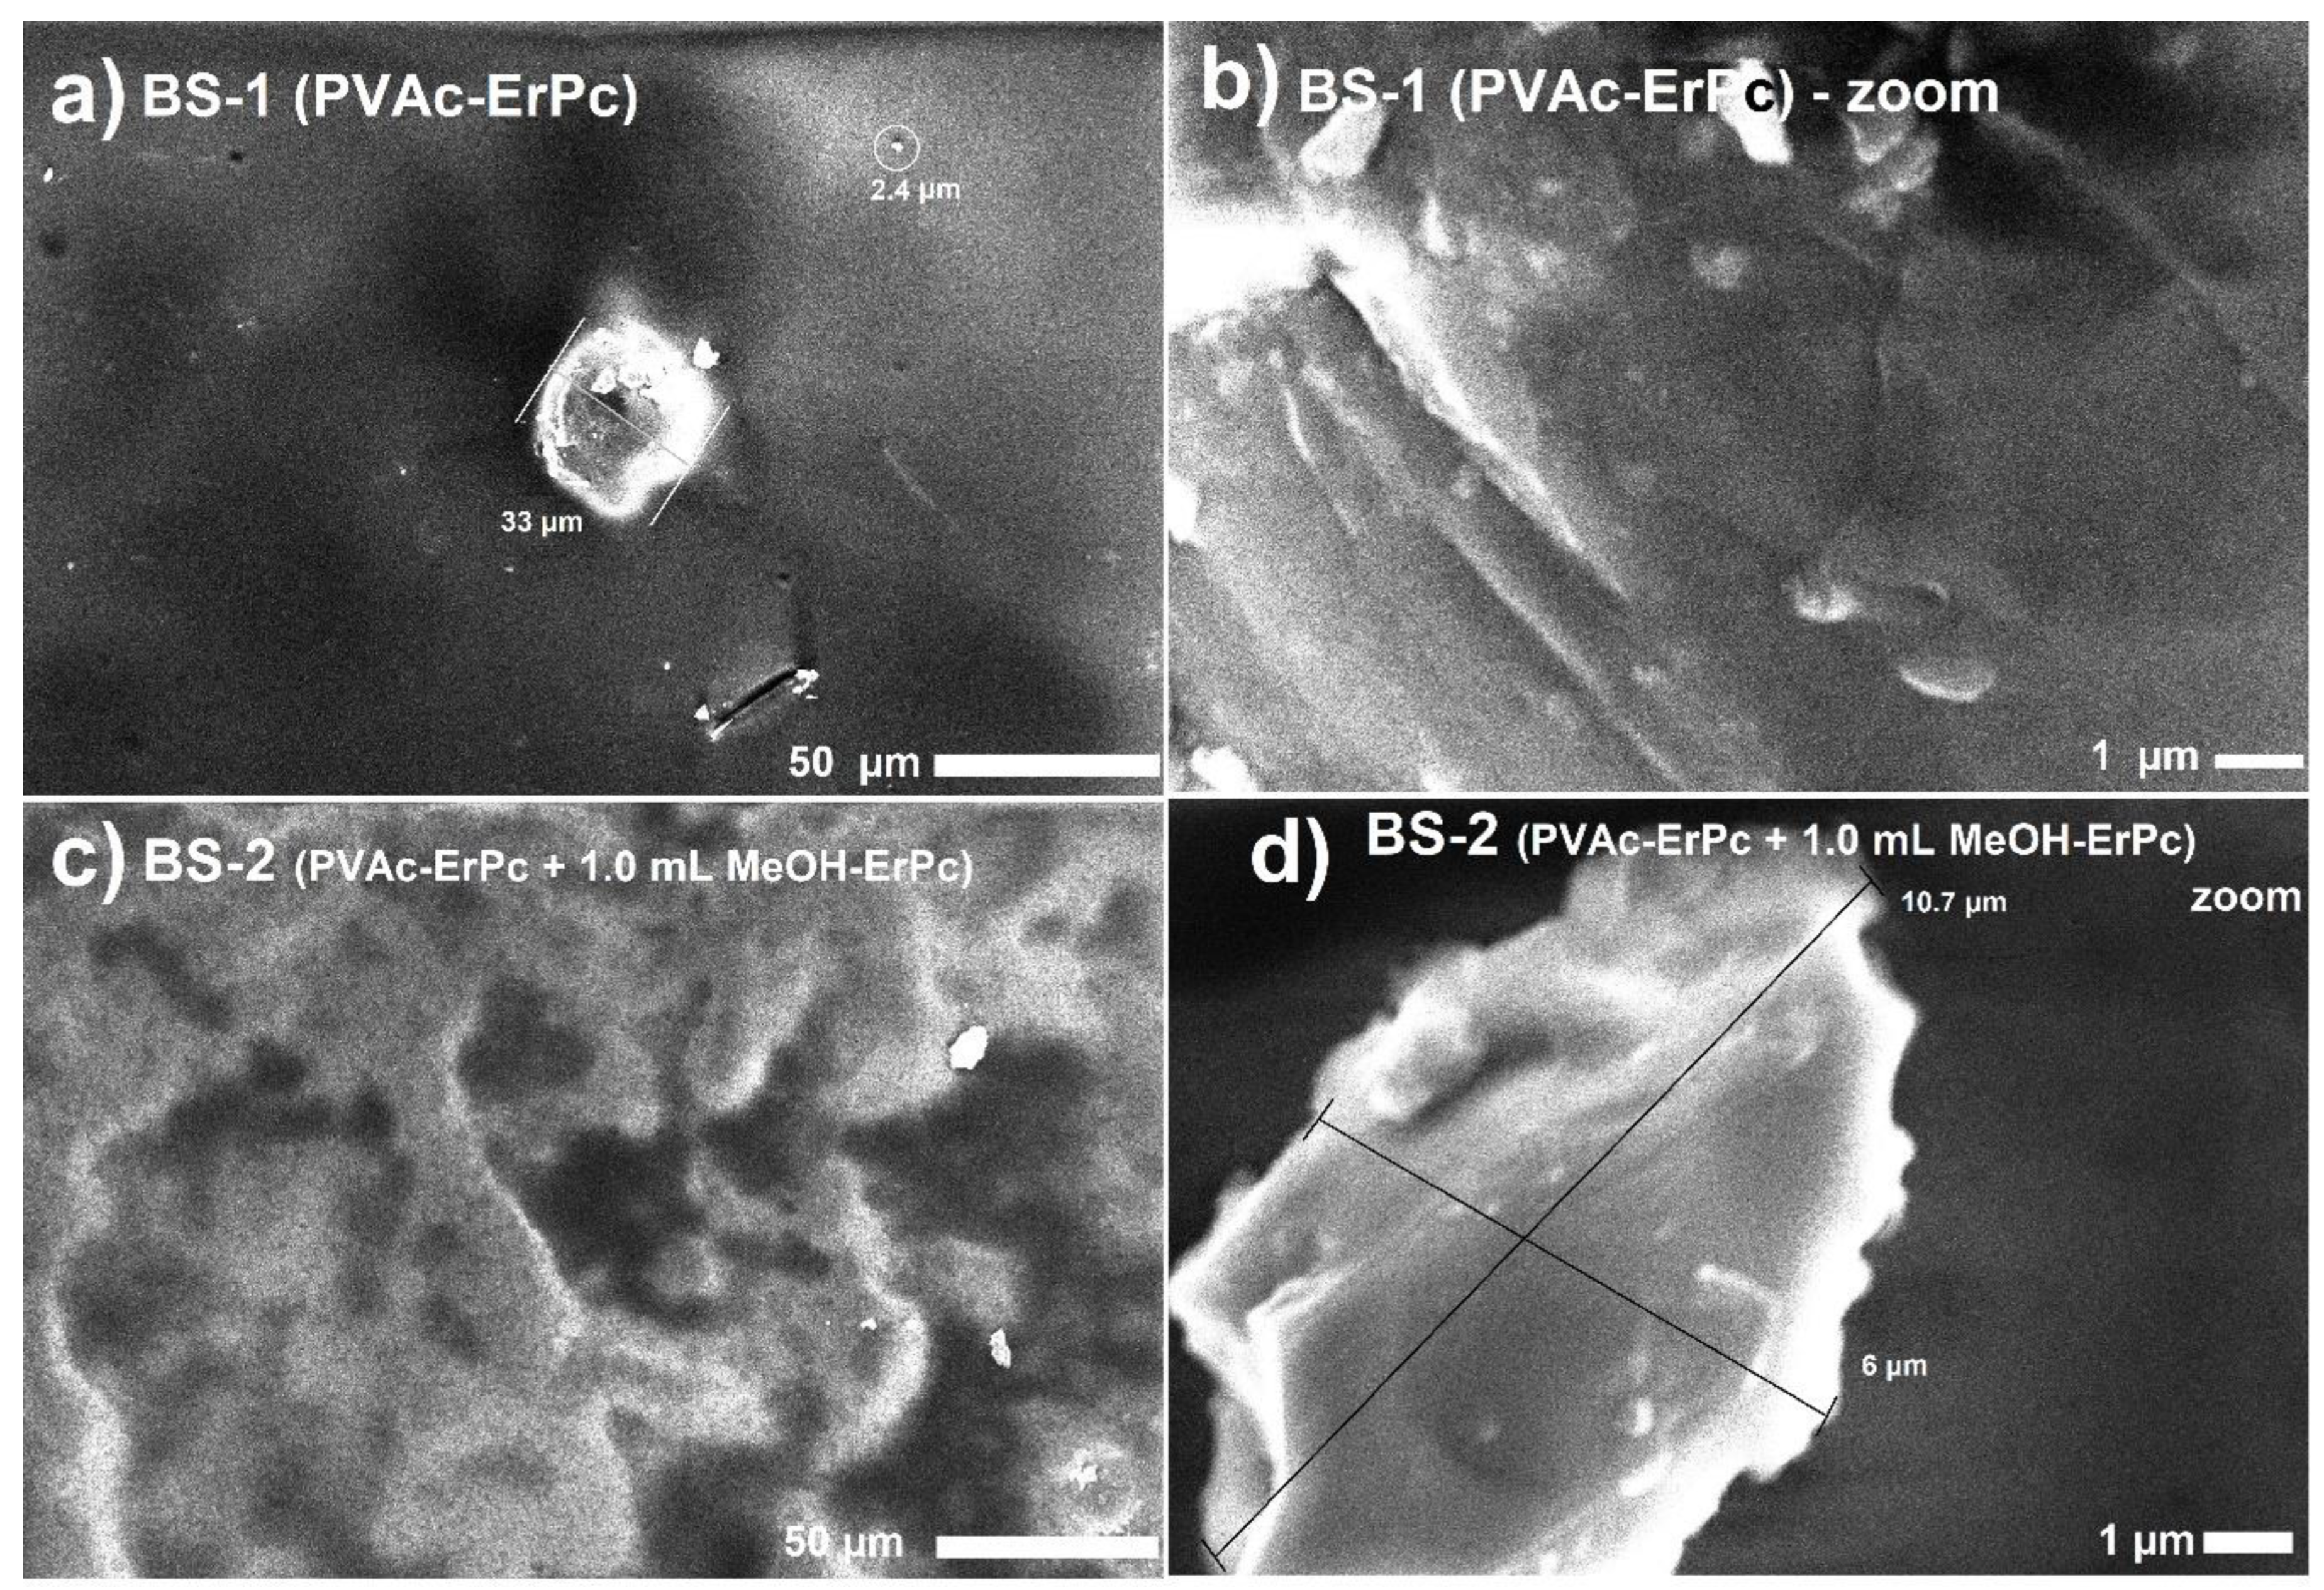
Figure 5.
Transmitted signal spectra of BS-1 in saliva and saliva with soda for: a) regular person, b) athlete), c) prediabetic person.
Figure 5.
Transmitted signal spectra of BS-1 in saliva and saliva with soda for: a) regular person, b) athlete), c) prediabetic person.
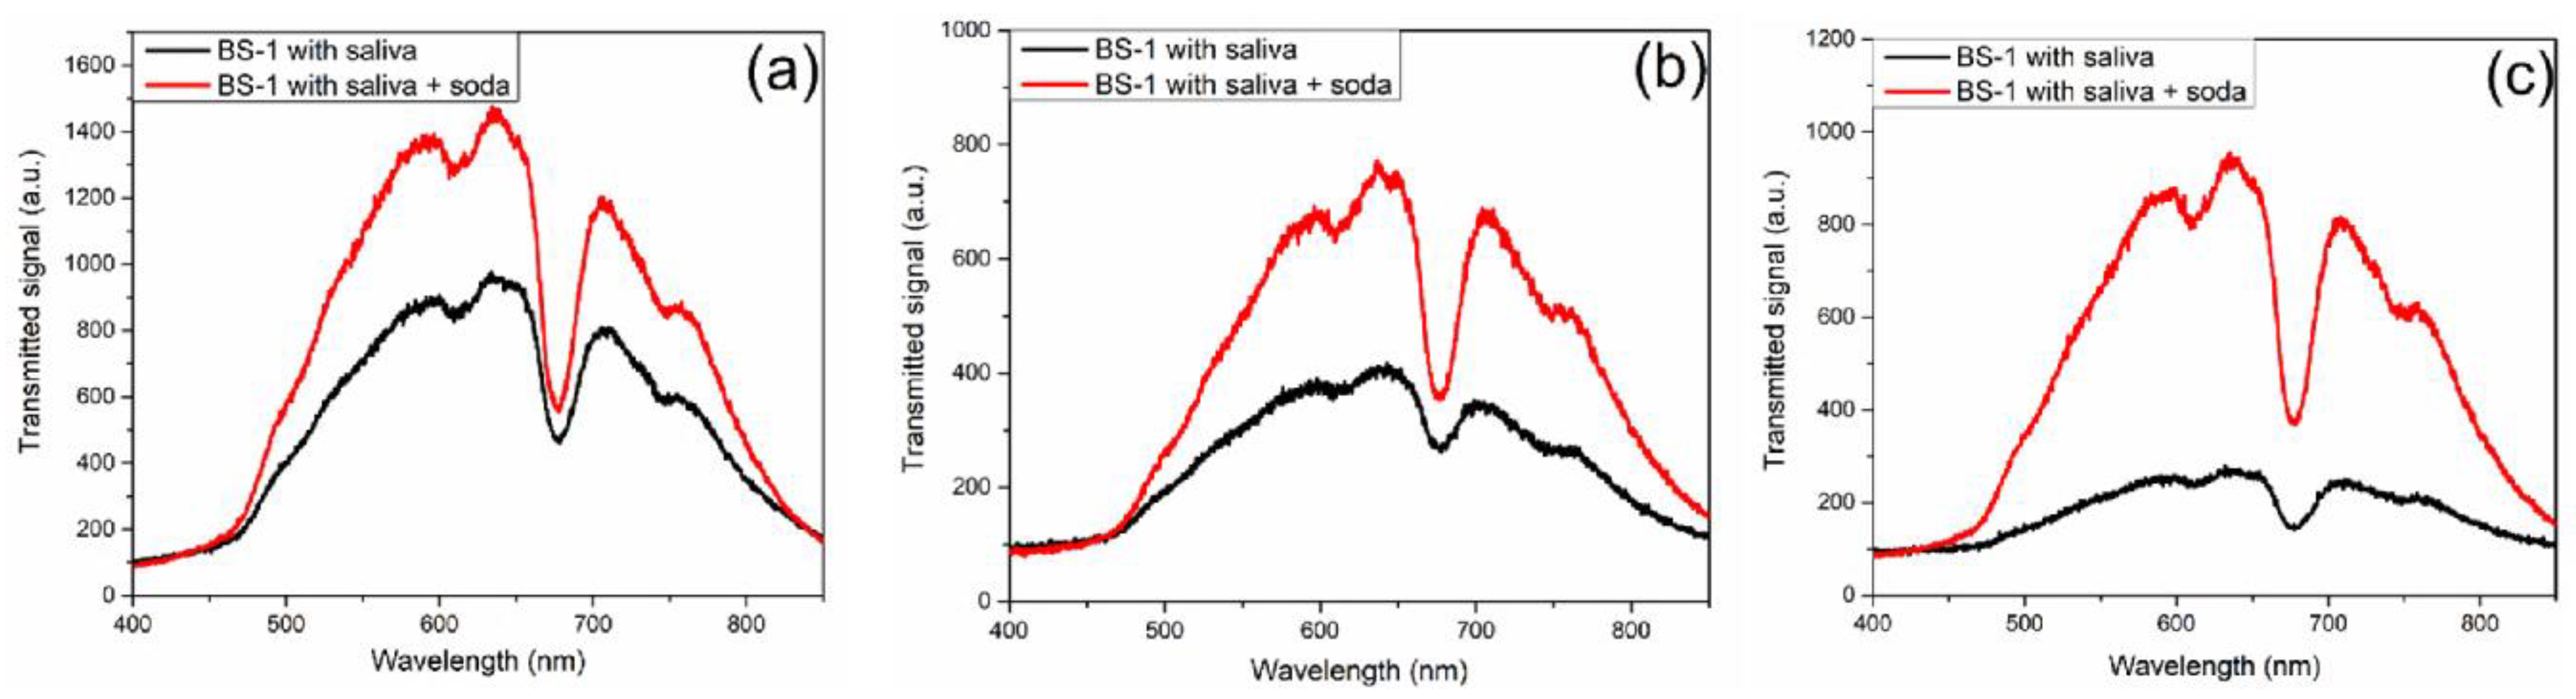
Figure 6.
Biosensor BS-1 characterization: a) Relative transmission for each study case, b) average relative transmission as a function of blood glucose.
Figure 6.
Biosensor BS-1 characterization: a) Relative transmission for each study case, b) average relative transmission as a function of blood glucose.
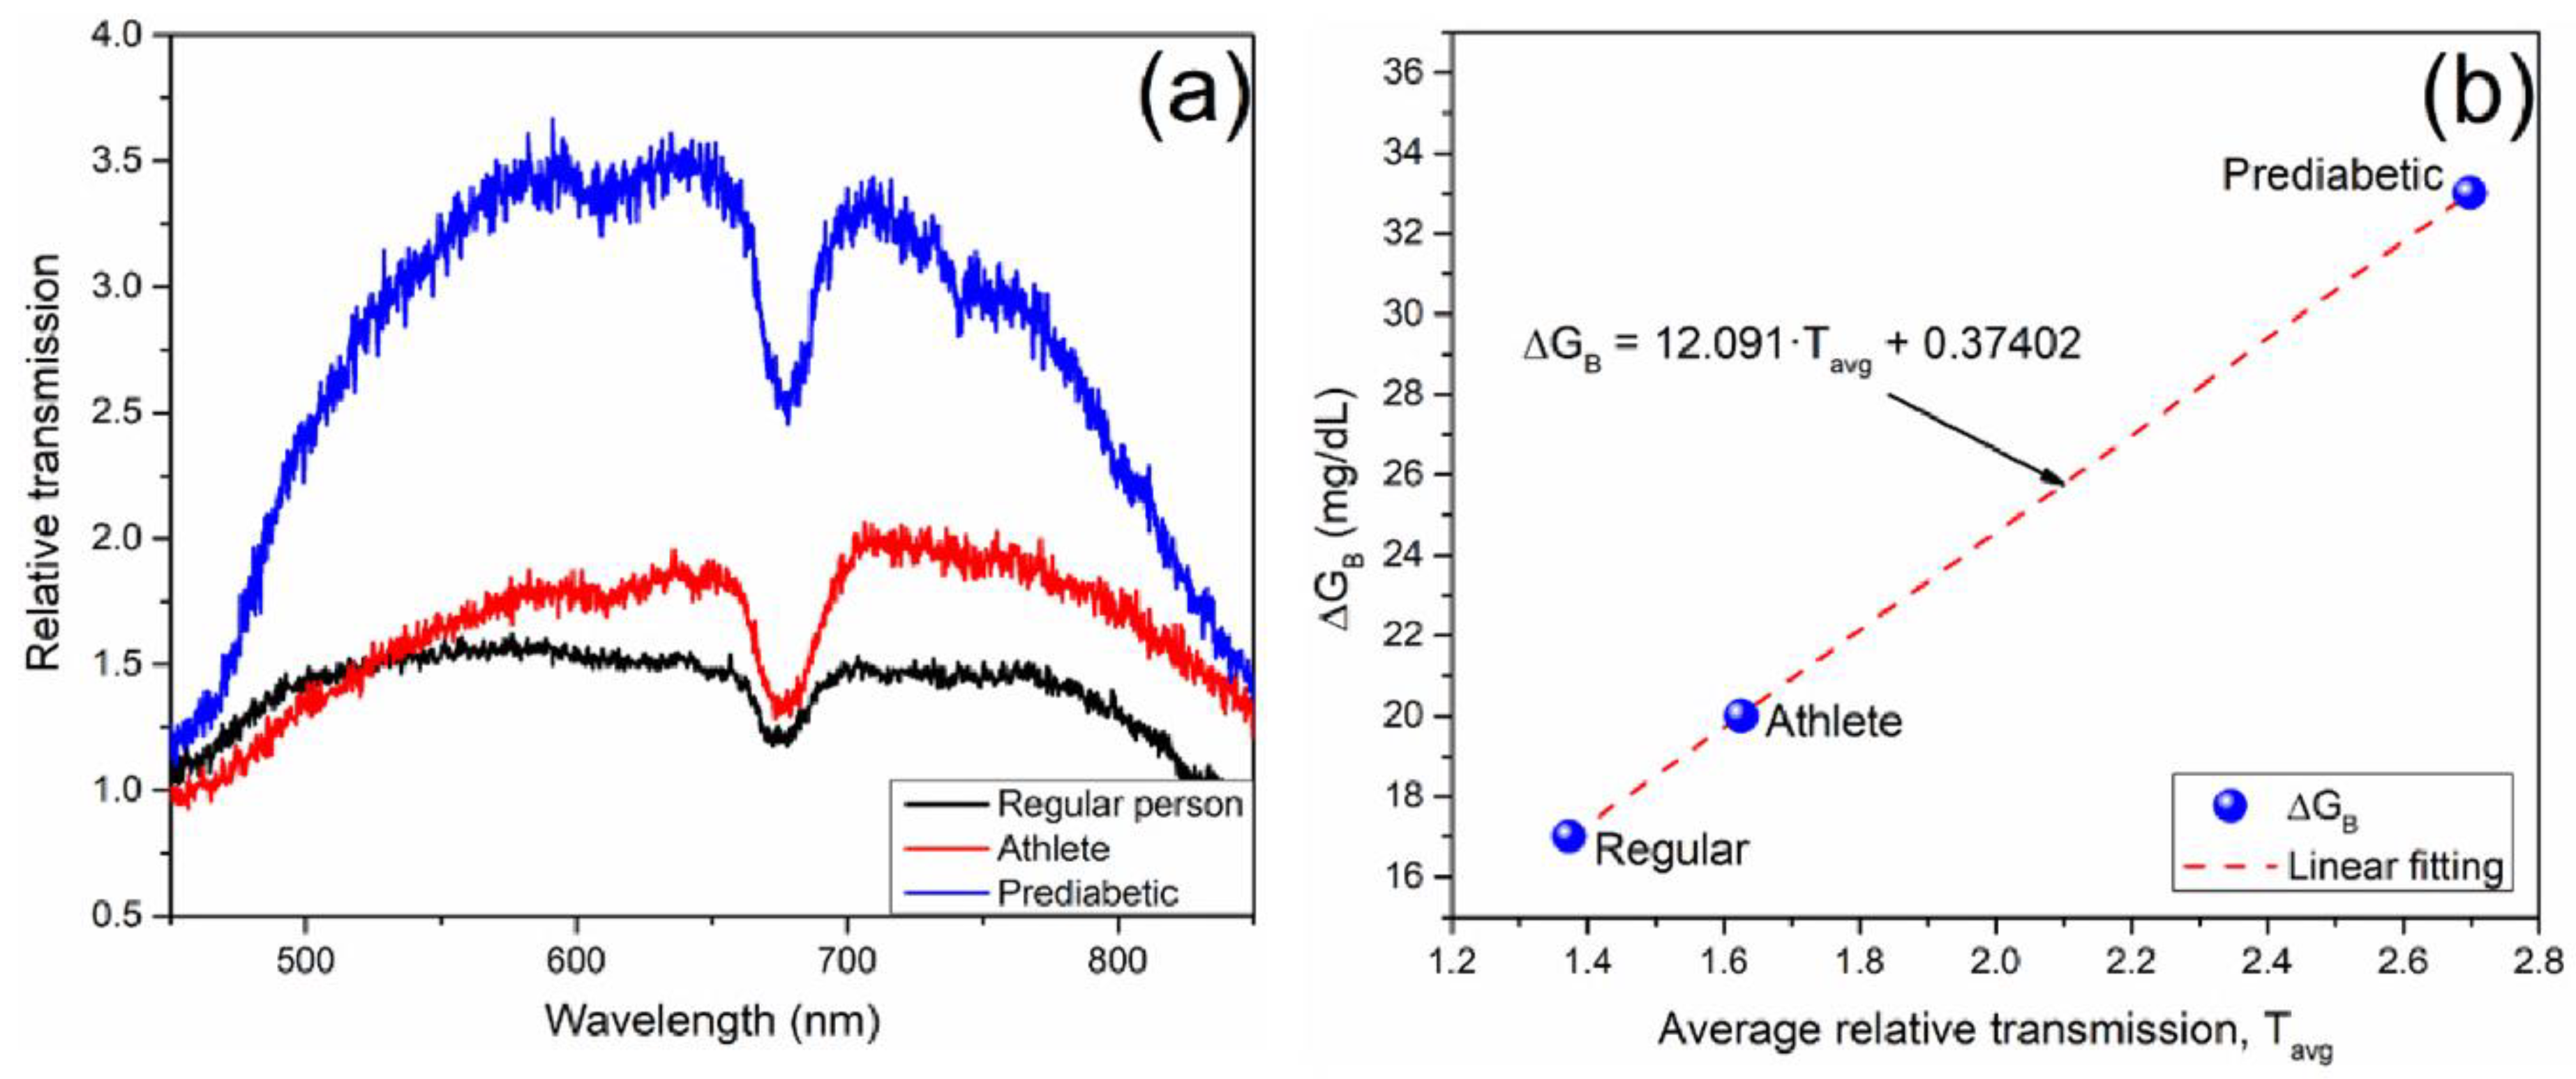
Figure 7.
Transmitted signal spectra of BS-2 in saliva and saliva with soda for: a) regular person, b) athlete), c) prediabetic person.
Figure 7.
Transmitted signal spectra of BS-2 in saliva and saliva with soda for: a) regular person, b) athlete), c) prediabetic person.
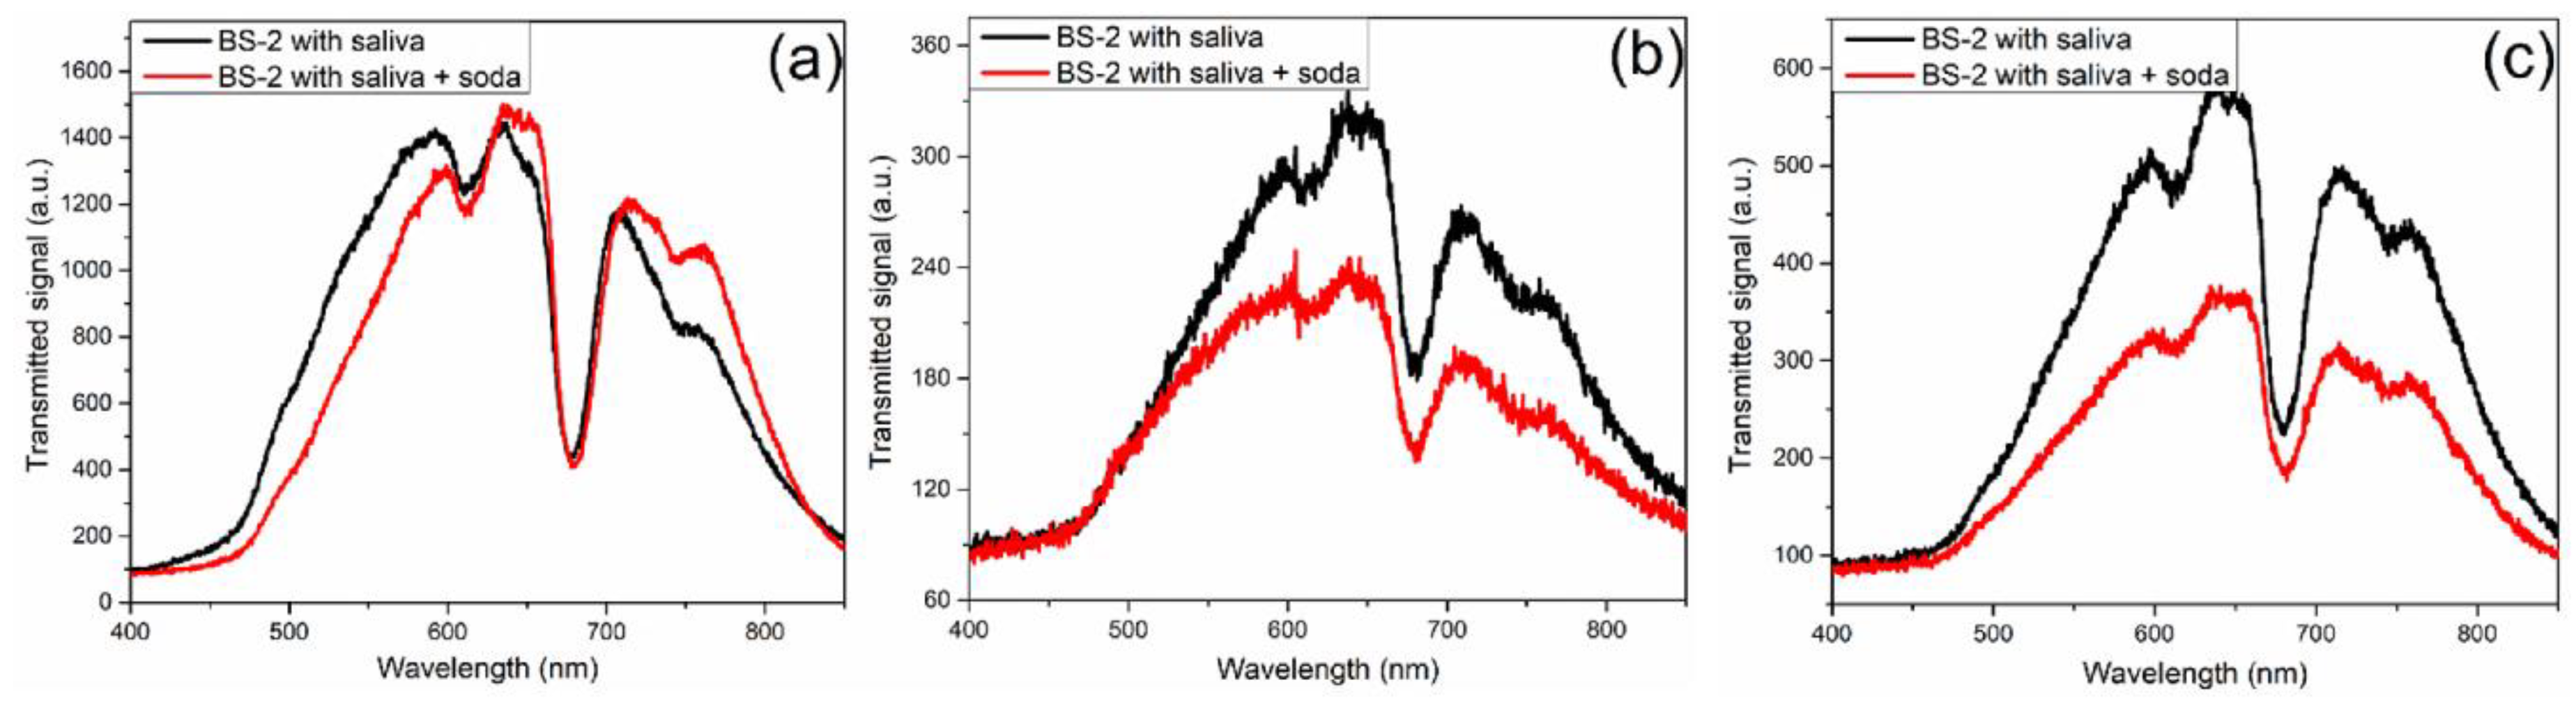
Figure 8.
Biosensor BS-2 characterization: a) Relative transmission for each study case, b) average relative transmission as a function of blood glucose.
Figure 8.
Biosensor BS-2 characterization: a) Relative transmission for each study case, b) average relative transmission as a function of blood glucose.
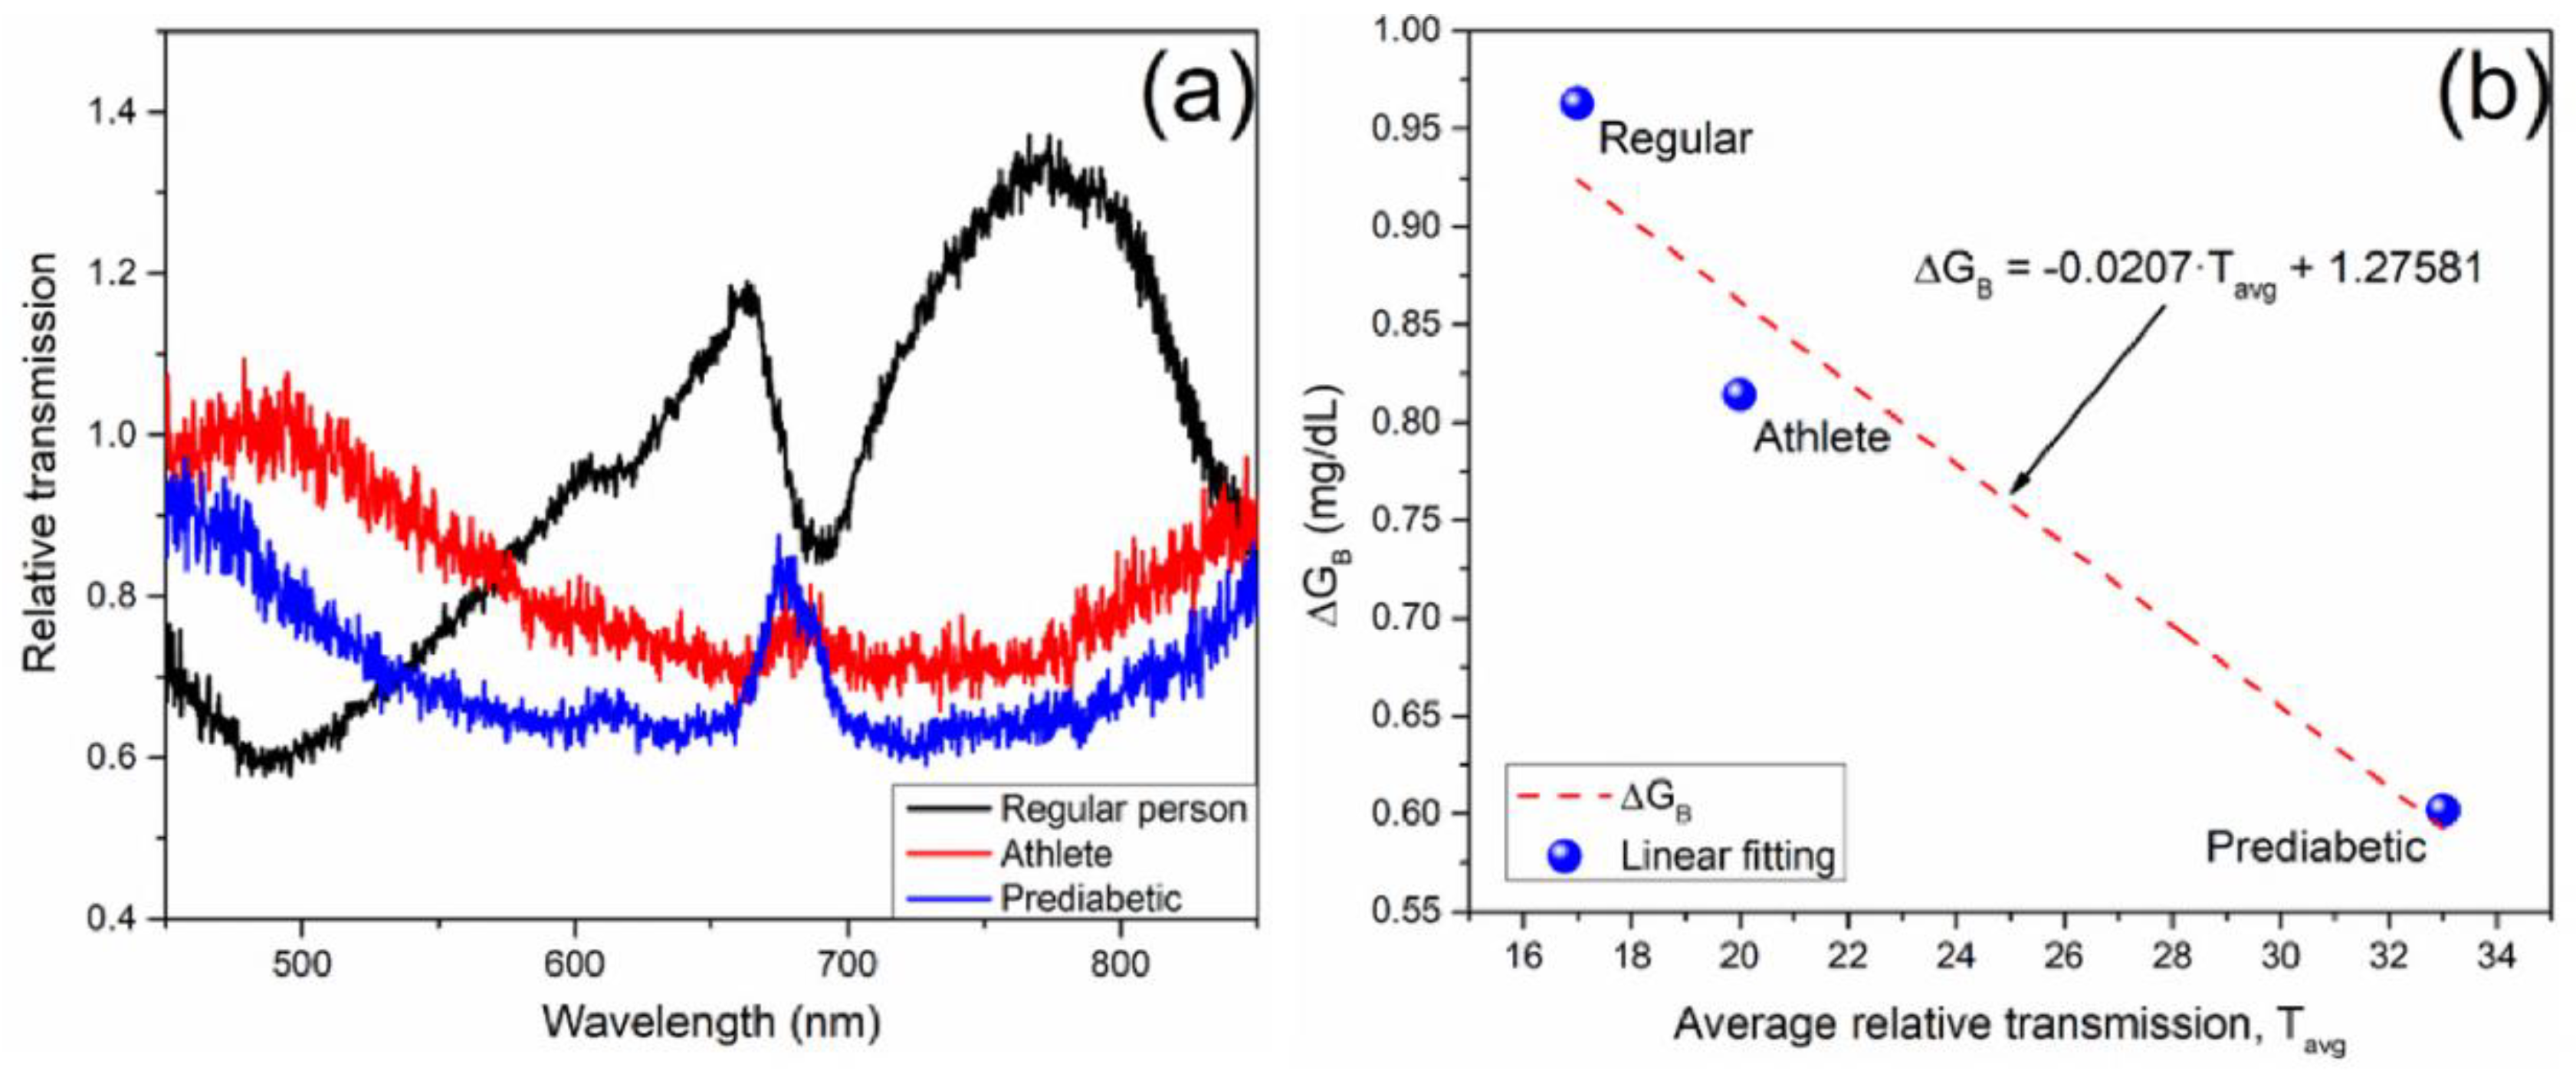

Table 1.
Labeling of the different biosensors.
| Biosensor number | Solution | Label |
|---|---|---|
| Biosensor one | PVAc-ErPc | BS-1 |
| Biosensor two | PVAc-ErPc + 1 mL MeOH-ErPc | BS-2 |
Disclaimer/Publisher’s Note: The statements, opinions and data contained in all publications are solely those of the individual author(s) and contributor(s) and not of MDPI and/or the editor(s). MDPI and/or the editor(s) disclaim responsibility for any injury to people or property resulting from any ideas, methods, instructions or products referred to in the content. |
© 2025 by the authors. Licensee MDPI, Basel, Switzerland. This article is an open access article distributed under the terms and conditions of the Creative Commons Attribution (CC BY) license (http://creativecommons.org/licenses/by/4.0/).
Copyright: This open access article is published under a Creative Commons CC BY 4.0 license, which permit the free download, distribution, and reuse, provided that the author and preprint are cited in any reuse.


