Preprint
Article

This version is not peer-reviewed.

Prediction Curve Approach for Monitoring Tractor Noise Levels Using a Random Forest Regressor with Activated PTO

Submitted:

27 February 2025

Posted:

28 February 2025

You are already at the latest version

Abstract

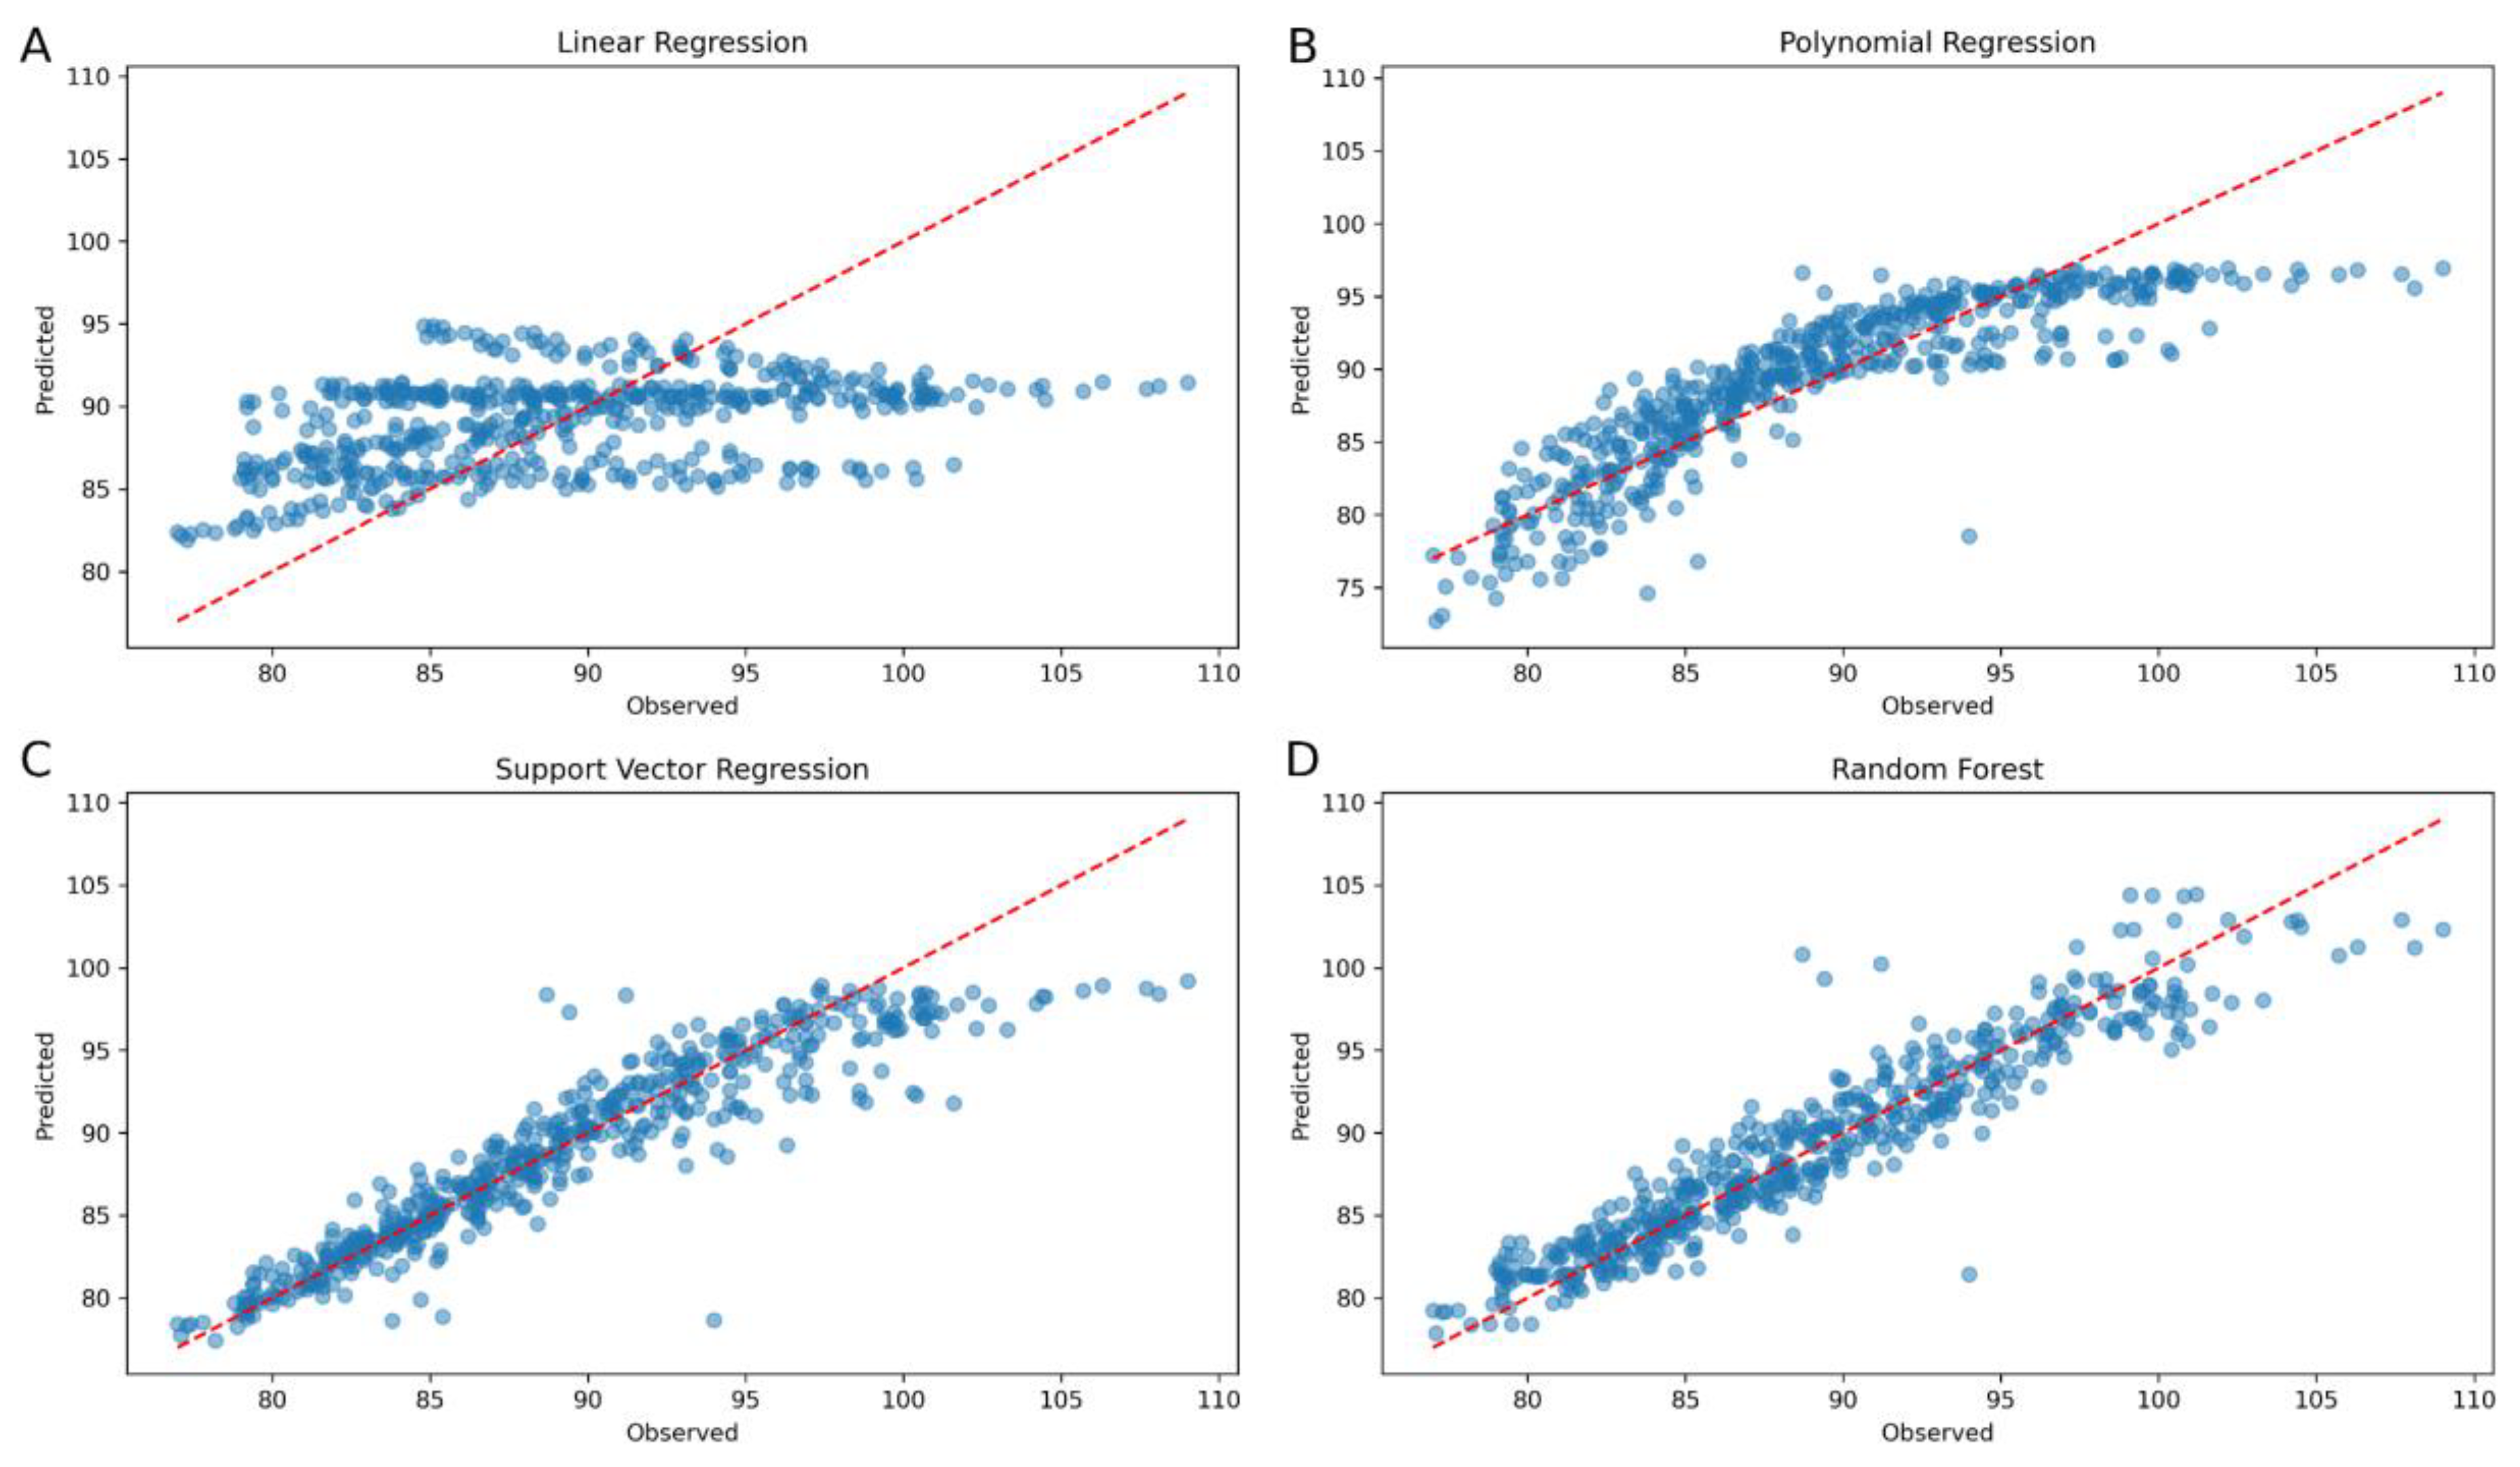
Agricultural tractor operators deal with health risks from engine and attachments noise, especially during prolonged exposure. This study measured noise levels in three tractors—one with a cabin and two without—at PTO speeds of 540, 750, and 1000 RPM. Measurements were taken at the operator’s seat and up to 15 m away using a sound level meter. Statistical analysis and machine learning models, including Linear Regression, Polynomial Regression (PR2), Support Vector Regression, and Random Forest (RF), were applied to predict spatial noise distribution. Results showed that noise levels at the operator’s seat exceeded 85 dB, with non-cabin tractors surpassing 100 dB, posing significant health risks. The Kruskal-Wallis test confirmed significant differences, with Dunn’s post-hoc test showing higher noise levels in non-cabin tractors. RPM variations did not significantly affect noise levels. The RF model performed best (R² = 0.89, RMSE = 2.06), with distance and cabin presence as key predictors. A 2D and 3D spatial analysis using RF regression provided insights for protecting worker health and tractor integrity, enhancing potential failure prediction based on abnormal noise patterns.

Keywords: 
;  ;  ;  ;  
Subject: 
Engineering  -   Other

1. Introduction

Farmers use agricultural tractors for various tasks, including land preparation, crop management, harvesting, and transporting products from fields to collection centers. Additionally, tractors are used to activate the Power Take Off (PTO) speeds (540 RPM, 750 RPM, and 1000 RPM) for crop management attachments such as rotary plows, sprayers, atomizers and fertilizers, and for harvesting forage with mowers or mincers, cob pickers, and other equipment. They are also applied to activate stationary equipment like generators, motor pumps for water extraction, threshing machines, corn shellers, quinoa threshers, drills, and trenchers [1].
All of these machines produce high noise levels, and the proximity to machines with excessive noise can affect the worker’s health, therefore measurements are necessary to know what the levels of noise exposure are. If the worker’s noise exposure exceeds 80 dB (A), the use of hearing personal protective equipment (PPE) has to be implemented [2]. Moreover, for all workers, the time in risk areas must be limited and policies should be established and communicated. Medical studies highlight the negative effects of prolonged noise exposure and high sound pressure levels, which can cause stress (hypertension), sleep disturbances, temporary or permanent hearing loss, disorienting reactions, neurosensory damage, changes in the circulatory, endocrine and digestive systems, nervous disorders, irritability, and more [3].
There is concern about the effectiveness of various noise reduction measures, such as cabin designs, sound insulators, and technical modifications in tractors, especially in basic model tractors because laboratory-based evaluations do not include field conditions where farmers operate machinery [4]. Previous studies reported that the noise at the driver's ear on a large tractor operated at full power exceeded the California 95 dB industrial noise level with a peak of 107 dB and after improved muffler installation the peak was 95 dB [5], using the standard ordinary exhaust (ISO 7216 and ISO 5131) at 2000 RPM in tractors Massey Fergusson model MF 285 (100.9 dB) and MF 299 (102.95 dB) [6].
Additional studies confirmed the benefit of using cabins and earplugs to reduce noise levels, and the driver's ability to perceive external signals and screams slightly reduced while his ears were effectively protected [7]. Also, there is a need to develop a noise reduction system in tractor cabs incorporating Coupled Resonance Acoustic Materials (CRAMs) to reduce ear noise by approximately 1.3 dB(A) at 2200 RPM [8]. Complementarily, operators' perceptions of noise and indoor activities were also studied, which were associated with a trim level of hearing noise risk, ranging from 62.3 to 84.7 dB [9]. Studies reported non-auditory effects which can occur by audible noise levels regarding infrasound levels; tractors are determined to produce considerable noise levels (both inside and outside the driver's cabin), with infrasound levels ranging between 83.8 and 110.4 dB-G [10], which exceed occupational health recommendations.
Industry usually reports higher noise levels in tractors without cabins than in tractors with cabins. Also, original cabins are promoted as being more effective at reducing moderate noise level and insulating noise than field-installed cabs, especially at high-frequency locations [11]. Also, regarding ergonomics, high noise levels impact negatively on the operator’s performance [12], and increase the risk for farmers in different activities ([6,7]).
Moreover, there is a direct correlation between the increased engine power and noise levels, due to the high-power demand derived from the driven parts [13]. Also, another finding was that the noise levels caused by threshing mechanisms at 540 RPM were higher than at 420 RPM, confirming the relationship between the rotating components of the machinery and noise levels [14]. Furthermore, the noise levels produced by two agricultural tractors pulling disc plows, disc harrows, subsoilers, and furrows produced the highest noise levels with the increase of operating speeds [15], and the noise levels generated by 198 tractors were higher in longer runs of a tractor than in shorter runs [14]. Statistically, the equipment's age is related to the noise level produced; however, open areas at the operator station increase the sound level pressure. The focus should be the reduction of open areas in the cabin to decrease noise in order to improve the ergonomics and care for the operators' health [16].
Also, failures in the maintenance of agricultural machines are directly related to increased noise production, raising the risk for the machinery and the workers [17]. Several studies dedicated to the reliability Prevention Failure (PF) curve noted the increase in noise levels, which can be audibly identified when the event is close to the functional failure (F) before the catastrophic failure, which can be monitored by using tractor sensors and computers [18]; however, in basic tractors these actions are limited by available technology. For that reason, it is reasonable the development of a methodology to reduce bias by perception, in addition to the technicians' hearing capacities to detect these noise changes in a range of five decibels or less using a standardized reference and a decibel meter with the use of a reference curve obtained from machine learning algorithm Figure 1. [19]. However, the tractor technician and operator’s capacity to match the noise level with the exact reference levels is relative, being 110 dB the level which statistically produces an annoying sensation [20], which finally can be related to any potential problem.
For this study, the Peruvian Supreme Decree No. 085-2003-PCM [21] outlines the regulations for environmental noise quality in the country and sets the maximum permissible noise levels. Similarly, Law 29783 on Occupational Health and Safety [22] highlights the rights and obligations of workers at workplaces following the international standard OHSAS 18001 [23] and uses recommendations from the OECD Standard Code 5 Method [24]. These are official guidelines when field activities are taking place to assess the noise levels in tractor models, with cabs and without them [25], which indicates that the maximum noise levels in the environment must not exceed 85 dB in order to protect human health.
For this experimental study, tractors for diverse attachments with PTO activated at 540, 750, and 1000 RPM with one tractor with an operator's cabin and two without a cabin were used to develop a preventive method to protect workers' health. For that reason, the primary established goal was the early prediction of machine failures which has direct relation with the noise level increase and the application of the method proposed to reduce risks and costs, and improve work conditions [26]. Also, the specific objectives are i) the assessment of the noise spatial distribution from tractors with and without cabin working at different RPM conditions; ii) the development of a machine learning model to predict the noise level spatial distribution; and iii) all of these actions to help to protect workers’ health providing a comprehensive material to support preventive policies for tractor operators and workers around them.

2. Materials and Methods

2.1. Noise Level Measurements

The study was conducted in Peru, in the National Agrarian University (Universidad Nacional Agraria La Molina, UNALM), located at latitude 12°04'55" S, longitude 76°56'53" W, and altitude of 243.7 meters above sea level (m.a.s.l.). The environmental conditions were temperature of 27 oC, with no precipitation, no strong winds, and in an arid dry soil predominantly sandy loam.
Three different standard models of agricultural tractors were chosen (Table 1), which are used in the agriculture industry to activate implements with the PTO for crop maintenance, categorized based on their features, such as having an operator's cabin and engine power:
For this study a decibel meter (Control Company model 4335) was used with ranges for Low: 35–95 dB and High: 65–130 dB, with resolution of 0.1 dB and accuracy of ±2 dB. The measurements to estimate noise levels in tractors were made in stationary conditions and were divided in two groups: the measurement of the noise transmitted to the environment and the noise affecting the operators [27]. This study evaluated the noise levels at the operator's ears sitting over the tractor and up to 15 m away from the tractor's front, back, right, and left sides in relation to the operator's seat with speed variations. Tractor’s rotational speeds of the crankshaft ranged from 900 to 2500 RPM [28], with highest noise levels in the cycles of 2250 and 2500 RPM, and the PTO rotational speeds of 540, 750, and 1000 RPM.
The Brazilian standard NBR 10152 [29] to measure the noise level was used as reference and the data were taken at every meter up to operator seat to evaluate noise levels at idle conditions as a function of motor rotation, around the tractor when working with PTO shaft levels of 540, 750, and 1000 RPM with one tractor with an operator's cabin and two without a cabin, at idle conditions, to be later compared to the maximum limits allowed by local legislations.
Additionally, the ISO 5131:2015 standard was used to measure noise level at the operator's position on agricultural tractors. Operational safety guidelines for handling agricultural machinery [30] were strictly followed, to ensure the safety and well-being of the personnel involved in the study, highlighting our commitment to ethical research practices.

2.2. Data Analysis

The inverse distance weighting (IDW) interpolation and isoline calculation was used to represent spatially distribution of the data collected for each tractor and RPM. Also, a 3D graph was created to illustrate the spatial distribution of noise levels, considering the X and Y axes and noise intensity represented along the Z-axis. In addition, the plot included a sphere to replicate the operator's location and understand how noise intensity varied spatially.[31]
The statistical differences in noise levels between tractors (with and without cabins) and the different PTO speeds or RPM levels (540, 750, and 1000) were tested. Consequently, the Shapiro-Wilk test and Levene's test were used to determine the most appropriate statistical test to analyze differences between subgroups defined by combinations of RPM and tractor (T1, T2, T3), where the normality of the data and the homogeneity of variance among the groups were evaluated. A p-value below 0.05 in both tests indicated that the data did not satisfy the assumptions of normality and homogeneity of variance, so the non-parametric Kruskal-Wallis test followed by the Dunn test were utilized [40]. Python software (Python Software Foundation, 2024) and the packages (NumPy, matplotlib, pandas, SciPy) were used [32,33,34,35].

2.3. Development of Machine Learning Models to Predict Potential Failures

The collected data was used to identify potential machinery failures based on noise level measurements, including whether the tractor had a cabin (Cabin), its revolutions per minute (RPM), the spatial position considering the distance to the front or rear and left or right of the operator, X and Y. These variables were used to build a predictive model that estimates the expected noise level at specific positions relative to the tractor operating under similar, optimal conditions. Therefore, predicted values could be used to compare if an actual value is atypical and can be a potential machinery failure.
Four models were used for comparison, training, and evaluation using a 5-fold stratified cross-validation approach, with stratification based on the Cabin and RPM variables to ensure that each fold was balanced and maintained consistent distributions of these key variables; Linear Regression (LR), Polynomial Regression of degree 2 (PR2), Support Vector Regression (SVR), and Random Forest (RF). [41,42]
The LR model was used as a baseline to capture linear relationships in the data. Afterward, PR2 was to account for potential non-linear relationships with a simple extension of the linear model, the SVR for its effectiveness in handling non-linear relationships by mapping data to higher dimensions, and the RF model for its robustness in capturing complex interactions through ensemble learning. These models offered a broad spectrum of analytical capabilities, from simple linear interpretations to more complex, non-linear interactions.
In each fold iteration, one-fold was designated as the testing set, while the remaining four folds were used for training, thus all data was used for both training and testing. For the models SVR and RF, hyperparameter tuning was performed using a grid search combined with an additional three-fold cross-validation within the training set to identify the optimal parameter configurations. The training and testing performance of each fold and model were evaluated using the Root Mean Squared Error (RMSE) and R-squared (R²) metrics. For each model, these metrics were averaged across all folds for training and testing independently, with the mean and standard deviation reported.

3. Results and Discussion

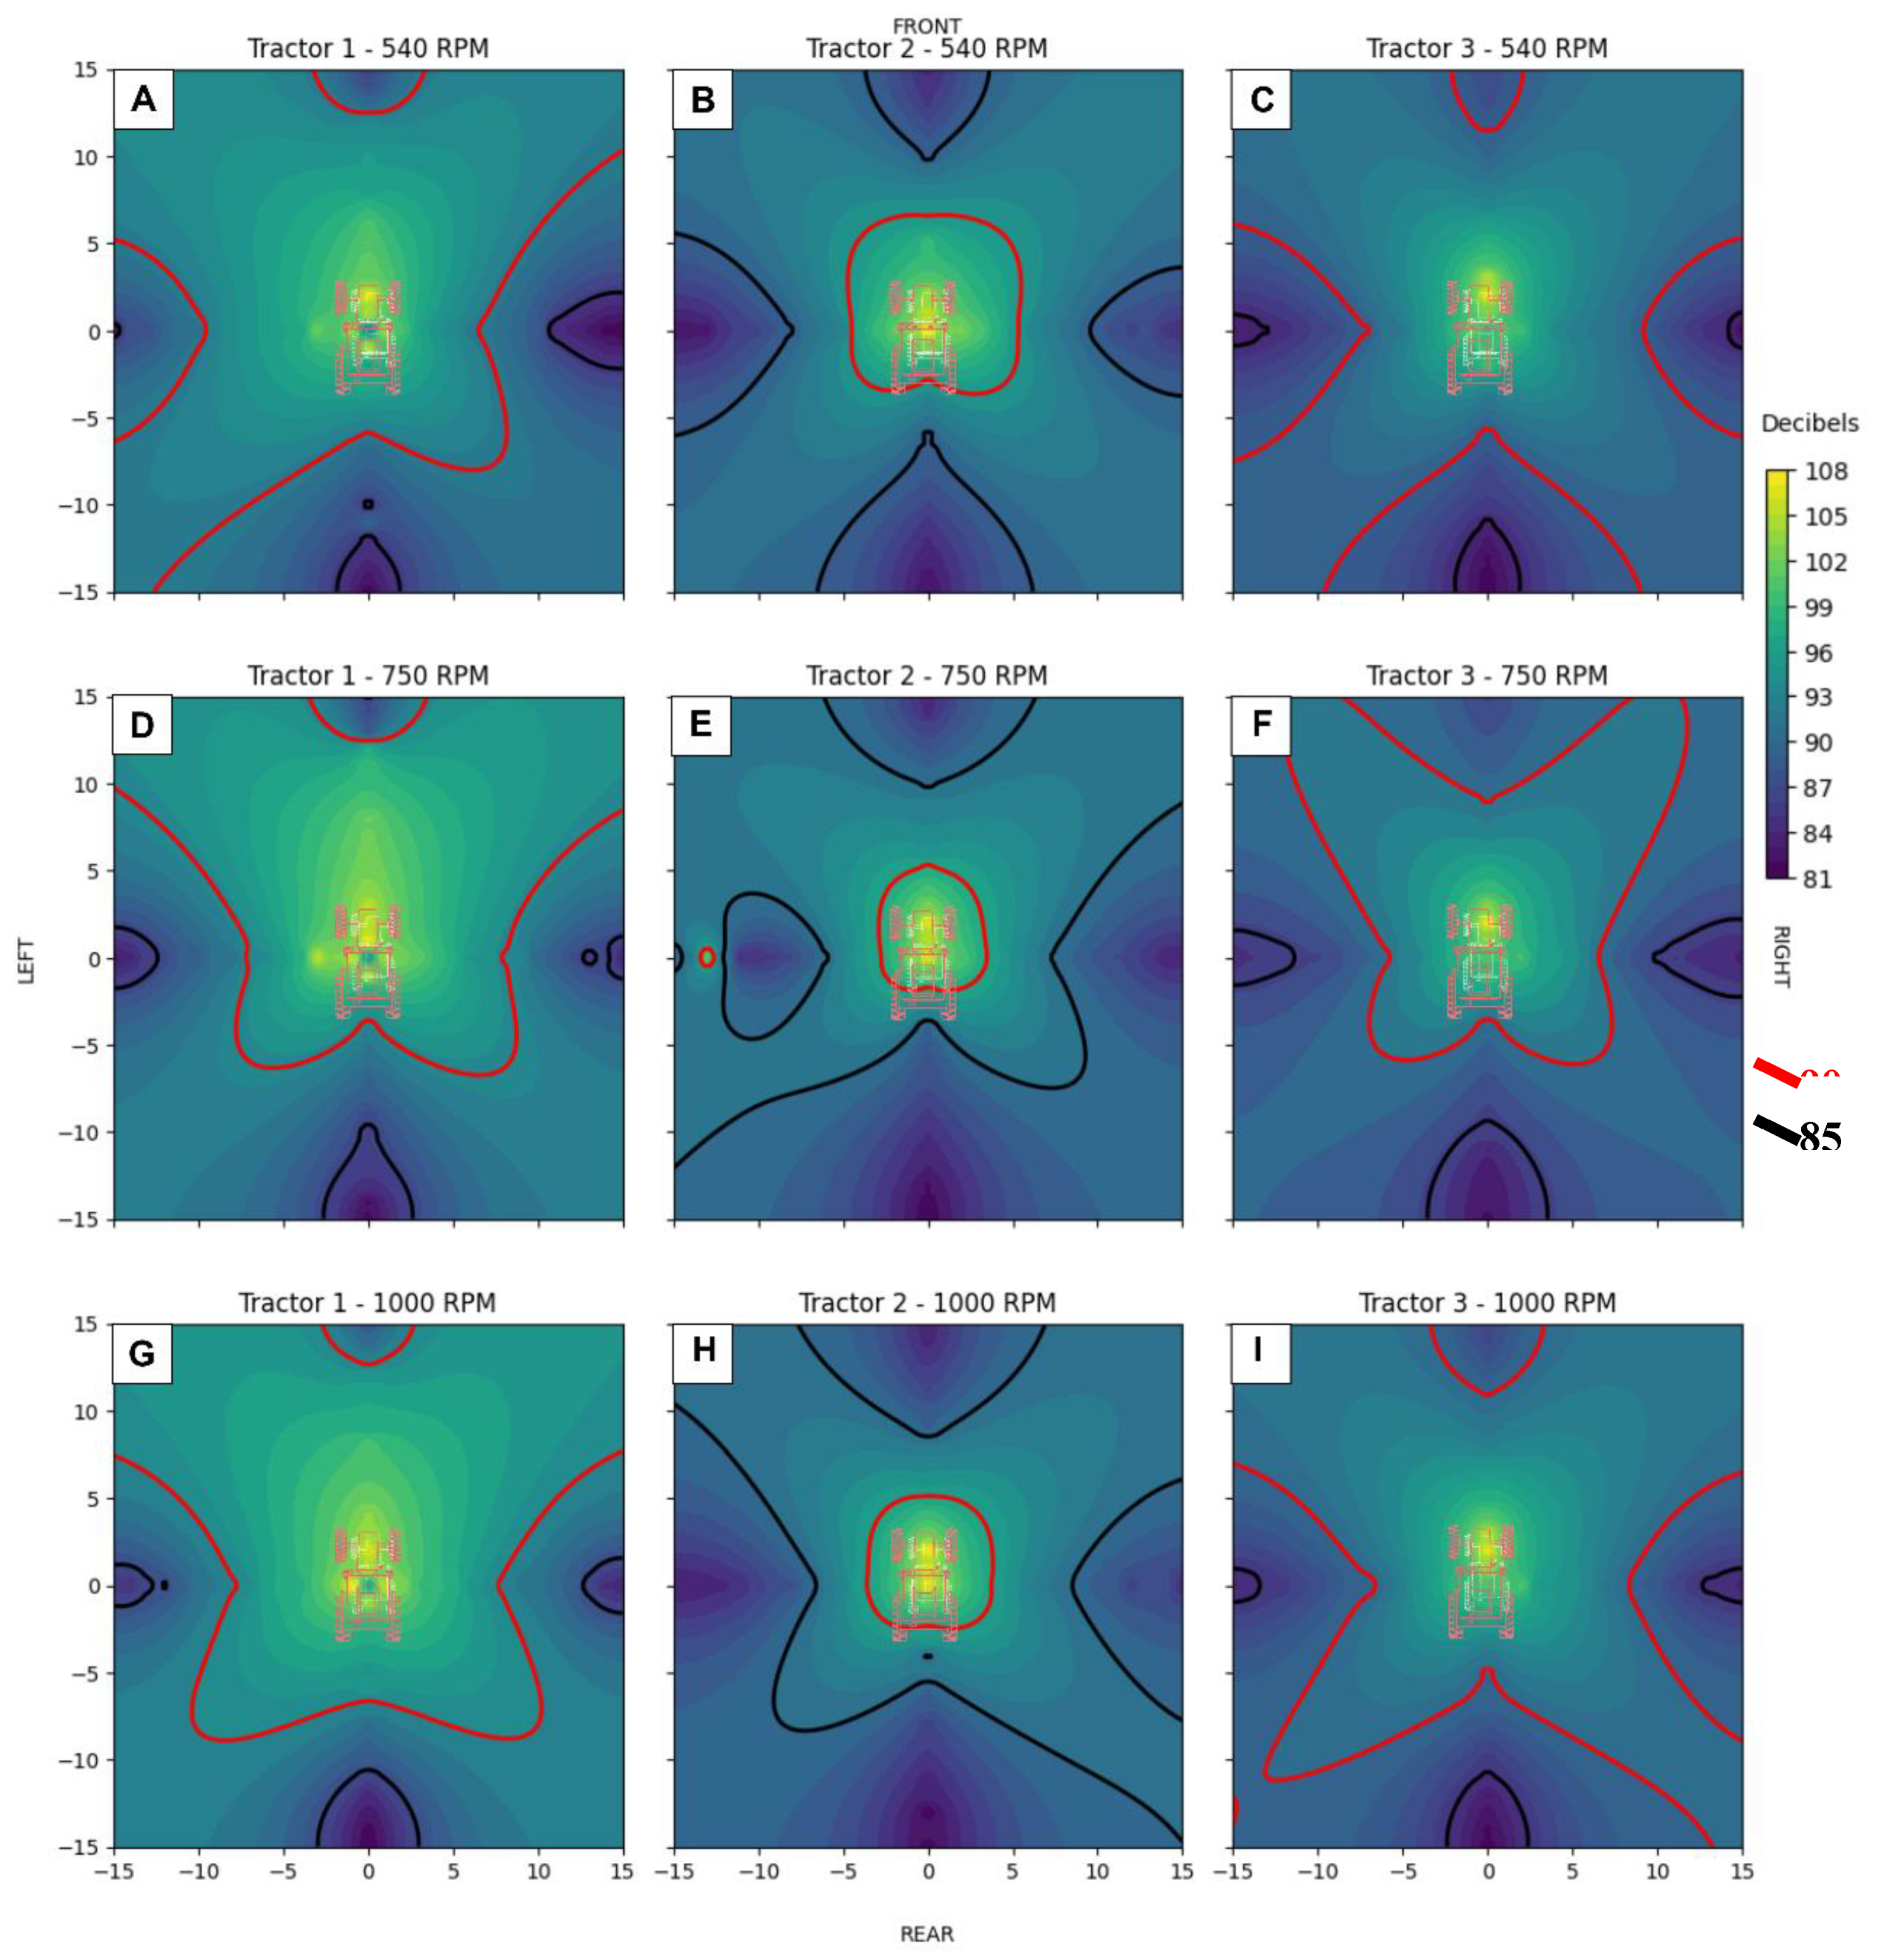
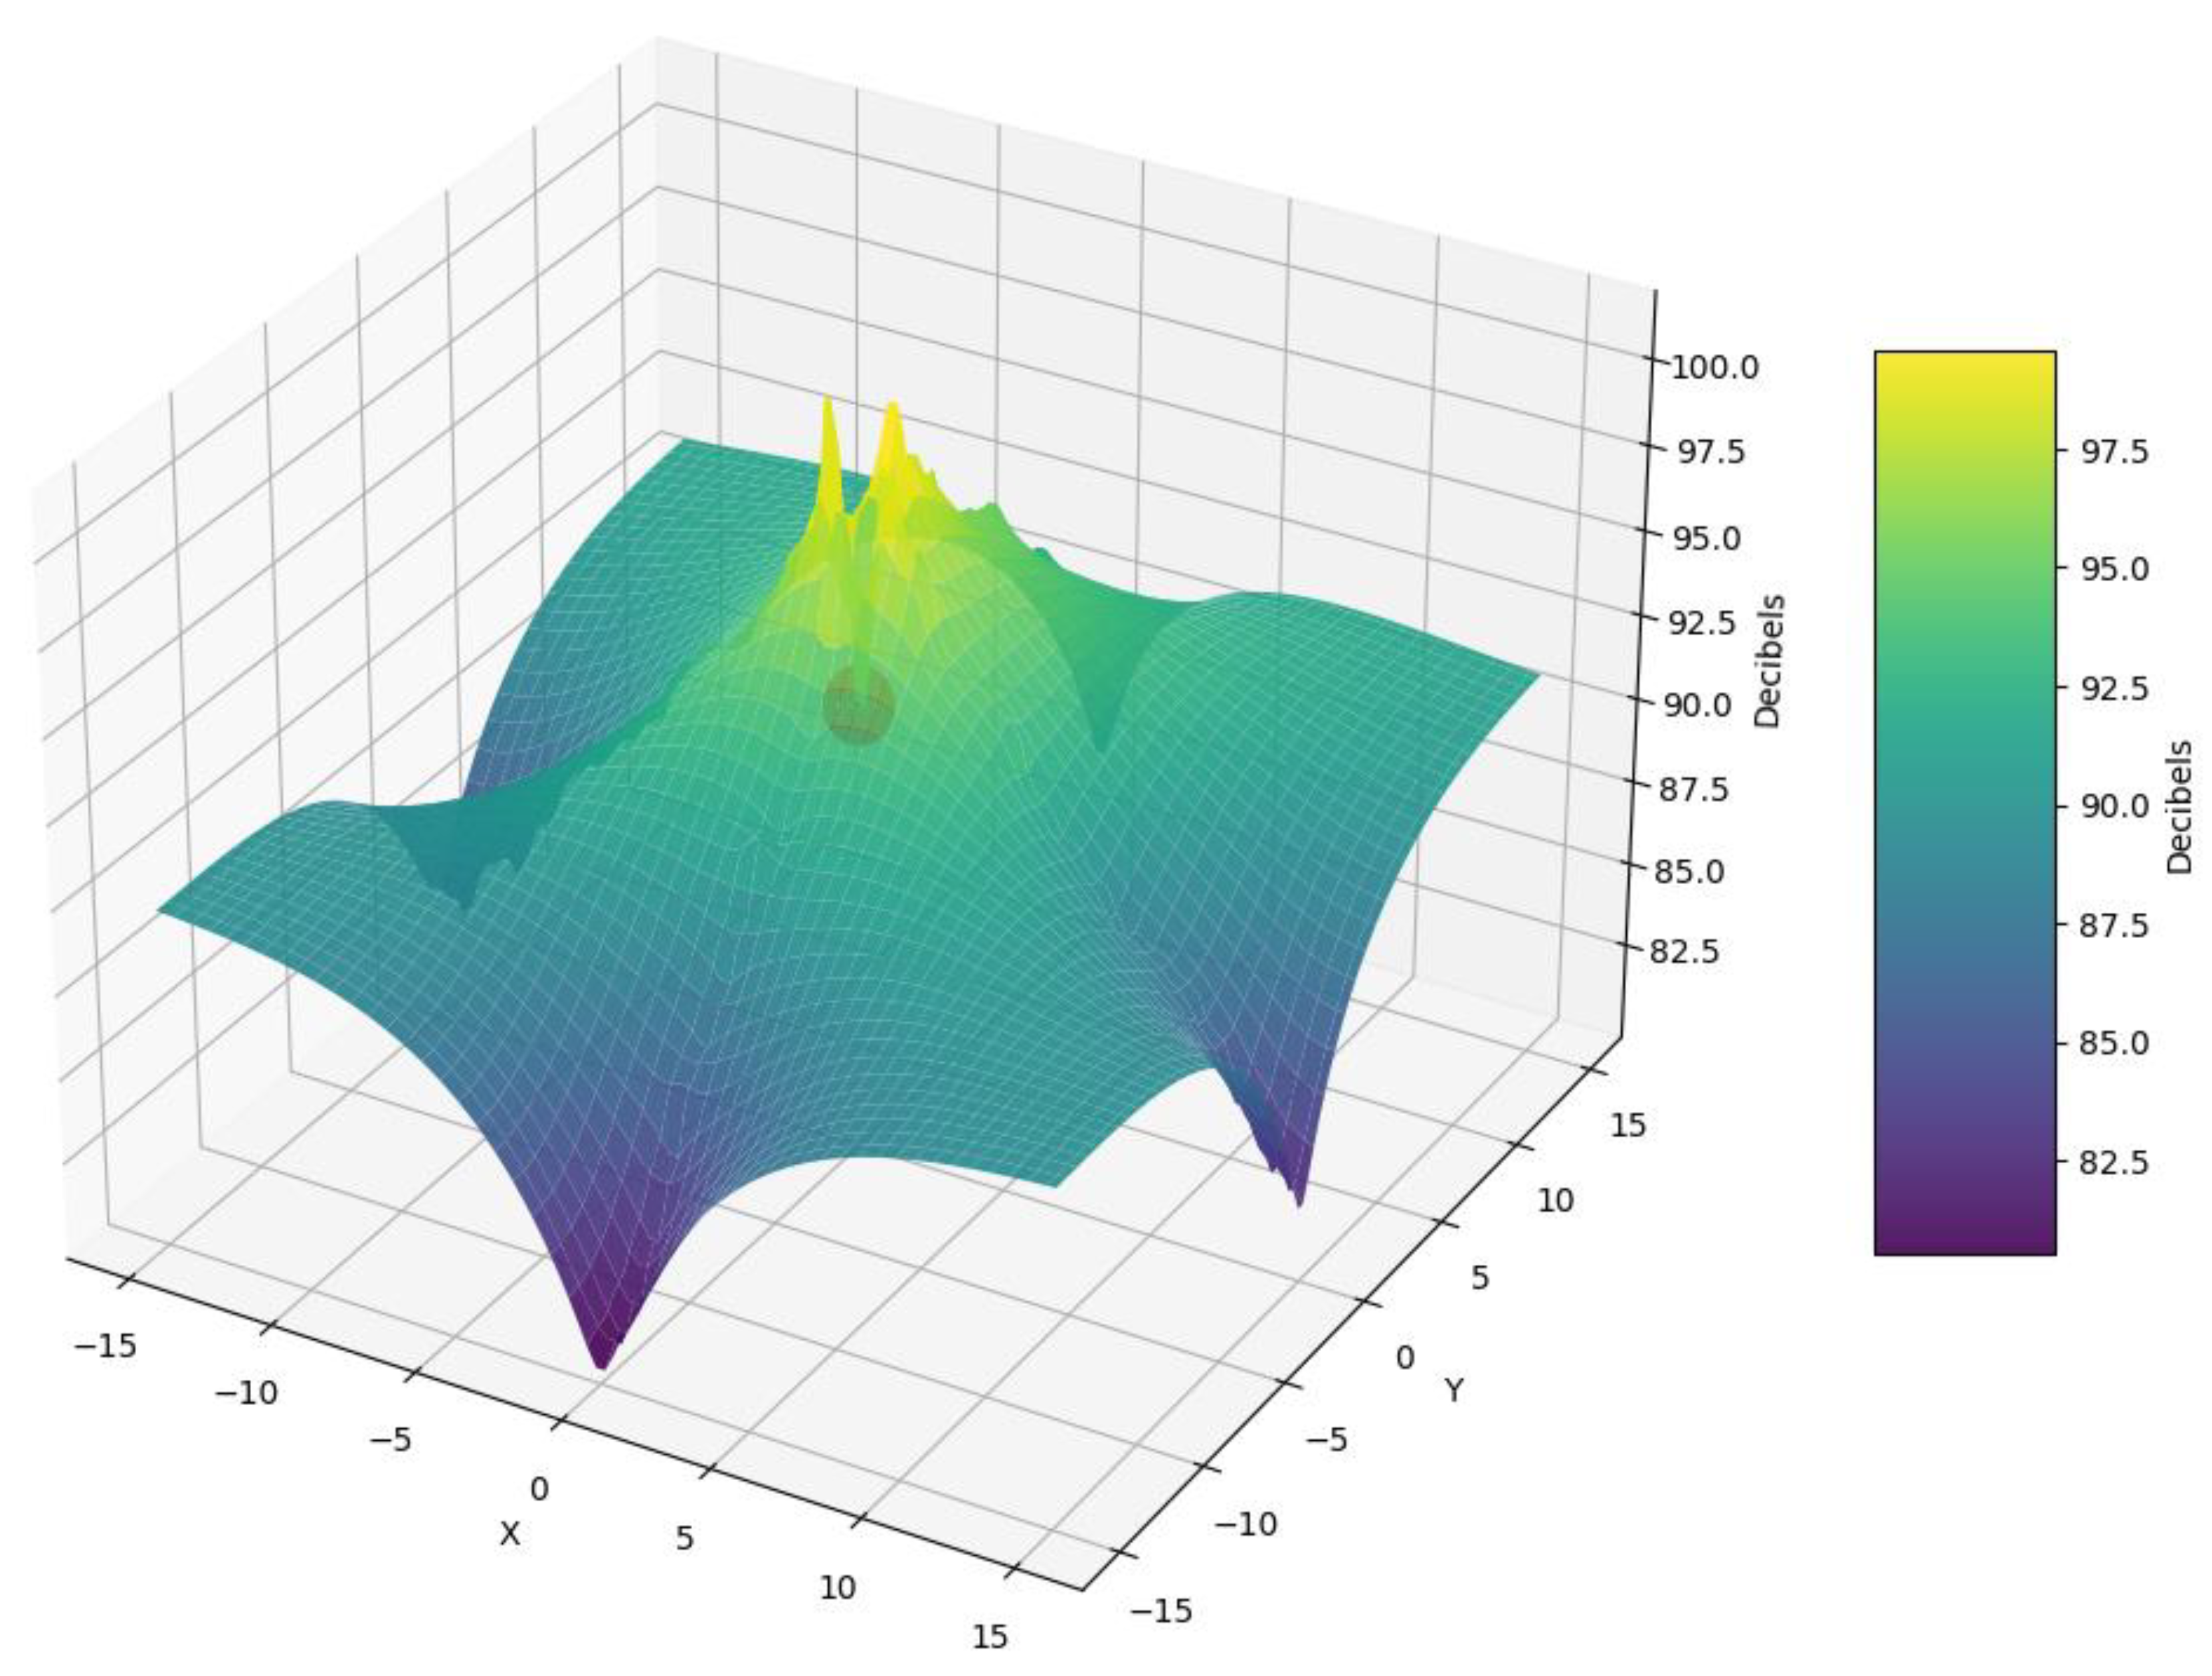
3.1. Spatial Noise Level Distribution Analysis

Noise levels for the three tractors working with PTO activated at 540, 750 and 1000 RPM were evaluated to find statistical differences (Figure 2). In non-cabin tractors T1 and T3 with PTO activated at 750 and 1000 RPM, the noise level exceeded 85 dB, and with 540 RPM, the noise level was over 90 dB, which increased the risk for operators. The sound pressure at the operator's cabin in T2, specifically at the operator's ear level, was lower when the three speeds of the PTO shaft were applied. However, the noise levels exceeded 85 dB when the PTO worked at 540 RPM, higher than the maximum limits specified by the standards for environmental quality for noise. [36]
The following graphs show the results obtained from noise measurements in tractors 1, 2 and 3, with PTO shaft activated at 540, 750, and 1000 RPM. Measurements started with the noise produced at the operator's compartment, close to the operator's ear.
The sound pressure > 90 dB produced by the PTO shaft at 540 RPM in T1 was significantly higher at the operator's ear in a region with a radius > 10 m (Fig. 2. A) and in the operation platform > 85 dB. At 750 RPM (Fig. 2.D), the sound pressure was < 85 dB 10 m far from the tractor and in the left, right, and front regions > 90 dB, including the operation platform. Finally, when the PTO was activated at 1000 RPM, the sound pressure exceeded 90 dB in the front, right, and left regions in radius of 10 m close to the tractor. Figure 3.G. [36]
For T3, a similar noise pressure level was measured as in T1, when the PTO was activated at 540 RPM (Fig. 2.C), at 750 RPM (Fig. 2.F), and at 1000 RPM (Fig. 2.I). The measurement exceeded 90 dB in the right, left, and front regions ~ 7 m far from the operator’s seat, reporting better performance in the noise mitigation in comparison to T1. However, high-level noise emission in the close region (5 m radius) in both cases showed an urgent necessity of improvement in insulation to mitigate the risk for operators and other workers with nearby activities. [37]
T2 demonstrated a better performance in noise mitigation for the environment when using a cabin with PTO activated at 540 RPM in a region of 5 m radius, at 750 RPM in a region of ~ 1 m radius from the tractor center, and at 1000 RPM in a region of ~2 m radius from the tractor center. In all these cases, the sound level was > 90 dB, also inside the cabin.
The increase in noise levels near the operator's ear when the tractor's lower speeds were applied was contrary to the results [15,38] because accessories and machinery handled by the PTO shaft differ from trailing accessories. In the case of large plows and subsoilers, which require fewer traction forces to operate, the noise is caused by the actions of rotation and vibration of internal parts of the machine power transmission [13,14].
Complementary recommendations about hearing protection mention that the minimum distance from the noise source to avoid using this protection is 4 m [30]. Additionally, it is necessary to consider the background noise, which should increase the total noise measured during the test [39]. However, a deeper analysis should be conducted to confirm their interaction.
The 3D plot shows spatial variations in the intensity of decibel levels with a PTO at 1000 RPM and higher peaks indicating areas of louder noise from 82.5 to 100 dB. A transparent sphere with 70% opacity was overlaid, centered to highlight a specific region of interest around the operator. The plot provides a clear visual representation of noise distribution, where the noise level exceeds 85 dB recommended by regulators. Also, it was confirmed the spatial noise distribution from 0 up to 15 m, in reference to the intensity with exponential trend forming an inverted bell involving the centered operator location at 540, 750 and 1000 RPM, where levels of non-cab tractor were over 100 dB and in cab tractor over 85 dB, Figure 3.

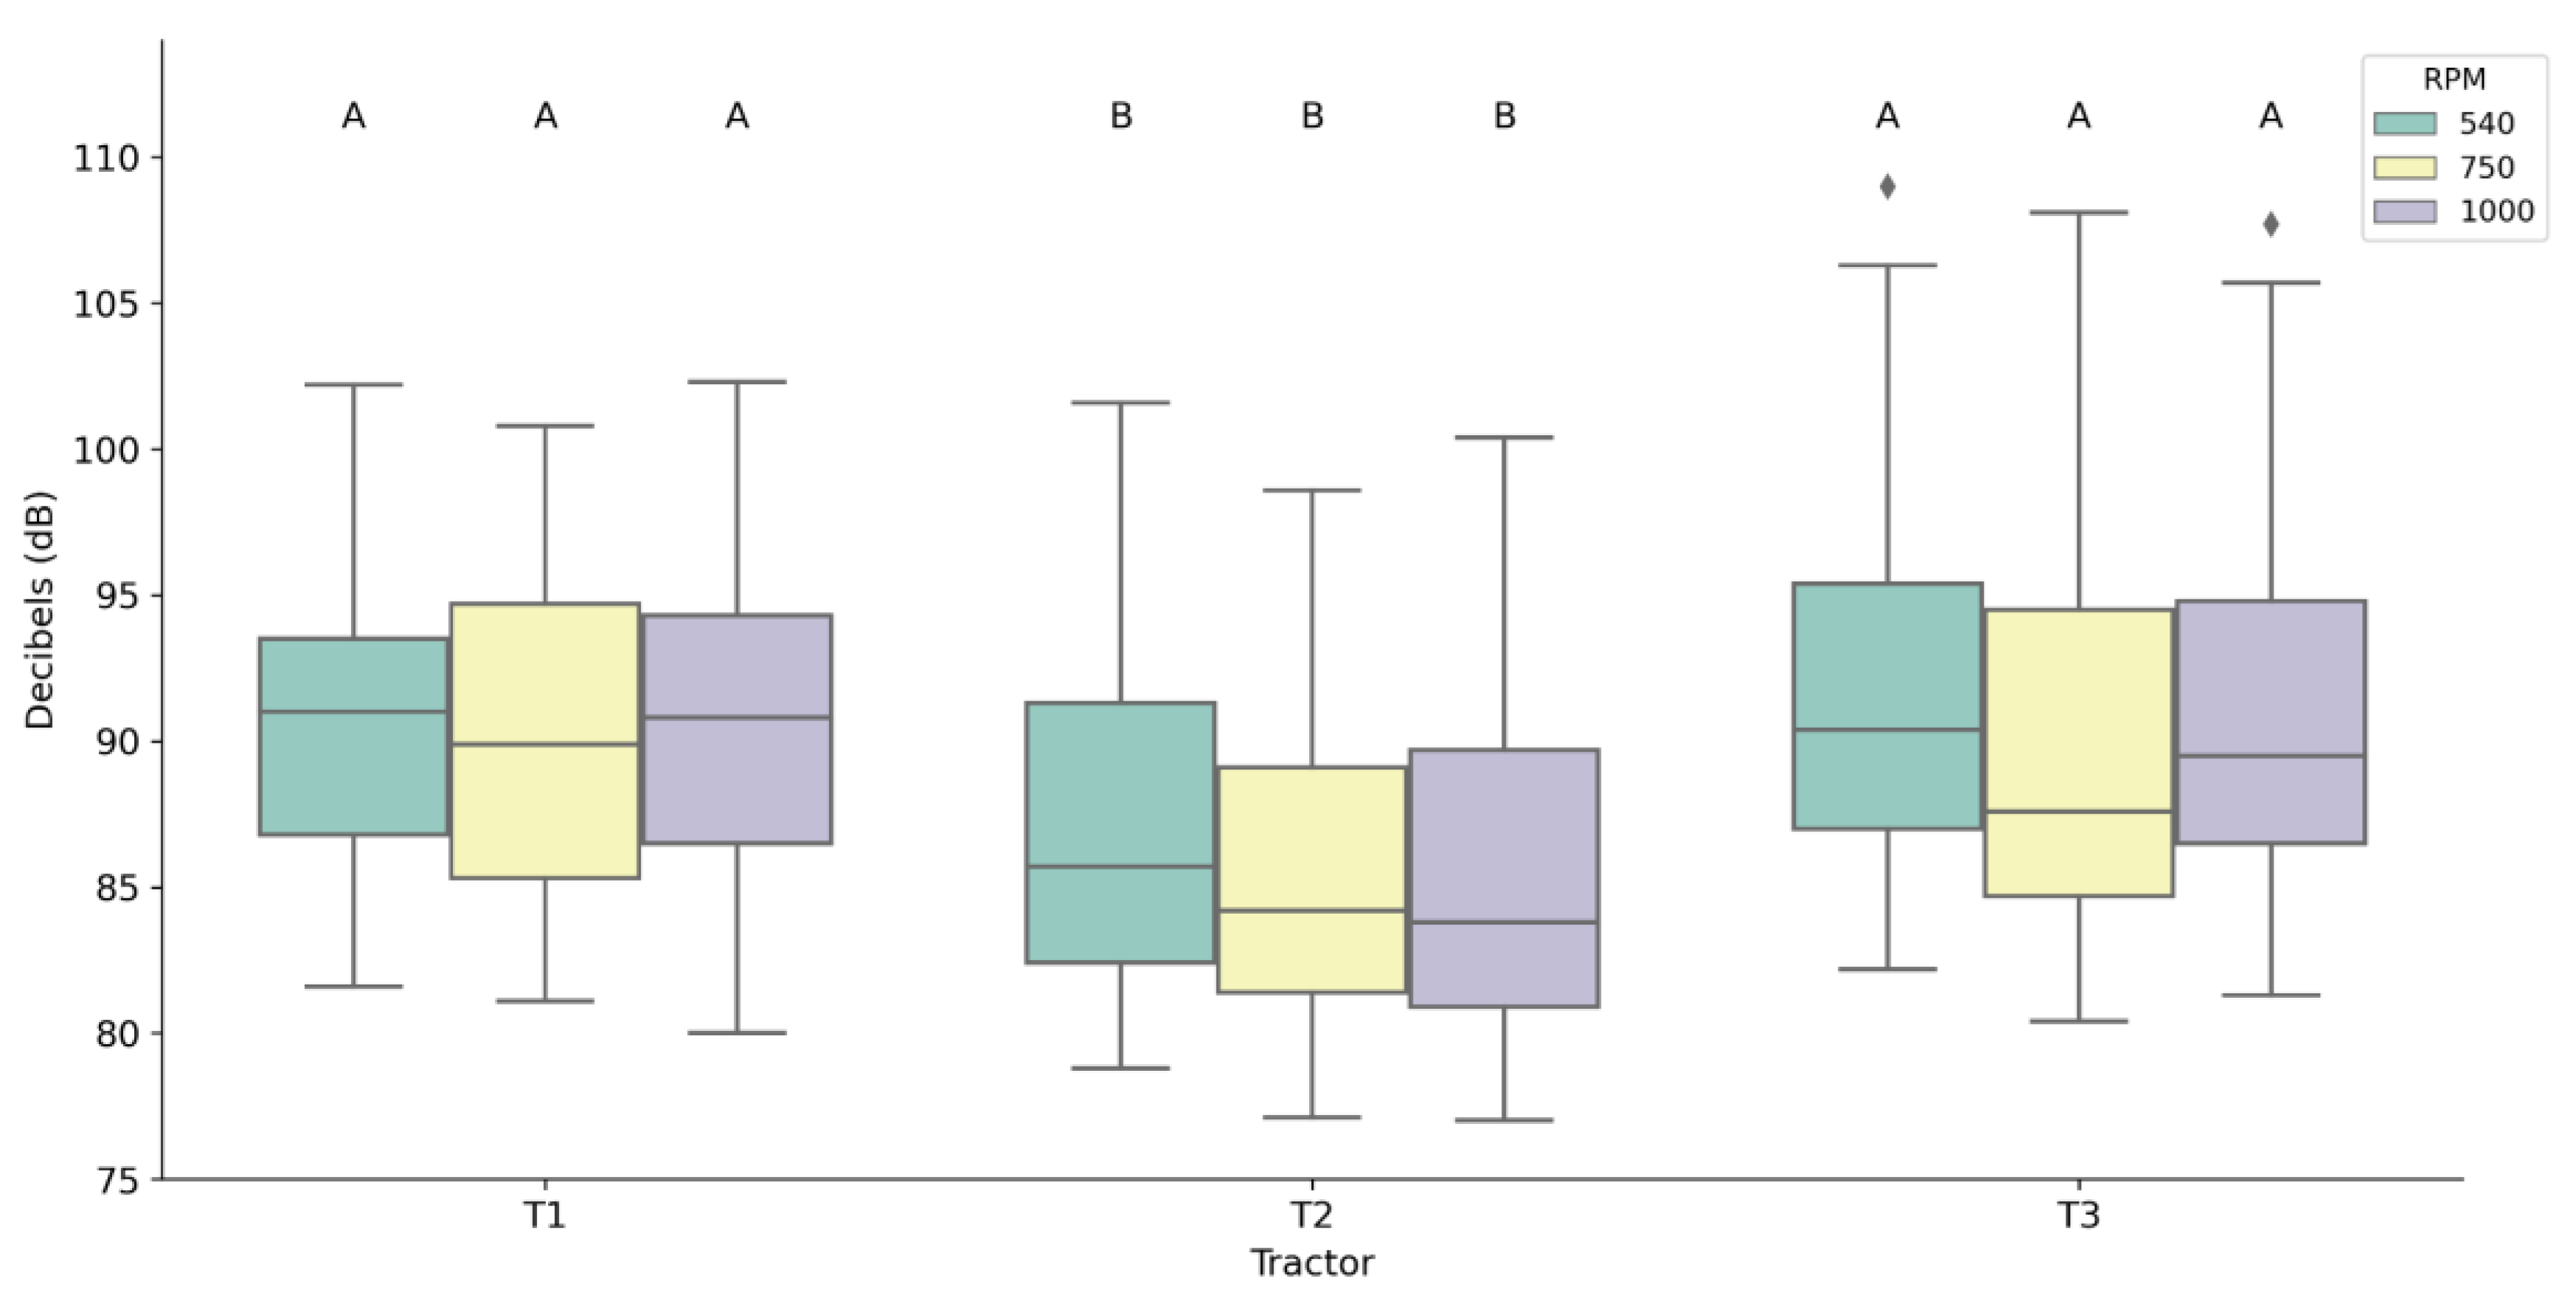
3.2. Statistical Analysis

The Kruskal-Wallis test indicated significant overall differences (H = 76.28, p < 2.74e-13), and Dunn's post-hoc test showed that tractors with cabins (T2) exhibited significantly higher noise levels compared to those without cabins (T1 and T3). Meanwhile, the noise levels among RPM groups (540, 750, and 1000) were statistically similar. These results highlight the varying noise exposure levels based on the presence of a cabin in the tractors, overshadowing the influence of RPM, Figure 4.[40]
Statistically, the expansion of the sound generated by the tractors followed the same pattern up to a distance of 15 meters, as shown by the isolines and 3D plots. However, differences were found and were significant when the tractors worked at 540 RPM. On the other hand, no statistically significant difference was found between tractors when they operated at 1000 RPM, where noise levels exceeded 85 dB.

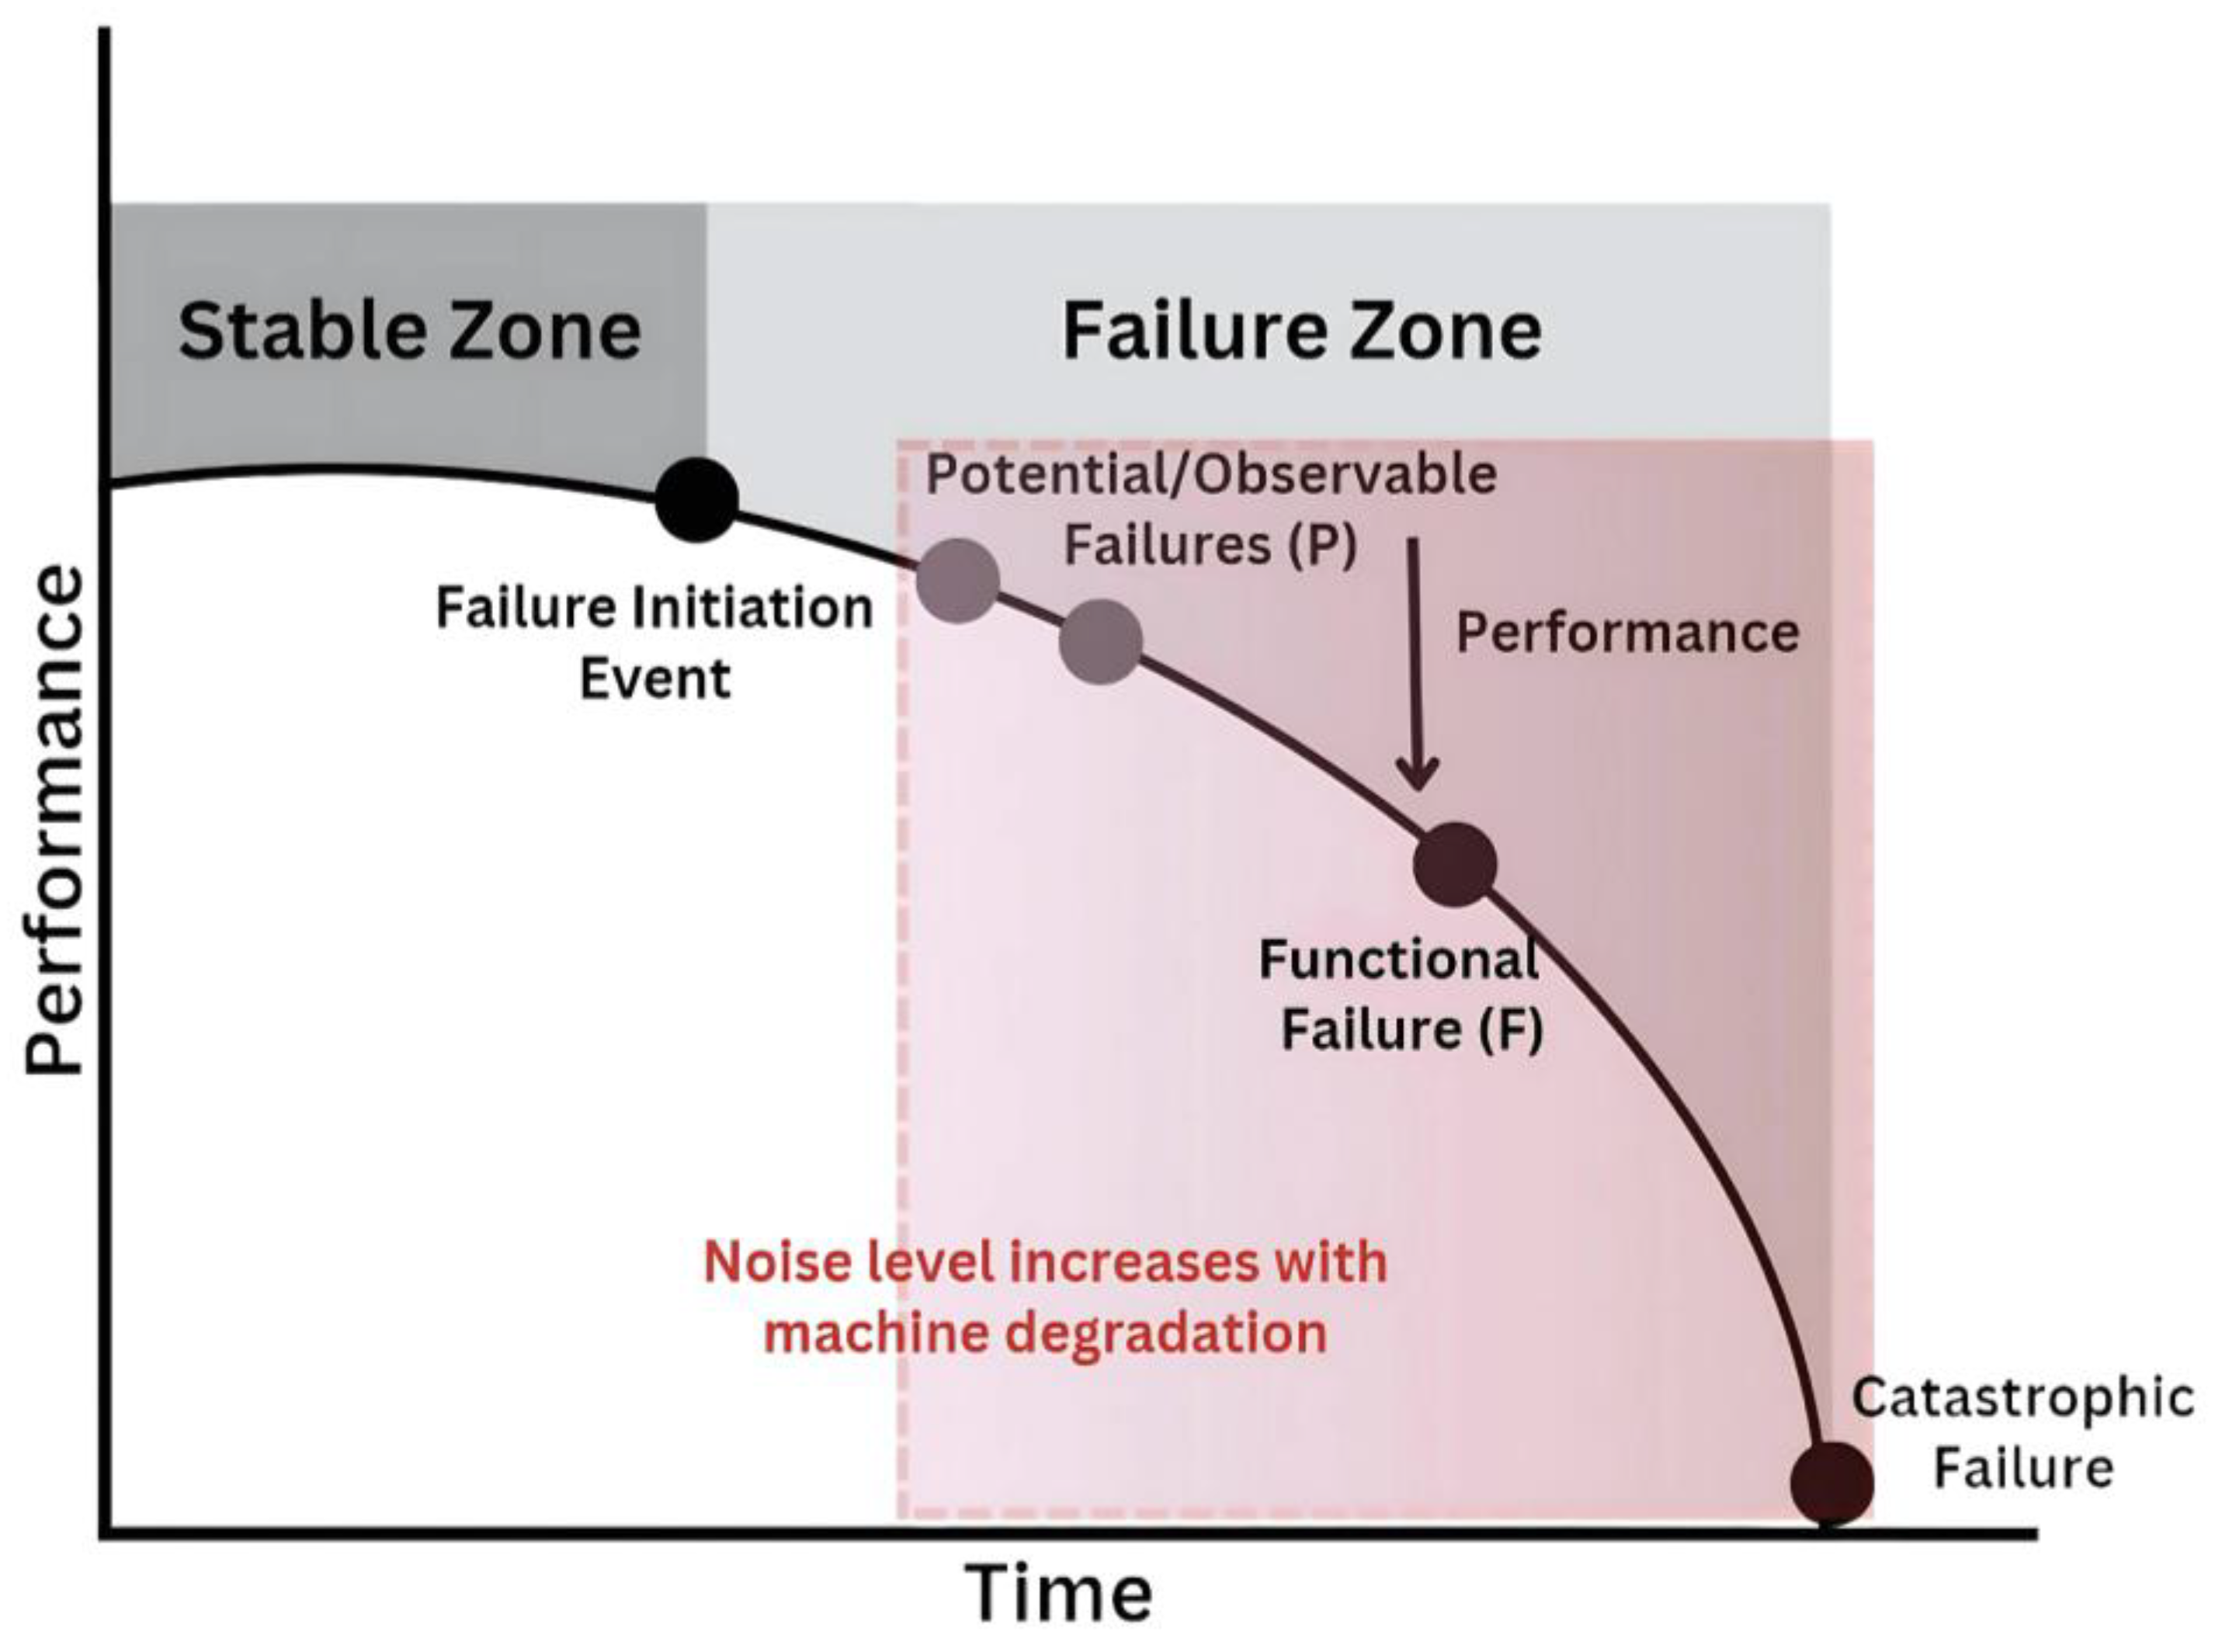
3.3. Use of Random Forest Model as a Tool to Detect Potential Failures

The RF model demonstrated the strongest predictive performance in both training and testing, followed by SVR, PR and LR (Table 2, Figure 5). In the training phase, the RF model explained 94% of the variance (RMSE = 1.56), while during the testing phase the RF model explained 89% of the variance (RMSE = 2.06). This highlights the advantages of non-linear models like RF and SVR, which are better suited to capture the complex, non-linear relationships associated with spatial noise influenced by RPM and cabin conditions. This non-linear relationship is evident in Figure 5, where LR and Polynomial Regression PR failed to capture the complexity of the data, showing broader scatter around the red dashed line (1:1). The SVR model, which used a radial basis function kernel, improved performance. However, RF achieved the best results, aligning predictions with observed values and effectively modeling the non-linear dependencies of spatial noise influenced by RPM and cabin conditions.
The 3D and 2D plots (Figure 2 and Figure 3) presented high variability in decibel levels influenced by RPM and tractor cabins, which the trained RF model effectively captured. Thus, the trained RF model could be used to predict noise levels at specific distances and generate acoustic maps for identifying high-noise zones in agricultural environments for tractors similar to those tested.
This model could serve as a valuable decision-support tool for predicting potential tractor failures by analyzing noise patterns and identifying deviations from normal operating conditions. Abnormal noise levels can indicate issues such as engine malfunctions, gearbox failures, exhaust system damage, loose or worn belts, or hydraulic system leaks. Addressing these issues proactively not only reduces downtime and repair costs but also minimizes health risks for workers. Prolonged exposure to elevated noise levels can lead to hearing loss, stress, fatigue, and other health complications. Additionally, early detection of mechanical issues helps preventing potential mechanical problems or increased emissions, contributing to safer and more sustainable agricultural practices.
Some practical uses of this model approach for agriculture tractors are the fleet monitoring by locating a decibel meter at a distance of 15 m, and this initial reading, given the trend of noise level distribution, can predict the noise level in the tractor platform or cabin. Frequent monitoring could help to detect variations in these readings that could be related to potential mechanical failures and mechanical degradation. Also, it can contribute to users standardizing health policies with the use of ear covers according to the distance of tractor operation.

Conclusions

The noise analysis showed that tractors with cabins generally reduced noise levels compared to non-cabin tractors, yet still often exceeded the 85 dB threshold at higher RPMs, while non-cabin tractors frequently surpassed 100 dB. These results emphasize the importance of protective measures and effective noise management to safeguard operator health, particularly during prolonged exposure. The Random Forest model proved more effective than simpler linear models in capturing the variability in noise levels influenced by RPM and tractor design, demonstrating its value as a tool for analyzing complex noise patterns and supporting strategies to mitigate health risks and improve working conditions.
The trained Random Forest model demonstrates significant potential as a decision-support tool for managing tractor performance and mitigating associated risks. By effectively capturing the variability in noise levels influenced by RPM and tractor cabins, the model can predict noise levels at specific distances and identify abnormal patterns indicative of mechanical issues. Proactively addressing these issues not only reduces repair costs and operational downtime but also safeguards worker health by mitigating the risks of prolonged exposure to harmful noise levels. Additionally, the model’s ability to reduce the sampling effort required for assessing noise impacts highlights its practicality. Early detection of failures also minimizes environmental impacts, contributing to more sustainable and efficient agricultural practices. With further data collection, the model’s applicability could be expanded to include a wider range of tractors and operational settings, enhancing its value in diverse agricultural contexts.

Supplemental Material

Group 1 Group 2 Mean Diff p-adj Reject
T1_540 T1_750 0.47213 1.0000 FALSE
T1_540 T1_1000 -0.03770 1.0000 FALSE
T1_540 T2_540 3.62459 0.0000 TRUE
T1_540 T2_750 5.24426 0.0191 TRUE
T1_540 T2_1000 5.16721 0.0000 TRUE
T1_540 T3_540 -1.02623 1.0000 FALSE
T1_540 T3_750 1.08525 1.0000 FALSE
T1_540 T3_1000 -0.39508 1.0000 FALSE
T1_750 T1_1000 -0.50984 1.0000 FALSE
T1_750 T2_540 3.15246 0.0000 TRUE
T1_750 T2_750 4.77213 0.0178 TRUE
T1_750 T2_1000 4.69508 0.0000 TRUE
T1_750 T3_540 -1.49836 1.0000 FALSE
T1_750 T3_750 0.61311 1.0000 FALSE
T1_750 T3_1000 -0.86721 1.0000 FALSE
T1_1000 T2_540 3.66230 0.0004 TRUE
T1_1000 T2_750 5.28197 0.0991 FALSE
T1_1000 T2_1000 5.20492 0.0004 TRUE
T1_1000 T3_540 -0.98852 1.0000 FALSE
T1_1000 T3_750 1.12295 1.0000 FALSE
T1_1000 T3_1000 -0.35738 1.0000 FALSE
T2_540 T2_750 1.61967 1.0000 FALSE
T2_540 T2_1000 1.54262 1.0000 FALSE
T2_540 T3_540 -4.65082 0.0000 TRUE
T2_540 T3_750 -2.53934 0.0000 TRUE
T2_540 T3_1000 -4.01967 0.0174 TRUE
T2_750 T2_1000 -0.07705 1.0000 FALSE
T2_750 T3_540 -6.27049 0.0165 TRUE
T2_750 T3_750 -4.15902 0.0028 TRUE
T2_750 T3_1000 -5.63934 1.0000 FALSE
T2_1000 T3_540 -6.19344 0.0000 TRUE
T2_1000 T3_750 -4.08197 0.0000 TRUE
T2_1000 T3_1000 -5.56230 0.0166 TRUE
T3_540 T3_750 2.11148 1.0000 FALSE
T3_540 T3_1000 0.63115 1.0000 FALSE
T3_750 T3_1000 -1.48033 1.0000 FALSE

References

  1. K. J. Stoss, J. K. J. Stoss, J. Deere, J. Deere European, J. Sobotzik, and E. R. Kreis, “Tractor Power for Implement Operation-Mechanical, Hydraulic, and Electrical: An Overview Bin Shi”, Accessed: May 01, 2024. [Online]. Available: www.asabe.org.
  2. and D., S. Pérez, Diego, “Mantenimiento básico de máquinas e instalaciones en la industria alimentaria,” Málaga, España: IC Editorial. Accessed: Sep. 12, 2022. [Online]. Available: https://scholar.google.com/scholar?hl=en&as_sdt=0%2C34&inst=7103165812348674092&q=Mantenimiento+Básico+de+Máquinas+en+instalaciones+en+la+Industria+alimentaria&btnG=.
  3. C. Guillén Subirán, “Consideraciones sobre la salud laboral de los trabajadores en el sector agropecuario,” Gestión práctica de riesgos laborales: Integración y desarrollo de la gestión de la prevención, ISSN 1698-6881, No. 179, 2020, págs. 35-43, no. 179, pp. 35–43, 2020, Accessed: Sep. 12, 2022. [Online]. Available: https://dialnet.unirioja.es/servlet/articulo?codigo=7291147&info=resumen&idioma=SPA.
  4. Vallone, M.; Bono, F.; Quendler, E.; Febo, P.; Catania, P. Risk exposure to vibration and noise in the use of agricultural track-laying tractors. Ann. Agric. Environ. Med. 2016, 23, 591–597. [Google Scholar] [CrossRef]
  5. Rowley, D.W. Control of Farm Tractor Intake and Exhaust Noise. 50th Anniversary SAE Tractor Meeting (1966). LOCATION OF CONFERENCE, COUNTRYDATE OF CONFERENCE;
  6. Jahanbakhshi, A.; Yousefi, M.; Karami-Boozhani, S.; Heidarbeigi, K.; Abbaspour-Gilandeh, Y. The effect of combined resistance muffler on noise pollution and the allowable driver exposure in Massey-Ferguson tractors (MF 285 and MF 299). J. Saudi Soc. Agric. Sci. 2020, 19, 409–414. [Google Scholar] [CrossRef]
  7. Talamo, J. Effects of cab noise environment on the hearing perception of agricultural tractor drivers. Appl. Acoust. 1979, 12, 125–137. [Google Scholar] [CrossRef]
  8. Wang, Z.; Zuo, Y.; Sun, L.; Zhao, X. Noise Reduction in Tractor Cabs Using Coupled Resonance Acoustic Materials. IEEE Access 2022, 10, 32689–32695. [Google Scholar] [CrossRef]
  9. Bilski, B. Exposure to audible and infrasonic noise by modern agricultural tractors operators. Appl. Ergon. 2013, 44, 210–214. [Google Scholar] [CrossRef]
  10. DOS Santos, L.M.; Ferraz, G.A.; Batista, M.L.; Martins, F.B.; Barbosa, B.D. Characterization of noise emitted by a low-profile tractor and its influence on the health of rural workers. An. da Acad. Bras. de Cienc. 2020, 92, e20200460. [Google Scholar] [CrossRef] [PubMed]
  11. Aybek, H. Kamer, S. A.-A. Ergonomics, and undefined 2010, “Personal noise exposures of operators of agricultural tractors,” Elsevier, Accessed: Sep. 12, 2022. [Online]. Available: https://www.sciencedirect.com/science/article/pii/S0003687009001021?casa_token=3HWqzGyIzwcAAAAA:oK_yX1EHs1jhotUPx8wvAHb5QXxQPTEkcqvdN_4qHhLGoPIfwyEHQsa2ep2ci1GPlcsMIGqtAg.
  12. Suggs, B.K.H.A.C.W. Tractor Noise and Operator Performance. Trans. ASAE 1968, 11, 0001–0005. [Google Scholar] [CrossRef]
  13. and, M. Cecchini. Zoppello, G., D. Monarca, “Aziende agricole, il rischio da rumore ed il - Google Scholar.” Accessed: Sep. 12, 2022. [Online]. Available: https://scholar.google.com/scholar?hl=en&as_sdt=0%2C34&inst=7103165812348674092&q=Aziende+agricole%2C+il+rischio+da+rumore+ed+il&btnG=.
  14. Souza, L.H.; Vieira, L.B.; Fernandes, H.C.; Lima, J.S.S. Níveis de ruído emitidos por uma recolhedora-trilhadora de feijão. Eng. Agricola 2004, 24, 745–749. [Google Scholar] [CrossRef]
  15. E. L. da Vitória, “Avaliação do nível de ruído emitido por tratores em diferentes operações agrícolas,” Universidade Federal de Viçosa. Accessed: Sep. 12, 2022. [Online]. Available: https://scholar.google.com/scholar?hl=en&as_sdt=0%2C34&inst=7103165812348674092&q=Avaliação+do+nível+de+ruído+emitido+por+tratores+em+diferentes+operações+agrícolas&btnG=.
  16. B. J. Ahlstrom, J. B. J. Ahlstrom, J. Zilles, and M. L. Pate, “Innovations in Engine Design and Cab Structures of Agricultural Equipment Considerations for Noise Exposure Written for presentation at the 2022 ASABE Annual International Meeting Sponsored by ASABE,” pp. 1–3, 2022.
  17. Cecchini, M.; Piccioni, F.; Ferri, S.; Coltrinari, G.; Bianchini, L.; Colantoni, A. Preliminary Investigation on Systems for the Preventive Diagnosis of Faults on Agricultural Operating Machines. Sensors 2021, 21, 1547. [Google Scholar] [CrossRef]
  18. da Silva, C.A.G.; de Sá, J.L.R.; Menegatti, R. Diagnostic of Failure in Transmission System of Agriculture Tractors Using Predictive Maintenance Based Software. Agriengineering 2019, 1, 132–144. [Google Scholar] [CrossRef]
  19. Saha, P.; Monir, M.U.; Sarkar, S.M.; Aziz, A.A.
  20. Di, G.; Yao, Y.; Chen, C.; Lin, Q.; Li, Z. An experiment study on the identification of noise sensitive individuals and the influence of noise sensitivity on perceived annoyance. Appl. Acoust. 2022, 185. [Google Scholar] [CrossRef]
  21. M. del A. MINAM, “ds.085.2003.pcm_ ECA RUIDO,” mediante Decreto Supremo N° 085-2003-PCM, pp. 1–11, 2003, [Online]. Available: https://sinia.minam.gob.
  22. Congreso de la República del Perú, “Ley De Seguridad N°29783 Y Reglamento De Seguridad DS N° 005-2012-TR,” El peruano, vol. 1, pp. 5–20, 2011, [Online]. Available: https://www.diariooficial.elperuano.pe/pdf/0052/ley-seguridad-salud-en-el-trabajo.
  23. Heras-Saizarbitoria, I.; Boiral, O.; Arana, G.; Allur, E. OHSAS 18001 certification and work accidents: Shedding light on the connection. J. Saf. Res. 2018, 68, 33–40. [Google Scholar] [CrossRef] [PubMed]
  24. S. Code, F. O. R. S. Code, F. O. R. The, O. Measurement, O. N. Agricultural, and F. Tractors, “Code 5 Oecd Standard Code for the Official Measurement of Noise At the Driving Position ( S ),” no. July, pp. 1–17, 2007.
  25. Franklin, R.C.; Depczynski, J.; Challinor, K.; Williams, W.; Fragar, L.J. Factors Affecting Farm Noise During Common Agricultural Activities. J. Agric. Saf. Heal. 2006, 12, 117–125. [Google Scholar] [CrossRef] [PubMed]
  26. Yadav, P.S.; Gaikwad, A.A.; Badgujar, S.Y.; Surkutwar, Y.V.; Karanth, N.V. Noise Reduction on Agricultural Tractor. Symposium on International Automotive Technology 2013. LOCATION OF CONFERENCE, COUNTRYDATE OF CONFERENCE;
  27. Mccolly, H.F.; Martin, J.W. Introduction to Agricultural Engineering. Soil Sci. 1956, 81, 153. [Google Scholar] [CrossRef]
  28. Magalhães, A.T.; Cortez, J.W.; Nagahama, H.D.J. NÍVEL DE RUÍDO DE UM TRATOR AGRÍCOLA EM FUNÇÃO DA ROTAÇÃO, DA DISTÂNCIA, DA VELOCIDADE E DA CONDIÇÃO DO SOLO OBTIDO POR MEIO DE DECIBELÍMETRO COM E SEM PROTEÇÃO DE VENTO. Ènerg. NA Agric. 2012, 27, 27–44. [Google Scholar] [CrossRef]
  29. Moraes, S.R.; Dias, V.d.O.; Cornélio, J.P.L.; Hitz, M.E. Noise in agricultural machinery: Modernization and workers' health; Seven Events: Sao Jose dos Pinhais, Parana, Brazil, 2023. [Google Scholar]
  30. Barač, Ž.; Plaščak, I.; Jurišić, M.; Tadić, V.; Zimmer, D.; Duvnjak, V. Noise in the Cabin of Agricultural Tractors. Teh. Vjesn. - Tech. Gaz. 2018, 25, 1611–1615. [Google Scholar] [CrossRef]
  31. D. Shepard, “A two-dimensional interpolation for irregularly-spaced data function”.
  32. Harris, C.R.; Millman, K.J.; van der Walt, S.J.; Gommers, R.; Virtanen, P.; Cournapeau, D.; Wieser, E.; Taylor, J.; Berg, S.; Smith, N.J.; et al. Array programming with NumPy. Nature 2020, 585, 357–362. [Google Scholar] [CrossRef]
  33. Hunter, J.D. Matplotlib: A 2D graphics environment. Comput. Sci. Eng. 2007, 9, 90–95. [Google Scholar] [CrossRef]
  34. McKinney, W. Data structures for statistical computing in python. In Proceedings of the 9th Python in Science Conference, Austin, TX, USA, 28 June–3 July 2010; Volume 445, pp. 51–56. [Google Scholar]
  35. Virtanen, P.; Gommers, R.; Oliphant, T.E.; Haberland, M.; Reddy, T.; Cournapeau, D.; Burovski, E.; Peterson, P.; Weckesser, W.; Bright, J.; et al. SciPy 1. 0 Contributors. SciPy 1.0 Fundamental Algorithms for Scientific Computing in Python. Nat. Methods 2020, 17, 261–272. [Google Scholar]
  36. De Souza, C.M.A.; Junior, G.M.; Da Silva, R.R.; Rafull, L.Z.L.; Orlando, R.C.; Ale, L.P. Occupational noise level exposures outside and inside agricultural tractor cabs. 2023; 21. [Google Scholar] [CrossRef]
  37. Q. Canada, “Evaluation the vibration and noise level emitted by a tractor Written for presentation at the 2014 ASABE and CSBE/SCGAB Annual International Meeting Sponsored by ASABE”.
  38. Avaliação dos níveis de ruído em tratores agrícolas e seus efeitos sobre o operador,” Aleph, Dec. 1991, Accessed: Sep. 12, 2022. [Online]. Available: http://repositorioslatinoamericanos.uchile.cl/handle/2250/2579014.
  39. Y. J. Park and K. U. Kim, “Reduction of rattle noise of a direct engine-pto driveline of agricultural tractors: part iii. reduction of pto rattle noise by a torsional damper,” Trans ASABE, vol. 52, no. 2, pp. 369–374.
  40. Camargo, D.A.; Munis, R.A.; Miyajima, R.H.; Lima, R.C.A.; Simões, D. An evaluation of machine operator exposure to occupational noise during harvesting and extraction operations in Brazilian eucalyptus plantations. Int. J. For. Eng. 2022, 34, 35–41. [Google Scholar] [CrossRef]
  41. Waleed, M.; Um, T.-W.; Kamal, T.; Usman, S.M. Classification of Agriculture Farm Machinery Using Machine Learning and Internet of Things. Symmetry 2021, 13, 403. [Google Scholar] [CrossRef]
  42. Hosseinpour-Zarnaq, M.; Omid, M.; Biabani-Aghdam, E. Fault diagnosis of tractor auxiliary gearbox using vibration analysis and random forest classifier. Inf. Process. Agric. 2021, in press. [CrossRef]
Figure 1. Reliability condition monitoring, P-F curve. Noise level increases with the mechanical degradation of tractors, audibly detected in the P-F region up to catastrophic failure.
Preprints 150794 g001
Figure 2. Sound pressure at the operator’s seat in T1 at A) 540 RPM, D) 750 RPM, G) 1000 RPM. In T2 at B) 540 RPM, E) 750 RPM, H) 1000 RPM, and in T3 at C) 540 RPM, F) 750 RPM, and I) 1000 RPM.
Preprints 150794 g002
Figure 3. 3D plot of sound pressure at the operator’s seat in T1 at 1000 RPM. The sphere in gray represents the location of the operator’s seat and the noise level of 91.2 dB.
Preprints 150794 g003
Figure 4. Boxplots showing noise levels (decibels) for tractors (T1, T2, T3) across RPM settings (540, 750, 1000). Each boxplot represents the distribution of noise levels, with letters indicating significant differences based on Dunn post-hoc test.
Preprints 150794 g004
Figure 5. Actual vs predicted plot results for: A) Linear Regression, B) Polynomial Regression, C) Support Vector Regression, and D) Random Forest Regressor Model.
Preprints 150794 g005
Table 1. Fleet of tractors selected for the evaluation.
Tractor Cabin Traction Power (kW) Nominal RPM Hour Meter
T1 No Single traction 65.4 2500 430
T2 Yes Power-assisted traction 73 2300 30
T3 No Assisted traction 59.65 2300 50
Table 2. Summary of model training and testing performance.
Training Testing
Model RMSE R2 RMSE R2
LR 5.71 (± 0.032) 0.19 (± 0.008) 5.77 (± 0.135) 0.17 (± 0.031)
PR 3.03 (± 0.028) 0.77 (± 0.005) 3.09 (± 0.107) 0.76 (± 0.016)
RF 1.56 (± 0.172) 0.94 (± 0.013) 2.06 (± 0.281) 0.89 (± 0.030)
SVR 2.18 (± 0.225) 0.88 (± 0.025) 2.28 (± 0.297) 0.87 (± 0.035)
Disclaimer/Publisher’s Note: The statements, opinions and data contained in all publications are solely those of the individual author(s) and contributor(s) and not of MDPI and/or the editor(s). MDPI and/or the editor(s) disclaim responsibility for any injury to people or property resulting from any ideas, methods, instructions or products referred to in the content.
Copyright: This open access article is published under a Creative Commons CC BY 4.0 license, which permit the free download, distribution, and reuse, provided that the author and preprint are cited in any reuse.
Prerpints.org logo

Preprints.org is a free preprint server supported by MDPI in Basel, Switzerland.

Subscribe

Disclaimer

Terms of Use

Privacy Policy

Privacy Settings

© 2025 MDPI (Basel, Switzerland) unless otherwise stated