
Submitted:
27 February 2025
Posted:
28 February 2025
You are already at the latest version
Abstract
Background/Objectives: Patients with glaucoma often exhibit cognitive dysfunction. Identifying imaging markers of glaucoma-related cognitive dysfunction can guide early clinical interventions.
Method: This study included 44 primary angle-closure glaucoma patients (PACG) with cognitive dysfunction, and 46 healthy controls (HCs). Participants underwent 3D high-resolution T1 structural imaging and BOLD fMRI scanning. Seven hippocampus subregions were selected as seed regions to explore changes in functional connectivity (FC) between the bilateral hippocampal subregions and the whole brain in PACG patients with cognitive dysfunction.
Results: Compared with the HCs group, the PACG group showed decreased FC between multiple hippocampus subregions and the cerebellum, precentral gyrus, postcentral gyrus, supplementary motor area, supramarginal gyrus, inferior frontal gyrus, opercular part, lenticular nucleus, pallidum, rolandic operculum, and inferior parietal, supramarginal, and angular gyri. However, increased FC was found between the bilateral hippocampal subregions and the calcarine fissure and the surrounding cortex, lingual gyrus, anterior cingulate, and paracingulate gyri. We also found that FC between the hippocampal subregion and some brain regions was associated with visual acuity, average cup-to-disc ratio, and retinal nerve fibre layer thickness. Conclusion: Extensive FC abnormalities between the hippocampal subregion and cerebellum, sensorimotor network, default mode network, visual network, and other brain areas were found in PACG patients with cognitive dysfunction, providing new insights into the neuropathological mechanisms and potential neuroimaging biomarkers for early diagnosis and intervention.
Keywords:
resting-state fMRI
; functional connectivity
; hippocampal subregions
; primary angle-closure glaucoma (PACG)
; cognitive dysfunction
1. Introduction
Glaucoma is a leading cause of irreversible blindness worldwide [1,2]. It is expected that 111.8 million people will develop glaucoma by 2040 with the ageing social population [3]. Glaucoma is characterised by the optic nerve damage and progressive loss of retinal ganglion cells (RGCs). Primary glaucoma is more common in clinical practice. Based on the opening and closing of the angle, glaucoma is divided into primary angle closure glaucoma (PACG) and primary open-angle glaucoma (POAG). PACG is mainly caused by a narrow or closed angle of the chamber, which prevents aqueous humour discharge and increases intraocular pressure (IOP). The intermittent or persistent elevation of IOP in patients with glaucoma exceeds the tolerance of the eyeball. It causes damage to various parts of the eyeball and visual function, resulting in the progressive loss of RGC cells, thinning of the retinal nerve fibre layer, atrophy of the optic nerve, narrowing of the visual field, and decreased vision. However, Gupta et al. found that glaucomatous damage was not limited to the optic nerve but also caused structural changes in the lateral geniculate body and visual cortex [4]. Subsequent studies have confirmed that glaucoma lesions are not only confined to the eyes but also cause structural and functional changes in the brain [5,6,7]. Many studies have also confirmed that glaucoma is similar to Parkinson’s and Alzheimer’s diseases, which are neurodegenerative diseases [8,9,10]. In the past, many studies have focused on POAG, which is the most prevalent in Western societies. However, the most common type in Asia and China is PACG. Compared with POAG, fewer retinal nerve fiber layer sectors have significant structure-function correlations in PACG [11], suggesting differences in the pathophysiology of optic nerve damage and even the whole visual pathway between PACG and POAG.
Recently, resting-state functional magnetic resonance imaging (rs-fMRI), which reflects the spontaneous brain activity in the resting state, has been widely used. Huang et al. applied the amplitude of low-frequency fluctuation (ALFF) of rs-fMRI [12], and Wang et al. applied the fractional ALFF (fALFF) analysis method [13], both revealing that glaucoma patients have abnormal spontaneous brain activity in multiple brain regions, including the visual cortex. Fu et al. found that patients with PACG showed abnormal regional homogeneity (ReHo) values in the cerebellum, visual cortex, and supplementary motor area [14], which may reflect the neural mechanism of visual loss. The voxel-based degree centrality (DC) analysis technique previously used by our group and Chen et al. revealed the central dysfunction of a wide range of brain functional networks in PACG patients [15,16]. Using voxel-mirrored homotopic connectivity (VMHC) analysis, our research group and Tong et al. found that PACG patients showed complex interhemispheric connectivity abnormalities [17,18]. In addition, our previous study used graph theory analysis to study the intrinsic functional brain network of PACG patients and found that PACG patients had significant changes in the local characteristics of the visual and cognitive-emotional brain regions [19]. Our previous studies have shown different spatial distributions in functional connectivity density mapping (FCD) in PACG patients [20]. Jiang et al. used Granger causality analysis to show that PACG patients have abnormal effective connectivity between many brain regions [21]. In addition, our previous application of the functional connectivity (FC) method found that PACG patients had decreased integration of visual information in the primary-advanced visual cortex pathway [22]. We also found a wide range of abnormal resting-state FC between the thalamus, amygdala, and visual and extra-visual brain regions in PACG patients [23,24].
Many studies have shown that glaucoma patients have neurocognitive dysfunction and an increased risk of dementia [25,26,27,28]. However, previous rs-fMRI studies on PACG patients have paid little attention to their cognitive dysfunction, and the underlying neural mechanisms of cognitive dysfunction are still unclear. The hippocampus is a widely studied brain region that plays an important role in advanced cognitive functions such as learning, memory, and navigation [29,30,31]. The hippocampus is one of the earliest structures affected by neurodegenerative diseases such as AD [32,33]. Studies have shown that changes in the FC in the anterior and posterior hippocampal regions are associated with decreased subjective cognitive ability [34]. This study focused on the hippocampus of PACG patients with cognitive dysfunction. We used rs-fMRI to explore patterns of hippocampal FC in PACG patients with cognitive dysfunction. The hippocampus is composed of subregions with different cellular structures, and each subregion has a different function [35,36,37,38]. We used a probability map of the hippocampal cell structure divided into seven subregions: Cornu Ammonis 1 (CA1), CA2, CA3, Dentate gyrus (DG), Entorhinal cortex (EC), HATA, Subiculum (Subc) to provide detailed hippocampal FC [39,40]. We hypothesized that, compared with healthy controls (HCs), the FC pattern in the hippocampal subregions of PACG patients with cognitive dysfunction may change. Changes in FC in the hippocampal subregions may be related to impaired visual and cognitive function.
2. Materials and Methods
2.1. Participants
Fifty PACG patients with cognitive dysfunction and 46 HCs were recruited for this study. All the participants were right-handed. Patients with PACG were recruited from our hospital’s inpatient and outpatient departments.
The inclusion criteria for PACG patients in this study were as follows: (1) monocular or binocular anterior chamber angle stenosis; (2) glaucoma-related visual field defects; (3) optic disc cup-to-disc ratio > 0.6; (4) suffer from cognitive dysfunction; (5) willing to cooperate with relevant evaluations. Two glaucoma experts assessed the results without knowing the patients’ information. Participants were included in the study only when the diagnoses of the two experts were consistent. The exclusion criteria for PACG patients in this study were as follows: (1) diagnosed as other types of glaucoma; (2) combined with other eye diseases, such as cataract, high myopia; (3) history of brain trauma or epilepsy; (4) have a history of hypertension, diabetes and other basic diseases; (5) a history of glaucoma surgery; (6) age greater than 65 years old or difficult to cooperate with the relevant evaluation of this study; (7) during rs-fMRI exam, head movement with a maximum displacement greater than 2 mm in any direction of x, y, and z or a rotation angle greater than 2 ° on any coordinate axis; (8) conventional MRI revealed the presence of encephalomalacia; (9) it is not suitable or cannot tolerate MRI examinations. Finally, 44 patients with PACG (16 males and 28 females; age 39-63 years) were included (two patients were older than 65 years, one patient was found to have a large encephalomalacia during magnetic resonance imaging, and three patients had head movement > 2 mm).
We recruited 46 right-handed, age- and sex-matched HCs from the community ( 18 males, 28 females. Age: 39-65 years old). The exclusion criteria for HCs in this study were as follows: (1) diagnosis of eye diseases or other neurological diseases; (2) presence of diabetes, hypertension, liver disease, or other basic diseases; (3) high myopia; (4) MRI examination contraindications; (5) age greater than 65 years; (6) head movement with maximum displacement greater than 2 mm in any direction of x, y, or z or rotation angle greater than 2 ° on any axis.
At this stage, informed consent was obtained, and clinical information was recorded. Participants were invited to participate in a cognitive assessment using the Montreal Cognitive Assessment (MoCA) before rs-fMRI examination [41] .
2.2. Magnetic Resonance Data Acquisition
The rs-fMRI data were collected using a 3T MR scanner (Siemens, Erlangen, Germany) with an 8-channel phased array head coil at the imaging centre of the First Affiliated Hospital of Nanchang University. All participants were instructed to sit for 10 min before resting-state scanning. Appropriate sponge pads and earplugs were used to suppress head movement and noise, respectively, and the participants were asked to remain relaxed and close their eyes but not fall asleep and try not to think. The rs-fMRI data acquisition lasted 8 minutes, and 240 time points were obtained. The scanning parameters were as follows: repetition time (TR), 2000 ms; echo time (TE), 40 ms; flip angle, 90 °; field of view (FOV), 240 mm × 240 mm; matrix, 64 × 64; layer thickness, 4 mm; and layer spacing, 1 mm. High-resolution T1-weighted images of each participant were obtained using a 3D MRI sequence. The scanning parameters were as follows: TR, 1900 ms; TE, 2.26 ms; flip angle, 9 °; FOV view, 240 mm × 240 mm; matrix, 256 × 256; number of sagittal planes, 176; and layer thickness, 1 mm.
2.3. Data Preprocessing
We used the DPARSF data processing module in the DPABI software (a toolbox for Data Processing & Analysis for Brain Imaging) based on the MATLAB platform to preprocess the collected magnetic resonance data [42]. The main steps are as follows: (1) Format conversion: the collected BOLD and 3D-T1 images are converted from DICOM file format to NIFTI format; (2) Remove the first 10 time points of the functional image to achieve magnetic field stability; (3) Time correction: Time layer correction is performed on the remaining 230 time point data of the functional image to check the different effects of different levels of scanning time; (4) Head movement correction; (5) Spatial standardisation: registration of functional images and high-resolution T1-weighted structural images, segmentation of structural data, spatial standardisation to standard Montreal Neurological Institute (MNI) space, and re-sampling to 3 × 3 × 3 mm isotropic voxels; (6) Smoothing: 6 mm full width half maximum Gaussian kernel smoothing; (7) De-linear drift: remove the linear trend of time series; (8) Filtering: filtering (0.01 ~ 0.08 Hz) to remove low-frequency physiological signals and high-frequency random noise; (9) Regression covariates: head movement and white matter, cerebrospinal fluid and global signal as covariates.
2.4. Seed-Based FC Analyses
The DPARSF module was used for seed-based FC analysis. For the hippocampal subregion, we used the Anatomy Toolkit's templates for the probabilistic graph of cellular structures [39,40] and was presented using MRIcron software (MRIcron v1.0.20190902, https://www.nitrc.org/projects/mricron/) (Figure 1). Bilateral hippocampal subregions were selected as seed regions, including the CA1, CA2, CA3, DG, EC, HATA, and Subc. The time series of each seed region was extracted for Pearson correlation FC analysis with whole-brain voxels, and an FC correlation coefficient map was obtained. Fisher’s Z transformation was performed to conform to the normal distribution for statistical analysis.
2.5. Clinical Assessment
All participants underwent a detailed ophthalmic examination. The anterior chamber angle was determined using gonioscopy and slit-lamp examination. Average cup-to-disc ratio (A-C/D), vertical cup-to-disc ratio (V-C/D) and retinal nerve fibre layer thickness (RNFLT) were measured by optical coherence tomography (Cirrus HD-OCT). IOP was measured 1 hour before the rs-fMRI examination using tonometer. visual acuity (VA) was measured using a international standard visual acuity chart. Disease course were also recorded. Because visual field measurements were subject to subjective factors, we did not include the visual field results in this study.
2.6. Statistical Analysis
SPSS 26.0 software package (IBM, Armonk, NY, USA) was used for the statistical analysis of the general clinical data. Descriptive statistics are expressed as mean ± standard deviation (mean ± SD), and an independent sample t-test is used for the measurement data that conform to the normal distribution. If the measurement data did not conform to a normal distribution, the median (quartile) was used, and the Mann-Whitney test was used for analysis. Count data were analysed by χ2 test. Differences were considered statistically significant at P < 0.05.
The statistical module in DPABI was used for rs-fMRI data analysis. A two-sample T-test was used to test differences in FC between PACG patients and HCs at the voxel level. Age and sex were used as covariates, and FDR was used for multiple comparison correction (P < 0.05).
Pearson’s correlation analysis was performed on the FC coefficients of different brain regions and clinical variables to study the correlation between changes in FC in the hippocampal subregions and clinical variables in the PACG group. Statistical significance was set at P < 0.05.
3. Results
3.1. General Clinical Information
Table 1 shows no significant differences in age, sex, educational level between the PACG and HCs groups. The two groups had significant differences in the IOP, VA, RNFLT, A-C/D, V-C/D, and MoCA scores.
3.2. Differences in FC in the Left Hippocampal Subregion
As shown in Table 2 and Figure 2, the overall results showed that compared with the HCs group, the PACG group exhibited significantly decreased FC between the left hippocampal CA1, CA2, DG subregions and the cerebellum, between the left hippocampal CA1, DG, Subc subregions and the precentral gyrus (PreCG), between the left hippocampal Subc subregion and the postcentral gyrus (PoCG), supramarginal gyrus (SMG), supplementary motor area (SMA). Only the left hippocampal CA1 subregion was found to have increased FC with the calcarine fissure and surrounding cortex (CAL).
3.3. Differences in FC in the Right Hippocampal Subregion
As shown in Table 2 and Figure 3, the overall results showed that compared with the HCs group, the PACG group exhibited significantly decreased FC between the right hippocampal CA1, CA2, CA3, DG, Subc subregions and cerebellum, between the right hippocampal CA1, DG, Subc subregions and PreCG, between the right hippocampal CA1, CA3, Subc subregions and PoCG, between the right hippocampal CA1 subregion and the SMG, between the right hippocampal CA2 subregion and the inferior frontal gyrus opercular part (IFGoperc), between the right hippocampal CA3 subregion and the Lenticular nucleus, pallidum (PAL), rolandic operculum (ROL), between the right hippocampal DG subregion and the inferior parietal cortex, but not the supramarginal and angular gyri (IPL), SMA. However, the PACG group exhibited significantly increased FC between the right hippocampal CA3, Subc subregions and CAL, between the right hippocampal CA3 subregion and lingual gyrus (LING), between the right hippocampal DG subregion and the Anterior cingulate and paracingulate gyrus (ACG).
3.4. Correlation Between Hippocampal FC and Clinical Indices in PACG Patients
As shown in Table 3 and Figure 4, FC between the left hippocampal CA1 subregion and the right CAL was positively correlated with VA (r = 0.396, P = 0.008). The FC between the right hippocampal subregion and the left PreCG was positively correlated with A-C/D (r = 0.311, P = 0.04). The FC between the right hippocampal Subc subregion and the right PreCG was negatively correlated with RNFLT (r = -0.312, P = 0.039). The FC between the right hippocampal CA3 subregion and the left LING was negatively correlated with A-C/D (r = -0.358, P = 0.017). However, contrary to our hypothesis, we did not find a correlation between FC in the hippocampal subregions and the MoCA score.
4. Discussion
We used the FC method of rs-fMRI to analyse changes in the FC of bilateral hippocampal subregions in PACG patients with cognitive dysfunction. As hypothesized, compared to HCs, PACG patients with cognitive dysfunction showed changes in hippocampal FC patterns. These changes were mainly observed in the cerebellum, PreCG, PoCG, SMG, SMA, and CAL. These findings provide new insights to understand better central nervous system damage in PACG patients with cognitive dysfunction.
Compared with HCs, we found that the FC between multiple subregions of the bilateral hippocampus and cerebellum was decreased in PACG patients with cognitive dysfunction. In addition to motor coordination, the cerebellum is also involved in cognitive and emotional regulation [43,44,45]. Studies have shown that almost all acute cerebellar strokes occur after cerebellar cognitive–affective syndrome [46]. Wang et al. found that a decrease in cerebellar CBF in POAG patients using ASL imaging confirmed cerebellar haemodynamic dysfunction in patients with glaucoma [47]. fMRI studies have confirmed the functional connection between the human cerebellum and hippocampus. A specific functional circuit between the cerebellum and hippocampus is mainly involved in the cognitive aspects of navigation [48]. Based on visual-motor integration, hippocampus-cerebellum interactions are involved in the spatiotemporal movement prediction [49]. Studies have shown a specific relationship between the cerebellum and hippocampus during changes in visual-spatial information perception [50]. These studies have shown the importance of the cerebellum and functional connections between the cerebellum and hippocampus in cognitive function. The decreased FC between multiple subregions of the bilateral hippocampus and cerebellum suggests that PACG patients with cognitive dysfunction have impaired cognitive function circuits between the hippocampus and cerebellum. This result may be one of the mechanisms leading to cognitive dysfunction in PACG patients. However, we did not find a significant linear correlation between the FC between the hippocampal subregion and the cerebellum and the cognitive score. A possible reason for this is that various central damage mechanisms are involved in the impairment of cognitive function, indicating that the mechanism of cognitive dysfunction in PACG patients is complex and diverse and requires further study. Alternatively, the scale used was not sufficiently sensitive. In the future, we should further study the mechanism of PACG patients with cognitive dysfunction and use a more sensitive and detailed cognitive function assessment scale.
Compared to HCs, the FC between multiple subregions of the bilateral hippocampus and the PreCG, PoCG, SMA was decreased in PACG patients with cognitive dysfunction. These brain regions are part of the sensorimotor network (SMN). As a ‘sensor’ in the brain, the SMN cooperates closely with other brain networks to perform important activities. Huang et al. found that spontaneous brain activity decreased in the left PreCG of PACG patients [12]. Wang et al. found that the CBF in the PoCG decreased in POAG patients [47]. In addition, patients with neovascular glaucoma showed abnormal PoCG function [51]. This result indicates that patients with different types of glaucoma have abnormal functions in some brain regions of the SMN. Dai et al. found that POAG patients showed decreased FC between the visual cortex and the PreCG [52], and our team’s previous studies found that PACG patients showed decreased static and dynamic brain network connectivity between the visual network (VN) and SMN [53]. These results speculated an abnormal visual sensorimotor processing integration function in PACG patients. Chen et al. found that PACG patients showed decreased FC between the amygdala and SMN brain regions [24], indicating that the amygdala-sensorimotor pathway was damaged in PACG patients. In PACG patients, as a result of the visual field defects and progressive loss of RGCs, the visual information received by the VN is reduced, and the visual signal input received by the SMN is reduced. As a result, the integration of visual-motor processing is affected. The FC between multiple subregions of the bilateral hippocampus and multiple brain regions of the SMN was decreased, suggesting damage of the hippocampus-sensorimotor pathway in PACG patients with cognitive dysfunction. In addition, the hippocampus is part of the default mode network (DMN), suggesting that PACG patients with cognitive dysfunction may have a reduced interaction between the DMN and SMN. In addition, we found that the FC between the right hippocampal subregion and the right PreCG was negatively correlated with the RNFLT. The RNFLT was correlated with the degree of visual impairment in the PACG [54], indicating that the decreased FC between the right hippocampal subregion and the right PreCG in PACG patients with cognitive dysfunction may help alleviate their visual impairment.
In PACG patients with cognitive dysfunction, the FC between the bilateral hippocampal subregions and the SMG was decreased, and the FC between the right hippocampal DG subregion and the IPL was decreased. The SMG and the IPL are located in the inferior parietal lobule. The inferior parietal lobule primarily involves visual attention, self-perception, nondirectional thinking, episodic memory, and social cognition [55]. Visual information is processed via the dorsal visual pathway to the inferior parietal lobules. We speculate that PACG may cause dysfunction of the inferior parietal lobule due to the reduced visual signal transmission. The inferior parietal lobule and hippocampus are parts of the DMN, indicating that the internal FC of the DMN is reduced in PACG patients with cognitive dysfunction. Wang et al. found that the CBF of the DMN in POAG patients was reduced [47], and CBF-FC coupling was abnormal [56]. Our research group’s previous application of the DC analysis method also found that the DC value of the DMN brain region was increased in PACG patients [15]. these results indicate that patients with glaucoma have abnormal DMN function. The DMN is involved in the body’s monitoring of the surrounding environment. We speculate that visual field defects and decreased vision inevitably lead to a decline in the ability of PACG patients to monitor their surrounding environment. Dai et al. found that FC was increased between the primary visual cortex and the DMN in POAG patients [52]. Our previous study found that the FC between the thalamus and DMN was abnormal in PACG patients [23]. In addition, Chen et al. found that PACG patients exhibited decreased FC between the amygdala and the DMN [24]. These results indicate that patients with glaucoma have abnormal functional interactions between the DMN and other brain regions. FC analysis of human fMRI data revealed that the visual cortex region, which selectively processes relevant information, is functionally connected to the frontoparietal network. In contrast, the visual cortex region, which processes irrelevant information, is simultaneously coupled with the DMN [57]. In addition, the DMN is a vision-oriented system [58]. Decreased visual network function in patients with glaucoma may lead to abnormal DMN function [22,59]. Several studies have shown that patients with Alzheimer’s disease have abnormal DMN function [60,61,62,63,64]. This study found that PACG patients with cognitive dysfunction had decreased FC within the DMN. However, no significant linear correlation was found with their cognitive scores. Whether this was related to cognitive dysfunction requires further investigation.
Significantly increased FC between the bilateral hippocampal subregions and the CAL, between the right hippocampal CA3 subregion and the LING were found in PACG patients with cognitive dysfunction. CAL and LING belong to the high-level visual cortex (V2). Dai et al. and our previous study found that FC between the primary visual cortex (V1) and V2 region was decreased in patients with glaucoma [22,52]. In contrast, FC between the hippocampus and V1 region was increased. We speculate that local neural plasticity in PACG patients with cognitive dysfunction may play a compensatory role in the occurrence and development of the disease and that the increase of FC between some subregions of the hippocampus and the V2 region may manifest functional compensation. In particular, the FC between the left hippocampal CA1 subregion and the right CAL was positively correlated with VA, suggesting that functional compensation between the left hippocampal CA1 and V2 regions may improve VA.
This study has several limitations. We only conducted a simple cognitive function assessment for PACG patients. A more detailed neuropsychological assessment is needed because clinical studies have found that PACG patients may also have mental symptoms, such as depression, anxiety, insomnia, and mental disorders, in addition to cognitive dysfunction. Secondly, this was a cross-sectional study. In the future, it will be necessary to study the changes in FC in hippocampal subregions before and after surgery in PACG patients with cognitive dysfunction further to explore the neural plasticity trajectory after surgery. Third, the course of PACG in patients with cognitive dysfunction is quite different, and the course length may affect the FC of the hippocampal subregions. Finally, many PACG patients use drugs to reduce the IOP, which may affect brain function.
5. Conclusions
Extensive FC abnormalities exist between the hippocampal subregions and the cerebellum, SMN, DMN, VN, and other brain regions in PACG patients with cognitive dysfunction, which provides a new perspective for understanding the neuropathological mechanisms of these patients and provides potential neuroimaging biomarkers for early diagnosis and intervention.
Author Contributions
Conceptualization, Shenghong Li and Xianjun Zeng; Data curation, Linglong Chen, Lianjiang Lv, Zihe Xu and Chonggang Pei; Funding acquisition, Xianjun Zeng; Investigation, Jian Li, Lianjiang Lv and Chonggang Pei; Methodology, Shenghong Li, Yuanyuan Wang, Fengqin Cai, Lianjiang Lv and Zihe Xu; Project administration, Xianjun Zeng; Software, Yuanyuan Wang and Zihe Xu; Supervision, Chonggang Pei; Validation, Jian Li; Writing – original draft, Shenghong Li; Writing – review & editing, Linglong Chen and Fengqin Cai. All authors contributed to the manuscript and approved the submitted version.
Funding
This research was Supported by The Clinical Research Center For Medical Imaging In Jiangxi Province (Grant No. 20223BCG74001). The National Natural Science Foundation of China (Grant No. 82360341). The Science and Technology Project of Jiangxi Health Committee (Grant No. 202410182).
Institutional Review Board Statement
This study followed the principles of the Declaration of Helsinki, and the research program was approved by the Clinical Research Ethics Committee of the First Affiliated Hospital of Nanchang University. (protocol code: IIT2024283, and date of approval 17 June 2024).
Informed Consent Statement
Informed consent was obtained from all subjects involved in the study.
Data availability
The data that support the findings of this study are available from the First Affiliated Hospital of Nanchang University but restrictions apply to the availability of these data, which were used under license for the current study, and so are not publicly available. Data are however available from the corresponding author upon reasonable request and with permission of the First Affiliated Hospital of Nanchang University.
Acknowledgments
We thank the patients and volunteers for participating in this study, thank them for their contribution to scientific research. Thanks to all the authors for their help with this study. In addition, we would like to thank Editage (www.editage.cn) for English language editing.
Conflicts of Interest
The authors declare no competing interests.
References
- Flaxman, S. R.; Bourne, R. R. A.; Resnikoff, S.; Ackland, P.; Braithwaite, T.; Cicinelli, M. V.; Das, A.; Jonas, J. B.; Keeffe, J.; Kempen, J. H.; et al. Global Causes of Blindness and Distance Vision Impairment 1990–2020: A Systematic Review and Meta-Analysis. The Lancet Global Health 2017, 5 (12), e1221–e1234. [CrossRef]
- Steinmetz, J. D.; Bourne, R. R. A.; Briant, P. S.; Flaxman, S. R.; Taylor, H. R. B.; Jonas, J. B.; Abdoli, A. A.; Abrha, W. A.; Abualhasan, A.; Abu-Gharbieh, E. G.; et al. Causes of Blindness and Vision Impairment in 2020 and Trends over 30 Years, and Prevalence of Avoidable Blindness in Relation to VISION 2020: The Right to Sight: An Analysis for the Global Burden of Disease Study. The Lancet Global Health 2021, 9 (2), e144–e160. [CrossRef]
- Tham, Y.-C.; Li, X.; Wong, T. Y.; Quigley, H. A.; Aung, T.; Cheng, C.-Y. Global Prevalence of Glaucoma and Projections of Glaucoma Burden through 2040: A Systematic Review and Meta-Analysis. Ophthalmology 2014, 121 (11), 2081–2090. [CrossRef]
- Gupta, N. Human Glaucoma and Neural Degeneration in Intracranial Optic Nerve, Lateral Geniculate Nucleus, and Visual Cortex. British Journal of Ophthalmology 2006, 90 (6), 674–678. [CrossRef]
- Gauthier, A. C.; Liu, J. Neurodegeneration and Neuroprotection in Glaucoma. Yale J Biol Med. 2016, 89(1), 73-79.
- Li, C.; Cai, P.; Shi, L.; Lin, Y.; Zhang, J.; Liu, S.; Xie, B.; Shi, Y.; Yang, H.; Li, S.; et al. Voxel-Based Morphometry of the Visual-Related Cortex in Primary Open Angle Glaucoma. Curr Eye Res. 2012, 37 (9), 794–802. [CrossRef]
- Williams, A. L.; Lackey, J.; Wizov, S. S.; Chia, T. M. T.; Gatla, S.; Moster, M. L.; Sergott, R.; Spaeth, G. L.; Lai, S. Evidence for Widespread Structural Brain Changes in Glaucoma: A Preliminary Voxel-Based MRI Study. Invest Ophthalmol Vis Sci. 2013, 54 (8), 5880–5887. [CrossRef]
- You, M.; Rong, R.; Zeng, Z.; Xia, X.; Ji, D. Transneuronal Degeneration in the Brain During Glaucoma. Front. Aging Neurosci. 2021, 13, 643685. [CrossRef]
- Sen, S.; Saxena, R.; Tripathi, M.; Vibha, D.; Dhiman, R. Neurodegeneration in Alzheimer’s Disease and Glaucoma: Overlaps and Missing Links. Eye 2020, 34 (9), 1546–1553. [CrossRef]
- Neacșu, A. M.; Ferechide, D. Glaucoma - a Neurodegenerative Disease with Cerebral Neuroconnectivity Elements. Rom J Ophthalmol. 2022, 66 (3), 219–224. [CrossRef]
- Lee, P.-J.; Liu, C. J.-L.; Wojciechowski, R.; Bailey-Wilson, J. E.; Cheng, C.-Y. Structure-Function Correlations Using Scanning Laser Polarimetry in Primary Angle-Closure Glaucoma and Primary Open-Angle Glaucoma. Am J Ophthalmol. 2010, 149 (5), 817-825.e1. [CrossRef]
- Huang, X.; Zhong, Y.-L.; Zeng, X.-J.; Zhou, F.; Liu, X.-H.; Hu, P.-H.; Pei, C.-G.; Shao, Y.; Dai, X.-J. Disturbed Spontaneous Brain Activity Pattern in Patients with Primary Angle-Closure Glaucoma Using Amplitude of Low-Frequency Fluctuation: A fMRI Study. Neuropsychiatr Dis Treat. 2015, 11, 1877–1883. [CrossRef]
- Wang, R.; Tang, Z.; Liu, T.; Sun, X.; Wu, L.; Xiao, Z. Altered Spontaneous Neuronal Activity and Functional Connectivity Pattern in Primary Angle-Closure Glaucoma: A Resting-State fMRI Study. Neurol Sci. 2021, 42 (1), 243–251. [CrossRef]
- Fu, Q.; Liu, H.; Zhong, Y. L. The Predictive Values of Changes in Local and Remote Brain Functional Connectivity in Primary Angle-Closure Glaucoma Patients According to Support Vector Machine Analysis. Front. Hum. Neurosci. 2022, 16, 910669. [CrossRef]
- Cai, F.; Gao, L.; Gong, H.; Jiang, F.; Pei, C.; Zhang, X.; Zeng, X.; Huang, R. Network Centrality of Resting-State fMRI in Primary Angle-Closure Glaucoma Before and After Surgery. PLoS One 2015, 10 (10), e0141389. [CrossRef]
- Chen, R.-B.; Zhong, Y.-L.; Liu, H.; Huang, X. Machine Learning Analysis Reveals Abnormal Functional Network Hubs in the Primary Angle-Closure Glaucoma Patients. Front. Hum. Neurosci. 2022, 16, 935213. [CrossRef]
- Shu, Y.; Huang, Y.; Chen, J.; Chen, L.; Cai, G.; Guo, Y.; Li, S.; Gao, J.; Zeng, X. Effects of Primary Angle-Closure Glaucoma on Interhemispheric Functional Connectivity. Front. Neurosci. 2023, 17, 1053114. [CrossRef]
- Tong, Y.; Zhong, Y. L.; Liu, H.; Huang, X. Disrupted Interhemispheric Functional Connectivity in Primary Angle-Closure Glaucoma: A Functional MRI Study: Voxel-Mirrored Homotopic Connectivity in Primary Angle-Closure Glaucoma Patients. NeuroReport 2022, 33 (14), 604–611. [CrossRef]
- Liu, D.; Gao, J.; You, T.; Li, S.; Cai, F.; Pei, C.; Zeng, X. Brain Functional Network Analysis of Patients with Primary Angle-Closure Glaucoma. Disease Markers 2022, 2022, 1–13. [CrossRef]
- Chen, L.; Li, S.; Cai, F.; Wu, L.; Gong, H.; Pei, C.; Zhou, F.; Zeng, X. Altered Functional Connectivity Density in Primary Angle-Closure Glaucoma Patients at Resting-State. Quant Imaging Med Surg. 2019, 9 (4), 603–614. [CrossRef]
- Jiang, F.; Fang, J.-W.; Ye, Y.-Q.; Tian, Y.-J.; Zeng, X.-J.; Zhong, Y.-L. Altered Effective Connectivity of Primary Visual Cortex in Primary Angle Closure Glaucoma Using Granger Causality Analysis. Acta Radiol. 2020, 61 (4), 508–519. [CrossRef]
- Li, S.; Li, P.; Gong, H.; Jiang, F.; Liu, D.; Cai, F.; Pei, C.; Zhou, F.; Zeng, X. Intrinsic Functional Connectivity Alterations of the Primary Visual Cortex in Primary Angle-Closure Glaucoma Patients before and after Surgery: A Resting-State fMRI Study. PLoS ONE 2017, 12 (1), e0170598. [CrossRef]
- Wang, Y.; Chen, L.; Cai, F.; Gao, J.; Ouyang, F.; Chen, Y.; Yin, M.; Hua, C.; Zeng, X. Altered Functional Connectivity of the Thalamus in Primary Angle-Closure Glaucoma Patients: A Resting-State fMRI Study. Front. Neurol. 2022, 13, 1015758. [CrossRef]
- Chen, Y.; Wang, Y.; Chen, L.; Ouyang, F.; Yin, M.; Lv, L.; Xu, Z.; Liu, J.; Zeng, X. Altered Resting-State Amygdalar Functional Connectivity in Primary Angle-Closure Glaucoma Patients. J. Integr. Neurosci. 2024, 23 (4), 75. [CrossRef]
- Park, D. Y.; Kim, M.; Bae, Y.; Jang, H.; Lim, D. H. Risk of Dementia in Newly Diagnosed Glaucoma: A Nationwide Cohort Study in Korea. Ophthalmology 2023, 130 (7), 684–691. [CrossRef]
- Yoshikawa, T.; Obayashi, K.; Miyata, K.; Saeki, K.; Ogata, N. Lower Cognitive Function in Patients With Functionally and Structurally Severe Glaucoma: The LIGHT Study. Journal of Glaucoma 2021, 30 (10), 882–886. [CrossRef]
- Lee, S. H.; Han, J. W.; Lee, E. J.; Kim, T.-W.; Kim, H.; Kim, K. W. Cognitive Impairment and Lamina Cribrosa Thickness in Primary Open-Angle Glaucoma. Trans. Vis. Sci. Tech. 2020, 9 (7), 17. [CrossRef]
- Crump, C.; Sundquist, J.; Sieh, W.; Sundquist, K. Risk of Alzheimer’s Disease and Related Dementias in Persons with Glaucoma: A National Cohort Study. Ophthalmology 2024, 131 (3), 302–309. [CrossRef]
- Bird, C. M.; Burgess, N. The Hippocampus and Memory: Insights from Spatial Processing. Nat Rev Neurosci. 2008, 9 (3), 182–194. [CrossRef]
- Slotnick, S. D. The Hippocampus and Long-Term Memory. Cogn Neurosci. 2022, 13 (3–4), 113–114. [CrossRef]
- Pronier, É.; Morici, J. F.; Girardeau, G. The Role of the Hippocampus in the Consolidation of Emotional Memories during Sleep. Trends Neurosci. 2023, 46 (11), 912–925. [CrossRef]
- Babcock, K. R.; Page, J. S.; Fallon, J. R.; Webb, A. E. Adult Hippocampal Neurogenesis in Aging and Alzheimer’s Disease. Stem Cell Reports 2021, 16 (4), 681–693. [CrossRef]
- Kim, T. A.; Syty, M. D.; Wu, K.; Ge, S. Adult Hippocampal Neurogenesis and Its Impairment in Alzheimer’s Disease. Zool Res. 2022, 43 (3), 481–496. [CrossRef]
- Wang, Q.; Chen, B.; Zhong, X.; Hou, L.; Zhang, M.; Yang, M.; Wu, Z.; Chen, X.; Mai, N.; Zhou, H.; et al. Static and Dynamic Functional Connectivity Variability of the Anterior-Posterior Hippocampus with Subjective Cognitive Decline. Alzheimers Res Ther. 2022, 14 (1), 122. [CrossRef]
- Neunuebel, J. P.; Knierim, J. J. CA3 Retrieves Coherent Representations from Degraded Input: Direct Evidence for CA3 Pattern Completion and Dentate Gyrus Pattern Separation. Neuron. 2014, 81 (2), 416–427. [CrossRef]
- Hodgetts, C. J.; Voets, N. L.; Thomas, A. G.; Clare, S.; Lawrence, A. D.; Graham, K. S. Ultra-High-Field fMRI Reveals a Role for the Subiculum in Scene Perceptual Discrimination. J Neurosci. 2017, 37 (12), 3150–3159. [CrossRef]
- Oliva, A.; Fernandez-Ruiz, A.; Karaba, L. A. CA2 Orchestrates Hippocampal Network Dynamics. Hippocampus 2023, 33 (3), 241–251. [CrossRef]
- Middleton, S. J.; McHugh, T. J. CA2: A Highly Connected Intrahippocampal Relay. Annu Rev Neurosci. 2020, 43, 55–72. [CrossRef]
- Amunts, K.; Kedo, O.; Kindler, M.; Pieperhoff, P.; Mohlberg, H.; Shah, N. J.; Habel, U.; Schneider, F.; Zilles, K. Cytoarchitectonic Mapping of the Human Amygdala, Hippocampal Region and Entorhinal Cortex: Intersubject Variability and Probability Maps. Anat Embryol (Berl) 2005, 210 (5–6), 343–352. [CrossRef]
- Eickhoff, S. B.; Stephan, K. E.; Mohlberg, H.; Grefkes, C.; Fink, G. R.; Amunts, K.; Zilles, K. A New SPM Toolbox for Combining Probabilistic Cytoarchitectonic Maps and Functional Imaging Data. Neuroimage 2005, 25 (4), 1325–1335. [CrossRef]
- Nasreddine, Z. S.; Phillips, N. A.; Bédirian, V.; Charbonneau, S.; Whitehead, V.; Collin, I.; Cummings, J. L.; Chertkow, H. The Montreal Cognitive Assessment, MoCA: A Brief Screening Tool for Mild Cognitive Impairment. J Am Geriatr Soc. 2005, 53 (4), 695–699. [CrossRef]
- Yan, C.-G.; Wang, X.-D.; Zuo, X.-N.; Zang, Y.-F. DPABI: Data Processing & Analysis for (Resting-State) Brain Imaging. Neuroinformatics 2016, 14 (3), 339–351. [CrossRef]
- Buckner, R. L. The Cerebellum and Cognitive Function: 25 Years of Insight from Anatomy and Neuroimaging. Neuron. 2013, 80 (3), 807–815. [CrossRef]
- Rudolph, S.; Badura, A.; Lutzu, S.; Pathak, S. S.; Thieme, A.; Verpeut, J. L.; Wagner, M. J.; Yang, Y.-M.; Fioravante, D. Cognitive-Affective Functions of the Cerebellum. J Neurosci. 2023, 43 (45), 7554–7564. [CrossRef]
- Koziol, L. F.; Budding, D.; Andreasen, N.; D’Arrigo, S.; Bulgheroni, S.; Imamizu, H.; Ito, M.; Manto, M.; Marvel, C.; Parker, K.; et al. Consensus Paper: The Cerebellum’s Role in Movement and Cognition. Cerebellum 2014, 13 (1), 151–177. [CrossRef]
- Abderrakib, A.; Ligot, N.; Naeije, G. Cerebellar Cognitive Affective Syndrome after Acute Cerebellar Stroke. Front Neurol. 2022, 13, 906293. [CrossRef]
- Wang, Q.; Qu, X.; Wang, H.; Chen, W.; Sun, Y.; Li, T.; Chen, J.; Wang, Y.; Wang, N.; Xian, J. Arterial Spin Labeling Reveals Disordered Cerebral Perfusion and Cerebral Blood Flow-Based Functional Connectivity in Primary Open-Angle Glaucoma. Brain Imaging and Behavior 2023, 18 (1), 231–242. [CrossRef]
- Iglói, K.; Doeller, C. F.; Paradis, A.-L.; Benchenane, K.; Berthoz, A.; Burgess, N.; Rondi-Reig, L. Interaction Between Hippocampus and Cerebellum Crus I in Sequence-Based but Not Place-Based Navigation. Cereb Cortex 2015, 25 (11), 4146–4154. [CrossRef]
- Onuki, Y.; Van Someren, E. J. W.; De Zeeuw, C. I.; Van der Werf, Y. D. Hippocampal-Cerebellar Interaction during Spatio-Temporal Prediction. Cereb Cortex 2015, 25 (2), 313–321. [CrossRef]
- Hauser, M. F. A.; Heba, S.; Schmidt-Wilcke, T.; Tegenthoff, M.; Manahan-Vaughan, D. Cerebellar-Hippocampal Processing in Passive Perception of Visuospatial Change: An Ego- and Allocentric Axis? Hum Brain Mapp. 2020, 41 (5), 1153–1166. [CrossRef]
- Wang, Y.; Wang, R.; Wang, Y.; Guo, L.; Zhan, Y.; Duan, F.; Cheng, J.; Tang, Z. The Alterations of Brain Network Degree Centrality in Patients with Neovascular Glaucoma: A Resting-State fMRI Study. Neurol Sci. 2023, 44 (8), 2915–2922. [CrossRef]
- Dai, H.; Morelli, J. N.; Ai, F.; Yin, D.; Hu, C.; Xu, D.; Li, Y. Resting-State Functional MRI: Functional Connectivity Analysis of the Visual Cortex in Primary Open-Angle Glaucoma Patients: Functional Connectivity in Glaucoma. Hum. Brain Mapp. 2013, 34 (10), 2455–2463. [CrossRef]
- Wang, Y.; Shu, Y.; Cai, G.; Guo, Y.; Gao, J.; Chen, Y.; Lv, L.; Zeng, X. Altered Static and Dynamic Functional Network Connectivity in Primary Angle-Closure Glaucoma Patients. Sci Rep. 2024, 14 (1), 11682. [CrossRef]
- Kurysheva, N. I.; Lepeshkina, L. V. Detection of Primary Angle Closure Glaucoma Progression by Optical Coherence Tomography. J Glaucoma. 2021, 30 (5), 410–420. [CrossRef]
- Igelström, K. M.; Graziano, M. S. A. The Inferior Parietal Lobule and Temporoparietal Junction: A Network Perspective. Neuropsychologia 2017, 105, 70–83. [CrossRef]
- Wang, Q.; Qu, X.; Chen, W.; Wang, H.; Huang, C.; Li, T.; Wang, N.; Xian, J. Altered Coupling of Cerebral Blood Flow and Functional Connectivity Strength in Visual and Higher Order Cognitive Cortices in Primary Open Angle Glaucoma. J Cereb Blood Flow Metab. 2021, 41 (4), 901–913. [CrossRef]
- Chadick, J. Z.; Gazzaley, A. Differential Coupling of Visual Cortex with Default or Frontal-Parietal Network Based on Goals. Nat Neurosci. 2011, 14 (7), 830–832. [CrossRef]
- Harmelech, T.; Friedman, D.; Malach, R. Differential Magnetic Resonance Neurofeedback Modulations across Extrinsic (Visual) and Intrinsic (Default-Mode) Nodes of the Human Cortex. J Neurosci. 2015, 35 (6), 2588–2595. [CrossRef]
- Duncan, R. O.; Sample, P. A.; Bowd, C.; Weinreb, R. N.; Zangwill, L. M. Arterial Spin Labeling fMRI Measurements of Decreased Blood Flow in Primary Visual Cortex Correlates with Decreased Visual Function in Human Glaucoma. Vision Res. 2012, 60, 51–60. [CrossRef]
- Fathian, A.; Jamali, Y.; Raoufy, M. R.; Alzheimer’s Disease Neuroimaging Initiative. The Trend of Disruption in the Functional Brain Network Topology of Alzheimer’s Disease. Sci Rep. 2022, 12 (1), 14998. [CrossRef]
- Ibrahim, B.; Suppiah, S.; Ibrahim, N.; Mohamad, M.; Hassan, H. A.; Nasser, N. S.; Saripan, M. I. Diagnostic Power of Resting-State fMRI for Detection of Network Connectivity in Alzheimer’s Disease and Mild Cognitive Impairment: A Systematic Review. Hum Brain Mapp. 2021, 42 (9), 2941–2968. [CrossRef]
- Marin-Marin, L.; Miró-Padilla, A.; Costumero, V. Structural But Not Functional Connectivity Differences within Default Mode Network Indicate Conversion to Dementia. J Alzheimers Dis. 2023, 91 (4), 1483–1494. [CrossRef]
- Zheng W.; Cui B.; Han Y.; Song H.; Li K.; He Y.; Wang Z. Disrupted Regional Cerebral Blood Flow, Functional Activity and Connectivity in Alzheimer's Disease: A Combined ASL Perfusion and Resting State fMRI Study. Front Neurosci. 2019, 13, 738. [CrossRef]
- Tondelli, M.; Ballotta, D.; Maramotti, R.; Carbone, C.; Gallingani, C.; MacKay, C.; Pagnoni, G.; Chiari, A.; Zamboni, G. Resting-State Networks and Anosognosia in Alzheimer’s Disease. Front Aging Neurosci. 2024, 16, 1415994. [CrossRef]
Figure 1.
the subregions of hippocampus.
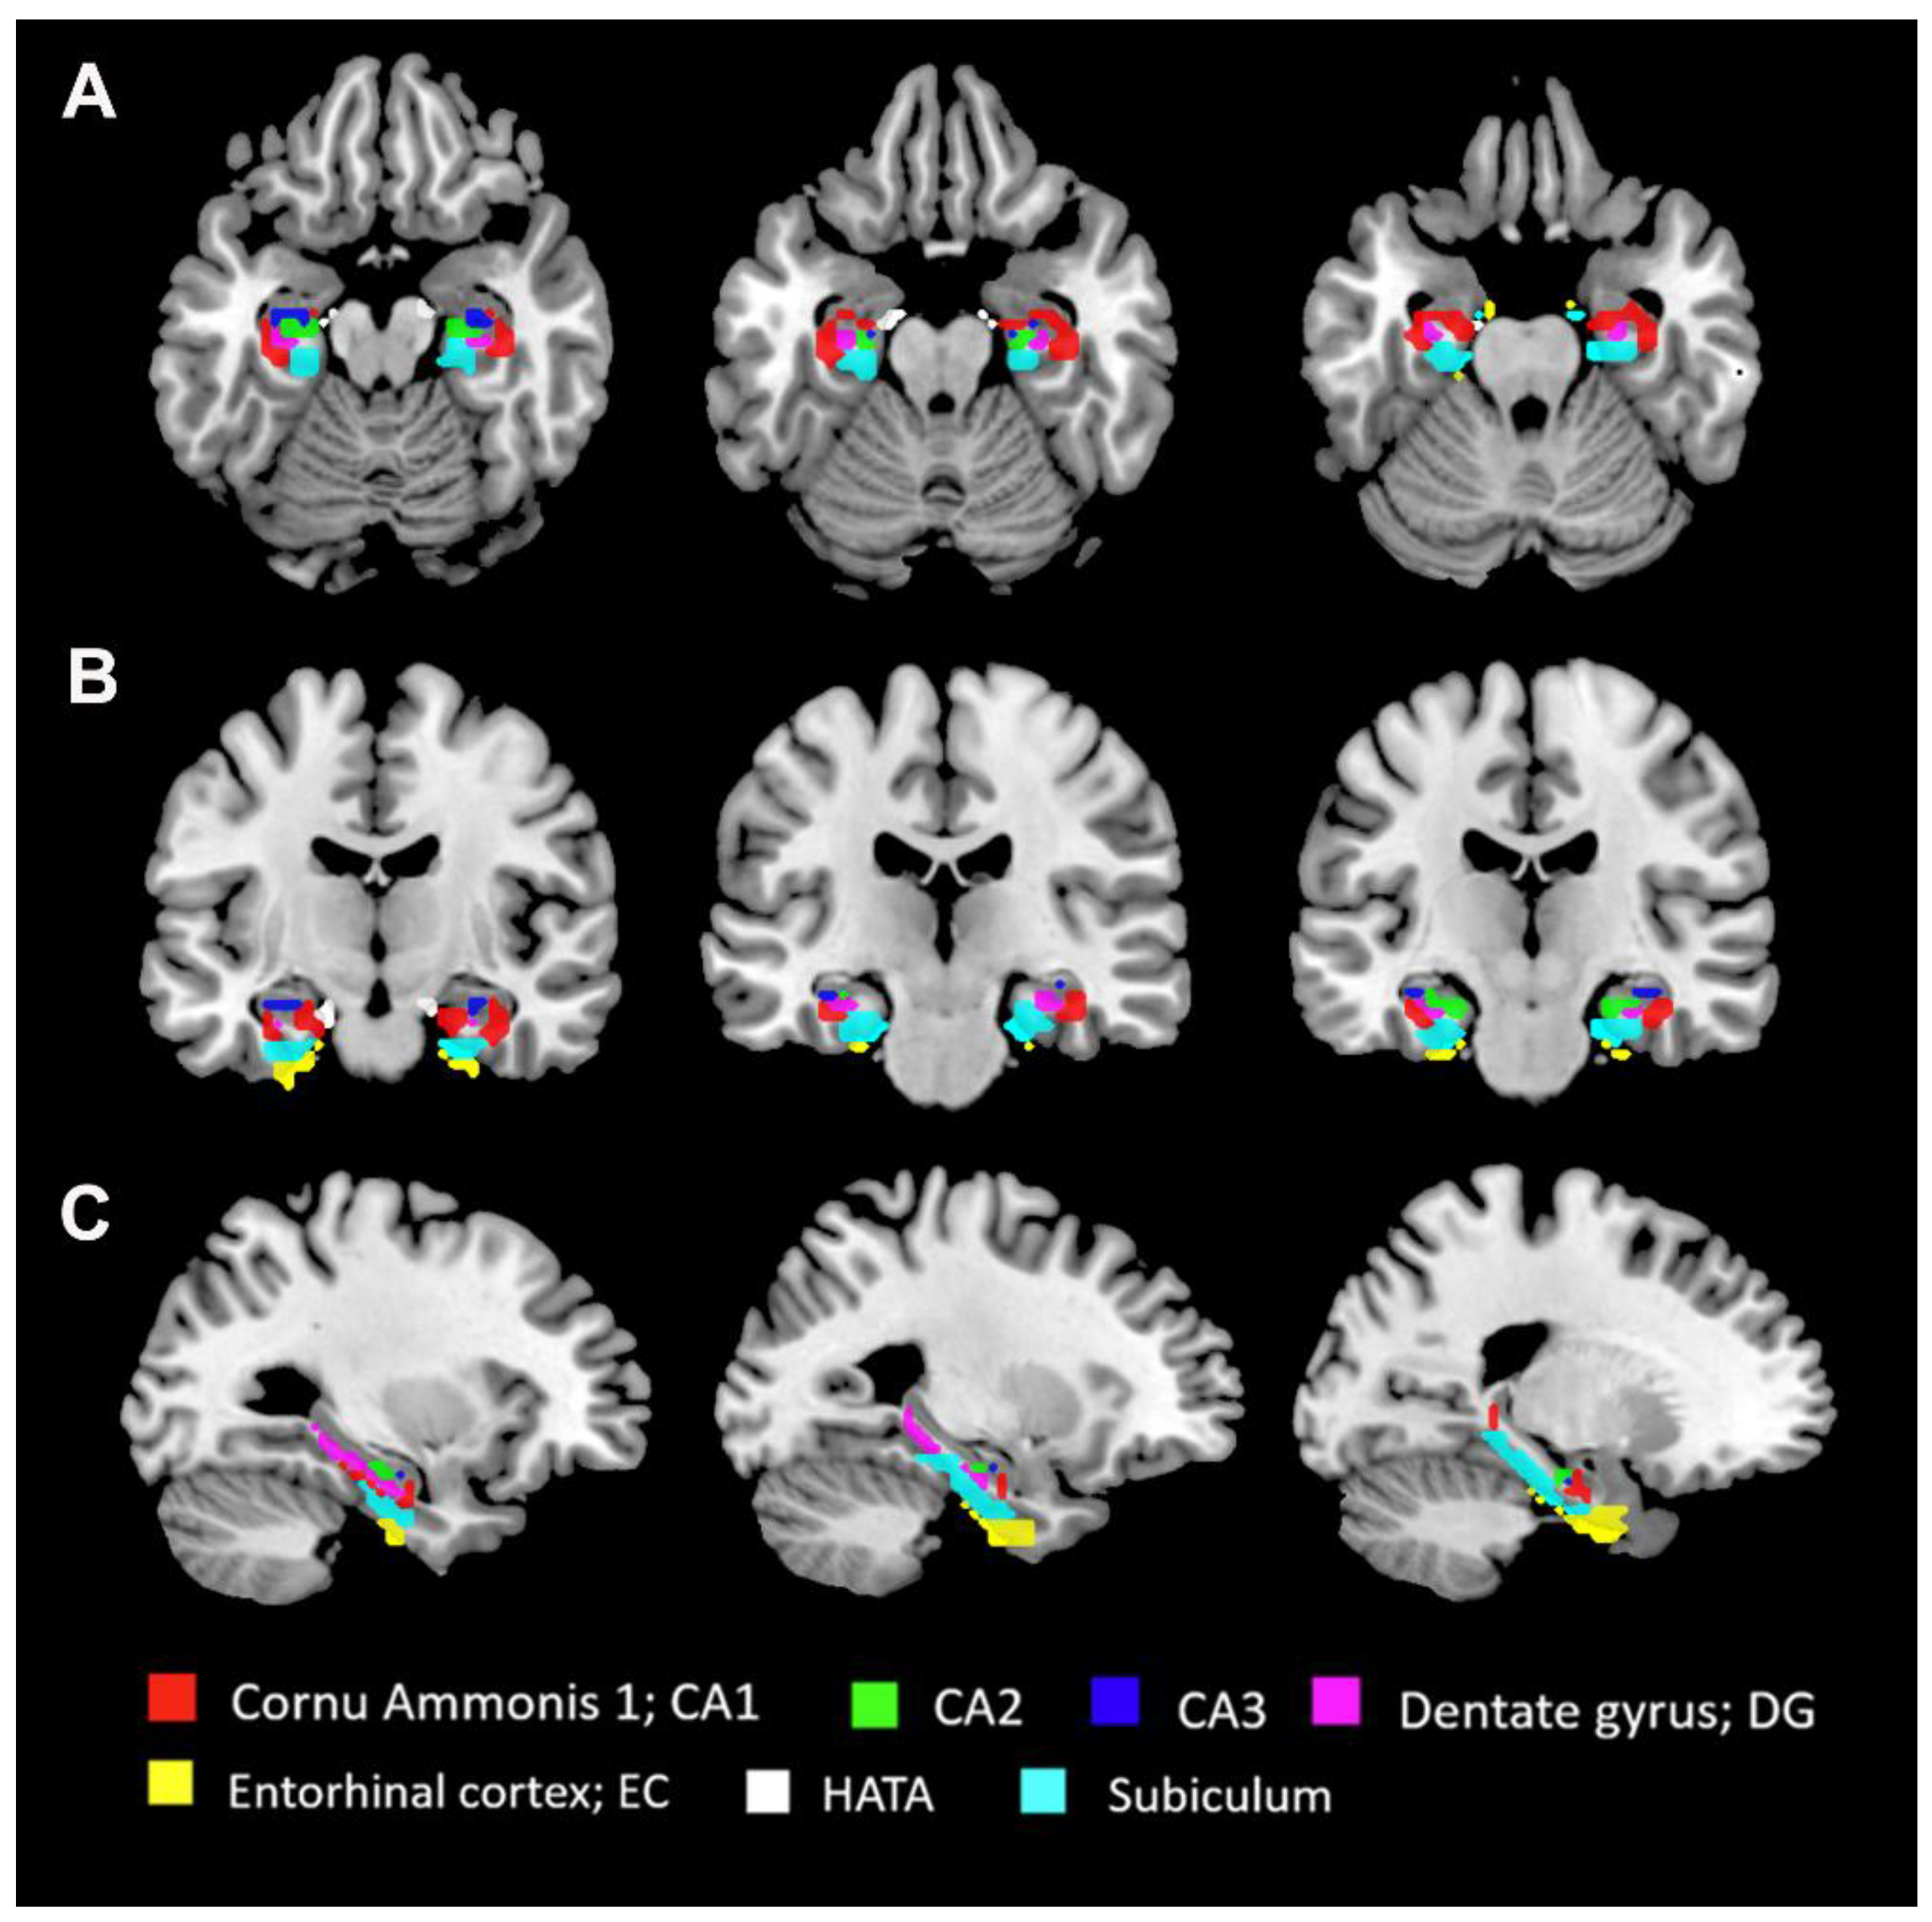
Figure 2.
Differences in FC in the left hippocampal subregion. Spatial distribution was visualized using surface brain imaging in BrainNet Viewer (BrainNet Viewer 1.7, www.nitrc.org/projects/bnv/).
Figure 2.
Differences in FC in the left hippocampal subregion. Spatial distribution was visualized using surface brain imaging in BrainNet Viewer (BrainNet Viewer 1.7, www.nitrc.org/projects/bnv/).
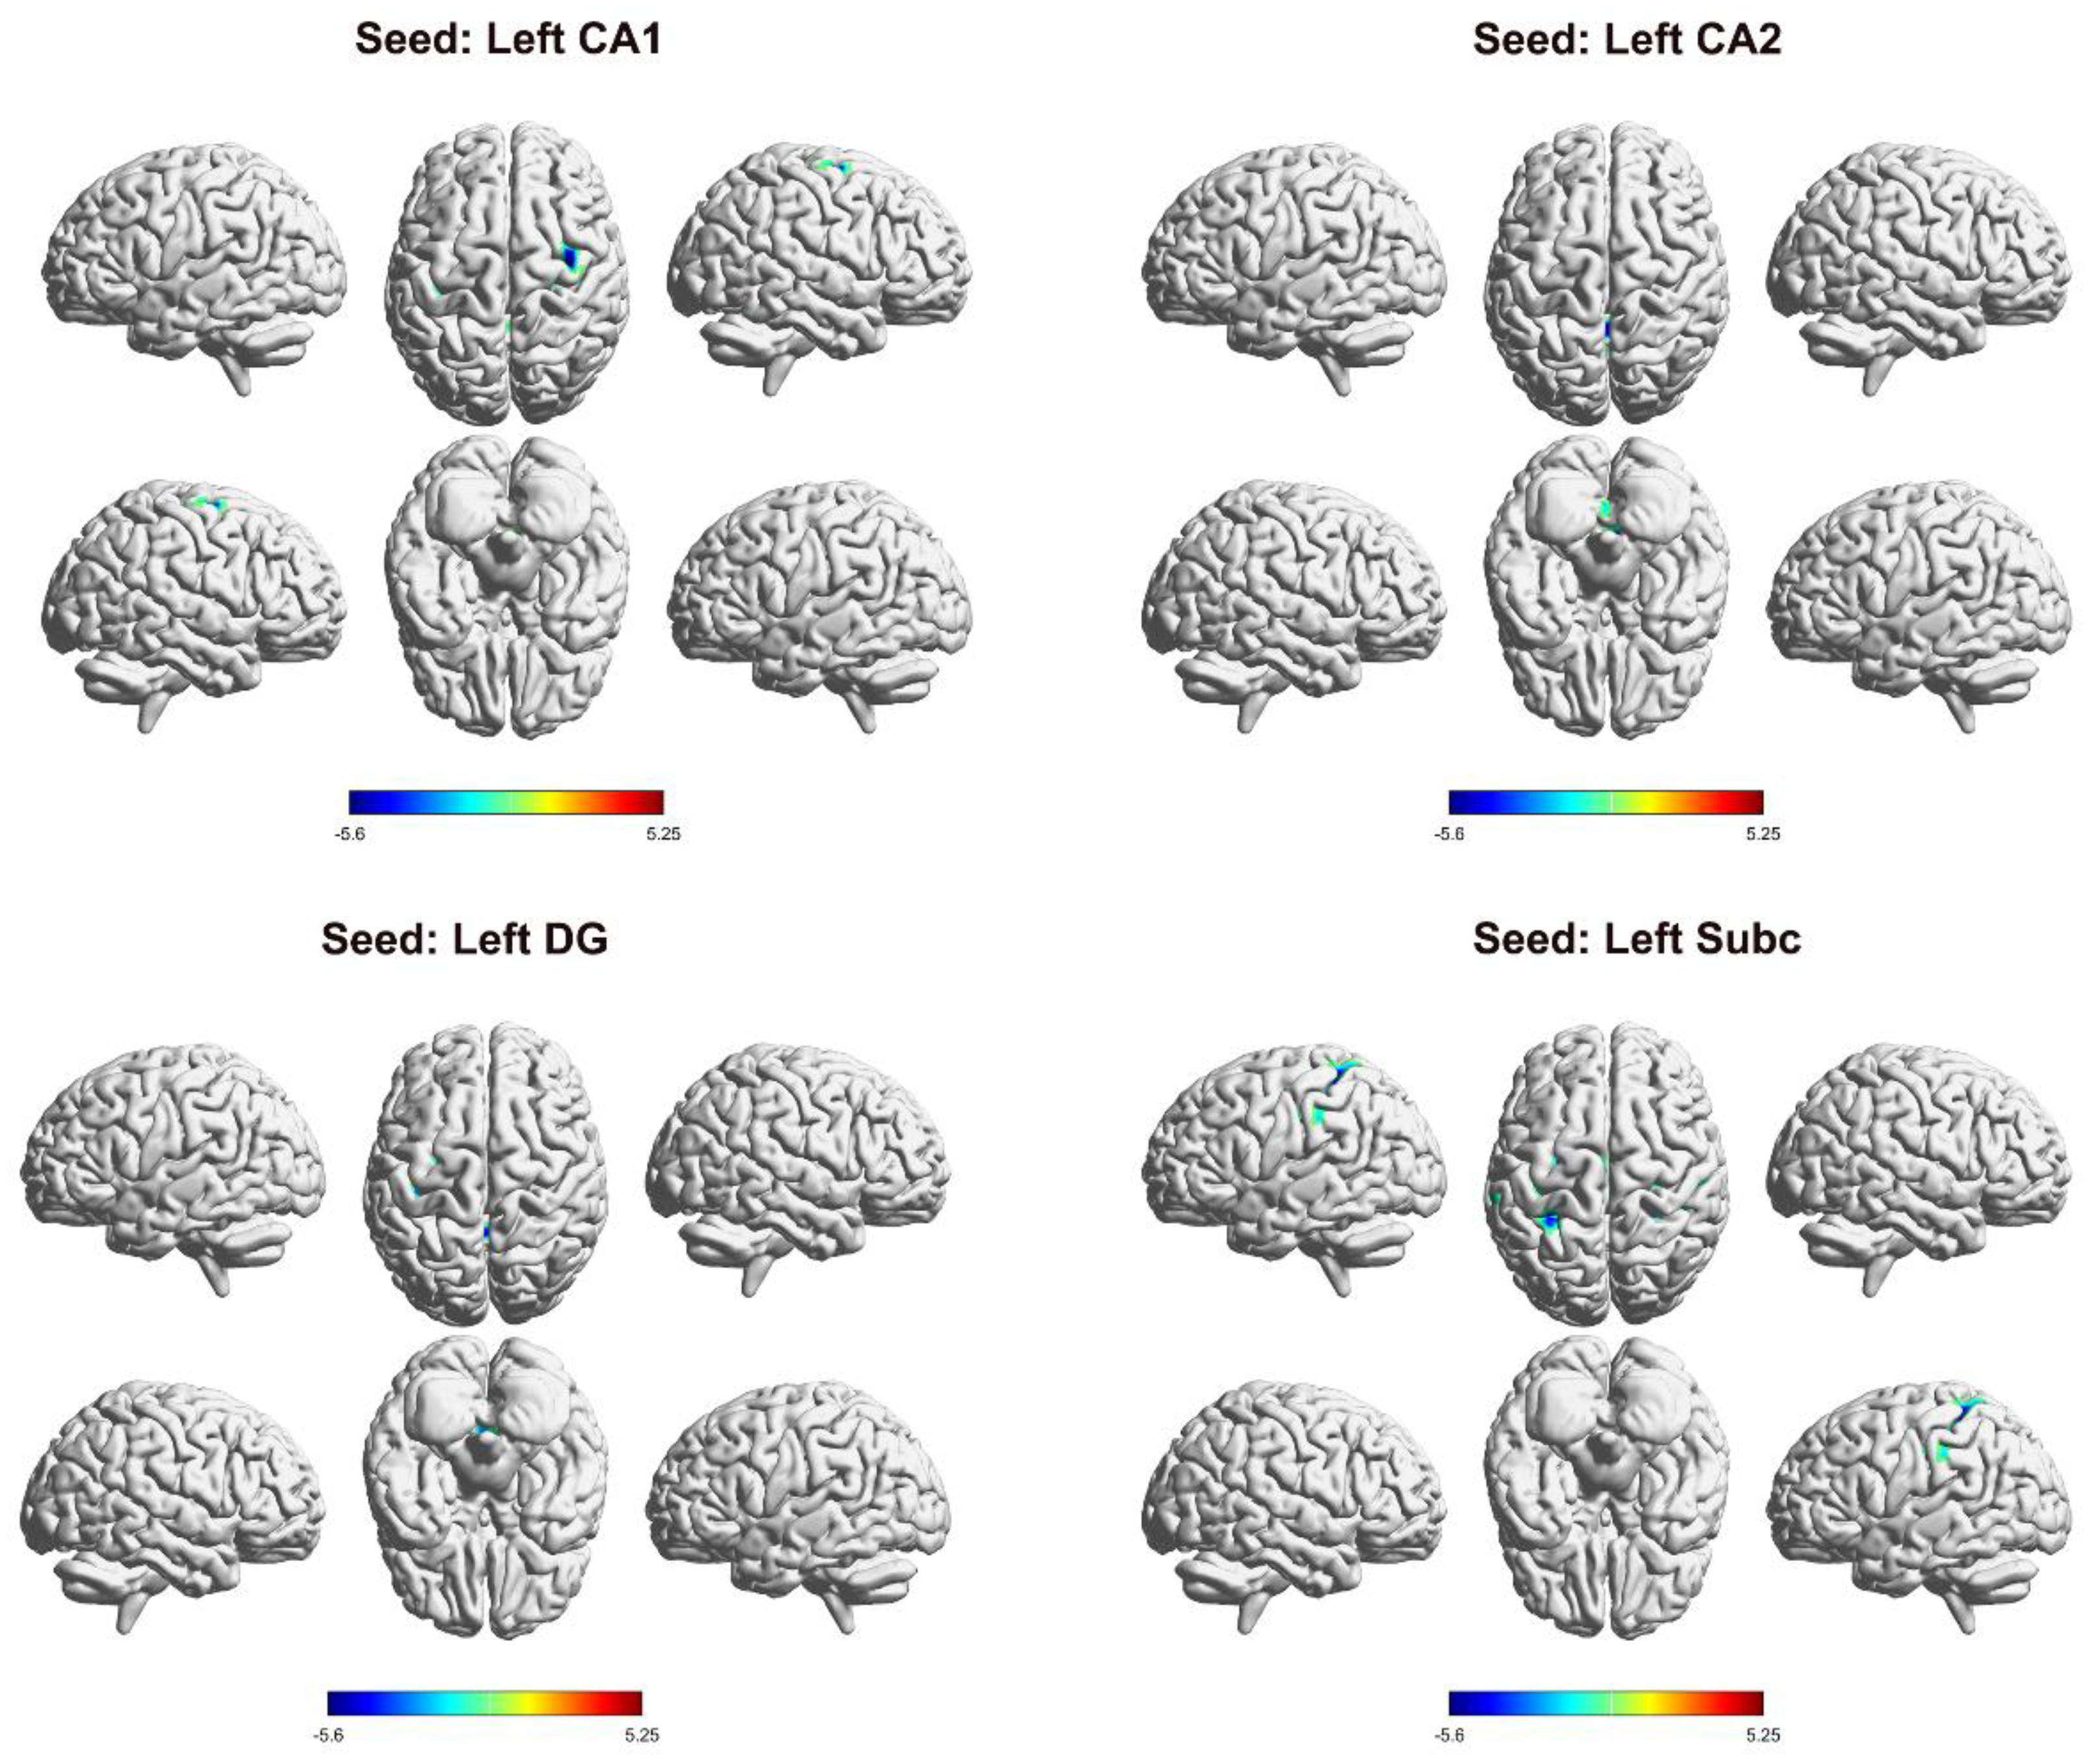
Figure 3.
Differences in FC in the right hippocampal subregion. Spatial distribution was visualized using surface brain imaging in BrainNet Viewer (BrainNet Viewer 1.7, www.nitrc.org/projects/bnv/).
Figure 3.
Differences in FC in the right hippocampal subregion. Spatial distribution was visualized using surface brain imaging in BrainNet Viewer (BrainNet Viewer 1.7, www.nitrc.org/projects/bnv/).
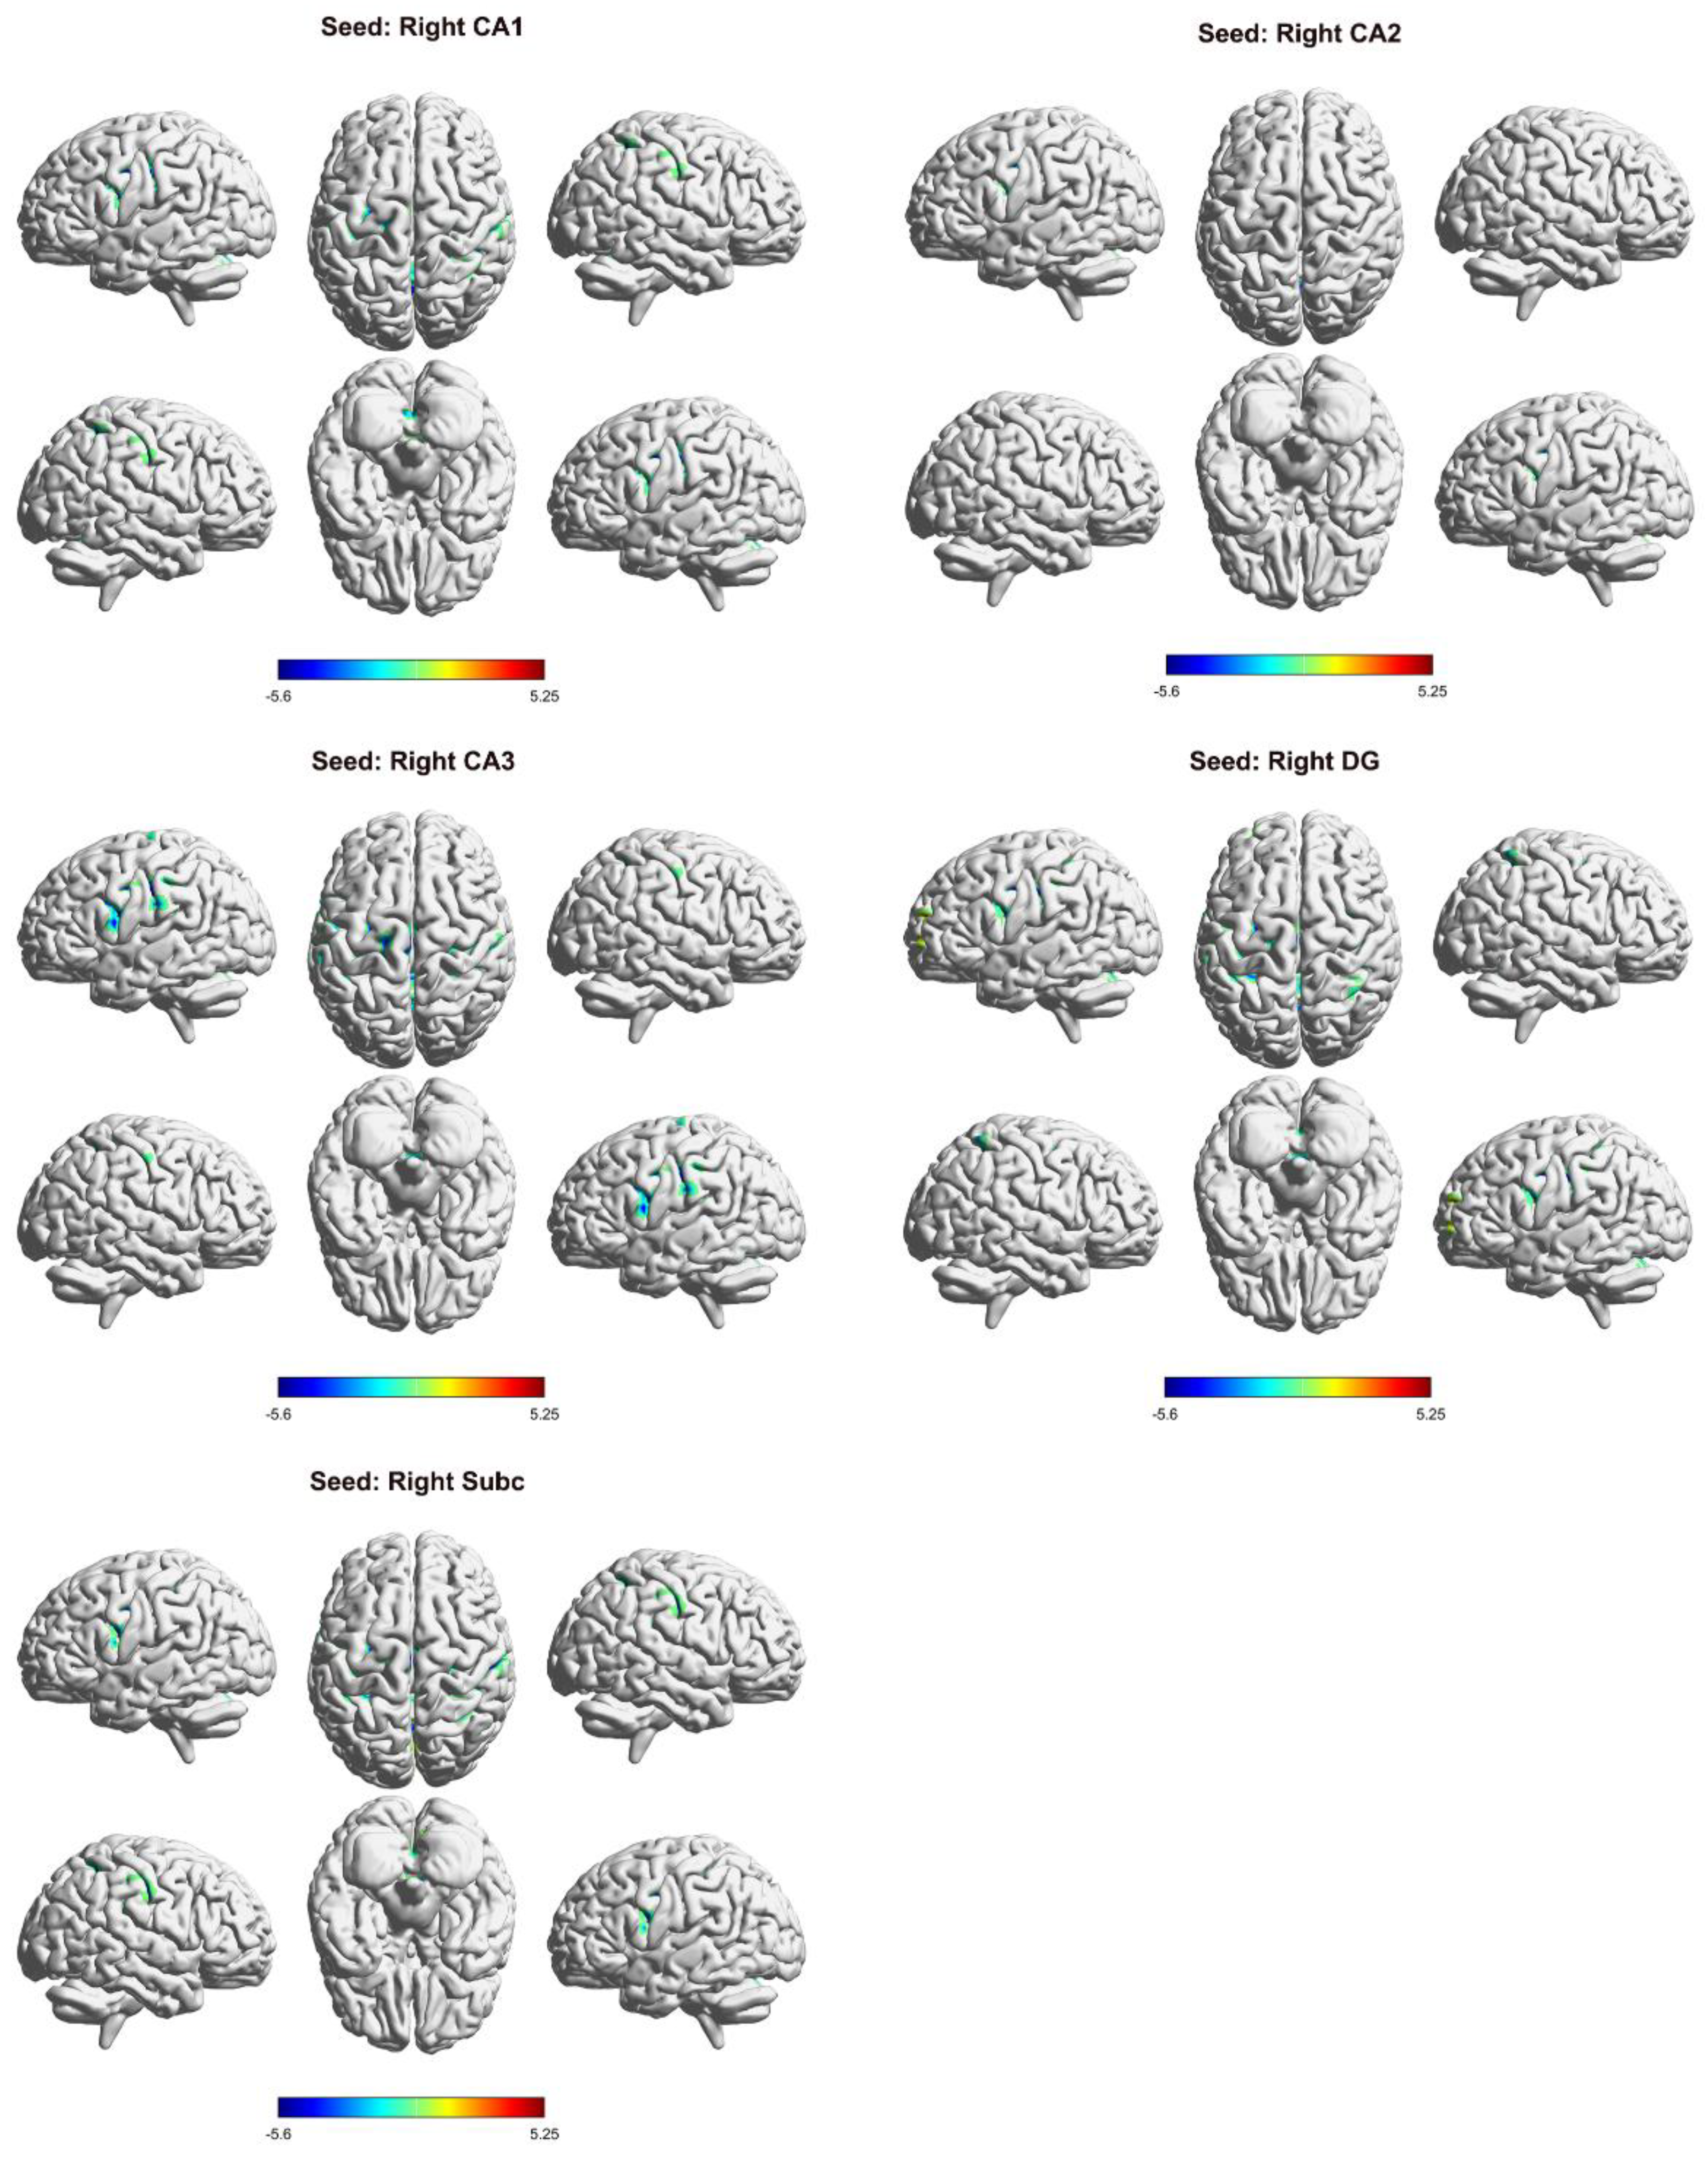
Figure 4.
Correlation between hippocampal FC and clinical indices in PACG patients.
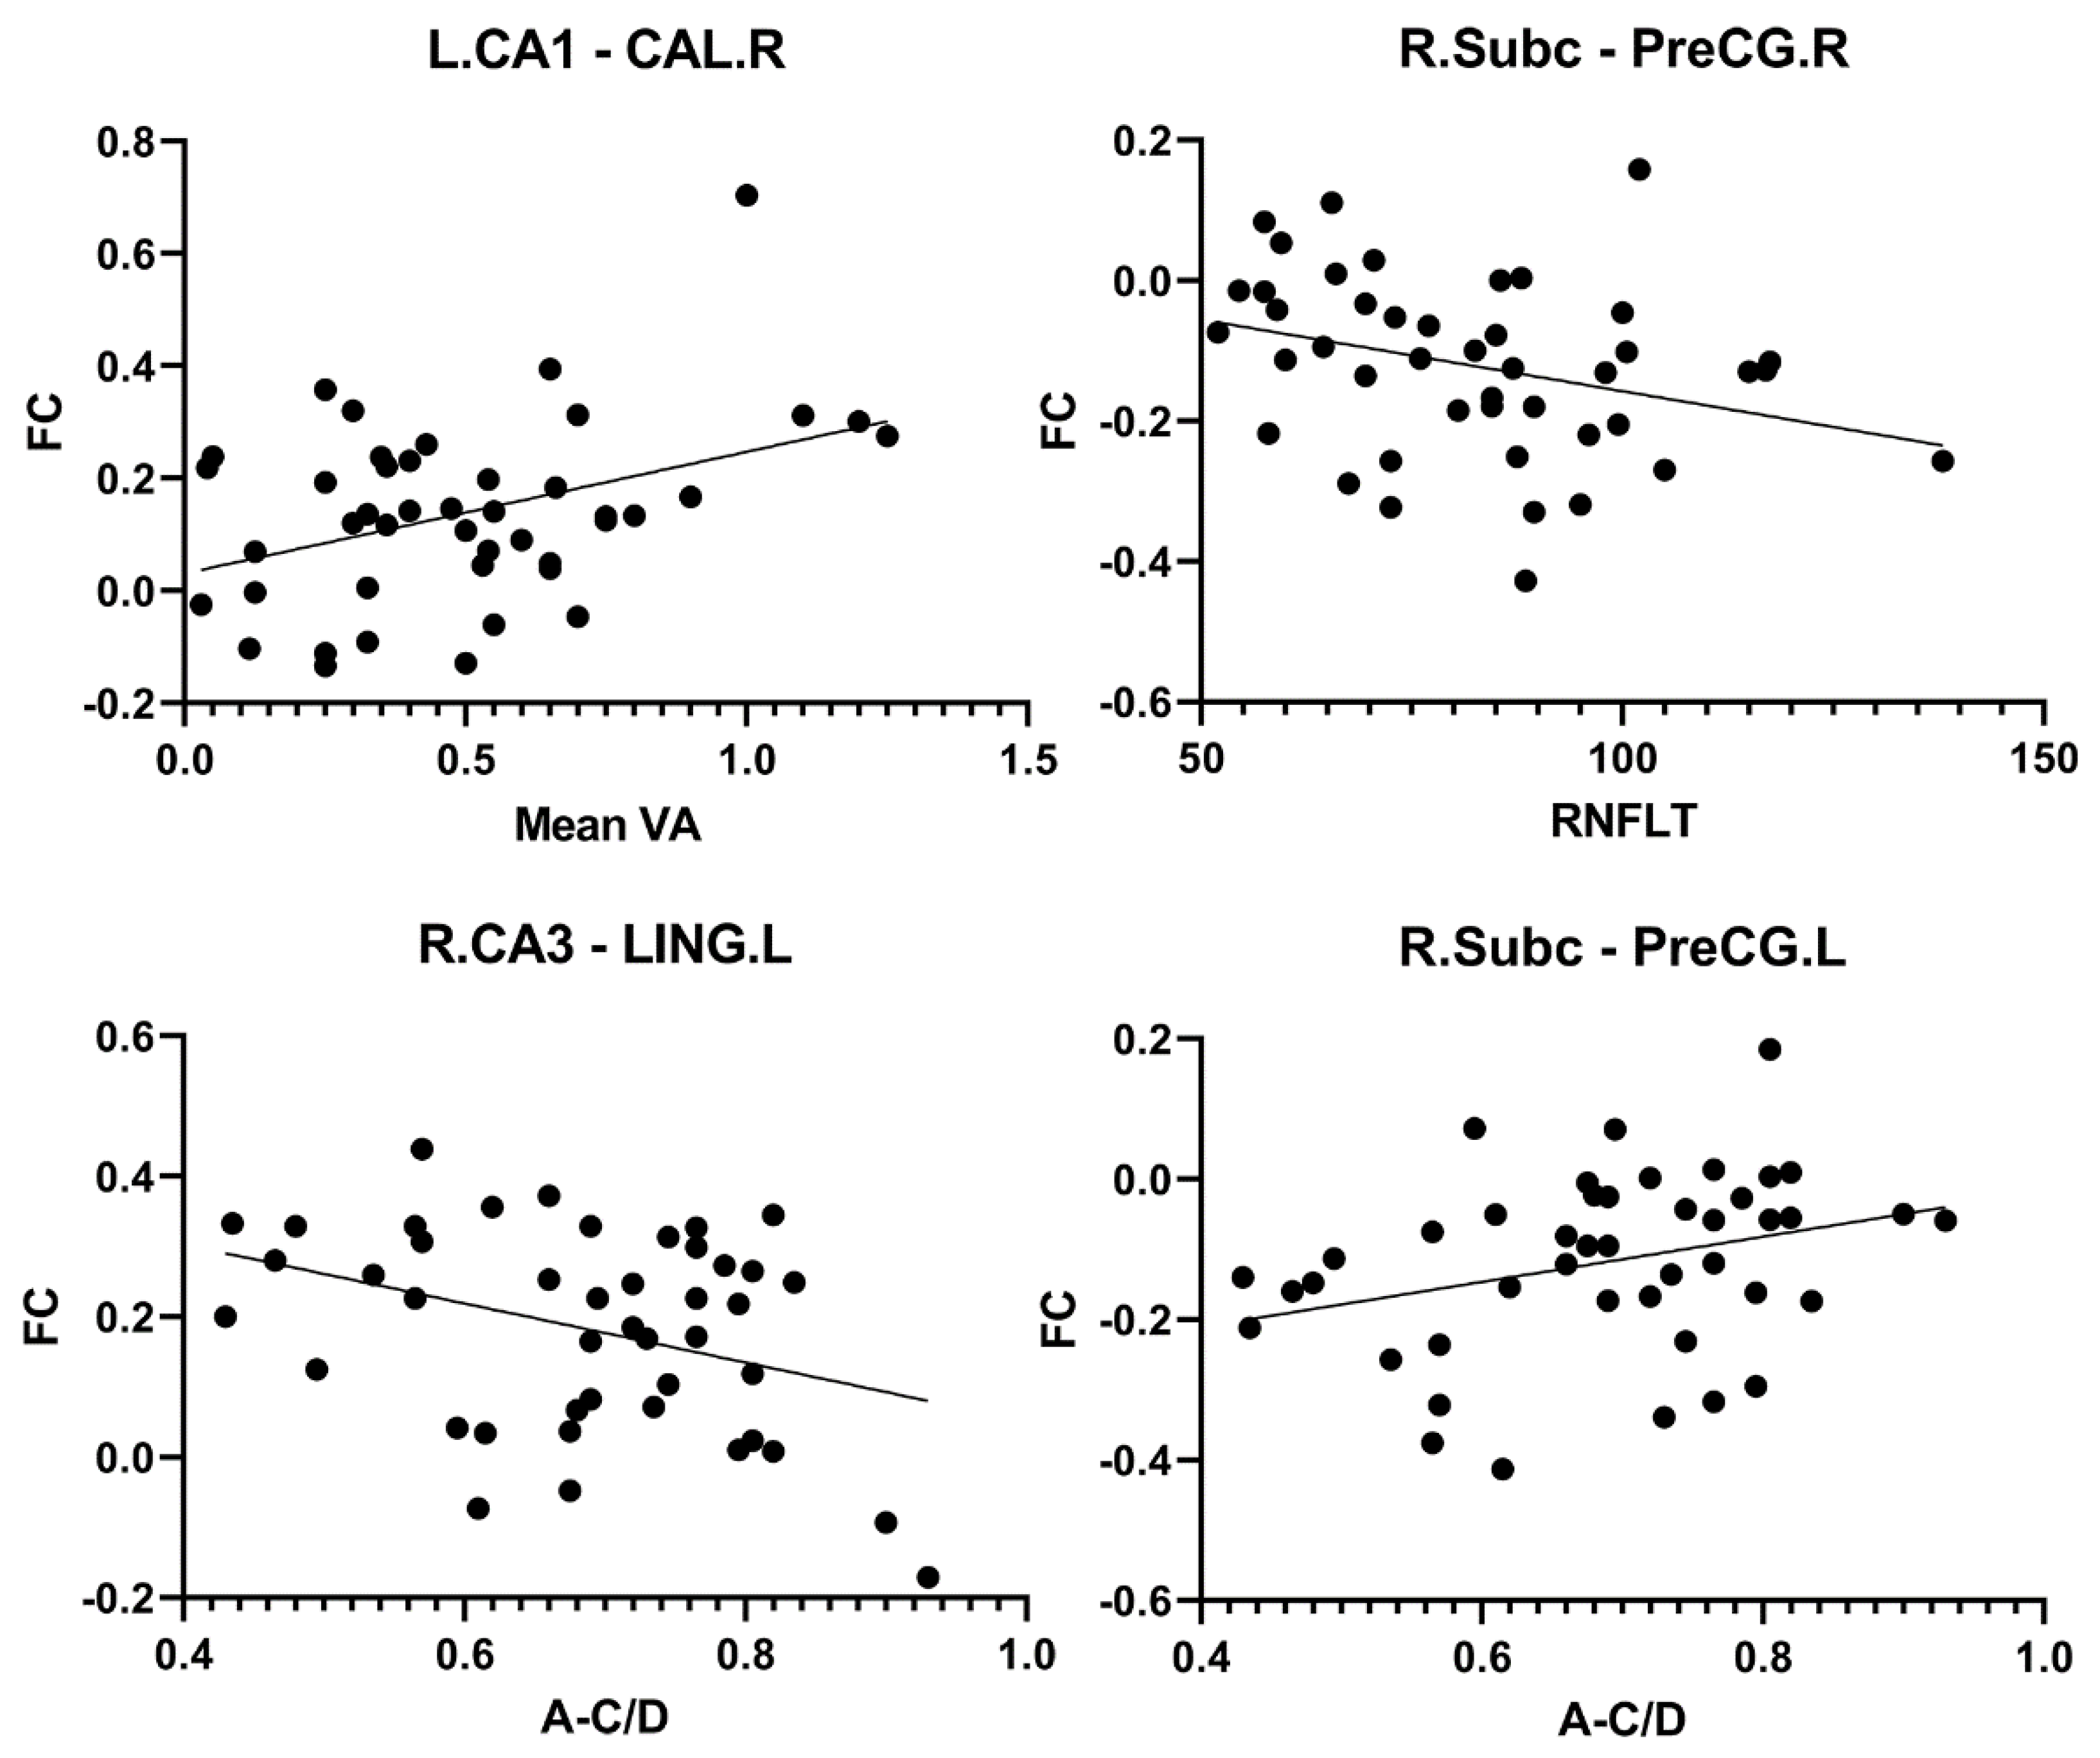

Table 1.
Demographics and clinical characteristics of all subjects.
| Condition | PACG(n=44) | HC(n=46) | p value | Statistics |
|---|---|---|---|---|
| Age(years) | 55.64±9.04 | 54.61±8.93 | 0.589 | 0.542 |
| Gender(male/female) | 16/28 | 18/28 | 0.787 | 0.073 |
| Education level(years) | 8.89±3.36 | 9.43±2.7 | 0.394 | -0.856 |
| Disease duration(years) | 0.45 (0.04,1) | - | - | - |
| Mean VA | 0.5±0.3 | 1.11±0.18 | <0.001 | -11.838 |
| IOP(mmHg) | 28.56±8.75 | 15.53±2.05 | <0.001 | 9.82 |
| RNFLT(μm) | 82.23±19.46 | 117.1±8.52 | <0.001 | -11.097 |
| A-C/D | 0.69±0.12 | 0.46±0.1 | <0.001 | 9.784 |
| V-C/D | 0.66±0.17 | 0.5±0.08 | <0.001 | 5.767 |
| MoCA | 22.43±3.07 | 27.04±1.43 | <0.001 | -9.205 |
Note: PACG, primary angle-closure glaucoma; HCs, healthy controls; IOP, RNFLT, A-C/D, V-C/D, and VA are presented as the binocular mean values. IOP, intraocular pressure; RNFLT, retinal nerve fiber layer thickness; A-C/D, average cup-to-disc ratio; V-C/D, vertical cup-to-disc ratio; VA, visual acuity; MoCA, Montreal Cognitive Assessment. The same abbreviations are used for all figures and tables.
Table 2.
The results of seed-based FC analysis.
| seed | brain region | MNI | Voxels | t value | ||
|---|---|---|---|---|---|---|
| X | Y | Z | ||||
| L_CA1 | cerebellum | 15 | -45 | -33 | 82 | -5.1998 |
| CAL_R | 18 | -60 | 6 | 68 | 5.2531 | |
| PreCG_R | 39 | -6 | 66 | 157 | -5.603 | |
| PreCG_L | -30 | -18 | 51 | 78 | -5.3584 | |
| L_CA2 | cerebellum | 0 | -48 | -12 | 173 | -5.9324 |
| L_DG | cerebellum | 0 | -51 | -21 | 119 | -5.2706 |
| PreCG_L | -30 | -21 | 51 | 150 | -5.5942 | |
| L_Subc | PoCG_R | 27 | -42 | 45 | 267 | -6.2276 |
| SMG_L | -48 | -33 | 30 | 165 | -5.0492 | |
| PreCG_L | -27 | -12 | 51 | 116 | -5.0965 | |
| SMA_L | -3 | -6 | 57 | 67 | -4.5938 | |
| R_CA1 | cerebellum | 15 | -48 | -27 | 337 | -6.1275 |
| PreCG_L | -45 | 0 | 36 | 144 | -5.5733 | |
| SMG_L | -51 | -21 | 36 | 286 | -5.1464 | |
| PoCG_R | 39 | -33 | 48 | 210 | -4.9792 | |
| R_CA2 | cerebellum | 21 | -60 | -33 | 107 | -5.1806 |
| IFGoperc_L | -45 | 3 | 27 | 64 | -4.8923 | |
| R_CA3 | cerebellum | 21 | -57 | -33 | 290 | -5.2591 |
| LING_L | -15 | -51 | 0 | 145 | 5.3832 | |
| CAL_R | 18 | -60 | 9 | 99 | 5.4462 | |
| PoCG_L | -51 | -18 | 36 | 1743 | -5.5171 | |
| PAL_R | 18 | 6 | 3 | 56 | -4.47 | |
| ROL_R | 57 | 6 | 15 | 91 | -4.4437 | |
| R_DG | cerebellum | 21 | -60 | -33 | 352 | -5.8117 |
| ACG | 0 | 42 | 12 | 218 | 5.023 | |
| PreCG_L | -36 | 3 | 30 | 113 | -5.0394 | |
| IPL_R | 36 | -45 | 39 | 107 | -4.5107 | |
| PreCG_R | 36 | -9 | 45 | 120 | -5.3434 | |
| IPL_L | -27 | -12 | 51 | 457 | -5.6223 | |
| SMA_L | -3 | -6 | 54 | 116 | -5.3053 | |
| R_Subc | cerebellum | 21 | -60 | -33 | 199 | -5.0727 |
| CAL_L | -9 | -69 | 18 | 318 | 5.0858 | |
| PreCG_R | 45 | 3 | 30 | 67 | -4.5003 | |
| PreCG_L | -45 | 0 | 39 | 77 | -4.4107 | |
| PoCG_R | 39 | -33 | 48 | 1078 | -5.3631 | |
Note: FC, functional connectivity; CA, Cornu Ammonis; DG, Dentate gyrus; Subc, Subiculum; CAL, Calcarine fissure and surrounding cortex, PreCG, Precental gyrus; PoCG, Postcentral gyrus; SMG, Supramarginal gyrus; SMA, Supplementary motor area; I IFGoperc, inferior frontal gyrus, opercular part. LING, Lingual gyrus; PAL, Lenticular nucleus, pallidum; ROL, Rolandic operculum; ACG, Anterior cingulate and paracingulate gyri; IPL, Inferior parietal, but supramarginal and angular gyri. The same abbreviations are used for all figures and tables.
Table 3.
Correlation between hippocampal FC and clinical indices in PACG patients.
| seed | Brain region | clinical parameter | r value | p value |
|---|---|---|---|---|
| L_CA1 | CAL_R | Mean VA | 0.396 | 0.008 |
| R_Subc | PreCG_R | RNFLT | -0.312 | 0.039 |
| R_CA3 | LING_L | A-C/D | -0.358 | 0.017 |
| R_Subc | PreCG_L | A-C/D | 0.311 | 0.04 |
Disclaimer/Publisher’s Note: The statements, opinions and data contained in all publications are solely those of the individual author(s) and contributor(s) and not of MDPI and/or the editor(s). MDPI and/or the editor(s) disclaim responsibility for any injury to people or property resulting from any ideas, methods, instructions or products referred to in the content. |
© 2025 by the authors. Licensee MDPI, Basel, Switzerland. This article is an open access article distributed under the terms and conditions of the Creative Commons Attribution (CC BY) license (http://creativecommons.org/licenses/by/4.0/).
Copyright: This open access article is published under a Creative Commons CC BY 4.0 license, which permit the free download, distribution, and reuse, provided that the author and preprint are cited in any reuse.


