
Submitted:
11 May 2023
Posted:
12 May 2023
You are already at the latest version
Abstract
Background. In the last decade, it was concluded that glaucomatous optic neuropathy is part of the neurodegenerative diseases in which destructive neuronal lesions are located not only in the structure of the retina, but they are also present at the level of the central visual and nervous pathways. Patients with Primitive Open Angle Glaucoma may have experienced changes such as sensorineural hearing loss as well as balance changes. The purpose of this study is to evaluate the degree of involvement of the auditory system in patients with glaucoma, the structural changes in the optic nerve and, to establish correlation between the hearing loss and structural changes in the optic nerve. The subjects included in the study are grouped as follows: a group of patients with glaucoma that will be compared to a group of patients without glaucoma only as well as identi-fy-ing the evolution of structural changes in optic nerve to patients with glaucoma and to normal patients. Material and methods. It is a prospective, cross-sectional study on 32 eyes of 16 subjects with Primitive Open Angle Glaucoma in a study group and 24 eyes of 12 healthy subjects in con-trol group with a mean age of 62 years in both groups. Both groups underwent ophthalmo-logical, audiological and radio imaging evaluation: Pure-tone audiometry (PTA) were recorded, oph-thalmologic evaluations according to a standardized protocol and MRI cerebral examination was performed. Results: In the Study group patients, compared to the Control group, the average lev-els of the left PTA, the cup/disc (C/D) area in both eyes, the C/D ratio in both eyes are in-creased. The mean level of Retinal nerve fiber layer (RNFL) mean thickness was slightly lower in patients with glaucoma. Multivariate analysis demonstrates that gender can be a good predictor of C/D area, gender and age can be good predictors of PTA both eyes and C/D ratio in the right eye, and gender, age and background can be good predictors of disc area in the left eye. Conclu-sions: Pa-tients with Primitive Open Angle Glaucoma show changes in audiometry test in correla-tion with ophthalmological parameters demonstrating that the auditory system can be affected in Primitive Open Angle Glaucoma. This study emphasizes the problem of interdisciplinarity in medicine with the aim of ensuring the quality of life of patients with glaucoma. A good collabora-tion between ophthalmologist and otolaryngologist will be very useful for these patients.
Keywords:
hearing loss
; pure tone audiometry
; structural changes in the optic nerve
; RNFL
; C/D ratio
1. Introduction
In 1922, Felix Lagrange of Bordeux noted that a glaucomatous eye is “a sick eye in a sick body” [1]. Nowadays, this intriguing statement remained a challenge in the study of glaucoma disease even after 100 years. Glaucoma has long been consid-ered a multi-factorial optic neuropathy, slowly progressive characterized by irre-versible damage to the optic nerve accompanied by the thinning and specific loss of retinal ganglion cells and the visual field [2]. The pathophysiology of glaucoma-tous optic neuropathy is completely unknown, and several mechanisms involved are approved: mechanical stress, changes in ocular blood flow, oxidative stress and neurotrophic factors that af-fect the survival of Retinal Ganglionar Cells (RGCs) and some RGCs being more sus-ceptible to destruction than others [3,4,5]. In 2007, Gupta and Yucel hypothesized that glaucomatous disease is a neurodegenerative condition, opening new perspectives in the pathophysiological approach of the disease with multiple implications both in the mechanisms of disease and in ther-apeutic management [6]. They were the first who stated that high IOP and the de-struction of the RGCs can be a trigger factor for transsynaptic degeneration in the lateral geniculate bodies (LGB) and visual cortex. Lowering intraocular pressure (IOP) is the best way to prevent RGCs death and may decrease the risk of central nervous system (CNS) degeneration in glaucoma. In 2009, Gupta showed that pa-tients with glaucoma have degenerative lesions in the LGB of the thalamus in the magnocellular, parvocellular, and koniocellular layers [7]. These changes were re-lated to intraocular pressure and the severity of optic nerve injury. Viewed as a neurodegenerative brain disease rather than a simple eye disease glauco-ma has generated various studies which demonstrate that the complex connection be-tween the eye and the brain is essential to the disease as stated by Jeffrey L. Gold-berg in 2010 [8]. The key process in glaucoma is the loss of specific neuronal popu-lations like in other neurodegenerative diseases such as Alzheimer's dementia [9]. Several mechanisms of neurodegenerative disorders also occur in glaucoma: oxi-dative stress, mitochondrial dysfunction, glutamate excitotoxicity, abnormal pro-tein accumulations [5,10,11,12] and neuroinflammatory reactions, especially at the level of glial and mi-croglial cells [13] with release of proinflammatory cytokines interleukines (IL1, IL6, TNFα) and chemokines (CCL2, CX3, CL1) at the first relay level central (thalamus: LGB and superior quadrigeminal colliculi) [14], dysfunction in the expression patterns of several markers of synaptic plasticity [15] in the LGB and visual cortex. Looking at glaucoma as a neurodegenerative disease, there is the hypothesis of an increased vulnerability to neuronal destruction explained by several mechanisms and there is a possibility that during the evolution of the disease it is accompanied by a functional de-cline in the senses and outside the visual pathways. Summing up, these visual and auditory deficits lead to a complex impairment of the patient with glaucoma and turns the ophthalmological condition into a public health problem. Along with the increase in life expectancy and the phenomenon of population ageing, both the two types of visual and auditory deficits generate a decrease in the quality of patients’ life, which is finally reflected in social life. Most research exploring non-visual sensory deficits has focused on the incidence of hearing loss in association with glaucoma, the findings being debatable and with variable incidence in high and low blood pressure groups [16,17]. The evidence supporting a link with peripheral hearing loss (related to a deficit at the cochlear level) is more consistent, in patients with pseudo-exfoliation glaucoma, where hearing loss is connected to the accumulation of pseudoexfoliation material in the extracellular matrix of the inner ear [18,19,20,21,22,23,24].
This study aimed at establishing the existence of some correlations between dam-age to the optic nerve, a defining element in glaucomatous disease with possible hearing impairment, both systems being extremely involved in ensuring the quality of life. On the one hand, the idea of studying these two systems, visual and auditory occurred as a natural consequence of the cortical anatomical and functional connections but al-so of current clinical findings.
2. Materials and Methods
2.1. Study Design.
A prospective, cross-sectional, observational study took place in the Ophthalmology Department of Clinical County Emergency Hospital of Braila during October 2021 and December 2022. Patients were evaluated for a period of 6 months after enrollment. This study was approved by the Ethics Commission of Clinical County Emergency Hospital of Braila, approval no.1/3.09.2021 in compliance with the ethical and deontological rules for medical and research practice. The study was con-ducted in accordance with the Declaration of Helsinki. In-formed consent forms were obtained from the patients. Inclusion criteria for patients was: presence of glaucoma was defined by high intraocular pressure without treatment, abnormal visual field defects on SAP and characteristic optic nerve head morphology (rim loss and corre-sponding retinal nerve fiber layer and visual field loss) in the presence of open irido-corneal angle, patients with glaucoma had to present the disease in both eyes to be in-cluded in the study, age range of 47 to 70 years, refractive error not exceeding a 4 di-opter sphere and a 2 diopter cylin-der, and transparent ocular media. All the glaucoma participants were on topical glaucoma medications.A history of uneventful cataract surgery was allowed for study participants. Healthy volunteers were required to have, in both eyes, intra-ocular eye pressure less 21 mmHg, clinically normal optic discs, SAP within nor-mal limits, and no ocular or systemic abnormalities that could affect optic nerve structure or visual function. Ophthalmological exclusion criteria refers in principal to ocular disease as well as systemic disease known to affect visual and hearing processing for each participant in study group or control group. These criteria included best-corrected visual acuity (BCVA) worse than 20/100, refractive error greater than ± 4 sphere diopters or 2 cylinder diopters, optically significant cataract, gonioscopy showing occluded angle, or anterior peripheral synechiae or excessive pigmentation or deposits of exfoliating material, history of inflammatory eye disease, previous eye trauma, diabetic retinopathy, neuro-ophthalmological disease, optic nerve abnormalities ( tilted disc, drusen), or angle anomalies, any retinal disease or other ocular or systemic disease capable of causing visual field loss or optic nerve damage, including intracranial injury or orbital disease. Participants who showed poor cooperation or had claustrophobia were also excluded. Hearing exclusion criteria were :conductive hearing loss, family history of hearing loss, problems in the neck muscles, high noise exposure, acute or chronic ear infection, tympanic membrane perforation, ear surgery, head trauma, active upper respiratory tract infection, history of drugs special ototoxic drugs and systemic dis-eases that affect hearing, auditory trauma, chronic lesions of the auditory apparatus were excluded from the study. Patients and voluntary without other neuro-logical diseases that could have disturbed the investigation were included in the study.
The subjects included in the study are grouped as follows: a group of patients with glaucoma that will be compared to a group of patients without glaucoma only as well as identifying the evolution of structural changes in optic nerve to patients with glau-coma and to normal patients. It is a prospective, cross-sectional study on 32 eyes of 16 subjects with Primary Open Angle Glaucoma(POAG) in a study group and 24 eyes of 12 healthy subjects in control group with a mean age of 62 years in both groups. Six-teen patients with POAG (study group) and twelve healthy subjects age and sex-matched controls participated. All the 16 case participants from the Ophthalmology Department of Clinical County Emergency Hospital of Braila were enrolled. The control participants were enrolled through the same hospital’s general Eye Department, or volunteer friends/relatives of cases or staff members. Of the 16 patients in the study group, 11 were female and 5 were male. Of the 12 healthy volunteers in the control group, 9 were female and 3 was male. Ophthalmological and audiometry evaluations were performed in both groups. It is a prospective, cross-sectional study on 32 eyes of 16 subjects with Primitive Open Angle Glaucoma in a study group and 24 eyes of 12 healthy sub-jects in control group with a mean age of 62 years in both groups. Starting from the population that addresses the main author, in one year/month (N=800), with a sampling error of 17%, a representative sample of 33 people is obtained (https://infomass. ro/computer-error-example/). Initially, the study group consisted of 33 patients investigated and diagnosed with glaucoma. Based on the rigorous and restrictive inclusion and exclusion criteria explained in study design, it started with 33 patients with glaucoma from which they were excluded: 9 patients based on the severity of the glaucomatous disease. From the rest, 8 were excluded who did not they met the stated criteria and thus resulted in 16 patients with glaucoma included in the study. The control group included 12 patients because only these patients met the rigorous inclusion and exclusion criteria and signed the in-formed consent. It should be mentioned that all patients and witnesses were examined by MRI, a difficult investigation to accept especially for subjects. (Figure 1).
2.2. Evaluation protocol
Ocular examinations. All participants had a detailed medical history and full ocular examinations: BCVA, refraction, and intraocular pressure (IOP) measurements, slit-lamp and fundus examinations, central corneal thickness (CCT). Refractive errors were evaluated by autorefractokeratometer (Reichert RK600, Reichert Technologies Inc, NY, USA). Bilateral IOP was measured once in the morning between 10:00 AM with Goldmann applanation tonometry and anterior segment was evaluated by slit-lamp (Reichert Xcel 200, Reichert Technologies Inc, NY, USA) by ophthalmologists. CCT was measured with central corneal ultrasonic pachymetry (OcuScan RxP; Alcon Laboratories Inc., Irvine, CA), fundus examinations were performed with 90D lens Volk Optical USA. Anterior chamber angle was estimated using 3 mirror lens Ocular Instruments, USA. We performed visual field (Standard Authomatic Perimetry-SAP) and OCT. Visual field means least two reliable SAP (Optopol Technology PTS 900, Glaucoma field, Strategy Fast threshold, Optopol Technology S.A., Zawiercie, Poland). If false negative errors were higher than 15% or false-positive or false-negative rates were higher than 15%, we reexamined the patient with more frequent breaks if he is tired or with better training. Abnormal SAP results were defined as typical glaucomatous defects with integrated perimetric defect in the clinical context, MD (mean defect) and Pattern defect (PD). Spectral-domain optical coherence tomography (OCT) imaging was performed using Optopol SOCT Copernicus (version 4.20, rev.5, SOCT Soft-ware 4, 3, Optopol Technology S.A., Zawiercie, Poland). The images were obtained un-der pupil dilation using the ultra–high-resolution spectral-SD OCT Copernicus who used to acquire tomograms with a wavelength of 850 nm and a theoretic axial resolution of 5.0 μm (7×7×2 mm, 75 B-scans, 743 A-scans per B-scan, fixation target set to image the optic disc). The cup diameter (using a cup offset 150 μm anteriorly to the disc axis), cup maximal depth, and horizontal rim size (distance between horizontal disc and cup diameters) and temporal and nasal height (be-tween the horizontal cup diameter level and the RNFL, limited on the periphery by the disc margins) were measured automatically. Peripapillary RNFL thickness was measured in a region from 1200 to 1600 μm on both sides of the center of the cup and Optic Nerve Head (ONH) parameters, including rim area, disc area, area Cup/Disc ratio, average CDR and vertical CDR (same as the default setting in the Optopol automated analysis). Only good-quality scans, defined as scans with a signal strength least of 7, without RNFL discontinuity or misalignment, or involuntary saccade or blinking arti-facts. We are performed OCT in a quiet and dark room, and were used artificial tears before OCT image acquisition for patient comfort. Optic nerve assessment included evaluation of optic disc size, neuroretinal rim shape, and a retinal nerve fiber layer. In the evaluation of glaucoma, qualitative and quantitative structural analyzes are lim-ited to optic nerve head and retinal nerve fiber layer parameters, but visual function depends on the functionality of the entire optic pathway.
Imaging evaluations. All the participants are performed brain magnetic resonance imaging (MRI) to exclude other ear diseases like cochlear ossification, active mastoidi-tis or cerebral tumor. MRI was performed with General Electric Healthcare MRI Signa Explorer, USA,2019; 1,5 Tesla with the orbit and head protocol performed by specialist radiologist. All subjects were examined head first, supine position. This de-vice allows head stabilization with foam cushions on both sides to minimize head motion. To minimize eye movement and possible anatomical changes during image acquisition process, participants were advised to look straight ahead for ensure standardization and repeatability of the MRI scans, the axial plane of each MRI session was set parallel to the line from the anterior commissure to the posterior commissure on sagittal local-izer images. For MRI scans of the optic nerve and cerebral tissue we combined orbit test and head test. For examination a orbit region we use nine series data: 3-Plane lo-calizer with field of view (FOV)= 30.0, echo time (TE)=1.8, bandwidth =31.2 and slice thickness =5.0, Ax T2 Propeller with field of view (FOV)=25.0, repetition time (TR)=4019.0, echo time (TE)=106.7, bandwidth =50.0 and slice thickness = 4.0, Ax T2 Flair with field of view (FOV)= 24.0, repetition time (TR)=9000.0, echo time (TE)=120.0, bandwidth =31.25 and slice thickness = 4.0, 3D Ax Swan(SWI) with field of view (FOV)=24.0, repetition time (TR)=79.9, echo time (TE)=50.0 bandwidth = 31.25 and slice thickness =3.0, Ax DWI b1000 with field of view (FOV)=24.0, repetition time (TR)=4543.0, echo time (TE)= min, bandwidth =250.0 and slice thickness =5.0, Sag3DT1 FSPGR with field of view (FOV)=25.6 ,repetition time (TR)= 8.5, echo time (TE)=min full bandwidth =22.73 and slice thickness =2.0, CorT2STIR with field of view (FOV)=20.0, repetition time (TR)= 2606.0, echo time (TE)=55.0, bandwidth =31.25 and slice thickness =2.0, Ax T2 Propeller with field of view (FOV)=22.0, repetition time (TR)=3854.0, echo time (TE)= 118.5, bandwidth =41.67 and slice thickness = 3.0, 3DAx T2 Cube with field of view (FOV)= 22.0, repetition time (TR)=2022.0, echo time (TE)=150.0, bandwidth =41.67 and slice thickness =1.0.
Ears examinations. Bilateral ear examination was performed by specialist otolaryn-gologist prior to hearing testing with Heine beta 200 otoscope. Audiometry evaluation was performed using pure-tone audiometry in a special double-walled soundproof booth quit room. Air–condition pure-tone thresholds audiometry was per-formed using a Audiometer MAICO MA53, two channels (MAICO Diagnostic GmbH, Salzufer 13/14, D 10587 BERLIN), Noah 9 software or each ear at six frequencies (125,250,500,1000,2000, 4000, and 8000 Hz) by well-trained examiner and the results were recorded. Hearing loss was defined as pure-tone average thresholds at 125,250,500,1000,2000,4000 and, 8000 Hz averaged for both ears of > 40-dB. Hearing impairment was categorized by severity (mild or moderate-to-profound). The degree of hearing loss was assessed in accordance with ASHA recommendations thresholds of 0-25 dB (decibels) were evaluated as normal hearing, 26-40 dB as mild hearing loss, 41-55 dB as moderate hearing loss, 56-70 dB moderate-severe hearing loss, 70-90 dB severe hearing loss, and >90 dB as profound hearing loss [24,25,26,27]. Audiometry testing was repeated once if initial testing was deemed unreliable.
2.3. Statistical Analysis
The data were loaded and processed using the statistical functions of SPSS version 18.0 software (SPSS Inc, Chicago, IL).The ANOVA test consisted in analyzing the dispersion of the dependent variable: intra- and intergroup. The coefficient of variation (CV%) highlights the percentage deviation between two averages, providing results on the homogeneity of the series of values and the Skewness test (-2 < p < 2) validates the normality of the series of values; it is used when the examined variable has continuous values. In the calculation of the significant difference between two or more groups, depending on the distribution of the value series, at the significance threshold of 95%, for the quantitative variables, apply: the t-Student test: parametric test that compares the mean values recorded in 2 groups with normal distributions; the F-test (ANOVA) used when comparing 3 or more groups with normal distributions, combined with the application of the Bonferroni correction (Bonferroni post-hoc) to reduce the error rate when testing several hypotheses; the c2 test is a non-parametric test that compares 2 or more frequency distributions from the same population, and it is applied when the expected events are excluded; The Kruskal-Wallis test, a non-parametric test that com-pares 3 or more frequency distributions between groups; "Pearson" correlation coefficient (r) represents the correlation of 2 variables from the same group (direct/indirect correlation); The study of the correlation between different parameters was carried out with the help of the Pearson correlation coefficient, which reproduces the intensity of the statistical links and their meaning. The values of the correlation co-efficient are between [-1, +1]: if the correlation coefficient tends to +1 (direct correlation), or to –1 (indirect correlation), there is a strong linear dependence of the parameters; the closer the correlation coefficient is to 0, the lower the intensity of the link. Multiple linear regression aims to highlight the relationship between a dependent variable (explained, endogenous, result) and a set of independent variables (explanatory, factorial, exogenous, predictors); By using multiple regression, one often tries to get the answer to one of the questions: "what is the best prediction for ...?", "who is the best predictor for ...?". ROC curve – drawing the specificity/sensitivity balance as a prognostic factor.
3. Results
3.1. Epidemiologic characteristics.
Distribution by age groups: the study included 16 POAG patients in a study group and 12 healthy individuals in control group. All 56 eyes and ears of the total 28 subjects were included in the evaluation. During the study, a number of eight patients were excluded from the study group because: three patients were diagnosed with tympanic disorders: one of the patients had a hearing aid, one was diagnosed with a toxic hearing impairment and another patient was excluded from the study because she did not initially declare that she was wearing a hearing aid. Two patients were excluded to incomplete or unreliable OCT, one patient with an is-chemic stroke was identified and two patients did not continue the study protocol. The control group included 12 patients because only these patients met the rigorous inclusion and exclusion criteria and signed the informed consent.
This section may be divided by subheadings. It should provide a concise and precise description of the experimental results, their interpretation, as well as the experimental conclusions that can be drawn.
The series of values for age was homogeneous: variations in the range of 48-69 years; group average 61.64 years ± 6.53; groups median of 63 years; result of the Skewness test = -0.442; the average age in the Study group was significantly higher compared to the Control group (63.69 vs 58.92 years; p=0.05). Corroborating these results, age 65 is chosen as the threshold for further statistical comparisons. It was found that 56.3% of the patients in the Study group were over 65 years old, while 83.3% of the patients in the Control group were under 65 years old (p=0.039) (Figure 2).
Gender distribution: In the case study, female patients prevail (71.4%), the F/M ratio being 2.5/1. In the study groups, the percentage distribution was homogeneous (68.8% vs 75%; p=0.716) (Figure 3).
Following the analysis of the demographic data, it can be stated that there is an in-crease in the addressability of the female sex. Women go to the doctor easier than men and more easily accept all the investigations necessary to detect and monitor the disease.
Distribution by means of origin is: in the case study, the urban patients prevail (82.1%), the C/D ratio being 4.6/1. In the study groups, all patients in the Control group and 68.8% of the Study group came from the urban environment (p=0.011). Regarding the distribution according to educational status in the case study, over 70% of the patients completed their secondary (32.1%) or higher (39.3%) education. In the study groups, over 58% of the patients in the Control group and only 25% in the Study group completed their higher education (p=0.05).
3.2. Clinical parameters
Pure tone audiometry (PTA): PTA is a homogeneous variable in both the right and left ears, so statistical significance tests can be applied (Table 2): PTA in the right ear varied from 0 to 30 dB (min to max), the average level being 16.21 dB ± 7.14, close to the median value (15 dB), and the Skewness test result = 0.441; PTA in the left ear varied from 5 to 52 dB, the average level being 19.29 dB ± 10.87, close to the median value (18 dB), and the Skewness test result = 1.292. Both in the right ear (18.38 vs 13.33 dB; p=0.063), but especially in the left ear (23.25 vs 14 dB; p=0.023), the average level of PTA was higher in the Study group (Table 1).
The multivariate analysis highlighted the fact that the PTA level both in the right ear (Model 2 p=0.001) and in the left ear (Model 2 p=0.031) has gender and age as good predictors, statistically significant. By using multiple regression, one often tries to get the answer to one of the questions: "what is the best prediction for ...?", "who is the best predictor for ...?" (Table 2).
Disc area: The disc area is a homogeneous variable in both the right and left eyes: RE (right eye) disc area varied from 1.02 to 3.21, the mean level being 1.91 ± 0.52, close of the median value (1.86 mm2), and the Skewness test result = 0.544; LE (left eye) disc area varied from 1.06 to 2.83, the average level being 1.66 ± 0.40, close to the median value (1.65 mm²), and the Skewness test result = 0.838. Both in the right eye (1.93 vs 1.90; p=0.886) and in the left eye (1.77 vs 1.52; p=0.096), the average level of the disc area was slightly higher in the Study group.
The homogeneous variable Rim area in both the right and left eyes. In the RE this varied from 0.43 to 3.02, the mean level being 1.12 ± 0.54, close to the median value (1.04 mm2), and Skewness test result = 1.768; LE Rim area ranged from 0.28 to 1.98, the average level being 1.03 ± 0.41, close to the median value (1.0 mm2), and the Skewness test result = 0.303. In the right eye, the average level of the Rim area was significantly higher in the Control group (0.89 vs 1.42; p=0.007), in the left eye the difference was not statistically significant (0.93 vs 1.17; p =0.121).
The C/D to RE area varied from 0.10 to 0.79, the average level being 0.43 ± 0.18, close to the median value (0.40 mm2), and the Skewness test result = 0.428; the C/D LE area varied from 0.10 to 0.92, the average level being 0.40 ± 0.34, close to the median value (0.34 mm2), and the Skewness test result = 0.948. Both in the right eye (0.52 vs 0.31; p=0.001), and in the left one (0.49 vs 0.28; p=0.007), the average level of the C/D area was significantly higher in the Study group.
The ratio C/D to RE varied from 0.27 to 0.92, the average level being 0.64 ± 0.16, close to the median value (0.63), and the result of the Skewness test = -0.356; ratio C/ D LE ranged from 0.31 to 0.95, the mean level being 0.63 ± 0.16, close to the median value (0.60), and the Skewness test result = 0.380. Both in the right eye (0.70 vs 0.55; p=0.016) and in the left eye (0.70 vs 0.54; p=0.009), the mean level of the C/D ratio was significantly higher in the Study group.
RNFL average thickness (µm) in the RE ranged from 61 to 139 µm, the average level being 94.71 µm ± 16.07, close to the median value (94 µm), and the Skewness test result = 0.485; in the LE it varied from 0 to 128 µm, the average level being 98.57 µm ± 22.98, relatively close to the median value (100 µm), and the Skewness test result = 0.948. Both in the right eye (93.19 vs 96.75; p=0.571) and in the left eye (95.56 vs 102.58; p=0.434), the average level of RNFL average thickness was slightly lower in the group Study.
CCT central corneal thickness (µm): in the RE it varied from 75 to 572 µm, the mean level being 522.11 µm ± 89.72, relatively close to the median value (535 µm), and the result of the Skewness test = -1.903; in the LE it varied from 504 to 573 µm, the average level being 540.18 µm ± 18.73, close to the median value (539 µm), and the result of the Skewness test = -0.014. Both in the right eye (482.75 vs 537 .85; p=0.145), and in the left one (542.13 vs 539.40; p=0.735), no significant differences in the average level of CCT were revealed.
Correlations between PTA values with structural elements of the optic nerve: disc area, Rim area, C/D area, vertical C/D rap, average RNFL with demographic elements (age) and CCT:
Right ear PTA did not correlate significantly with RE disc area (r= -0.045; p= 0.820); Rim RE area (r= -0.216; p= 0.269); C/D RE area (r= +0.127; p= 0.521) or C/D RE ratio (r= +0.013; p= 0.946) Figure 4a–d.
Right ear PTA did not correlate significantly with the mean RNFL structure RE (r= -0.112; p= 0.570), Figure 4e.
Right ear PTA did not correlate significantly with RE CCT (r= -0.072; p= 0.715), Figure 4f.
Right ear PTA correlated significantly, directly, moderately in intensity with age (r= 0.629; p= 0.001), Figure 4g.
The test result variable(s): RE C/D ratio, RE C/D area, RE Rim area, RE RNFL average, PTA right has at least one tie between the positive actual state group and the negative actual state group. Statistics may be biased.
a Under the nonparametric assumption
b Null hypothesis: true area = 0.5
By plotting the ROC curve, the following parameters were highlighted as good predic-tors of glaucoma in the left eye (Figure 7): at values higher than 0.56 of the C/D ra-tio, with a sensitivity of 75% and a specificity of 42% (AUC=0.734; IC95%: 0.550-0.919; p=0.037); at values higher than 0.30 of the C/D area, with a sensitivity of 75% and a specificity of 50% (AUC=0.763; IC95%: 0.588-0.938; p=0.019) and at values higher than 14 of the left ear PTA with a sensitivity of 75% and a specificity of 50% (AUC=0.745; IC95%: 0.562-0.928; p=0.029).
The test result variable(s): LE C/D ratio, LE C/D area, LE Rim area, LE RNFL average, PTA left has at least one tie between the positive actual state group and the negative actual state group. Statistics may be biased.
a Under the nonparametric assumption
b Null hypothesis: true area = 0.5
4. Discussion
The dual visual and auditory impairment in glaucoma has aroused the interest of many researchers. It is interesting that these studies have a dual character, the topic being approached both from an ophthalmological starting point vision loss in glaucoma correlated with hearing dysfunction, but also in the opposite direction with an audiological starting point: hearing loss correlated with glaucomatous disease. Opinions are divided regarding the dual visual and auditory impairment in glaucoma. It is interesting that in the published studies the two visual and auditory dysfunctions are evaluated by more than one parameter. In 1997, Shapiro et al. examined 67 patients with glaucoma and found no connection between sensorineural hearing loss and visual loss that exceeded age-matched losses. But this study included patients with POAG of several types: pigmentary glaucoma, congenital glaucoma, and intraocular hypertension, which could explain the study results (17). Many studies have investigated hearing loss in patients with pseudoexfoliative syndrome accompanied or not by pseudo-exfoliative glaucoma. In 2022, a meta-analysis published by Huang et al. which refers to 14 eligible studies concludes that there is a connection between pseudoexfoliative syndrome and hearing loss. Although the causes are not fully known, there are several theories that refer to: the common embryological origin of the inner ear and the ante-rior segment of the eye, the accumulation of pseudoexfoliative material both at the level of the anterior segment and at the cochlear level, at the level of the vascular walls, vestibular damage through pseudoexfoliative material that generates vestibular compensation [18,19,20,21,22,23,27,28]. In 2004, in a study conducted on 34 patients with nor-mo-tensive glaucoma, Kremmer et al. stated that microcirculation disorders generated by microthrombi produced by an increase in antiphospholipid antibodies [16] are the cause for visual and auditory dysfunctions. In 2012, O'Hare, Crowston et al. noted the limitations of previous studies and by regarding glaucoma as a neurodegenerative disease, they studied the visual and auditory dysfunction from the point of view of cortical integration. They found that patients with glaucoma have processed the temporal cortical abnormalities auditory information based on the theory of neuronal vulnerability [29]. In 2012, in a study on 215 patients Mudie et al examined the effect of glaucomatous visual field loss and hearing impairment to glaucoma patients. After evaluating the visual and auditory impairment, they concluded that these have a key role in functional and cognitive decline elements which have an overwhelming in-flu-ence on the social integration of patients [30].
In 2019, in a study conducted on 12,899 patients over 40 years of age, Kim et al con-cluded that age, male sex and the value of triglycerides [31] play a key role in associ-ating glaucoma with hearing impairments. In 2020, in a large-scale retrospective study conducted on 15,686 patients, over 16 years, Chien et al investigated the inci-dence of glaucoma in patients with hearing impairment. After taking into account multiple po-tential risk factors the conclusions of the study reported sensorineural hearing loss in correlation with the increased incidence of glaucoma. As a recommen-dation, the au-thors emphasize that routine ophthalmological examination for glau-coma detection should be recommended for those with previous events of sensorineu-ral hearing loss [32].
In our study, urban female cases, aged over 65, prevailed in the Study group. In patients of the Study group compared to the Control group, the mean levels of the left PTA, the C/D area in both eyes, the C/D ratio in both eyes were higher. The mean level of mean RNFL thickness was slightly lower in glaucoma patients. Multivariate analysis shows that gender can be a good predictor of C/D area, gender and age can be good predictors of PTA in both eyes and C/D ratio in the right eye, while gender, age and background can be good predictors of disc area in the left eye. Also, a direct statistical correlation was observed between the PTA values as an element to evaluate the au-di-tory function and the vertical C/D ratio as well as the C/D area as elements that de-fine the structure of the optic nerve. An indirect correlation was observed with the RNFL values, a fact that reinforces the hypothesis of the connection between the two visual and auditory shortage. We mention that these correlations were identified on the left side. It should be mentioned that all participants in the study are right-handed. Also, PTA values are correlated in both ears with age, a fact recognized by the existing data in the literature [33]. Corneal thickness values do not correlate statistically significantly with hearing changes, quantified by PTA. Two elements are interesting in the study: the occurrence of changes in the value of PTA in both ears, together with the presence of correlations within the structure of the optic nerve only on the left side and the possibility of issuing some predictive factors from a statistical point of view in both eyes, in the study group.
The visual stimulus has a key role in the perception of the acoustic surroundings and in identifying the location of the stimulus [34,35]. Visual information confirms the location of the sound through direct (source position) and indirect (source environment) methods [36], the two stimuli acting simultaneously. Placing the auditory stim-ulus in a visual context improves both auditory and motor performance [37]. The con-text of visual performance impairment generates simultaneous auditory adaptation, the auditory space spontaneously recalibrates to the visual space probably determined by cortical mechanisms of adaptation and restructuring of both intramodal and cross-modal plasticity [34].
There have been interesting scientific concerns regarding the establishment of some correlations between intraocular pressure, eyeball length, retinal thickness, choroidal thickness and stomatognathic apparatus elements: masticatory and neck muscle thickness [38]. The correlations between the visual and auditory clinical parameters established by our study allow the glaucomatous disease to be approached from a cortical aspect as well. Humans are the only species with asymmetrical, cross-lateralized motor behavior [39]. The phenomenon of cortical lateralization is known for several cognitive functions, but with the specification that some of them, such as language, have specific cortical areas. Taking into account these elements that combine with the phenomenon of crossmodal neuroplasticity that occurs as an adaptive cerebral response to various pathologies, we can think of the study results as a beginning in the complex evaluation of the patient with glaucoma.
The aim of the conducted study is to highlight a correlation between two of the most important systems of the human body: vision and hearing. The purpose of this work is to investigate the possible involvement of the two analyzers in a neurodegenerative disease such as glaucomatous disease. Of course, bilateral damage is important both in diagnosis, but it has an even greater value in ensuring the quality of life of glaucoma patients. When both systems have different degrees of disability, the medical problem becomes a big social problem.
Taking into account what has been stated, it is possible to take into consideration the dual evaluation of the hearing in the patient with glaucoma, but also the ophthalmological evaluation of the patients with hearing disorders.
The paper wants to emphasize the interdisciplinary nature of the evaluation of the pa-tient with glaucoma in its preparation by participating specialists from various areas of medical interest whose concerns present areas of common interest: ophthalmology, otorhinolaryngology, radiodiagnostics, neurosurgery.
As a conclusion, a multicenter, longitudinal study starting from the encouraging results of the work presented could provide valuable information, worthy of being included in the diagnosis and treatment algorithm of glaucoma patients.
Limitations. Our study has limitations that we want to mention: The limits of our study are generated by the small number of enrolled cases in both groups, patient and control and, the short follow-up period. At the same time, we can say that the cross-sectional design limits the ability to explore the association between hearing loss and visual loss on long-term. But this can be considered as further research of a preliminary study. Over a longer period of time, the evaluation of the optic nerve parameters combined with audiometry may be useful for highlighting the new clinical complete examination of glaucoma patients.
5. Conclusions
In this study, the patients with POAG show changes in audiometry test in correlation with the ophthalmological parameters thus demonstrating that the auditory system can be affected in POAG. Taking into account the fact that both the visual and auditory systems are involved in ensuring the quality of life and that in fact the quality of life of the patients is the main goal of the entire medical act. It is important to periodically recommend an auditory evaluation for patients with glaucoma but also for patients with hearing impairments to be ophthalmologically examined and possibly given a diagnosis of glaucoma.
Author Contributions
Conceptualization, A-M.N, N.A and D.F; methodology A-M.N, L.L, V.S, M-C.A, M.C .; software, V.S, M-C.A; validation, A-M.N; N.A and D.F .; formal analysis, A-M.N.; L.L, V.S, M-C.A, M.C investigation, A-M.N.; L.L, V.S, M-C.A, M.C re-sources, A-M.N.; data cura-tion, A-M.N.; N.A and D.F; writing—original draft prepa-ration, A-M.N; N.A and D.F ; writ-ing—review and editing, A-M.N; N.A and D.F.; vis-ualization, N.A and D.F.; supervision N.A and D.F.; project administration A-M.N and D.F..; funding acquisition, A-M.N. All authors have read and agreed to the published version of the manuscript.
Funding
The work did not use financial resources involving any company or institu-tion.
Institutional Review Board Statement
The study was approved by the Ethics Commis-sion of Clinical County Emergency Hospital Braila, approval no.1/3.09.2021, in com-pliance with ethical and deontological rules for medical and research practice. The study was conducted in accord-ance with the Helsinki Declaration.
Informed Consent Statement
Informed consent was obtained from all subjects in-volved in the study.
Data Availability Statement
The data published in this research are available on re-quest from the first author and corresponding authors.
Acknowledgments
We would like to thank the study participants, whose generous time and ef-fort made this study possible.
Conflicts of Interest
The authors declare no conflict of interest.
References
- Pache, M. ,Flammer J. A Sick Eye in a Sick Body? Systemic Findings in Patients with Primary Open-Angle Glaucoma. Surv. of Ophthalmol. 2006, 51, 179–203. [Google Scholar] [CrossRef] [PubMed]
- Weinreb RN, Khaw PT. Primary Open-Angle Glaucoma. Lancet. 2004, 363, 1711–1720. [Google Scholar] [CrossRef] [PubMed]
- Vrabec JP, Levin LA. The neurobiology of cell death in glaucoma. Eye (Lond). 2007, 21, S11–S14. [Google Scholar] [CrossRef] [PubMed]
- Yucel Y, Gupta N. Glaucoma of the brain: a disease model for the study of transsynaptic neural degeneration. Prog Brain Res. 2008, 173, 465–478. [Google Scholar]
- Quigley, HA. Neuronal death in glaucoma. Prog Retin Eye Res. 1999, 18, 39–57. [Google Scholar] [CrossRef]
- Gupta, N. , Yucel, Y.H. What changes can we expect in the brain of glaucoma patients? Surv. Of Ophthalmol. 2007, 52, S122–S126. [Google Scholar]
- Gupta, N. , Greenberg G., Noel de Tilly L., Gray B., Polemidiotis M., Yucel Y.H. Atrophy of the lateral geniculate nucleus in 520 human glaucoma detected by magnetic resonance imaging. Br J Ophthalmology. 2009, 93, 56–60. [Google Scholar] [CrossRef]
- Jeffrey, L. Goldberg, Glaucoma research updates, 2018, 21 February.
- Jorge, A. Ghiso, PhD, Ivo Doudevski, PhD, Robert Ritch, PhD, and Agueda A. Rostagno, PhD Alzheimer’s Disease and Glaucoma: Mechanistic Similarities and Differences. J Glaucoma. 2013, 22, S36–S38. [Google Scholar]
- Gupta N, Yucel YH. Glaucoma as a neurodegenerative disease. Curr Opinion Opththalmol. 2007, 18, 110–114. [Google Scholar] [CrossRef]
- Ray K, Mookherjee S. Molecular complexity of primary open angle glaucoma: Current concepts. J Genet. 2009, 88, 451–467. [Google Scholar] [CrossRef]
- Nakamura T, Lipton SA. Redox regulation of mitochondrial fission, protein misfolding, synaptic damage, and neuronal cell death: Potential implications for Alzheimer’s and Parkinson’s diseases. Apoptosis. 2010, 15, 1354–1363. [Google Scholar] [CrossRef] [PubMed]
- Ramirez,A. I.,deHoz,R.,Salobrar-Garcia,E.,Salazar,J.J.,Rojas,B.,Ajoy,D.,Lopez- Cuenca,I.,Rojas,P., Trivino, A., Ramirez, J.M. The Role of Microglia in Retinal Neurodegeneration: Alzheimer’s Disease, Parkinson, and Glaucoma. Front. Aging Neurosci. 2017, 9, 214. [Google Scholar]
- Stephane Melik Parsadaniantz, Annabelle Reaux-Le Goazigo, Anais Sapienza, Habas C., Baudouin C. Glaucoma: A De-generative Optic Neuropathy Related to Neuroinflammation? Cells, MDPI. 2020, 9, 535.
- Lam, D.Y.; Kaufman, P.L.; Gabelt, B.T.; To, E.C.; Matsubara, J.A. Neurochemical correlates of cortical plasticity after unilateral elevated intraocular pressure in a primate model of glaucoma. Investig. Ophthalmol. Vis. Sci. 2003, 44, 2573–2581. [Google Scholar] [CrossRef] [PubMed]
- Kremmer S, Kreuzfelder E, Bachor E, Jahnke K, Selbach JM, Seidahmadi S. Coincidence of normal tension glaucoma, pro-gressive sensorineural hearing loss, and elevated antiphos-phatidylserine antibodies. Br JOphthalmol. 2004, 88, 1259–1262. [Google Scholar] [CrossRef] [PubMed]
- ShapiroA, Siglock TJ, Ritch R, Malinoff R. Lack of association between hearing loss and glaucoma. Am J Otol. 1997, 18, 172–174. [Google Scholar]
- Aydogan Ozkan B, Yuksel N, Keskin G, et al. Homocysteine levels in plasma and sensorineural hearing loss in patients with pseudoexfoliation syndrome. Eur J Ophthalmol. 2006, 16, 542–547. [Google Scholar] [CrossRef] [PubMed]
- Cahill M, Early A, Stack S, Blayney AW, Eustace P. Pseudoexfoliation and sensorineural hearing loss. Eye. 2002, 16, 261–266. [Google Scholar] [CrossRef]
- Detorakis ET, Chrysochoou F, Paliobei V, et al. Evaluation of the acoustic function in pseudoexfoliation syndrome and exfo-liation glaucoma: audiometric and tympanometric findings. Eur J Ophthalmol. 2008, 18, 71–76. [Google Scholar] [CrossRef]
- Shaban RI, Asfour WM. Ocular pseudoexfoliation associated with hearing loss. Saudi Med J. 2004, 25, 1254–1257. [Google Scholar]
- Turacli ME, Ozdemir FA, Tekeli O, Gokcan K, Gerceker M, Duruk K. Sensorineural hearing loss in pseudoexfoliation. Can J Ophthalmol. 2007, 42, 56–59. [Google Scholar]
- Yazdani S, Tousi A, Pakravan M, Faghihi AR. Sensorineural hearing loss in pseudoexfoliation syndrome. Ophthalmo-lo-gy. 2008, 115, 425–429. [Google Scholar]
- Joe Walter Kutz, Ginger Mullin, Kathleen C M Campbel Audiology Pure-Tone Testing, English edition, drugs &disease, Clinical procedures.Medscape, 2018, August 27.
- Clark, J. G. Uses and abuses of hearing loss classification. Asha, 1981, 23, 493–500. [Google Scholar] [PubMed]
- ASHA recomandations online. Degree, and Configuration of Hearing Loss, 2023, February 5. Available online: https://www.asha.org.public/hearing/Type.
- Mustafa Deger Bilgec,Nagehan Erdogmus Kucukcan, Leman Birdane Armagan Incesulu, Nilgun Yildirim Evaluation of the Vestibulocochlear System in Patients with Pseudoexfoliation Syndrome. TurkJOphthalmol. 2021, 51, 156–160.
- Wenbin Huang, Jifa Kuang, Feilan Chen, Yu Fu Association of sensorineural hearing loss and pseudoexfoliation syn-drome: a meta-analysis. Annals of Eye Science. 2022, 7, 26. [CrossRef]
- Fleur O’Hare, Gary Rance, Jonathan G. Crowston, and Allison M. McKendrick Auditory and Visual Temporal Pro-cessing Disruption in Open Angle Glaucoma. Invest Ophthalmol Vis Sci. 2012, 53, 6512–6518. [CrossRef]
- Lucy, I. Mudie, Varshini Varadaraj, Prateek Gajwani, Beatriz Munoz, Pradeep Ramulu, Frank R. Lin, Bonnielin K. Swenor, 565 David S. Friedman, Nazlee Zebardas Dual sensory impairment: The association between glaucomatous vi-sion loss and hearing impairment and function Hearing and vision impairment: Effect on function. PLOS ONE, 2018, July 6.
- Joon Mo Kim,SeYoung Kim,Hee Seung Chin,Hyun Ji Kim and Na Rae Kim, on behalf of the Epidemiologic Survey Committee of the Korean Ophthalmological Society Relationships between Hearing Loss and the Prevalences of Cata-ract, Glaucoma, Diabetic Retinopathy, and Age-Related Macular Degeneration in Korea. J. Clin. Med. 2019, 8, 1078.
- Hsiang-Wen Chien, Pei-Hsuan Wu, Kai Wang, Chi-Chin Sun, Jing-Yang Huang, Shun-Fa Yang, Hung-Chi Chen and 573 Chia-Yi Lee Increased Incidence of Glaucoma in Sensorineural Hearing Loss: A Population-Based Cohort Study Int. J. Environ. Res. Public Health. 2019, 16, 2907.
- Jennifer, H. Madans, PhD., Julie D. Weeks, Ph.D., and Nazik Elgaddal, M.S. Hearing Difficulties Among Adults:. United States 2019. 2021, 414, 1–8. [Google Scholar]
- M Alzaher, N Vannson, O Deguine, M Marx, Pascal Barone, et al. Brain plasticity and hearing disorders. Revue Neu-rologique 2021, 177, 1121–1132. [Google Scholar] [CrossRef] [PubMed]
- Eric, I. Knudsen, Phyllis F. KnudsenVision Guides the Adjustment of Auditory Localization in Young Barn Owls. KnudsenVision Guides the Adjustment of Auditory Localization in Young Barn Owls..Science 1985, Vol.230, 545–548. [Google Scholar]
- Chiara Valzolgher, Mariam Alzhaler, Elena Gessa, Michela Todeschini, Pauline Nieto, et al. . The impact of a visual spa-tial frame on real sound-source localization in virtual reality. Current Research in Behavioral Sciences. 2020, 1, 100003. [Google Scholar] [CrossRef]
- Redon, Christine; Hay, Laurette Role of visual context and oculomotor conditions in pointing accuracy Cognitive neu-ro-science and neuropsychology. NeuroReport. 2005, 16, 2065–2067. [CrossRef]
- Grzegorz Zielinsk, Marcin Wojcicki,Maria Rapa, Anna Matysik-Wozniak, Michal Baszczowski Michal Ginszt,Monika Litko-Rola, Jacek Szkutnik, Ingrid Rozylo-Kalinowska, Robert Rejdak and Piotr Gawda Masticatory Muscle Thickness and Activity Correlates to Eyeball Length, Intraocular Pressure, Retinal and Choroidal Thickness in Healthy Women versus Women with Myopia. Pers. Med. 2022, 12, 626.
- Luthra, S. The role of the right hemisphere in processing phonetic variability between talkers. Neurobiology of Language. 2021, 2, 138–151. [Google Scholar] [CrossRef]
Figure 1.
Patient recruitment flow diagram (inclusion and exclusion criteria).
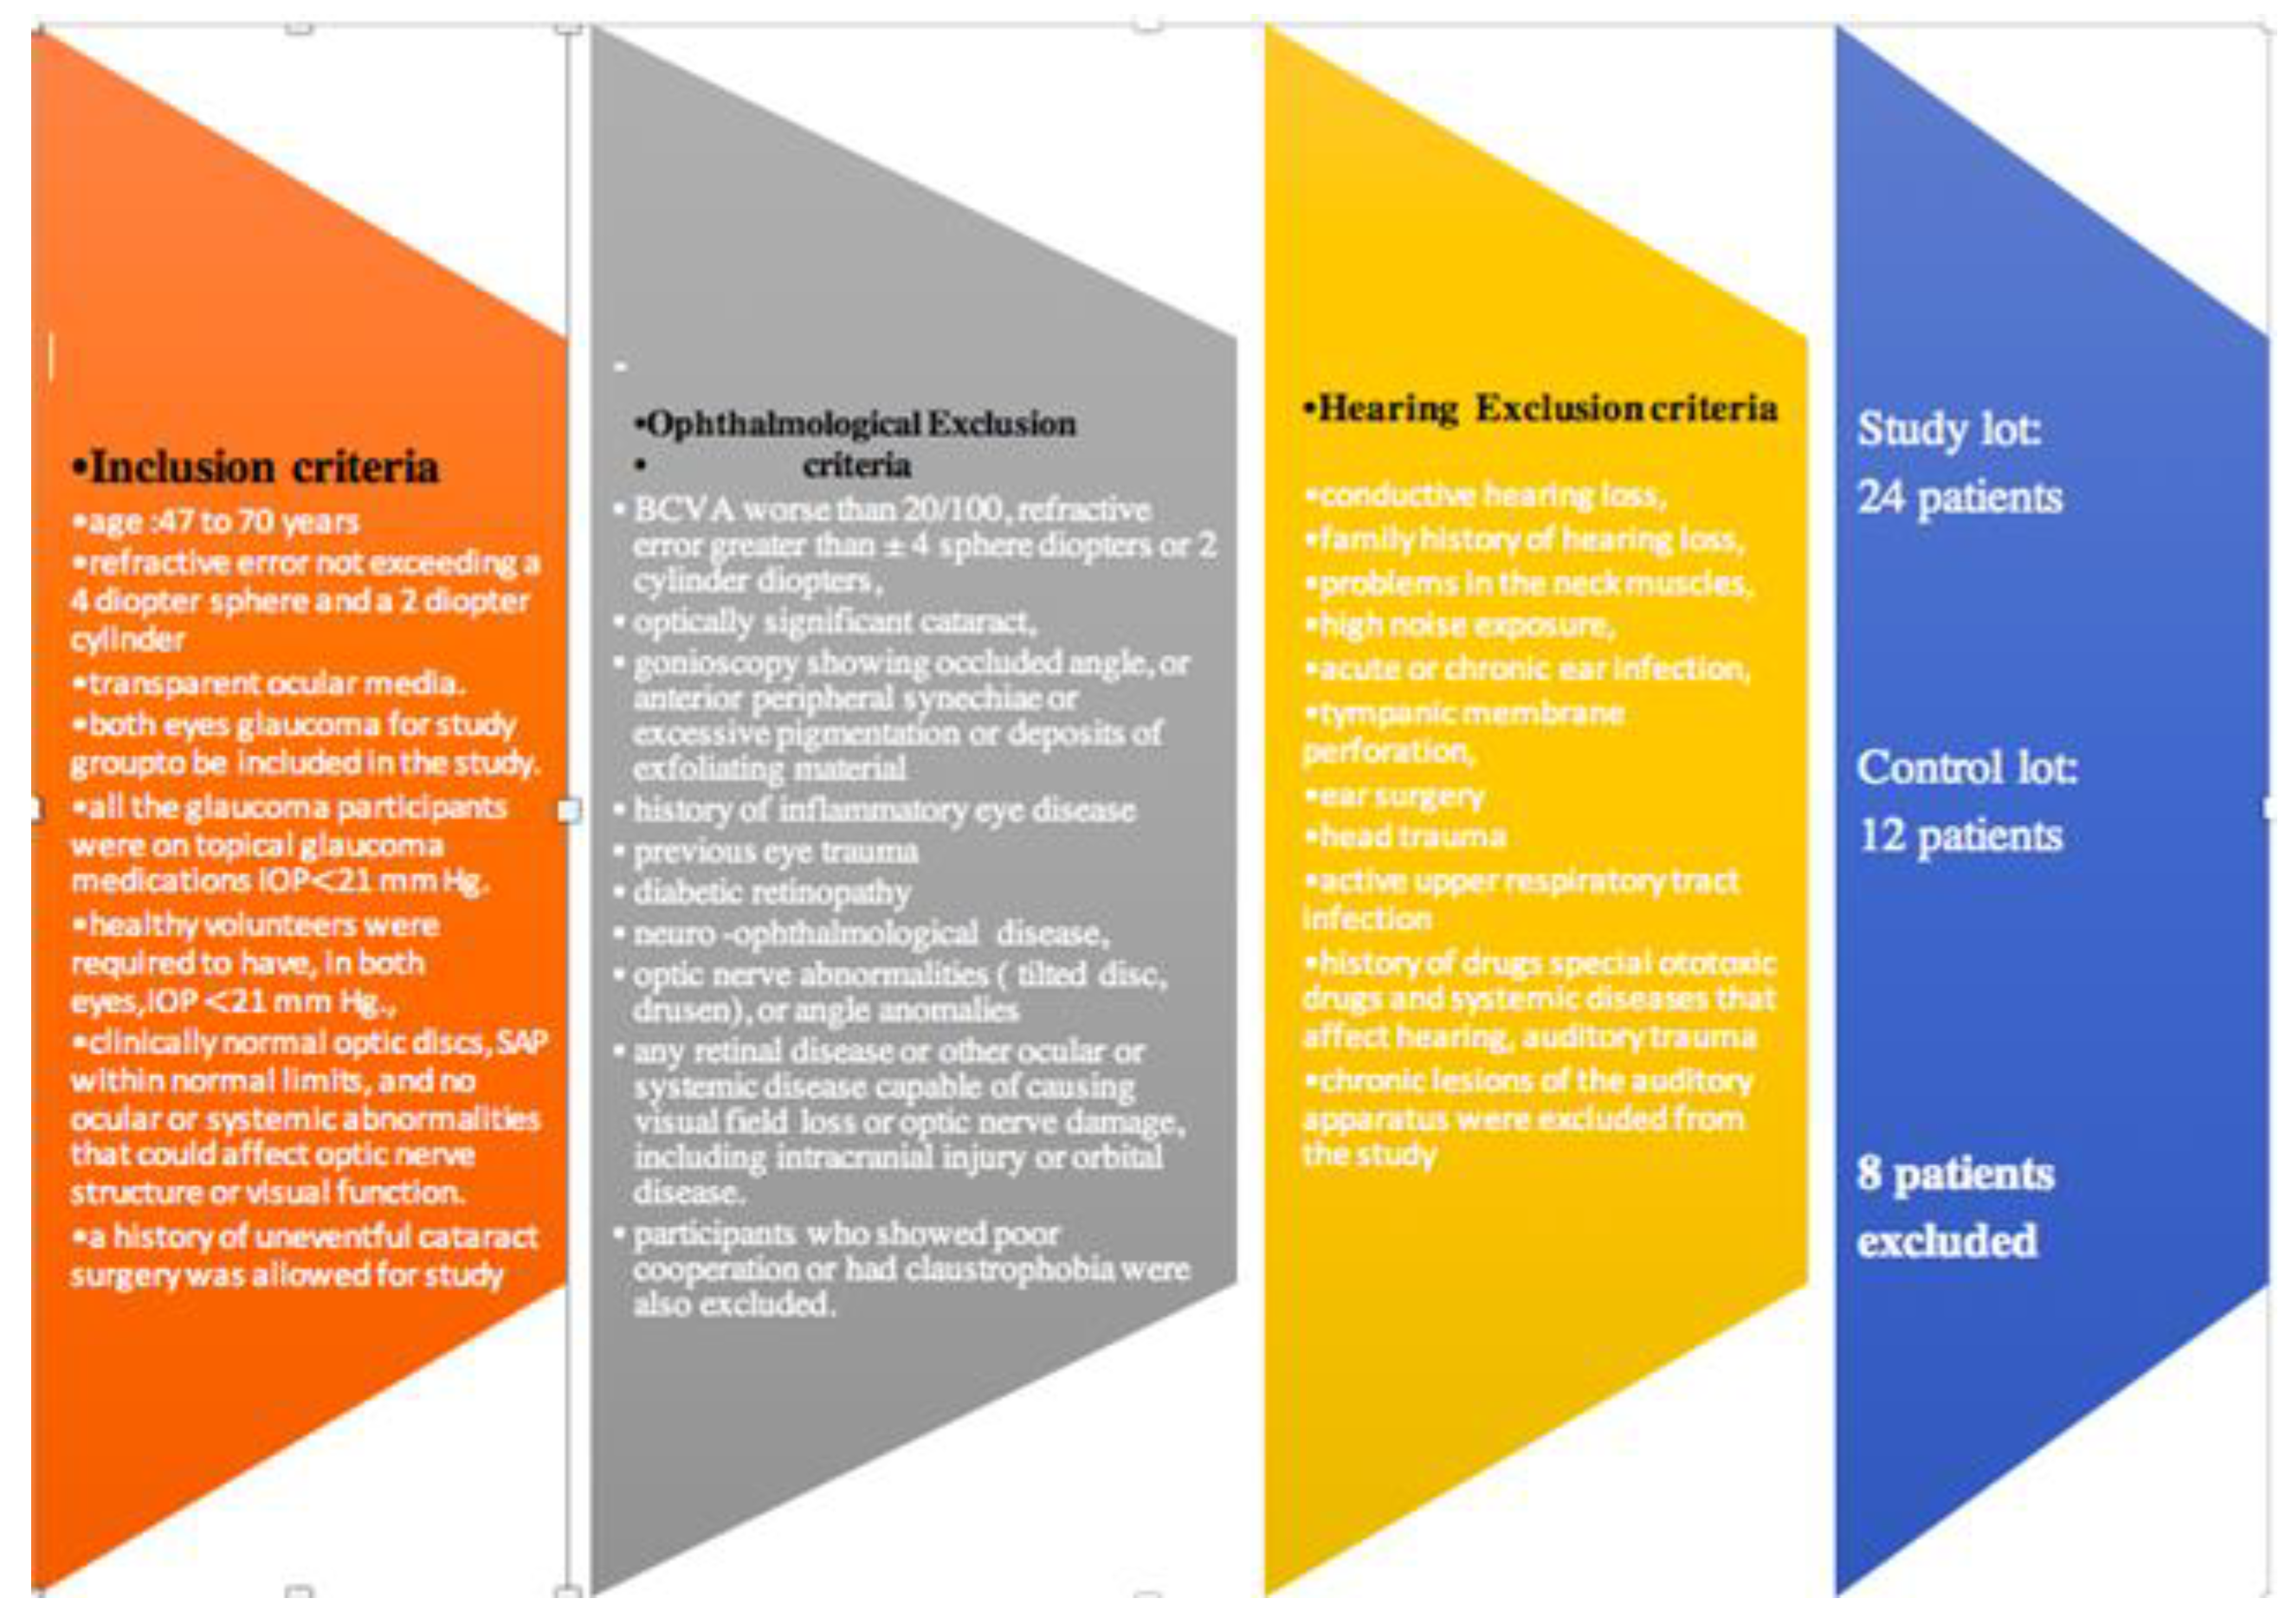
Figure 2.
Structure by age groups (over 65 years, under 65 years).
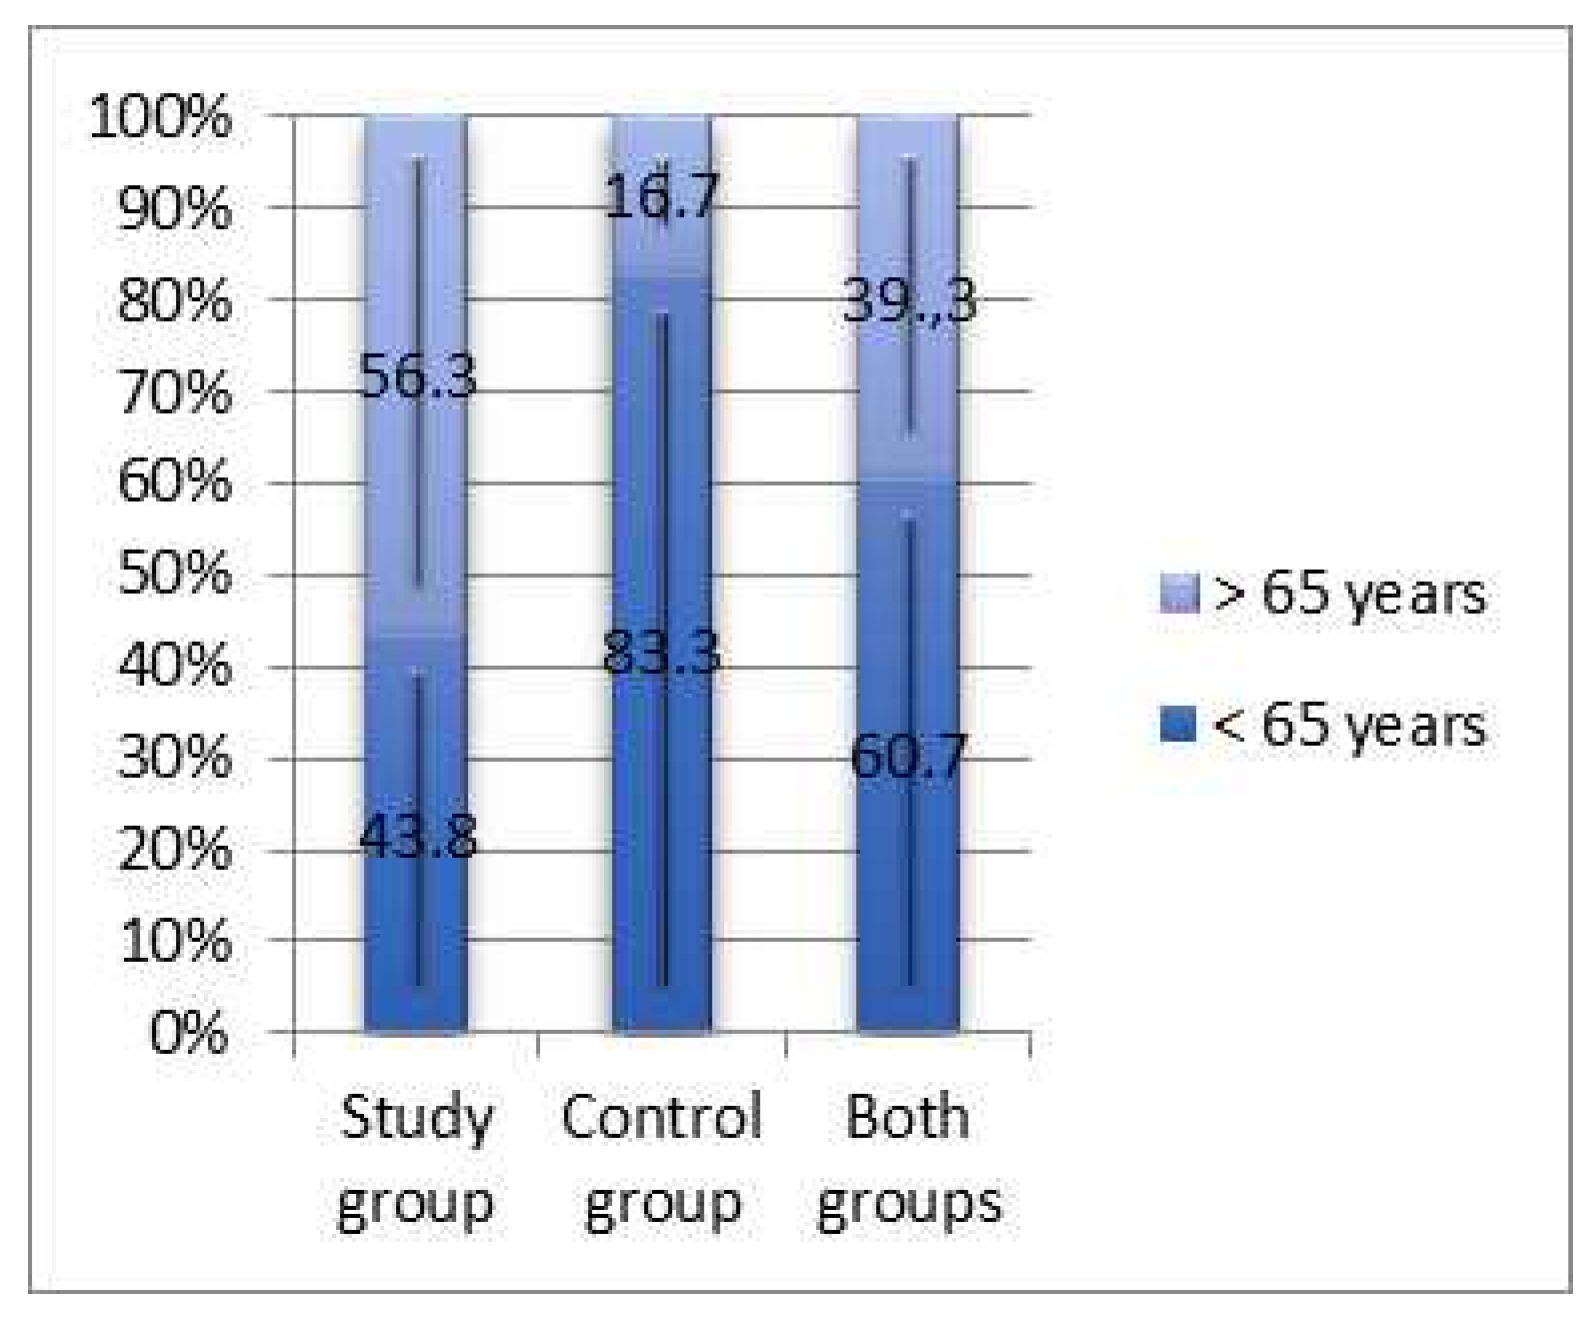
Figure 3.
Average age compared by gender (study groups and control groups).
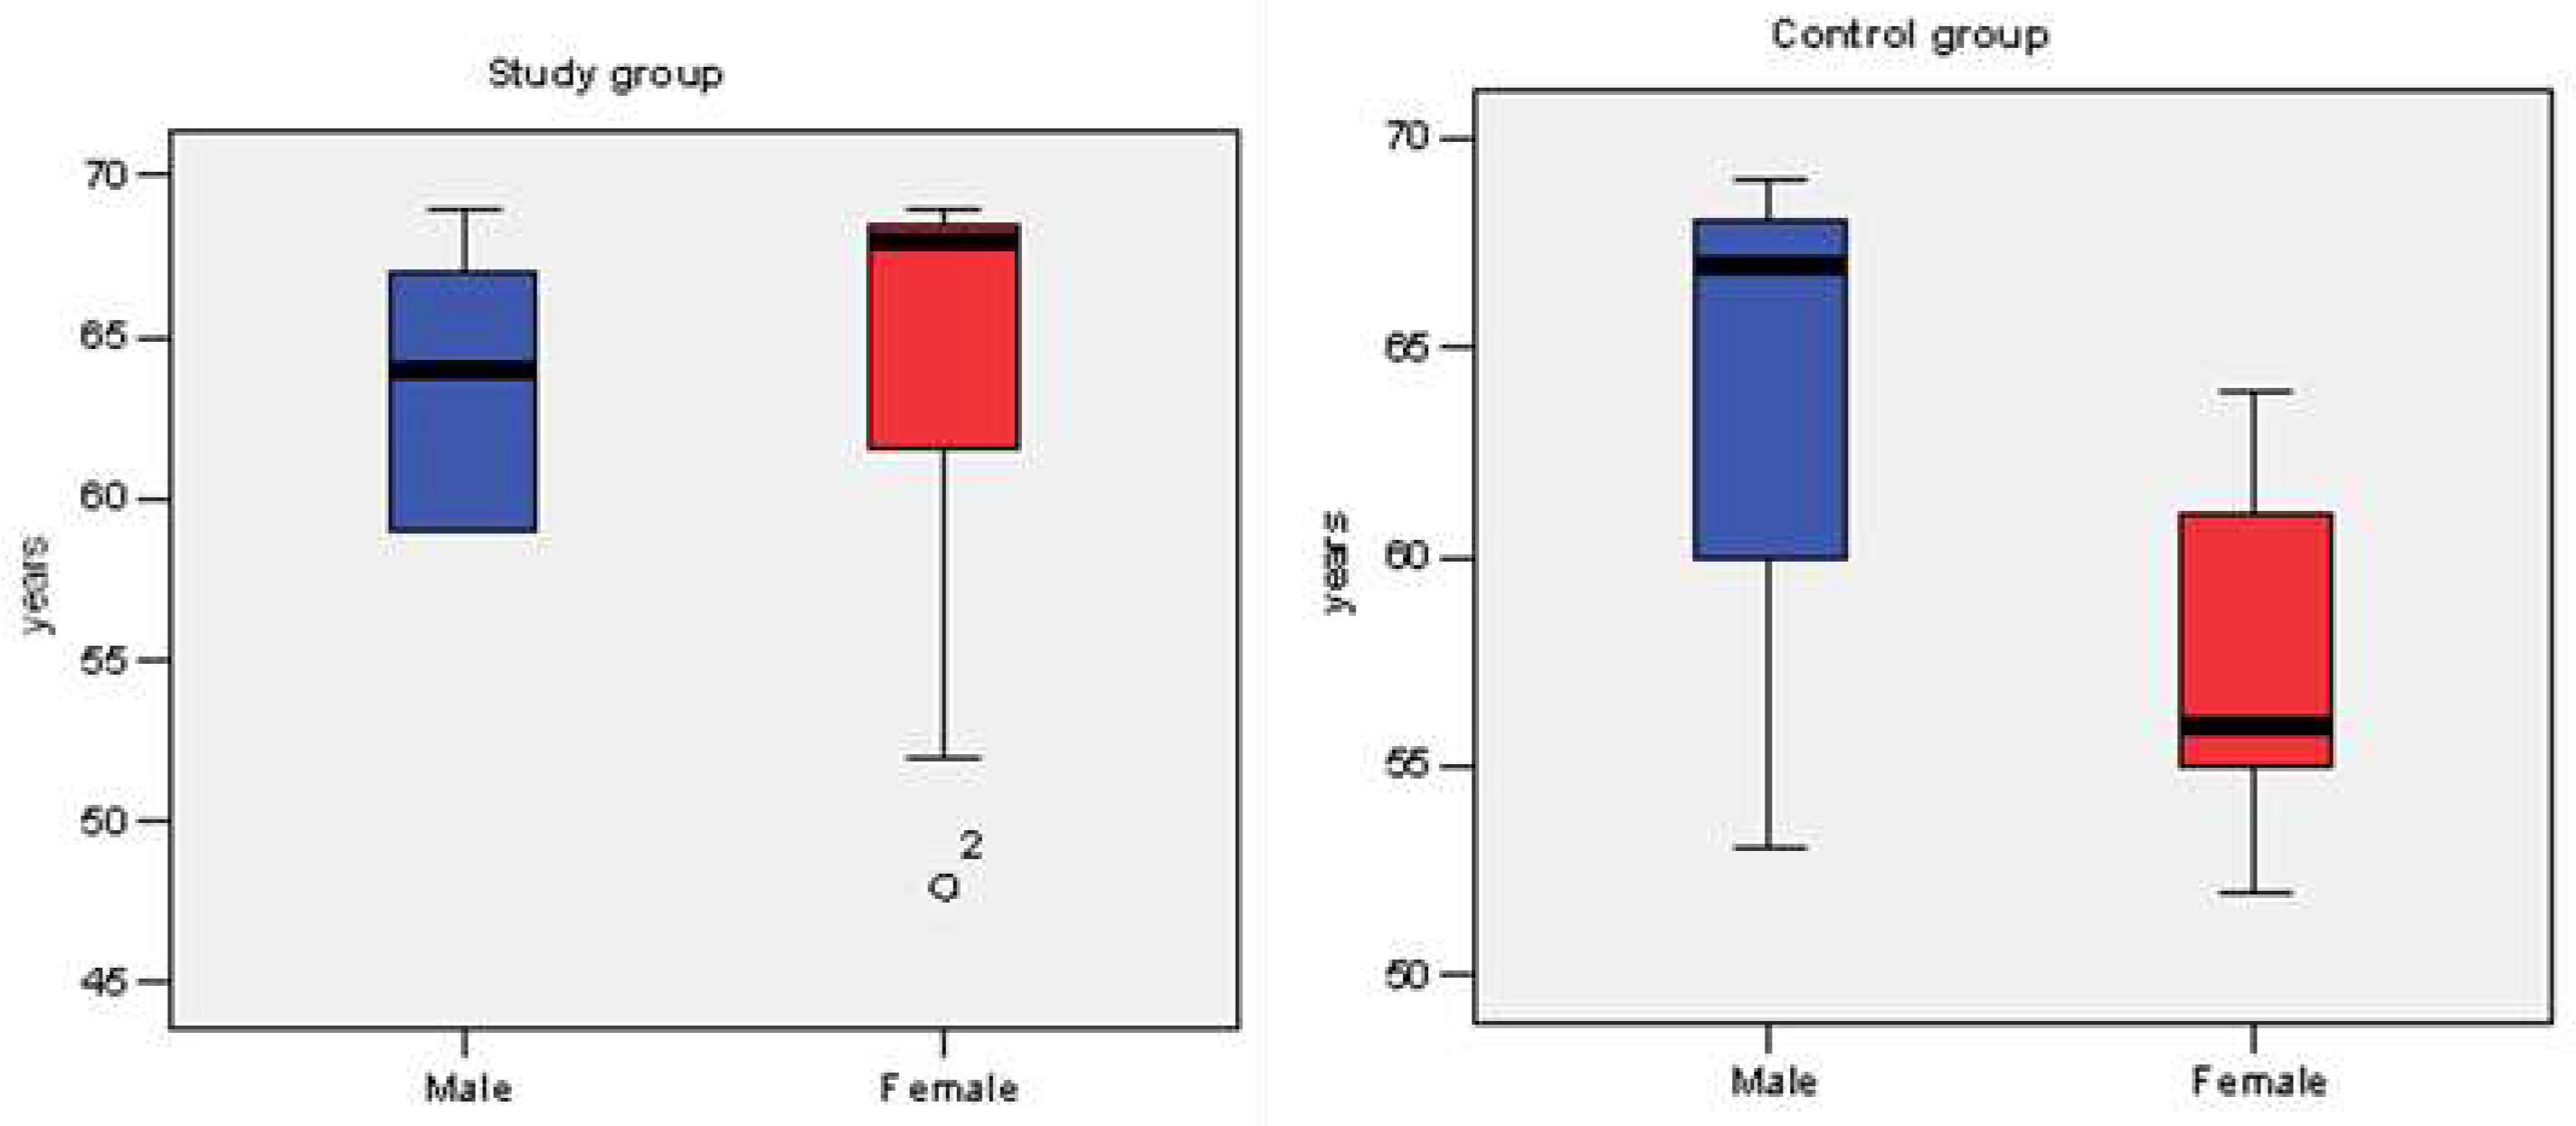
Figure 4.
Correlation of PTA in the right ear with RE disc area, RE Rim area, RE C/D area and RE C/D ratio, RE average RNFL, RE CCT and age .The values of the correlation co-efficient are between [-1, +1]: if the correlation coefficient tends to +1 (direct correlation), or to –1 (indirect correlation), there is a strong linear dependence of the parameters; the closer the correlation coefficient is to 0, the lower the intensity of the link. (a) disc area, (b) rim area, (c) C/D area, (d) C/D ratio, (e) RNFL, average, (f) CCT ,g) years. Left ear PTA correlated significantly with C/D LE area (r= +0.452; p= 0.016) and C/D LE ratio (r= +0.434; p= 0.021), but not with LE disc area (r= + 0.334; p= 0.082) or the LE Rim area (r= -0.271; p= 0.162) (Figure 5a–d). Left ear PTA correlated significantly, indirectly, moderately in intensity, mean RNFL structure LE (r= -0.438; p= 0.02) Figure 5e. Left ear PTA correlated significantly, directly, moderately in intensity with age (r= 0.445; p= 0.018) (Figure (f)). Left ear PTA did not significantly correlate with LE CCT (r= -0.185; p= 0.345) (Figure 5g).
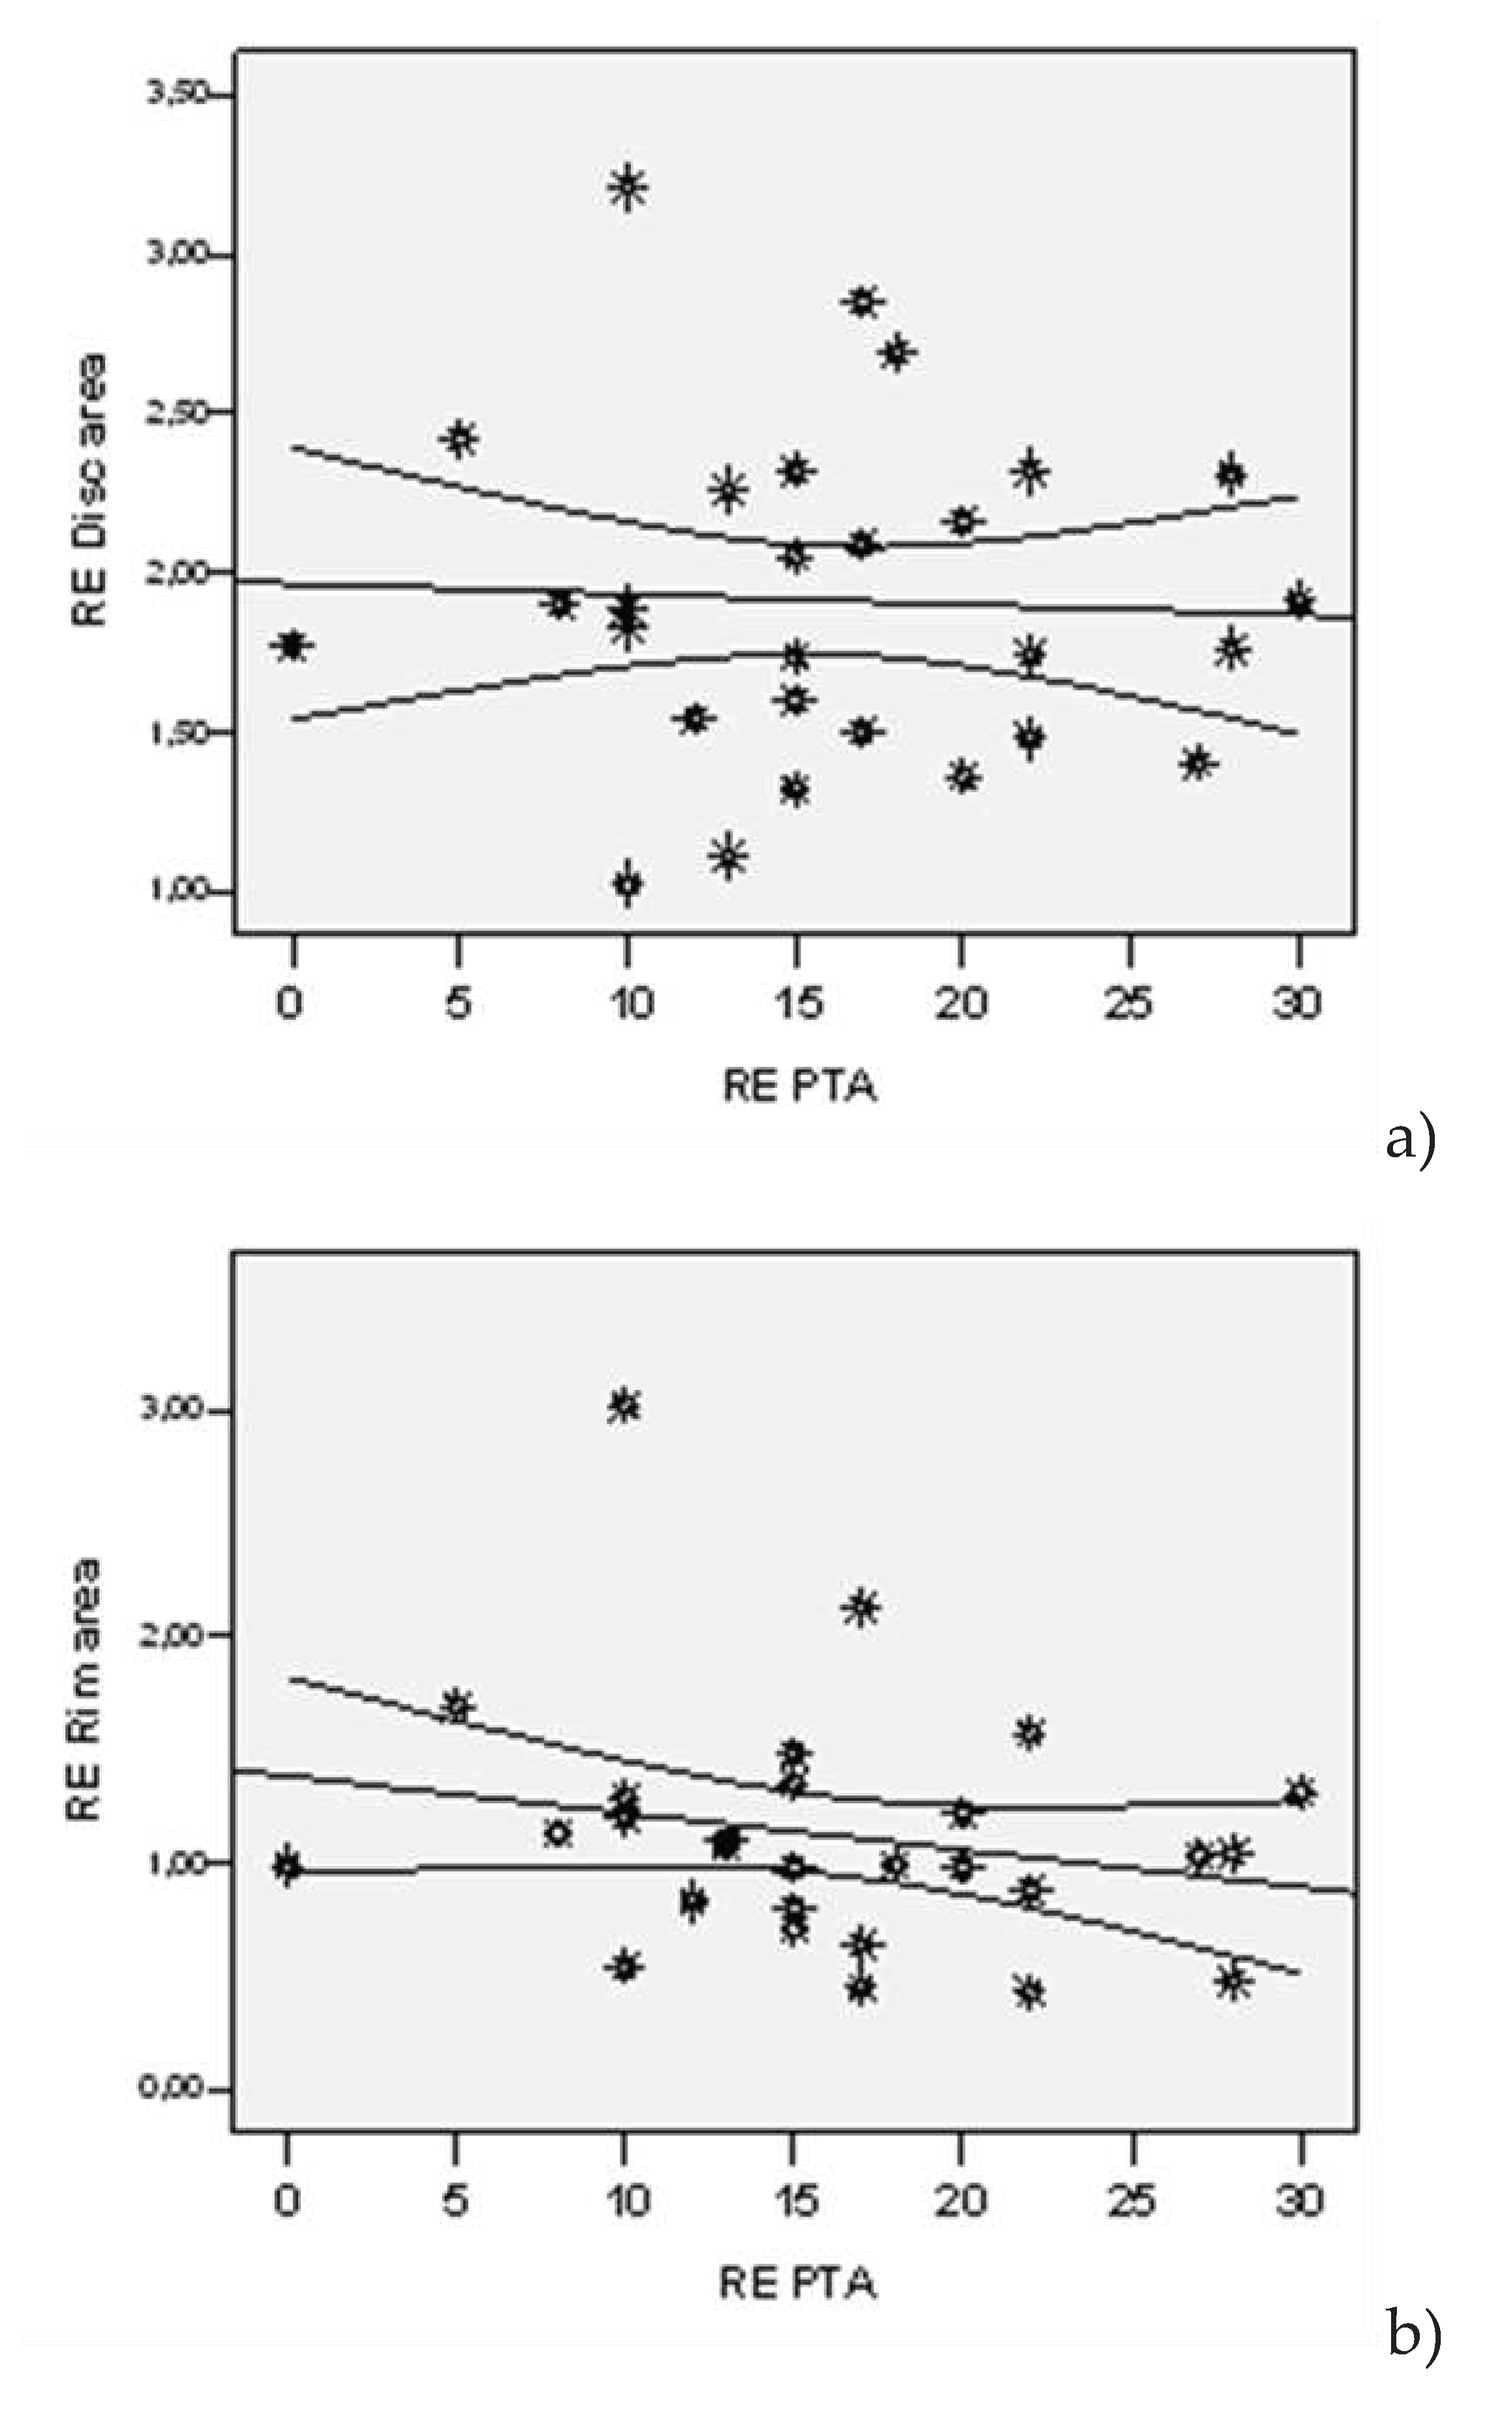
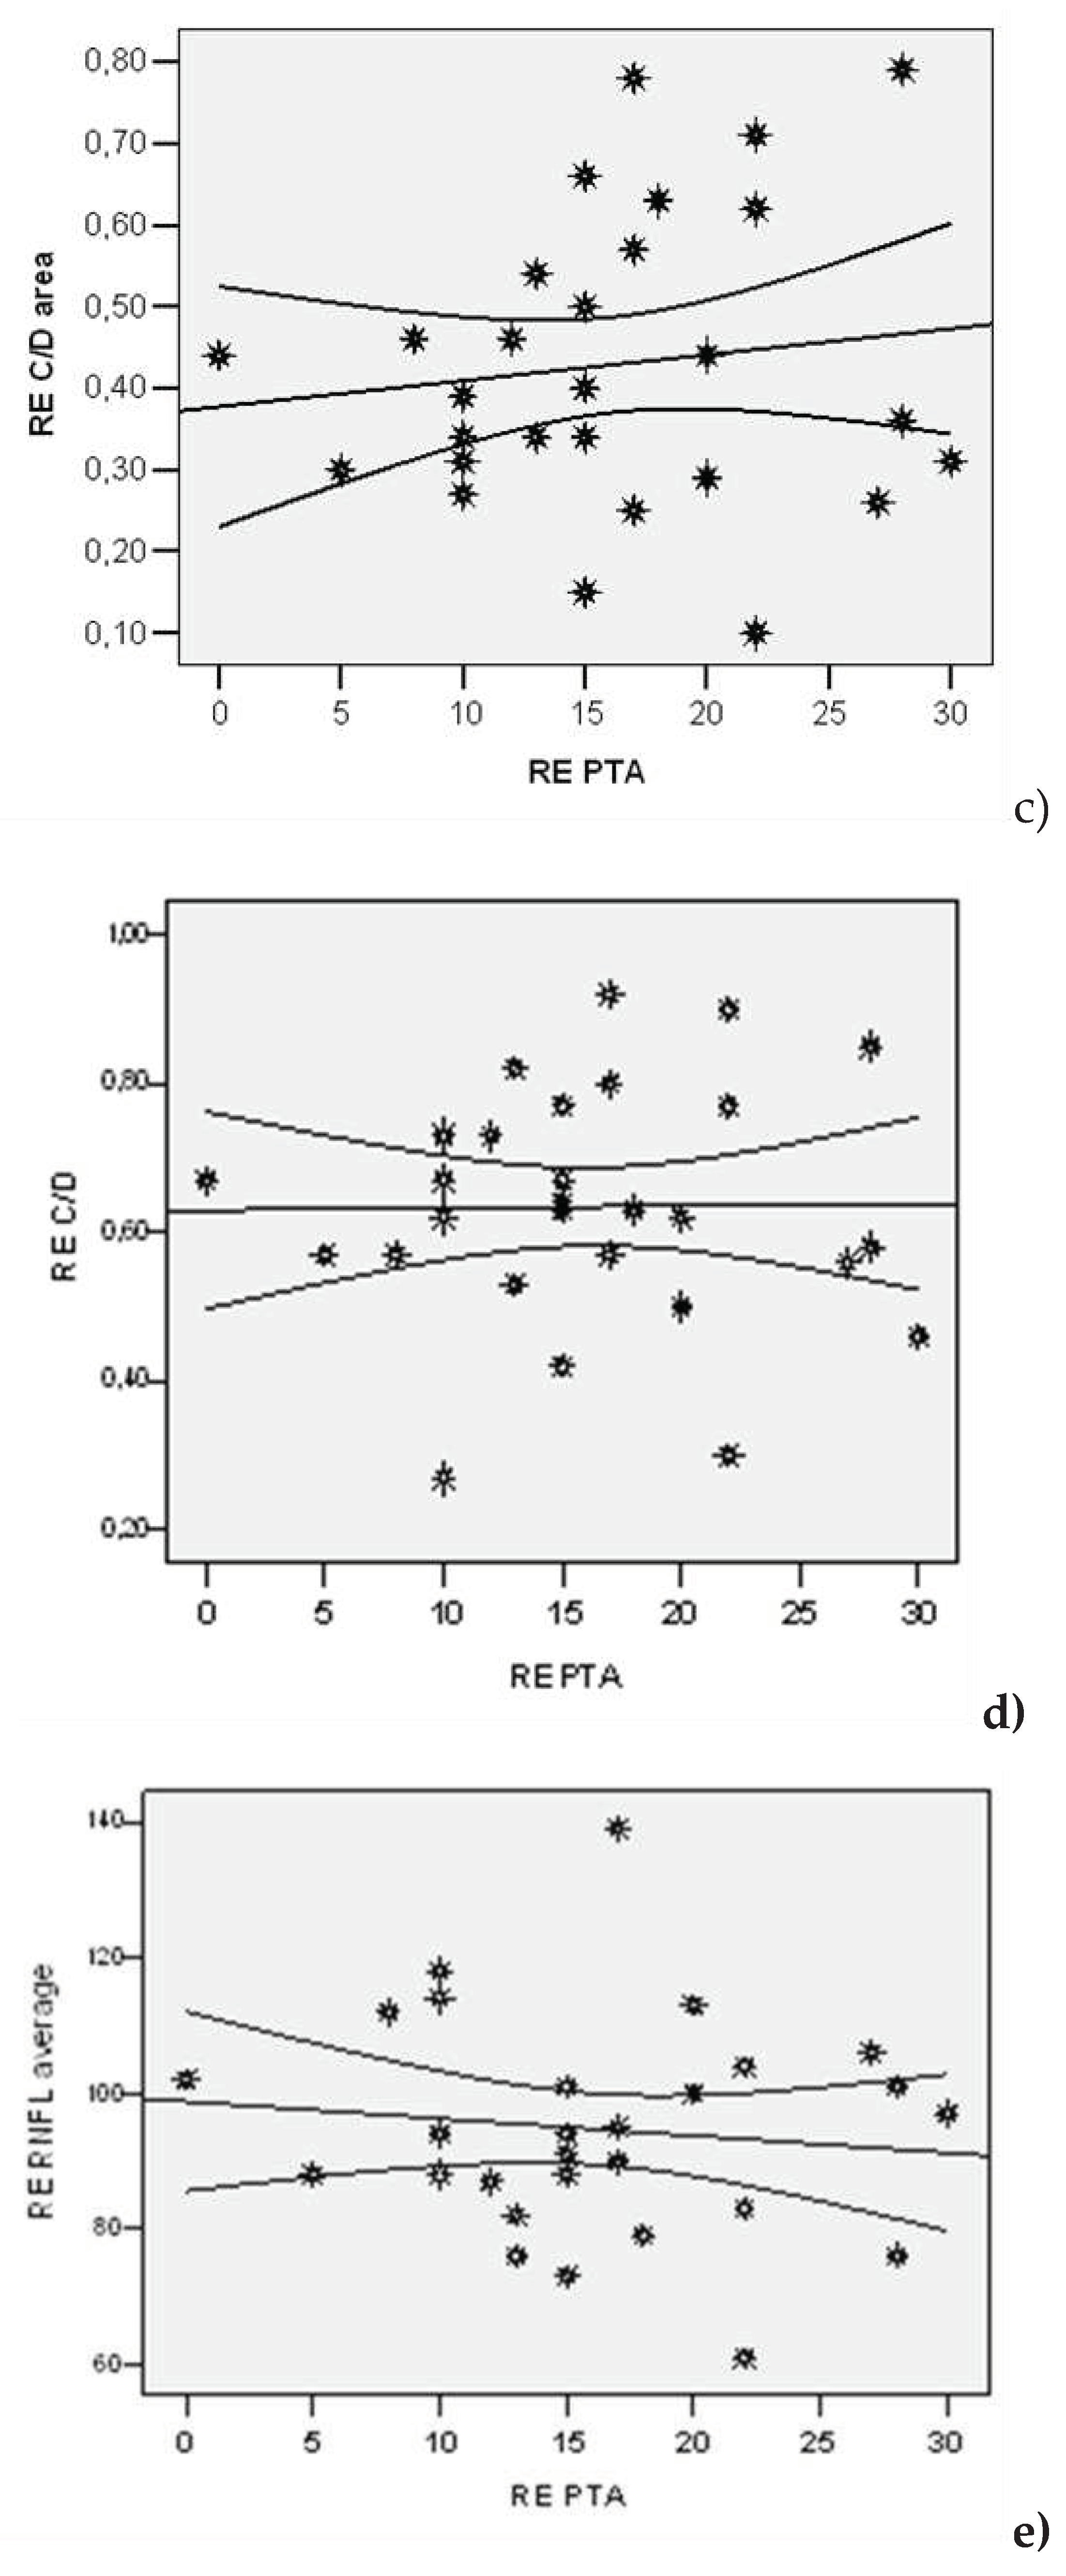
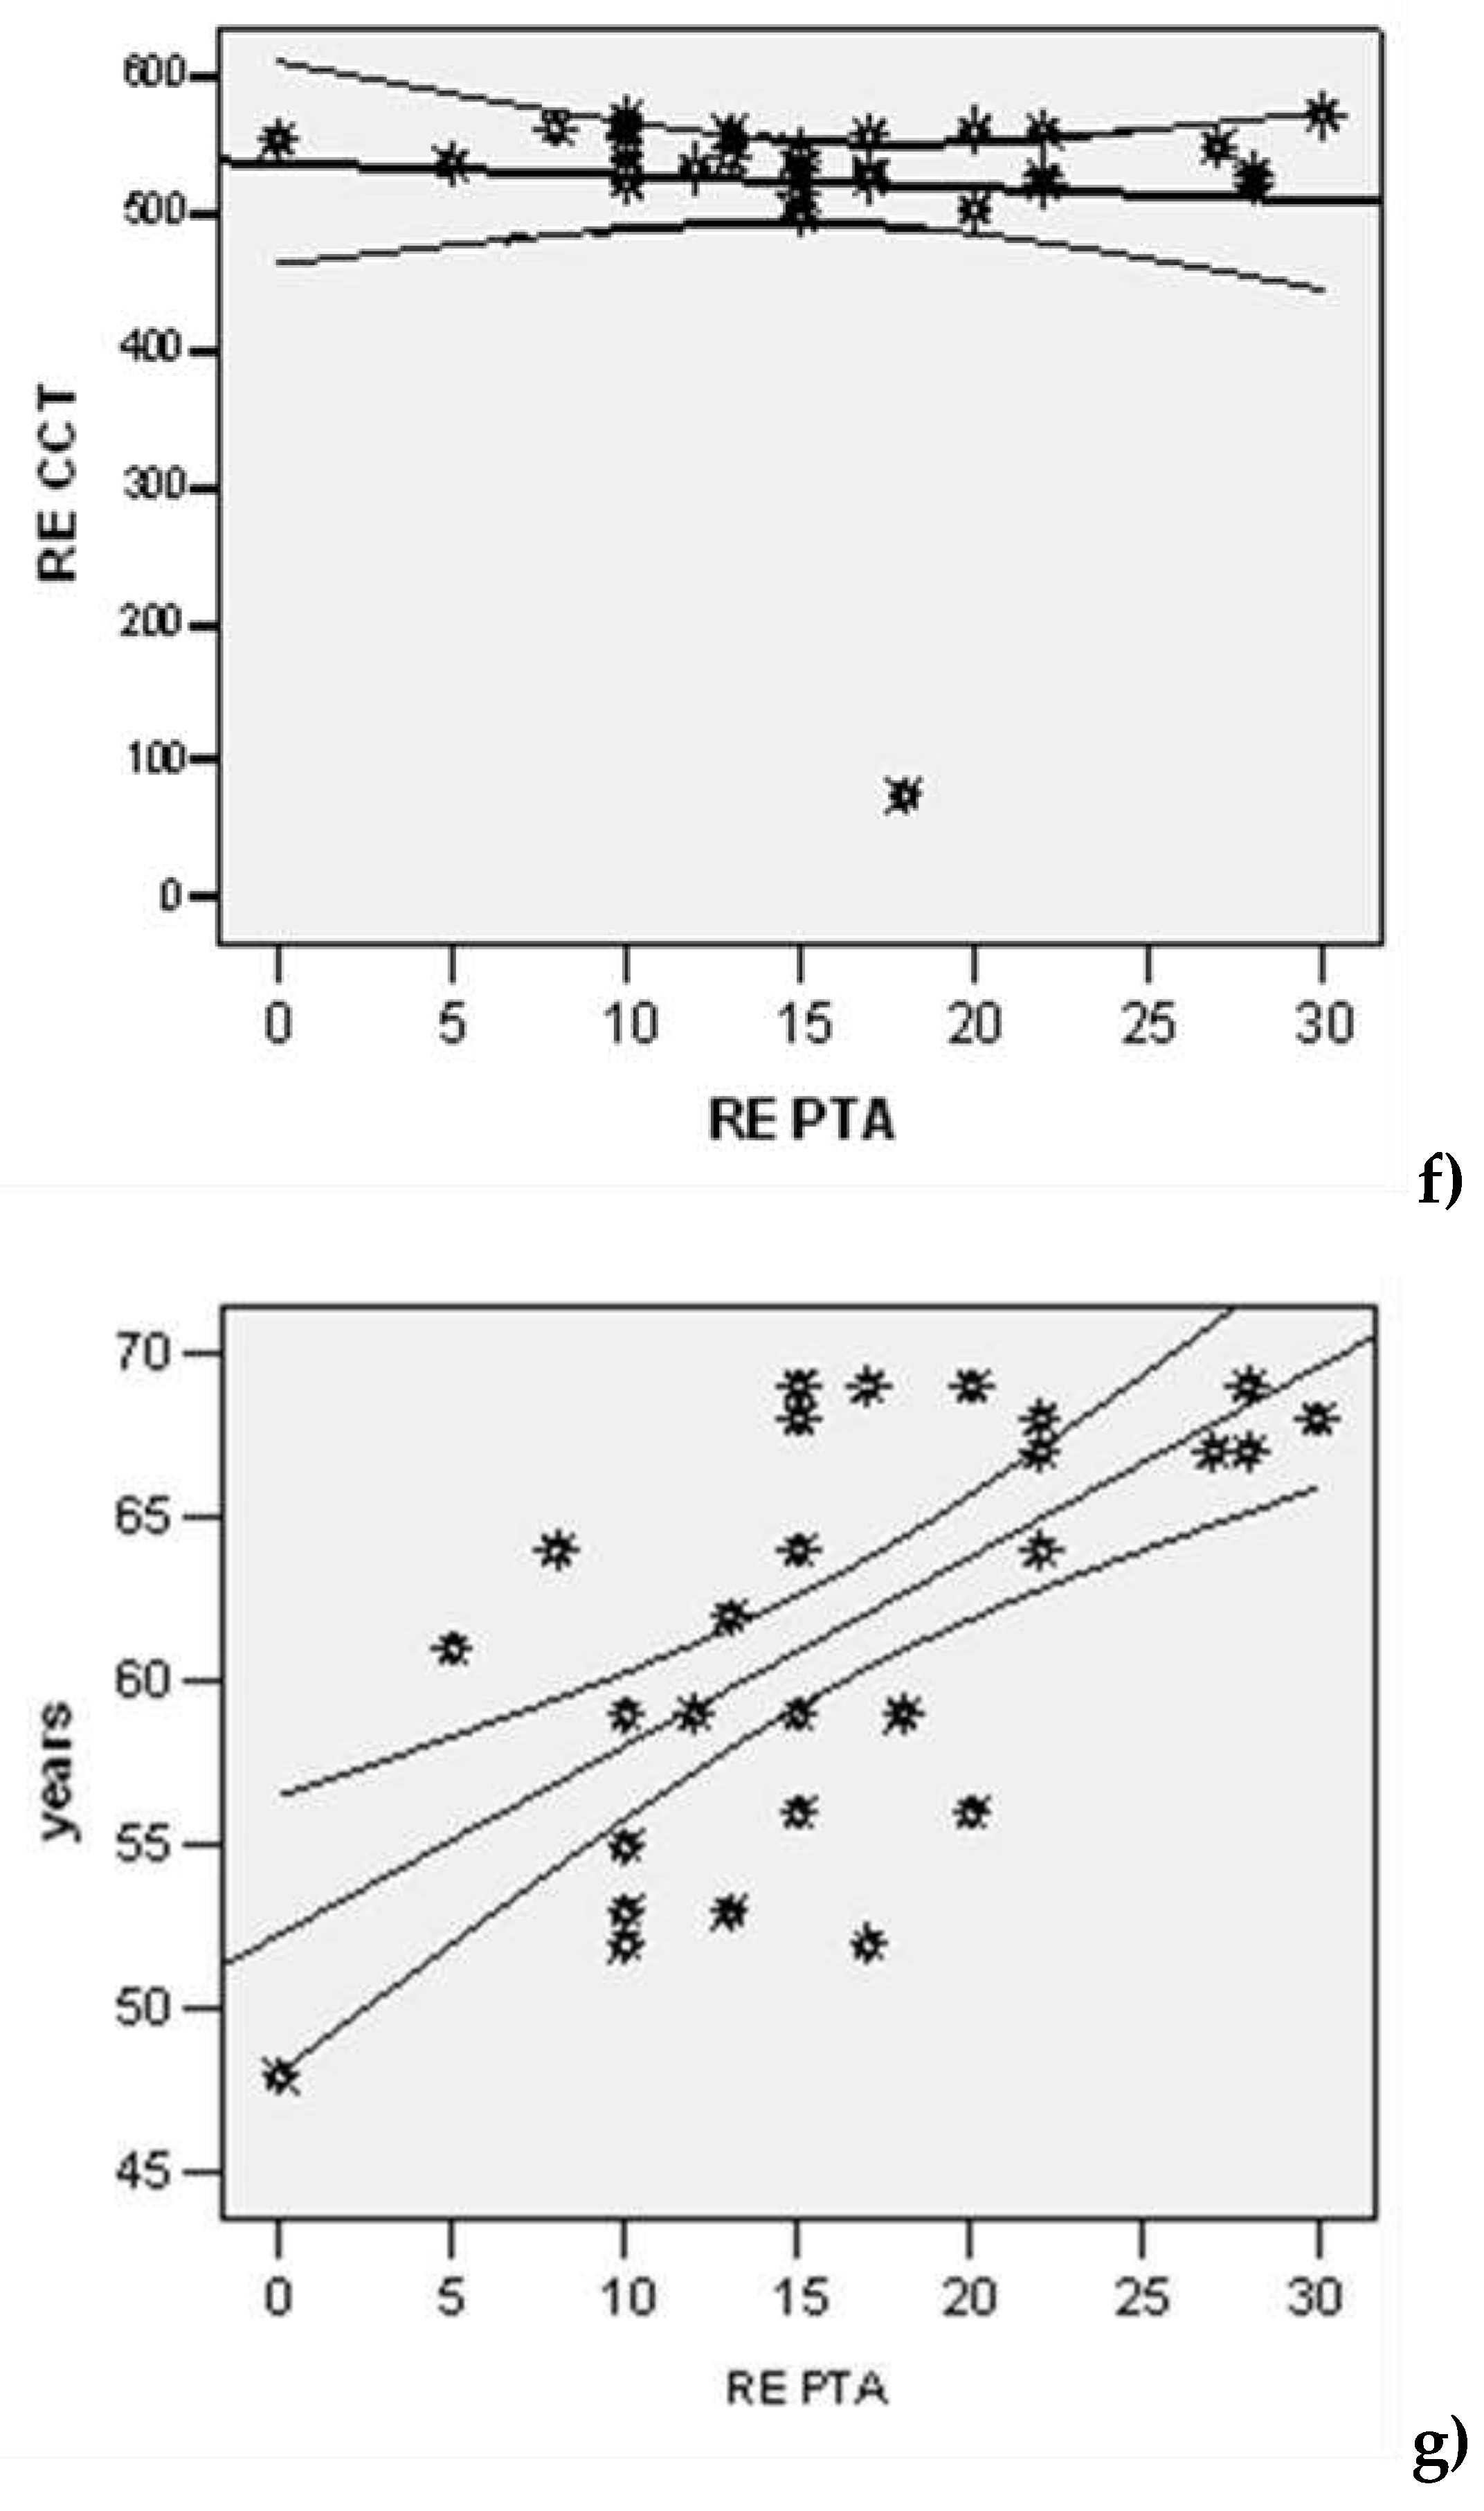
Figure 5.
Correlation of left ear PTA with LE C/D area, LE C/D ratio, LE disc area, LE rim area, average RNFL, CCT LE and age. The values of the correlation coefficient are be-tween [-1, +1]: if the correlation coefficient tends to +1 (direct correlation), or to –1 (in-direct correlation), there is a strong linear dependence of the parameters; the closer the correlation coefficient is to 0, the lower the intensity of the link. (a) LE C/D area, (b) LE C/D ratio, (c) LE disc area, (d) LE rim area, (e) LE RNFL average, (f) years, (g) CCT. By plotting the ROC curve, the following parameters were highlighted as good predictors of glaucoma in the right eye (Figure 6): at values higher than 0.60 of the C/D ratio, with a sensitivity of 75% and a specificity of 58.3% (AUC=0.753; IC95%: 0.569-0.937; p=0.024); at values higher than 0.33 of the C/D area, with a sensitivity of 87.5% and a specificity of 58.3% (AUC=0.862; IC95%: 0.725-0.999; p=0.001) and at values higher than 14 of the right ear PTA with a sensitivity of 81.3% and a specificity of 58.3% (AUC=0.732; IC95%: 0.542-0.922; p=0.039).
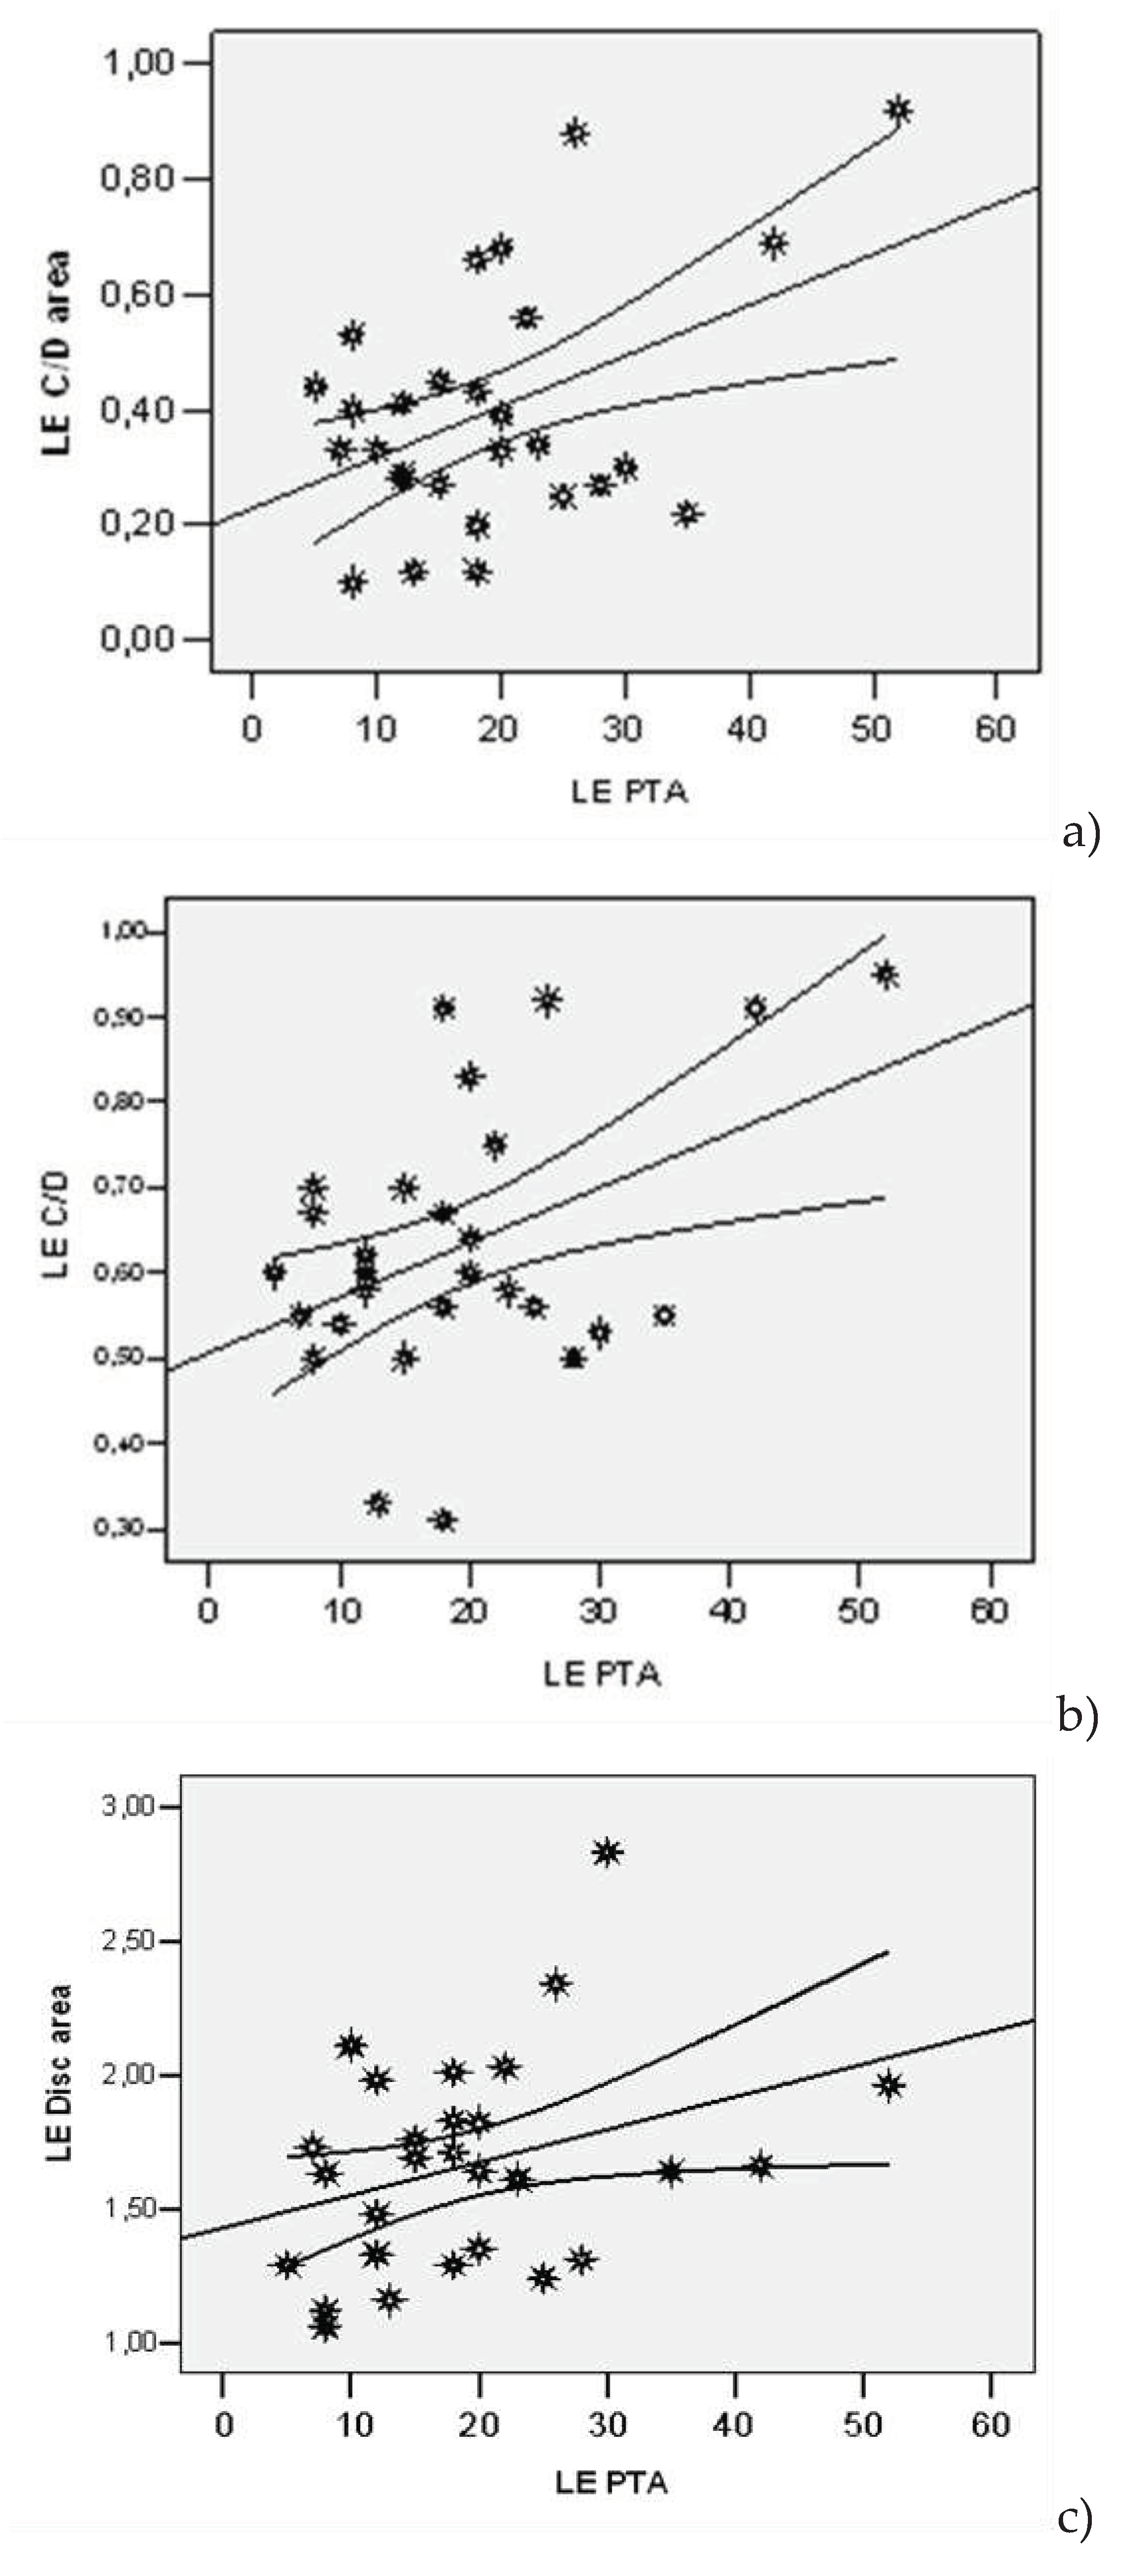
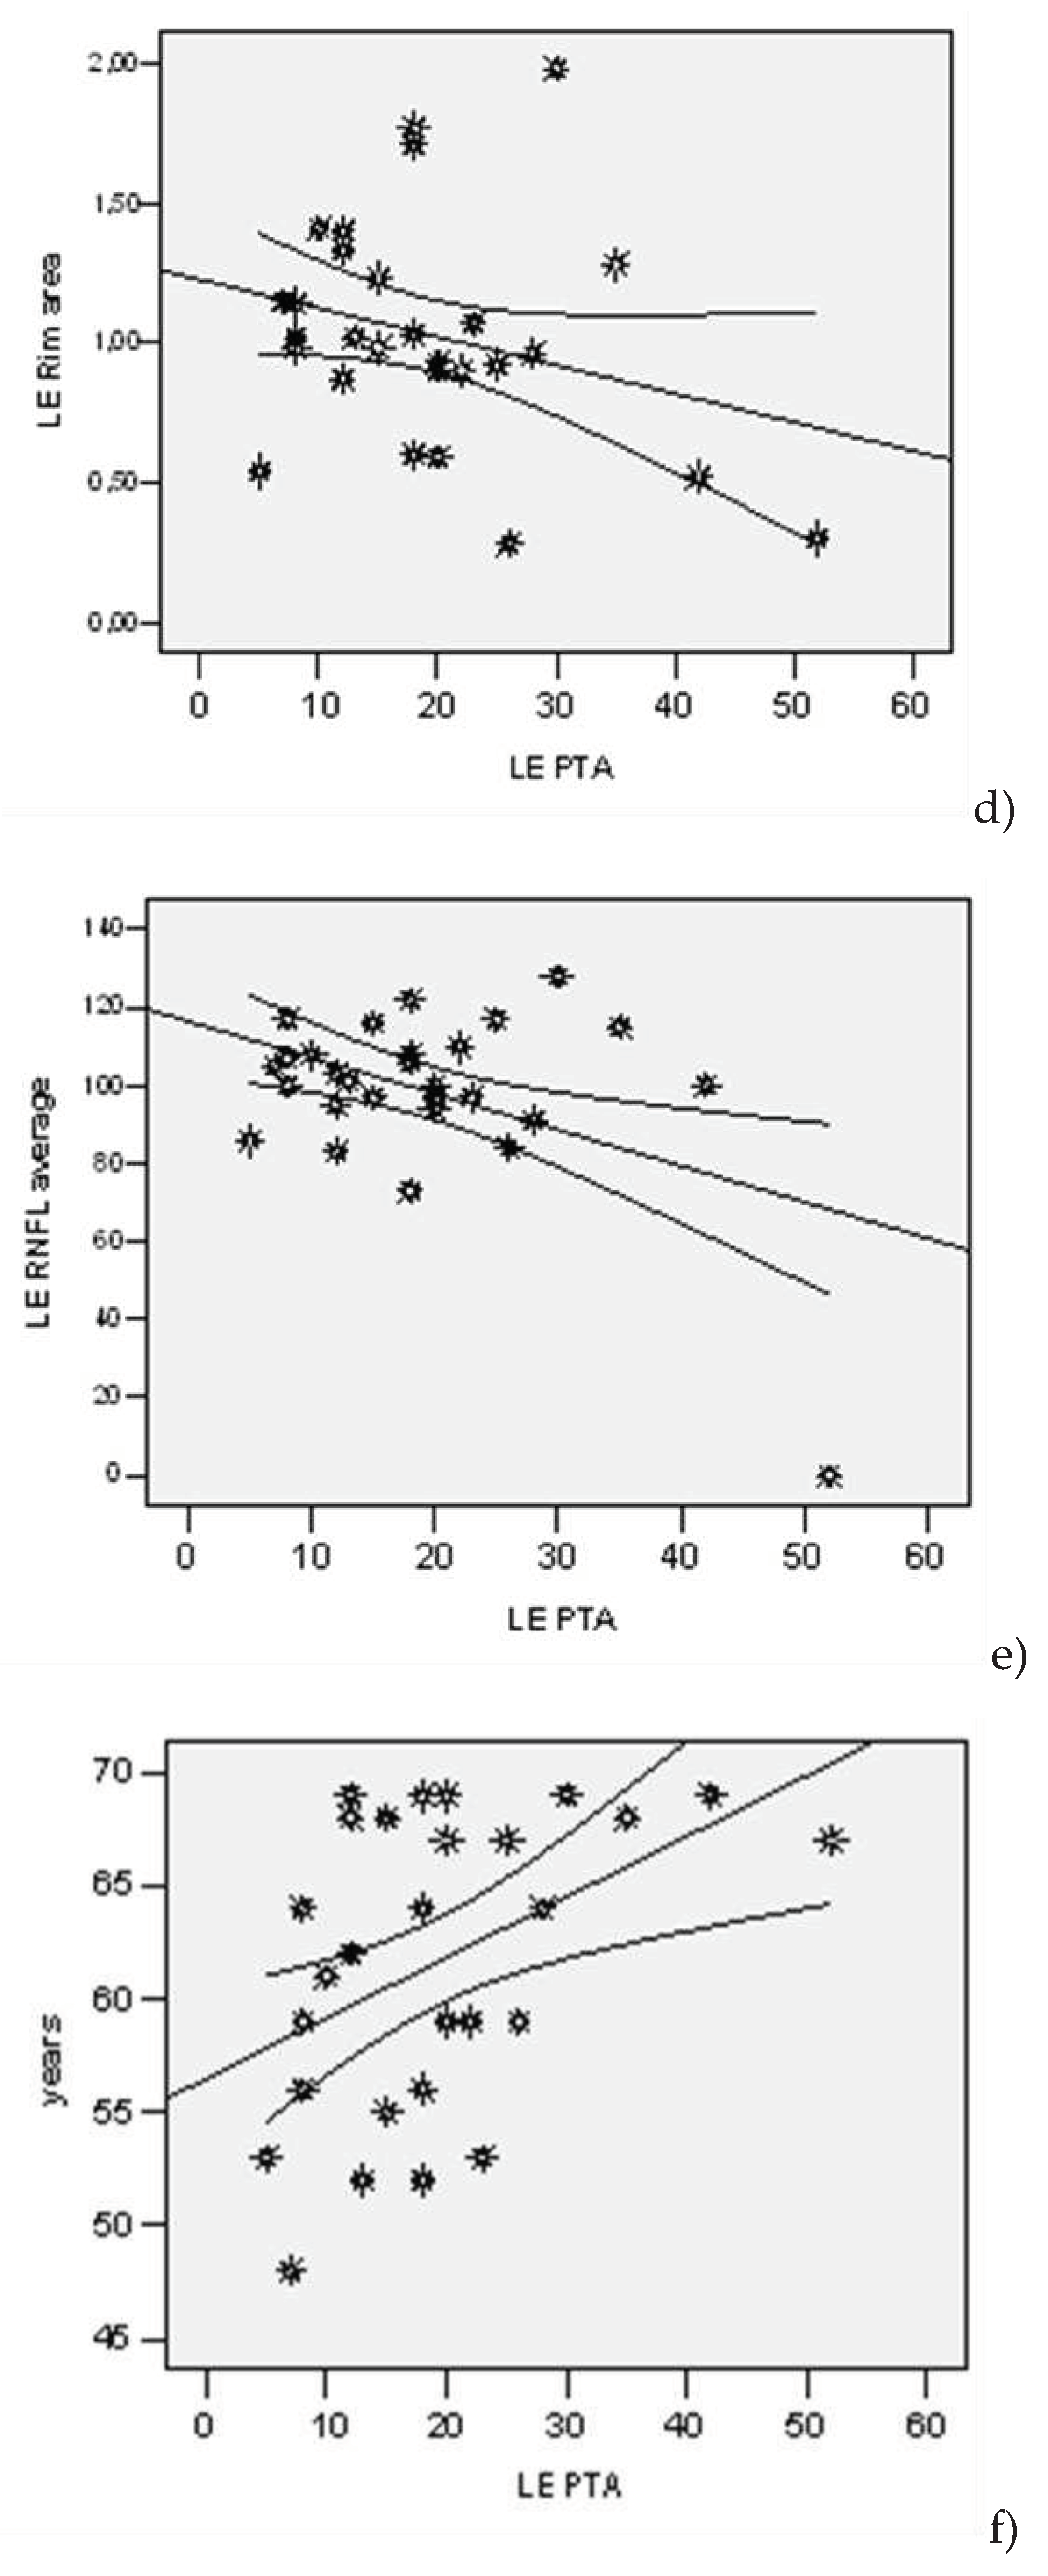
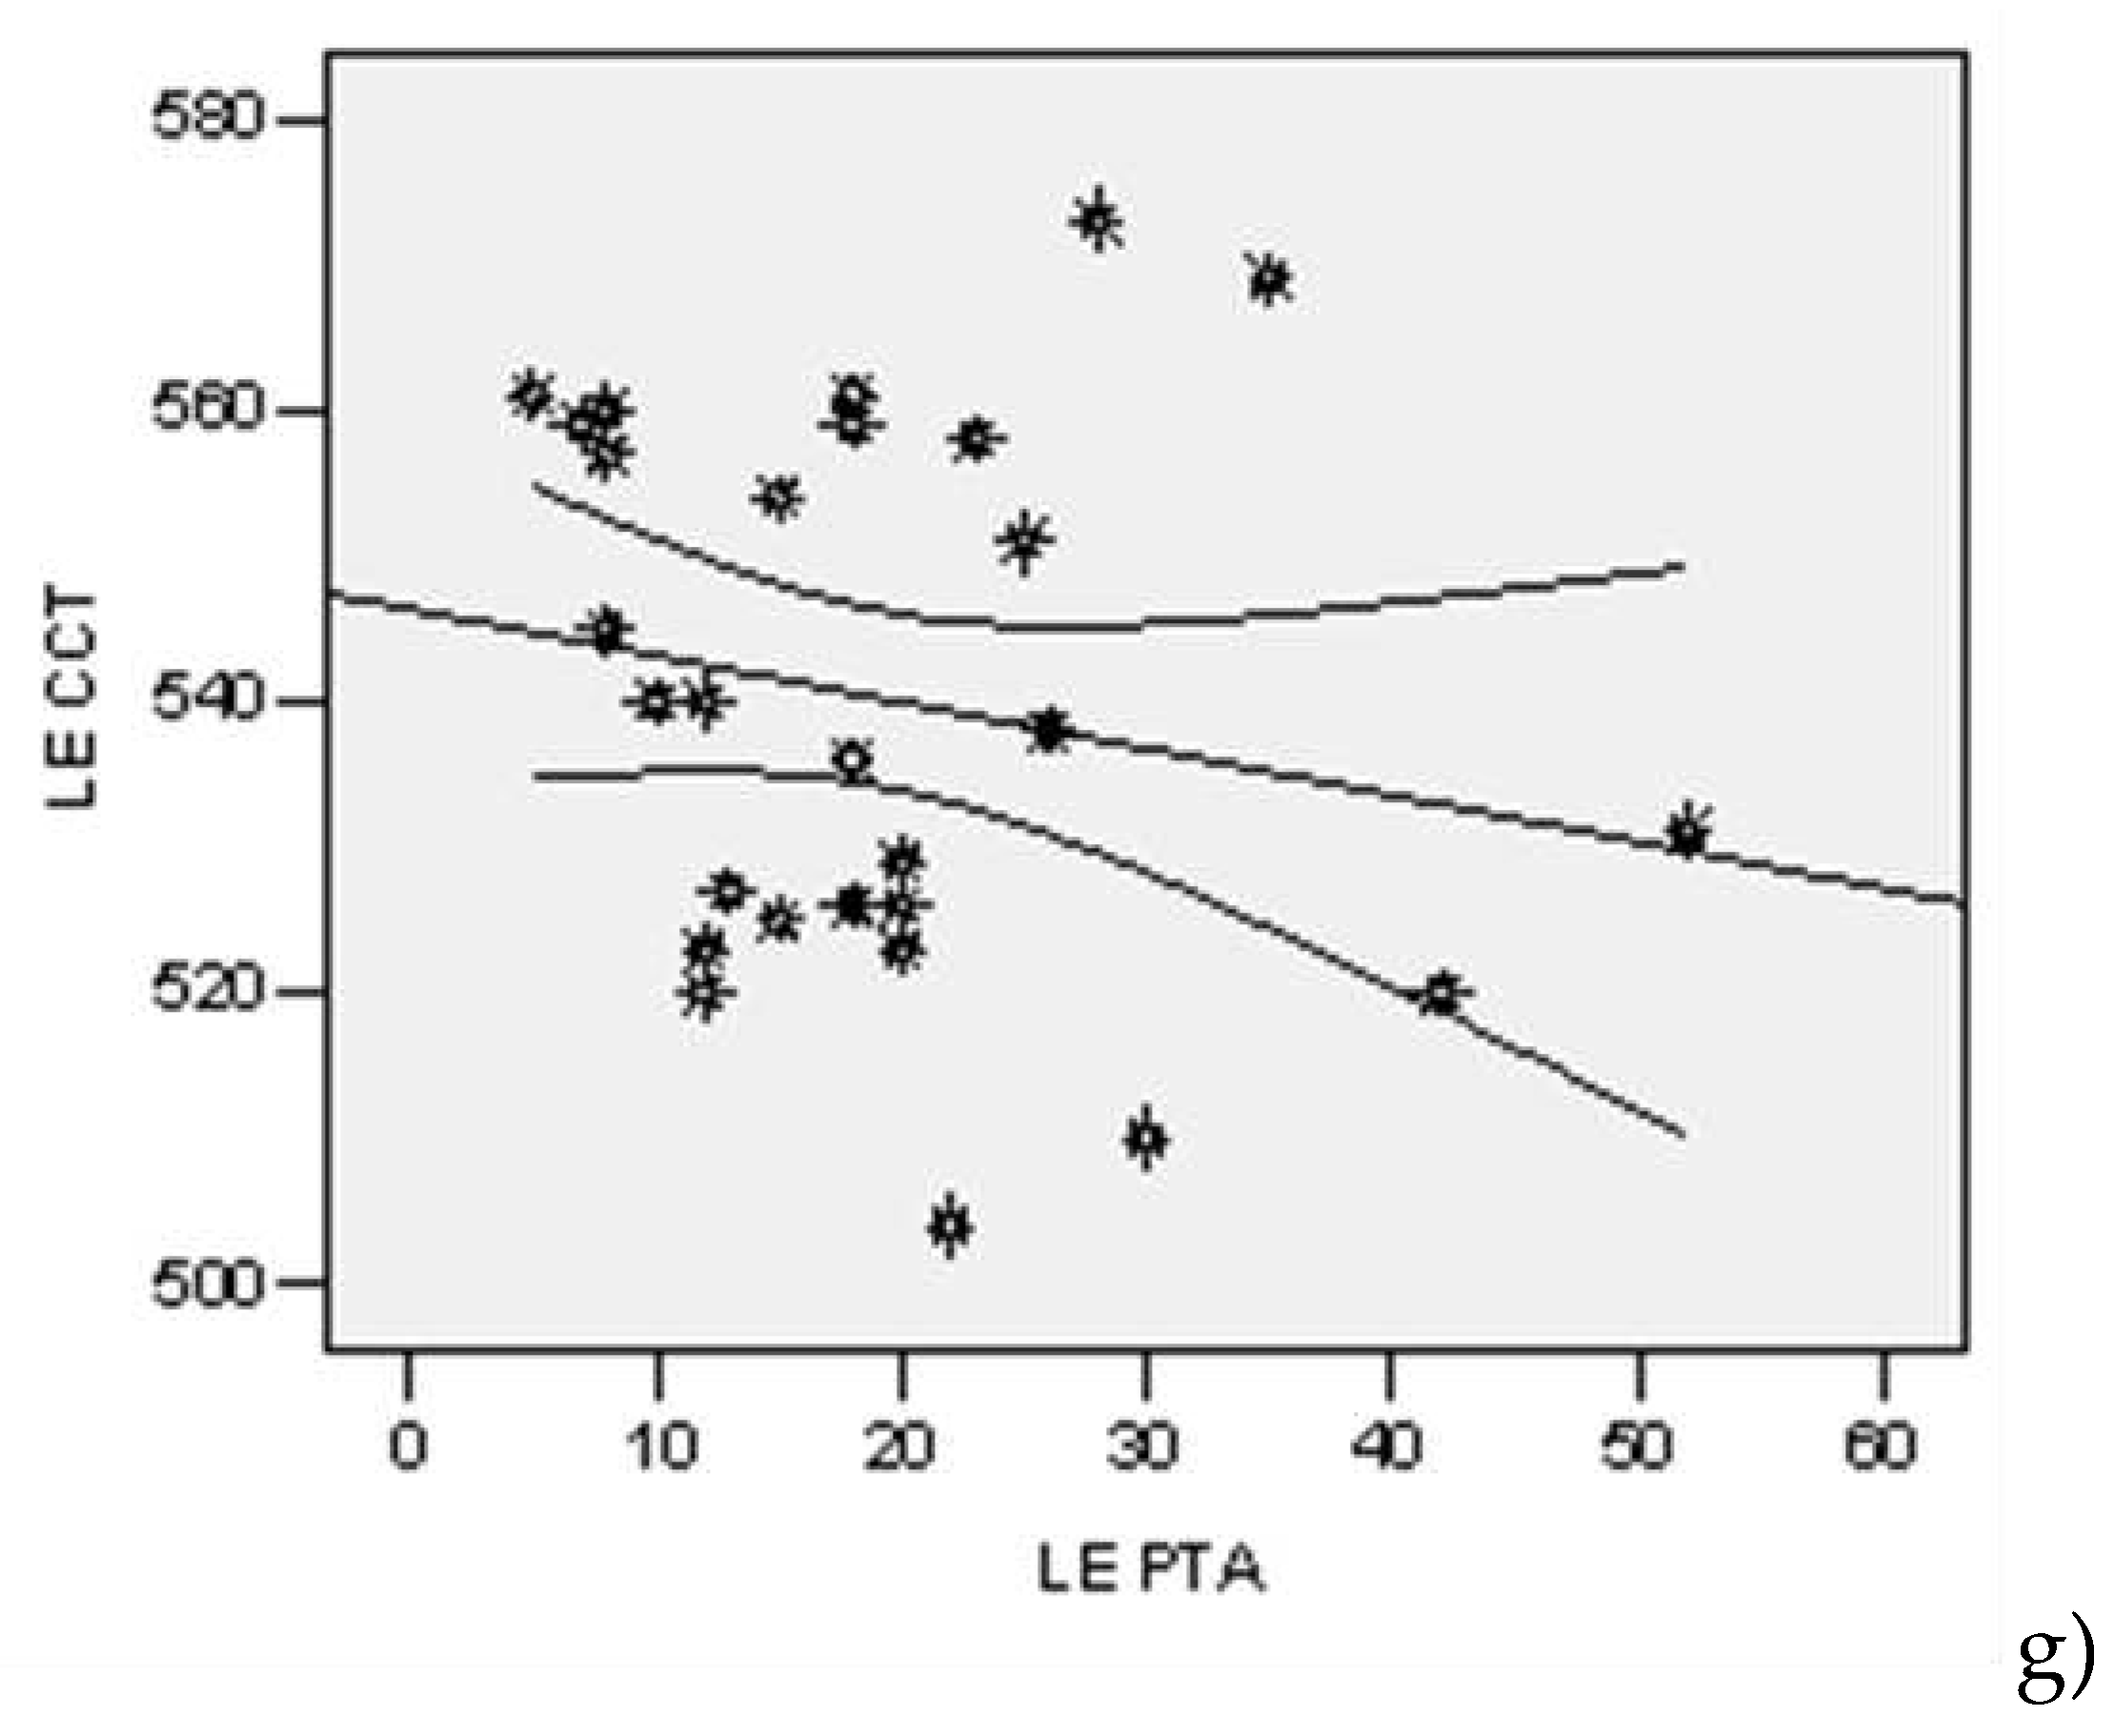
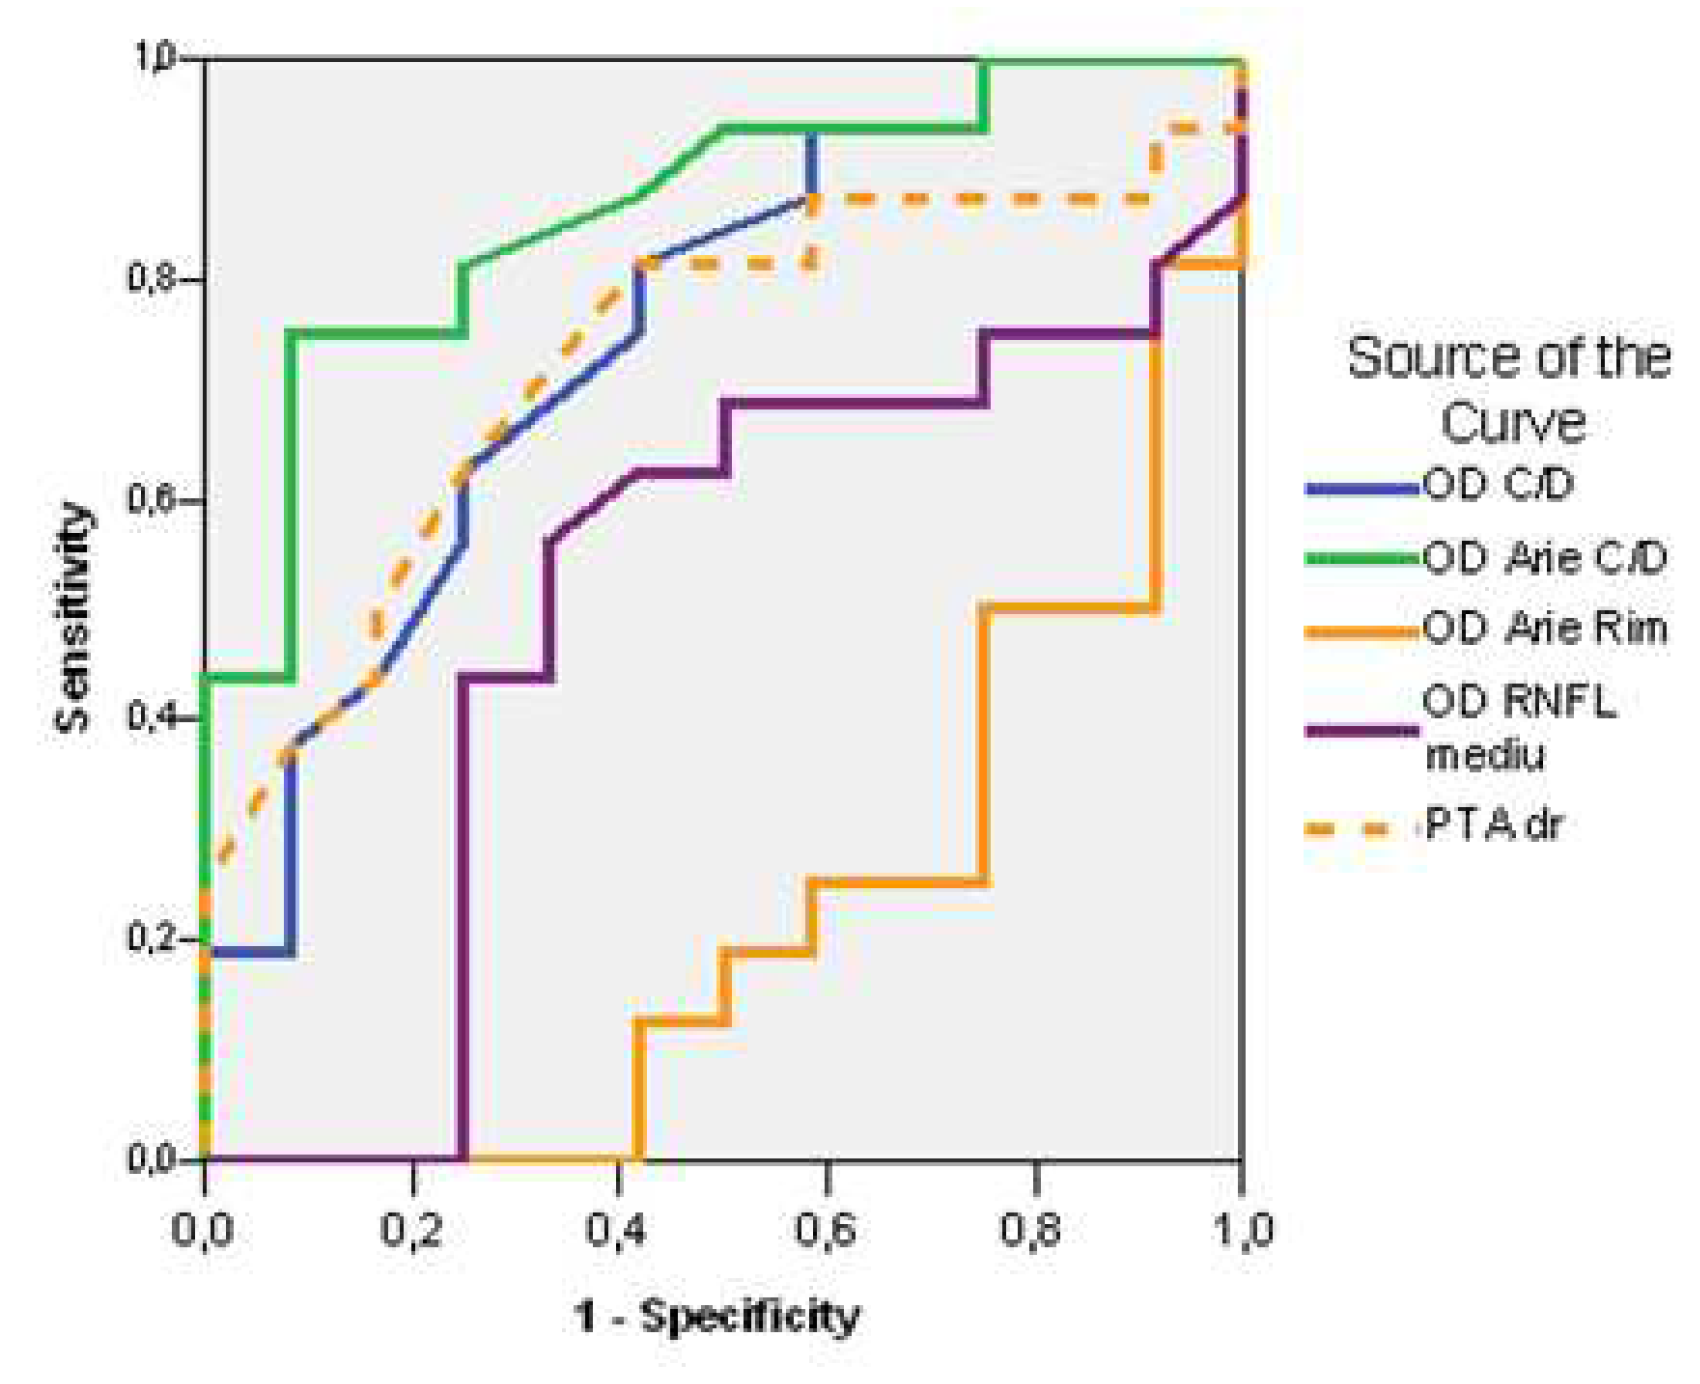
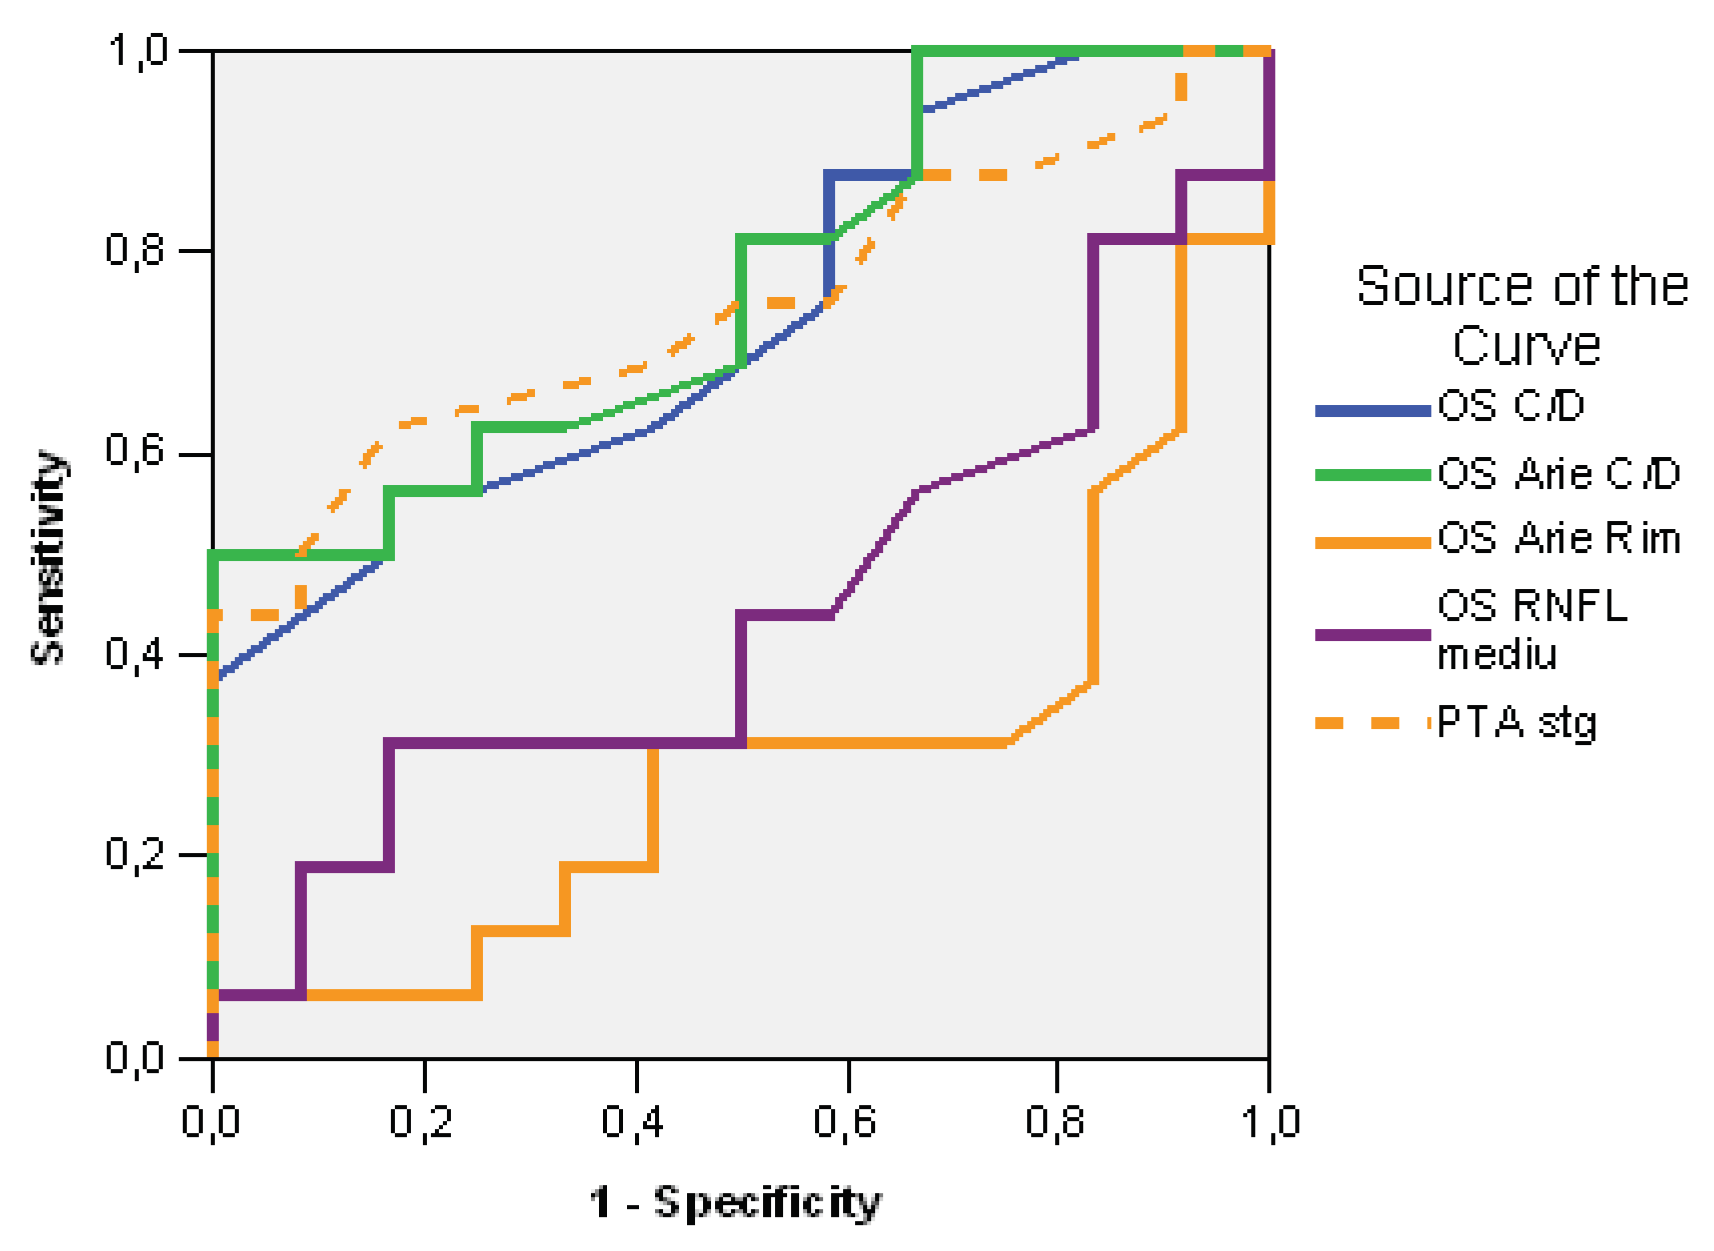

Table 1.
Descriptive data of PTA compared to study groups.
| Lot | N | Average | Std. Dev | Std.error | Confidence Interval 95% | Min | Max | t-Student Test ( p) | |
|---|---|---|---|---|---|---|---|---|---|
| -95%CI | +95%CI | ||||||||
| PTA (dB) right | |||||||||
| Study | 16 | 18.38 | 7.949 | 1.987 | 14.14 | 22.61 | 0 | 30 | 0.063 |
| Control | 12 | 13.33 | 4.793 | 1.384 | 10.29 | 16.38 | 5 | 22 | |
| PTA (dB) left | |||||||||
| Study | 16 | 23.25 | 12.283 | 3.071 | 16.70 | 29.80 | 7 | 52 | 0.023 |
| Control | 12 | 14.00 | 5.560 | 1.605 | 10.47 | 17.53 | 5 | 23 | |
Table 2.
Multivariate analysis. PTA dependent variable linear regression.
| Model | R | R Square | Adjusted R Square | StandardError | Change Statistics | ||||
|---|---|---|---|---|---|---|---|---|---|
| R Square | F | df1 | df2 | p | |||||
| The dependent variable PTA (dB) right | |||||||||
| 1 | 0,342(a) | 0,117 | 0.083 | 6.834 | 0.117 | 3.437 | 1 | 26 | 0,075 |
| 2 | 0,672(b) | 0,452 | 0.408 | 5.491 | 0.335 | 15.269 | 1 | 25 | 0,001 |
| 3 | 0,672(c) | 0,452 | 0.383 | 5.603 | 0.000 | 0,008 | 1 | 24 | 0,930 |
| 4 | 0,672(d) | 0,452 | 0.357 | 5.724 | 0,000 | 0.000 | 1 | 23 | 0,995 |
| The dependent variable PTA (dB) left | |||||||||
| 1 | 0,390(a) | 0,152 | 10.197 | 0.152 | 4.677 | 4,677 | 1 | 26 | 0,040 |
| 2 | 0,547(b) | 0,300 | 9.452 | 0.147 | 5.259 | 5.259 | 1 | 25 | 0,031 |
| 3 | 0,548(c) | 0,300 | 9.646 | 0.000 | 0.006 | 0,006 | 1 | 24 | 0,939 |
| 4 | 0,616(d) | 0,380 | 9.275 | 0.080 | 2.960 | 2.960 | 1 | 23 | 0,099 |
a Predictors: (Constant), Sex; b Predictors: (Constant), Sex, years; c Predictors: (Constant), Sex, years, Environment; d Predictors: (Constant), Sex, years, Environment, Studies.
| Test Result Variable(s) | Area | Std. Error(a) | Asymptotic Sig.(b) | Asymptotic 95% Confidence Interval | ||
|---|---|---|---|---|---|---|
| Cut off | Lower Bound | Upper Bound | ||||
| RE C/D ratio | 0,753 | 0,60 | 0,094 | 0,024 | 0,569 | 0,937 |
| RE C/D Area | 0,862 | 0,33 | 0,070 | 0,001 | 0,725 | 0,999 |
| RE Rim Area | 0,219 | 1,11 | 0,090 | 0,012 | 0,043 | 0,395 |
| RE RNFL average | 0,505 | 95,00 | 0,118 | 0,963 | 0,275 | 0,736 |
| PTA right | 0,732 | 14,00 | 0,097 | 0,039 | 0,542 | 0,922 |
| Test Result Variable(s) | Area | Std. Error(a) | Asymptotic Sig.(b) | Asymptotic 95% Confidence Interval | ||
|---|---|---|---|---|---|---|
| Cut off | Lower Bound | Upper Bound | ||||
| LE C/D ratio | 0,734 | 0,56 | 0,094 | 0,037 | 0,550 | 0,919 |
| LE C/D Area | 0,763 | 0,30 | 0,090 | 0,019 | 0,588 | 0,938 |
| LE Rim Area | 0,292 | 1,11 | 0,100 | 0,063 | 0,095 | 0,488 |
| LE RNFL average | 0,443 | 100,00 | 0,111 | 0,610 | 0,226 | 0,659 |
| PTA left | 0,745 | 14,00 | 0,093 | 0,029 | 0,562 | 0,928 |
Disclaimer/Publisher’s Note: The statements, opinions and data contained in all publications are solely those of the individual author(s) and contributor(s) and not of MDPI and/or the editor(s). MDPI and/or the editor(s) disclaim responsibility for any injury to people or property resulting from any ideas, methods, instructions or products referred to in the content. |
© 2023 by the authors. Licensee MDPI, Basel, Switzerland. This article is an open access article distributed under the terms and conditions of the Creative Commons Attribution (CC BY) license (http://creativecommons.org/licenses/by/4.0/).
Copyright: This open access article is published under a Creative Commons CC BY 4.0 license, which permit the free download, distribution, and reuse, provided that the author and preprint are cited in any reuse.


