
Submitted:
20 February 2025
Posted:
28 February 2025
You are already at the latest version
Abstract
In the process of global economic integration, green development has become an important trend. In 2020, China formulated the "Double Carbon Target", which promoted the process of emission reduction and carbon reduction. At the same time, how to accelerate the social low-carbon transformation was included in the urgent problem to be solved in the development process of our country. Due to the different development models of provinces and cities, there are differences in the spatial dimension of carbon emission efficiency between provinces and cities. Therefore, it is of great strategic significance to study the spatial correlation network structure of carbon emission efficiency between provinces and cities in order to realize the "double carbon goal" and formulate emission reduction policies.In this paper, firstly, the super-efficient EBM model with unexpected output is constructed, and the carbon emission efficiency of 30 provinces, municipalities and autonomous regions in China (excluding Hong Kong, Macao and Taiwan and Tibet) from 2006 to 2021 is measured more accurately. Secondly, the spatial-temporal dynamic evolution characteristics of carbon emission efficiency are analyzed by using the exploratory spatial-temporal data analysis model in the field of geographical research, and the spatial correlation network structure is further studied by combining social network analysis. Finally, LMDI decomposition model is used to decompose the driving factors of carbon emissions into energy efficiency effect, energy intensity effect, economic output effect and population size effect, and their impacts on carbon emissions are analyzed one by one.
Keywords:
carbon emission efficiency
; Super-efficient EBM model
; Exploratory spatio-temporal data analysis
; Social network analysis
; LMDI decomposition model
1. Introduction
With the acceleration of global economic integration, "green development" has become an important trend in the world, and reducing emissions and carbon has become a global consensus. According to the statistics of the World Meteorological Organization, the global atmospheric carbon dioxide concentration will reach 413.2ppm in 2020, which will have many adverse effects on the global climate. As a responsible big country, China has always been an important participant in international climate issues. In September 2020, General Secretary Xi Jinping put forward the "Double Carbon Goal" for the first time at the 75th United Nations General Assembly, that is, to achieve peak carbon dioxide emissions by 2030, and strive to achieve carbon neutrality by 2060, which clearly defined the time plan for China's emission reduction and carbon reduction. The 18th National Congress of the Communist Party of China and Report to the 20th CPC National Congress put forward the national strategy of "actively responding to climate change" and the requirement of "actively and steadily promoting carbon neutrality in peak carbon dioxide emissions", which not only promoted the transformation of China's economic and social development to a green and low-carbon direction, but also reflected China's emphasis on carbon emissions and its responsibility as a big country. The improvement of carbon emission efficiency is the core of a country's realization of "reducing carbon and promoting economy"1. In order to effectively improve carbon emission efficiency and achieve carbon emission reduction targets, a region relies more and more on regional coordination. Therefore, under the background trend of the times, supported by artificial intelligence and big data technology, it is of great significance for China's green transformation and upgrading and achieving the goal of "double carbon" to take carbon emission efficiency as the main measurement index to deeply study the spatial correlation structure of carbon emission efficiency in China province.
As an important indicator to measure whether the emission reduction target is achieved, carbon emission efficiency has gradually become the focus of academic attention. The research on carbon emission efficiency mainly includes the following three aspects: First, the measurement method of carbon emission efficiency. At present, Data Envelopment Analysis (DEA) is the most widely used efficiency measurement method.2On this basis, some scholars consider unexpected output, exogenous environment and other factors, improve the measurement method, and measure the carbon emission efficiency by using Super Slack Based Model, SBM-DEA model and three-stage DEA model.[3,4,5]. The second is the temporal and spatial evolution characteristics of carbon emission efficiency. Some scholars use theil index, Gini coefficient, nuclear density estimation, Markov chain, social network analysis, Exploratory Spatial Data Analysis (ESDA) and other methods to analyze the spatial and temporal characteristics of carbon emission efficiency.[6,7,8,9,10,26]. It is found that the spatial distribution of urban carbon emission efficiency in China has the characteristics of "north-south differentiation, high in the east and low in the west", and the regional differences are expanding[11,12]. The third is the analysis of influencing factors of carbon emission efficiency. Some scholars use spatial econometric analysis methods such as QAP (Quadratic Assignment Procedure) regression, Tobit regression and spatial Dobbin model to explore the influencing factors of carbon emission efficiency.[13,14,15]. It is found that per capita GDP level, geographical proximity, scientific and technological innovation level and informatization level all have significant positive effects on the spatial correlation of carbon emissions.[16,17].
By combing the existing literature, we can find that the research on carbon emission efficiency has achieved some research results, especially in measurement methods, temporal and spatial evolution characteristics and influencing factors, but there is still room for further improvement. First, most of the existing studies have studied the spatio-temporal dynamic evolution characteristics of carbon emission efficiency and the spatial correlation network structure separately, but few scholars have studied them together at present. Secondly, most of the existing studies use DEA model, SBM model or super-efficient SBM model to measure. At present, few scholars apply the EBM(Epsilon-Based Measure) model to measure carbon emission efficiency. The former is more sensitive to the selection and setting of parameters, while the latter can consider environmental efficiency more comprehensively, thus improving the accuracy of assessment.
This paper measures the carbon emission efficiency of 30 provinces in China from 2006 to 2021 based on the super-efficiency EBM model. Then, an exploratory spatio-temporal data analysis model is introduced to study the spatio-temporal evolution characteristics of carbon emission efficiency; Thirdly, the modified gravity model and social network analysis are used to explore the spatial correlation network structure characteristics of carbon emission efficiency; In addition, the log-average Dirichlet Index (LMDI) decomposition model is used to decompose the driving factors of carbon emissions into four types, and their impacts on carbon emissions are analyzed one by one.
The marginal contribution of this paper is mainly reflected in the following two aspects: First, in terms of research content, this paper will consider the time factor on the basis of ESDA, explore the temporal and spatial evolution characteristics of carbon emission efficiency by using Exploratory Time-Space Data Analysis (ESTDA) in the field of geographical research, and make a comprehensive study on the temporal and spatial dynamic evolution characteristics of China's provincial carbon emission efficiency and the spatial correlation network structure by combining social network analysis. Secondly, in the measurement method, this paper uses the super-efficient EBM model to measure the carbon emission efficiency, which effectively eliminates the interference of unexpected output and some statistical noise on the research results, making the calculation of carbon emission efficiency more scientific and accurate.
The Calculation of Carbon Emission Efficiency in China Province
2.1. Index Selection
Considering the availability of data and existing literature practices18The carbon emission efficiency is defined as the maximum economic output (expected output) and the minimum carbon dioxide emission (unexpected output) that the decision-making unit can achieve under the condition of constant labor, energy and capital input. Therefore, the number of employees at the end of the year, the total energy consumption and the capital stock are selected as input indicators to measure the carbon emission efficiency, among which the capital stock draws lessons from Zhang Jun.19Based on the year 2000, the fixed assets investment price index is used for depreciation. The capital stock in the base period is obtained by dividing the initial actual total fixed assets investment by 10%, and the depreciation rate of capital over the years is 9.6%. The regional GDP is regarded as the expected output, and the total carbon emission of each province is regarded as the unexpected output. The evaluation index system of carbon emission efficiency is shown in Table 1.
2.2. Data Sources
This paper selects the panel data of 30 provinces in China from 2006 to 2021 as samples, but Hong Kong, Macau, Taiwan Province and Tibet are not included in the study due to lack of data. The total carbon emission data comes from the China provincial carbon emission inventory provided by China Carbon Accounting Database (https://www.ceads.net.cn/). The list is calculated according to the updated carbon emission factor and apparent energy consumption estimation method, which reduces the uncertainty of carbon emission data in China, including cement production and fossil fuel consumption.27. Other relevant data mainly come from China Statistical Yearbook, China Energy Statistical Yearbook and China Industrial Statistical Yearbook.
2.3. Calculation Results
This paper compares Andersen and Petersen.28The pioneering super-efficiency DEA model is embedded into the EBM model, and the super-efficiency EBM model with unexpected output is constructed, and this model is used to calculate the carbon emission efficiency of China province. The EBM model can be expressed as:
Among them, it is the provincial carbon emission efficiency calculated by EBM model; And the sum is the planning parameters of the radial part; ,, and are the key parameters for the transformation of radial and non-radial relaxation conditions, and the range of values is; And the weights of input, output and unexpected output indicators respectively; And the slack of input, expected output and unexpected output respectively; And input, expected output and unexpected output of the first decision-making unit, respectively; Is the linear combination coefficient of the decision-making unit; And that quantity of input, expected output and unexpected output, respectively.
Based on Formula (1)- Formula (2), the provincial carbon emission efficiency of China from 2006 to 2021 is calculated, and the results are shown in Table 2.
As can be seen from Table 2, from 2006 to 2021, the national carbon emission efficiency increased from 0.275 to 0.644, with an average annual change rate of 5.825%, showing an upward trend year by year. The average carbon emission efficiency of Jiangsu, Shanghai, Beijing, Hunan, Guangdong and Tianjin is greater than 0.5, while that of Shanxi, Ningxia, Xinjiang and Gansu is less than 0.3. At the same time, a few provinces have appeared unstable characteristics, such as Gansu, Xinjiang and Inner Mongolia. In terms of the average annual change rate, the average annual change rate of 30 provinces in China is positive, and the carbon emission efficiency of Yunnan, Chongqing, Beijing, Hubei and Fujian provinces has increased rapidly, with the average annual change rate greater than 8%. Generally speaking, there are obvious regional differences in the carbon emission efficiency of provinces in China. The carbon emission efficiency of eastern provinces is higher, while that of central and western provinces is lower.
3. The Spatial and Temporal Evolution Characteristics of Carbon Emission Efficiency in China province
With the completion and continuous implementation of the "double carbon" policy system, the spatial-temporal pattern of carbon emission efficiency in China has also changed greatly. Based on ESTDA, this paper studies the spatial-temporal evolution characteristics of carbon emission efficiency in China province.
Rey et al29On the basis of exploratory spatial data analysis, exploratory spatio-temporal data analysis is put forward, which makes up for the deficiency of the former in time dimension measurement. At present, ESTDA mainly includes LISA (local indicators of spatial association) time path and Lisa time-space transition, and is widely used in water resources, land use and other fields, but it is rare in the research field of carbon emission efficiency.
LISA time path can describe the dynamic migration and change of LISA coordinates in Moran index scatter plot, reveal the stability of LISA coordinates with time, and then explain the dynamic characteristics of spatial-temporal differences and the process of spatial-temporal interaction of carbon emission efficiency in China province. The geometric characteristics of LISA time path include relative length, curvature and moving direction.
The formula for calculating the relative length is:
The calculation formula of curvature is:
The calculation formula of moving direction is:
where: is the time interval; Is the total number of provinces; Is the coordinate position of the year saved in the Moran index scatter plot; In order to save the moving distance from to. Because the length of the provincial coordinate movement is higher than the average, the higher it is, the more dynamic the local spatial structure of the provincial carbon emission efficiency is. The larger the province is, the greater the influence of neighboring provinces and cities is, and the evolution process of local spatial dependence of carbon emission efficiency is more volatile. It is the average moving direction of introspection during the study period.
LISA's spatio-temporal transition is to embed the moving distance and moving direction of the provincial coordinates in Moran's exponential scatter plot into the traditional Markov chain to reflect the transformation process of different local spatial correlation types. LISA space-time transitions are generally divided into the following four types, as shown in Table 3.
3.1. The Geometric Characteristics of the Time Path
With the help of GeoDa software, the relative length, curvature and moving direction of LISA's time path are calculated based on Formula (3)- Formula (5), and the relative length and curvature are divided into four grades by natural breakpoint method, as shown in Figure 1.
As shown in Figure 1a, on the whole, the relative length of LISA's time path is high in the east and low in the west. Relatively speaking, the change range between the eastern region and the central region is large, and its local spatial structure is dynamic. The average relative length of the eastern region, the central region and the western region is 1.210, 0.941 and 0.833 respectively, and the spatial pattern of the eastern region has the largest change. The relative lengths of LISA time paths in Tianjin, Jiangsu, Shanghai, Beijing and Yunnan are longer, which are 1.939, 1.631, 1.448, 1.378 and 1.216 respectively, indicating that their local spatial structures are more dynamic. The relative length of LISA's time path is short in Shaanxi, and its relative length is 0.531, which shows that its local spatial structure is relatively stable.
In Figure 1b, the average curvatures of the eastern region, the central region and the western region are 6.496, 7.792 and 3.262, respectively, and the carbon emission efficiency of the central region has strong fluctuation in spatial dependence. Anhui, Jiangsu, Jiangxi, Shanghai and Xinjiang are the provinces with large curvature, among which Anhui has the largest curvature, which is 24.828, indicating that its carbon emission efficiency has strong fluctuation and is more easily affected by neighboring provinces and cities; There are 19 provinces with small curvatures, accounting for 63.33%, and the smallest three provinces are Hainan, Guangdong and Yunnan, with curvatures of 1.357, 1.386 and 1.790 respectively, indicating that their spatial dependence changes are relatively stable.
3.2. The Moving Direction of the Time Path
According to the coordinate changes of 30 provinces in China from 2006 to 2021 in the local Moran index scatter map, the moving direction can be divided into four categories. 0-90 is the first quadrant, indicating that the carbon emission efficiency of provinces and cities themselves and neighboring provinces and cities is a positive coordinated transition; 180-270 is the third quadrant, indicating that provinces and cities themselves and neighboring provinces and cities are a negative coordinated transition; 90-180 in the second quadrant and 270-360 in the fourth quadrant indicate that provinces and cities themselves and neighboring provinces and cities are reverse transitions, with a total of 15. Among them, a total of five provinces and cities are positively coordinated, namely Beijing, Hubei, Anhui, Qinghai and Chongqing. A total of 10 provinces and cities have a negative coordinated transition, mainly distributed in Northeast China, North China and South China. On the whole, the negative integration of coordinated transition provinces and cities is greater than the positive integration. The other provinces and cities are in reverse transition with neighboring provinces and cities. Among them, the provinces and cities with the transition direction of 90-180 are mostly distributed in the western region, and the growth rate of their own carbon emission efficiency is slow, while the growth rate of neighboring provinces and cities is fast; The provinces and cities with the transition direction of 270-360 are mostly distributed in the eastern region, and the provinces and cities themselves have a high growth trend, while the neighboring provinces and cities have a low growth trend.
3.3. Time-Space Transition Analysis
Using LISA time-space transition analysis, the spatial transfer probability matrix is further calculated according to the local spatial correlation type, and the results are shown in Table 4.
From Table 4, it can be seen that there are relatively few transitions between different types. There are no transitions in half of the provinces, which shows that the spatial correlation pattern of carbon emission efficiency in China province is relatively stable, with certain characteristics of transfer inertia and path dependence. During the study period, there were four different types of transfer transitions in the carbon emission efficiency of China province, among which HHt→HHt+1(0.909) in Type 0 has the highest probability, indicating that no spatial transfer is the most common transition type. In Type I, the largest spatial correlation transition probability is LHt→HHt+1, and its value is 0.095. In type ii, the maximum transition probability is HLt→HHt+1, and its value is 0.100. In type ⅲ, the maximum transition probability is HLt→LHt+1, and its value is 0.025. It can be seen that the regional carbon emission efficiency of China province is less affected by the spillover effect of neighboring provinces and cities, and more depends on the provinces and cities' own factors to change their position in the overall spatial and temporal pattern of carbon emission efficiency, and the spillover effect of collaborative governance has not been fully exerted.
4. Analysis on the Characteristics of Spatial Correlation network Of Carbon Emission Efficiency in China Province
In order to deeply understand the spatial evolution of carbon emission efficiency in China province and the spatial correlation of carbon emission efficiency among regions, this paper uses social network analysis method to discuss the overall structure and local characteristics of the spatial correlation network of carbon emission efficiency, and clarify the roles, functions and positions of provinces in the spatial correlation network.
4.1. The Construction of Spatial Correlation Network
Reference related research[21,22]The spatial correlation intensity of carbon emission efficiency in China province is calculated by gravity model. At the same time, the contribution of carbon emission efficiency of each province to spatial correlation is revised, and the formula of the revised gravity model is as follows.
Among them, the correlation degree of carbon emission efficiency is the correction coefficient, and, are the carbon emission efficiency indexes of provinces, respectively, and are the geographical distance between provinces.
On the basis of determining the inter-provincial correlation of carbon emission efficiency, the correlation intensity matrix of carbon emission efficiency is constructed and binarized, as shown in Formula (8), so as to better analyze the spatial structure of carbon emission efficiency in China province.
Taking the provinces as nodes and the carbon emission efficiency links between provinces as edges, a relationship network without power and direction is constructed. The squares in the network represent the provinces, and the directed line segments among the provinces represent the network correlation strength and spatial spillover direction. In order to show more clearly the dynamic changes of the correlation of carbon emission efficiency among provinces, this paper draws a directed network diagram of the spatial correlation of carbon emission efficiency in 2006, 2011, 2016 and 2021 by using Netdraw software, as shown in Figure 3, in which the size of the box indicates the degree centrality of the province in the correlation network.
The spatial correlation of carbon emission efficiency in China province has formed an obvious network structure, among which the provinces with more connections include Henan, Anhui, Jiangxi, Hunan, Hubei, Shandong, Jiangsu, Shanghai, Tianjin and Beijing. Figure 3 shows that the spatial correlation of carbon emission efficiency is large, showing obvious "center-edge" characteristics. During the research period, this spatial correlation effect is increasing year by year, and the spatial network structure intensifies the mutual influence of carbon emission efficiency among provinces.
4.2. Analysis of the Overall Structural Characteristics of the Associated Network
From 2006 to 2021, the spatial network density of carbon emission efficiency showed a significant upward trend. The spatial network density showed a downward trend from 2006 to 2011, but it kept an upward trend after 2011, rising from 0.1701 in 2011 to 0.1885 in 2021, indicating that the close degree of inter-provincial links was constantly improving, but only less than 18.85% of the links were observed.
4.3. Analysis of the Characteristics of the Individual Structure of the Associated Network
On the basis of defining the structural characteristics of the overall spatial correlation network of carbon emission efficiency, the central index of carbon emission efficiency of each province in the network is further calculated, and the role, status and function of each province in the spatial correlation network of carbon emission efficiency are analyzed accordingly. In order to visually show the dynamic evolution trend of centrality characteristics of spatial correlation networks during the research period, this paper uses Arcgis software to visualize the centrality indicators of provinces in 2006, 2011, 2016 and 2021, and divides the centrality level into four levels from low to high according to the natural discontinuity method.
- 1.Degree centrality
Degree centrality is the most intuitive index to measure node centrality. If a province has a high degree centrality, it indicates that it has more links with other provinces in carbon emission efficiency, and is at the core of the carbon emission efficiency network, with high influence and resource agglomeration capacity.
Figure 4.
Degree Centrality Evolution of Spatial Correlation Network of Carbon Emission Efficiency.
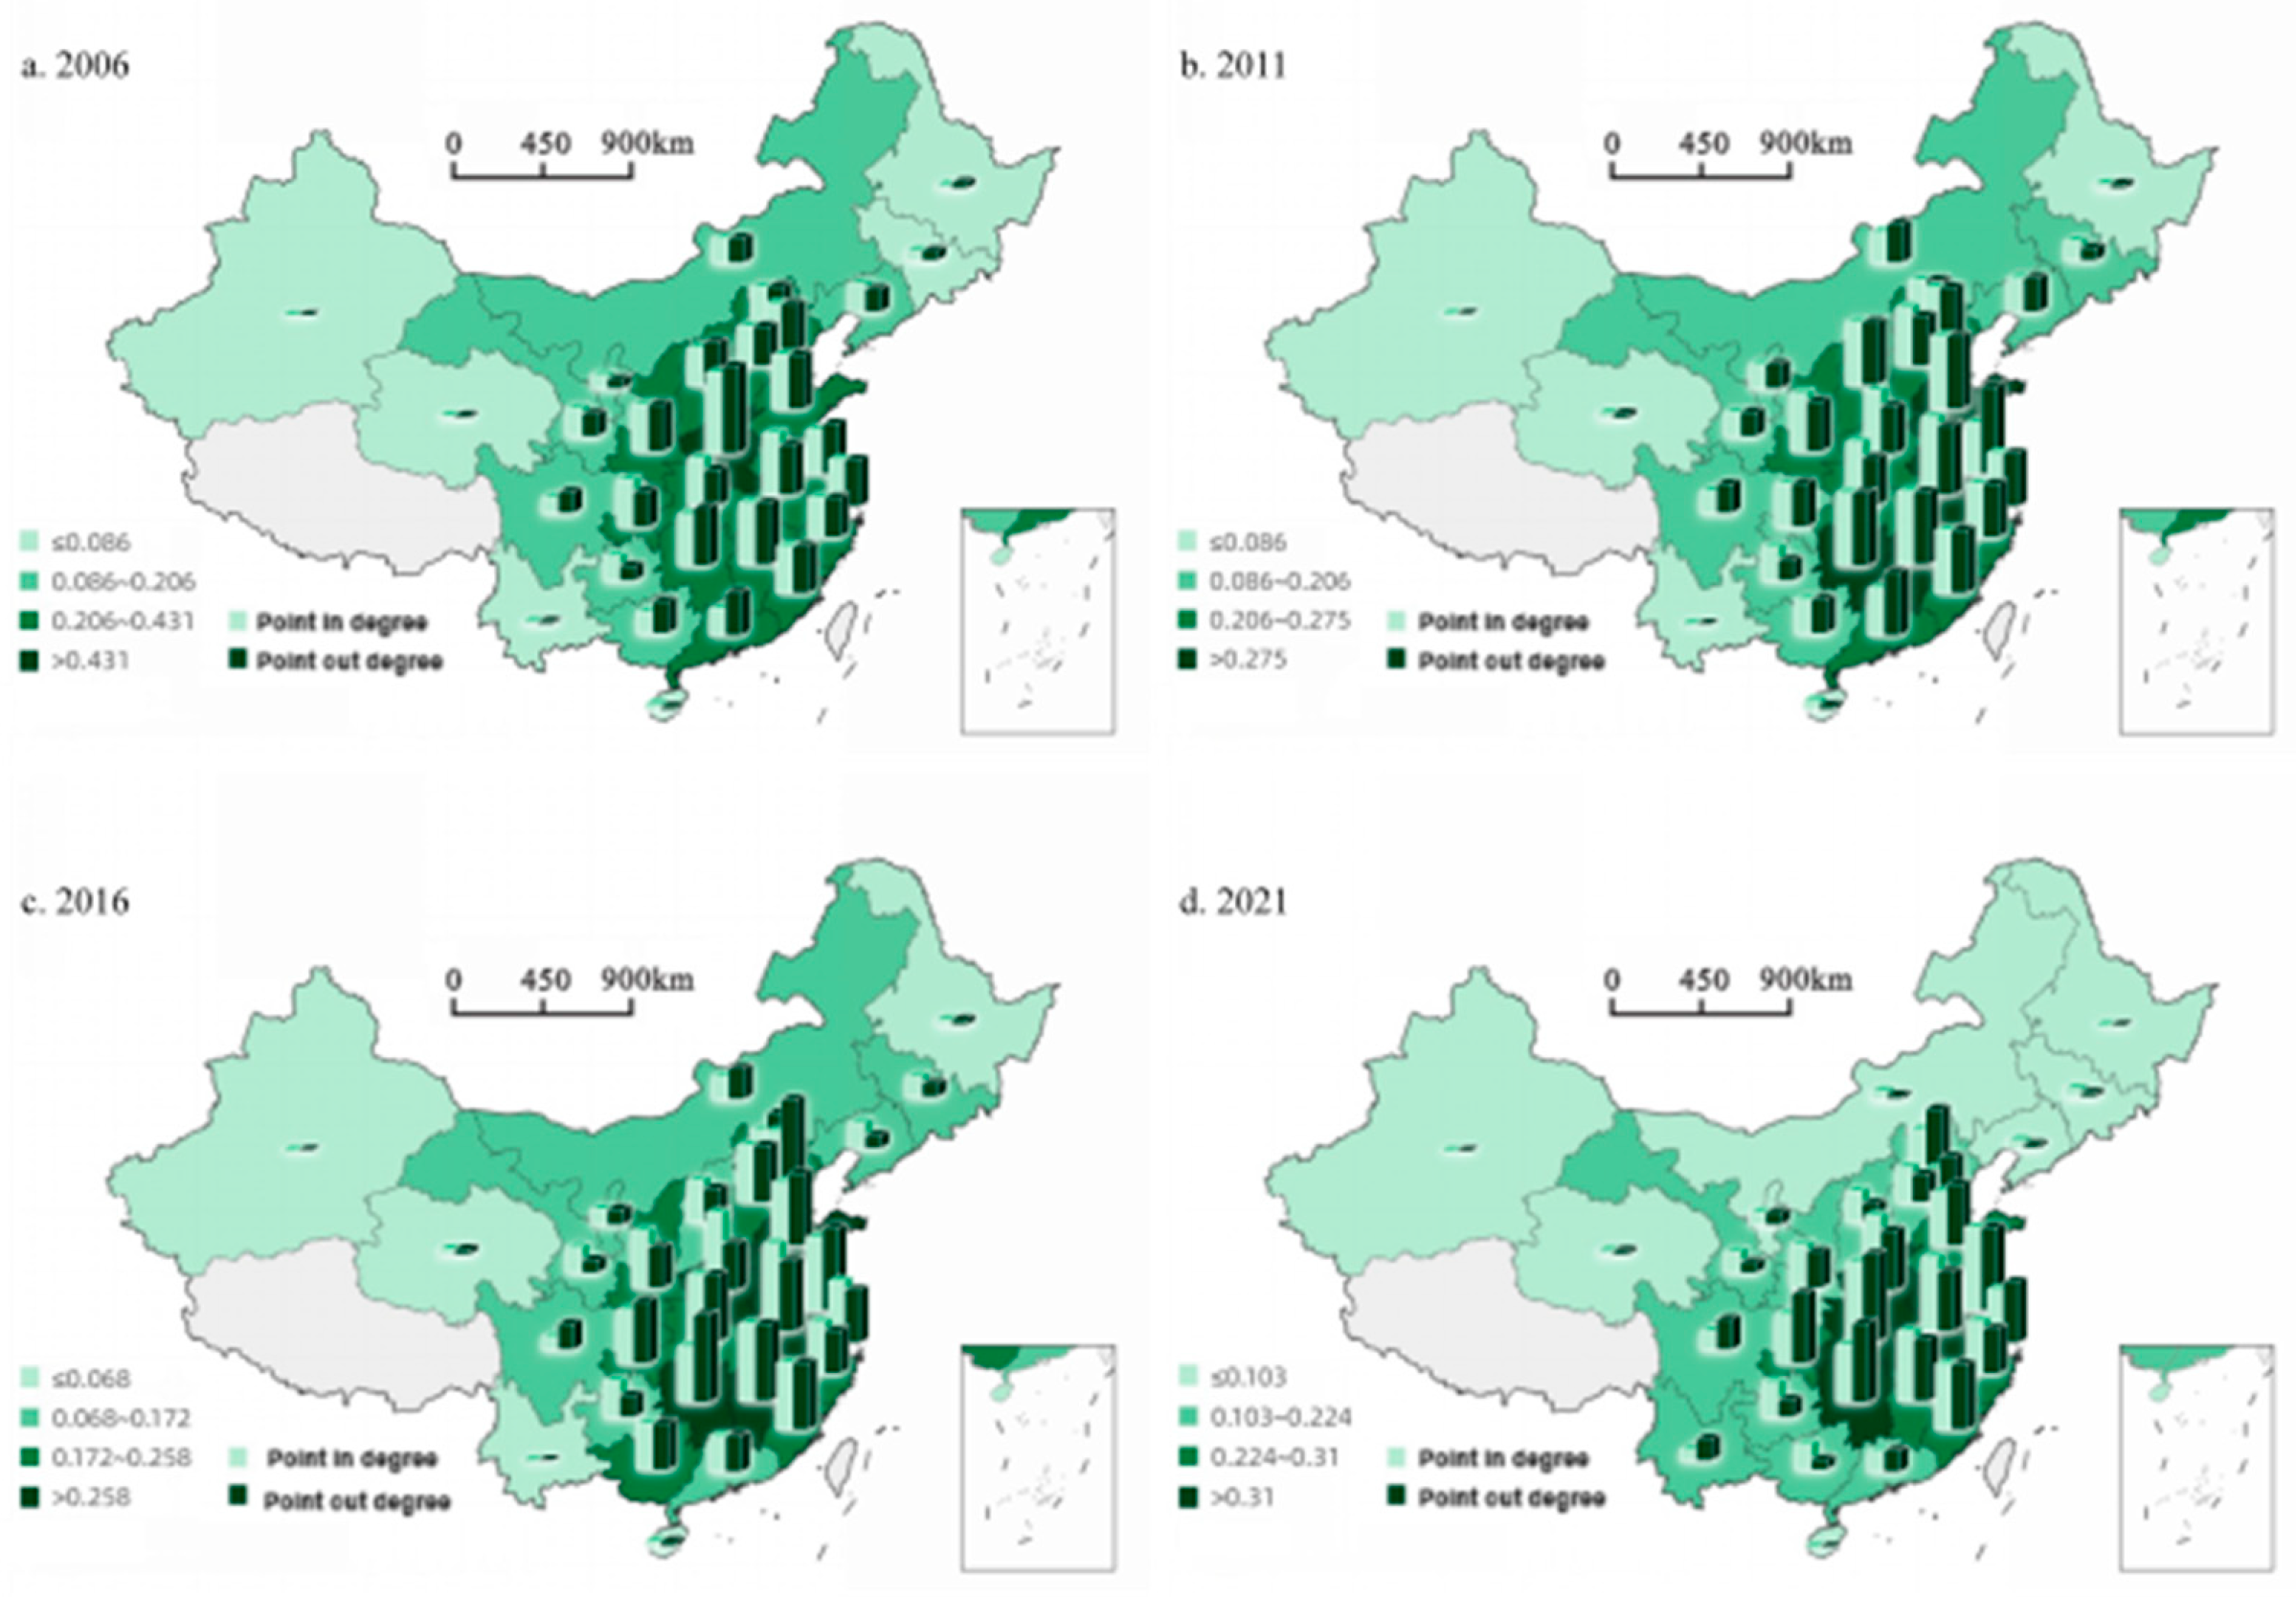
Provinces with lower degree centrality are more likely to issue carbon emission efficiency correlation to provinces with higher degree centrality. The provinces with lower degree centrality are mainly distributed in areas with relatively rich energy resources and relatively small economic scale, while the provinces with higher degree centrality are mostly located in economically developed areas such as Bohai Rim and Yangtze River Delta.
The provinces with higher degree centrality are Henan, Anhui, Jiangxi, Hunan, Shandong, Jiangsu, Shanghai, Tianjin and Beijing, and their local connections are closer, reflecting that the spatial correlation of carbon emission efficiency in the Bohai Rim and Yangtze River Delta regions is more concentrated. Hainan, Yunnan, Xinjiang, Qinghai and Heilongjiang are less connected in the network. Because of their relatively backward economic development and remote geographical location, it is difficult to establish spatial relations with other provinces.
Furthermore, according to the calculation results of penetration degree and penetration degree, the recipients of the spatial correlation relationship of carbon emission efficiency are mainly provinces with higher degree centrality, and the penetration degree of these provinces is obviously greater than the penetration degree. Relatively speaking, the in-degree of provinces with less correlation in the network is obviously lower than the out-degree, and these provinces play the role of emitters in the spatial correlation network of carbon emission efficiency.
To sum up, the degree centrality of Bohai Rim and Yangtze River Delta is always at a high level, and its in-degree and out-degree are relatively high. The reason is that these areas have a high level of carbon emission efficiency, which has been in the core position for a long time, so it is easier to communicate and cooperate with other areas, and their carbon emission efficiency spillover and siphon effect are relatively strong.
- 2.
- Intermediary centrality
Intermediary centrality is a measure of the number of times a province serves as the shortest path bridge between the other two provinces.
Figure 5.
Evolution of Intermediary Centrality of Spatial Correlation Network of Carbon Emission Efficiency.
Figure 5.
Evolution of Intermediary Centrality of Spatial Correlation Network of Carbon Emission Efficiency.
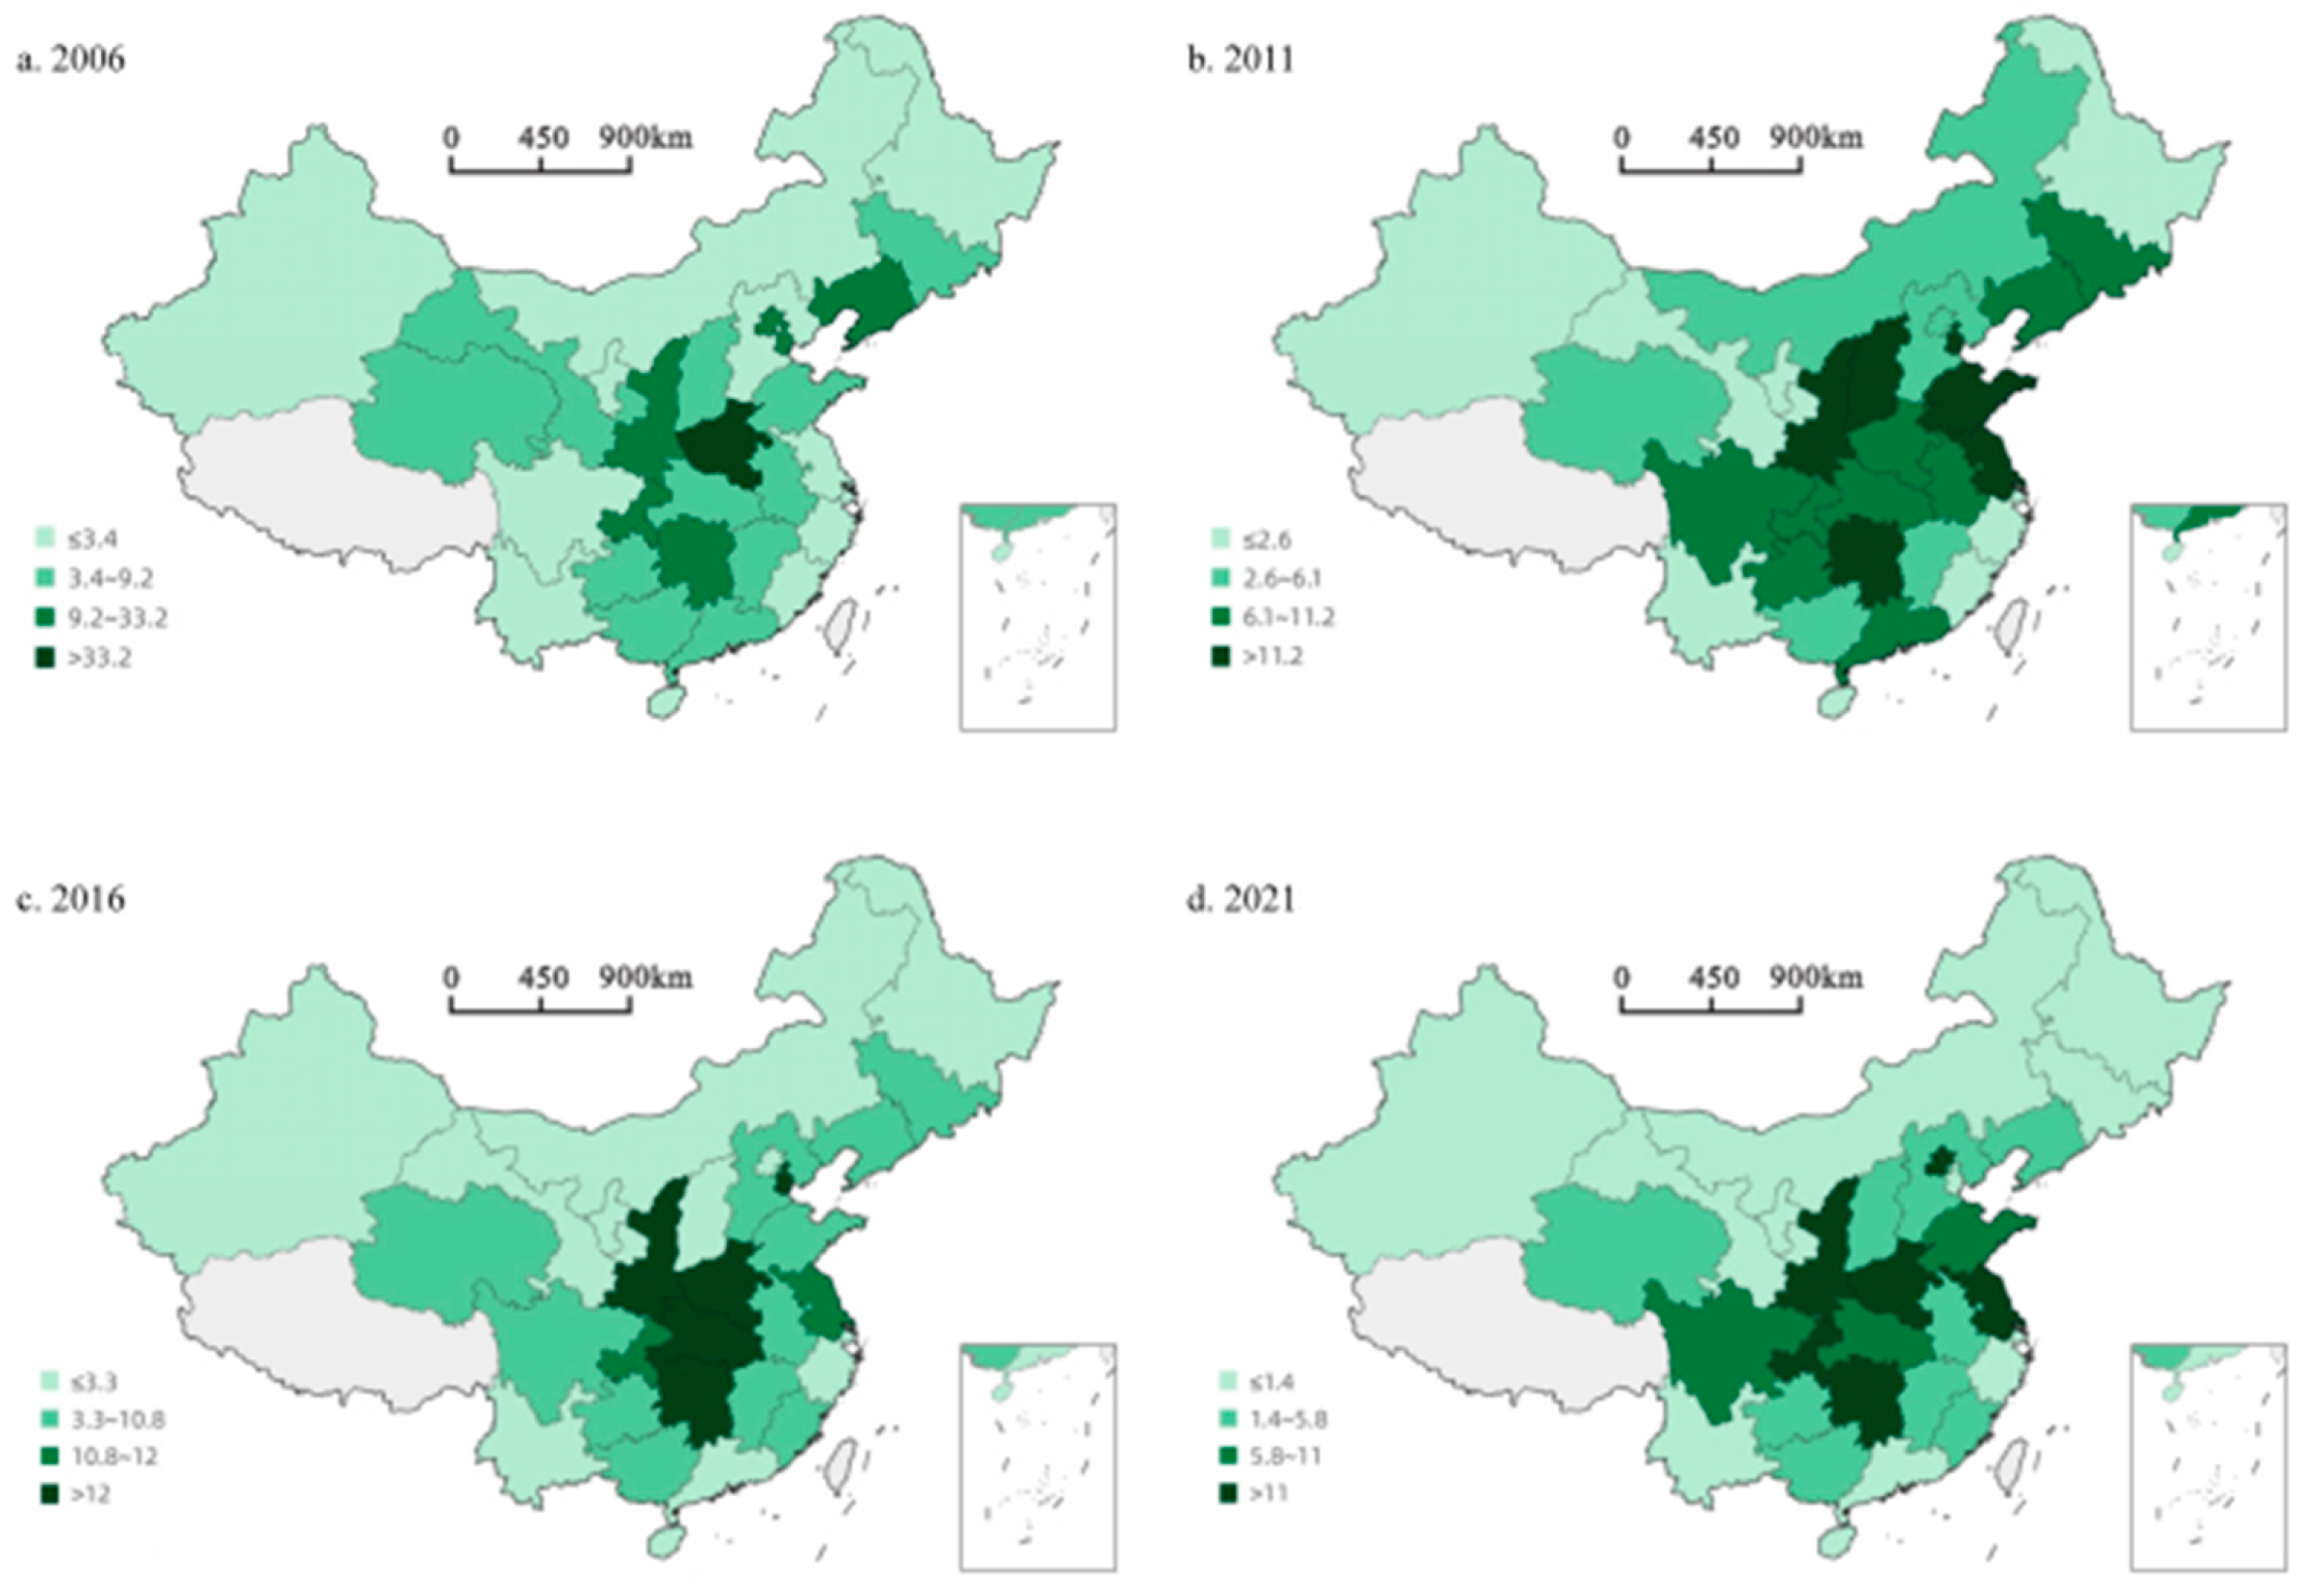
From 2006 to 2021, the polarization trend of the distribution of intermediary centrality has been alleviated, indicating that the control ability of individual provinces to the whole network has been weakened, which makes the realization of coordinated development of provincial carbon emission efficiency no longer depend on only a few provinces.
Henan, Shaanxi, Hunan, Chongqing, Jiangsu and other provinces play the role of "intermediary" in the spatial correlation network of carbon emission efficiency. These provinces are located in areas with high economic development level in China, and have strong influence and control over the flow of resource elements such as talents, capital and technology needed for the development of carbon emission efficiency, so they occupy a pivotal position in the correlation network of carbon emission efficiency. At the same time, there are a large number of provinces bordering these provinces, which makes it easier to play the role of "bridge" in the related network.
Xinjiang, Yunnan, Hainan, Inner Mongolia, Heilongjiang and other provinces with low intermediary centrality are more susceptible to the influence of provinces with high intermediary centrality in the spatial network, thus changing their existing spatial relationship. In addition, the economic scale of these provinces is relatively small and their geographical location is remote, which shows that the geographical location and economic development level of these provinces have a strong influence on the spatial correlation of carbon emission efficiency.
- 3.
- Approach centrality
Proximity degree is used to measure the degree of difficulty in establishing relations between a province and other provinces. The higher the value, the easier it is to establish relations between provinces.
Figure 6.
Evolution of spatial correlation network of carbon emission efficiency near centrality. Note: Based on the standard map production of Gaode Map ReviewNo. GS (2019) No.756, the base map has not been modified.
Figure 6.
Evolution of spatial correlation network of carbon emission efficiency near centrality. Note: Based on the standard map production of Gaode Map ReviewNo. GS (2019) No.756, the base map has not been modified.
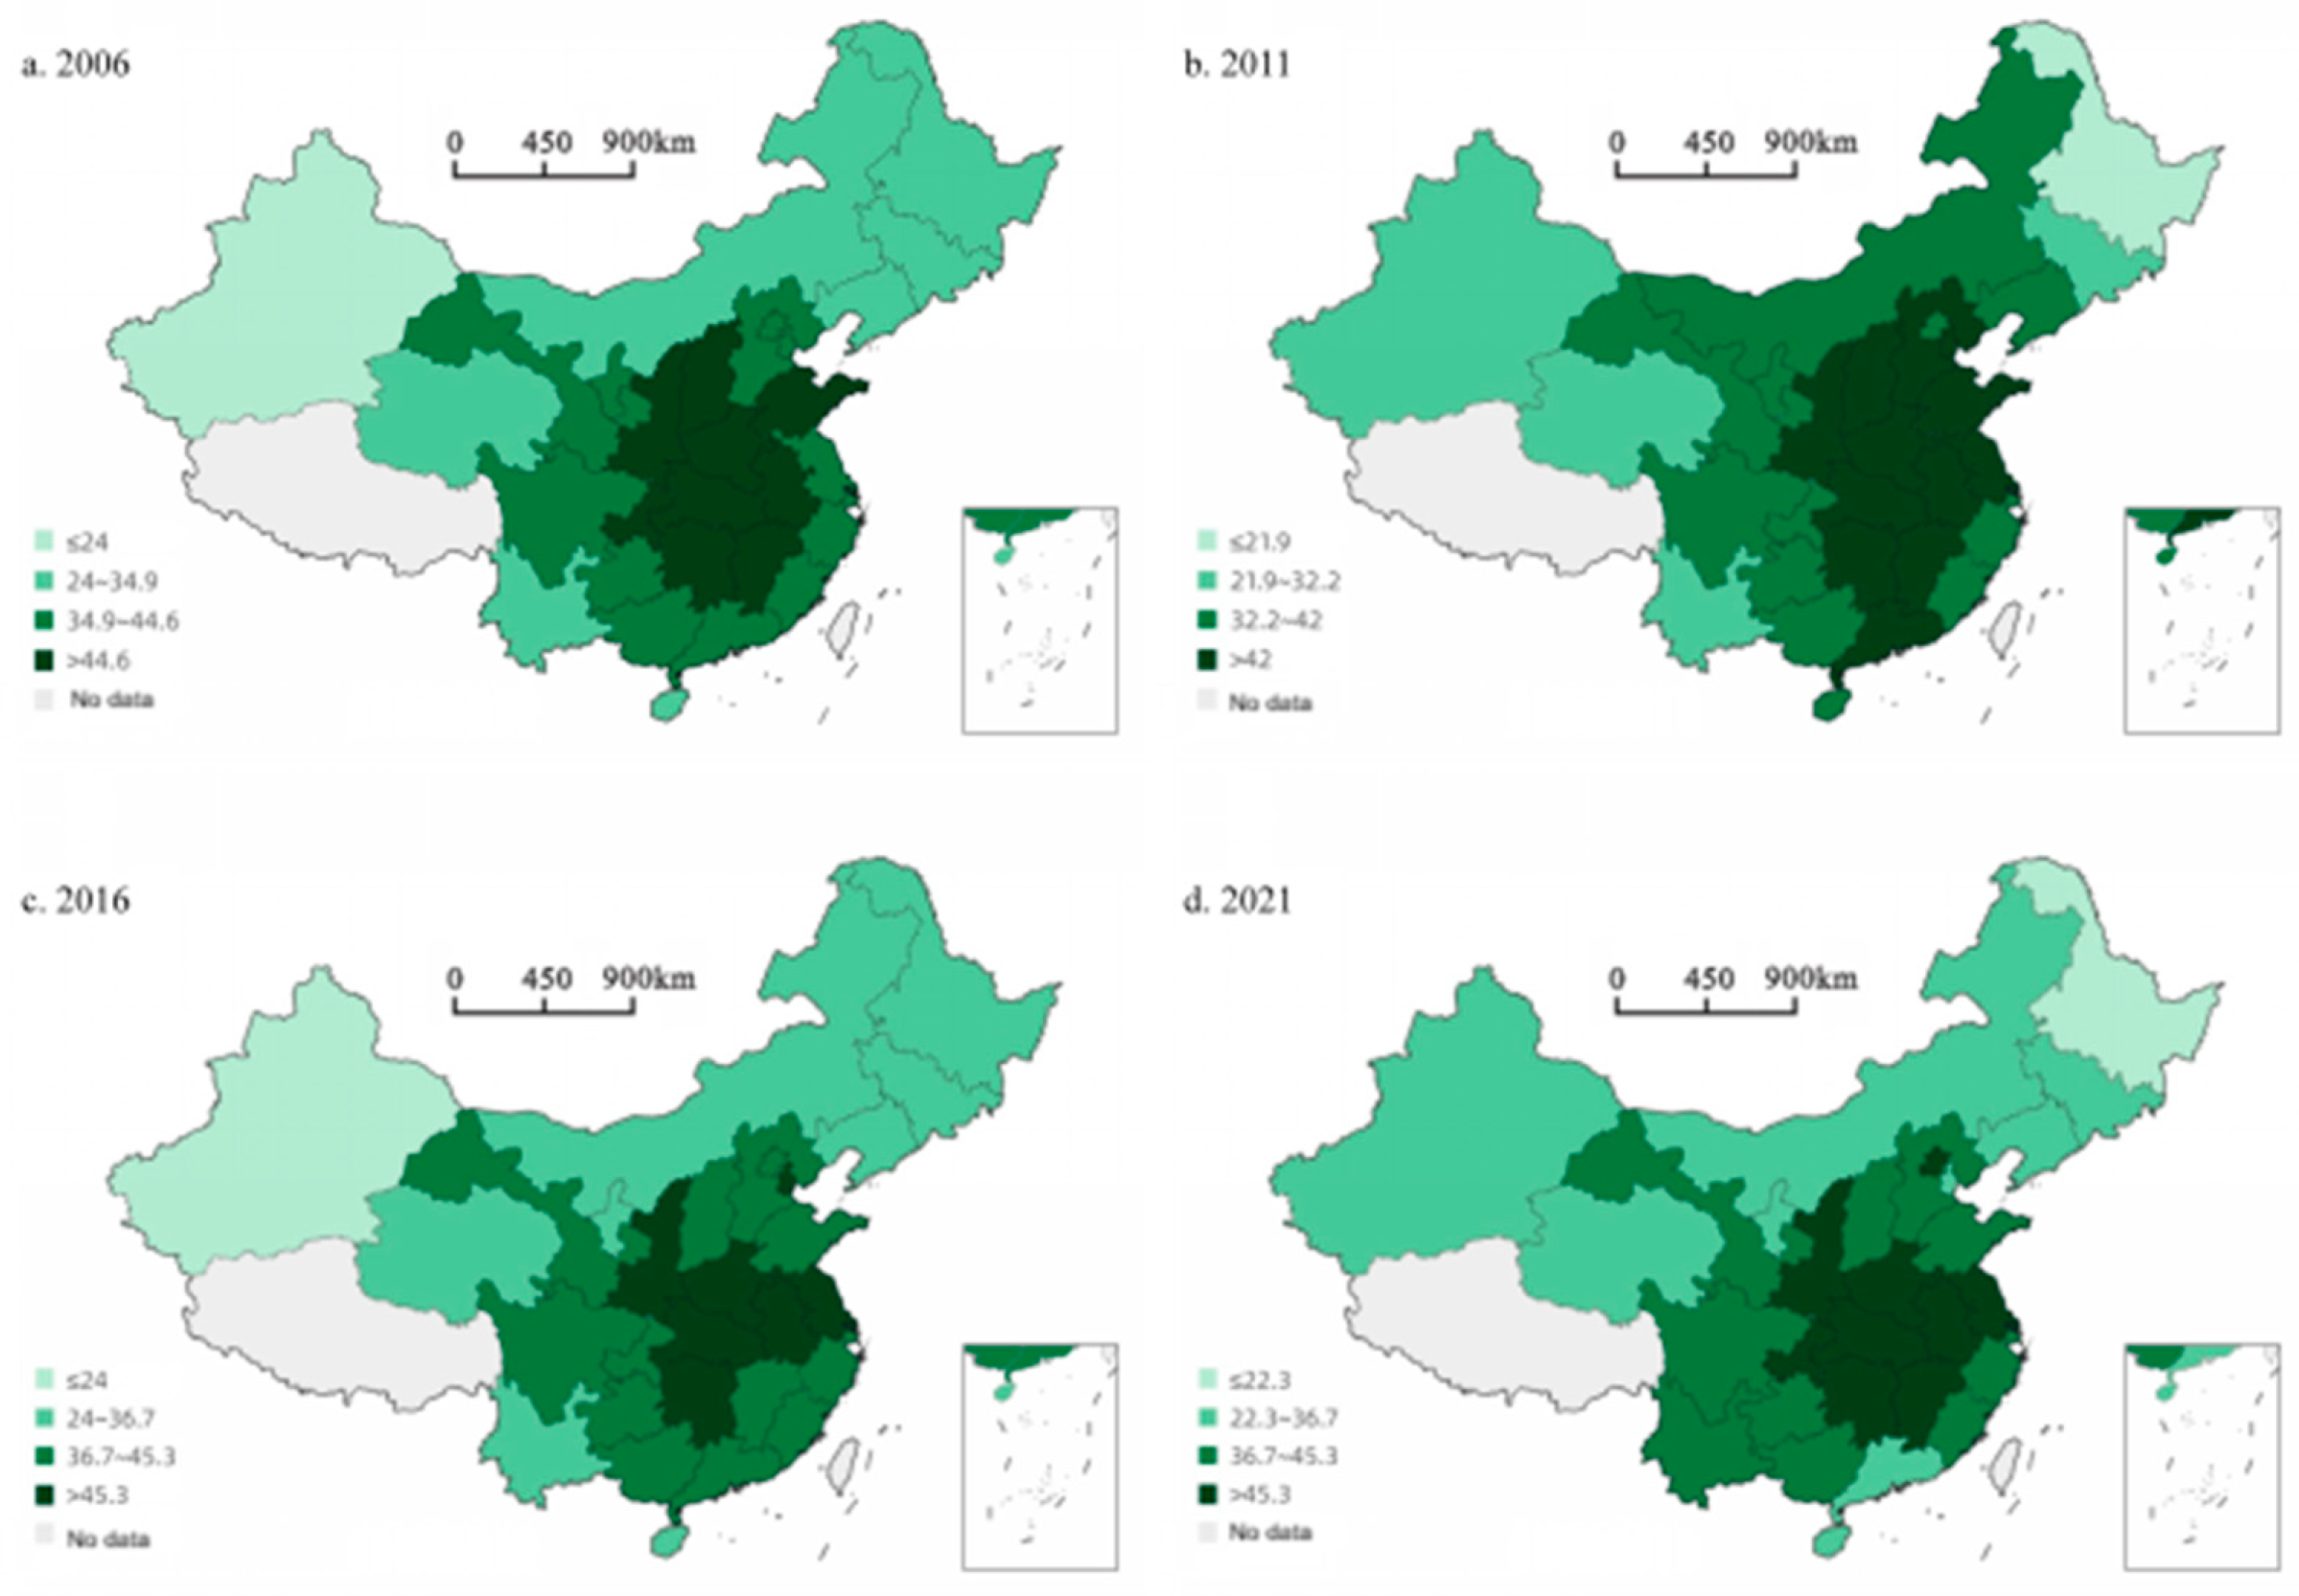
Beijing, Tianjin, Jiangsu, Anhui, Jiangxi, Henan, Hubei, Hunan, Chongqing, Shaanxi and other provinces are close to the center. Under the background of rapid economic development, these provinces are more likely to make use of their advantages in energy, labor and capital to reduce the output of carbon emissions to marginal provinces with relatively scarce resources, which is manifested in the spatial correlation of carbon emission efficiency in the spatial correlation network.
4.4. Block model analysis
Based on the Concor algorithm of Ucinet software, the block model of the spatial correlation network of carbon emission efficiency is analyzed, and the results are shown in Table 5 and Table 6.
The number of provinces in Plate 1 is seven, namely Beijing, Tianjin, Hebei, Shanxi, Inner Mongolia, Henan and Shandong, mainly in Beijing, Tianjin and Hebei. There are many connections among the members of Plate 1 and with the members of the external plate, which belongs to the two-way overflow plate. Plate 2 includes Jilin, Heilongjiang, Liaoning, Xinjiang and Qinghai provinces, which are mainly distributed in the northeast and northwest regions. The actual proportion of internal relations is greater than the expected proportion, and it belongs to the net benefit plate. Plate 3 includes Jiangxi, Fujian, Jiangsu, Zhejiang, Anhui, Shanghai, Hubei, Hunan and Guangdong provinces, which are mainly distributed in the middle and lower reaches of the Yangtze River. The spillover relationship is obviously more than the reception relationship, so it is classified as a net spillover plate. The number of provinces in Plate 4 is 9, including Chongqing, Guangxi, Guizhou, Yunnan, Shaanxi, Gansu, Hainan, Ningxia and Sichuan. The actual proportion of internal relations is small, indicating that there are fewer connections among members of Plate 4, but there are more connections with other members of Plate 4, which has typical broker characteristics and plays the role of "intermediary" in the spatial correlation network of carbon emission efficiency.
5. Analysis of Driving Factors of Carbon Emissions in China Province
In order to deeply explore the main factors affecting carbon emissions, this paper uses LMDI to analyze the influence of various driving factors on carbon emissions based on the evaluation index system constructed above.
5.1. Decomposition of LMDI drivers
At present, Kaya identity is the mainstream analysis method to analyze the influencing factors of carbon emissions, which was put forward by Japanese scholar Kaya(1989). This equation has strong explanatory power to the driving factors of carbon emissions change, and can link energy, society and economy, and is an effective form to quantitatively express carbon dioxide emissions. Follow LMDI's analytical framework and related literature.[24,30]For the research object of this paper, the Kaya identity is reasonably extended, as shown in Formula (9).
Among them, it is the total carbon emission in the first year; Total energy consumption in the first year; Represents the regional GDP of the year; Refers to the labor force in the first year.Let represent the energy carbon emission coefficient, that is, the energy efficiency effect; Is the energy consumption per unit output value, that is, the energy intensity effect; It is the per capita GDP of labor force, that is, the economic output effect; Represents the population size effect. Thus, Formula (9) can be simplified as:
According to the LMDI additive decomposition model, it can be decomposed into the sum of the contribution values of each driving factor, as shown in Formula (11).
Among them, it represents the contribution value of each driving factor to the change of carbon emissions, and the calculation formula is as follows.
5.2. Plate Driving Factors Analysis
As mentioned above, this paper will calculate the contribution of each driving factor to the carbon emissions of 30 provinces in China from four perspectives: energy efficiency effect, energy intensity effect, economic output effect and population size effect. The calculation results are shown in Table 7.
The economic output effect is positive, which is the biggest resistance to energy saving and emission reduction. Specifically, from 2006 to 2021, the per capita GDP of China's labor force increased from 181,700 yuan/person to 643,500 yuan/person. At the same time, carbon dioxide emissions increased by 69,061,900 tons. With the improvement of economic output level and people's quality of life, the demand for energy and the contribution to carbon emissions are also on the rise. However, the practice of reducing carbon emissions at the expense of economic development is contrary to the goal of improving people's livelihood and well-being. Therefore, we should promote the green and low-carbon transformation of the economy and encourage residents to consume moderately and green.
The population scale effect is second only to the economic output effect in hindering energy conservation and emission reduction. Affected by economic growth and family planning policy, the number of employed people is increasing year by year, which makes it more difficult to reduce emissions. The research shows that population growth has a negative impact on reducing carbon emissions, but if the emission reduction target is achieved by reducing the population size, it may lead to a series of social problems, such as labor shortage, which is not conducive to social and economic stability.
The energy efficiency effect leads to the cumulative emission increase of 1427.70 million tons of carbon dioxide, and the contribution is mostly positive, which has relatively little resistance to energy saving and emission reduction. During the research period, the carbon emission per unit energy consumption rose from 214 million tons/10,000 tons of standard coal to 270 million tons/10,000 tons of standard coal, showing an overall upward trend. In 2021, the total carbon emission of crude oil, raw coal and other consumption is about 117.511 million tons of standard coal. In recent years, although the consumption proportion of low-carbon energy such as electricity and natural gas has increased, the overall proportion is still low, and the impact on the energy structure is limited. Driven by the goal of "double carbon", it is particularly urgent to accelerate the adjustment of energy structure to alleviate its role in promoting carbon emissions.
Energy intensity effect is the biggest driving force to realize energy saving and emission reduction. From 2006 to 2021, although China's total energy consumption increased from 2,918,697,300 tons of standard coal to 4,867,363,700 tons of standard coal, the energy consumption per unit GDP showed a significant downward trend, from 126 tons of standard coal/10,000 yuan to 0.43 tons of standard coal/10,000 yuan, a decrease of 65.87%. This shows that reducing energy consumption per unit GDP is the key to promote the development of low-carbon life in China.
- Analysis of driving factors of two-way overflow plate
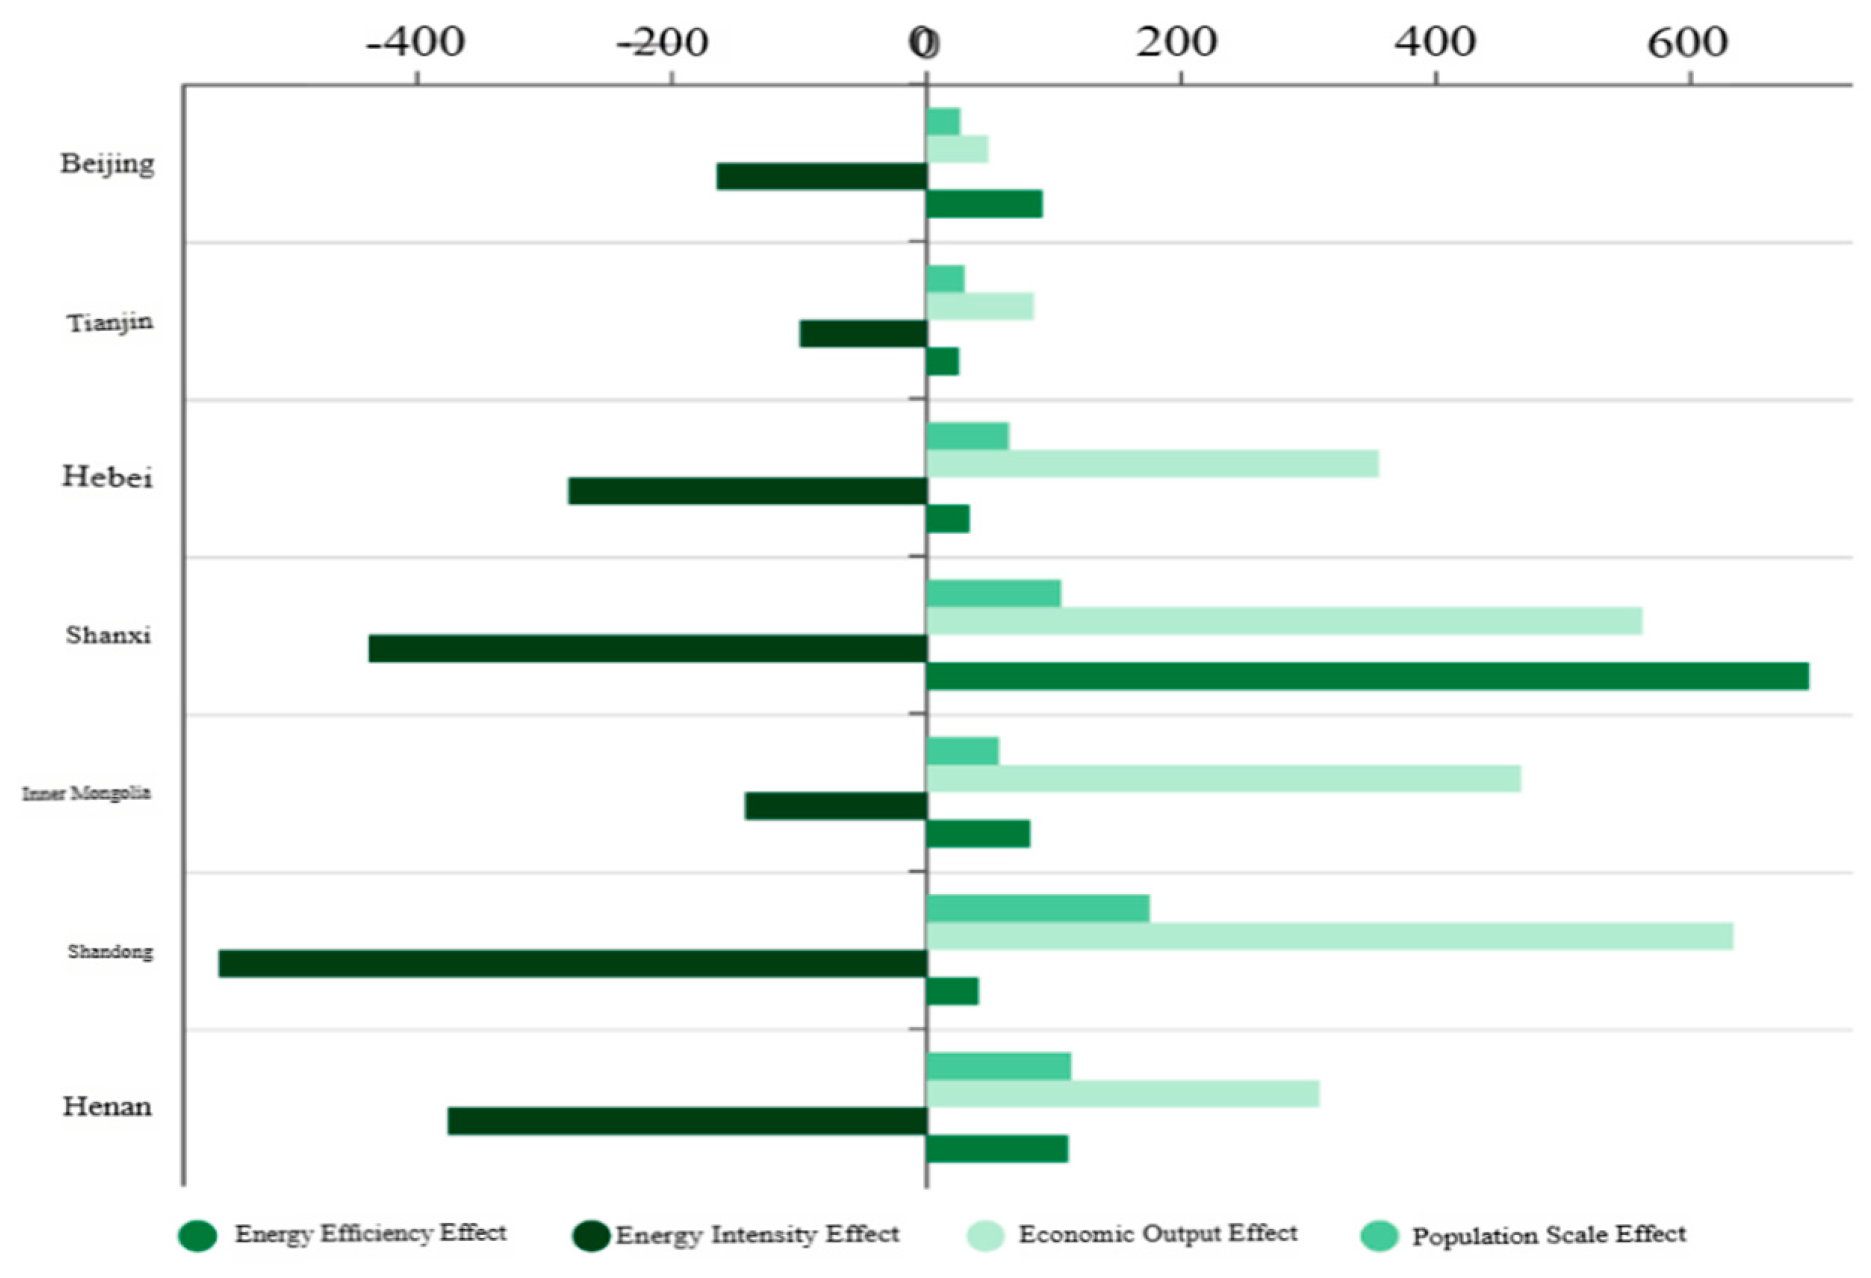
From 2006 to 2021, the overall effect of carbon emissions from the two-way spillover plate is positive, with Shanxi and Inner Mongolia increasing the most, with 922.80 million tons and 462.66 million tons respectively.
Figure 7.
Grouping bar chart of carbon emission contribution of each factor in two-way spillover plate.
Figure 7.
Grouping bar chart of carbon emission contribution of each factor in two-way spillover plate.
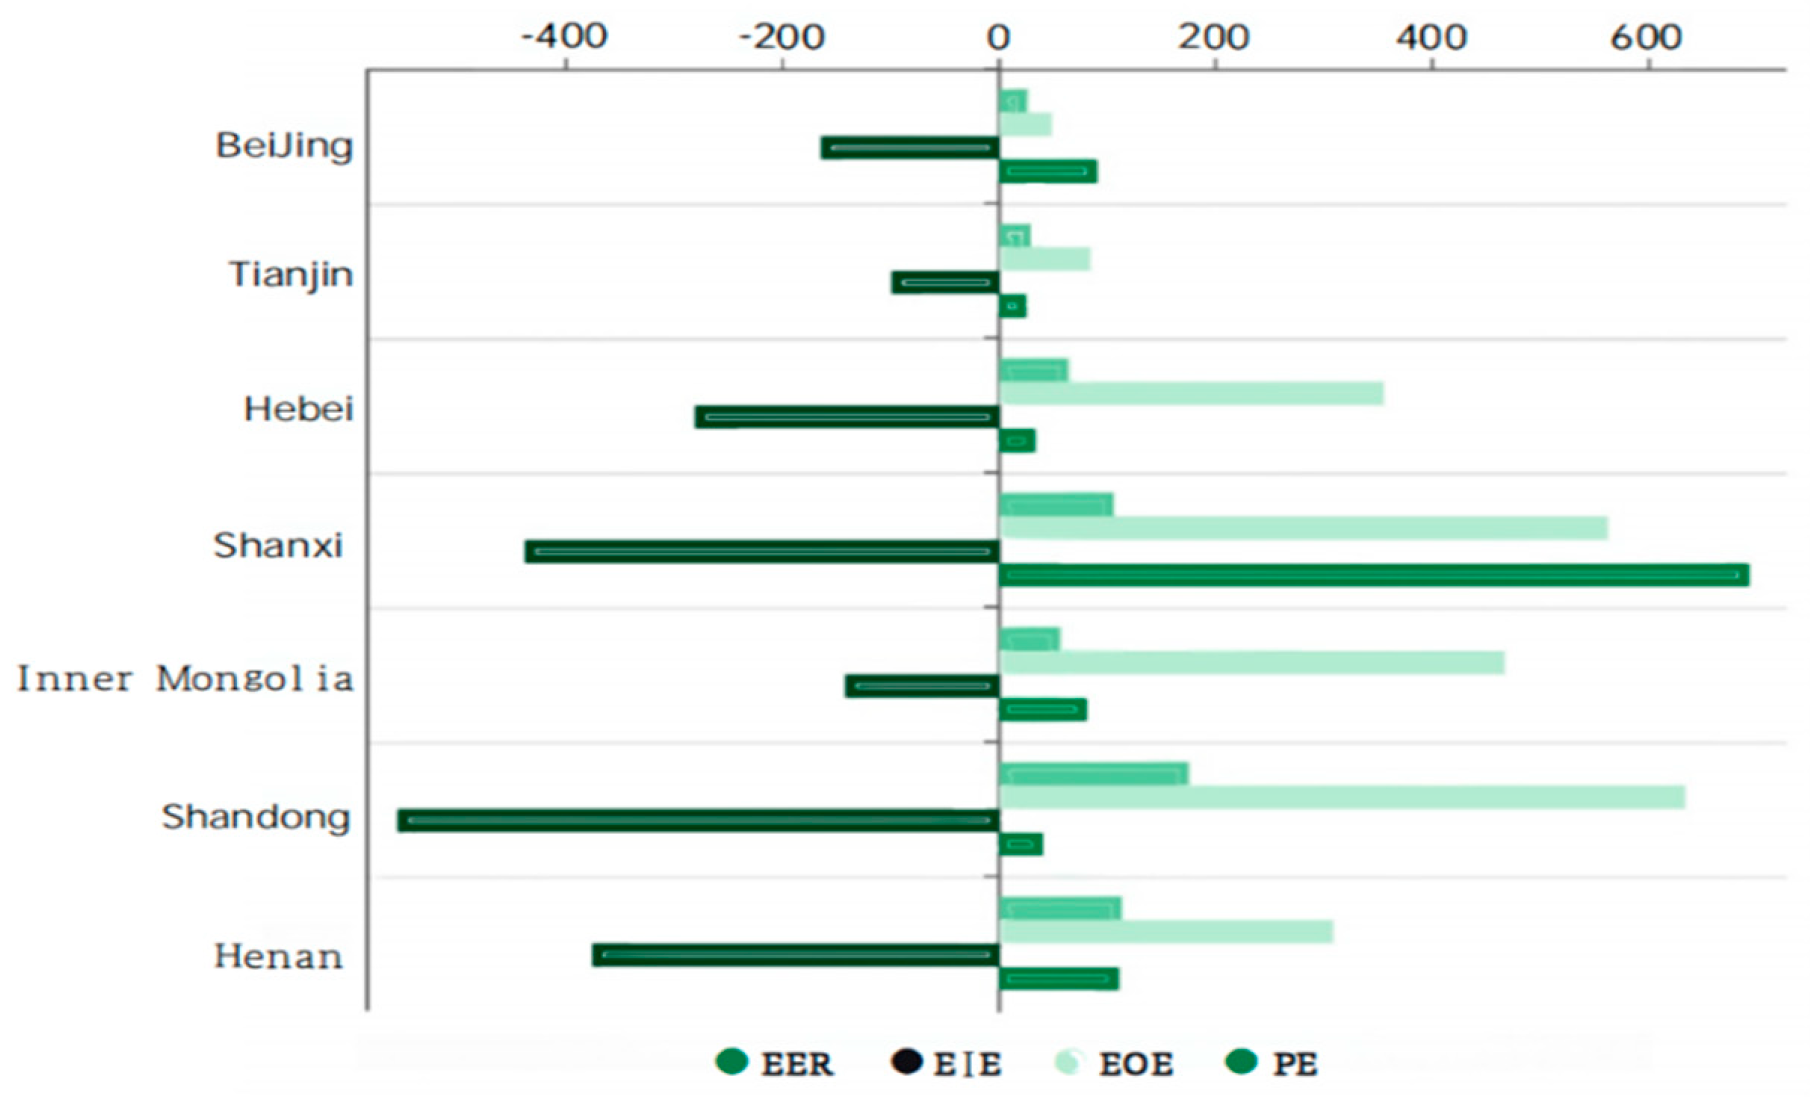
By analyzing the effects of four driving factors, it is found that the energy intensity effect of seven provinces and cities has played a major role in promoting energy conservation and emission reduction; Secondly, energy efficiency effect, economic output effect and population size effect are all positive effects, which play a restraining role in energy conservation and emission reduction.
- 2.
- Analysis of driving factors of net benefit plate
During the period of 2006-2021, the overall effect of carbon emissions from net benefit sectors was positive, with the largest increase in Xinjiang, accounting for 220.78 million tons.
Figure 8.
Group bar chart of carbon emission contribution of each factor in net benefit plate.
By analyzing the effects of four driving factors, it is found that the energy intensity effect of four provinces and cities except Xinjiang has played a major role in promoting energy conservation and emission reduction; Secondly, the economic output effect is positive, which inhibits energy conservation and emission reduction; The population scale effect is positive except Heilongjiang, which inhibits energy saving and emission reduction, but has little influence; The energy efficiency effect is positive except for Heilongjiang and Xinjiang, and it also inhibits energy conservation and emission reduction.
- 3.
- Analysis of driving factors of net overflow plate
From 2006 to 2021, the overall effect of carbon emissions from the net spillover plate is positive, with Guangdong and Jiangsu increasing the most, with 182.95 million tons and 176.13 million tons respectively.
Figure 9.
Group bar chart of carbon emission contribution of each factor in net spillover plate.
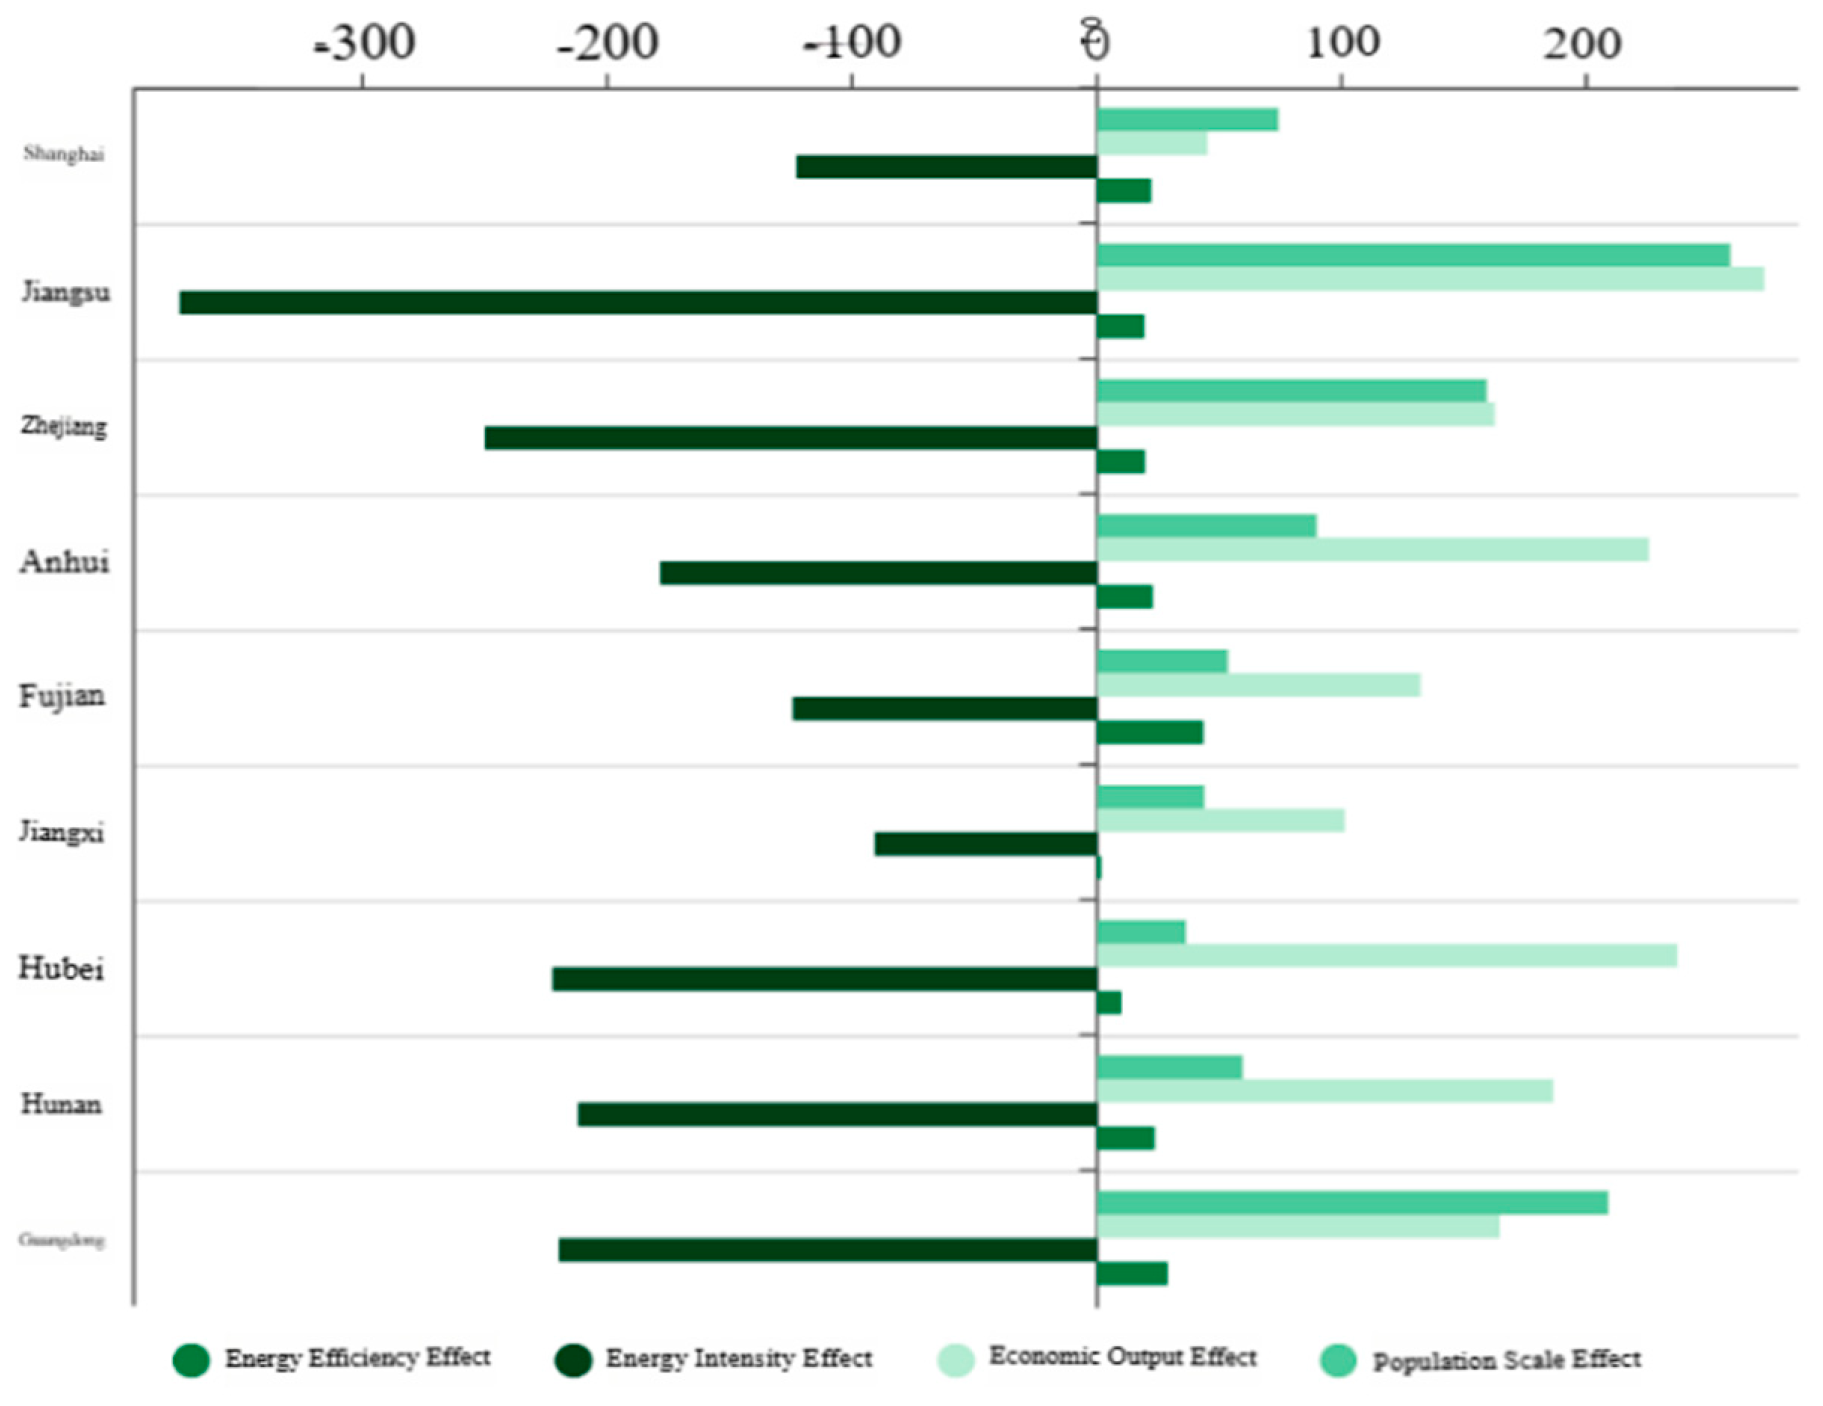
By analyzing the effects of four driving factors, it is found that the energy intensity effect of seven provinces and cities has played a major role in promoting energy conservation and emission reduction; Secondly, energy efficiency effect, economic output effect and population size effect are all positive effects, which play a restraining role in energy conservation and emission reduction.
- 4.
- Analysis of driving factors of broker plate
During 2006-2021, the overall effect of carbon emissions from the brokerage sector was positive, with the largest increase in Shaanxi, accounting for 276.05 million tons.
Figure 10.
Bar chart of carbon emission contribution of each factor in broker plate.
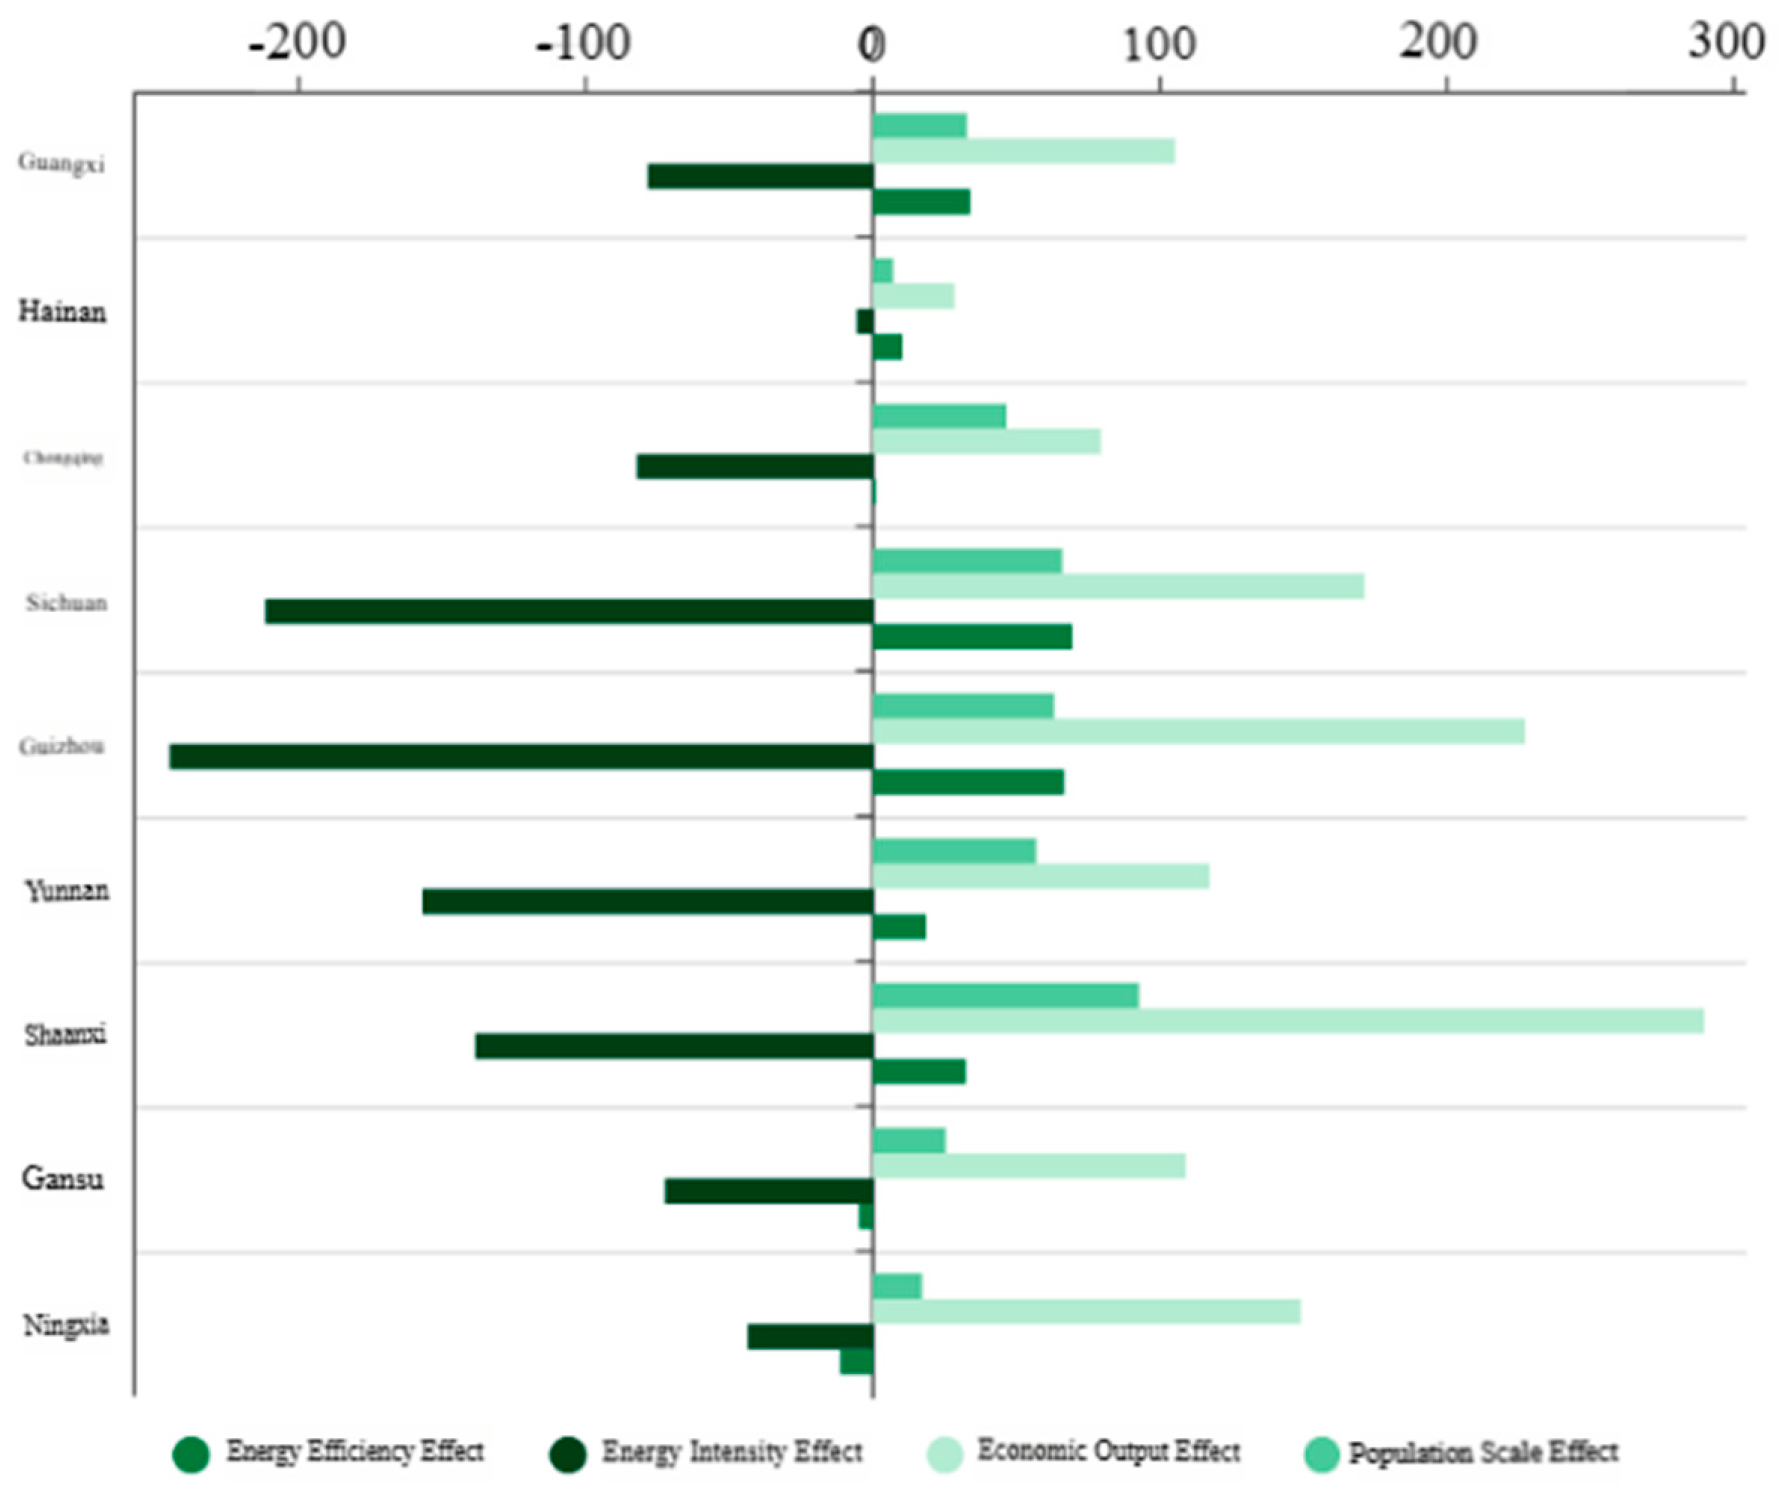
By analyzing the effects of four driving factors, it is found that the energy intensity effect of seven provinces and cities has played a major role in promoting energy conservation and emission reduction; Secondly, the economic output effect and the population scale effect are both positive effects, which play an inhibitory role in energy conservation and emission reduction. The energy efficiency effect is positive except Gansu and Ningxia, and it also inhibits energy conservation and emission reduction, but the impact is small.
6. Conclusions and Policy Recommendations
In this paper, the super-efficient EBM model is used to measure the carbon emission efficiency of 30 provinces in China from 2006 to 2021, and its temporal and spatial evolution characteristics, spatial correlation network structure characteristics and the decomposition of driving factors of carbon emission are analyzed, and the following conclusions are drawn:
First, the carbon emission efficiency of 30 provinces in China is increasing year by year from 2006 to 2021, which has great potential for emission reduction. The carbon emission efficiency in the eastern region is relatively high, while the carbon emission efficiency in the central and western regions is relatively low and varies greatly. The average annual change rate of carbon emission efficiency in all provinces is positive, indicating that the development of all provinces is in the transition stage from high carbon to low carbon.
Secondly, the spatial correlation pattern of carbon emission efficiency in China province has certain characteristics of transfer inertia and path dependence. The relative length of the time path of carbon emission efficiency LISA is higher in the east and lower in the west as a whole, and the spatial structure of carbon emission efficiency in the eastern and central regions is more dynamic. The curvature of LISA time path in the central region is high, and its carbon emission efficiency has strong fluctuation in spatial dependence. 63.33% of the provinces have low curvature, and their spatial dependence changes are relatively stable. The carbon emission efficiency of half of the provinces and cities is coordinated with that of neighboring provinces and cities, which shows that the carbon emission efficiency of China province has a high spatial integration. However, on the whole, the negative integration of provinces and cities is greater than the positive integration. From the perspective of LISA time-space transition, the carbon emission efficiency of China province is less affected by the spillover effect of neighboring provinces and cities, and more depends on the provinces and cities' own factors to change their position in the overall space-time pattern of carbon emission efficiency, and the spillover effect of collaborative governance has not been fully exerted.
Thirdly, from the overall network structure characteristics, the spatial network density of carbon emission efficiency is increasing year by year, and the spatial correlation of carbon emission efficiency among provinces is also increasing year by year. From the structural characteristics of individual spatial network, the spatial network of carbon emission efficiency in China province presents a "center-edge" structure. From the results of spatial cluster analysis, Jiangxi, Fujian, Jiangsu, Zhejiang, Anhui, Shanghai, Hubei, Hunan and Guangdong are the net spillover plates in the spatial correlation network of carbon emission efficiency; Chongqing, Guangxi, Guizhou, Yunnan, Shaanxi, Gansu, Hainan, Ningxia and Sichuan play the role of "brokers" in the spatial correlation network of carbon emission efficiency; Jilin, Heilongjiang, Liaoning, Xinjiang and Qinghai are the net benefit plates in the spatial correlation network of carbon emission efficiency.
Fourthly, the influencing factors of carbon emissions can be divided into energy efficiency effect, energy intensity effect, economic output effect and population size effect. Among them, economic output, population size and energy efficiency hinder energy conservation and emission reduction, and the degree of resistance decreases in turn; Improving energy intensity will promote energy conservation and emission reduction.
Based on the above conclusions, this paper puts forward the following policy suggestions:
First, based on the concept of regional collaborative governance, establish a cross-regional carbon emission reduction collaborative mechanism. China's provincial carbon emission efficiency shows typical spatial network characteristics, and the network correlation is increasing year by year, but it is less affected by the spillover effect of neighboring provinces and cities, and its linkage is weak. Therefore, it is necessary to establish a spatial concept in carbon emission control, build a cross-regional and multi-provincial collaborative governance mechanism of "national-local" and "guidance-follow", and make overall plans to promote the improvement of provincial carbon emission efficiency. For example, Shanghai, Jiangsu, Beijing, Tianjin and other provinces have high individual centrality indicators and are in a core dominant position in the spatial network. Therefore, when formulating carbon emission reduction policies, we should pay attention to key areas and give full play to their influence as central nodes to promote carbon emission control in other provinces.
Second, formulate differentiated carbon emission reduction policies. Combined with the characteristics of each plate, it is suitable for local conditions. The "two-way spillover" plate and the "net benefit" plate are mainly distributed in areas with high economic development level such as Beijing-Tianjin-Hebei and Yangtze River Delta. In order to promote regional energy conservation and emission reduction, the above-mentioned key areas should give full play to their own technological and management advantages, promote green transformation of economic and social development, and advocate low-carbon economy. However, the "broker" and "net spillover" sectors, which are relatively lagging behind in development, should introduce high-end scientific research talents, learn from low-carbon technologies in developed regions, and continuously improve energy efficiency, so as to promote the process of carbon emission reduction.
Third, advocate a green production and lifestyle. Relieving the pressure of carbon emission at the expense of economic development and population growth is contrary to the concept that development is the top priority in China. China should thoroughly implement the new development concept, promote the economic system construction of green and low-carbon circular development, and strictly limit the development of projects with high energy consumption and high emissions. At the same time, we should promote the concept of green living, raise public awareness of environmental protection, and advocate residents to practice moderate and rational consumption, so as to contribute to the realization of the goal of "double carbon".
Fourth, actively increase the supply of clean energy. At present, China relies too much on fossil energy, so it is necessary to gradually improve environmental standards, promote the clean and efficient utilization of coal, and make coal a "black gold" green. At the same time, we should vigorously develop and utilize non-fossil energy, speed up the construction of renewable energy supply system based on wind energy, solar energy and hydropower, actively promote the construction of new power system, and promote the transformation of energy structure from oil-based to diversified. By adjusting the energy structure, we will guide it to develop in a clean and efficient direction and promote the green transformation of the economic development model.
Author Contributions
Sanglin Zhao: Conceptualization, Data curation, Formal analysis, Software, Writing–original draft, Visualization, Writing–review and editing, Jiaang Tong: Writing–review and editing.
Funding
This study did not receive any funding.
Data Availability Statement
Data available on request from the Corresponding author.
Conflicts of Interest
All authors disclosed no relevant relationships.
References
- Shao Shuai, Fan Meiting, Yang Lili. Economic restructuring, green technology progress and China's low-carbon transformation and development-an empirical study based on the overall technological frontier and spatial spillover effect [J]. Management World, 2022,38(02): 46-69.
- Zhang Mingdou, Xi Shengjie. Evaluation of carbon emission efficiency of resource-based cities and its policy implications [J]. Journal of Natural Resources, 2023,38(01):220-237.
- Wang Shaojian, Gao Shuang, Huang Yongyuan, et al. Spatial-temporal evolution pattern and prediction of urban carbon emission performance in China based on super-efficient SBM model [J]. Journal of Geography, 2020,75(06):1316-1330.
- Li Jianbao, Huang Xianjin, Zhai Xiaowei, et al. Spatial and temporal characteristics and influencing factors of carbon emission efficiency in the Yangtze River Delta [J]. Resources and Environment in the Yangtze River Basin, 2020,29(07):1486-1496.
- Li Jinkai, Ma Jingjing, Wei Wei. Study on Regional Differences of Energy Carbon Emission Efficiency in Eight Comprehensive Economic Zones in China [J]. Research on Quantitative Economy, Technology and Economy, 2020,37(06):109-129.
- Shen Li, Fan Wenxiao. Time-space coupling and coordination between carbon emission efficiency and high-quality development of financial industry in China [J]. china population resources and environment, 2023,33(08):13-26.
- Dong Huizhong, Guo Xuelian. Spatial-temporal evolution characteristics of carbon emission efficiency of transportation industry in China [J]. East China Economic Management, 2023,37(07):70-80.
- Li Minghong, Huang Yi, Zhu Weijun, et al. Study on the total factor productivity of carbon emissions in China transportation industry-based on the Global Malmquist-Luenberger index [J]. Science and Technology Management Research, 2021,41(09):203-211.
- Xiao Guoan, Chen Cheng, Gao Yajie. Dynamic evolution characteristics and influencing factors of carbon emission efficiency of five urban agglomerations in China [J]. statistics and decision, 2023,39(21):159-163.
- Ding Yinghui, Yang Yaru. Structural characteristics and influencing factors of spatial correlation network of carbon reduction potential in China province [J]. Science and Technology Management Research, 2024,44(05):199-208.
- Zhang Yongnian. Dynamic Evolution, Regional Difference and Spatial Convergence of Urban Carbon Emission Efficiency in China [J]. Urban Issues, 2023,(07):33-42+83.
- Sun Xing, Liu Xi. Temporal and spatial evolution and influencing factors of urban carbon emission efficiency in China —— Based on the stochastic frontier model of heterogeneous space [J]. Geographical Research, 2023,42(12):3182-3201.
- Shao Haiqin, Wang Zhaofeng. Spatial correlation network structure of transportation carbon emission efficiency in China and its influencing factors [J]. china population resources and environment, 2021,31(04):32-41.
- Gabbrielle Wu, Guan Weihua, Zhang Hui, et al. Temporal and spatial coupling characteristics and influencing factors of carbon emission efficiency and high-quality development in Yangtze River Delta urban agglomeration [J]. Resources and Environment in Yangtze River Basin, 2023,32(11):2273-2284.
- Zheng Ruijing, Cheng Yu. Study on the Impact of Innovation Factor Agglomeration on Carbon Emission Efficiency in the Yellow River Basin [J]. Geographical Research, 2024,43(03):577-595.
- Wang Xinjing, Cheng Yu. Study on the mechanism of urbanization's influence on carbon emission efficiency —— An empirical analysis based on the panel data of 118 countries around the world [J]. World Geographic Research, 2020,29(03):503-511.
- Fang Dachun, Wang Linlin. Study on the network characteristics and influencing factors of spatial correlation of carbon emissions in China [J]. Resources and Environment in the Yangtze River Basin, 2023,32(03):571-581.
- Xu Yingqi, Cheng Yu, Wang Jingjing, et al. Temporal and spatial evolution and influencing factors of carbon emission efficiency of low-carbon pilot cities in China [J]. Journal of Natural Resources, 2022,37(05):1261-1276.
- Zhang Jun, Wu Guiying, Zhang Jipeng. Estimation of provincial physical capital stock in China: 1952-2000 [J]. Economic Research, 2004,(10):35-44.
- Yin Junfeng, Song Changqing, Shi Peiji, et al. Temporal and spatial transition characteristics and influencing factors of "Sansheng" functional coordination degree in county villages of Gansu Province from the perspective of coupling [J]. Geographical Research, 2024,43(04):874-892.
- Zhang Weifu, Li Fengchun, Hu Yabei. Study on the Inter-provincial Transfer of CO2 Emissions in China and the Measurement of Emission Reduction Responsibility [J]. China Industrial Economy, 2014,(03):57-69.
- Wang Kai, Yu Fangfang, Hu Yi, et al. Spatial correlation network structure of carbon emission reduction potential of tourism in China and its influencing factors [J]. Geographic Science, 2022,42(06):1034-1043.
- Sun Yanan, Liu Huajun, Liu Chuanming, et al. Study on spatial correlation and effect of inter-provincial carbon emissions in China —— An empirical study based on SNA [J]. Shanghai Economic Research, 2016,(02):82-92.
- Chyi Yu, Xu Chaoyi. Study on the Influencing Factors of Logistics Carbon Emissions in Henan Province Based on LMDI [J]. Journal of Luoyang Institute of Technology (Social Science Edition), 2022,37(01):47-53.
- Yan Guiqin, Xu Mengyue. Analysis of carbon emission decoupling of logistics industry based on LMDI and its influencing factors [J]. Logistics Science and Technology, 2024,47(02):10-15.
- Lv T ,Geng C ,Zhang X , et al.Spatiotemporal evolution and influencing factors of urban industrial carbon emission efficiency in the Mid-Yangtze River urban agglomeration of China[J].Physics and Chemistry of the Earth,2024,135103607.
- Zhu L ,Dabo G ,Wei W ,et al. Reduced carbon emission estimates from fossil fuel combustion and cement production in China.[J].Nature,2015,524(7565): 335-8.
- ANDERSEN P ,PETERSEN N C.A procedure for ranking efficient units in data envelopment analysis[J].Management science,1993,39(10):515-521. [CrossRef]
- Rey J S, Janikas V M. STARS: Space-Time Analysis of Regional Systems[J].Geographical Analysis,2006,38(1):67-86. [CrossRef]
- Humaira Y ,Ying W ,Hashim Z, et al. Decomposing factors affecting CO2/sub emissions in Pakistan: insights from LMDI decomposition approach.[J]. Environmental science and pollution research international,2020,27(3):3113-3123. [CrossRef]
Figure 1.
Dynamic Evolution Process of Carbon Emission Efficiency in China Province from 2006 to 2021. Note: Based on the standard map produced by the Ministry of Natural Resources of China,No. GS(2019)756, the base map has not been modified, and the same as below.
Figure 1.
Dynamic Evolution Process of Carbon Emission Efficiency in China Province from 2006 to 2021. Note: Based on the standard map produced by the Ministry of Natural Resources of China,No. GS(2019)756, the base map has not been modified, and the same as below.
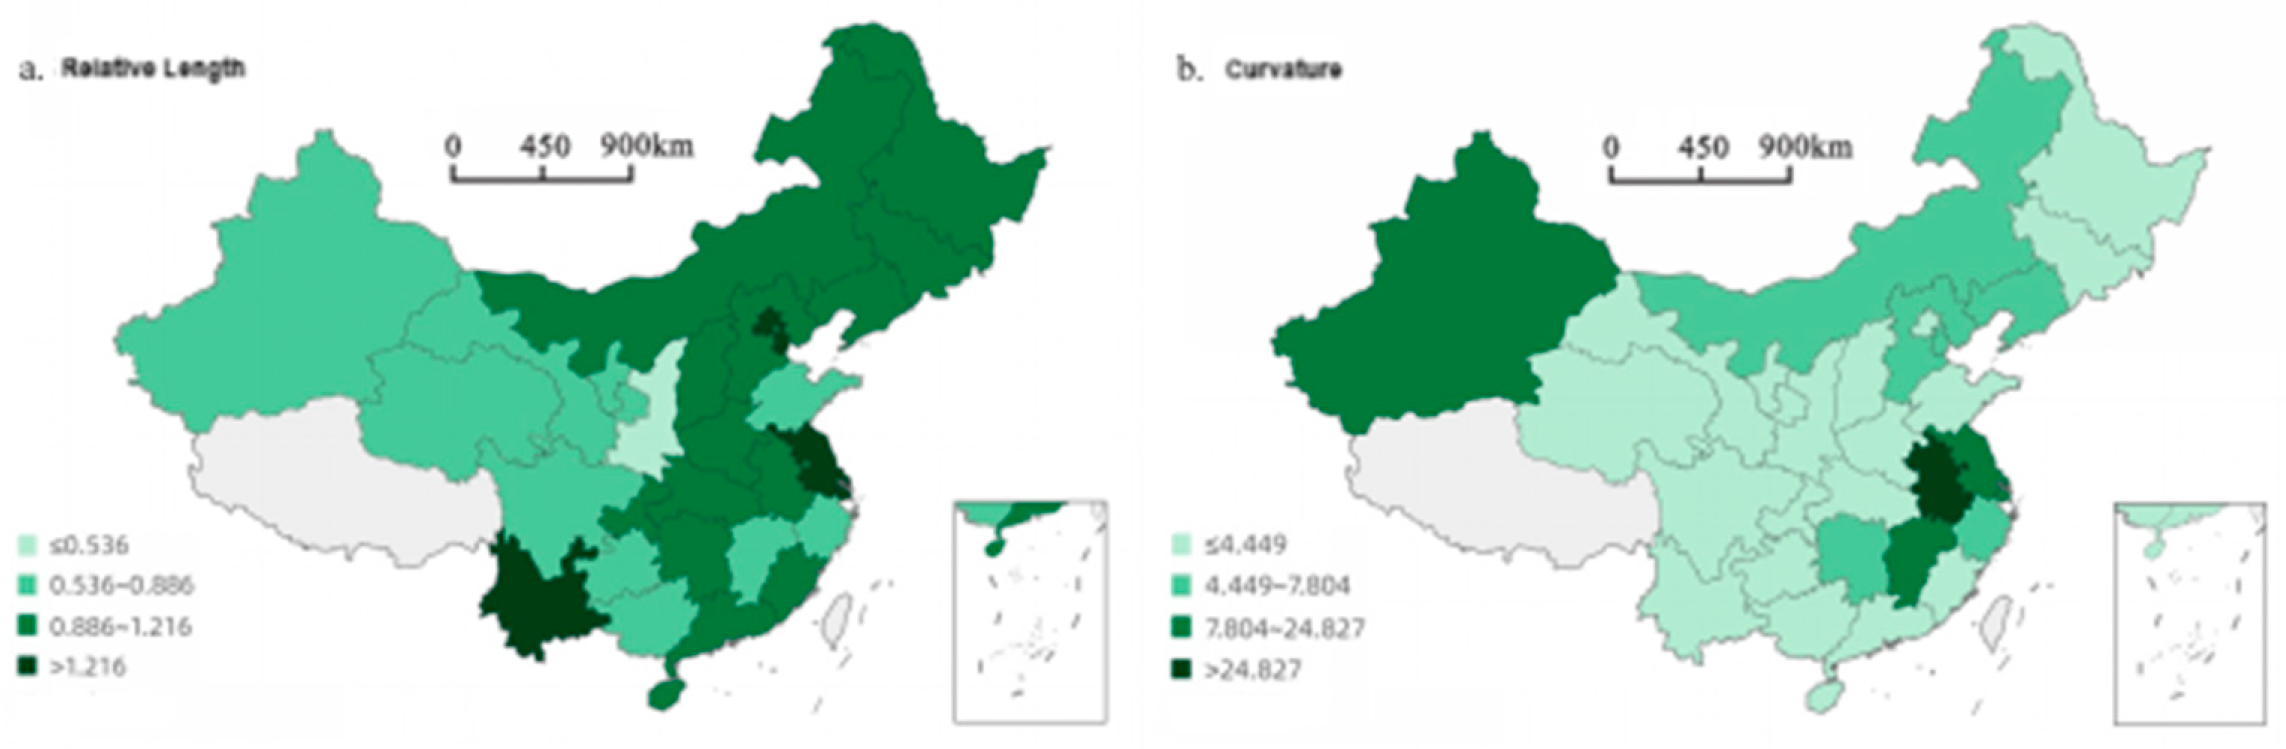
Figure 3.
Spatial correlation network structure of carbon emission efficiency.
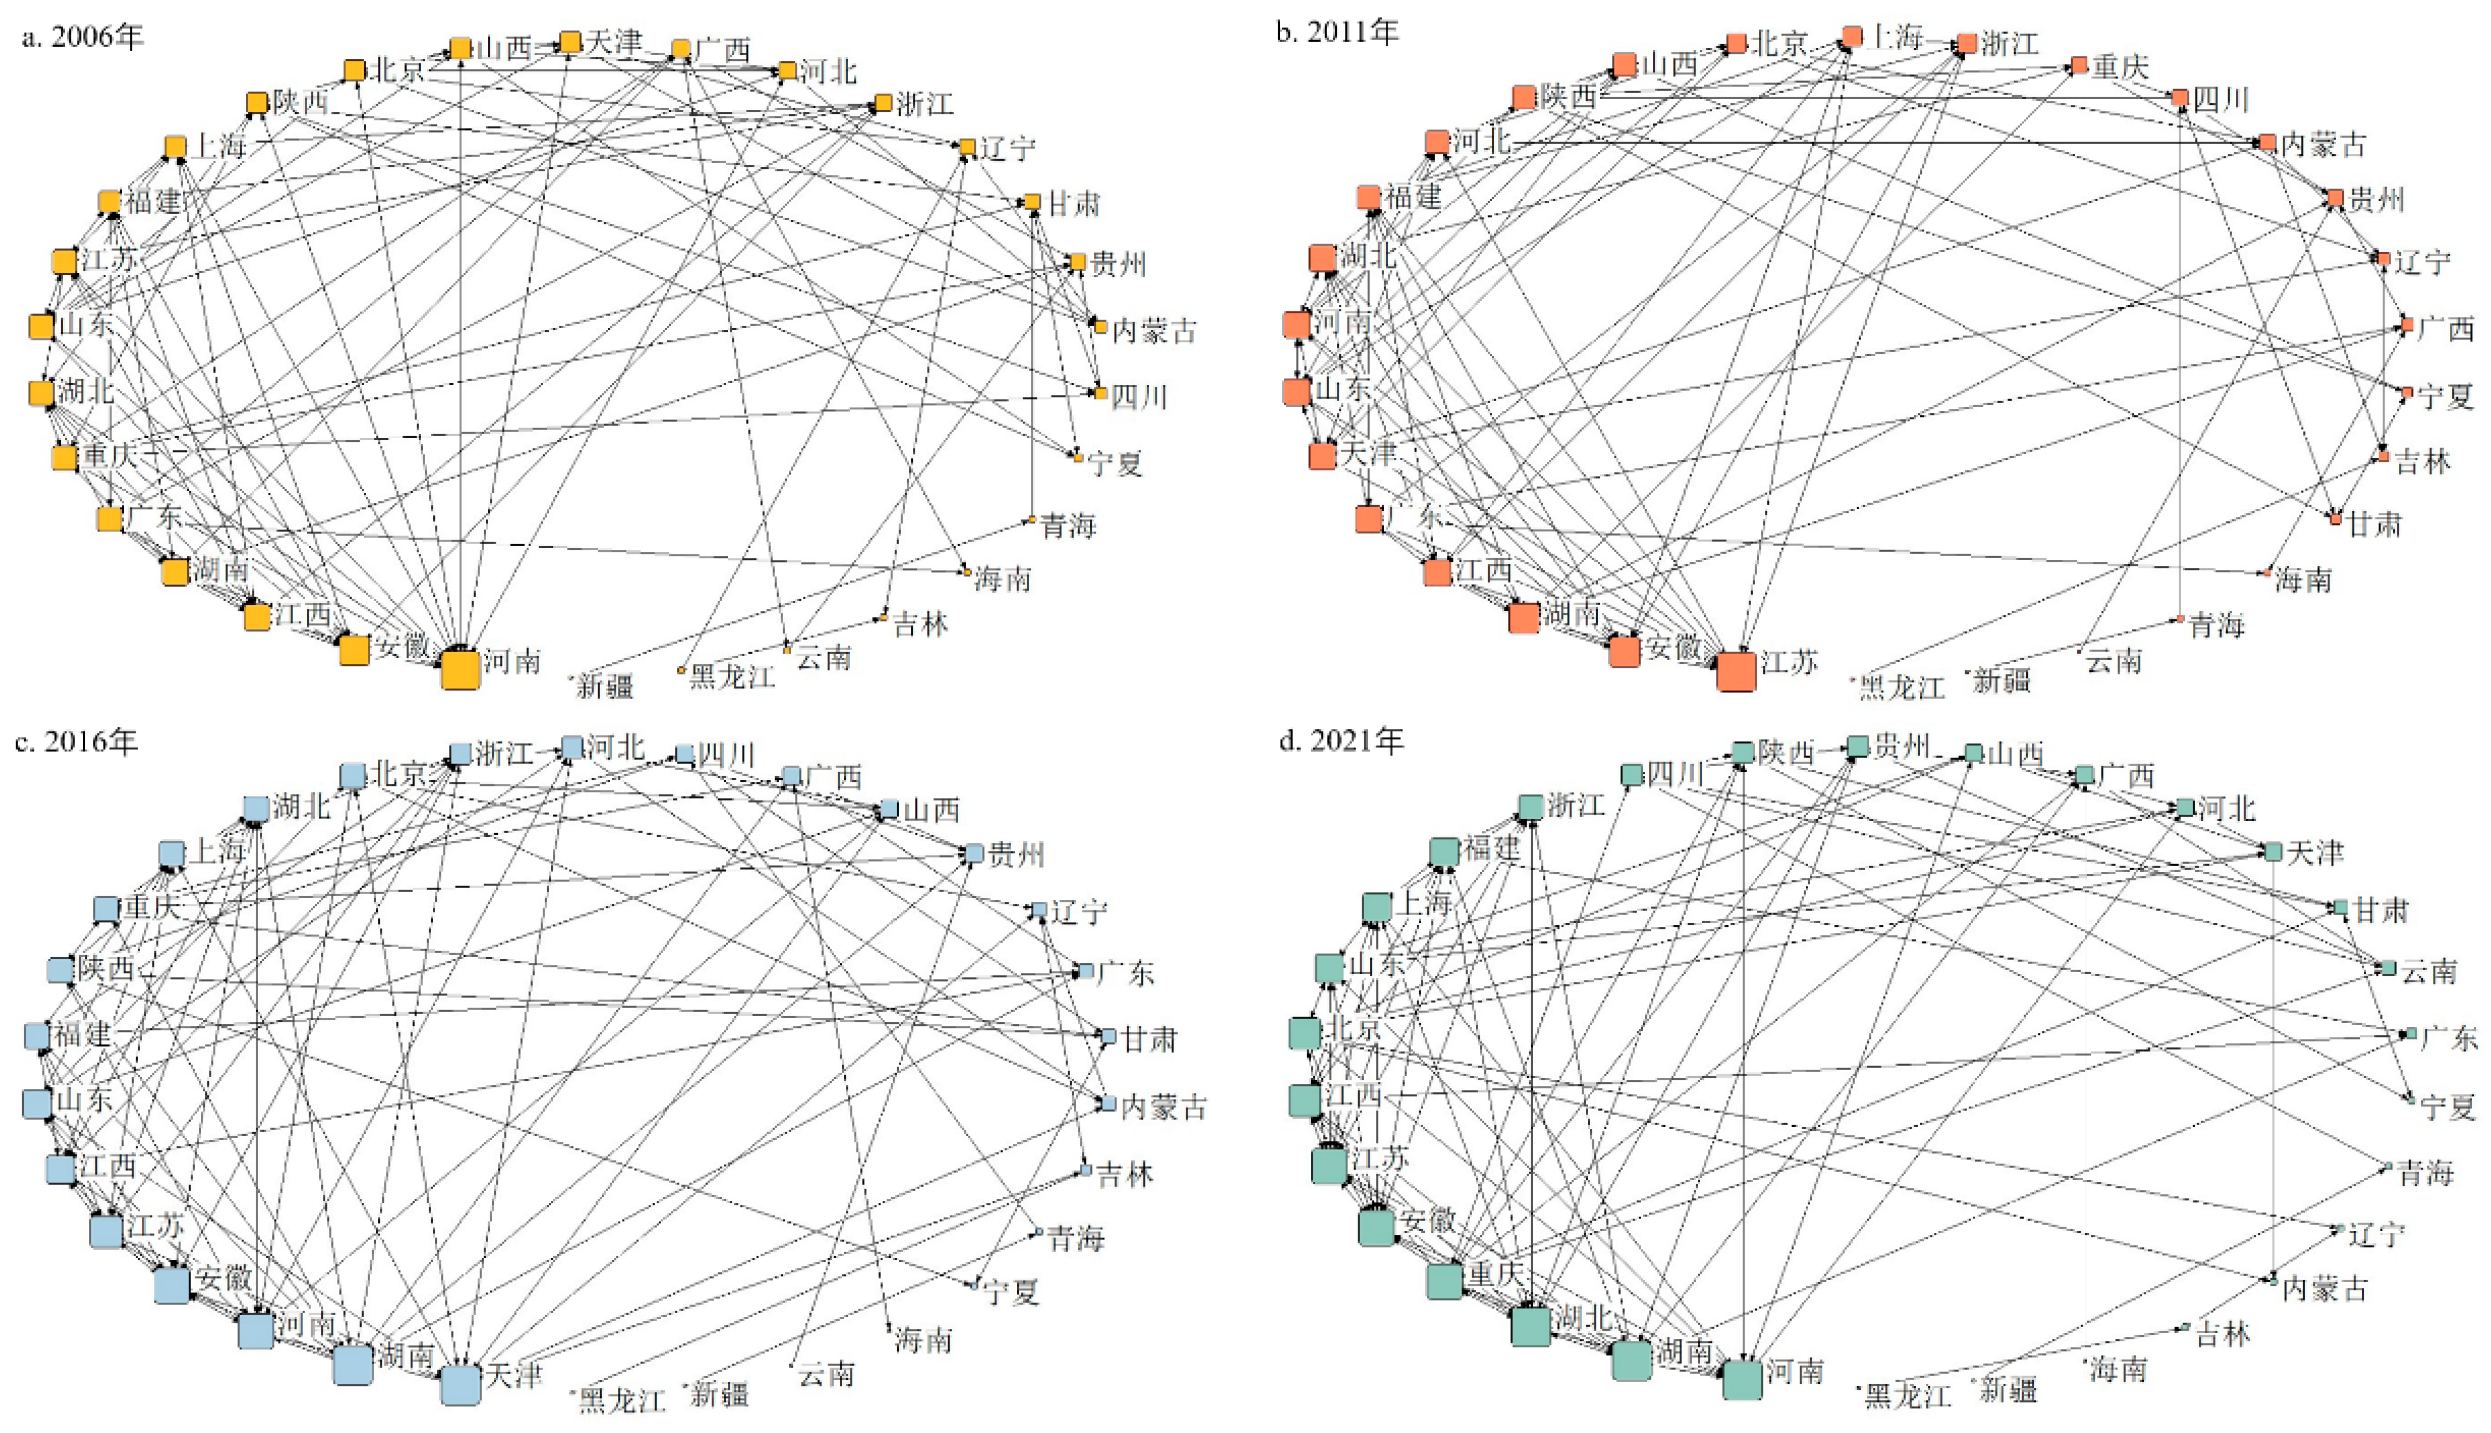

Table 1.
Evaluation index system of carbon emission efficiency.
| Primary index | Secondary index | Indicator description |
|---|---|---|
| Input factors | Labor force elements | Number of employed persons at the end of the year (10,000) |
| Energy elements | Total energy consumption (ten thousand tons of standard coal) | |
| Capital factor | Capital stock (100 million yuan) | |
| Expected output | Economic benefit output | Gross regional product (100 million yuan) |
| Unexpected output | carbon dioxide emission | Total carbon emissions (million tons) |
Table 2.
Carbon Emission Efficiency of China Province from 2006 to 2021.
| Province | 2006 | 2011 | 2016 | 2021 | Average/mean value | Average annual change rate (%) |
|---|---|---|---|---|---|---|
| Beijing | 0.289 | 0.407 | 0.520 | 1.031 | 0.518 | 8.838 |
| Tianjin | 0.312 | 0.424 | 0.646 | 0.589 | 0.503 | 4.336 |
| Hebei | 0.274 | 0.386 | 0.386 | 0.521 | 0.385 | 4.386 |
| Shanxi | 0.282 | 0.312 | 0.243 | 0.412 | 0.295 | 2.555 |
| Inner Mongolia | 0.274 | 0.439 | 0.414 | 0.486 | 0.392 | 3.897 |
| Liaoning | 0.258 | 0.350 | 0.324 | 0.475 | 0.353 | 4.168 |
| Jilin | 0.254 | 0.341 | 0.391 | 0.398 | 0.342 | 3.051 |
| Heilongjiang | 0.303 | 0.323 | 0.322 | 0.353 | 0.319 | 1.021 |
| Shanghai | 0.334 | 0.445 | 0.550 | 1.016 | 0.549 | 7.693 |
| Jiangsu | 0.344 | 0.574 | 0.530 | 1.029 | 0.568 | 7.583 |
| Zhejiang | 0.284 | 0.381 | 0.464 | 0.756 | 0.450 | 6.746 |
| Anhui | 0.269 | 0.343 | 0.394 | 0.642 | 0.385 | 5.974 |
| Fujian | 0.313 | 0.361 | 0.443 | 1.001 | 0.469 | 8.055 |
| Jiangxi | 0.286 | 0.346 | 0.393 | 0.672 | 0.395 | 5.865 |
| Shandong | 0.303 | 0.402 | 0.475 | 0.580 | 0.432 | 4.427 |
| Henan | 0.318 | 0.311 | 0.339 | 0.612 | 0.377 | 4.466 |
| Hubei | 0.254 | 0.352 | 0.464 | 0.846 | 0.462 | 8.338 |
| Hunan | 0.308 | 0.403 | 0.554 | 0.916 | 0.511 | 7.540 |
| Guangdong | 0.409 | 0.517 | 0.475 | 0.697 | 0.511 | 3.628 |
| Guangxi | 0.316 | 0.348 | 0.448 | 0.534 | 0.400 | 3.554 |
| Hainan | 0.261 | 0.348 | 0.397 | 0.571 | 0.384 | 5.350 |
| Chongqing | 0.247 | 0.302 | 0.438 | 1.008 | 0.445 | 9.828 |
| Sichuan | 0.262 | 0.353 | 0.431 | 0.720 | 0.419 | 6.972 |
| Guizhou | 0.210 | 0.270 | 0.319 | 0.456 | 0.308 | 5.321 |
| Yunnan | 0.238 | 0.280 | 0.344 | 1.010 | 0.383 | 10.129 |
| Shanxi | 0.263 | 0.311 | 0.319 | 0.465 | 0.331 | 3.855 |
| Gansu | 0.235 | 0.272 | 0.247 | 0.337 | 0.266 | 2.435 |
| Qinghai | 0.186 | 0.269 | 0.331 | 0.403 | 0.301 | 5.304 |
| Ningxia | 0.167 | 0.296 | 0.311 | 0.411 | 0.290 | 6.177 |
| Xinjiang | 0.211 | 0.277 | 0.252 | 0.370 | 0.273 | 3.816 |
| whole country | 0.275 | 0.358 | 0.405 | 0.644 | 0.401 | 5.825 |
Table 3.
Types and characteristics of LISA space-time transition.
| type | Specific types | Specific characteristics |
|---|---|---|
| Type 0 | LHt→LHt+1, HLt→HLt+1, HHt→HHt+1, LLt→LLt+1 | The adjacent provincial units and the provincial units themselves have not made a transition. |
| Type i | LHt→HHt+1, HLt→LLt+1, HHt→LHt+1, LLt→HLt+1 | The neighboring provincial units remain unchanged, and only the provincial units themselves make a transition. |
| Type II | LHt→LLt+1, HLt→HHt+1, HHt→HLt+1, LLt→LHt+1 | The provincial units themselves remain unchanged, and only the adjacent provincial units make a transition. |
| Type iii | HLt→LHt+1, LHt→HLt+1, LLt→HHt+1, HHt→LLt+1 | The adjacent provincial units and the provincial units themselves all make transitions. |
Table 4.
Local Moran Exponential Transition Probability Matrix.
| t\t+1 | HH | LH | LL | HL |
|---|---|---|---|---|
| HH | Type 0 (0.909) | Type I (0.055) | Type iii (0.006) | Type II (0.030) |
| LH | Type I (0.095) | Type 0 (0.833) | Type II (0.083) | Type iii (0.000) |
| LL | Type iii (0.006) | Type II (0.030) | Type 0 (0.916) | Type I (0.042) |
| HL | Type II (0.100) | Type iii (0.025) | Type I (0.150) | Type 0 (0.725) |
Table 5.
Division of spatial correlation network of carbon emission efficiency in 2021.
| Plate division | Province |
|---|---|
| Plate 1 | Beijing, Tianjin, Hebei, Shanxi, Inner Mongolia, Henan and Shandong |
| Plate 2 | Jilin, Heilongjiang, Liaoning, Xinjiang, Qinghai |
| Plate 3 | Jiangxi, Fujian, Jiangsu, Zhejiang, Anhui, Shanghai, Hubei, Hunan and Guangdong |
| Plate 4 | Chongqing, Guangxi, Guizhou, Yunnan, Shaanxi, Gansu, Hainan, Ningxia and Sichuan |
Table 6.
Spillover effect and plate role of spatial correlation network of carbon emission efficiency in 2021.
Table 6.
Spillover effect and plate role of spatial correlation network of carbon emission efficiency in 2021.
| Plate division | Internal relationship of plates | Overflow relation | Acceptance relation | Number of plate provinces | Expected interior Relationship proportion |
Actual interior Relationship proportion |
Plate role |
|---|---|---|---|---|---|---|---|
| Plate 1 | 27 | 11 | 11 | seven | 20.69% | 71.05% | Bidirectional overflow |
| Plate 2 | four | one | one | five | 13.79% | 80.00% | Net benefit |
| Plate 3 | 58 | 15 | 14 | nine | 27.59% | 79.45% | Net overflow |
| Plate 4 | 26 | eight | nine | nine | 27.59% | 76.47% | broker |
Table 7.
Contribution of Carbon Emissions from Various Factors in 2006-2021. Unit: million tons.
| Energy efficiency effect | Energy intensity effect | Economic output effect | Population scale effect | Total effect | |
|---|---|---|---|---|---|
| Beijing | 90.91 | -164.81 | 48.65 | 26.40 | 1.15 |
| Tianjin | 25.04 | -99.72 | 84.05 | 29.92 | 39.29 |
| Hebei | 33.61 | -281.27 | 355.17 | 64.58 | 172.09 |
| Shanxi | 692.88 | -438.59 | 562.75 | 105.76 | 922.80 |
| Inner Mongolia | 81.18 | -142.44 | 467.11 | 56.80 | 462.66 |
| Liaoning | 12.16 | -307.95 | 367.26 | 39.75 | 111.22 |
| Jilin | 8.67 | -138.70 | 164.55 | 14.53 | 49.05 |
| Heilongjiang Province | -1.41 | -98.23 | 248.83 | -45.94 | 103.24 |
| Shanghai | 22.29 | -122.93 | 45.36 | 74.31 | 19.03 |
| Jiangsu | 19.36 | -374.79 | 272.83 | 258.73 | 176.13 |
| Zhejiang | 19.54 | -250.03 | 162.68 | 159.41 | 91.60 |
| Anhui | 22.97 | -178.33 | 225.49 | 89.84 | 159.97 |
| Fujian | 43.58 | -124.16 | 132.32 | 53.66 | 105.39 |
| Jiangxi | 1.69 | -90.74 | 101.31 | 43.96 | 56.22 |
| Shandong | 40.67 | -555.97 | 633.84 | 175.17 | 293.72 |
| Henan | 111.21 | -375.73 | 308.57 | 113.86 | 157.91 |
| Hubei | 10.14 | -222.58 | 237.26 | 36.60 | 61.42 |
| Hunan | 23.75 | -212.02 | 186.26 | 59.47 | 57.46 |
| Guangdong | 28.89 | -219.75 | 164.68 | 209.14 | 182.95 |
| Guangxi | 33.91 | -78.36 | 105.10 | 32.77 | 93.42 |
| Hainan | 10.26 | -5.48 | 28.37 | 7.00 | 40.15 |
| Chongqing | 1.00 | -82.26 | 79.33 | 46.50 | 44.57 |
| Sichuan | 69.44 | -211.67 | 171.18 | 66.20 | 95.15 |
| Guizhou | 66.55 | -245.01 | 226.93 | 63.24 | 111.71 |
| Yunnan | 18.46 | -157.13 | 117.49 | 56.89 | 35.71 |
| Shanxi | 32.32 | -138.64 | 289.64 | 92.73 | 276.05 |
| Gansu | -4.76 | -72.48 | 109.00 | 25.45 | 57.21 |
| Qinghai | 3.19 | -19.94 | 27.76 | 11.28 | 22.30 |
| Ningxia | -11.55 | -43.69 | 149.10 | 17.19 | 111.06 |
| Xinjiang | -78.24 | 39.50 | 210.79 | 48.73 | 220.78 |
Disclaimer/Publisher’s Note: The statements, opinions and data contained in all publications are solely those of the individual author(s) and contributor(s) and not of MDPI and/or the editor(s). MDPI and/or the editor(s) disclaim responsibility for any injury to people or property resulting from any ideas, methods, instructions or products referred to in the content. |
© 2025 by the authors. Licensee MDPI, Basel, Switzerland. This article is an open access article distributed under the terms and conditions of the Creative Commons Attribution (CC BY) license (http://creativecommons.org/licenses/by/4.0/).
Copyright: This open access article is published under a Creative Commons CC BY 4.0 license, which permit the free download, distribution, and reuse, provided that the author and preprint are cited in any reuse.


