Submitted:
28 August 2023
Posted:
29 August 2023
You are already at the latest version
Abstract
With the changes in the spatial structure of China's economic development, urban clusters have become the primary carriers of China's regional economy and green growth. The article uses annual data from 2010 to 2021 to study the carbon emission characteristics and carbon reduction pathways of 36 cities in the Yangtze River Delta region. Firstly, cities in the Yangtze River Delta region are divided into six carbon emission types based on decoupling elasticity coefficient and carbon intensity indicators. Then, the STIRPAT model is used to regress the panel data of different carbon emission types for 11 years, analyze the driving factors of carbon emissions, and develop differentiated carbon emission reduction paths for cities with six carbon emission types. According to the results, the city of Type I needs to accelerate low-carbon technology innovation, Type II needs to improve energy efficiency and strengthen low-carbon technology research and development, Type V needs to suppress foreign investment in high energy consumption and high emission projects in the local area, Type VI needs to accelerate the process of new urbanization and optimize industrial structure. Types III and IV have not received effective emission reduction paths, and further research is required on other emission reduction policies and measures.
Keywords:
Carbon peaking
; Carbon emission characteristics
; Carbon emission reduction path
; STIRPAT model
1. Introduction
Since entering the era of industrial civilization in the 19th century, human social production activities have consumed much fossil energy[1]. Excessive emissions of greenhouse gases such as carbon dioxide have led to the continuous acceleration of sea level rise, frequent extreme weather events, and natural disasters, posing a severe threat to human survival and development. Affected by insufficient energy supply and geopolitical tensions, global climate action faces significant obstacles. In this context, as the world's largest carbon emitter, China has actively proposed strengthening national independent contributions and the "dual carbon" targets. However, due to the vast territory of our country, different regional resource endowments, economic development levels, and significant differences in carbon emission characteristics. It is unnecessary to require all regions of the country to "quick march" in reducing emissions. Therefore, achieving the goal of controlling total carbon emissions needs to be decomposed into smaller areas and ranges[2], and the formulation of carbon reduction measures needs to be taken according to the circumstances. With the spatial structure of China's economic development changes, urban clusters have become the most active regions in China's social and economic development [3] and the primary carrier of China's regional economy and green growth [4]. The 19 major urban clusters carry over 75% of China's urban population and contribute over 80% of its GDP, making them a new mainstay of China's economic development. Therefore, China's "dual carbon" targets can be decomposed into urban clusters as a spatial unit for implementation. The Yangtze River Delta urban cluster is located in the eastern coastal region of China, including three provinces and one city, including Jiangsu, Zhejiang, Anhui, and Shanghai. It is one of the six major urban clusters in the world [5] and the region with the highest level of economic development in China.
With the rapid growth of the economy, the Yangtze River Delta urban cluster is also facing severe ecological and environmental problems. Studying the carbon emission reduction characteristics and pathways of the Yangtze River Delta urban cluster can alleviate the ecological and environmental issues of the cluster and is of great significance for China to achieve the "dual carbon" targets. In the past few years, the Yangtze River Delta urban cluster has attached great importance to carbon reduction, actively exploring ways to achieve the "dual carbon" targets and promoting the "dual carbon" cause to enter a new stage. Due to the good urbanization foundation and obvious overall advantages of the Yangtze River Delta urban cluster, it plays a certain leading role in the "dual carbon" targets. Therefore, focusing on the carbon emission characteristics and emission reduction paths of the Yangtze River Delta urban cluster can provide reference and reference for other urban clusters.
2. Literature Review
The close connection between carbon emissions and economic activities has become a universal consensus. Since the signing of the Paris Agreement, domestic and foreign scholars have researched the characteristics of carbon emissions in different regions, and current research mainly focuses on the relationship between carbon emissions and economic growth[7]. Many scholars use decoupling models to analyze whether there is a decoupling relationship between carbon emissions and economic growth, that is to say, to study the decoupling effect of carbon emissions. Tapio(2005) defined the meaning of decoupling elasticity and divided it into eight decoupling types based on the elasticity value, then analyzed the relationship between economic growth and the ecological environment in detail[8]. Based on the Tapio Decoupling Model, Chen(2018) analyzed the relevant data of the Organization for Economic Cooperation and Development (OECD) from 2001 to 2015 and studied the decoupling between carbon emissions and the economic growth of OECD countries[9]. Li and Qin(2019) studied the decoupling relationship between China's carbon emissions and economic development by summarizing the historical development characteristics and predicting the future development trend [10]. The Tapio Decoupling Model is widely used in academic research to measure the decoupling relationship between economic growth and carbon emissions[11]. Still, some scholars use the Tapio Decoupling elasticity model and the OECD decoupling model simultaneously. Grand and Mariana (2016) divided 21 countries into low-income countries, low and middle-income countries, high and middle-income countries, and high-income countries and applied the OECD decoupling model and Tapio Decoupling Model to analyze the dynamic changes in carbon emissions and carbon emission structure of the four types of countries[12]. Deutch (2017) applied two decoupling models to conduct a quantitative study based on historical data and compared the differences between China, the United States, and the world regarding carbon emission and energy carbon intensity growth [13]. The academic community has extensively researched the decoupling relationship between China's economic growth and carbon emissions. It has achieved rich research results, covering the investigation of the overall decoupling effect and change trend of carbon emissions at the national, regional, and provincial levels, laying a solid foundation for conducting this study. However, research on the decoupling effect of carbon emissions at the urban cluster level and city level still needs to be improved.
Regarding the relationship between carbon emissions and other driving factors, in China's practice of carbon emission reduction, there are significant differences in carbon emission driving factors among different regions due to geographical location, population size, and technological level. The formulation of carbon emission reduction paths has also shown diversification. In the past, scholars mostly used LMDI models[14], IPAT models[15], STIRPAT models[16], CGE models[17], and " scenario analysis combined with sensitivity analysis" methods[18] to identify the driving factors of carbon emissions. Because the STIRPAT model considers the nonlinear impact of economic growth factors on carbon emissions and multiple indicator factors such as technology and environment, it is an effective method to explore the driving aspects of energy-related carbon emissions. It has been widely applied by domestic and foreign scholars[19]. Shahbaz et al.(2016) used the STIRPAT model to study the impact of urbanization on carbon emissions in Malaysia[20]. Wang et al.(2016) empirically analyzed the main factors affecting the carbon intensity of countries and eight economic zones using the STRIPAT model, and the results showed that the level of economic activity and the secondary industry were the main factors influencing carbon intensity[21]. Liu et al.(2017) introduced spatiotemporal factors into the STRIPAT model, analyzed empirical data from 30 provinces in China, and concluded that population size, urbanization rate, energy intensity, industrial structure, energy consumption pattern, energy price, and openness are important driving factors of regional emissions[22]. Dong et al.(2018) analyzed the driving factors of carbon emission intensity change in China by using structural decomposition analysis and quantile regression. They found that energy structure, industrialization index, and final consumption rate positively impacted carbon emission intensity[23]. Chen et al.(2020) took the eight economic zones of China as the starting point, used the StoNED Model to measure energy efficiency, and built a geographical and time-weighted regression-STIRPAT model to analyze the influence of each driving factor of carbon emission[24]. Liu et al.(2022) made a statistical analysis on the scale development of six energy-intensive industries and revealed the heterogeneity of driving effects of 10 key factors, including economic level, urbanization level, industrial structure, technological innovation, and environmental regulation, from the perspective of factor driving[25]. Liu et al.(2023) combined the structural decomposition analysis method and input-output subsystem analysis method to build a decomposition model of influencing factors of carbon dioxide emission change in China. They concluded that the energy intensity effect is a significant influencing factor in curbing carbon dioxide emission. Economic development is the main driving factor for increased carbon dioxide emission[26]. Scholars have further enriched research on carbon emission reduction by identifying the driving factors of carbon emissions across the country, regions, and industries and developing differentiated and diversified emission reduction measures for different carbon emission driving factors.
At present, research on the carbon emission reduction paths of the Yangtze River Delta urban cluster is relatively limited, and the relevant emission reduction paths and measures lack specificity. Liu et al.(2017) took the Yangtze River Delta region as an example, combined with data envelopment analysis, and proposed a city-level allocation method. The analysis shows that cities with enormous carbon emission reduction potential, financial solid capacity, large industrial enterprises above designated size, and high GDP have better carbon emission reduction and should be allocated proportionally higher emission reduction targets[27]. Li et al.(2017) used the prefecture-level panel data derived from 2000-2010 grid data to study whether there is convergence of carbon intensity in prefecture-level cities in the Yangtze River Delta. They concluded that prefecture-level cities with high carbon intensity in the Yangtze River Delta will rapidly decrease. The research results emphasize the importance of considering carbon emission reduction driving factors such as the current situation of carbon intensity, spatial factors, industrial structure, and economic level to reduce carbon intensity[28]. Zhu et al.(2023) analyzed carbon emissions in the Yangtze River Delta region and summarized the pressure and potential of carbon emission reduction in the Yangtze River Delta region. Through dialectical analysis of the characteristics of each emission reduction policy, suggestions are put forward from the perspective of implementing a carbon tax policy[29].
In summary, scholars applied different methods to study carbon emission characteristics and developed differentiated carbon emission reduction paths for various regions and industries. However, there are few in-depth studies on the characteristics of carbon emission reduction within the Yangtze River Delta urban cluster. Therefore, Cao's method was used for reference[11], carbon emission characteristics were defined based on the two indicators of carbon emission intensity and decoupling types, and the Yangtze River Delta urban cluster was divided into six carbon emission types. Furthermore, the STIRPAT Model explores the driving factors of carbon emission in different types of carbon emission reduction cities to formulate differentiated carbon emission reduction paths. Finally, suggestions are made for realizing the "double carbon" target in the Yangtze River Delta cluster.
3. Research Methodology
3.1. Variable Selections and Data Sources
The empirical analysis data in this article comes from the China Economic Data website, China Carbon Accounting Database, National Bureau of Statistics website, provincial statistical yearbooks, CSMAR database, and Report on the implementation of the national economic and social development plan. All data are annual data from 36 cities in the Yangtze River Delta region of China from 2010 to 2021. The description of variables and their data sources is shown in Table 1.
3.2. Sample Analysis and Data Processing
The Yangtze River Delta urban cluster consists of 41 prefecture-level cities, but due to the lack of foreign direct investment data, industrial structure data, and regional GDP data, only the carbon emission characteristics and pathways of 36 cities in the Yangtze River Delta region were studied, excluding five cities: Huai'an, Taizhou, Bozhou, Chuzhou, and Huaibei.
Among them, foreign direct investment data for Jiaxing, Wenzhou, Ningbo, Changzhou, and Yancheng in 2020 and 2021 are missing, so the Linear Interpolation Method is used to estimate the missing values. In addition, the carbon dioxide emissions data of 36 cities from 2020 to 2021 have not been disclosed yet, and the Linear Interpolation Method is also used for estimation.
Represents the carbon dioxide emissions in year t, and t represents the year.
3.3. Model Construction
- (1)
- Improved Tapio Decoupling Model
Considering that the population and economic development level vary greatly among cities, it is better to compare the situation of each region horizontally from the perspective of "per capita." Therefore, based on the improved Tapio model, the carbon emission characteristics of 36 cities in the Yangtze River Delta region were analyzed. The improved Tapio elastic coefficient calculation formula is as follows:
t represents the current period; t-1 represents the previous period; represents per capita carbon emissions; PGDP represents per capita GDP.
The traditional Tapio Model defines eight types of decoupling based on the value of the decoupling elasticity coefficient T and the positive or negative of and . Considering that China's GDP has a stable positive growth rate (∆ PGDP>0), according to the value ofand the positive or negative of and , decoupling types are simplified into three classes in this article. The specific types of decoupling are shown in Table 2.
- (2)
- STIRPAT Model
Dietz and Rosa(1994) improved the IPAT Model in 1997[30]. Then, they proposed the STIRPAT (Stochastic Impacts by Regression on Population, Affluence, and Technology) Model, which overcame the limitations of proportional changes in various driving factors in the IPAT model. The STIRPAT Model is shown as follows:
I represent environmental impact (emission level); P represents population; A represents economic level; T represents technology; a,b,c, and d represent the elastic coefficients; α is the coefficient; e is the residual error. The parameters can be obtained through regression.
After taking the natural logarithm and adding the quadratic term, it can be transformed into the following form:
Equation (4) expresses the nonlinear relationship among population P, wealthy level A, technological level T, and environmental pressure I.
This article selects carbon dioxide emissions as a representative of environmental pressure I and also selects factors that focus on carbon peaking and carbon neutrality: energy intensity, industrial structure, foreign trade level, urbanization level, and low-carbon technology level, to expand the STIRPAT model:
TC is the dependent variable, representing carbon dioxide emissions; α is a constant; 、、、、、、 are the coefficients; The explanatory variables include: PGDP represents per capita GDP, measuring wealth level; LCT means the number of green patents, measuring the level of low-carbon technology; EI is the growth rate of energy consumption per unit of GDP, measuring energy intensity; IS represents the ratio of industrial added value to regional GDP, representing the industrial structure; FDI is the ratio of foreign direct investment to regional GDP, meaning the level of foreign trade; UR is the ratio of urban population to total population, representing the level of urbanization; is the error term.
4. Research Fingdings
4.1. Classification of Carbon Emission Types Based on Tapio Elasticity Coefficient
Firstly, based on the per capita GDP data and per capita carbon dioxide emissions data of 36 cities in the Yangtze River Delta region, calculate their decoupling elasticity coefficient .
Then, observe the calculated value of the decoupling elasticity coefficient. , as well as the positive and negative of and , found that In 2019, the of 36 cities are both positive, of which 29 cities belonged to solid or weak decoupling types, and only seven cities, such as Zhoushan belonged to the type of expansive negative decoupling. The detailed decoupling types of 36 cities are shown in Table 3.
Next, calculate the carbon emission intensity (ES) of 36 cities in 2019 and divide them using ES=1 as the boundary point. When 0<ES<1, it is defined as low-carbon strength; When ES>1, it is defined as high-carbon intensity. Through calculation and induction, it was found that 15 cities, including Ningbo, belong to high-carbon intensity cities, with an average carbon intensity of 1.94 tons every 10000 yuan; Shanghai and 21 other cities belong to low-carbon intensity cities, with an average carbon intensity of 0.63 tons every 10000 yuan. The carbon intensity types are shown in Table 4.
Finally, combining the Tapio decoupling coefficient and carbon intensity, 36 Yangtze River Delta region cities were classified by growth rate and absolute quantity. This article takes ES=1, =0, =0.8 as the critical value to divide 36 cities into six types of carbon emissions.
The classification results are shown in Table 5: 36 cities are divided into six carbon emission types, namely carbon emission type I (0<ES<1 and <0), type II (0<ES<1 and 0<<0.8), Type III (0<ES<1 and >0.8), type IV (ES>1 and <0), type V (ES>1 and 0<<0.8), and type VI (ES>1 and >0.8). Carbon emission type I includes seven cities: Wenzhou, Taizhou, Lishui, Nantong, Yancheng, Huzhou, and Yangzhou; Type II consists of 12 cities including Shanghai, Hangzhou, Shaoxing, Jinhua, Jiaxing, Changzhou, Wuxi, Lianyungang, Fuyang, Bengbu, Hefei and Huangshan; Type III includes two cities: Lu'an and Suqian; Type IV consists of 8 cities: Ningbo, Quzhou, Chizhou, Suzhou, Xuancheng, Anqing, Tongling, and Ma'anshan; Type V includes two cities: Nanjing and Huainan; Carbon emission type VI consists of five cities: Zhoushan, Xuzhou, Suzhou, Wuhu, and Zhenjiang.
Based on the classification results, further analysis shows that type I cities have achieved negative per capita carbon emissions growth and low carbon intensity, making it a relatively ideal carbon emission type; The per capita carbon emission growth rate of Type II cities is lower than the per capita GDP growth rate, and the carbon intensity is also at a relatively low level; Although Type III cities have low carbon intensity, their per capita carbon emissions growth rate is greater than the per capita GDP growth rate, indicating that these cities are in a stage of sacrificing the environment for economic development; The per capita carbon emission growth rate of Type IV cities shows negative growth, but the carbon intensity is relatively high; The per capita carbon emission growth rate of Type V cities is lower than the per capita GDP growth rate, and their carbon intensity is higher; The per capita carbon emission growth rate of Type VI cities is higher than the per capita GDP growth rate and the carbon intensity is relatively high, which is an unsatisfactory type of carbon emission.
4.2. Analysis of Regional Characteristics of Carbon Emissions Based on Decoupling Index
The 2019 Tapio decoupling elasticity coefficient and carbon intensity distribution of 41 cities in the Yangtze River Delta region of China are shown in Figure 1 and Figure 2, respectively. Next, analyze the spatial distribution of decoupling elasticity coefficient and carbon intensity in various cities 2019.
Figure 1 shows the spatial distribution of decoupling elasticity coefficients for 41 cities in 2019. It can be observed that: five cities located in the central part of the Yangtze River Delta region (Lu'an, Wuhu, Zhenjiang, Suzhou, Zhoushan) and two cities in the north (Xuzhou, Suqian) had high decoupling elasticity coefficients in 2019, which all greater than 0.8, indicating that the economic development of these seven cities still relies on carbon emissions; At the same time, five cities located in the southern part of the Yangtze River Delta region (Ningbo, Taizhou, Wenzhou, Lishui, Quzhou), six cities in the central part (Anqing, Chizhou, Tongling, Xuancheng, Huzhou, Ma'anshan), and four cities in the northern part (Suzhou, Yancheng, Yangzhou, Nantong) have negative decoupling elasticity coefficients, all less than 0, indicating that the economic development and carbon emissions of these 15 cities have achieved decoupling, and carbon emissions have achieved negative growth; The growth rate of per capita carbon emissions in the remaining 14 cities is lower than the growth rate of per capita GDP. Overall, less than 20% of cities in the Yangtze River Delta region have high per capita carbon emissions growth. In comparison, over 80% of cities have low or negative per capita carbon emissions growth. From a spatial perspective, cities with negative per capita carbon emissions growth are often located on the edge of the Yangtze River Delta region. In contrast, cities with low and high per capita carbon emissions growth occupy the interior of the Yangtze River Delta region in an "S" shape.
According to Figure 2, cities with high carbon intensity are primarily concentrated in Anhui Province, with eight cities with high carbon intensity; Jiangsu Province takes second place, with four high carbon intensity cities; Zhejiang Province takes third place, with three high carbon intensity cities. About 40% of cities in the Yangtze River Delta region are still high carbon intensive, while less than 60% are low carbon intensive. From a spatial perspective, carbon intensity in the Yangtze River Delta region shows "light at the ends and heavy in the middle."
According to the "classification criteria" for carbon emission types in Table 5, a quadrant diagram for 36 cities in the Yangtze River Delta region in 2019 can be shaped (see Figure 3). It is found that 53% of cities belong to Type I and Type II, with low-carbon negative growth and low-carbon low growth, respectively. This indicates that in the Yangtze River Delta region, at least half of the cities have carbon emissions at a low level of both total and growth rates, making them the ideal carbon emission type. In addition, 5% of cities belong to Type III, where the total carbon emissions are very low, but the growth rate is high. Technological innovation and upgrading are needed to reduce the growth rate. About 28% of cities belong to Type IV and Type V, with high total carbon emissions but a decreasing growth rate and significant room for emission reduction. However, 14% of cities still belong to Type VI, where the economic development rate is far slower than the increase in industrial energy consumption, and both aggregate and growth rates of carbon emissions are high.
4.3. Analysis of Carbon Emission Reduction Paths Based on the STIRPAT Model
Thirty-six cities were divided into carbon emission types according to the Tapio Model, and the STIRPAT model was further used to analyze panel data of cities with different carbon emission types from 2010 to 2021. Firstly, Eviews was used to perform unit root tests and cointegration tests. Levin, Lin, and Chu (LLC) tests were used to test the stationarity of each variable's time series, and the Pedroni method was used to perform a cointegration test on panel data (as shown in Table 6 and Table 7).
The test results indicate that there are no unit roots in lnTC, lnP, lnPGDP, lnLCT, lnIS, lnFDI, lnUR, EI, and the sequences of each variable are stationary, and the sequences are integration of order zero.
According to the cointegration test results, the significance is 0.0000, indicating a long-term equilibrium relationship between variables.
After pre-testing, OLS regression was performed on panel data of six carbon emission types using SPSS26.0, and the regression results are shown in Table 8. There is a severe collinearity (VIF value much greater than 30) between the explanatory variable and lnPGDP after regression. After excluding the term , the regression was conducted again, and it was found that the Durbin Watson (DW) values of cities with carbon emission types I, II, and IV were far less than 2. These results indicate that the autocorrelation between these three carbon emission types of cities is more severe. The reason is that cities with the same carbon emission type have similarities in carbon emission intensity and decoupling.
Table 8 shows the regression results of the STIRPAT Model corresponding to the six-carbon emission types. Based on the regression coefficients and their significance, specific cities can be further refined and targeted to develop carbon emission reduction paths. Based on different types of carbon emissions, the analysis of particular regression results and the setting of effective emission reduction paths are as follows:
Cities belonging to carbon emission type I include Wenzhou, Taizhou, and Lishui. These cities have the characteristics of negative per capita carbon emissions growth and low carbon intensity. Observing the regression results, it was found that the total carbon emissions of such cities are significantly positively correlated with population, per capita GDP, low-carbon technology level, and energy intensity, with regression coefficients of 0.538, 0.819, 0.343, and 0.048, respectively. Since Type I is primarily cities with population outflow and relatively flat economic development, reducing population and suppressing economic growth are ineffective emission reduction measures. Therefore, starting with a low-carbon economy and achieving emission reduction goals through continuous innovation of low-carbon technologies is necessary. At the same time, the city can share low-carbon technologies with other cities and provide them with a carbon reduction experience.
Cities belonging to carbon emission type II include 12 cities such as Shanghai, Hangzhou, and Shaoxing, where the per capita carbon emission growth rate is lower than the per capita GDP growth rate, the carbon intensity is relatively low, and there is still some room for emission reduction. The total carbon emissions of these cities are significantly positively correlated with population, per capita GDP, low-carbon technology level, foreign trade level, and energy structure, with regression coefficients of 0.942, 1.113, 0.081, 0.093, and 0.027, respectively. This type of city has a large population inflow and a relatively high economic level, and carbon emissions cannot be suppressed by sacrificing economic development. These cities have high levels of low-carbon technology and energy efficiency. After comparing other regression coefficients, it was found that the level of foreign trade is the main factor affecting their carbon emissions. For such kinds of cities, it is necessary to focus on adjusting the fields and product types of foreign investment while continuously improving energy efficiency and strengthening the research and development of low-carbon technologies.
Cities of carbon emission type III include Lu'an and Suqian, which have low total carbon emissions but high growth rates. The regression results show that the regression coefficients of variables such as population, per capita GDP, and low-carbon technology level are insignificant, and all variables cannot significantly impact such cities. Therefore, there is currently no effective emission reduction path for such cities, and targeted policies must be taken based on their actual situation to suppress their carbon emission growth rate.
Cities belonging to carbon emission type IV include eight cities, such as Ningbo, Quzhou, and Chizhou, which have achieved negative per capita carbon dioxide emissions growth. However, due to the rapid economic development in the past decade, the total amount of carbon dioxide is large. Observing the regression coefficients, it was found that there is a significant positive correlation between population, per capita GDP, and total carbon emissions, with regression coefficients of 0.667 and 1.318, respectively. Other factors are not significant. Due to the large population inflow, rapid economic development, and large carbon dioxide emissions in these cities, it is necessary to strengthen their carbon sequestration capacity or reduce carbon emissions by enhancing residents' awareness of environmental protection and low-carbon lifestyle.
Cities belonging to carbon emission type V include Nanjing and Huainan, which have sizeable total carbon emissions and high growth rates. Therefore, it is necessary to simultaneously consider "reducing total emissions" and "suppressing growth rates." Observing its regression coefficients, it was found that there is a significant positive correlation between per capita GDP, foreign trade level, and total carbon emissions, with regression coefficients of 1.380 and 0.811, respectively. There is a significant negative correlation between the level of low-carbon technology and the total carbon emissions, with a regression coefficient of -0.472. Therefore, emission reduction can be achieved by suppressing foreign investment in high-energy consumption and high-emission projects in the local area and by accelerating the improvement of low-carbon technology to reduce carbon emissions effectively.
Cities belonging to carbon emission category VI include five cities, such as Zhoushan, Xuzhou, and Suzhou, with significant carbon emissions while also experiencing high carbon emission growth rates. Observing its regression coefficients, it was found that there is a significant positive correlation between urbanization level, population, industrial structure, energy intensity, and total carbon emissions. The regression coefficients from large to small are 1.135, 0.894, 0.645, and 0.029, respectively; There is a significant negative correlation between the level of foreign trade and the total carbon emissions, with a regression coefficient of -0.210. This type of city has a high level of urbanization, with population inflow exceeding population outflow, and cannot effectively suppress carbon emissions through these two variables. However, carbon emissions can be stopped by optimizing the industrial structure and achieving the transformation from industry to service industry as soon as possible. At the same time, improving energy efficiency can reduce energy intensity and carbon emissions in the production process. It is also possible to increase foreign trade to transfer carbon emissions.
5. Conclusions and Recommendations
5.1. Conclusions
Thirty-six cities in China's Yangtze River Delta region are further divided into different carbon emission types according to indicators of the decoupling elastic coefficient and carbon emission intensity. Then, a STIRPAT Model is constructed based on panel data from 2010 to 2021 for regression, exploring the main driving factors for carbon emission reduction in each city, and developing differentiated carbon emission reduction paths for different regions. Based on the empirical results, the following conclusions can be drawn:
The 36 cities in the Yangtze River Delta urban cluster can be divided into six types of carbon emissions based on the two characteristic indicators of decoupling and carbon emission intensity, namely carbon emission type I, Type II, Type III, type IV, type V, and Type V. Based on panel data of cities in the Yangtze River Delta from 2010 to 2021, a STIRPAT Model was constructed. After regression analysis, it was found that cities with different carbon emission types have different carbon emission driving factors. Factors that significantly affect the carbon emissions of cities in the Yangtze River Delta urban cluster include population size, per capita GDP, low-carbon technology level, industrial structure, foreign trade level, urbanization level, and energy intensity. It is noteworthy that population size and per capita GDP have a significant positive driving effect on certain carbon-emitting cities, with per capita GDP having a stronger driving effect than population size. The driving effects of low-carbon technology level, industrial structure, foreign trade level, urbanization level, and energy intensity on carbon emissions vary in direction and size among different carbon emission types of cities. In response to the driving factors of differentiated carbon emissions, it is necessary to develop differentiated carbon emission reduction paths tailored to local conditions for cities with different carbon emission types.
According to empirical results, the carbon emission reduction path can be arranged as follows: the cities of carbon emission type I can strengthen innovation in low-carbon technologies while improving energy efficiency and reducing their energy intensity. For the cities of Type II, various methods are not very effective in suppressing carbon emissions. Therefore, consideration should be given to innovation in low-carbon technologies, adjustment of foreign trade product types, and improvement of energy efficiency. The cities of type V can curb foreign investment in high-energy consumption and high-emission projects in the region while promoting and applying low-carbon technologies on a large scale and across all fields; The cities of type VI need to accelerate the process of new urbanization, adjust and optimize the industrial structure, and at the same time improve the level of foreign trade and energy efficiency. However, cities of types III and IV do not have very effective emission reduction paths. For these two types of cities, further research should be conducted to explore other effective emission reduction paths, such as formulating carbon tax policies and other related policies in specific regions or cities or thinking and researching from the aspect of "carbon sink."
5.2. Recommendations
Based on the conclusions, the following suggestions can be made:
(1) Under the background of achieving the "carbon peaking" target before 2030, considering the differences in economic development and industrial structure among cities in the Yangtze River Delta region, it is necessary to achieve carbon peaking in the Yangtze River Delta region in batches and areas, known as "cascade peaking." Pay attention to the priority order of carbon peaking among cities in the Yangtze River Delta: prioritize increasing the growth rate of high carbon emissions and reducing emissions in high carbon intensity cities while paying attention to implementing emission reduction in other cities. After achieving carbon peaking in cities with negative carbon emission growth rates and low carbon intensity, we will systematically achieve carbon peaking in other cities.
(2) Driving cities within the urban cluster to achieve carbon peaking through collaborative emission reduction mechanisms. There is a spatial spillover-effect between adjacent cities, and the development of collaborative emission reduction mechanisms cannot be ignored in achieving a carbon peak in the Yangtze River Delta region. Each city can leverage its "comparative advantages" to provide carbon reduction experience and low-carbon technologies for other cities.
(3) For cities with high carbon emission growth rates and high carbon intensity, combining economic and particular policies is necessary to increase carbon reduction efforts and efficiency. A single policy may not have a good effect, and it is necessary to combine diversified policies to implement carbon reduction paths while enriching carbon reduction paths, which can help such cities achieve efficient carbon reduction.
It is less than ten years since the goal of achieving a carbon peak before 2030, and the time for carbon reduction is tight, and the task is heavy. From a national perspective, as one of China's fastest-growing urban clusters, the Yangtze River Delta region needs to actively implement carbon emission reduction and set an excellent example for other urban clusters. Different urban clusters should explore carbon reduction paths suitable for their respective regions, considering factors such as geographical location and economic level. From a regional perspective, there are significant differences within the Yangtze River Delta region, and different cities should adopt differentiated and diversified carbon reduction measures to provide successful carbon reduction experiences for other urban clusters.
Funding
The Project is supported by the Guangxi Humanities and Social Sciences Development Research Center (grant number: WKZX2022001): Research on Carbon Peak Prediction and Differentiated Emission Reduction Path of Guangxi Urban Cluster under the "Dual Carbon" Target; The Project is supported by Sichuan Provincial Key Research Base of Social and Science——The Center of System Science and Enterprise Development (grant number: XQ22B09): Research on Carbon Peak Prediction and Differentiated Emission Reduction Pathway of Urban Cluster in China under the "Dual Carbon" Target.
References
- Liu, J., The spatiotemporal pattern evolution of regional carbon emissions under the background of manufacturing agglomeration: Taking Zhejiang Province as an example. Productivity Research, 2022(8): p. 33-38.[Chinese].
- Xu, L. and X. Shi, Analysis of the Evolution Law and Characteristics of Carbon Emissions in Energy Intensive Regions: Taking Shanxi as an Example. Energy of China, 2018. 40(10): p. 38-41. [Chinese].
- Zhang, J. and S. Wang, Air Pollution Emission Characteristics of Urban Agglomeration in the Middle Reaches of the Yangtze River. Chinese Journal of Environmental Management, 2017. 9(3): p. 83-88. [Chinese].
- Wang, J., W. Gao, and S. Che, Research on the Driving Mechanism of Carbon Reduction in China from the Perspective of "Dual Carbon" Targets: Evidence from the Energy Mining Industry. Western China, 2023(1): p. 65-81. [Chinese].
- Hu, H., A Study of Coordinative Development Between Economic Growth and Resources and Environmental of the Yangtze River Delta. 2014, Liaoning Normal University. [Chinese].
- Wang, C., S. Ji, and L. Ren, Spatial correlation and influencing factors of energy carbon emissions in Yangtze River Delta urban agglomeration. Shanghai Land & Resources, 2022. 43(03): p. 8-14. [Chinese]. [CrossRef]
- Sun, L., Q. Wang, and J. Zhang, Inter-industrial Carbon Emission Transfers in China: Economic Effect and Optimization Strategy. Ecological Economics, 2017. 132(FEB.): p. 55-62. [Chinese]. [CrossRef]
- Tapio, P., Towards a theory of decoupling: degrees of decoupling in the EU and the case of road traffic in Finland between 1970 and 2001. Transport Policy, 2005. 12(2): p. 137-151. [CrossRef]
- Chen, H. Comprehensive Evaluation of Carbon Emission Permits Allocation: Evidence From 30 Provinces in China. in International Conference on Management Science and Engineering. 2018.
- Li, H. and Q. Qin, Challenges for China's carbon emissions peaking in 2030: A decomposition and decoupling analysis. Journal of Cleaner Production, 2019. [CrossRef]
- Cao, J. and Y. Zhang, Research on Carbon Emission Characteristics and Reduction Pathways of Provinces in China. Ecological Economy, 2022. 38(08): p. 13-19. [Chinese].
- Grand, C. and Mariana, Carbon emission targets and decoupling indicators. Ecological Indicators, 2016. 67: p. 649-656.
- Deutch, J., Decoupling Economic Growth and Carbon Emissions. Joule, 2017. [CrossRef]
- Liu, J., Research on the Influencing Factors of China's Carbon Emission and the Countermeasures Based on the LMDI Model. Industrial Economy, 2022(20): p. 146-148. [Chinese].
- Ding, S. and Z. Wen, Study on Influential Factors of Carbon Emissions in Yangtze River Delta——Based on IPAT Improved Model. Journal of Technical Economics & Management, 2014(09): p. 106-109. [Chinese].
- Gao, G., et al., Study on Carbon Peak of Urban clusters based on Analysis of Influencing Factors of Carbon Emissions Business and Management Journal, 2023. 45(02): p. 39-58. [Chinese].
- Su, X., Carbon emission growth factor decomposition and carbon tax policy effect simulation based on CGE model in Shanxi Province. 2022, Shanxi University of Finance and Economics. [Chinese].
- Wang, L. and Y. Zhang, Factors Decomposition and Scenario Prediction of Energy-Related CO2 Emissions in China. Electric Power Construction, 2021. 42(09): p. 1-9. [Chinese].
- Zhang, C. and L. Yan, Panel estimation for urbanization, energy consumption and CO2 emissions: A regional analysis in China. Energy Policy, 2012. [CrossRef]
- Shahbaz, M., et al., How urbanization affects CO2 emissions in Malaysia? The application of STIRPAT model. Renewable and Sustainable Energy Reviews, 2016. [CrossRef]
- Wang, Z., B. Zhang, and T. Liu, Empirical analysis on the factors influencing national and regional carbon intensity in China. Renewable and Sustainable Energy Reviews, 2016. 55: p. 34-42. [CrossRef]
- Liu, Y., et al., Driving factors of carbon dioxide emissions in China: an empirical study using 2006-2010 provincial data. Frontiers of Earth Science, 2017. 11(1): p. 156-161. [CrossRef]
- Dong, F., et al., Drivers of carbon emission intensity change in China. Resources, Conservation and Recycling, 2018. 129: p. 187-201. [CrossRef]
- Chen, J., et al., Analysis of China's carbon emission driving factors based on the perspective of eight major economic regions. Environmental Science and Pollution Research, 2020(10): p. 1-24. [CrossRef]
- Liu, J., et al., Synergy and heterogeneity of driving factors of carbon emissions in China's energy-intensive industries. Ecological Indicators, 2022. 142: p. 109161.
- Liu, M., et al., Drivers of China's carbon dioxide emissions: Based on the combination model of structural decomposition analysis and input-output subsystem method. Environmental Impact Assessment Review, 2023. 100: p. 107043.
- Liu, Z., et al., Efficient distribution of carbon emissions reduction targets at the city level: A case of Yangtze River Delta region. Journal of Cleaner Production, 2017. 172(pt.2): p. 1711-1721. [CrossRef]
- Li, J., et al., Convergence of carbon intensity in the Yangtze River Delta, China. Habitat International, 2017. 60: p. 58-68. [CrossRef]
- Zhu, W., et al., Coordinated carbon reduction mechanism and policy design to achieve carbon peak and neutrality goals in the Yangtze River Delta. Sustainable Energy Technologies and Assessments, 2023. 56: p. 103113. [CrossRef]
- Dietz, T. and E.A. Rosa, Rethinking the environmental impacts of population, Affluence and technology. 1994.
Figure 1.
Spatial distribution of decoupling elasticity coefficient of cities in 2019.
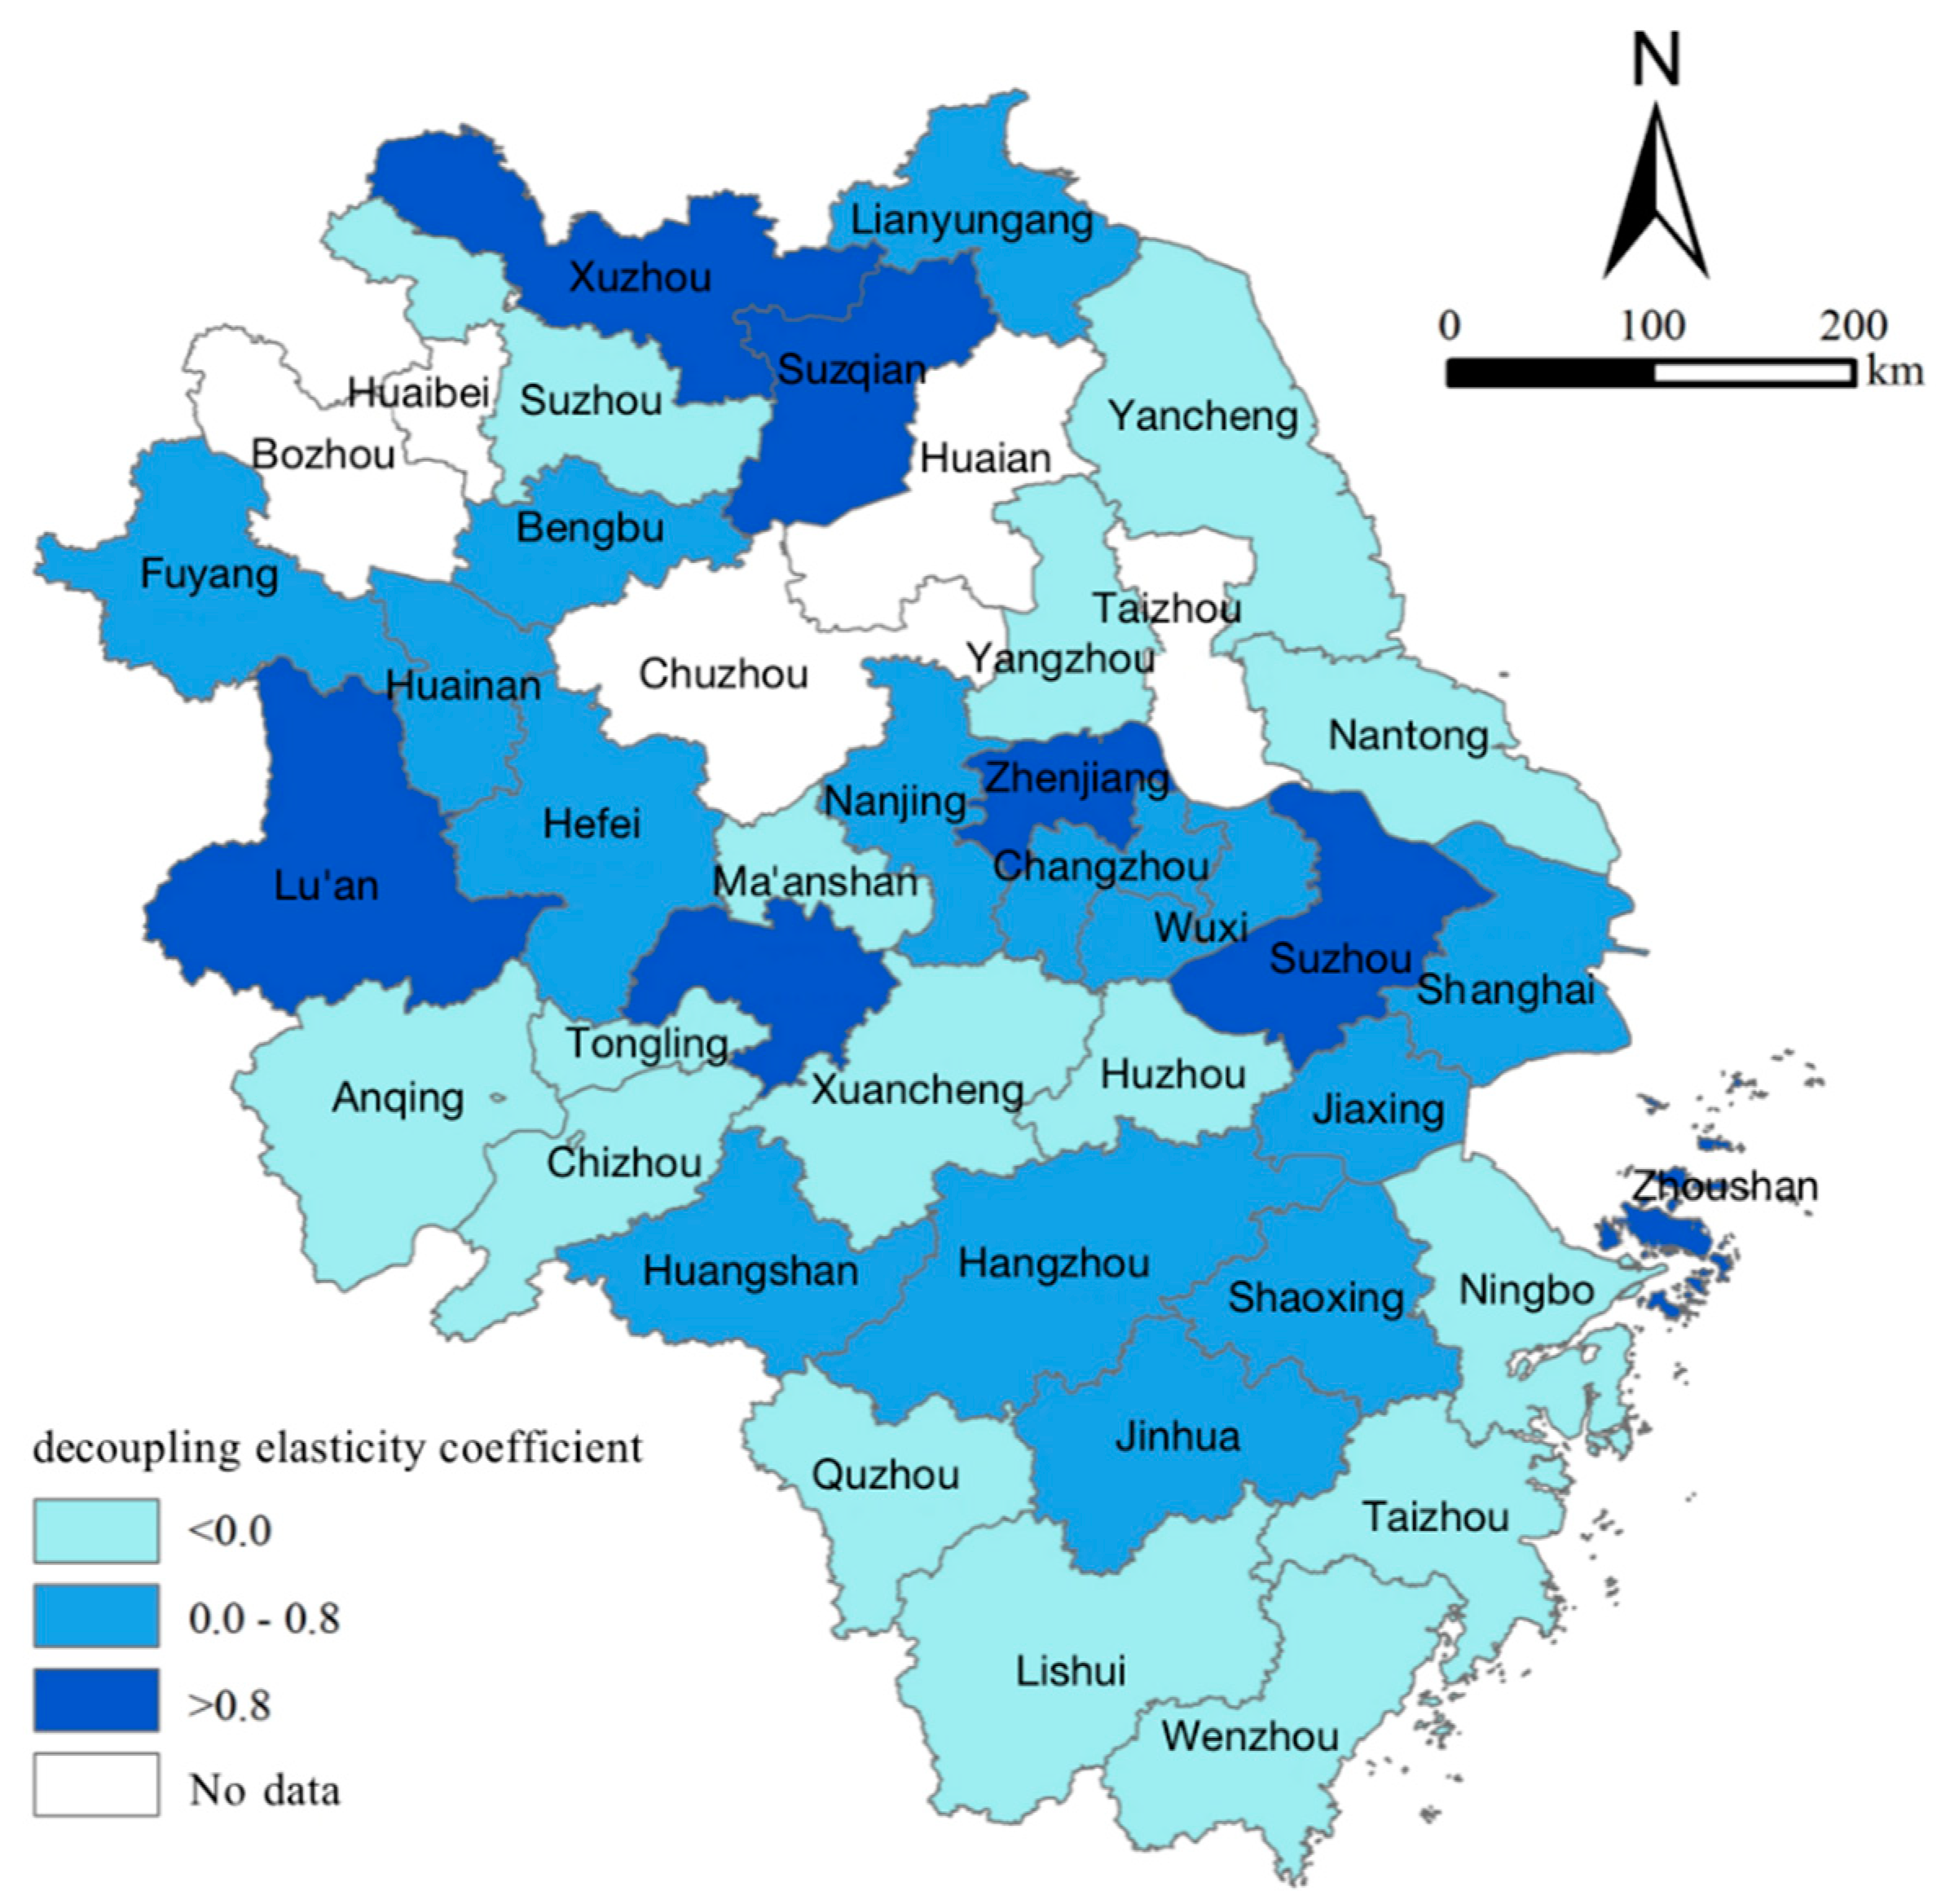
Figure 2.
Spatial distribution of carbon intensity of cities in 2019.
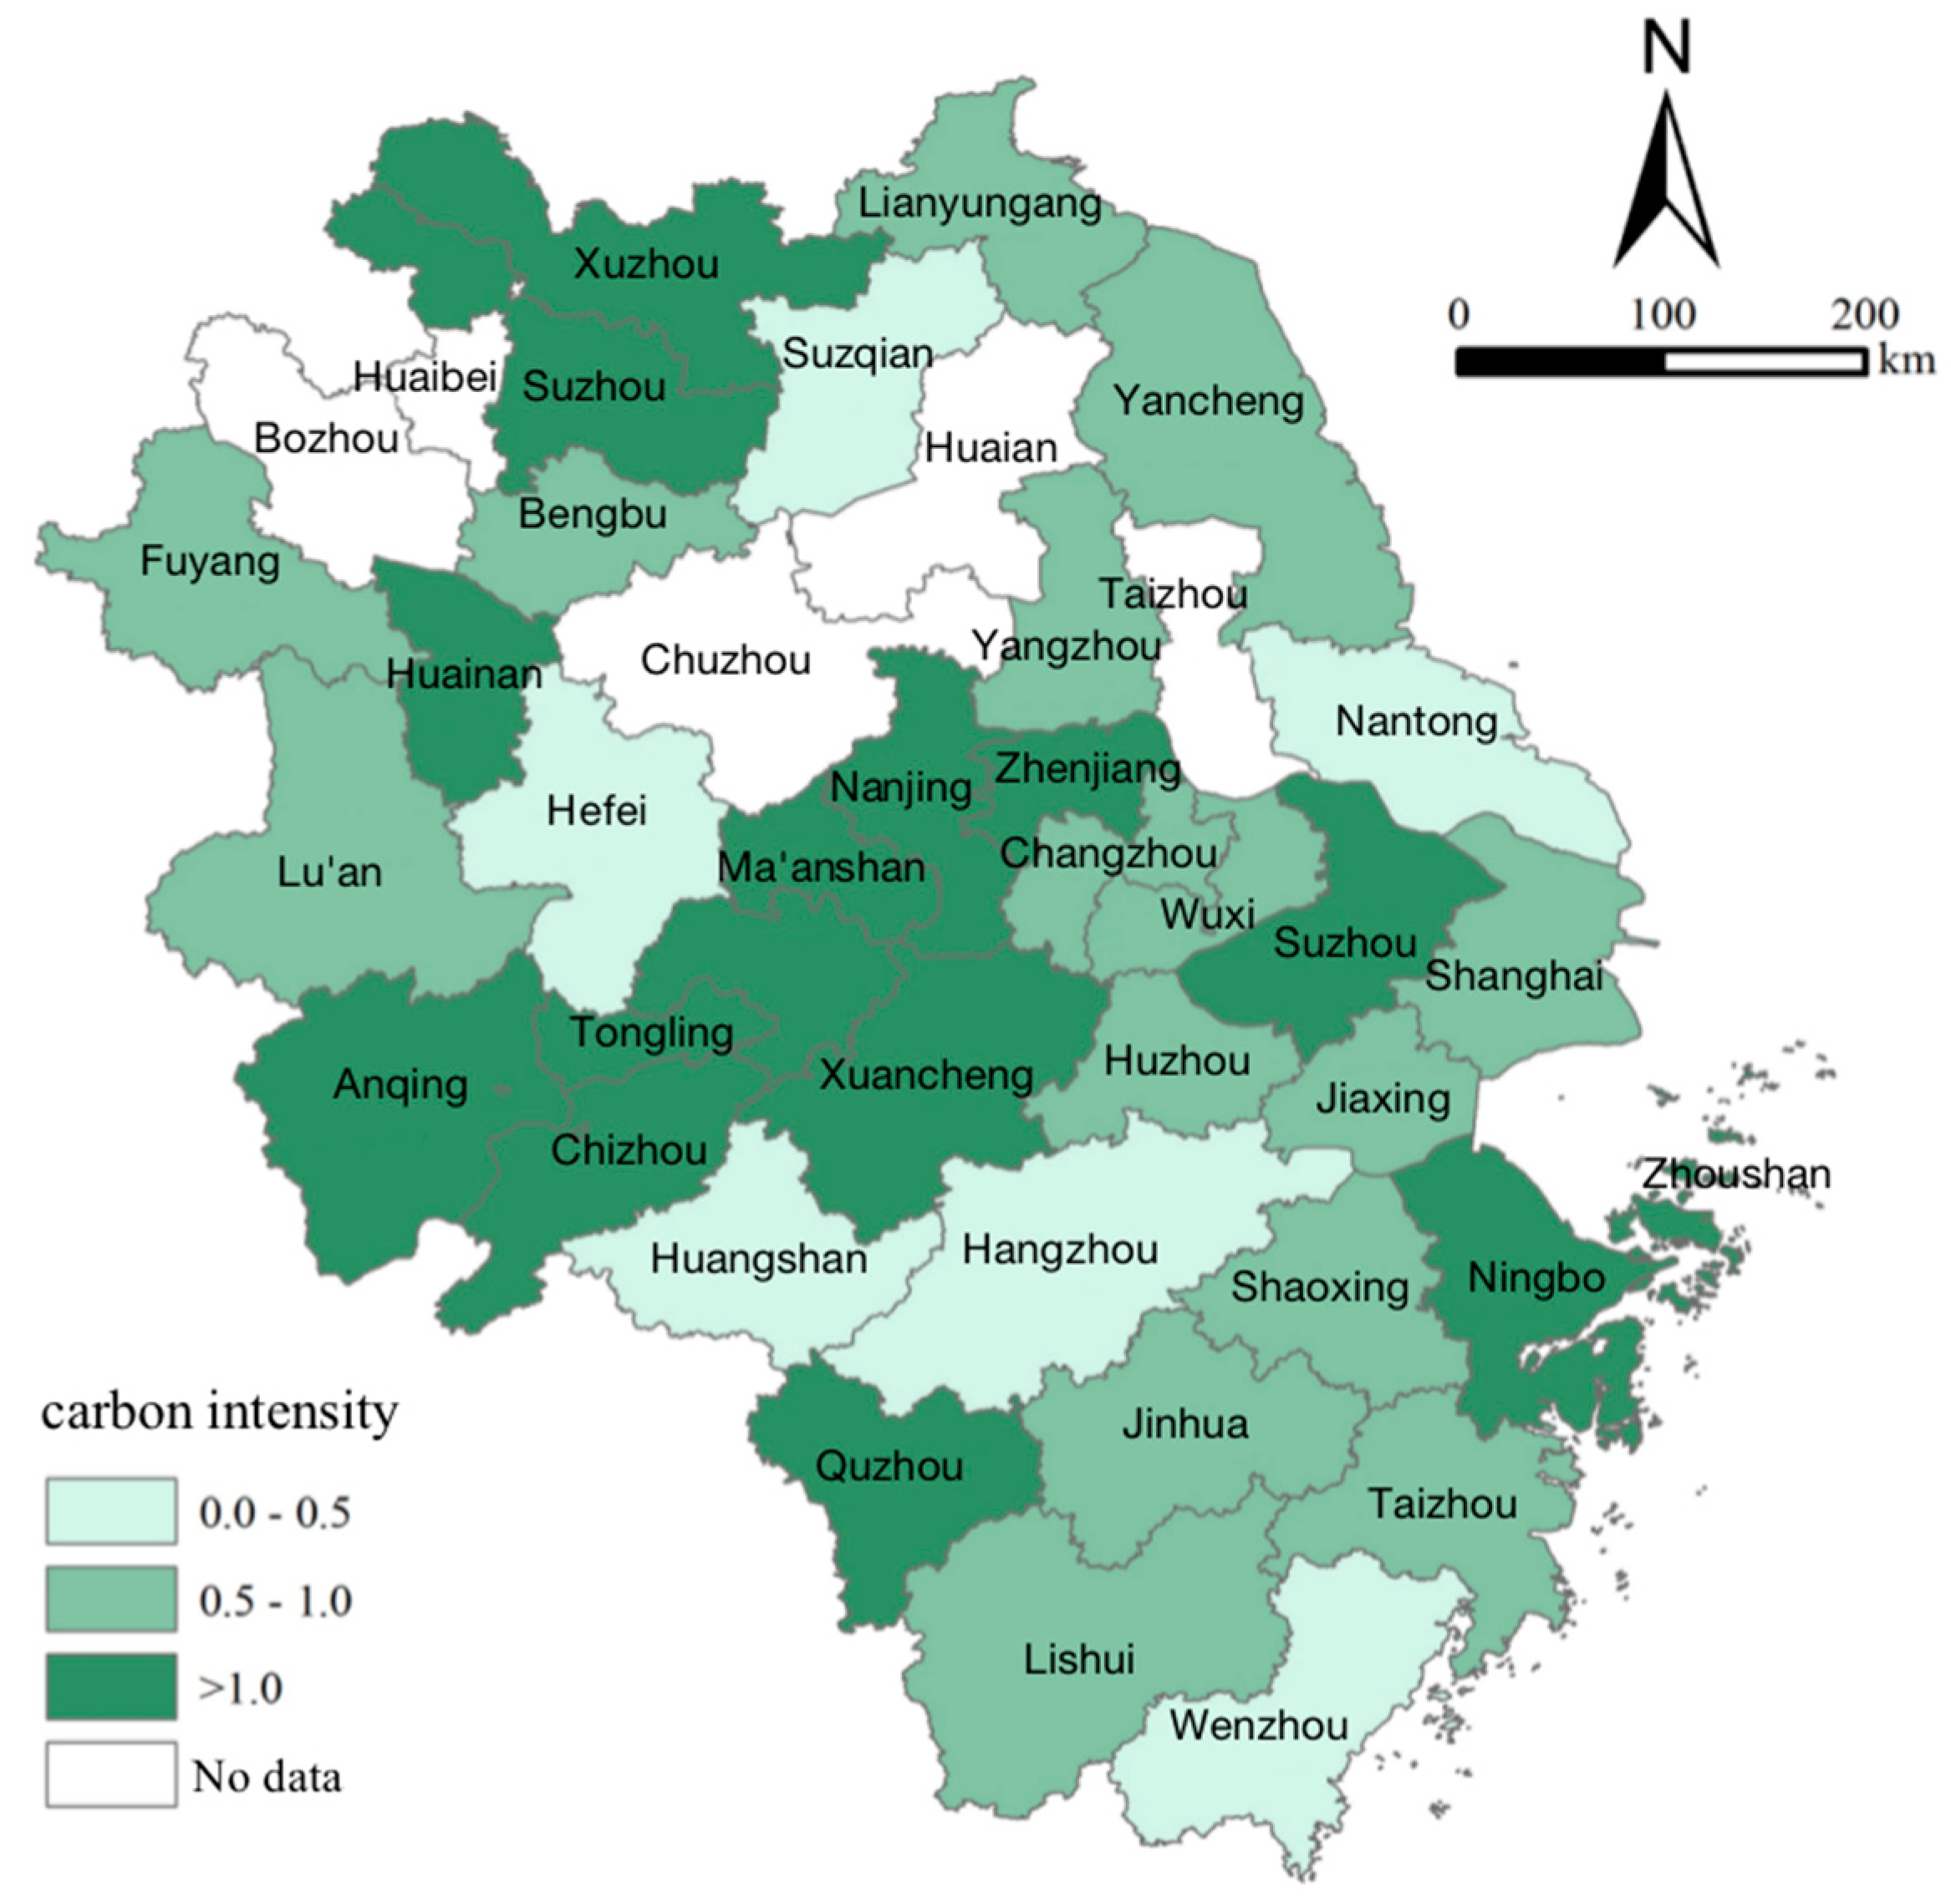
Figure 3.
Quadrant diagram of carbon emission types for 36 cities in 2019.
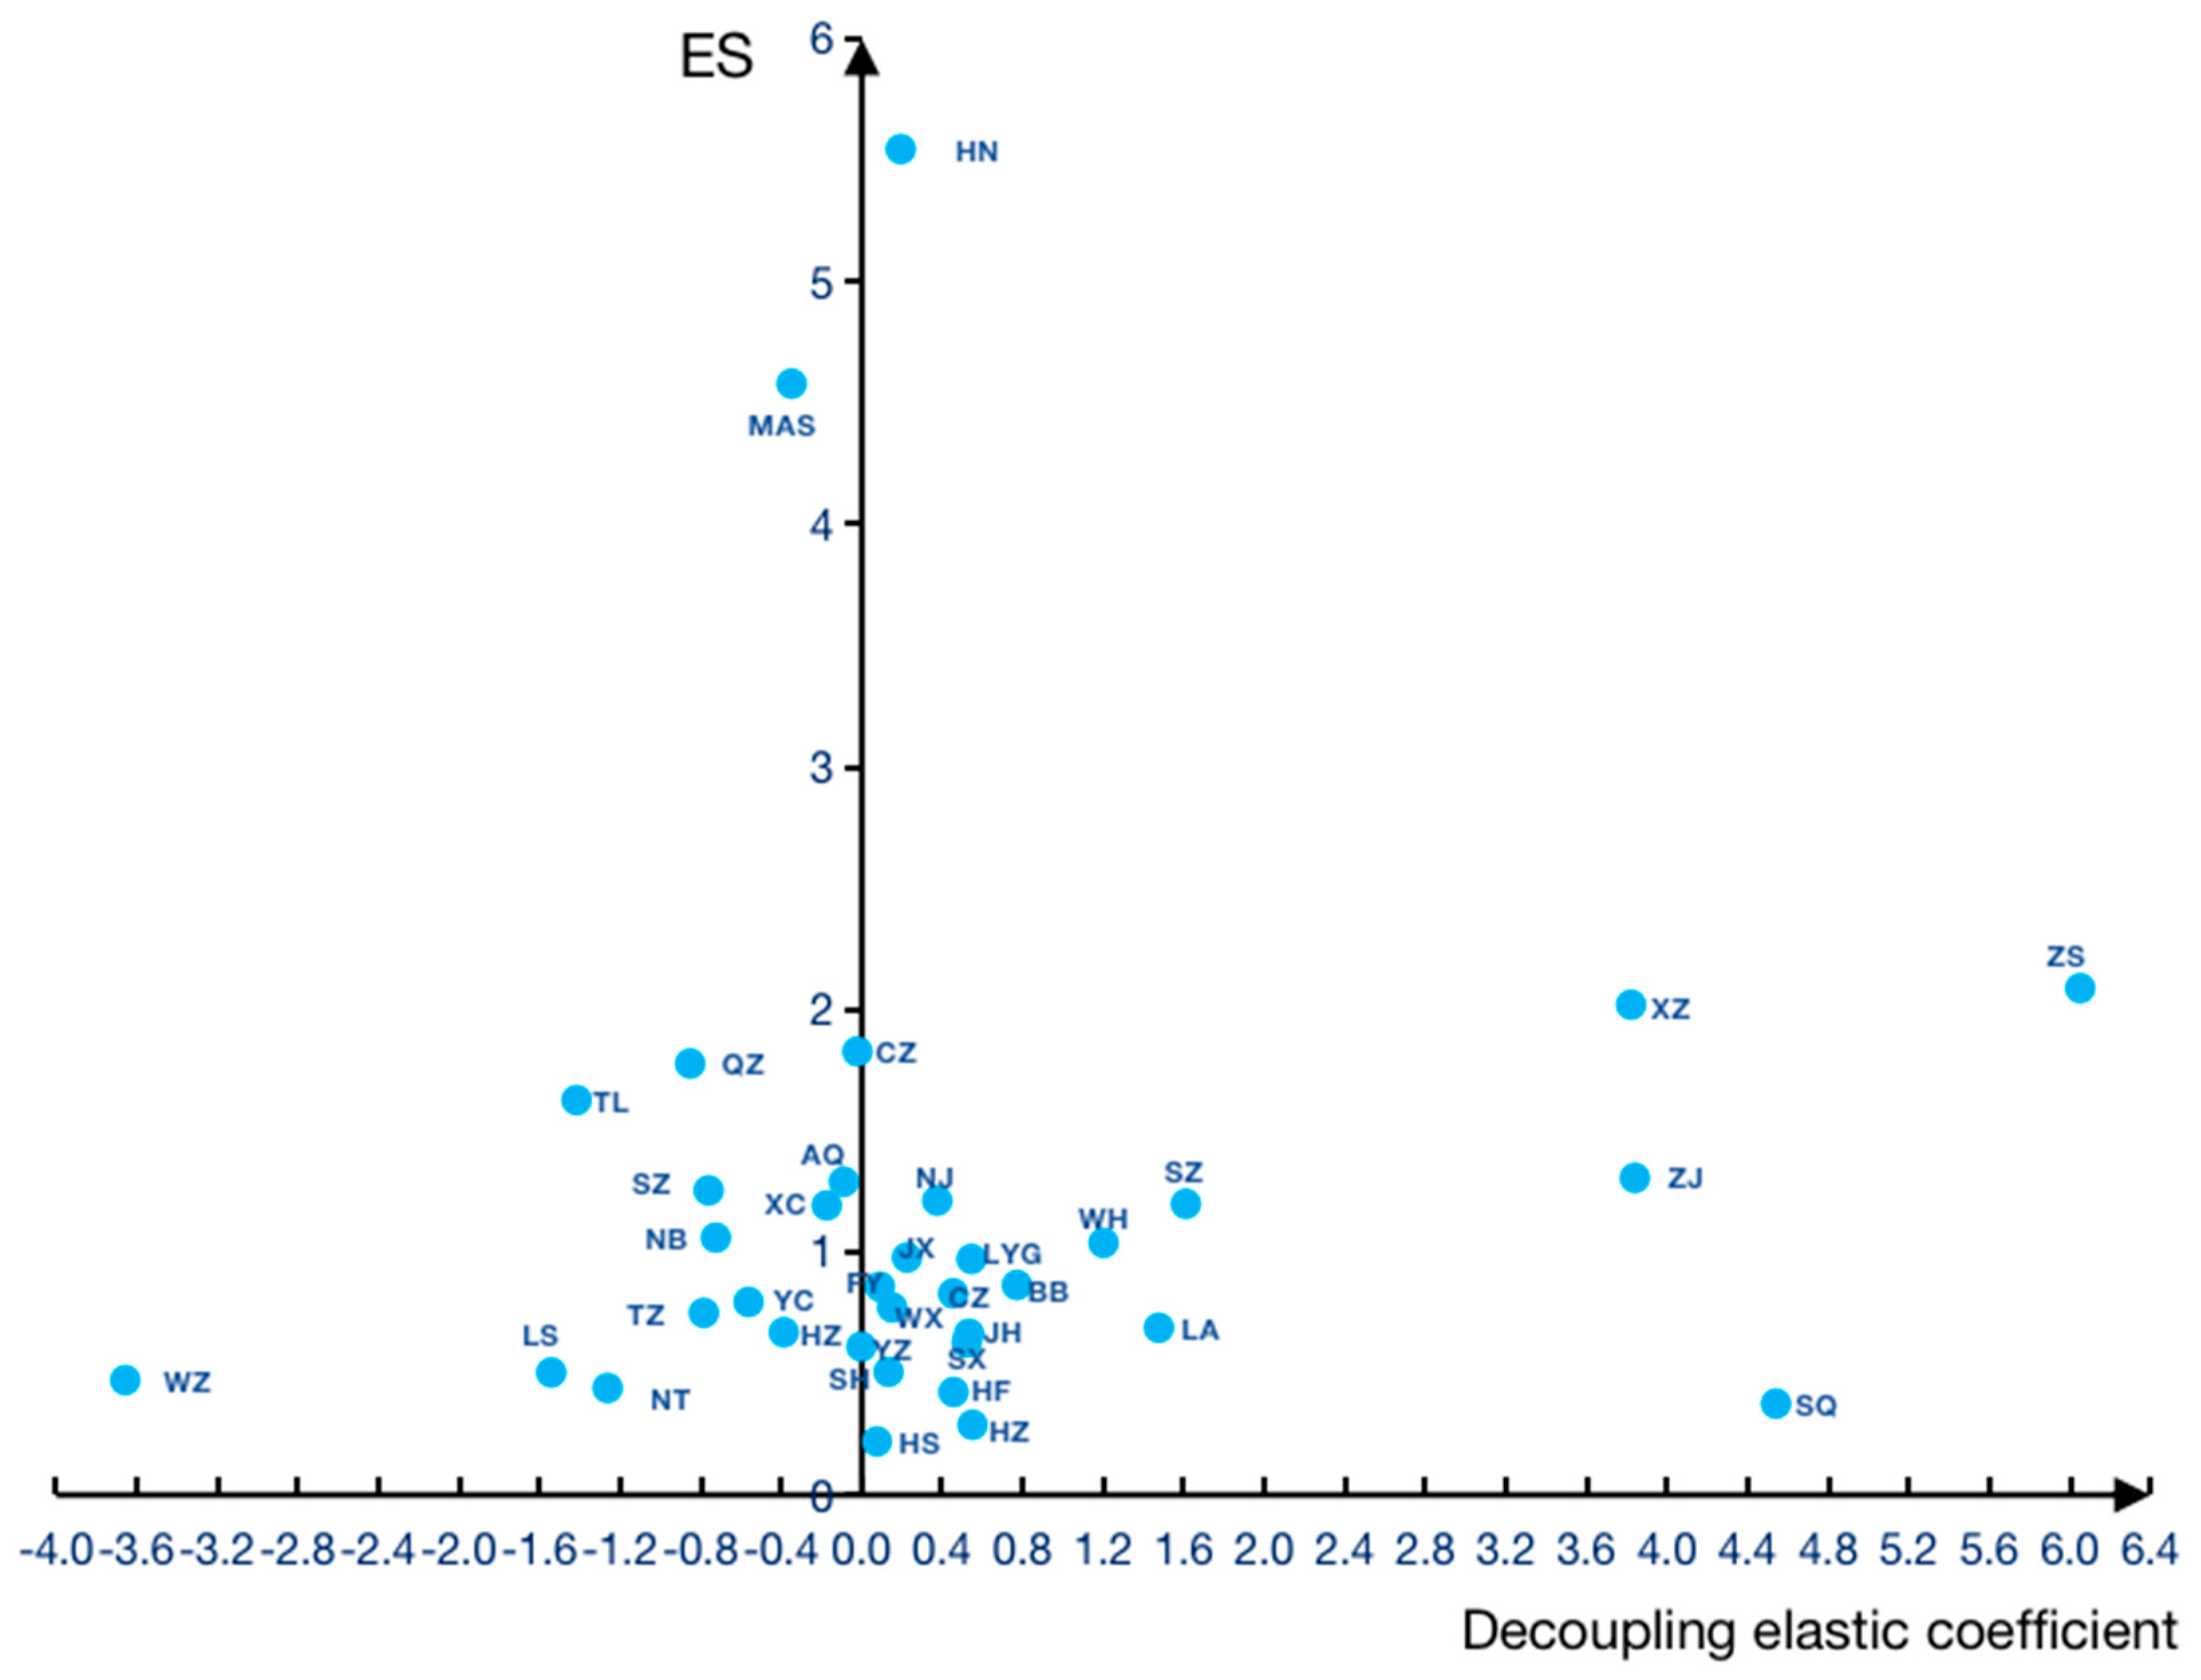

Table 1.
Variable selection and data sources.
| Variable Type | Variable name | Mark | Unit | Variable description | Data source |
|---|---|---|---|---|---|
| Explained Variable | Carbon dioxide emission | TC | 10000 ton |
The effectiveness of emission reduction | China Carbon Accounting Database |
| explanatory variable | Gross domestic product | GDP | 0.1 billion yuan |
economic development level |
provincial statistical yearbooks |
| Population | P | 10000 people |
The number of permanent residents | provincial statistical yearbooks | |
| Low Carbon Technology | LCT | One item | The number of green technologies | CSMAR database | |
| Industry structure | IS | % | The ratio of industrial-added value to regional GDP | China Economic Data website | |
| Foreign Direct Investment | FDI | % | The ratio of foreign direct investment to regional GDP, the Exchange rate is 0.153 | China Economic Data website | |
| Energy Intensity | EI | % | The growth rate of energy consumption per unit of GDP | China Economic Data website, Provincial Report on the Implementation of the National Economic and Social Development Plan | |
| Urbanization | UR | % | The ratio of the urban population to the total population | China Economic Data website |
Table 2.
Tapio decoupling types.
| Decoupling types | Indicator | ||
|---|---|---|---|
| GDP | |||
| Strong decoupling | <0 | >0 | (-∞,0) |
| Weak decoupling | >0 | >0 | (0,0.8) |
| Expansive negative decoupling | >0 | >0 | (0.8,∞) |
Table 3.
Decoupling types of cities in 2019.
| Decoupling types | City |
|---|---|
| Strong decoupling | Huzhou, Lishui, Ningbo, Quzhou, Taizhou, Wenzhou, Nantong, Yancheng, Yangzhou, Anqing, Chizhou, Ma'anshan, Suzhou, Xuancheng, Tongling |
| Weak decoupling | Shanghai, Hangzhou, Jiaxing, Jinhua, Shaoxing, Changzhou, Lianyungang, Nanjing, Wuxi, Bengbu, Fuyang, Hefei, Huainan, Huangshan |
| Expansive negative decoupling | Zhoushan, Suzhou, Suqian, Xuzhou, Zhenjiang, Lu'an, Wuhu |
Table 4.
Types of emission intensity of cities in 2019.
| Types of Carbon emission intensity | City |
|---|---|
| High carbon emission intensity (ES>1) | Ningbo, Quzhou, Zhoushan, Nanjing, Suzhou, Xuzhou, Zhenjiang, Anqing, Chizhou, Huainan, Ma'anshan, Suzhou, Wuhu, Xuancheng, Tongling |
| Low carbon emission intensity (0<ES<1) | Shanghai, Hangzhou, Huzhou, Jiaxing, Lishui, Jinhua, Shaoxing, Taizhou, Wenzhou, Changzhou, Lianyungang, Nantong, Suqian, Wuxi, Yancheng, Yangzhou, Bengbu, Fuyang, Hefei, Huangshan, Lu'an |
Table 5.
Classification Criteria.
| Indicators | Tapio decoupling coefficient | ||
|---|---|---|---|
| <0 | <0.8 | >0.8 | |
| High carbon emission intensity (ES>1) | Type IV(High-carbon, negative growth) | Type V(High-carbon , low growth ) | Type VI(High-carbon, high growth) |
| Low carbon emission intensity (0<ES<1) | Type I(Low-carbon, negative growth) | Type II(Low-carbon , low growth ) | Type III(Low-carbon , high growth ) |
Table 6.
Result of LLC test.
| Variable | LLC test | Result | |
|---|---|---|---|
| Statistic | P-value | ||
| lnTC | -6.84324 | 0.0000 | Stationary |
| lnP | -33.8807 | 0.0000 | Stationary |
| lnPGDP | -10.9294 | 0.0000 | Stationary |
| lnLCT | -10.6621 | 0.0000 | Stationary |
| lnIS | -5.74237 | 0.0000 | Stationary |
| lnFDI | -6.18488 | 0.0000 | Stationary |
| lnUR | -5.22267 | 0.0000 | Stationary |
| EI | -11.0908 | 0.0000 | Stationary |
Table 7.
Result of cointegration test.
| ADF | t-Statistic | Prob. |
| -7.370456 | 0.0000 | |
| Residual variance | 0.071730 | |
| HAC variance | 0.052136 |
Table 8.
Panel regression results for different carbon emission types.
| Variable | lnTC | |||||
|---|---|---|---|---|---|---|
| Type I | Type II | Type III | Type IV | Type V | Type VI | |
| lnP | 0.538*** | 0.942*** | 2.544 | 0.667*** | 1.028 | 0.894*** |
| (0.102) | (0.109) | (7.836) | (0.095) | (0.638) | (0.088) | |
| lnPGDP | 0.819*** | 1.113*** | 1.708 | 1.318*** | 1.380*** | 0.516 |
| (0.200) | (0.197) | (1.027) | (0.383) | (0.460) | (0.351) | |
| lnLCT | 0.343*** | 0.081* | -0.175 | 0.023 | -0.472** | 0.094 |
| (0.108) | (0.190) | (0.197) | (0.084) | (0.218) | (0.071) | |
| lnIS | 0.501 | 0.152 | -1.354 | 0.316 | -0.645 | 0.645*** |
| (0.351) | (0.147) | (2.262) | (0.286) | (0.882) | (0.175) | |
| lnFDI | -0.037 | 0.093** | -0.040 | -0.037 | 0.811*** | -0.210*** |
| (0.056) | (0.046) | (3.363) | (0.054) | (0.276) | (0.063) | |
| lnUR | 0.875 | -0.452 | 0.499 | -0.049 | -0.104 | 1.135* |
| (0.872) | (0.378) | (2.765) | (0.864) | (1.663) | (1.020) | |
| EI | 0.048*** | 0.027*** | 0.042 | 0.019 | -0.039 | 0.029** |
| (0.013) | (0.012) | (0.041) | (0.017) | (0.043) | (0.015) | |
| Constant | -13.113*** | -10.889* | -23.438 | -12.626*** | -9.120 | -11.545*** |
| (3.861) | (1.888) | (40.709) | (2.185) | (5.450) | (2.030) | |
| FE | YES | YES | YES | YES | YES | YES |
| TE | YES | YES | YES | YES | YES | YES |
| N | 84 | 144 | 24 | 96 | 24 | 60 |
| 0.868 | 0.924 | 0.910 | 0.861 | 0.965 | 0.959 | |
| DW | 1.316 | 0.811 | 1.897 | 0.784 | 1.697 | 1.940 |
Notice: *represents P<0.1, **represents P<0.05, and ***represents P<0.01; Standard errors are in the parentheses; N represents the number of cases.
Disclaimer/Publisher’s Note: The statements, opinions and data contained in all publications are solely those of the individual author(s) and contributor(s) and not of MDPI and/or the editor(s). MDPI and/or the editor(s) disclaim responsibility for any injury to people or property resulting from any ideas, methods, instructions or products referred to in the content. |
© 2023 by the authors. Licensee MDPI, Basel, Switzerland. This article is an open access article distributed under the terms and conditions of the Creative Commons Attribution (CC BY) license (http://creativecommons.org/licenses/by/4.0/).
Copyright: This open access article is published under a Creative Commons CC BY 4.0 license, which permit the free download, distribution, and reuse, provided that the author and preprint are cited in any reuse.


