Submitted:
27 February 2025
Posted:
28 February 2025
You are already at the latest version
Abstract
Population change in high-altitude mountainous areas is influenced by various socio-economic and environmental factors, yet relevant research remains limited. This study examines the key driving forces of population change in high-altitude mountainous areas, using Sichuan Province, China, as a case study, to provide insights for regional planning. By employing Geodetector and spatial autocorrelation analysis, this study evaluates the impact of economic, infrastructure, and healthcare factors on population change based on 14 indicators from the Sichuan Statistical Yearbook. The results indicate that healthcare resources and economic factors are the primary drivers of population change in high-altitude areas. Resident and rural population are most influenced by healthcare resources, while urban population change is driven by both economic and healthcare factors. In recent years, the dominant driving force of population growth has shifted from economic factors to healthcare resources, with high-altitude areas experiencing a higher population growth rate than low-altitude areas. The findings highlight the critical role of healthcare accessibility and economic development in shaping population dynamics in high-altitude areas, providing empirical support for regional development policies.
Keywords:
Population change
; Driving forces
; High-altitude mountainous areas
; Healthcare
; Economic development
1. Introduction
Since the economic reforms and opening up of China in the 1980s, rapid economic development and urbanization have regional disparities in population distribution and economic growth, primarily due to variations in natural conditions. These disparities have strengthened the intricate relationship between population distribution and economic expansion, leading to significant demographic shifts [1,2]. With rising income levels, improved infrastructure, and a booming consumer industry, intercity mobility has surged, driven by convenience and consumption preferences. Beyond traditional economic disparities among cities, factors such as the allocation of educational resources, the quality of public services, and overall living conditions have become increasingly influential in shaping population movements, reflecting a shift toward more diverse and multifaceted migration drivers [3,4].
Current research on population changes focuses on various dimensions, including spatial distribution patterns [5,6], change modes [7,8], driving factors [9,10], and their impacts. Internationally, the trends of internalization and regionalization in population change have garnered increasing attention [11]. In China, with its vast migrant population, research primarily concentrates on interprovincial change and the characteristics of developed urban agglomerations [12]. Data from the seventh national census indicate that since 2010, the new urbanization strategy has accelerated population mobility, with a rising proportion of interprovincial change. However, questions remain regarding the driving factors, differential change pathways, and the underlying complex social relationships [13].
Existing literature primarily focuses on developed urban agglomerations such as the Yangtze River Delta, Pearl River Delta, and Beijing-Tianjin-Hebei region, while paying less attention to interprovincial change characteristics in high-altitude areas and central-western urban clusters [14]. As national policies and local government initiatives promote the rise of central-western urban clusters, their attractiveness to migrants is gradually increasing. Future research should investigate these diverse geographical contexts to comprehensively reveal the population change characteristics in different regions, particularly in complex terrain, providing targeted insights for regional development policies [15].
The driving forces of population change are often conceptualized through the push-pull theory, where the "push" factors from the origin and the "pull" factors from the destination create directional flows. Current research on change motivations can be divided into macro and micro levels. The macro level examines the interplay between population change and regional economic development, considering factors such as spatial distance, economic growth, and policy guidance [16]. In contrast, the micro level focuses on the individual characteristics and psychological logic of decision-makers, exploring the roles of factors like "service availability", "infrastructure", "family strategies" and "lifecycle" [17,18].
Current research methods primarily utilize quantitative and qualitative approaches. Qualitative methods include interviews, surveys, and case studies, drawing on classical theories to gain insights into individual and group change motivations. Quantitative methods employ statistical analysis, spatial panel models, and econometric models, leveraging big data to identify and quantify driving factors. For instance, Kraft analyzes population trajectories using mobile communication and transportation network data [19], while Zhang studies population flow patterns among 328 cities with location-based big data [20]. Liu employs spatial analysis and Geodetector to investigate spatial patterns and drivers of population loss in hilly areas. Additionally, mixed methods that combine quantitative and qualitative data provide a more comprehensive analytical perspective, helping to uncover the complex mechanisms behind population movement [21].
This study focuses on the high-altitude mountainous areas of Sichuan Province to analyze the driving factors behind population change, addressing existing research gaps. While previous studies have examined the effects of t economy, infrastructure, and healthcare on population dynamics, the unique geographic and socioeconomic conditions of high-altitude mountainous areas remain insufficiently explored. The substantial elevation differences and complex topographical diversity in Sichuan introduce additional challenges to understanding population change, particularly in regions above 2,000 meters. To uncover the distinct driving mechanisms of population change in these areas, this study innovatively applies the Geodetector model. Initially, it establishes key variables related to economic conditions, infrastructure, and healthcare, emphasizing their roles in improving living standards and influencing population stability. Fourteen indicators, derived from the Sichuan Statistical Yearbook, were constructed to support the analysis. Finally, the study employs the Geodetector model to assess the impact of various driving factors on resident, urban, and rural populations, with a particular focus on the spatial heterogeneity of urban-rural transitions within high-altitude mountainous areas. This research provides empirical evidence to inform regional development strategies and policy formulation for high-altitude mountainous areas.
2. Materials And Methods
2.1. Study Area
This study focuses on Sichuan Province, China, specifically targeting 42 non-key counties located in high-altitude areas, as shown in Figure 1. These counties have an average altitude exceeding 2,000 meters. The high-altitude areas considered in this study encompass both sub-high-altitude and high-altitude areas. According to data from China's Seventh National Census, Sichuan Province has a total population of 83,674,866. Sichuan spans several major geomorphological units, including the Qinghai-Tibet Plateau, the Hengduan Mountains, the Yunnan-Guizhou Plateau, the Qinba Mountains, and the Sichuan Basin. The province’s terrain slopes from high in the west to low in the east, with mountainous areas as its primary feature. The average altitude of Sichuan is 2,598 meters. The highest average altitude is found in the Garzê Tibetan Autonomous Prefecture at 4,192 meters, while the lowest is in Suining City at 362 meters. The province's highest point is located at the main peak of Mount Gongga in Kangding City, Garzê Tibetan Autonomous Prefecture, with an altitude of 7,526 meters, while the lowest point is in Yulin Town, Linshui County, Guang'an City, at 188 meters above sea level. Sichuan Province possesses various human and environmental conditions relevant to the research.
2.2. Geographic mapping
The map information of Sichuan Province was obtained from the National Basic Geographic Information Center, based on the 1:1,000,000 administrative division map in 2020.
2.3. Indicator system and data source
2.3.1. Dependent variables: resident population, urban population, rural population
This study focuses on three primary research subjects: resident population, urban population, and rural population. According to the Seventh National Population Census Bulletin, the resident population includes individuals who reside in a given township or sub-district and either hold household registration (hukou) within the same area or have an undetermined household registration status. It also includes individuals who have left their registered household location for over six months but are residing in the township or sub-district, as well as those temporarily studying or working abroad. The resident population reflects the actual number of people living in a region at the statistical reference time, serving as a key indicator for assessing population distribution, labor supply, and resource allocation within the area. Based on the Regulations on the Statistical Division of Urban and Rural Areas, the urban population comprises residents living in cities or towns, whereas the rural population includes individuals residing outside urban areas. This classification primarily depends on residential location and occupational industry. The urban population is a critical metric for measuring urbanization levels, economic development, and social structural changes. As economic growth and urbanization progress, the proportion of urban residents typically increases. Conversely, rural population data are essential for planning rural infrastructure, formulating agricultural policies, managing rural poverty, and developing public services such as education and healthcare. Together, these three population statistics provide an objective and comprehensive reference for social resource allocation and economic development.
2.3.2. Independent variables: Economy, Infrastructure, Healthcare
As shown in Table 1, this study evaluates the impact of three key dimensions—economy, infrastructure, and healthcare—on population dynamics. To determine the relevant influencing factors, we conducted a comprehensive review of existing literature. The findings indicate that population changes in high-altitude mountainous areas are driven by 14 specific indicators across these three dimensions, highlighting the multifaceted nature of demographic shifts in such areas.
To ensure a comprehensive and systematic selection of indicators, we employed a two-step screening process. First, we identified potential factors influencing population changes based on existing literature. This included factors proposed in prior studies [22,23,24,25]and the evaluation criteria for urban development in China [26]. Second, we refined the list by applying criteria of scientific rigor and data usability, narrowing the selection to the most relevant and measurable indicators. As a result, we identified 14 specific indicators as independent variables. Economic factors (8): Gross Regional Domestic Product, Primary Industry Production Value, Secondary Industry Production Value, Tertiary Industry Production Value, Local Public Finance Revenue, Total Retail Sales of Consumer Goods, Urban Residents Average Disposable Income, Farmers and Herdsmen Average Disposable Income. Infrastructure factors (3): Investment in Fixed Assets of the Whole Society, Number of Primary Schools, Number of General Secondary Schools. Healthcare factors (3): Number of Hospitals and Health Centers, Number of Beds in Hospitals and Health Centers, Number of Health Personnel in Health Facilities.
2.4. Methods
2.4.1. Spatial autocorrelation
Spatial autocorrelation is a statistical method used to measure the distributional characteristics and interrelationships of spatial data [27]. The basic idea is that there may be some kind of dependence or similarity between data values at spatially neighboring or close locations, and this dependence or similarity will be weakened or disappeared with the increase of distance [28]. Spatial autocorrelation can be divided into two types: global spatial autocorrelation and local spatial autocorrelation.
Global spatial autocorrelation is a comprehensive measure of spatial data across the entire study area, which is used to reflect whether the spatial data show a tendency to be clustered or discrete and the strength and significance of this tendency [29]. Moran’s I index is the most commonly used one [30], and its formula is:
In the formula: n is the total number of spatial units; is the average value of all observations; and are the observed values of spatial units i and j; is the spatial weight matrix, which indicates the spatial relationship between spatial units i and j. When the value of I is greater than 0, it indicates positive spatial correlation and the aggregation trend of “high - high, low - low” between neighboring elements; when the value of I is less than 0, it indicates negative spatial correlation, i.e., the distribution trend of “high - low, low - low” between neighboring elements; when the value of I is close to 0, it indicates random spatial distribution and no correlation. When the value of I is close to 0, it indicates a random spatial distribution without correlation.
Local spatial autocorrelation is an indicator for analyzing the spatial data of different areas or units in the study area, which is used to reflect the degree and significance of spatial difference between each area or unit and its surrounding area. The commonly used indicator is the Local Moran’s I index [28], with the formula:
It can be used to identify different types of spatial clustering or dispersion phenomena such as high value clustered areas, low value clustered areas, high and low outliers, and low and high outliers that exist in the study area.
Spatial autocorrelation is commonly used to analyze the spatial distribution patterns of road traffic [31], disease distribution [32], etc. For example, Zhu Mingfei [33] revealed the spatial clustering characteristics of COD emissions and their trends over time in Chinese provinces through spatial autocorrelation analysis, which provided an important basis for understanding the geographical distribution and driving factors of COD emissions.
2.4.2. Geodetector
Geodetector is a statistical method proposed by Jinfeng Wang et al. to detect spatially stratified heterogeneity and reveal the driving factors behind it [34]. Its strength lies in its ability to detect two main types of spatial variability: one is the interaction between factors and the other is the heterogeneity within factors. By analyzing this spatial variability, Geodetector can quantitatively assess the explanatory power of individual factors in spatial data for the target variable.
Geodetector consists of four main modules: the divergence and factor detector, the interaction detector, the risk zone detector, and the ecological detector [34]. By calculating and comparing the q-value of each single factor, their explanatory power for spatial dissimilarity can be judged, with larger q-values indicating stronger explanatory power. q-values are calculated using the following formula [35]:
In the formula: h=1,...,L represents the stratification of variable Y or factor X, which refers to classification or partitioning. and N denote the number of units in layer h and the entire region, respectively. and signify the variances of Y values in layer h and the entire region, respectively. and stand for Within Sum of Squares and the Total Sum of Squares, respectively. Currently, this technology is widely used in many fields such as geography, environmental science, ecology, and socio-economics, and is an important part of modern geographic information technology [33]. For example, Zhu Yaoyao used geographic probes to analyze and quantify the various driving factors affecting changes in Shanghai's urban open space, revealing the dominant role of socioeconomic factors[37].
This study examines the driving factors behind population changes in high-altitude mountainous areas. As shown in Figure 2, a two-step approach was implemented to identify the independent variables, which span three dimensions—economy, infrastructure, and healthcare—comprising a total of 14 specific indicators. Subsequently, the Geodetector method was applied to evaluate the impact of these indicators on the resident, urban, and rural populations in high-altitude mountainous areas. This analytical framework uncovers the underlying patterns and characteristics of urbanization in mountainous areas, providing insights into the spatial dynamics of population distribution and migration trends.
3. Results
3.1. The Spatial Distribution Analysis of Population
3.1.1. Spatial Distribution of Population
As shown in Figure 3, the spatial distribution of the county-level administrative population in Sichuan Province, China, in 2023 exhibits a significant imbalance, with the population in the eastern area being markedly higher than in the western area, and the highest concentration in the central-eastern area. The spatial distribution of the county-level population closely correlates with altitude patterns. In low-altitude areas, the central area of Sichuan Province has the highest resident population, ranging from 1,136,000 to 275,400. In low-altitude and sub-high-altitude areas, the resident population in the northeastern and southern area of Sichuan Province is relatively high, ranging from 190,000 to 1,136,000. In sub-high-altitude and high-altitude areas, the resident population is the lowest, ranging from 25,000 to 190,000. These findings indicate that high-altitude areas of Sichuan Province exhibit the lowest overall population density, highlighting the influence of altitude on demographic distribution.
3.1.2. Analysis of Population Growth Rate
This study employed one-way analysis of variance (ANOVA) to compare two experimental groups: the average population growth rate of non-key counties in high-altitude areas of Sichuan Province from 2012 to 2022 and the average population growth rate of non-key counties in middle- and low-altitude areas of Sichuan Province. As shown in Table 2, the one-way ANOVA results indicate a significant difference in the average population growth rates between the two altitude areas, F (1,108) = 62.904, p = 0.000, η² = 0.368. The mean population growth rate for non-key high-altitude counties was M = 0.01±0.01, while that for non-key middle- and low-altitude counties was M = -0.01±0.01. These results demonstrate a significant difference in average population growth rates between high-altitude and middle- to low-altitude areas (p < 0.05), indicating that the average population growth rate in high-altitude areas is significantly higher than that in middle- and low-altitude areas.
3.2 Spatial Autocorrelation Analysis of Population
In 2023, the spatial analysis of county-level population distribution in Sichuan Province revealed that the global spatial autocorrelation analysis indicated a significant positive correlation (Moran’s I = 0.535, p = 0.000). Figure 4 presents the LISA cluster map of the county-level population distribution in Sichuan Province, showing a distinct spatial pattern characterized by high-high clustering in the eastern area and low-low clustering in the western area. Additionally, some high-low outlier areas are observed in the central and eastern areas, while some low-high outlier areas appear in the southern area. The results indicate that the high-high clustering areas are in the high-altitude western area of Sichuan Province, whereas the low-low clustering areas are found in the low-altitude eastern area of Sichuan Province.
3.3. Identification of driving forces
3.3.1. The Driving Influences of Economy, Infrastructure, and Healthcare
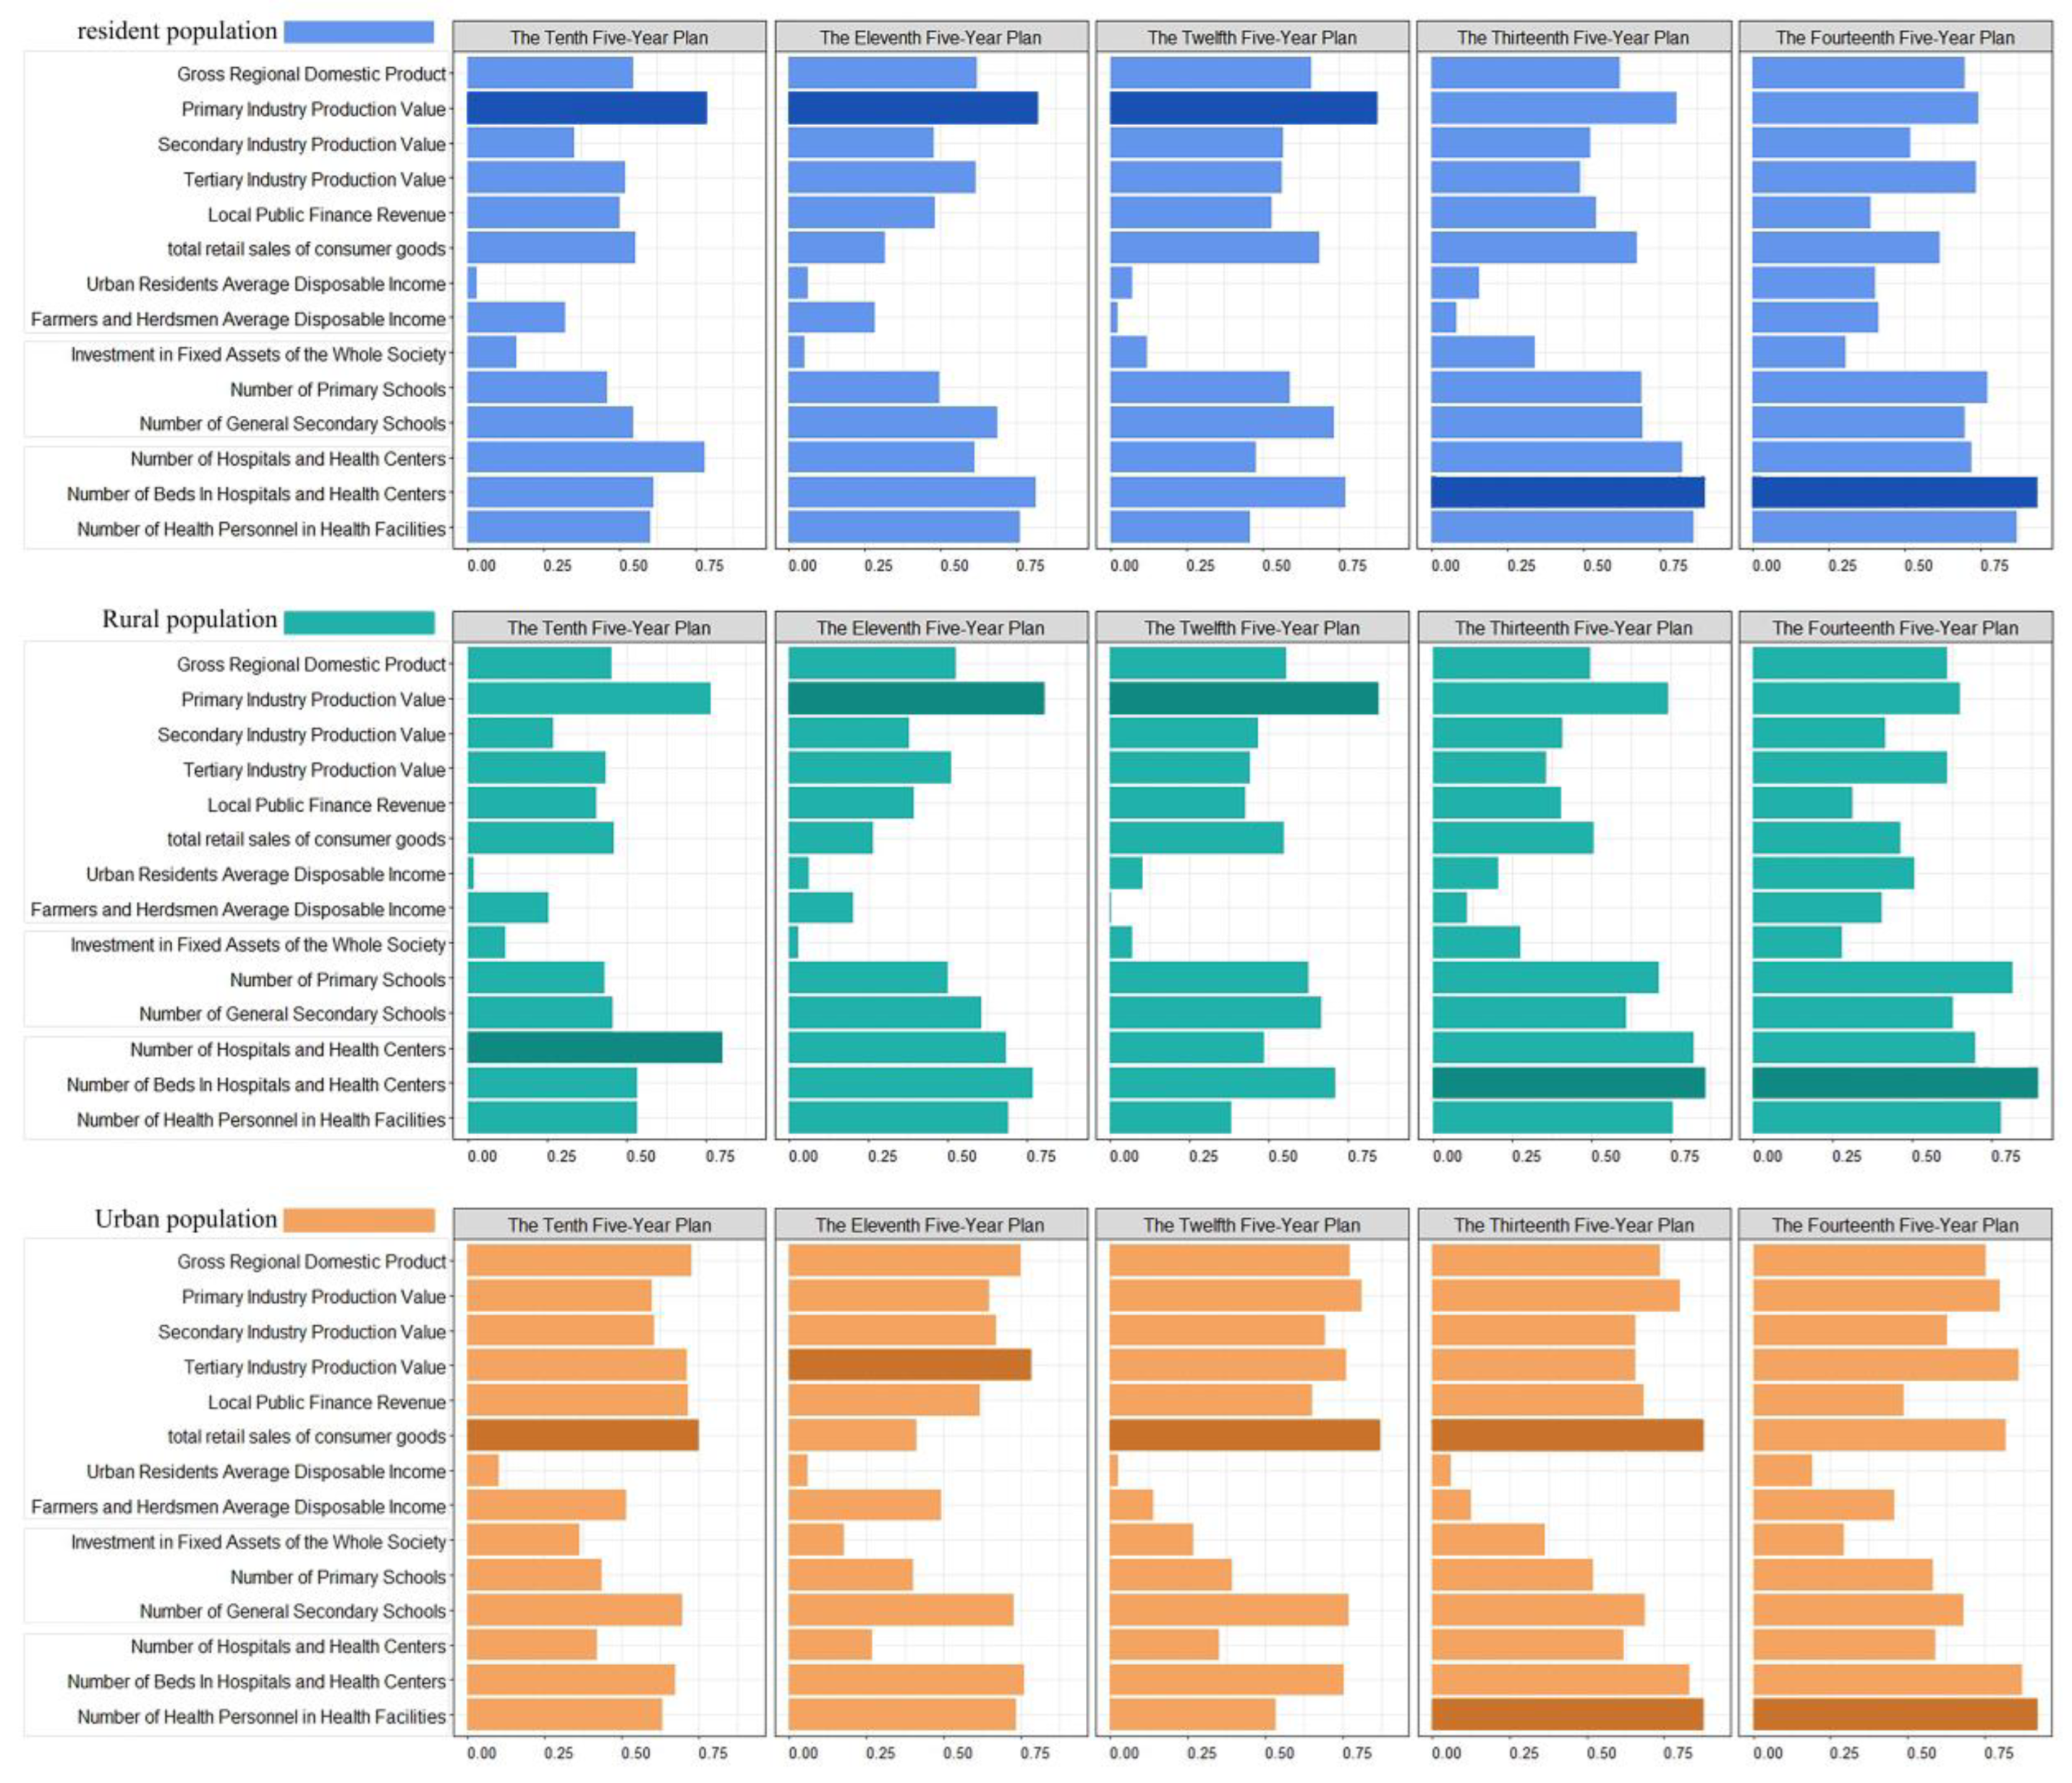
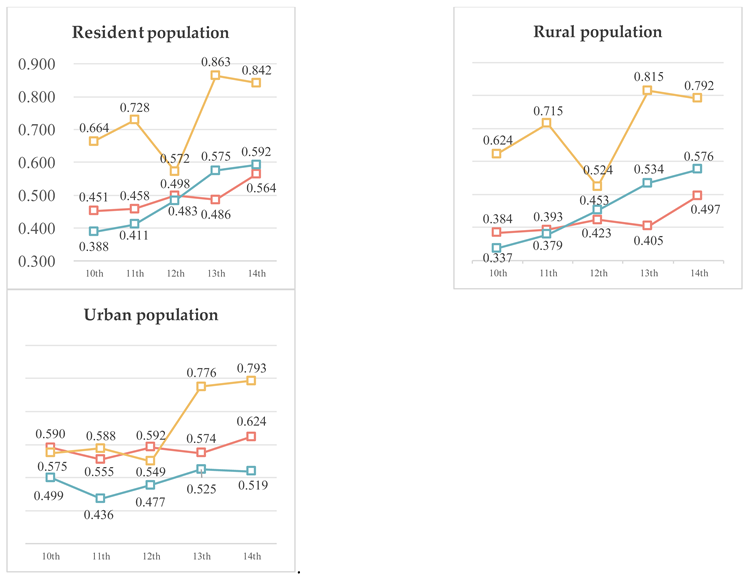
According to the results of the Geodetector analysis (Figure 5), in mountainous areas with an average altitude greater than 2000m, medical facilities are the primary driving factor for both the resident population and rural population, while the main driving factors for the urban population are medical facilities and the economy, as shown in Figure 5. From the Tenth Five-Year Plan period to the Fourteenth Five-Year Plan period, the most influential driving factor for the resident population was medical facilities, with the highest average q-value reaching 0.86 during the Thirteenth Five-Year Plan period. Similarly, for the rural population, medical facilities remained the dominant driving factor, with the highest average q-value of 0.81 during the Thirteenth Five-Year Plan period. For the urban population, from the Tenth to the Twelfth Five-Year Plan periods, the primary driving factor was the economy, with an average q-value peaking at 0.59, while the second most influential factor was medical facilities, also with an average q-value of 0.59. However, from the Thirteenth to the Fourteenth Five-Year Plan periods, medical facilities became the primary driving factor for the urban population, with the highest average q-value of 0.79. These findings indicate that healthcare and economy factors are the primary drivers influencing population dynamics in mountainous areas with an average altitude exceeding 2,000 meters.
3.3.2. Indicators of individual effect
Using factor detection analysis within the Geodetector framework, the results indicate that all 14 indicators significantly influence the population distribution in county-level administrative areas at altitudes above 2000m (p < 0.05), with varying impacts across different Five-Year Plan periods, as shown in Table 3. During the tenth, Eleventh, and Twelfth Five-Year Plan periods, the primary driving factor for the resident population was the Primary Industry Production Value, with the highest q-value reaching 0.880. In contrast, during the Thirteenth and Fourteenth Five-Year Plan periods, the most influential factor for the resident population shifted to the number of beds in hospitals and health centers, with a maximum q-value of 0.937. From 2001 to 2005, the primary driving factor for the rural population was the number of hospitals and health centers, with a q-value of 0.804.
During the Tenth, Eleventh, and Twelfth Five-Year Plan periods, the dominant factor for rural population growth remained primary industry production value, with a q-value peaking at 0.844. However, in the Thirteenth and Fourteenth Five-Year Plan periods, the primary driving factor for the rural population shifted back to the number of hospitals and health centers, with a q-value of 0.896. For the urban population, during the Tenth Five-Year Plan period, the most influential factor was total retail sales of consumer goods, with a maximum q-value of 0.726. In the Eleventh Five-Year Plan period, the primary driving factor became tertiary industry production value, with the highest q-value of 0.785. During the Twelfth and Thirteenth Five-Year Plan periods, total retail sales of consumer goods emerged as the dominant factor again, reaching a peak q-value of 0.877. Finally, during the Thirteenth and Fourteenth Five-Year Plan periods, the most influential factor for urban population distribution was the number of health personnel in health facilities, with a maximum q-value of 0.819. From 2001 to 2023, the Geodetector analysis revealed that among county-level administrative areas at altitudes above 2000m, all 14 indicators had a significant impact on population distribution. The primary driving factors for resident, rural, and urban populations evolved over time. The resident population's key driving factor transitioned from primary industry production value to the number of hospital beds. For the rural population, the main factors were the number of hospitals and health centers and primary industry production value. Meanwhile, for the urban population, the dominant driving factors were total retail sales of consumer goods, the number of health personnel in health facilities, and tertiary industry production value.

Table 4.
The Values of Factor Detection for Economy, Infrastructure, and Healthcare.
| Five Year Plan |
Population | Result | Economy | Infrastructure | Healthcare | ||||||||||||
|---|---|---|---|---|---|---|---|---|---|---|---|---|---|---|---|---|---|
| E1 | E2 | E3 | E4 | E5 | E6 | E7 | E8 | I1 | I2 | I3 | H1 | H2 | H3 | ||||
| 10th | Resident population | q | 0.544 | 0.789 | 0.350 | 0.519 | 0.502 | 0.554 | 0.032 | 0.322 | 0.160 | 0.460 | 0.544 | 0.779 | 0.611 | 0.601 | |
| p | 0.000 | 0.000 | 0.000 | 0.000 | 0.000 | 0.000 | 0.172 | 0.000 | 0.000 | 0.000 | 0.000 | 0.000 | 0.000 | 0.000 | |||
| Rural population |
q | 0.455 | 0.768 | 0.270 | 0.434 | 0.407 | 0.461 | 0.021 | 0.254 | 0.121 | 0.433 | 0.458 | 0.804 | 0.535 | 0.533 | ||
| p | 0.000 | 0.000 | 0.000 | 0.000 | 0.000 | 0.000 | 0.372 | 0.000 | 0.000 | 0.000 | 0.000 | 0.000 | 0.000 | 0.000 | |||
| Urban Population |
q | 0.726 | 0.596 | 0.605 | 0.712 | 0.717 | 0.751 | 0.101 | 0.514 | 0.364 | 0.435 | 0.698 | 0.419 | 0.674 | 0.631 | ||
| p | 0.000 | 0.000 | 0.000 | 0.000 | 0.000 | 0.000 | 0.000 | 0.000 | 0.000 | 0.000 | 0.000 | 0.000 | 0.000 | 0.000 | |||
| 11th | Resident population | q | 0.617 | 0.819 | 0.477 | 0.614 | 0.480 | 0.316 | 0.061 | 0.283 | 0.051 | 0.497 | 0.686 | 0.612 | 0.813 | 0.759 | |
| p | 0.000 | 0.000 | 0.000 | 0.000 | 0.000 | 0.000 | 0.014 | 0.000 | 0.234 | 0.000 | 0.000 | 0.000 | 0.000 | 0.000 | |||
| Rural population |
q | 0.525 | 0.804 | 0.379 | 0.510 | 0.394 | 0.264 | 0.064 | 0.204 | 0.029 | 0.500 | 0.606 | 0.686 | 0.769 | 0.691 | ||
| p | 0.000 | 0.000 | 0.000 | 0.000 | 0.000 | 0.000 | 0.010 | 0.000 | 0.488 | 0.000 | 0.000 | 0.000 | 0.000 | 0.000 | |||
| Urban Population |
q | 0.749 | 0.648 | 0.672 | 0.785 | 0.617 | 0.413 | 0.060 | 0.493 | 0.177 | 0.400 | 0.729 | 0.268 | 0.762 | 0.735 | ||
| p | 0.000 | 0.000 | 0.000 | 0.000 | 0.000 | 0.000 | 0.015 | 0.000 | 0.000 | 0.000 | 0.000 | 0.000 | 0.000 | 0.000 | |||
| 12th | Resident population | q | 0.661 | 0.880 | 0.568 | 0.565 | 0.530 | 0.688 | 0.071 | 0.023 | 0.119 | 0.592 | 0.738 | 0.481 | 0.774 | 0.459 | |
| p | 0.000 | 0.000 | 0.000 | 0.000 | 0.000 | 0.000 | 0.009 | 0.371 | 0.003 | 0.000 | 0.000 | 0.000 | 0.000 | 0.000 | |||
| Rural population |
q | 0.555 | 0.844 | 0.467 | 0.440 | 0.426 | 0.548 | 0.102 | 0.004 | 0.070 | 0.625 | 0.663 | 0.484 | 0.708 | 0.380 | ||
| p | 0.000 | 0.000 | 0.000 | 0.000 | 0.000 | 0.000 | 0.000 | 0.950 | 0.058 | 0.000 | 0.000 | 0.000 | 0.000 | 0.000 | |||
| Urban Population |
q | 0.775 | 0.813 | 0.695 | 0.761 | 0.653 | 0.872 | 0.027 | 0.139 | 0.269 | 0.393 | 0.769 | 0.354 | 0.756 | 0.536 | ||
| p | 0.000 | 0.000 | 0.000 | 0.000 | 0.000 | 0.000 | 0.252 | 0.000 | 0.000 | 0.000 | 0.000 | 0.000 | 0.000 | 0.000 | |||
| 13th | Resident population | q | 0.619 | 0.805 | 0.524 | 0.488 | 0.540 | 0.675 | 0.156 | 0.082 | 0.338 | 0.692 | 0.695 | 0.827 | 0.900 | 0.863 | |
| p | 0.000 | 0.000 | 0.000 | 0.000 | 0.000 | 0.000 | 0.009 | 0.006 | 0.000 | 0.000 | 0.000 | 0.000 | 0.000 | 0.000 | |||
| Rural population |
q | 0.497 | 0.744 | 0.408 | 0.358 | 0.407 | 0.509 | 0.208 | 0.107 | 0.278 | 0.714 | 0.610 | 0.826 | 0.861 | 0.757 | ||
| p | 0.000 | 0.000 | 0.000 | 0.000 | 0.000 | 0.000 | 0.000 | 0.000 | 0.000 | 0.000 | 0.000 | 0.000 | 0.000 | 0.000 | |||
| Urban Population |
q | 0.737 | 0.800 | 0.658 | 0.656 | 0.683 | 0.877 | 0.060 | 0.125 | 0.367 | 0.519 | 0.688 | 0.618 | 0.831 | 0.877 | ||
| p | 0.000 | 0.000 | 0.000 | 0.000 | 0.000 | 0.000 | 0.020 | 0.000 | 0.000 | 0.000 | 0.000 | 0.000 | 0.000 | 0.000 | |||
| 14th | Resident population | q | 0.696 | 0.742 | 0.518 | 0.736 | 0.387 | 0.616 | 0.401 | 0.414 | 0.306 | 0.771 | 0.698 | 0.719 | 0.937 | 0.869 | |
| p | 0.000 | 0.000 | 0.000 | 0.000 | 0.000 | 0.000 | 0.000 | 0.000 | 0.000 | 0.000 | 0.000 | 0.000 | 0.000 | 0.000 | |||
| Rural population |
q | 0.611 | 0.651 | 0.415 | 0.610 | 0.312 | 0.463 | 0.507 | 0.404 | 0.280 | 0.818 | 0.629 | 0.700 | 0.896 | 0.780 | ||
| p | 0.000 | 0.000 | 0.000 | 0.000 | 0.000 | 0.000 | 0.000 | 0.000 | 0.000 | 0.000 | 0.000 | 0.000 | 0.000 | 0.000 | |||
| Urban Population |
q | 0.753 | 0.799 | 0.626 | 0.861 | 0.486 | 0.817 | 0.192 | 0.456 | 0.295 | 0.581 | 0.680 | 0.591 | 0.870 | 0.919 | ||
| p | 0.000 | 0.000 | 0.000 | 0.000 | 0.000 | 0.000 | 0.007 | 0.000 | 0.000 | 0.000 | 0.000 | 0.000 | 0.000 | 0.000 | |||
Figure 6.
Evolution of Driving Factors Across Five-Year Plans.
4. Discussion
Our findings demonstrate that the population density of county-level administrative areas in low- and mid-altitude areas is higher than that in high-altitude mountainous areas. However, the average population growth rate in low- and mid-altitude county-level areas is lower than that in high-altitude mountainous areas, exhibiting a significant difference. The study reveals that the primary driving factors influencing population dynamics in high-altitude mountainous areas are healthcare and economic factors. Key indicators include primary industry production value, total retail sales of consumer goods, tertiary industry production value, number of beds in hospitals and health centers, number of hospitals and health centers, and number of health personnel in health facilities. Additionally, our research confirms that the dominant driving factors and their corresponding indicators vary across different periods.
The study reveals that population density is higher in low-altitude areas compared to medium- to high-altitude mountainous areas. However, the population growth rate is lower in low-altitude areas than in high-altitude areas, indicating significant geographic disparities in population dynamics. This finding is consistent with previous studies on the relationship between population distribution and altitude [39,40,41,42]. Low-altitude areas tend to attract more population concentration due to their favorable geographical conditions, convenient transportation, and suitable climate [41]. In contrast, high-altitude areas have relatively slow population growth due to relatively harsh natural conditions [42]. Regarding the difference in population growth rates, it may be due to the fact that population growth is constrained by more social and economic factors in low-altitude areas due to their relatively developed economy and higher level of urbanization [43].
Studies have shown that healthcare is the most crucial factor influencing changes in both the resident population and the rural population. In urban areas, economic and healthcare factors together serve as the primary drivers of population change. This finding is consistent with the existing literature on the impact of medical facilities on population change [44,45,47]. The degree of improvement of medical facilities is directly related to the quality of life and health protection of residents, and therefore becomes an important factor affecting population movement and distribution [6]. In both resident and rural populations, the convenience and accessibility of medical facilities are particularly important, influencing people's residential choices and migration decisions [45]. For urban populations, the dual influence of economic and medical facilities reflects the higher pursuit of quality of life and health protection in the urbanization process [46,47].
With the development of the times, the biggest influencing factor for the growth of resident population changed from primary industry production value to the number of beds in hospitals and health centers. This result presents some differences compared to previous studies. Earlier studies focused more on the influence of economic factors such as primary industry production value on population movement [48,49,50]. However, with the progress of society and the improvement of people's living standards, people's demand for quality of life has been increasing, and medical resources have become one of the important factors attracting the resident population [44]. This finding coincides with the findings of Li Tuo [46] on the drivers of urban population migration, further confirming the importance of medical resources in modern urban life.
The results of the study showed that the biggest driver influences of rural population growth experienced a change from the number of hospitals and health centers to the primary industry production value to the number of beds in hospitals and health centers. This suggests that the importance of healthcare resources and services is increasing in rural areas where residents' needs for quality of life and public services are becoming more prominent [51]. Previous studies may have focused more on the impact of primary industry production value, such as agriculture, on rural population growth [52,53]. However, with the improvement of healthcare conditions and people's health awareness, the influence of healthcare resources and services in rural areas is gradually increasing [54].
In urban areas, the most driving influencing factor of population growth has undergone a change from total retail sales of consumer goods to tertiary industry production value, back to total retail sales of consumer goods, and finally to the number of health personnel in health facilities. This change indicates that the influencing factors of population mobility in towns and cities are complex and variable [55,56], but the number of health personnel in health facilities gradually becomes the determining factor. This finding is somewhat different from previous studies. Past studies may have focused more on the influence of economic factors such as total retail sales of consumer goods and tertiary industry production value on urban population growth [57]. However, with the acceleration of urbanization and changes in people's lifestyles, the influence of the number of health personnel in health facilities, as one of the most important indicators of the level of health care services, has gradually emerged [58,59]. This finding not only reflects the new characteristics of urban population mobility, but also provides a new perspective for urban planning and development.
The limitations of this study lie in the exclusive use of quantitative statistical data to analyze the driving factors of population changes in high-altitude areas, without considering the impact of administrative policies implemented through five-year planning and construction initiatives. Additionally, certain potential driving factors may have been overlooked due to the unavailability of data under current technological conditions. Future research will first expand the database of driving factors, incorporating more comprehensive data for analysis. Furthermore, the study will integrate an assessment of the influence of administrative policies to enhance the overall comprehensiveness and scientific rigor of the research.
5. Conclusions
This study analyzes the driving forces of population change in high-altitude mountainous areas of Sichuan Province. The findings indicate that low-altitude areas exhibit higher population densities but lower growth rates, whereas high-altitude areas demonstrate the opposite trend. Through Geodetector model analysis, healthcare and economic factors are identified as the primary drivers of population change in high-altitude areas. Key indicators include primary industry production value, total retail sales of consumer goods, tertiary industry production value, number of beds in hospitals and health centers, number of hospitals and health centers, and number of health personnel in health facilities. These driving factors evolve over time, reflecting changes in socioeconomic development and public services. The role of healthcare infrastructure in population stability and growth has become increasingly prominent. The primary factor influencing resident population growth has shifted from primary industry production value to the number of beds in hospitals and health centers. For rural populations, the dominant influence alternates between economic and healthcare factors, whereas urban populations have transitioned from being primarily driven by economic factors to being increasingly shaped by healthcare resources. This study acknowledges certain limitations, including the lack of consideration for the impact of administrative policies, such as Five-Year Plans, and the exclusion of some potential driving factors due to data limitations. Future research should expand the dataset and enhance policy impact analysis. Overall, this study provides empirical support for regional development and policy formulation, highlighting the critical role of economic and healthcare factors in population change. The findings offer new perspectives for optimizing public services and promoting sustainable development in high-altitude areas.
Author Contributions
Data curation, X. D.; Formal analysis, X. D.; Funding acquisition M. D.; Investigation, X. D.; Methodology, X. D.; Project administration, S. Z.; Resources, X. D.; Software, X. D.; Supervision, X. D.; Validation, X. D.; Investigation, X. D.; Visualization, X. D.; Writing-original draft preparation, X. D.; Writing-review and editing, X. D.; All authors have read and agreed to the published version of the manuscript.
Funding
This research was funded by Tianjin University Science and Technology Innovation Leading Talent Cultivation "Qiming Plan" (Program No. 2024XQM-0025).
Data Availability Statement
Data are available with the corresponding author and can be shared upon reasonable request.
Acknowledgments
The authors would like to thank the anonymous reviewers for their constructive comments on improving this research.
Conflicts of Interest
The authors declare no conflict of interest.
References
- He, C.; Chen, T. Economic transition, urbanization and population redistribution in China. Habitat Int. 2016, 51, 39-47. [CrossRef]
- Wang, Y. Migration patterns in China extracted from mobile positioning data. Habitat Int. 2019, 86, 71-80. [CrossRef]
- Liu, Y.; Stillwell, J. Interprovincial migration, regional development and state policy in China,1985 - 2010. Appl. Spat. Anal. 2014, 7, 47 -70. [CrossRef]
- Gu, H.; Liu, Z. Modelling interprovincial migration in China from 1995 to 2015 based on an eigenvector spatial filtering negative binomial model. Popul. Space Place 2019, 25, e2253. [CrossRef]
- Li, J.; Li, J. Spatiotemporal distribution characteristics and mechanism analysis of urban population density: A case of Xi’an, Shaanxi, China. Cities 2019, 86, 62-70. [CrossRef]
- Liang, Z.; Li, Z. Changing Patterns of the Floating Population in China, 2000–2010. Popul. Dev. Rev. 2014, 40, 695–716. [CrossRef]
- Qi, W. China’s Different Spatial Patterns of Population Growth Based on the “Hu Line.” J. Geogr. Sci. 2016, 26, 1611–1625. [CrossRef]
- Pan, J.; Lai, J. Spatial Pattern of Population Mobility Among Cities in China: Case Study of the National Day Plus Mid-Autumn Festival Based on Tencent Migration Data. Cities 2019, 94, 55–69. [CrossRef]
- Wu, J.W. Changing Distribution of Migrant Population and Its Influencing Factors in Urban China: Economic Transition, Public Policy, and Amenities. Habitat Int. 2019, 94, 102063. [CrossRef]
- Liu, J.; Yin, M. Long-Term Impacts of Urbanization Through Population Migration on China’s Energy Demand and CO₂ Emissions. Mitig. Adapt. Strateg. Glob. Change 2020, 25, 1053–1071. [CrossRef]
- Park, S.; Lee, K. A Markov Chain Model for Population Distribution Prediction Considering Spatio-Temporal Characteristics by Migration Factors. J. Econ. Geogr. Soc. Korea 2019, 22, 351–365. [CrossRef]
- Luo, J.; Zhang, X. Urban Land Expansion and the Floating Population in China: For Production or for Living? Cities 2018, 74, 219–228. [CrossRef]
- Ding, H.; Liu, Z. Areal Differentiation of Inter-Provincial Migration in China and Characteristics of the Flow Field. Acta Geogr. Sin. 2005, 60, 106–114. [CrossRef]
- Wang, J.; Li, H. Approaches to Census Mapping: Chinese Solution in 2010 Rounded Census. Chinese Geogr. Sci. 2012, 22, 356–366. [CrossRef]
- Wang, L.; Xue, C. Spatio-Temporal Characteristics and Influencing Factors of Urban Floating Population in China from 2011 to 2015. Chinese J. Popul. Resour. Environ. 2019, 17, 359–373. [CrossRef]
- Wang, X.; Gao, X. The Evolution of China’s Floating Population and Its Impact on Urbanization: A Comparative Analysis Based on Inter- and Intra-Provincial Perspectives. Scientia Geogr. Sinica 2019, 39, 1866–1874. [CrossRef]
- Black, R.; Bellagamba, A. Migration Drivers and Migration Choice: Interrogating Responses to Migration and Development Interventions in West Africa. CMS 2022, 10, 10. [CrossRef]
- Zhou, J.; Hui, C. Housing Prices, Migration, and Self-Selection of Migrants in China. Habitat Int. 2022, 119, 102479. [CrossRef]
- Kraft, S.; Halás, M. Functional Regions as a Platform to Define Integrated Transport System Zones: The Use of Population Flows Data. Appl. Geogr. 2022, 144, 102732. [CrossRef]
- Zhang, W.; Chong, Z. Spatial Patterns and Determinant Factors of Population Flow Networks in China: Analysis on Tencent Location Big Data. Cities 2020, 99, 102640. [CrossRef]
- Liu, Y.; Zhang, X. Spatial Patterns and Driving Factors of Rural Population Loss Under Urban–Rural Integration Development: A Micro-Scale Study on the Village Level in a Hilly Region. Land 2022, 11, 99. [CrossRef]
- Li, W.; Li, X. Influences of Population Pressure Change on Vegetation Greenness in China’s Mountainous Areas. Ecol. Evol. 2017, 7, 9041–9053. [CrossRef]
- Ma, C.; He, Y. Spatiotemporal Trends and Ecological Determinants in Population by Elevation in China Since 1990. Chinese Geogr. Sci. 2021, 31, 248–260. [CrossRef]
- Zhu, F.; Fang, Y. Effects of Altitude on County Economic Development in China. J. Mountain Sci. 2018, 15, 406–418. [CrossRef]
- The National Population Census Data. The Seventh National Population Census Report. Available online: https://www.gov.cn/guoqing/2021-05/13/content_5606149.htm (accessed on February 14, 2025).
- Sichuan Bureau of Statistics. Sichuan Statistical Yearbook. Available online: http://tjj.sc.gov.cn/scstjj/tjgb/jump.shtml (accessed on February 14, 2025).
- Getis, A. Handbook of applied spatial analysis: Software tools, methods and applications, 1st ed.; Springer: Berlin, Germany, 2009; pp. 255-278.
- Dale, M.R.T.; Fortin, M.J. Spatial Autocorrelation and Statistical Tests: Some Solutions. J. Agric. Biol. Environ. Stat. 2009, 14, 188–206. [CrossRef]
- Ping, J.L.; Green, C.J. Exploring Spatial Dependence of Cotton Yield Using Global and Local Autocorrelation Statistics. Field Crops Res. 2004, 89, 219–236.
- Tiefelsdorf, M. Some Practical Applications of Moran's I’s Exact Conditional Distribution. Papers Reg. Sci. 1998, 27, 985–999. [CrossRef]
- Gedamu, W.T. A Spatial Autocorrelation Analysis of Road Traffic Crash by Severity Using Moran’s I Spatial Statistics: A Comparative Study of Addis Ababa and Berlin Cities. Accid. Anal. Prev. 2024, 200, 107535. [CrossRef]
- Tsai, P.J.; Lin, M.L. Spatial Autocorrelation Analysis of Health Care Hotspots in Taiwan in 2006. BMC Public Health 2009, 9, 464. [CrossRef]
- Zhu, M.F.; Yu, X. Spatiotemporal Characteristics and Driving Factors of Chemical Oxygen Demand Emissions in China’s Wastewater: An Analysis Based on Spatial Autocorrelation and Geodetector. Ecol. Indic. 2024, 166, 112308. [CrossRef]
- Wang, J.F.; Xu, C.D. Geodetector: Principle and Prospective. Acta Geogr. Sin. 2017, 72, 116–134. [CrossRef]
- Wang, J.F.; Li, X.H.; Christakos, G.; et al. Geographical Detectors-Based Health Risk Assessment and Its Application in the Neural Tube Defects Study of the Heshun Region, China. Int. J. Geogr. Inf. Sci. 2010, 24, 107–127. [CrossRef]
- Lou, C.R.; Liu, H.Y. Socioeconomic Drivers of PM2.5 in the Accumulation Phase of Air Pollution Episodes in the Yangtze River Delta of China. Int. J. Environ. Res. Public Health 2016, 13, 928. [CrossRef]
- Li, X.; Xie, Y. Influence of Planting Patterns on Fluoroquinolone Residues in the Soil of an Intensive Vegetable Cultivation Area in Northern China. Sci. Total Environ. 2013, 458, 63–69. [CrossRef]
- Zhu, Y.; Ling, G. Driving Forces and Prediction of Urban Open Spaces Morphology: The Case of Shanghai, China Using Geodetector and CA-Markov Model. Ecol. Informatics 2024, 82, 102763. [CrossRef]
- Cohen, J.E.; Small, C. Hypsographic Demography: The Distribution of Human Population by Altitude. Proc. Natl. Acad. Sci. USA 1998, 95, 14009–14014. [CrossRef]
- Ma, C.; He, Y. Spatiotemporal Trends and Ecological Determinants in Population by Elevation in China Since 1990. Chinese Geogr. Sci. 2021, 31, 248–260. [CrossRef]
- Mi, R.; Gai, X. Factors Influencing Population Distribution in Shaanxi Province Using Spatial Econometric Analysis. Arid Land Geogr. 2020, 43, 491–498.
- Brown, E.R.; Giussani, D.A. Cause of Fetal Growth Restriction During High-Altitude Pregnancy. iScience 2024, 27, 109702. [CrossRef]
- Feng, Z.; Tang, Y. The Relief Degree of Land Surface in China and Its Correlation with Population Distribution. Acta Geogr. Sin. 2007, 62, 1073–1082. [CrossRef]
- Chen, L.; Chen, T. The Contributions of Population Distribution, Healthcare Resourcing, and Transportation Infrastructure to Spatial Accessibility of Health Care. Inquiry 2023, 60, 469580221146041. [CrossRef]
- Wu, J.J.; K, Y.F. The Spatial Accessibility Analysis of Rural Medical Facilities Based on GIS: A Case Study of Lankou County, Henan Province. Hum. Geogr. 2008, 23, 37–42. [CrossRef]
- Zhang, L.; He, X.X. Industrial Agglomeration, Public Services and City Size: Evidence from 286 Cities in China. Land Use Policy 2023, 131, 106758. [CrossRef]
- Tao, Y.H.; Shen, Y. Spatial Difference of Medical Facility Accessibility and Influencing Factors: A Comparative Study of Registered and Floating Populations in Shanghai. Prog. Geogr. 2018, 37, 1075–1085. [CrossRef]
- Li, P.; Wu, L. Distribution Characteristics and Influencing Factors of Intangible Cultural Heritage in Beijing-Tianjin-Hebei. Heritage Sci. 2023, 11, 19. [CrossRef]
- Huang, D.; Liu, Z. Emerging Polycentric Megacity in China: An Examination of Employment Subcenters and Their Influence on Population Distribution in Beijing. Cities 2017, 69, 36–45. [CrossRef]
- Tao, L.; Qi, Y. China's Floating Population in the 21st Century: Uneven Landscape, Influencing Factors, and Effects on Urbanization. Acta Geogr. Sin. 2015, 70, 567–581. [CrossRef]
- Xie, S.H.; Wang, J.X. The Effect of Health on Urban-Settlement Intention of Rural-Urban Migrants in China. Health Place 2017, 47, 1–11. [CrossRef]
- Gao, J.; Song, G. Does Labor Migration Affect Rural Land Transfer? Evidence from China. Land Use Policy 2020, 99, 105096. [CrossRef]
- Xie, X.; Zhang, Y. Spatial Distribution Characteristics and Influencing Factors of Rural Governance Demonstration Villages in China. Int. J. Environ. Res. Public Health 2023, 20, 4538. [CrossRef]
- Meng, Y.; Hao, Z. Analysis of the Equalization Effect of Basic Public Services in New-Type Urbanization-A Case Study of County Regions in Guizhou, China. Heliyon 2024, 10, 21. [CrossRef]
- Zhao, Y.; Gao, Y. Spatial Patterns and Trends of Inter-City Population Mobility in China-Based on Baidu Migration Big Data. Cities 2024, 151, 105124. [CrossRef]
- Liu, T.; Qi, Y. China's Floating Population in the 21st Century: Uneven Landscape, Influencing Factors, and Effects on Urbanization. Acta Geogr. Sin. 2015, 70, 567–581. [CrossRef]
- Chen, Y.; Cheng, Y. Analysis of the Spatio-Temporal Dynamics and Influencing Factors of Registered Population Urbanization in Hainan Island. World Reg. Stud. 2023, 32, 108–118. [CrossRef]
- Du, Y.; Xie, Z. Research on Equity Analysis and Forecasting of Nursing Human Resource Allocation in Jiangxi Province, China. Int. J. Nurs. Sci. 2025, 12, 19–26. [CrossRef]
- Yu, Y.H.; Zhao, X. Environmental Support for the Delivery of Integrated Medical and Preventive Services in Primary Healthcare Institutions. Chin. Gen. Pract. 2021, 24, 52. [CrossRef]
Figure 1.
Altitude map of Sichuan provinces in western China.
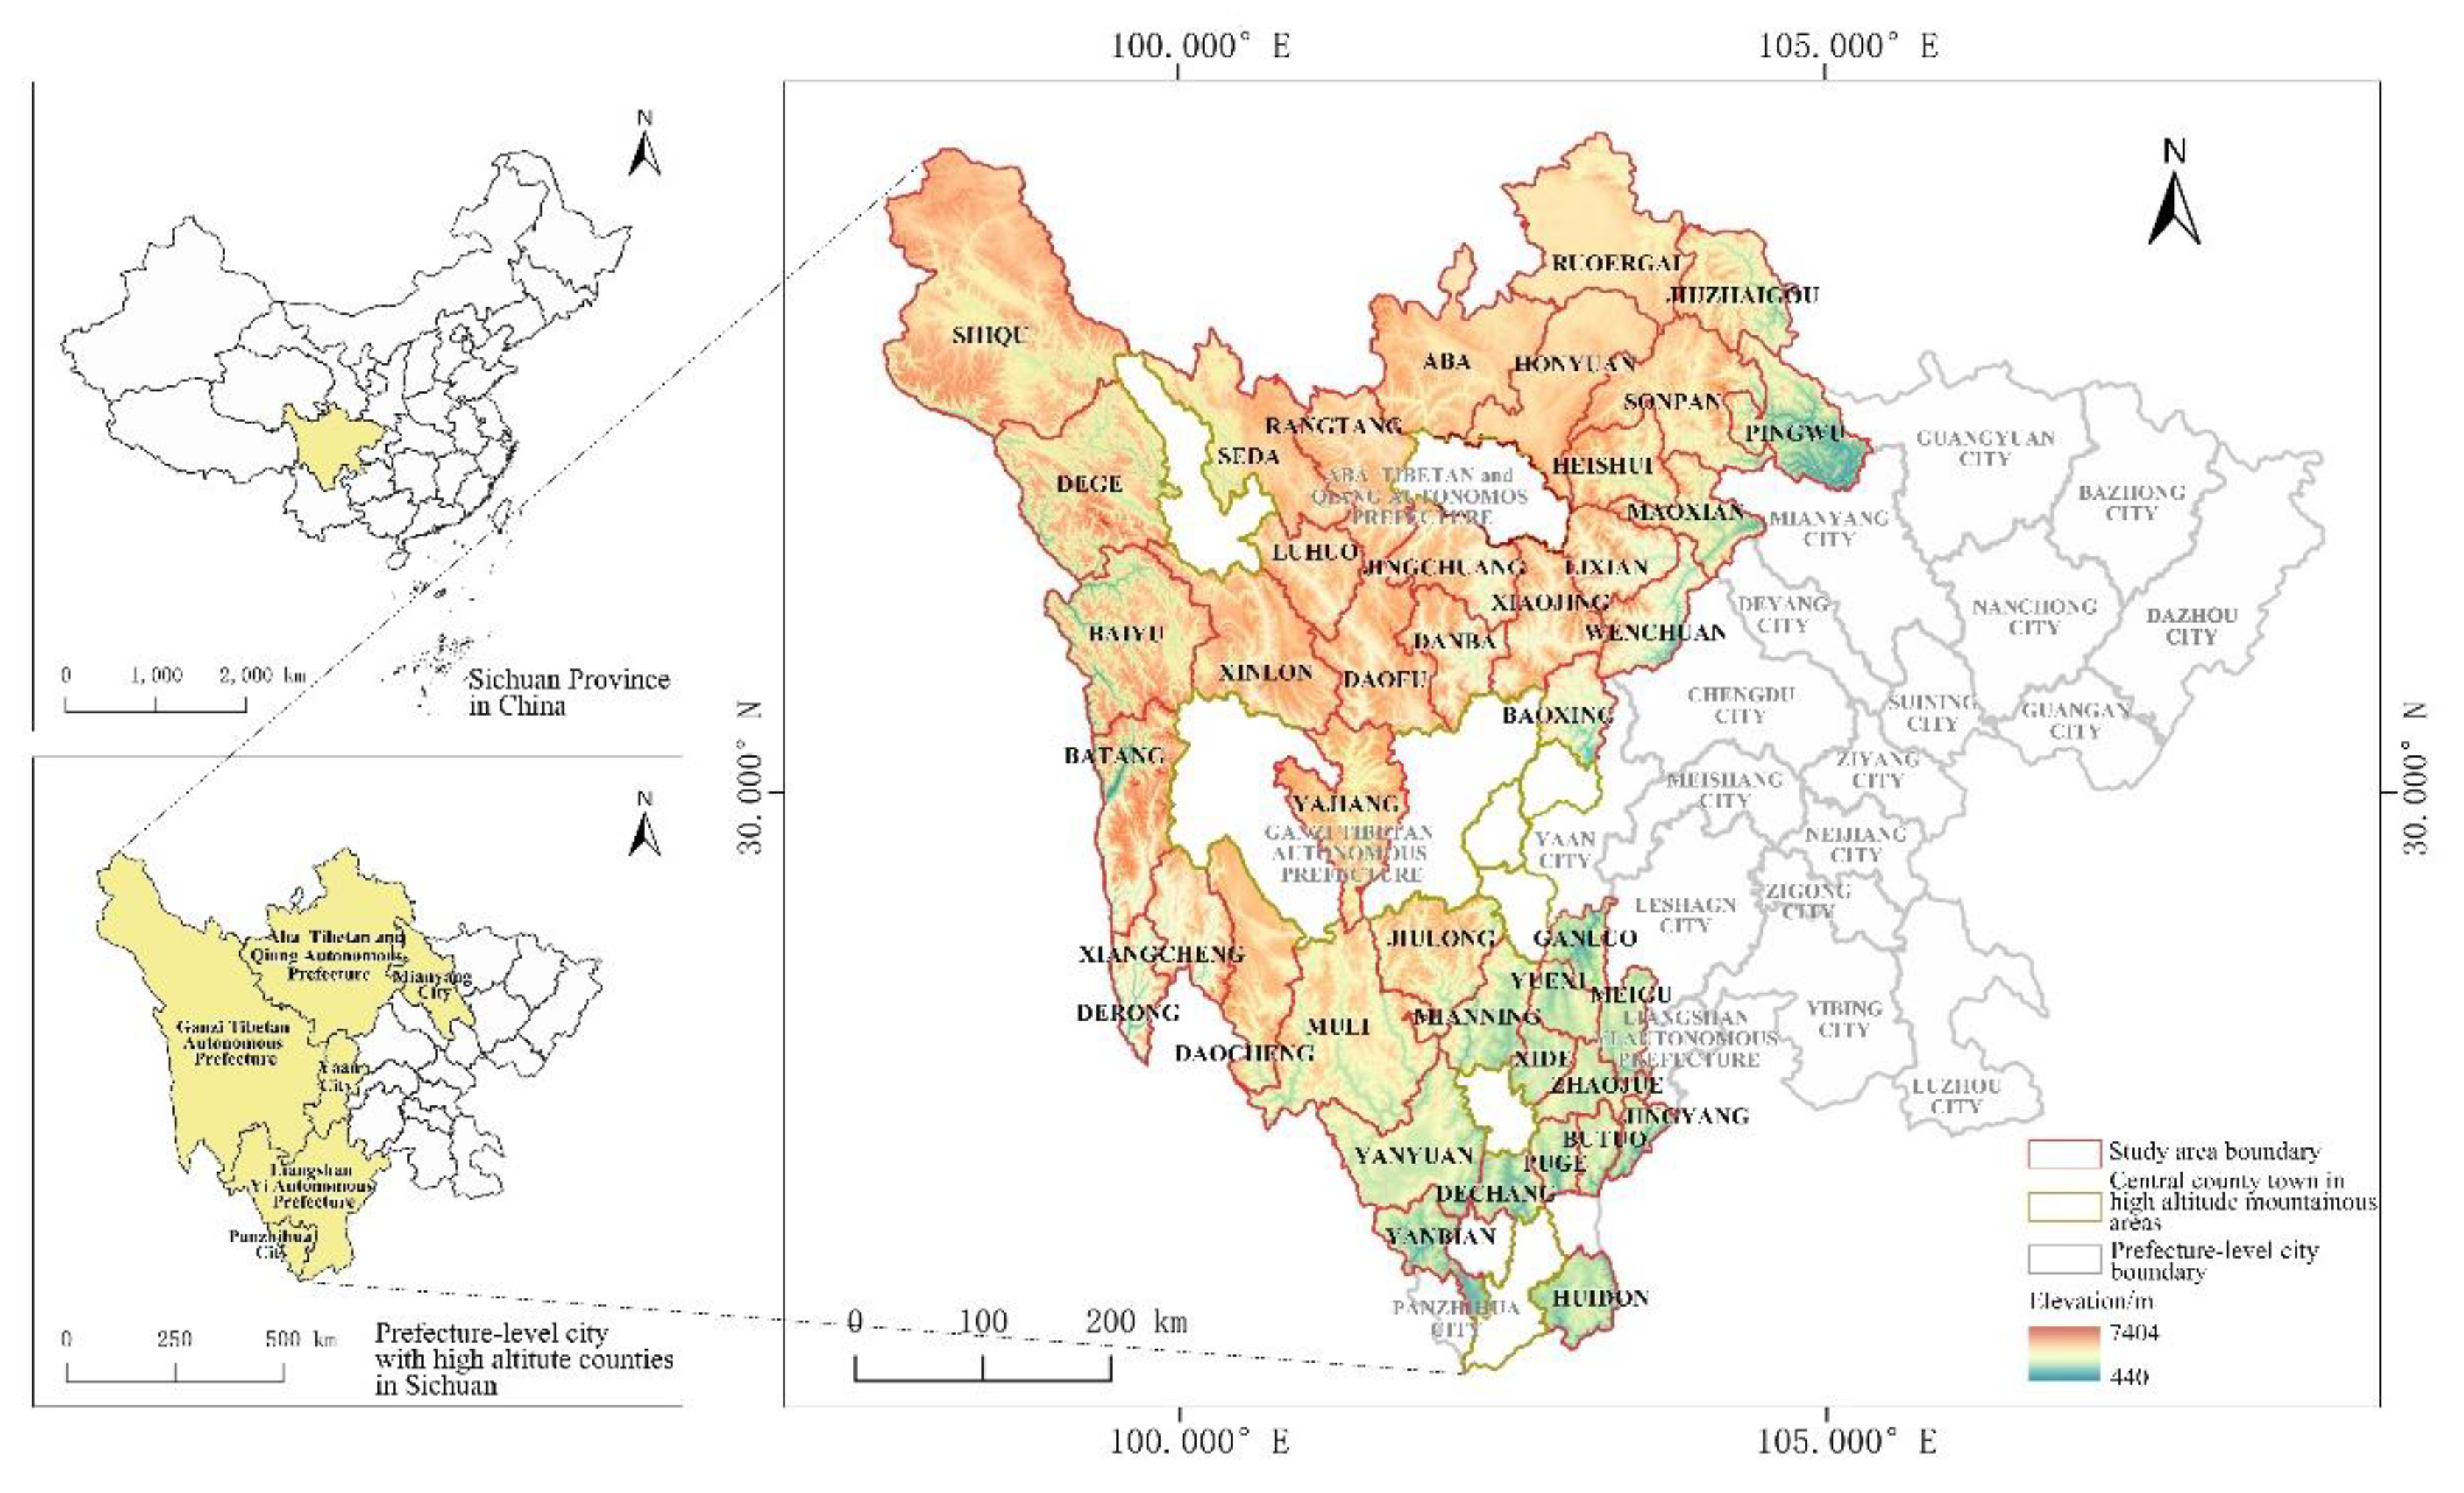
Figure 2.
Research Framework.
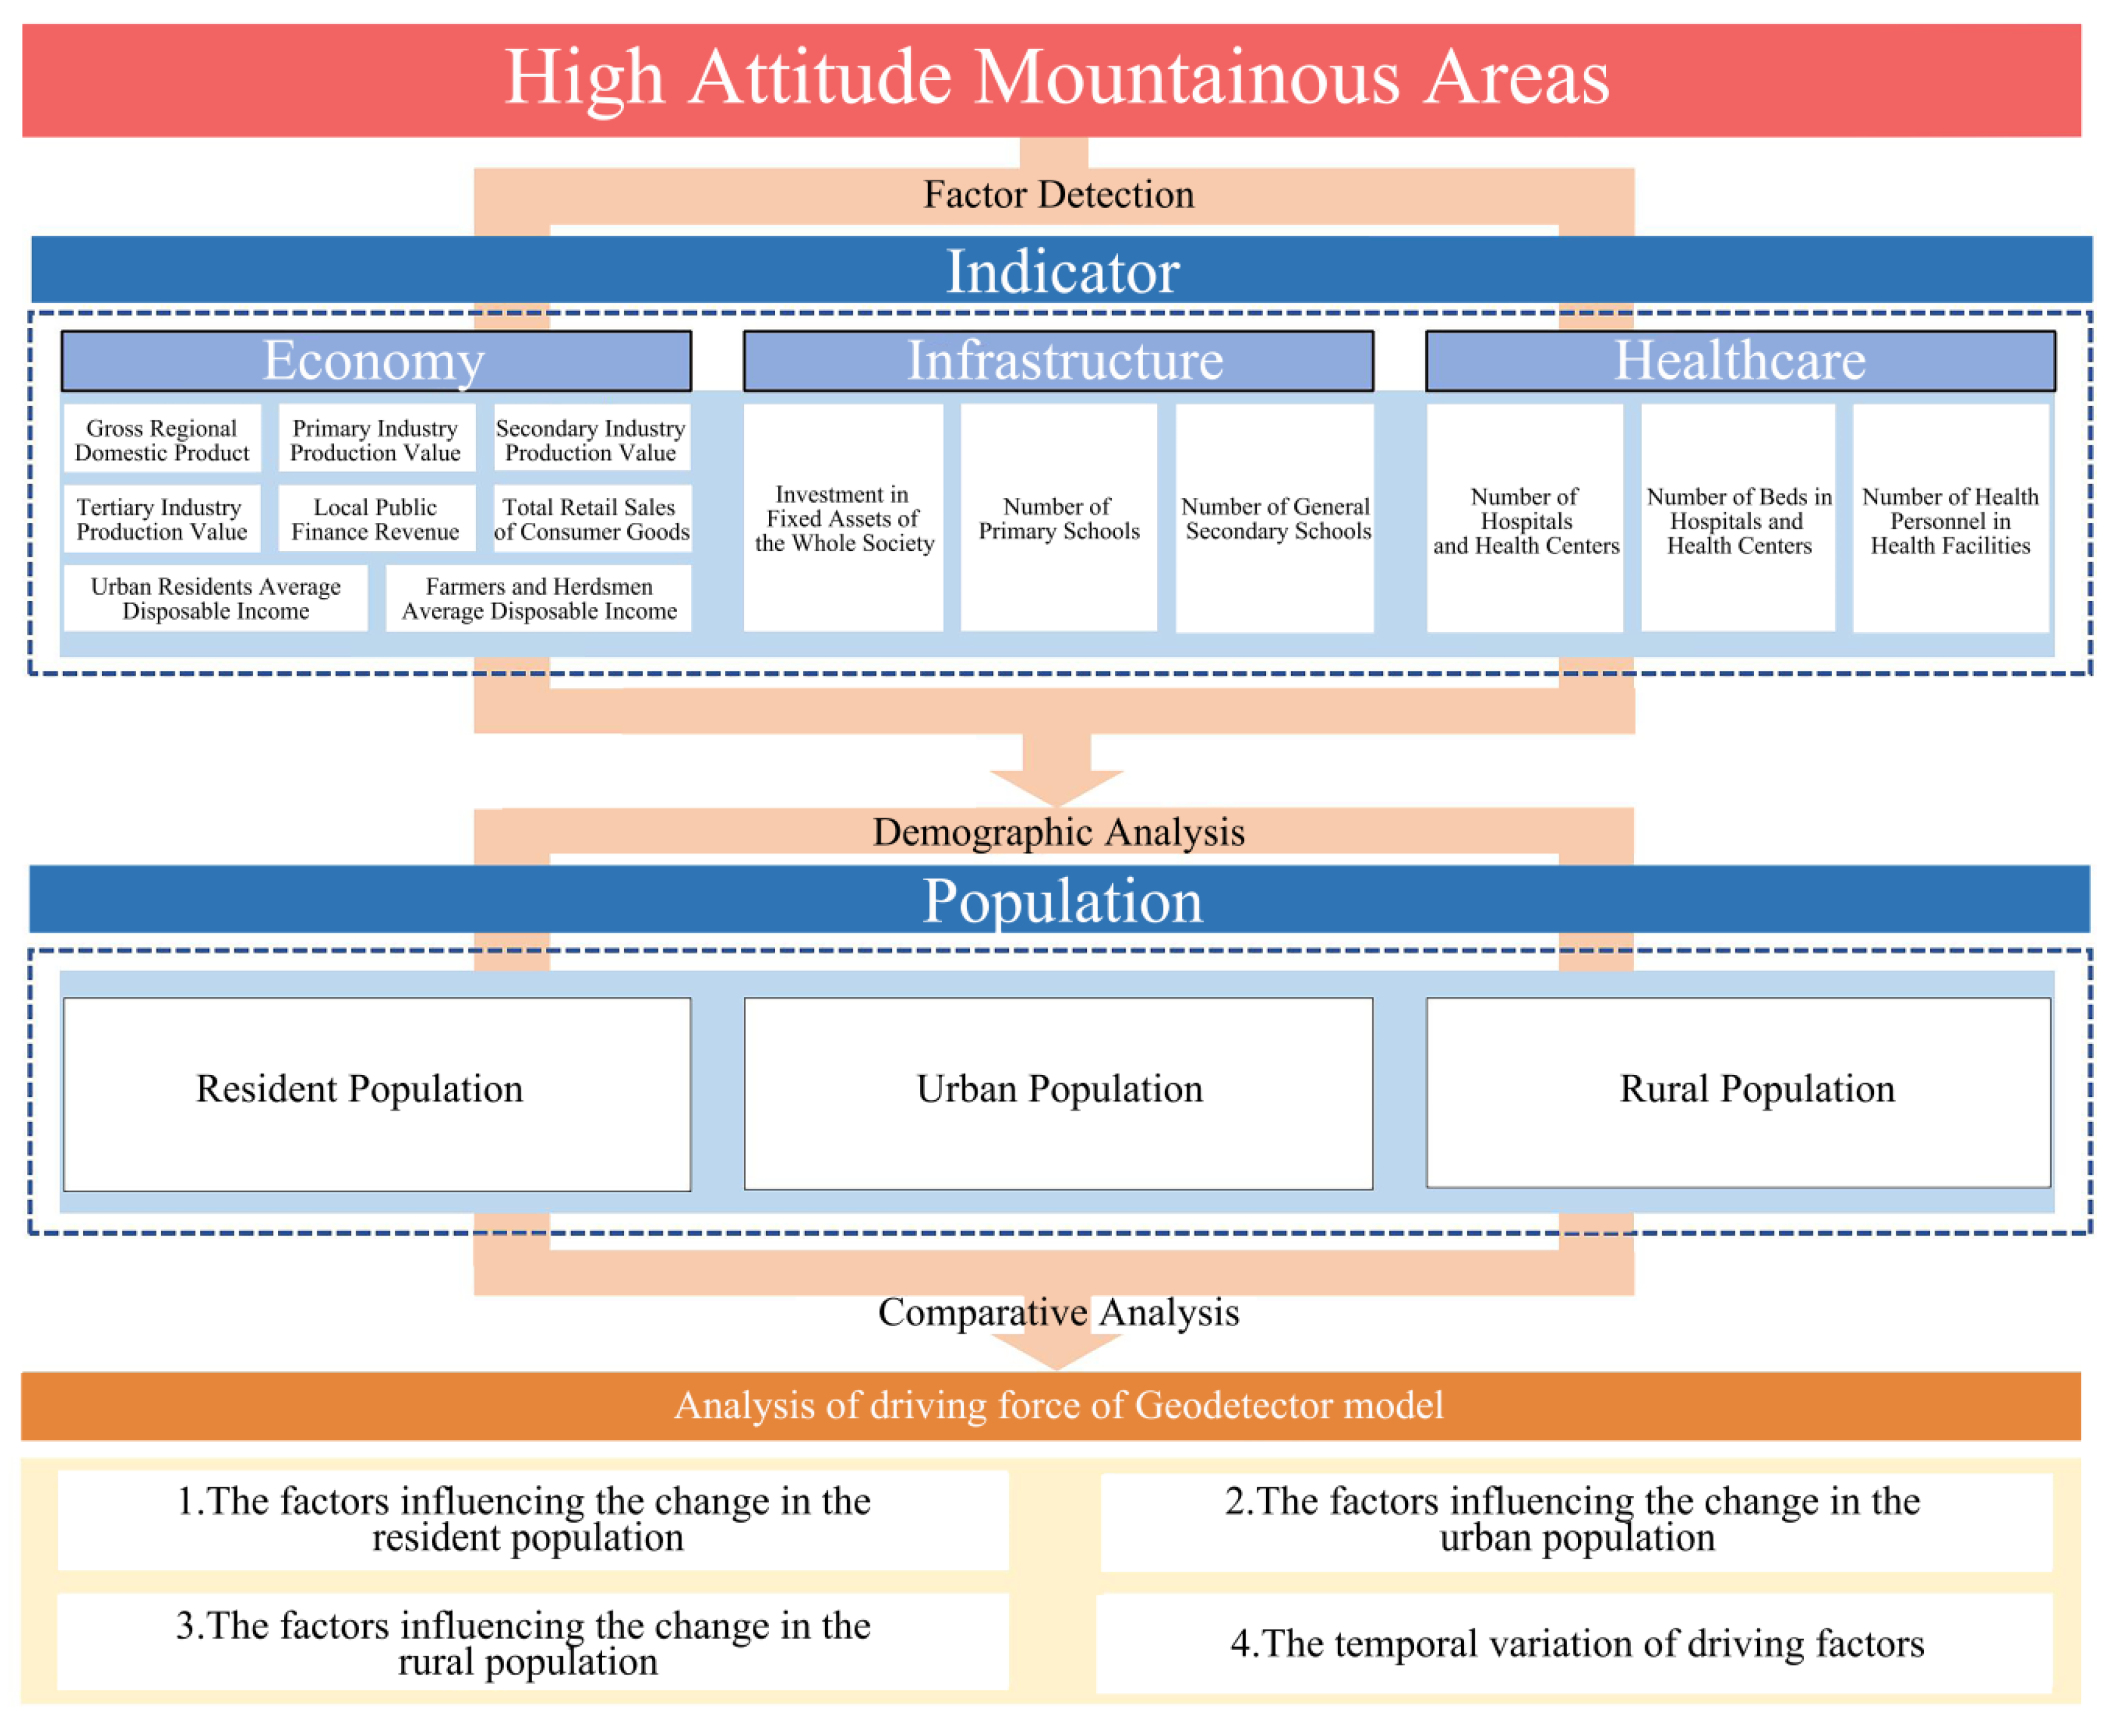
Figure 3.
Spatial Distribution of Population in Sichuan Province.
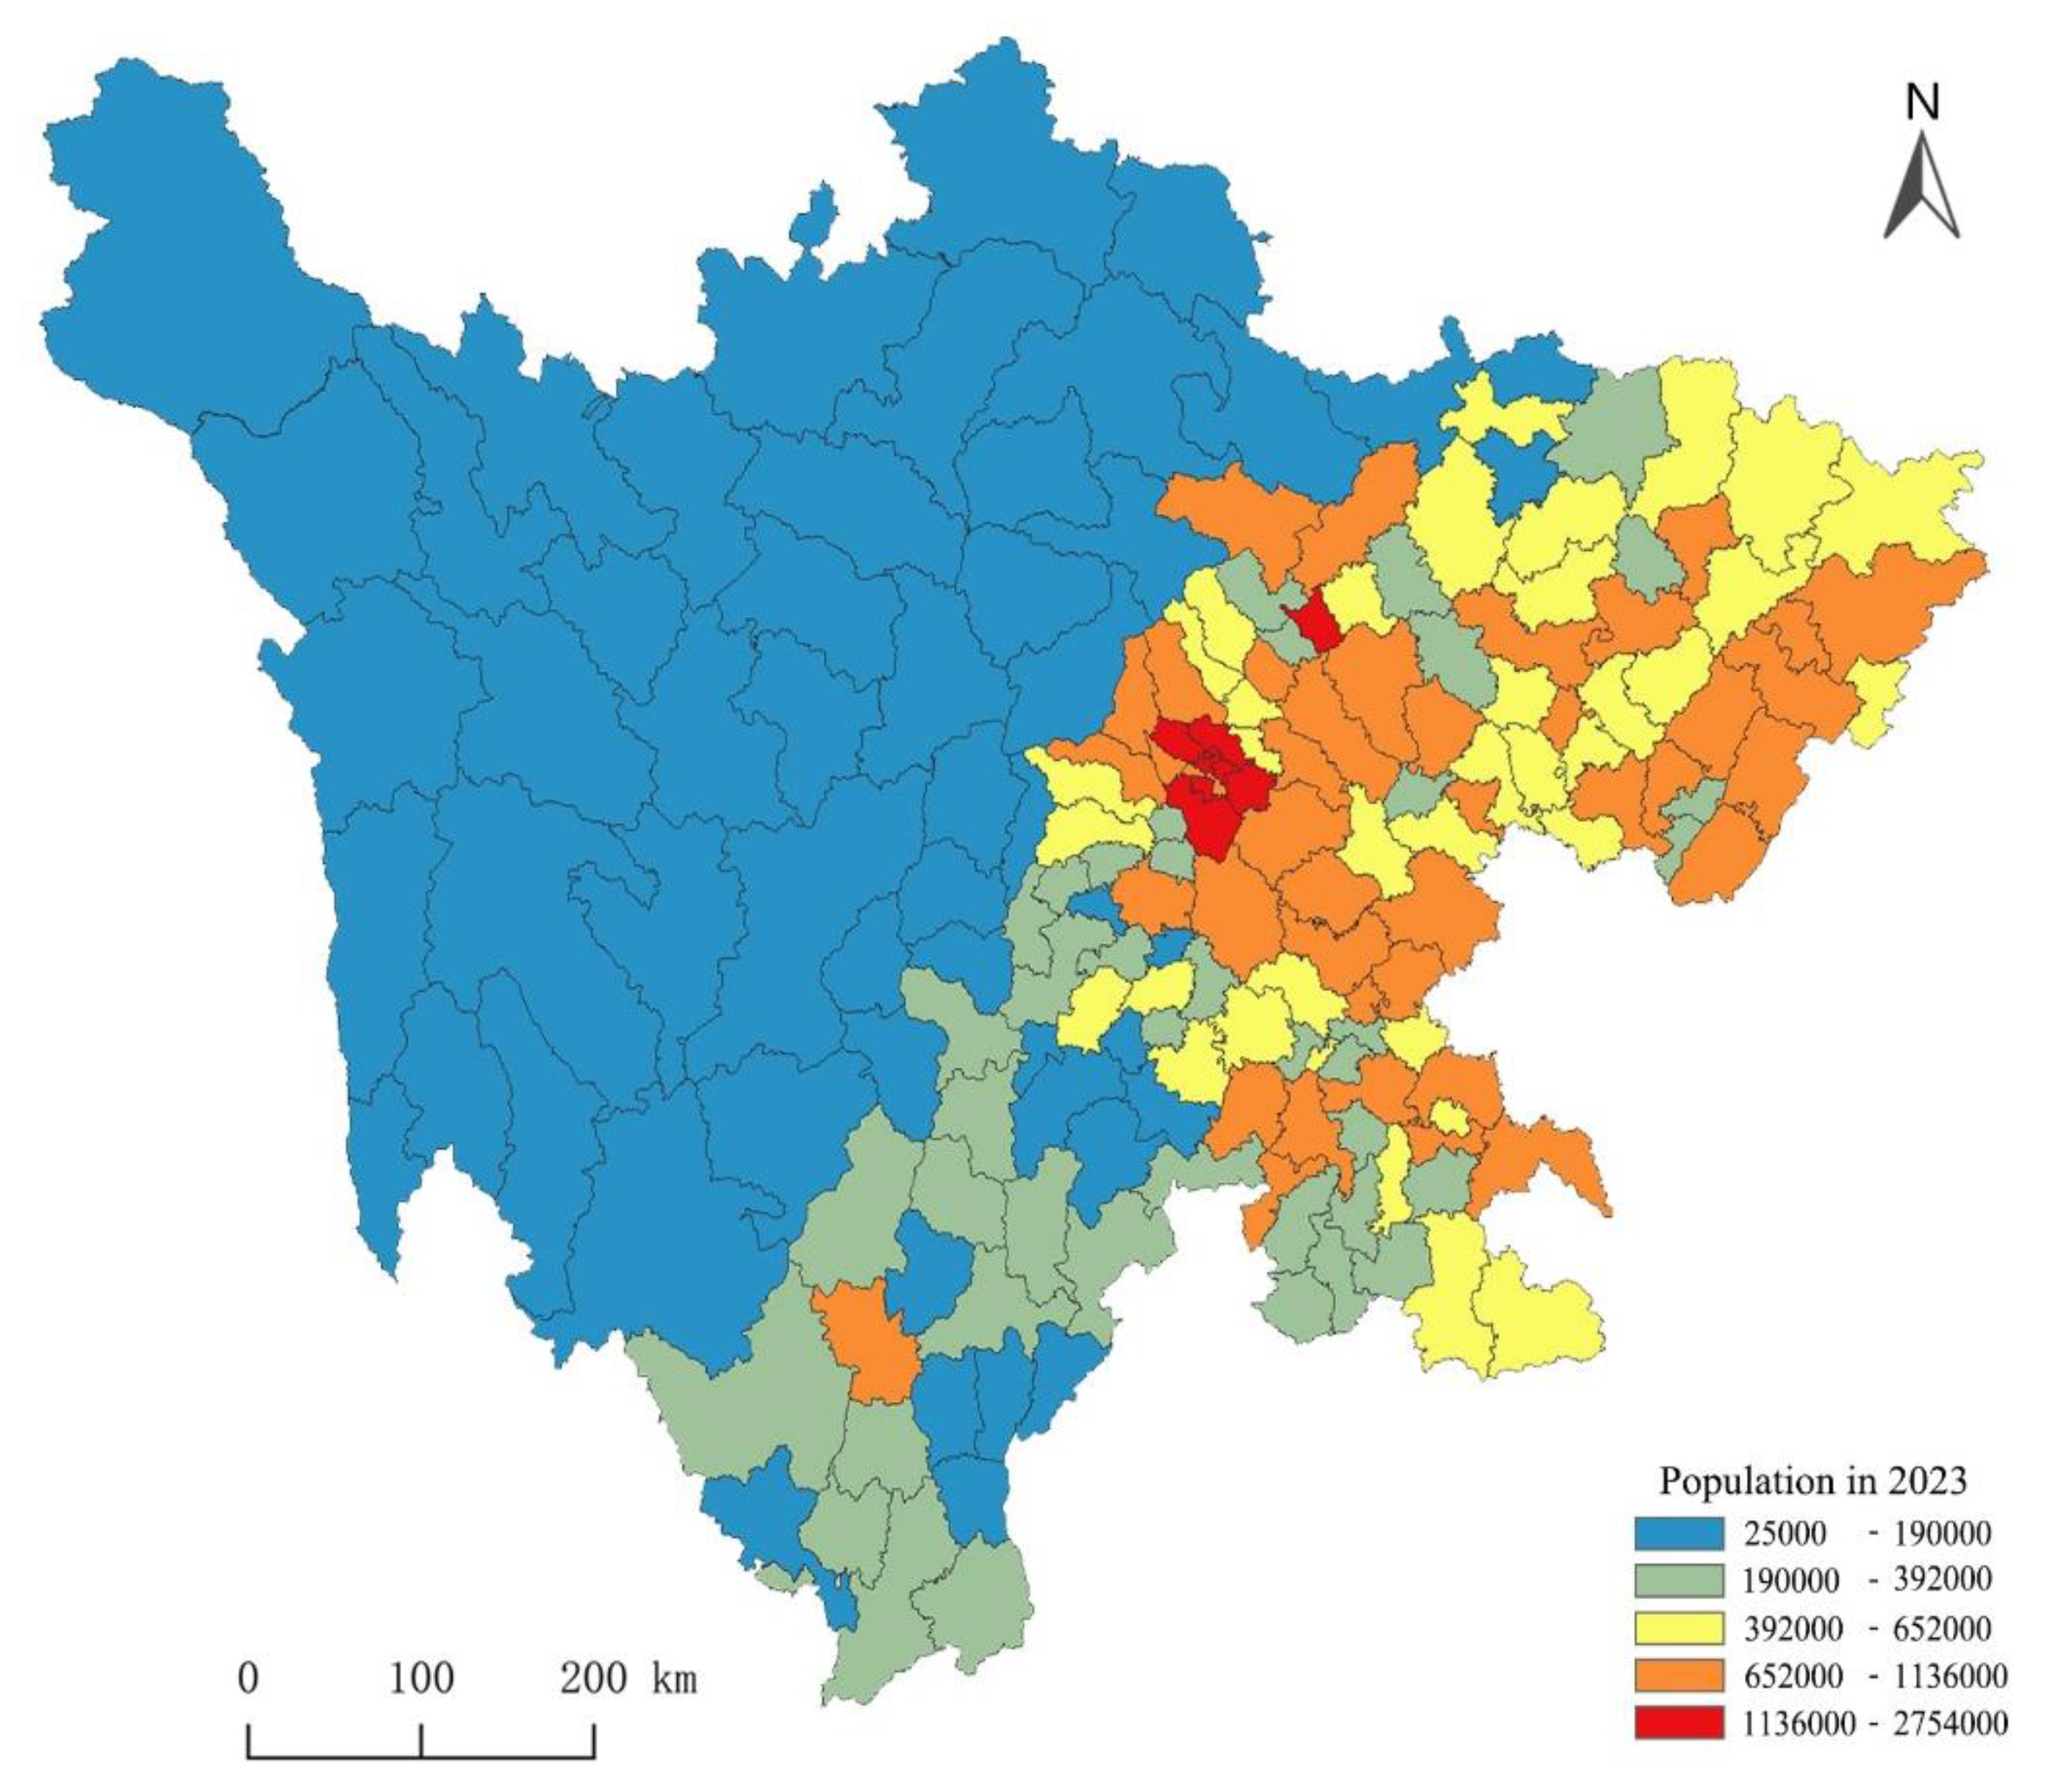
Figure 4.
Autocorrelation of Population Spatial Distribution.
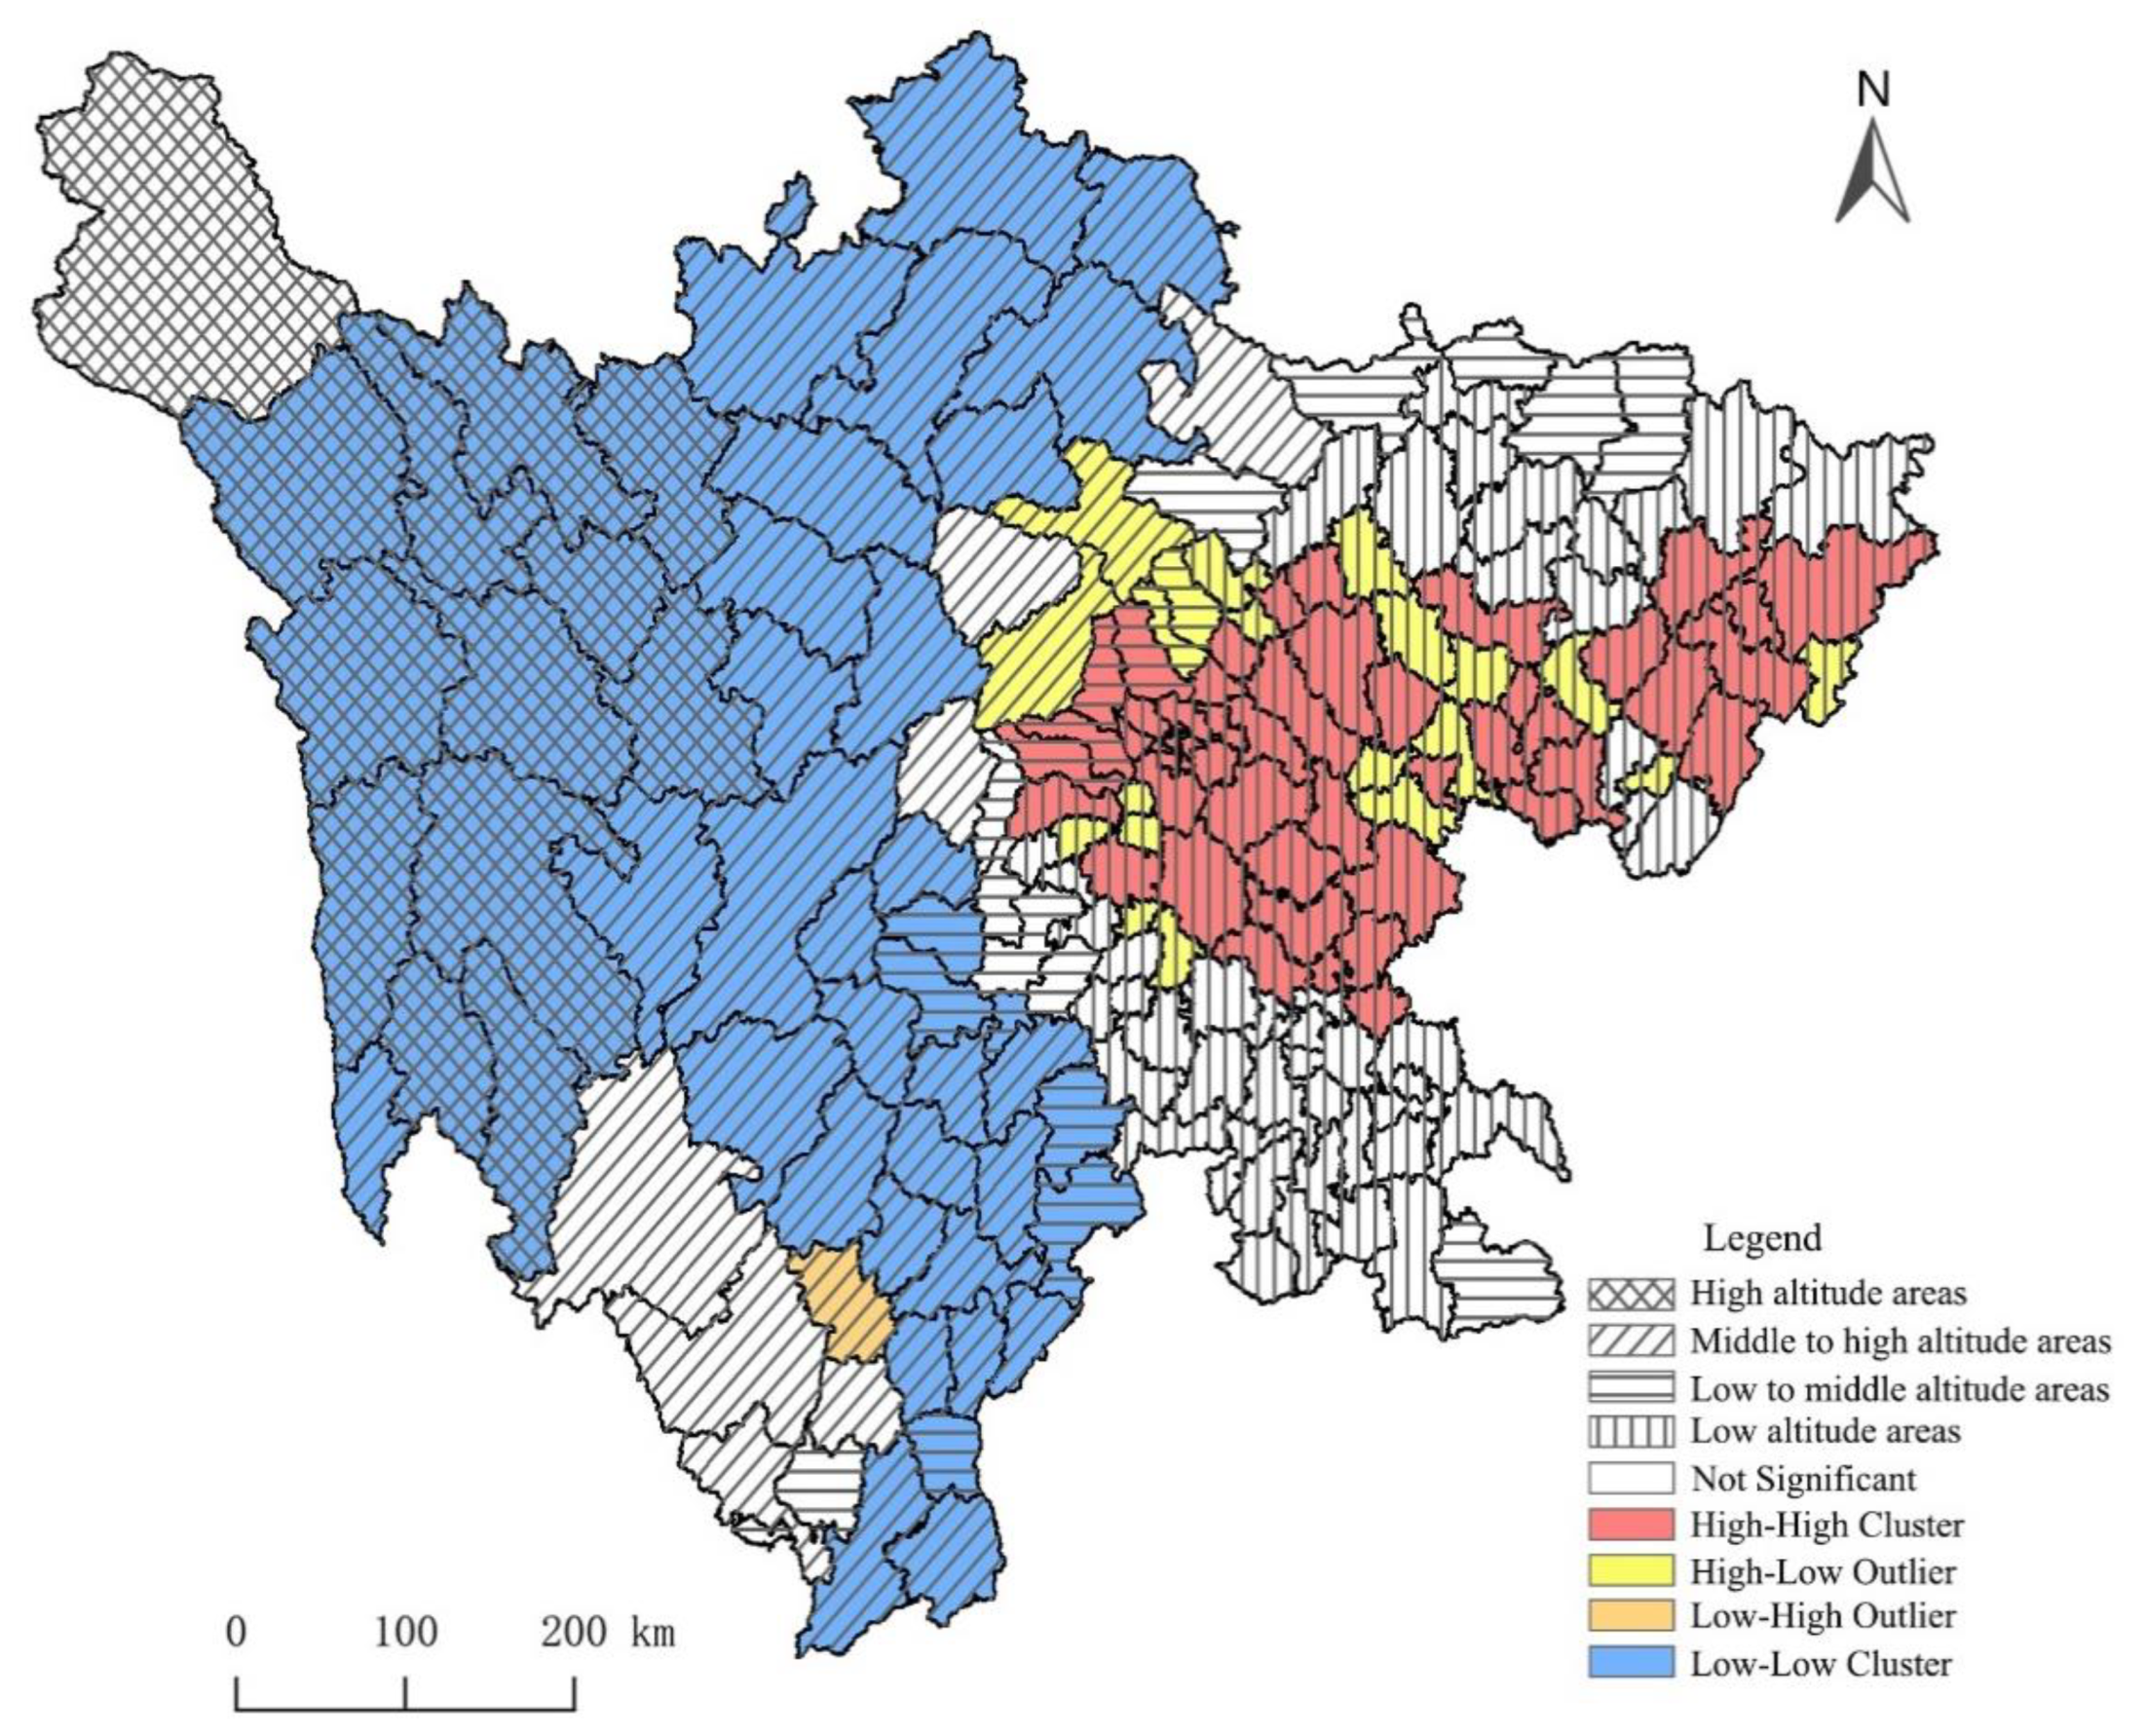
Figure 5.
The Driving Forces and Impacts. (a) The Driving Forces and Impacts of Resident population; (b) The Driving Forces and Impacts of Rural population; (c) The Driving Forces and Impacts of Urban population.
Figure 5.
The Driving Forces and Impacts. (a) The Driving Forces and Impacts of Resident population; (b) The Driving Forces and Impacts of Rural population; (c) The Driving Forces and Impacts of Urban population.
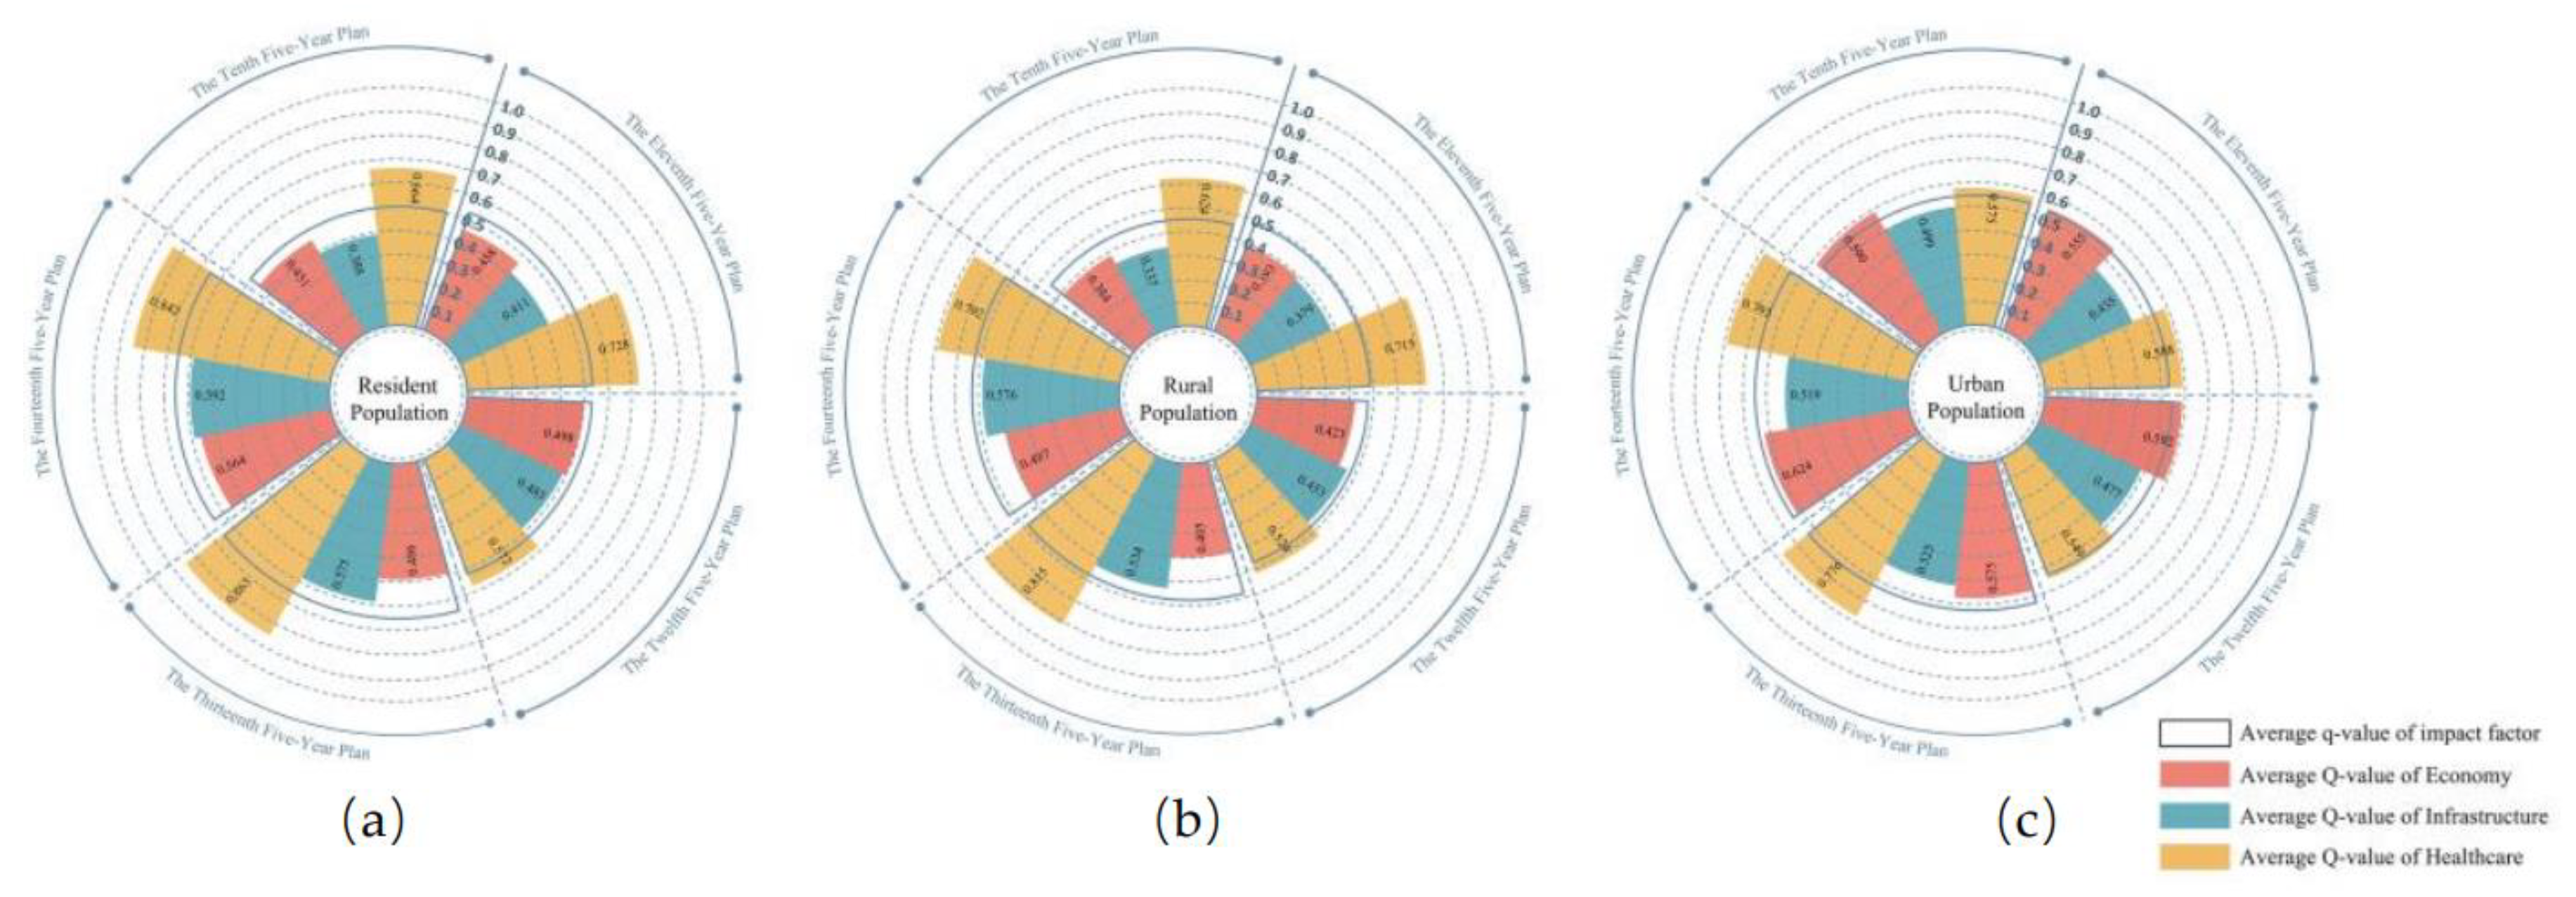
Table 1.
Variable Definitions and Data Sources.
| Indicator Type | Indicator | Units | Data Sources | Variable ID |
|---|---|---|---|---|
| Economy | Gross Regional Domestic Product | Ten thousand RMB | Provincial, city and county statistical yearbooks | E1 |
| Primary Industry Production Value | Ten thousand RMB | Provincial, city and county statistical yearbooks | E2 | |
| Secondary Industry Production Value | Ten thousand RMB | Provincial, city and county statistical yearbooks | E3 | |
| Tertiary Industry Production Value | Ten thousand RMB | Provincial, city and county statistical yearbooks | E4 | |
| Local Public Finance Revenue | Ten thousand RMB | Provincial, city and county statistical yearbooks | E5 | |
| Total Retail Sales of Consumer Goods | Ten thousand RMB | Provincial, city and county statistical yearbooks | E6 | |
| Urban Residents Average Disposable Income | RMB | Provincial, city and county statistical yearbooks | E7 | |
| Farmers and Herdsmen Average Disposable Income | RMB | Provincial, city and county statistical yearbooks | E8 | |
| Infrastructure | Investment in Fixed Assets of the Whole Society | Ten thousand RMB | Provincial, city and county statistical yearbooks | I1 |
| Number of Primary Schools | Number of schools | Provincial, city and county statistical yearbooks | I2 | |
| Number of General Secondary Schools | Number of schools | Provincial, city and county statistical yearbooks | I3 | |
| Healthcare | Number of Hospitals and Health Centers | Number of Hospitals and Health Centers | Sichuan Provincial Health and Wellness Statistical Yearbook | H1 |
| Number of Beds in Hospitals and Health Centers | Number of Beds | Sichuan Provincial Health and Wellness Statistical Yearbook | H2 | |
| Number of Health Personnel in Health Facilities | Person | Sichuan Provincial Health and Wellness Statistical Yearbook | H3 |
Table 2.
Significance Analysis of Population.
| Test Item | Comparative Group (Mean Difference ± Standard Deviation) |
F- Value |
P- Value |
|
| Non-key high-altitude counties (n = 42) |
Non-key middle- and low- altitude counties (n = 68) | |||
| Growth rate of population | 0.01±0.01 | -0.01±0.01 | 62.904 | 0.000** |
** p < 0.05, * p < 0.01
Table 3.
The q Values of Factor Detection for Economy, Infrastructure, and Healthcare.
 |
Disclaimer/Publisher’s Note: The statements, opinions and data contained in all publications are solely those of the individual author(s) and contributor(s) and not of MDPI and/or the editor(s). MDPI and/or the editor(s) disclaim responsibility for any injury to people or property resulting from any ideas, methods, instructions or products referred to in the content. |
© 2025 by the authors. Licensee MDPI, Basel, Switzerland. This article is an open access article distributed under the terms and conditions of the Creative Commons Attribution (CC BY) license (http://creativecommons.org/licenses/by/4.0/).
Copyright: This open access article is published under a Creative Commons CC BY 4.0 license, which permit the free download, distribution, and reuse, provided that the author and preprint are cited in any reuse.


