
Submitted:
26 February 2025
Posted:
27 February 2025
You are already at the latest version
Abstract
This paper focuses on a real-time baggage handling monitoring system by proposing a computational ergo-design approach. It presents the optimal system architecture for real-time baggage handling. The proposed architecture, called ARTEMIS (ARchitecture for real-TimE baggage handling and MonitorIng System), is designed for real-time baggage handling and monitoring. The circuit modeling is carried out using a directed graph. Five strategies are simulated to test their effectiveness and evaluate their performance within the system. A simulation that generates key indicators enables preliminary visualization and analysis of AGV behavior through predefined scenarios. These results are presented through an intuitive and ergonomic user interface, designed with a focus on user-computer interaction as a problem-solving process centered on the user’s experience. The results show that if the goal is to balance energy efficiency with effective baggage handling, the Mixed Advance/Delay Strategy appears to be the best overall choice, as it optimizes both energy consumption and baggage handling while maintaining relatively low waiting times. However, if minimizing queue time and maximizing baggage collection are the highest priorities (with less emphasis on energy efficiency), the Turnstile Strategy remains a solid option. In addition, the simulations show that the operator plays a central role in minimizing delays and ensuring the smooth operation of the system. Both local and global system failures depend heavily on the operator’s response time, decision-making, and overall efficiency. Therefore, operator efficiency and a well-designed support system are critical to maintaining a smooth and effective baggage handling process.
Keywords:
airport 4.0
; baggage handling system
; computational ergo-design
; simulation
; failure analysis
; human-centered design
1. Introduction
The rapid advancement of automation in logistics and transportation has significantly transformed operational efficiency in airports. Today, airports face increasing pressure to improve efficiency while minimizing environmental impact. In the modern context of air travel, efficient baggage handling has become a foundation of both passenger satisfaction and operational quality. Airports worldwide are under increasing pressure to manage the growing volume of passengers and the associated complexity of logistical operations. To meet these demands, autonomous mobile robots (AMR) or automated guided vehicles (AGV) are increasingly deployed for different tasks that present challenges in optimizing their movement to ensure both energy efficiency and operational effectiveness. Airports, with their dynamic and often congested environments, also require these robots to operate alongside humans, further complicating the balance between task efficiency, safety and adaptability. Moreover, the baggage handling system (BHS) is a network of technologies implemented at airports, representing a complex system for humans, as access becomes very difficult in the event of a breakdown.
Despite the growing use of autonomous robots in logistics and transportation, existing research often prioritizes task efficiency over energy consumption. Current studies overlook how these systems should function in dynamic, human-shared environments, where unpredictable events introduce additional complexity. While human-centered design and ergonomics are widely discussed in various fields, there is a clear gap in research when it comes to applying these principles to robotic systems—specifically in designing systems that balance task efficiency, energy efficiency and human safety in both robot-only and human-robot shared environments.
Addressing these challenges requires innovative approaches. In this context, ergo-design—an emerging discipline that integrates ergonomic principles with design—emerges as a powerful tool for sustainable baggage management systems. Ergo-design, at its essence, is about designing systems that integrate continuously the human factor in design. Ergo-design also acts as the bridge between these two disciplines. By considering the interactions of human with both technology and infrastructure, ergo-design ensures that systems are not only operationally effective but also human-centric. The advancements in computational design [1,2] can bring a significant evolution also in ergo-design, giving rise to computational ergo-design. Computational ergo-design employs advanced simulations (for example, coupled Matlab-Simulink and Python simulations [3]), real-time data processing, and computational modeling to design, test, and refine human-centered complex systems. This computational approach is a key element of smart ergo-design, which integrates intelligent technologies and interconnected systems to meet the dynamic demands of modern environments such as airports [4,5,6].
Many methods have been proposed to model and simulate complex systems before their development, with the aim of efficiency, robustness and sustainability of these systems [7,8], mainly: Discrete-Event Modelling and Simulation [9], System Dynamics Modelling and Simulations [10], or Agent-Based Modelling and Simulation (ABMS) [11]. In ABMS, agents are modeled to perform tasks autonomously, to communicate and interact with each other, to evolve and perceive dynamic environments [12]. Their simulation allows to visualize and analyze their adaptive behaviors in very varied fields, including transportation [13,14] and autonomous vehicles [15]. The simulation of a fleet of AGVs in an airport is therefore an excellent illustration of this [16].
Within the domain of airport baggage handling, ergo-design focuses on two primary stakeholder groups: (i) passengers and (ii) operators. By prioritizing both passengers and operators need, ergo-design allows the design of systems that are human-centered, while being functional and sustainable. For passengers, the goal is to ensure continuous access to information about their baggage’s location and status, ensuring that their baggage is reliably delivered to their destination and that they have access to real-time updates about its location. User-friendly interfaces and timely notifications play a vital role in meeting these expectations. Meanwhile, airport operators require effective tools to track, trace, and manage baggage efficiently while minimizing errors or delays [17]. The challenge lies in equipping operators with robust tools for tracking and managing baggage securely and efficiently across the complex infrastructure of airports. To address these needs, computing is indispensable.
Several issues faced by airports are addressed using MATLAB/Simulink simulations, including:
- Baggage security control [18];
- Evaluating fuzzy control strategies to reduce energy consumption while simultaneously ensuring passenger comfort in an airport terminal [21];
- Analyzing the load flow of energy production at the Abuja airport (Nigeria) injection substation, highlighting the impact of decentralized production through genetic algorithm integration [22].
Carlson and Murphy [23] classified the failures into two groups: human (design, interaction, etc.) and physical (communications, effector, sensors, power, control system, field-repairable and non-field-repairable, etc.). Expanding on this work, Ramesh et al. [24] introduced the concept of "robot vital signs," defined as a set of parameters indicating a robot’s health and its ability to operate autonomously despite performance degradation. When performance degradation is minimal or absent, these vital signs remain within a defined range of values, which may vary depending on the robotic hardware or environmental conditions. Changes in one or more vital signs can provide insights into the specific nature of the robot’s performance degradation. These failures have thus been the subject of specific studies for AGVs used in Industry 4.0 [25,26].
The authors [3] propose an algorithm for estimating the remaining useful life (RUL) while considering the production plan, thereby enabling the prediction of the future dynamic behavior of robots. The execution of the RUL prediction algorithm relies on the Python RUL prediction executor, which can operate either manually or automatically using a task scheduler. This module, in turn, iteratively runs MATLAB functions until a failure is predicted or the entire prediction horizon is analyzed without any failure being detected.
This paper focuses on a real-time baggage handling monitoring system (BHMS) by proposing a computational ergo-design approach. The goal is to model a wide range of scenarios, assess the monitoring system’s performance under diverse conditions, and analyze how changes could impact overall efficiency. These simulations allow system designers and operators to collaboratively explore and test performance under realistic and challenging conditions [7]. This co-construction of scenarios ensures that the computations are aligned with the specific requirements of the airport environment, enabling precise identification of weaknesses and opportunities for improvement.
Furthermore, one of the key issues is determining the optimal system architecture for real-time baggage handling. Additionally, identifying effective computing strategies is crucial for rigorously testing the system’s performance and resilience. These strategies must account for the real-world complexities of airport operations. Finally, the design of the human-computer interface (HCI) is essential for operational success. By integrating the principles of ergo-design with computational tools, this research seeks to address these challenges comprehensively.
The structure of this article is as follows. We start by defining an architecture for real-time baggage handling monitoring system that we named ARTEMIS. Then, we present the modelling and simulation of the ARTEMIS system. In Section 4, we compare five strategies to optimize baggage queue waiting time in ARTEMIS. A study and a discussion of system degradation mechanisms in AGV circuits are given in Section 5. Following this discussion on the numerical simulation of scenarios of system failures and the conclusion, we propose our perspectives on future works.
2. An Architecture for Real-Time Baggage Handling Monitoring System
The proposed architecture for real-time baggage handling and monitoring system, called ARTEMIS (ARchitecture for real-TimE baggage handling and MonitorIng System) at an airport is composed of four main components: (1) Database component, (2) Real-Time Environment, (3) Monitoring Component and (4) Data Analysis Component.
Figure 1.
ARchitecture for a real-Time baggagE handling and MonitorIng System (ARTEMIS).
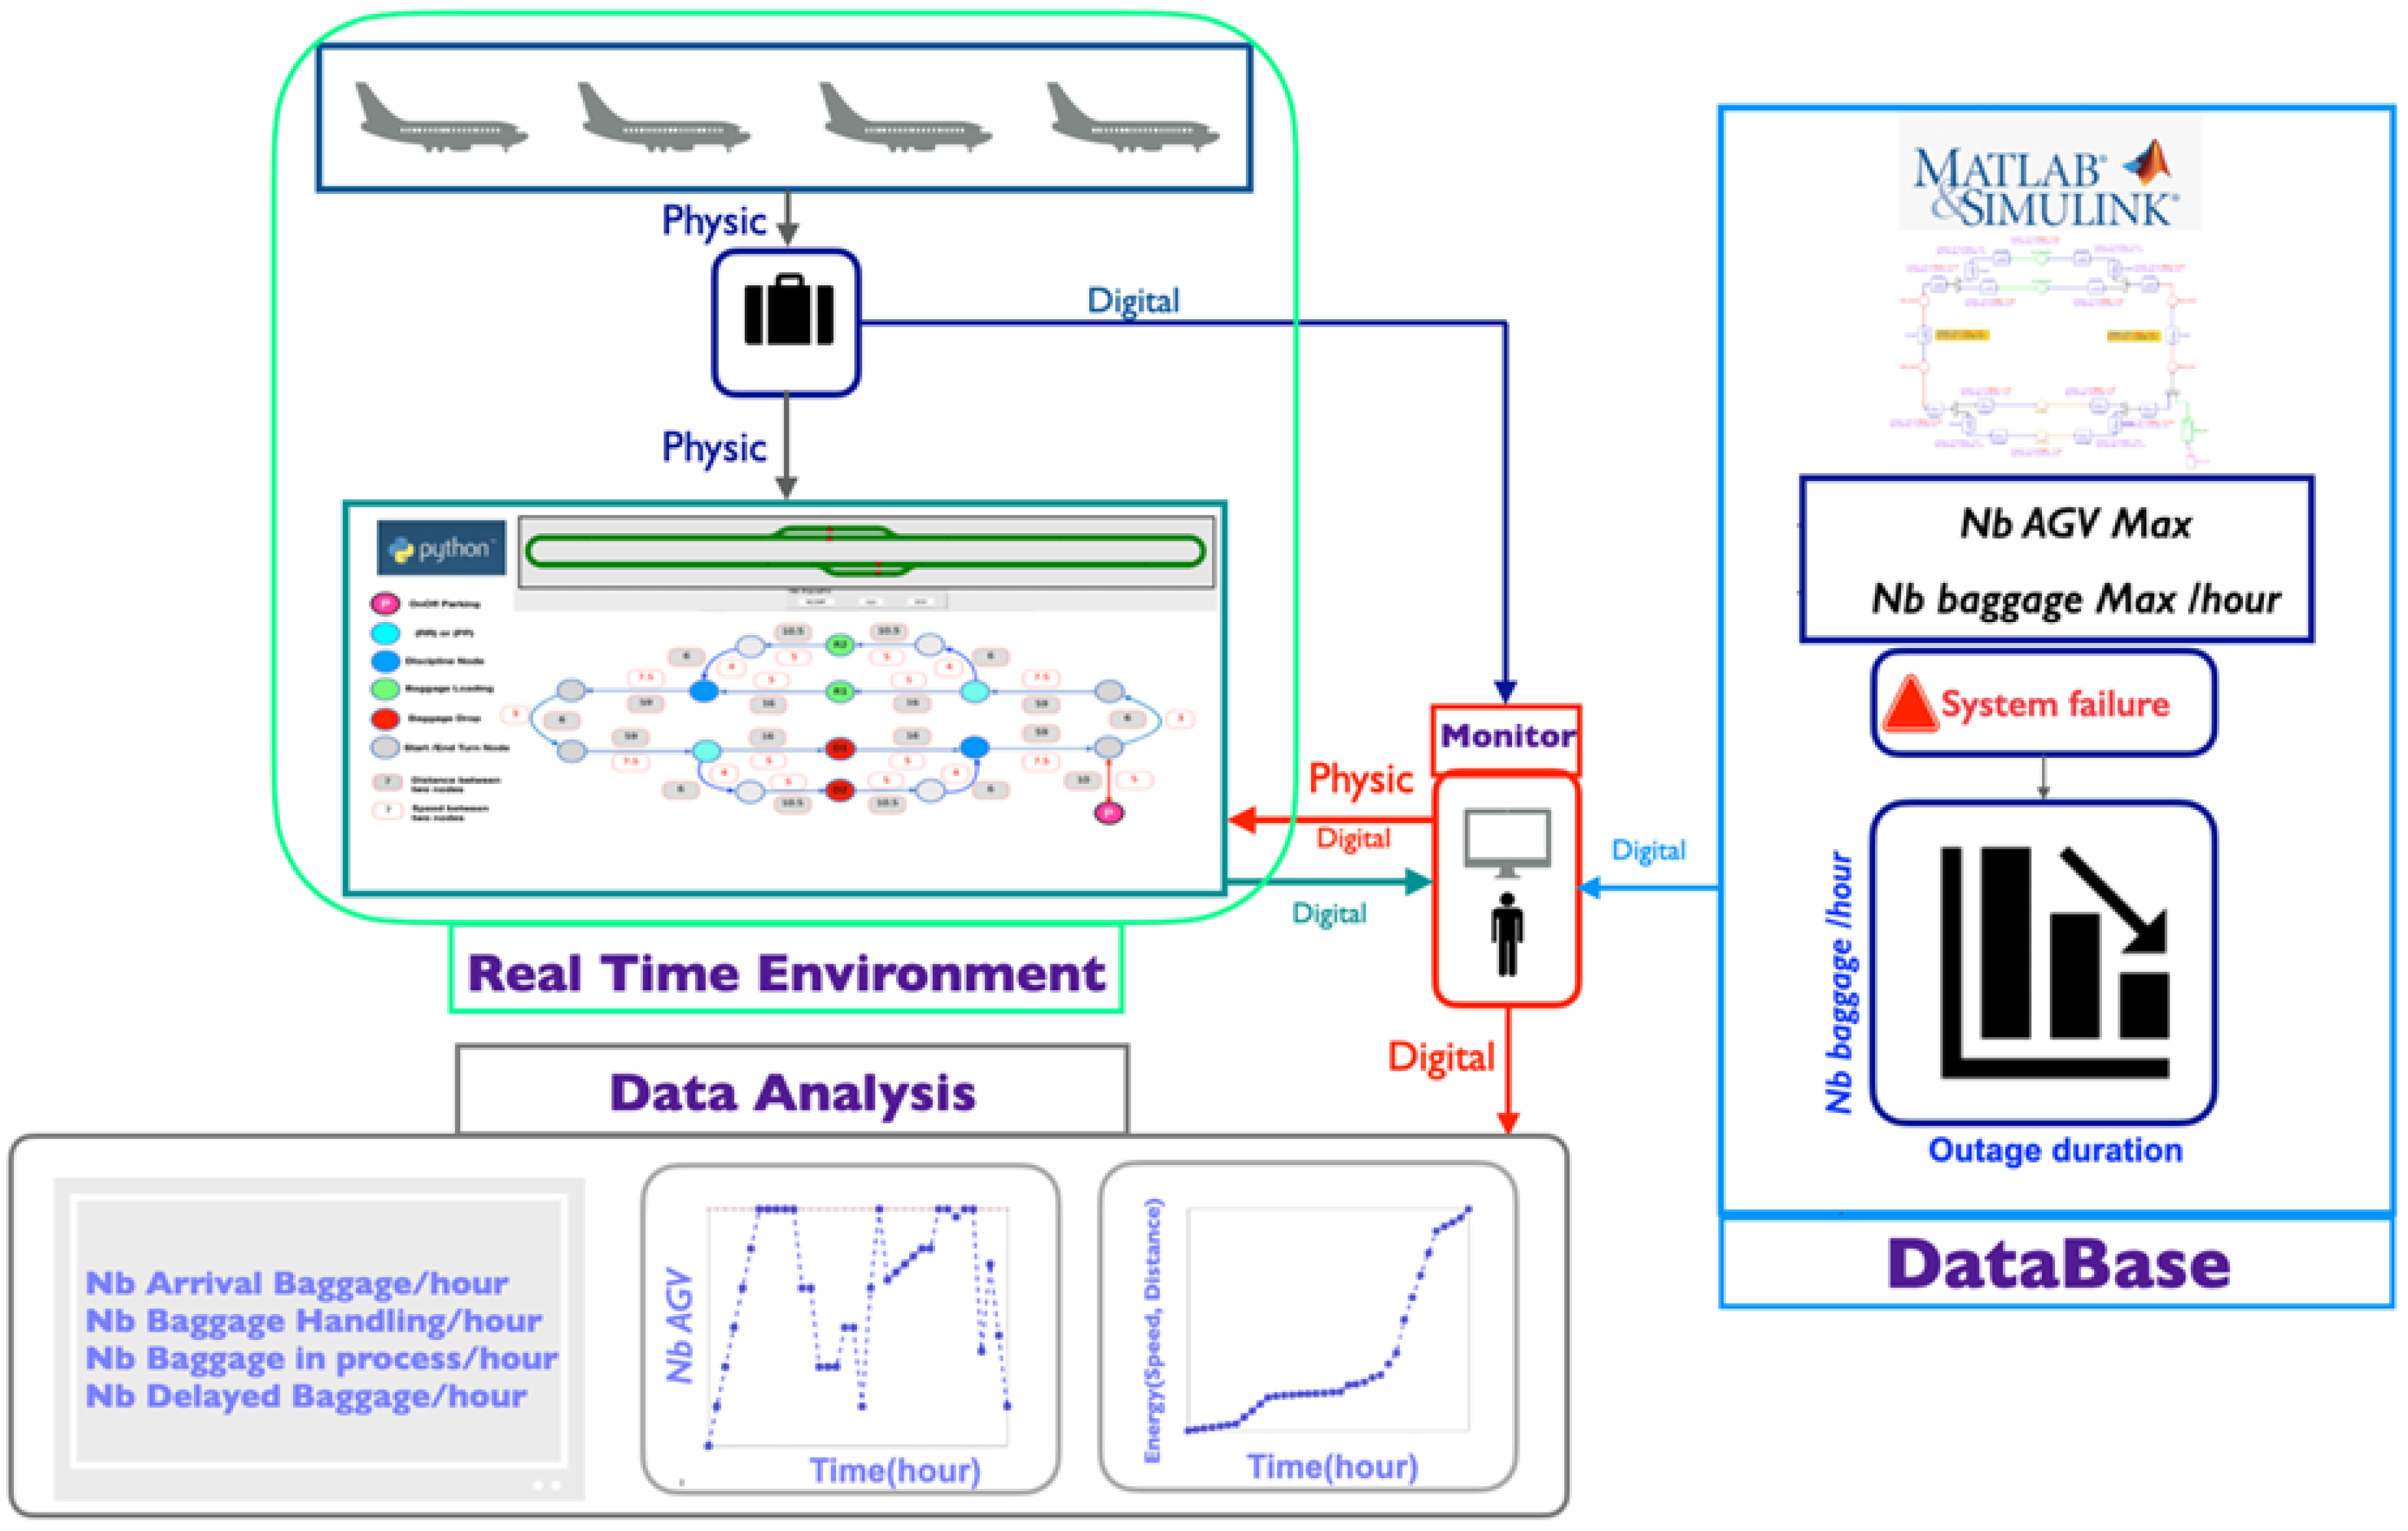
2.1. Functional Description of Components of ARTEMIS
The Database Component is responsible for creating and storing performance data. Simulations run on MATLAB & Simulink are essential for creating a robust database that logs key performance data. This includes statistics such as the maximum number of AGVs on the circuit, bags processed per hour, and delayed baggage counts in the event of a system breakdown, depending on the duration of the outage. MATLAB & Simulink simulations are instrumental in testing how the system reacts under various conditions. For example, the system can simulate failures to assess response times, identify bottlenecks, and visualize the impact of outages on baggage flow. The database archives operational metrics, such as delayed baggage numbers correlated with outage durations, alongside other reliability and performance metrics.
The Real-Time Environment integrates real-world elements, such as planes and AGVs and provides real-time visualization and modeling of AGV behavior in critical situations. It is composed of operational components and Simulation platform. The operational components focus on real-world elements like planes and AGVs. Meanwhile, the Simulation platform: A Python-based simulation platform provides real-time data visualization through labeled nodes (e.g., "On/Off Parking," "Loading," "Drop"), and allows us to model, simulate and study the behavior of AGVs, in a set of problematic situations defined in test scenarios. This visual interface helps operators track baggage flow and understand the status of different system components.
The Monitoring Component offers a comprehensive interface for displaying real-time statistics and supporting decision-making by combining digital data streams with physical observations for precise situational awareness. A monitoring interface presents real-time statistics to operators, facilitating decision-making. It combines physical observations with digital data streams to provide an accurate, up-to-date snapshot of system performance.
Finally, the Data Analysis Component evaluates system performance by generating detailed reports and visual representations of metrics, including baggage throughput, AGV utilization, and energy consumption. Data Analysis Component performs the following roles: (i) Performance Metrics Analysis; (2) Graphical Representation and (3) Time Analysis. Performance Metrics Analysis analyzes data to generate reports on metrics such as baggage throughput (Nb Arrival Baggage, Nb Baggage Handling, Nb Baggage in process, Nb Delayed Baggage), AGV utilization, and energy consumption based on speed and distance traveled. In Graphical Representation, Graphs and charts depict time-series data, revealing trends like the number of AGVs used per hour and variations in energy consumption over days. These visualizations help identify performance trends and areas for optimization. Time Analysis allow for detailed time analysis charts highlight baggage handling efficiency, pinpointing peak and off-peak operational periods.
2.2. Behavior of ARTEMIS
The components of ARTEMIS interact between them, ensuring smooth and efficient baggage handling operations. This real-time baggage handling and monitoring system leverages simulations, real-time data processing, monitoring interfaces, and analytical tools. The interconnected components enable adaptive control, rapid responses to system failures, and performance optimization. This makes it a robust and comprehensive solution for airport baggage management.
Tasks begin with the arrival of planes and the physical movement of baggage from aircraft to designated drop points. As soon as a plane lands, the monitoring system receives digital data on the number of bags. Leveraging the database created via MATLAB & Simulink, the monitoring system sends operational data from the Python platform in real time, such as the number of AGVs allocated based on incoming baggage. It also receives feedback on the number of processed and in-progress bags. Feedback loops between the real-time environment and monitoring tools create an adaptive system capable of responding to changes. This ensures high reliability and continuous improvement, facilitating seamless communication between the simulation platform and real-time data processing. The integration of physical data collection (e.g., baggage counting) with digital processing via the Python simulation module enables real-time updates and precise tracking. Alerts are generated for scenarios such as system failures or when performance thresholds are reached (e.g., maximum AGV capacity or baggage processing rates). These alerts ensure timely operator intervention.
3. Modelling and Simulation of ARTEMIS
3.1. Modelling of the Handling System
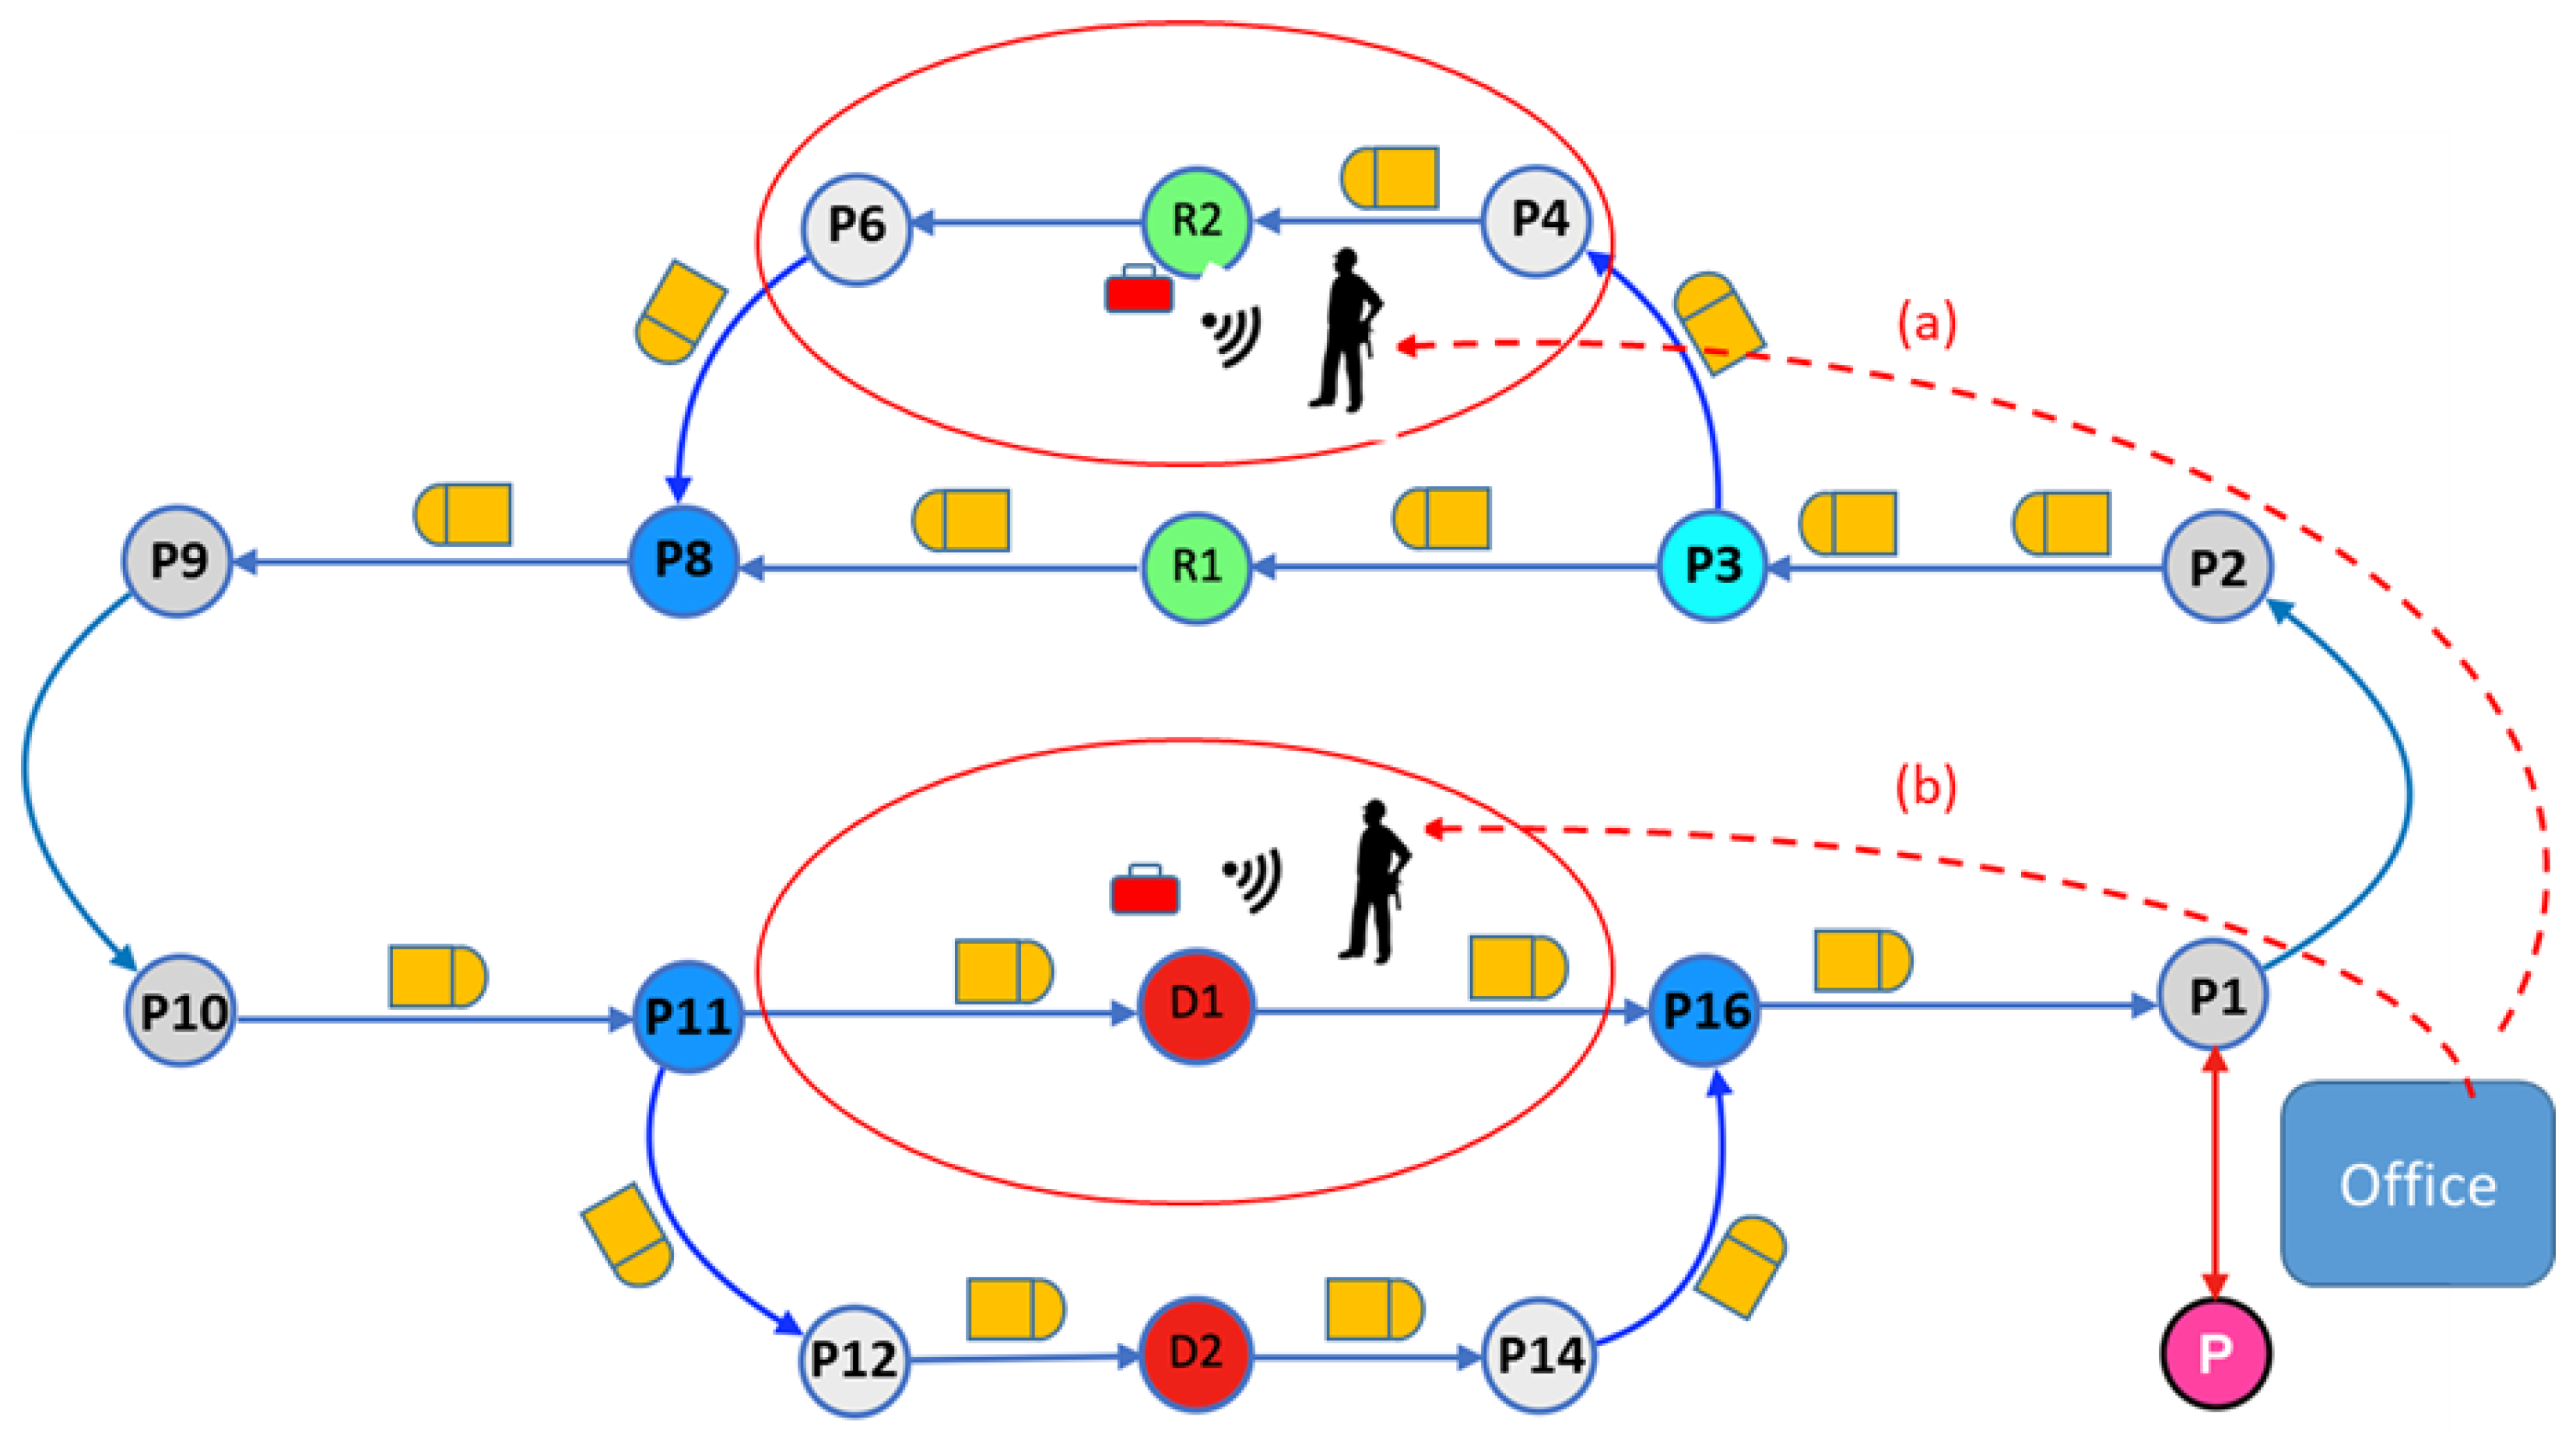
The simulation model of the baggage handling system consists of four elements: a circuit, AGVs, baggage and a human operator.
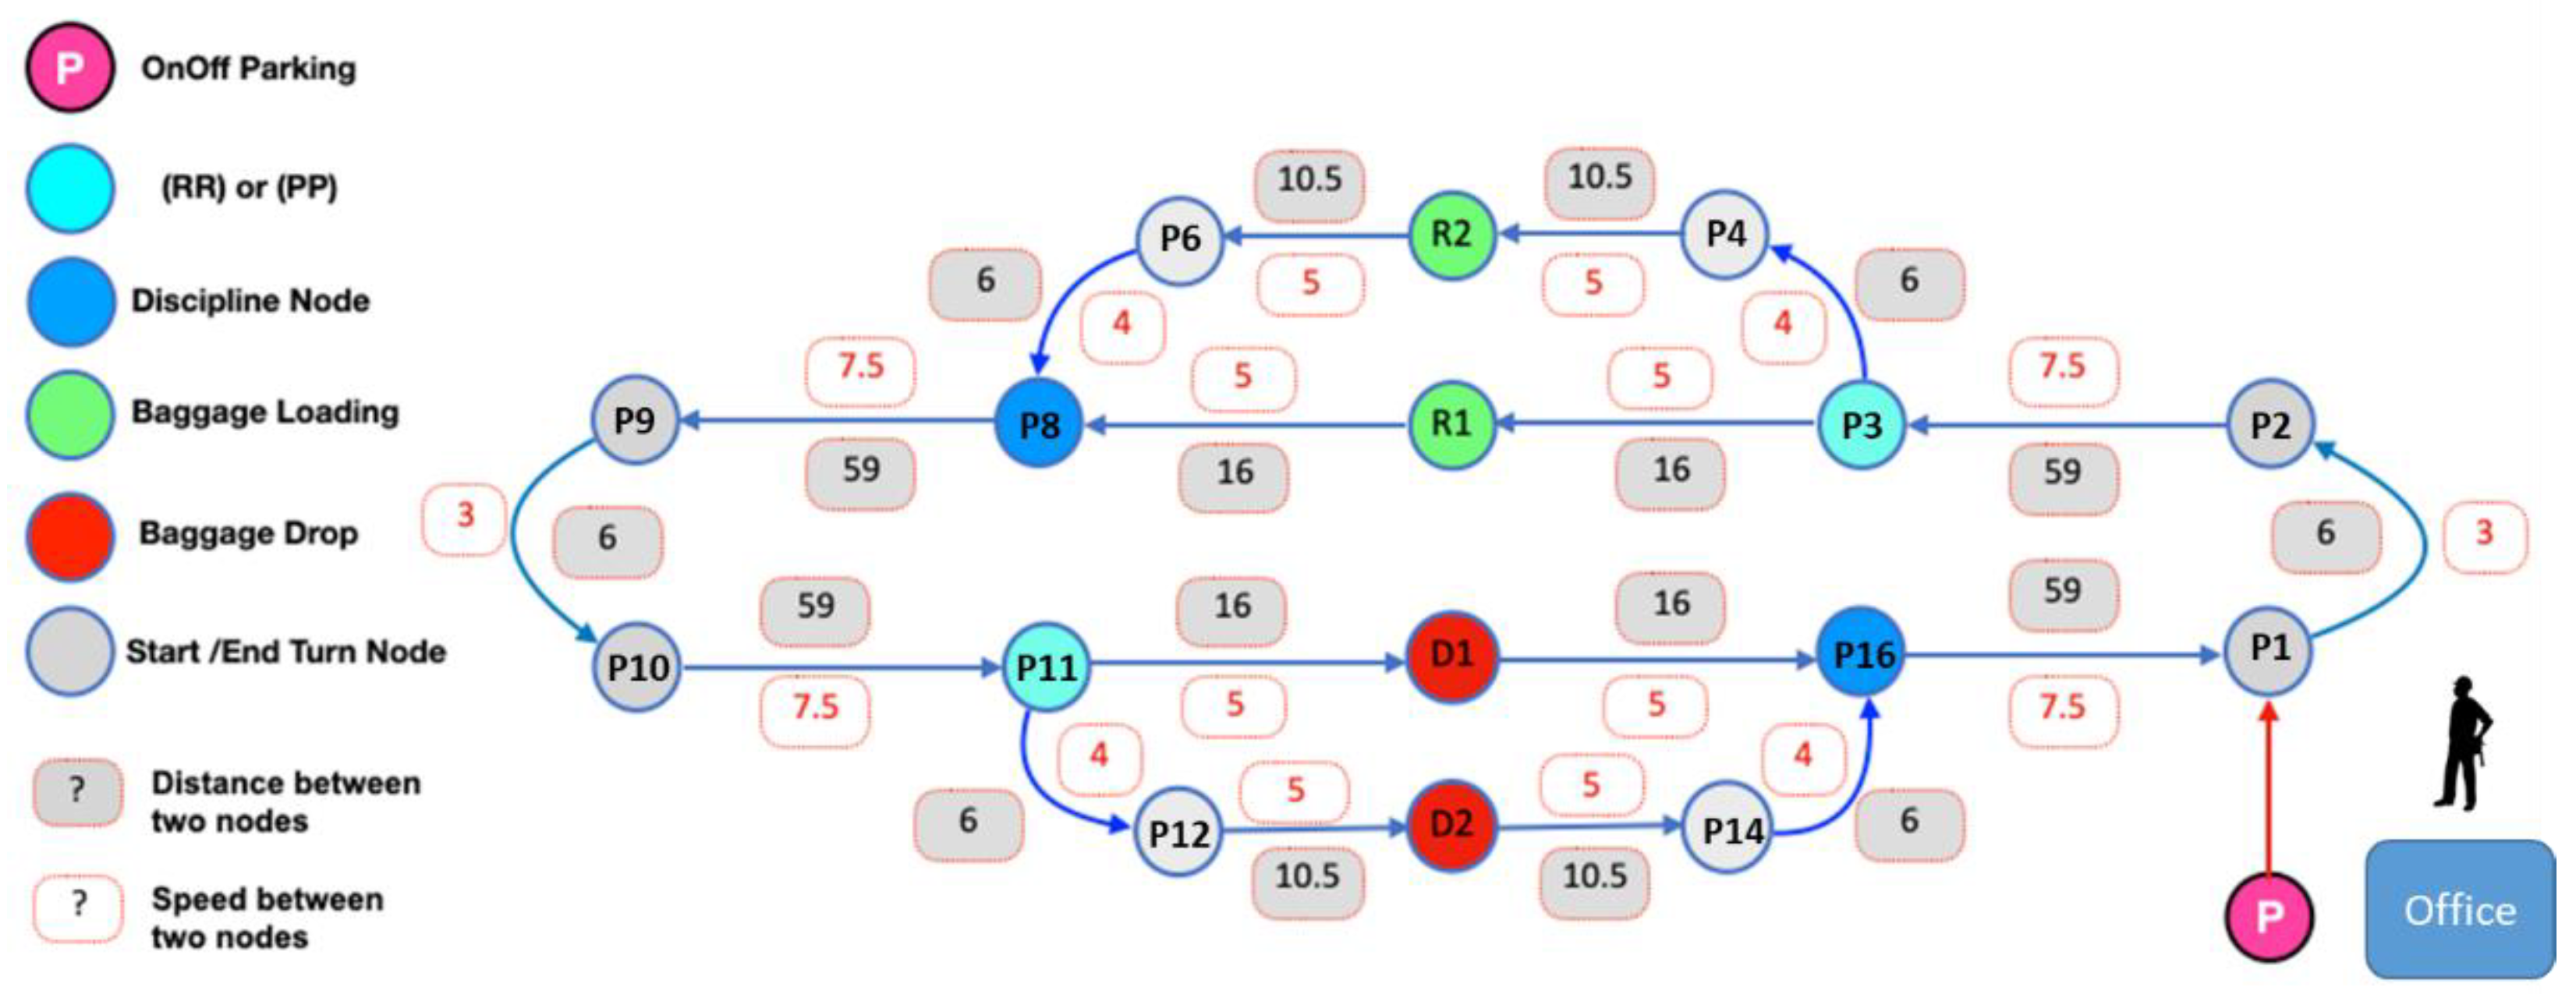
The space in which the robots operate is defined as a two-dimensional plane representing a closed and oriented circuit, in other words a loop with a direction of circulation. On this circuit are defined 2 baggage input flows and 2 baggage output flows (Figure 2). In addition, the circuit includes a main lane and two branches: an upper one allowing to add a second input flow to the main input flow, and a lower one, allowing to add an output flow to the main output flow. The modelling of the circuit will therefore have to consider two points of divergence (disjunction between the main lane and the 2 branches) and two points of convergence (junction between the main lane and the 2 branches).
The circuit modeling is carried out using a directed graph with 17 nodes (Figure 3):
- Node P corresponds to the AGV parking lot.
- Nodes R1 and R2 correspond to the 2 baggage collection points linked to the 2 entry flows.
- Nodes D1 and D2 correspond to the 2 baggage drop-off points linked to the 2 exit flows.
- Nodes P3 and P11 correspond to the 2 points of divergence of the circuit.
- Nodes P8 and P16 correspond to the 2 points of convergence of the circuit.
- The other nodes (P1, P2, P4, P6, P9, P10, P12, P14) correspond to characteristic points of the circuit topology.
Figure 3.
Graph based Modelling of handling system with cinematic data.
The AGVs’ mission is to transport baggage between the pick-up points (R1 or R2) and drop-off points (D1 or D2) points. They are modeled by software agents to simulate their movements and baggage handling activities, and to analyze their behaviors in different situations implemented in the form of scenarios. The agent paradigm is indeed well suited for the simulation and analysis of the activity of autonomous entities, active and reactive to their environment [27,28].
The baggage is modeled by objects containing elementary information such as its identifier and its position on the circuit. It is created according to various input flow strategies defined in the simulation scenarios: continuous, discontinuous, random flows, or corresponding to real cases recorded in airports used as tests.
Finally, an office, not connected to the circuit graph detailed above, is located near the AGV parking lot. A human operator is in this office to supervise the system and intervene in the event of a problem in baggage handling or in the circulation of the AGVs.
3.2. HCI of ARTEMIS
Human-Computer Interaction (HCI) focuses on designing better computer interfaces by evaluating their usefulness through user trials, where real users assess the system’s effectiveness and ease of use [29]. The goal is to create interfaces that are intuitive, efficient, and user-friendly. Norman [30] argues that devices and interfaces should be easy to use, intuitive, and function correctly, outlining six key design principles: visibility, feedback, affordance, mental mapping, constraints, and consistency. These principles help create effective designs. Other principles like visibility, affordance, feedback, simplicity, structure, consistency, tolerance, and accessibility are emphasized [31].
Interface design rules include striving for consistency, enabling frequent users to use shortcuts, and offering informative feedback [32]. Other guidelines suggest designing dialogue to provide closure, simple error handling, and easy action reversal. Supporting an internal locus of control and reducing short-term memory load are also essential [32]. These guidelines aim to create intuitive and user-friendly interfaces.
Usability is not a single characteristic but a combination of factors. According to Nielsen [33,34], a system is usable if it is easy to learn, easy to remember, error-free or error-forgiving, and pleasant to use. Additionally, the Nielsen Norman Group proposed 10 general guidelines (heuristics) to improve human-computer interaction. These heuristics are broad recommendations, not strict rules, intended to enhance the user experience.
The general principles of interaction design emphasize that a system should provide clear and timely status updates, present information in ways users can understand, and maintain consistency in language, icons, and other elements to prevent confusion. These principles should be mapped to heuristics or guidelines, which should then be linked to GUI design rules. From there, solutions should be developed, evaluated, and tested, ultimately converging toward the optimal interface. These mappings ensure that user-computer interaction is a problem-solving process centered on the user’s experience [35].
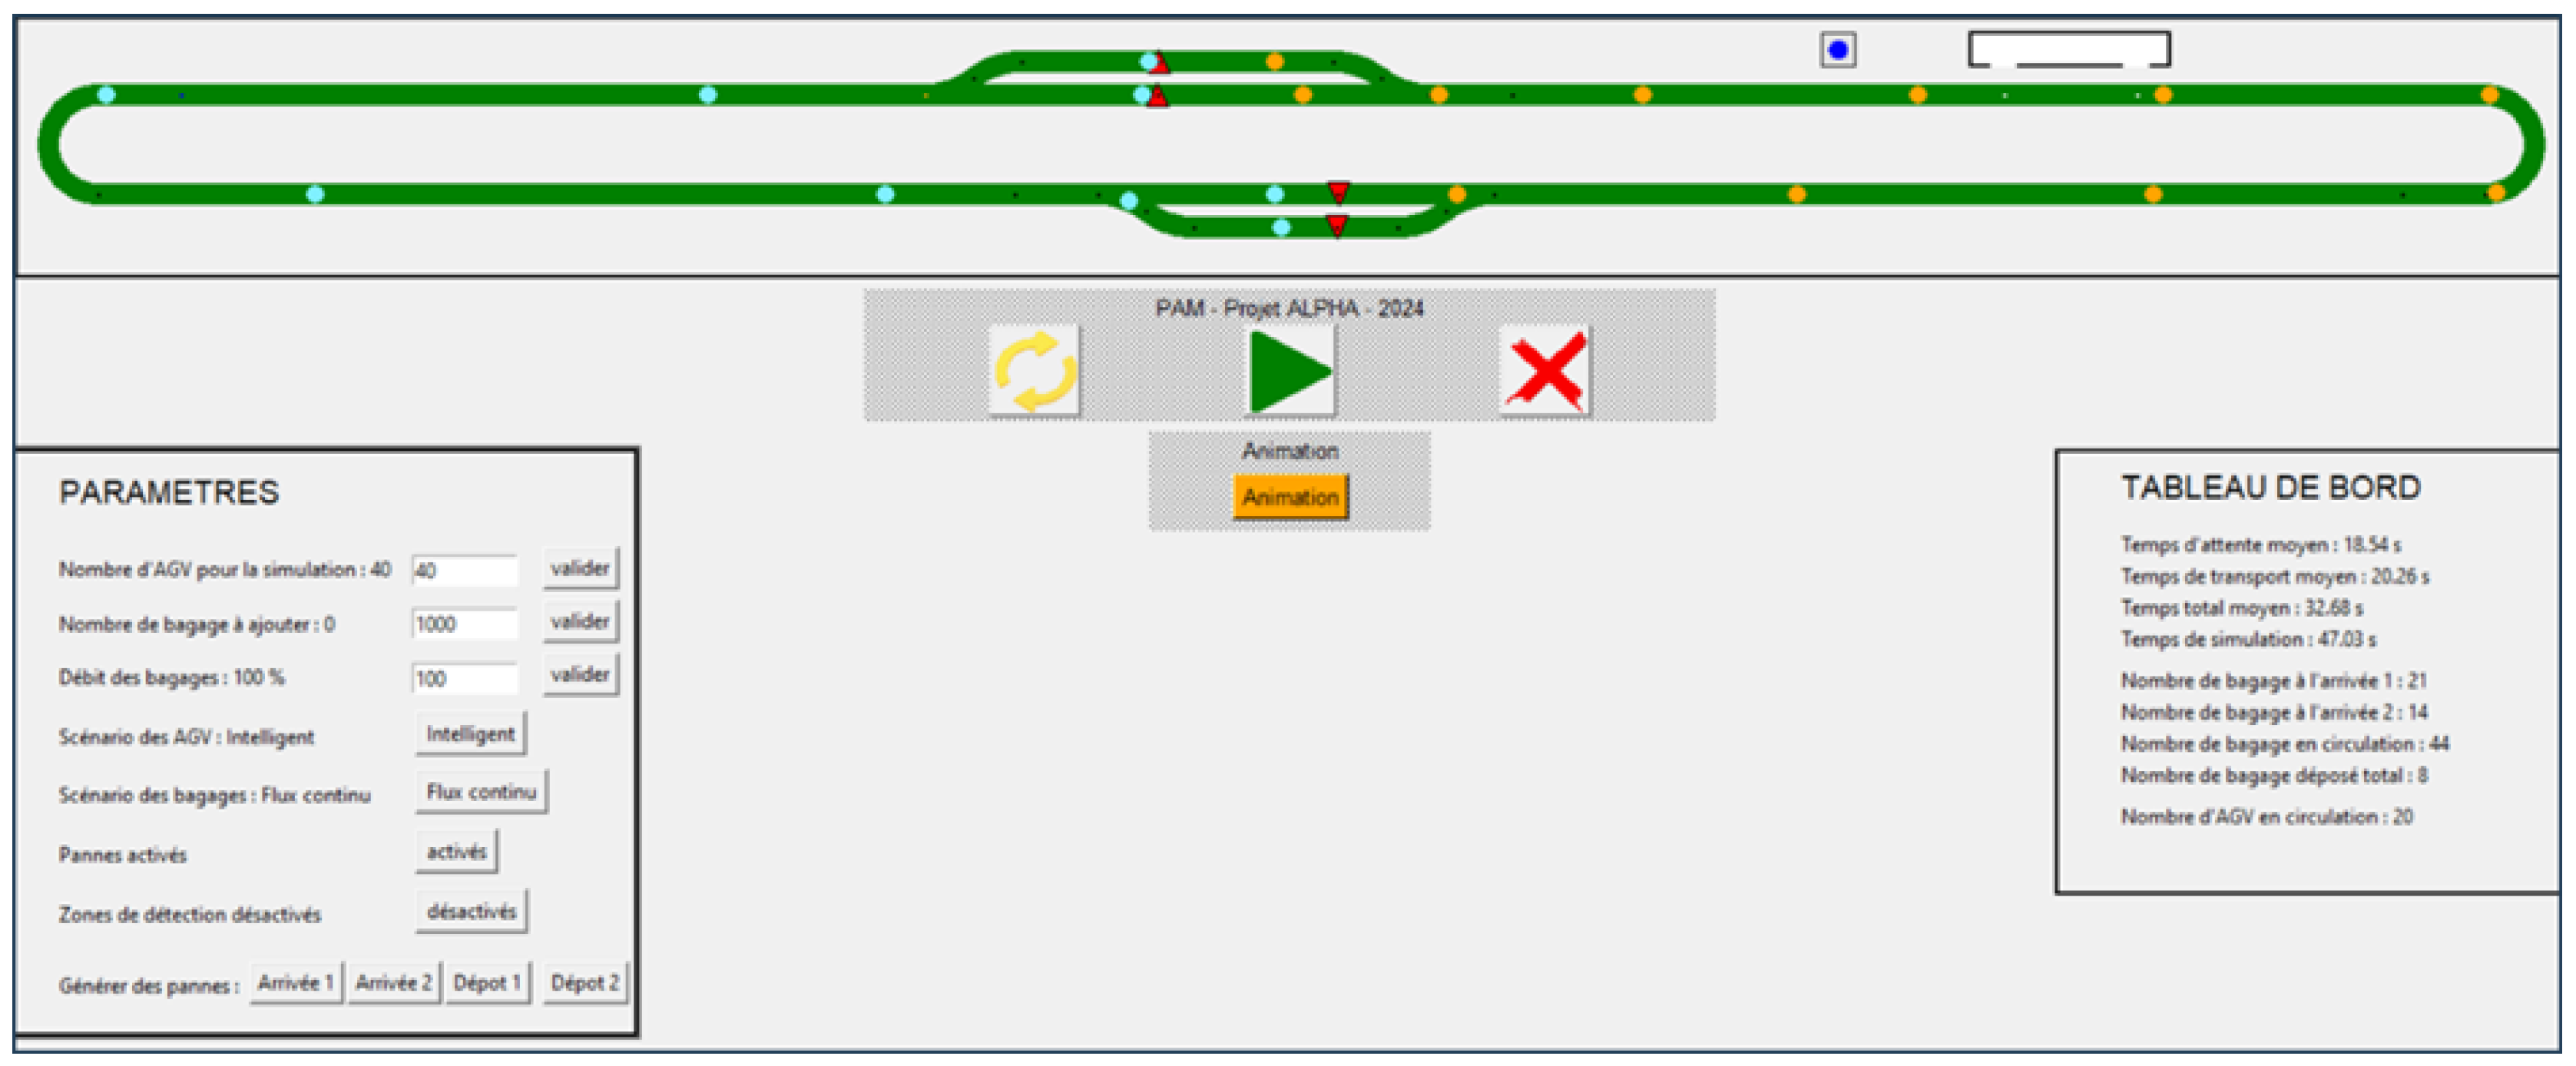
A simulation, based on the model presented above, offers the possibility to visualize and analyze in a preliminary way the behavior of the AGVs through predefined scenarios. This allows, for example, to evaluate the impact of an AGV failure or to test different baggage arrival flows. This type of simulation can also generate key indicators, such as the average waiting time and the average transport time, allowing an in-depth analysis of the performance. These results are presented through an intuitive and ergonomic user interface, designed by considering user-computer interaction as a problem-solving process focused on the user’s experience. This approach ensures that the interface design accounts for the system’s functionality, behavior, and the user’s experience. The user interface and AGVs circulating on the circuit are modeled in Python and developed using a system based on software agents [15,36].
The HCI is structured in four main sections (Figure 4):
- A simulation area. This space displays the circuit where the AGVs evolve and presents in real time the simulation in progress.
- A parameter table. This space allows users to configure the simulation parameters.
- A dashboard. This area provides real-time monitoring of information related to the simulation, including essential data to analyze its evolution.
- The control commands. A series of dedicated buttons allow you to start, stop or reset the simulation as needed.
The table of parameters offers the possibility to configure the following elements:
- The number of AGVs on the circuit, therefore participating in the simulation
- The total number of bags managed in the simulation.
- The number of bags processed per minute in the simulation.
- The status of the baggage entry and exit processes.
- The selection of a predefined simulation scenario.
Figure 4.
HCI of ARTEMIS.
4. Computing Strategies for ARTEMIS
4.1. Strategies to Optimize Baggage Queue Waiting Time
Five strategies are simulated to test their effectiveness and evaluate their performance in the system:
- Turnstile Strategy: AGVs continuously circulate along the circuit and pick up a bag if one is available at R1 or R2, depending on their route.
- On-Demand Strategy: AGVs are deployed only when baggage arrives and are available in the parking area, operating with an ideal number of AGVs.
- Delay Parking Strategy: This is a variation of the On-Demand Strategy, where AGVs remain on the circuit slightly longer to collect all the baggage.
- Needs Prediction Strategy: The number of AGVs circulating on the circuit is periodically calculated based on predicted demand. This is a variation of the On-Demand Strategy, where AGVs enter the circuit before baggage arrival.
- Mixed Advance/Delay Strategy: This combines strategies 3 and 4, deploying AGVs into the circuit in advance and delaying them towards the end as necessary.
4.2. Numerical Simulation Results
The queuing model is implemented in Simulink-MATLAB for the intersection of the circuit. A round-robin method is defined for managing the traffic flow. This queuing model is used to minimize the number of AGVs present in the On-Demand Strategy, while maximizing the number of bags handled. The queuing system is characterized by the following assumptions:
- The arrival of baggage follows a Poisson process.
- The service time for each baggage at the baggage loading and drop-off points is deterministically distributed; each service taking 4 seconds.
Using numerical simulations, the maximum number of AGVs for the circuit shown in Figure 4 is determined to be 31 AGVs (NbAGVmax = 31):
- Pickup/Drop-off Service Rate (µ): the average service duration is µ =2 seconds, as there are two services, each lasting 4 seconds.
- Baggage Arrival Rate (λ): the average baggage arrival duration satisfies 0≤λ<2.
Numerical simulations lead to the following conclusions:
- If λ≤0.5, the system converges.
- If λ>0.5, the system diverges.
Then the highest rate of baggage handling: λmax=0.5.
Thanks also to several numerical simulations we can obtain: given an integer N>0 (N=1,2,3,…), the ideal number of AGVs according to the number of bags is defined by (1):
λ*=λmax/N, which implies that NbAGV* = NbAGVmax/N
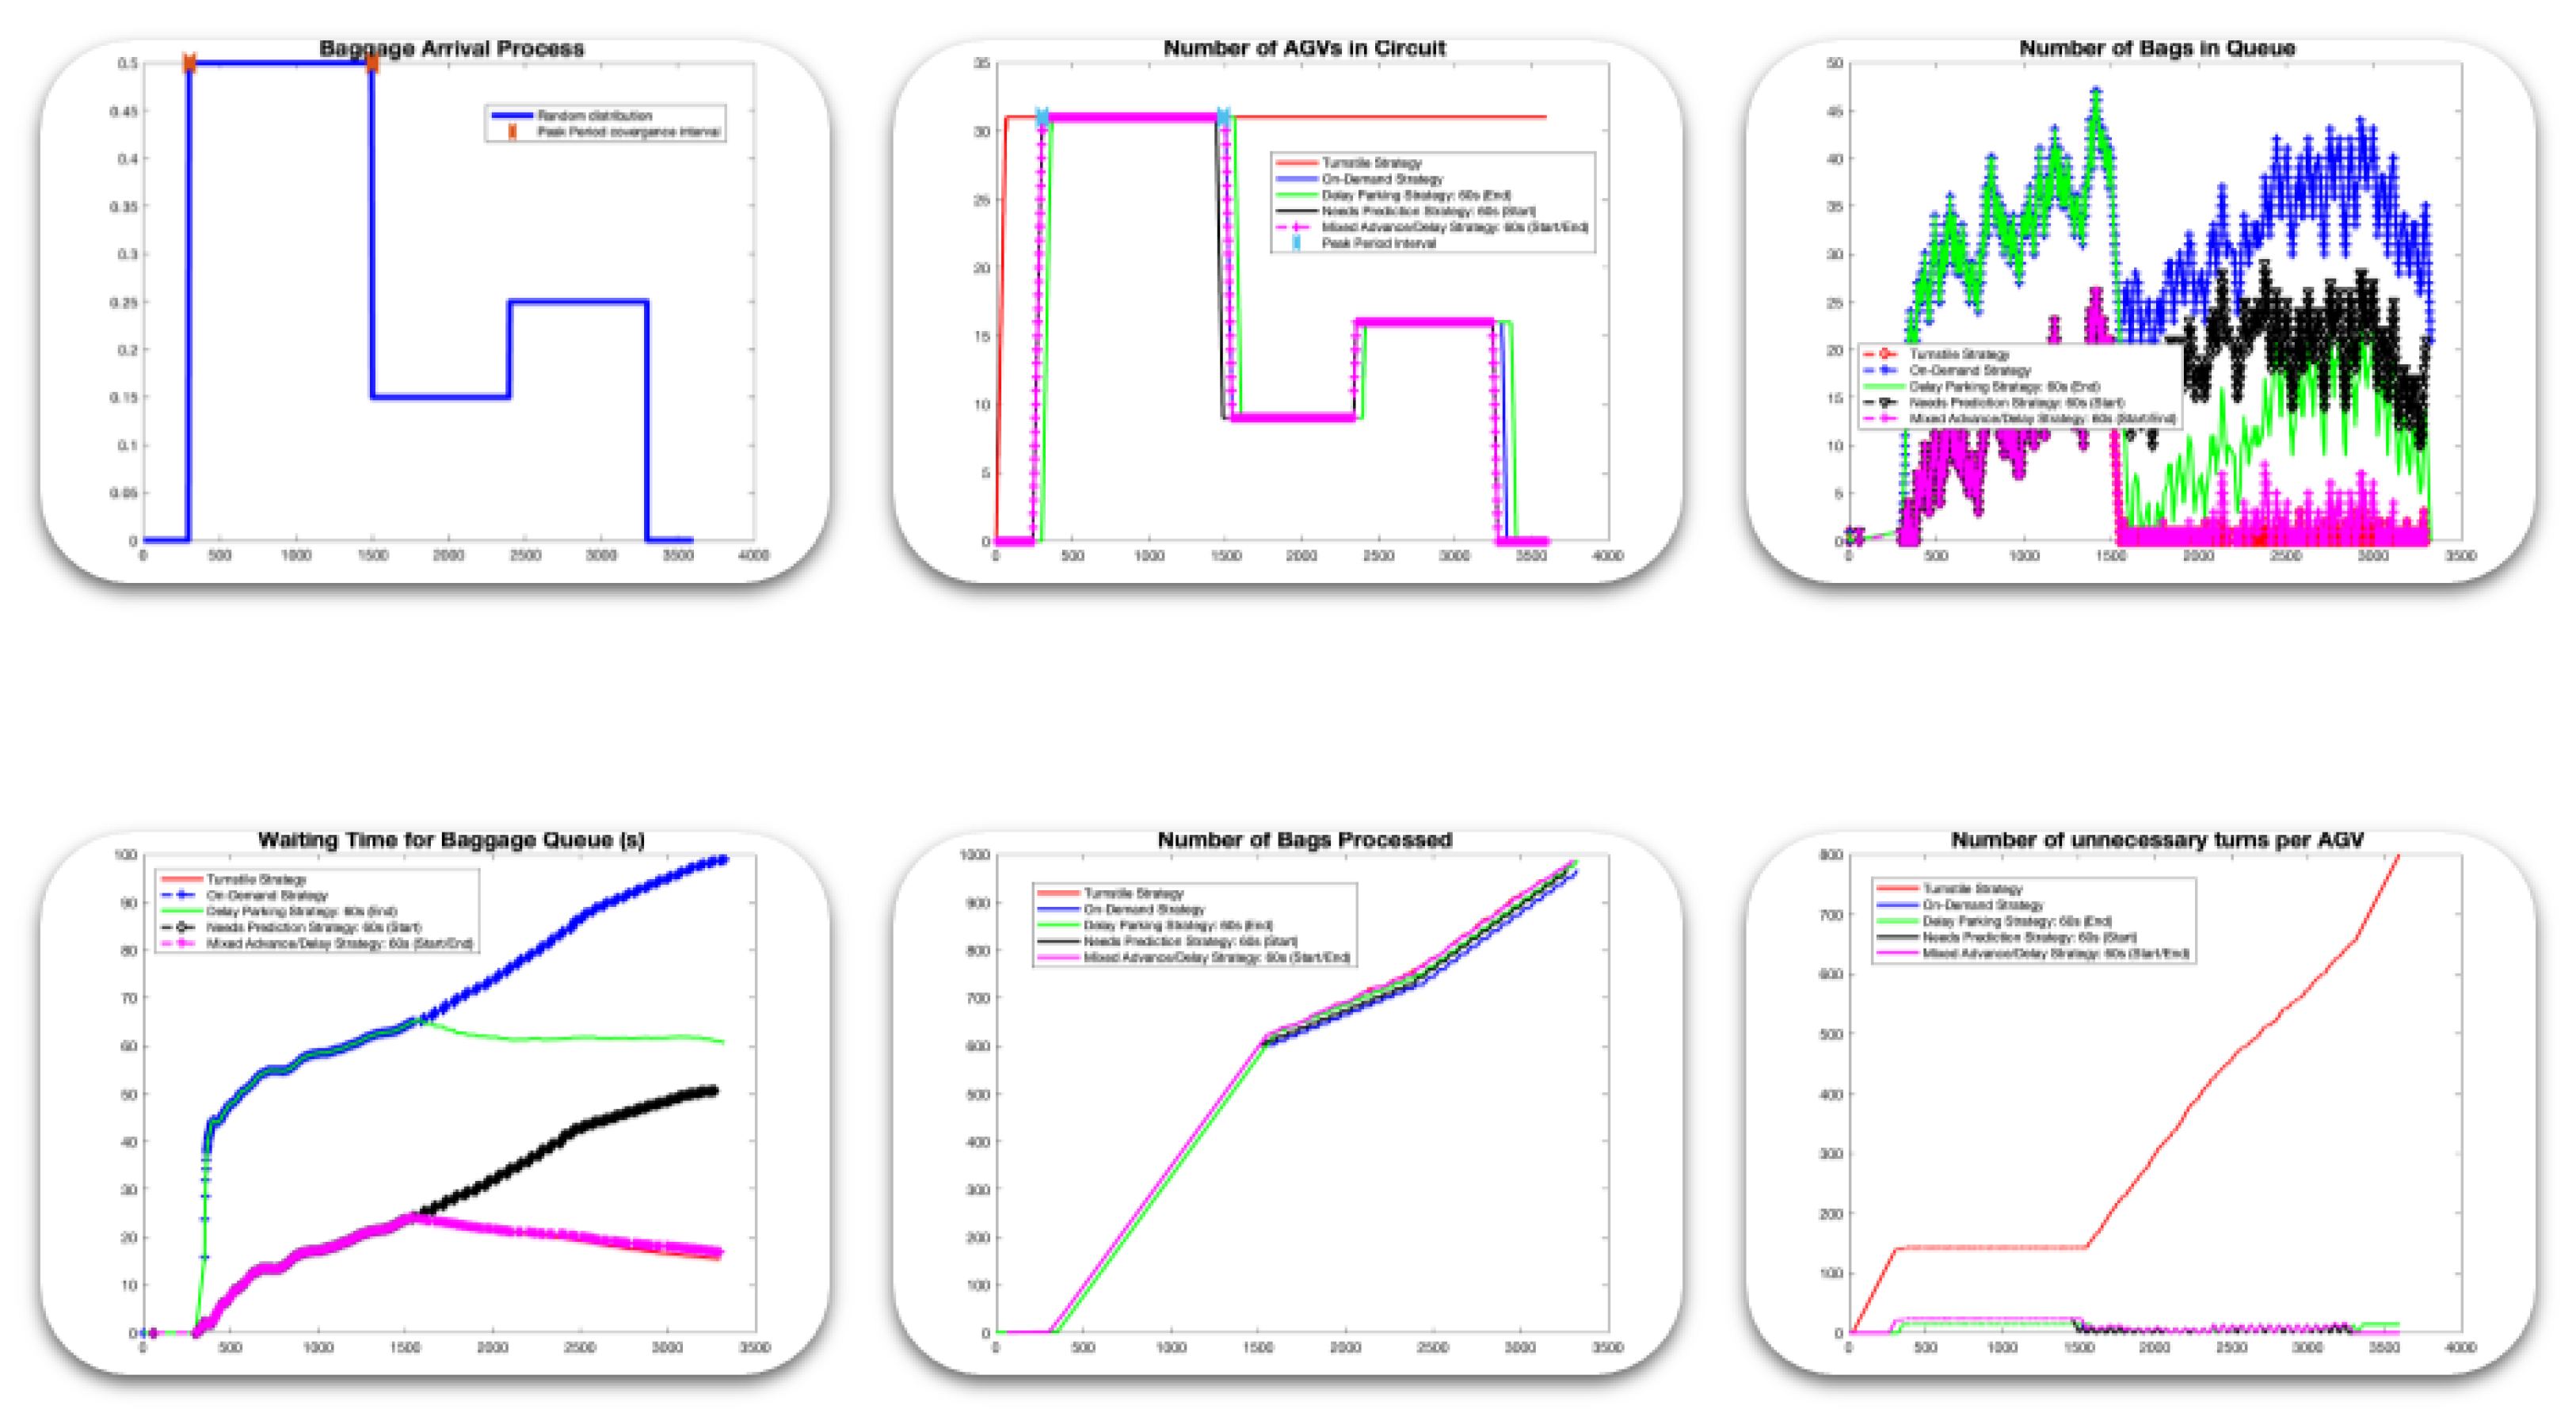
Six scenarios are conducted to evaluate the five strategies previously presented, focusing on energy consumption, the number of bags in the queue, and the waiting time for the bags. The first two scenarios simulate variable baggage flows with one and then two peak periods. The next three scenarios simulate baggage flows in the form of a staircase with a baggage peak positioned successively at the beginning, in the middle and then at the end of the simulated period. The last scenario simulates a baggage flow with two peak periods, one converging and one diverging. All simulations are run over a period of one hour using MATLAB and Simulink.
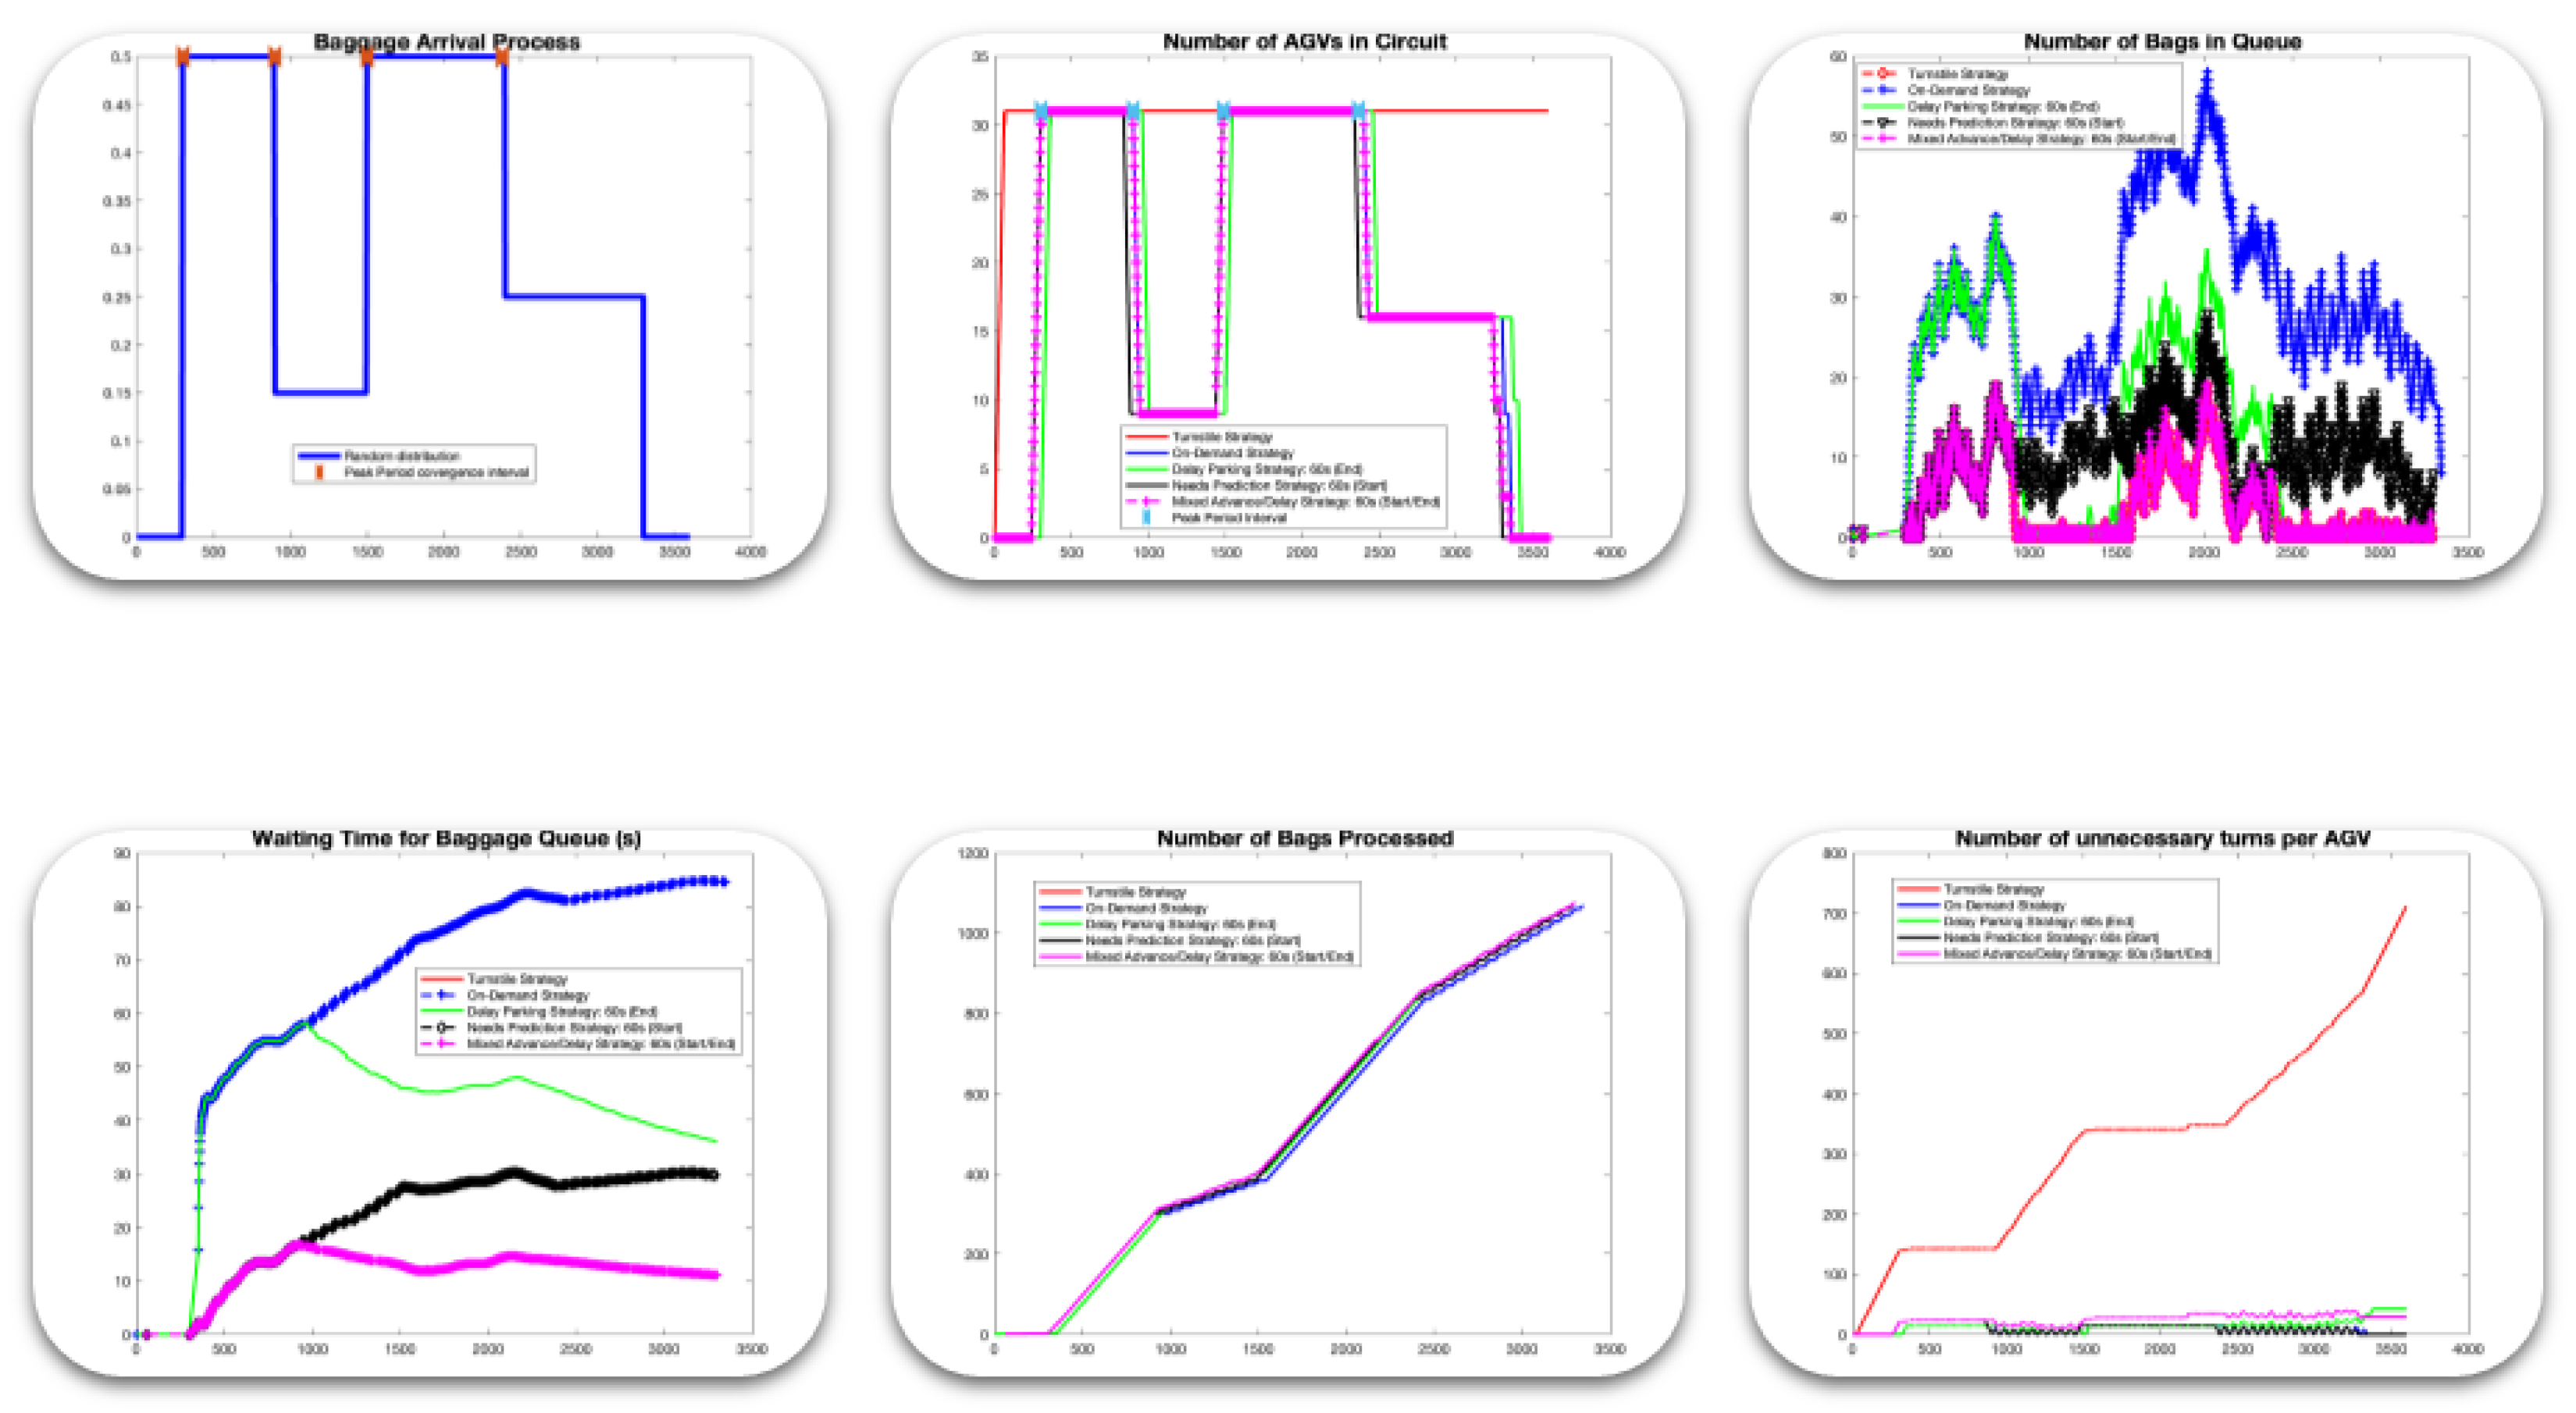
4.2.1. Scenario 1: Variable Baggage Flows with a Single Peak Period
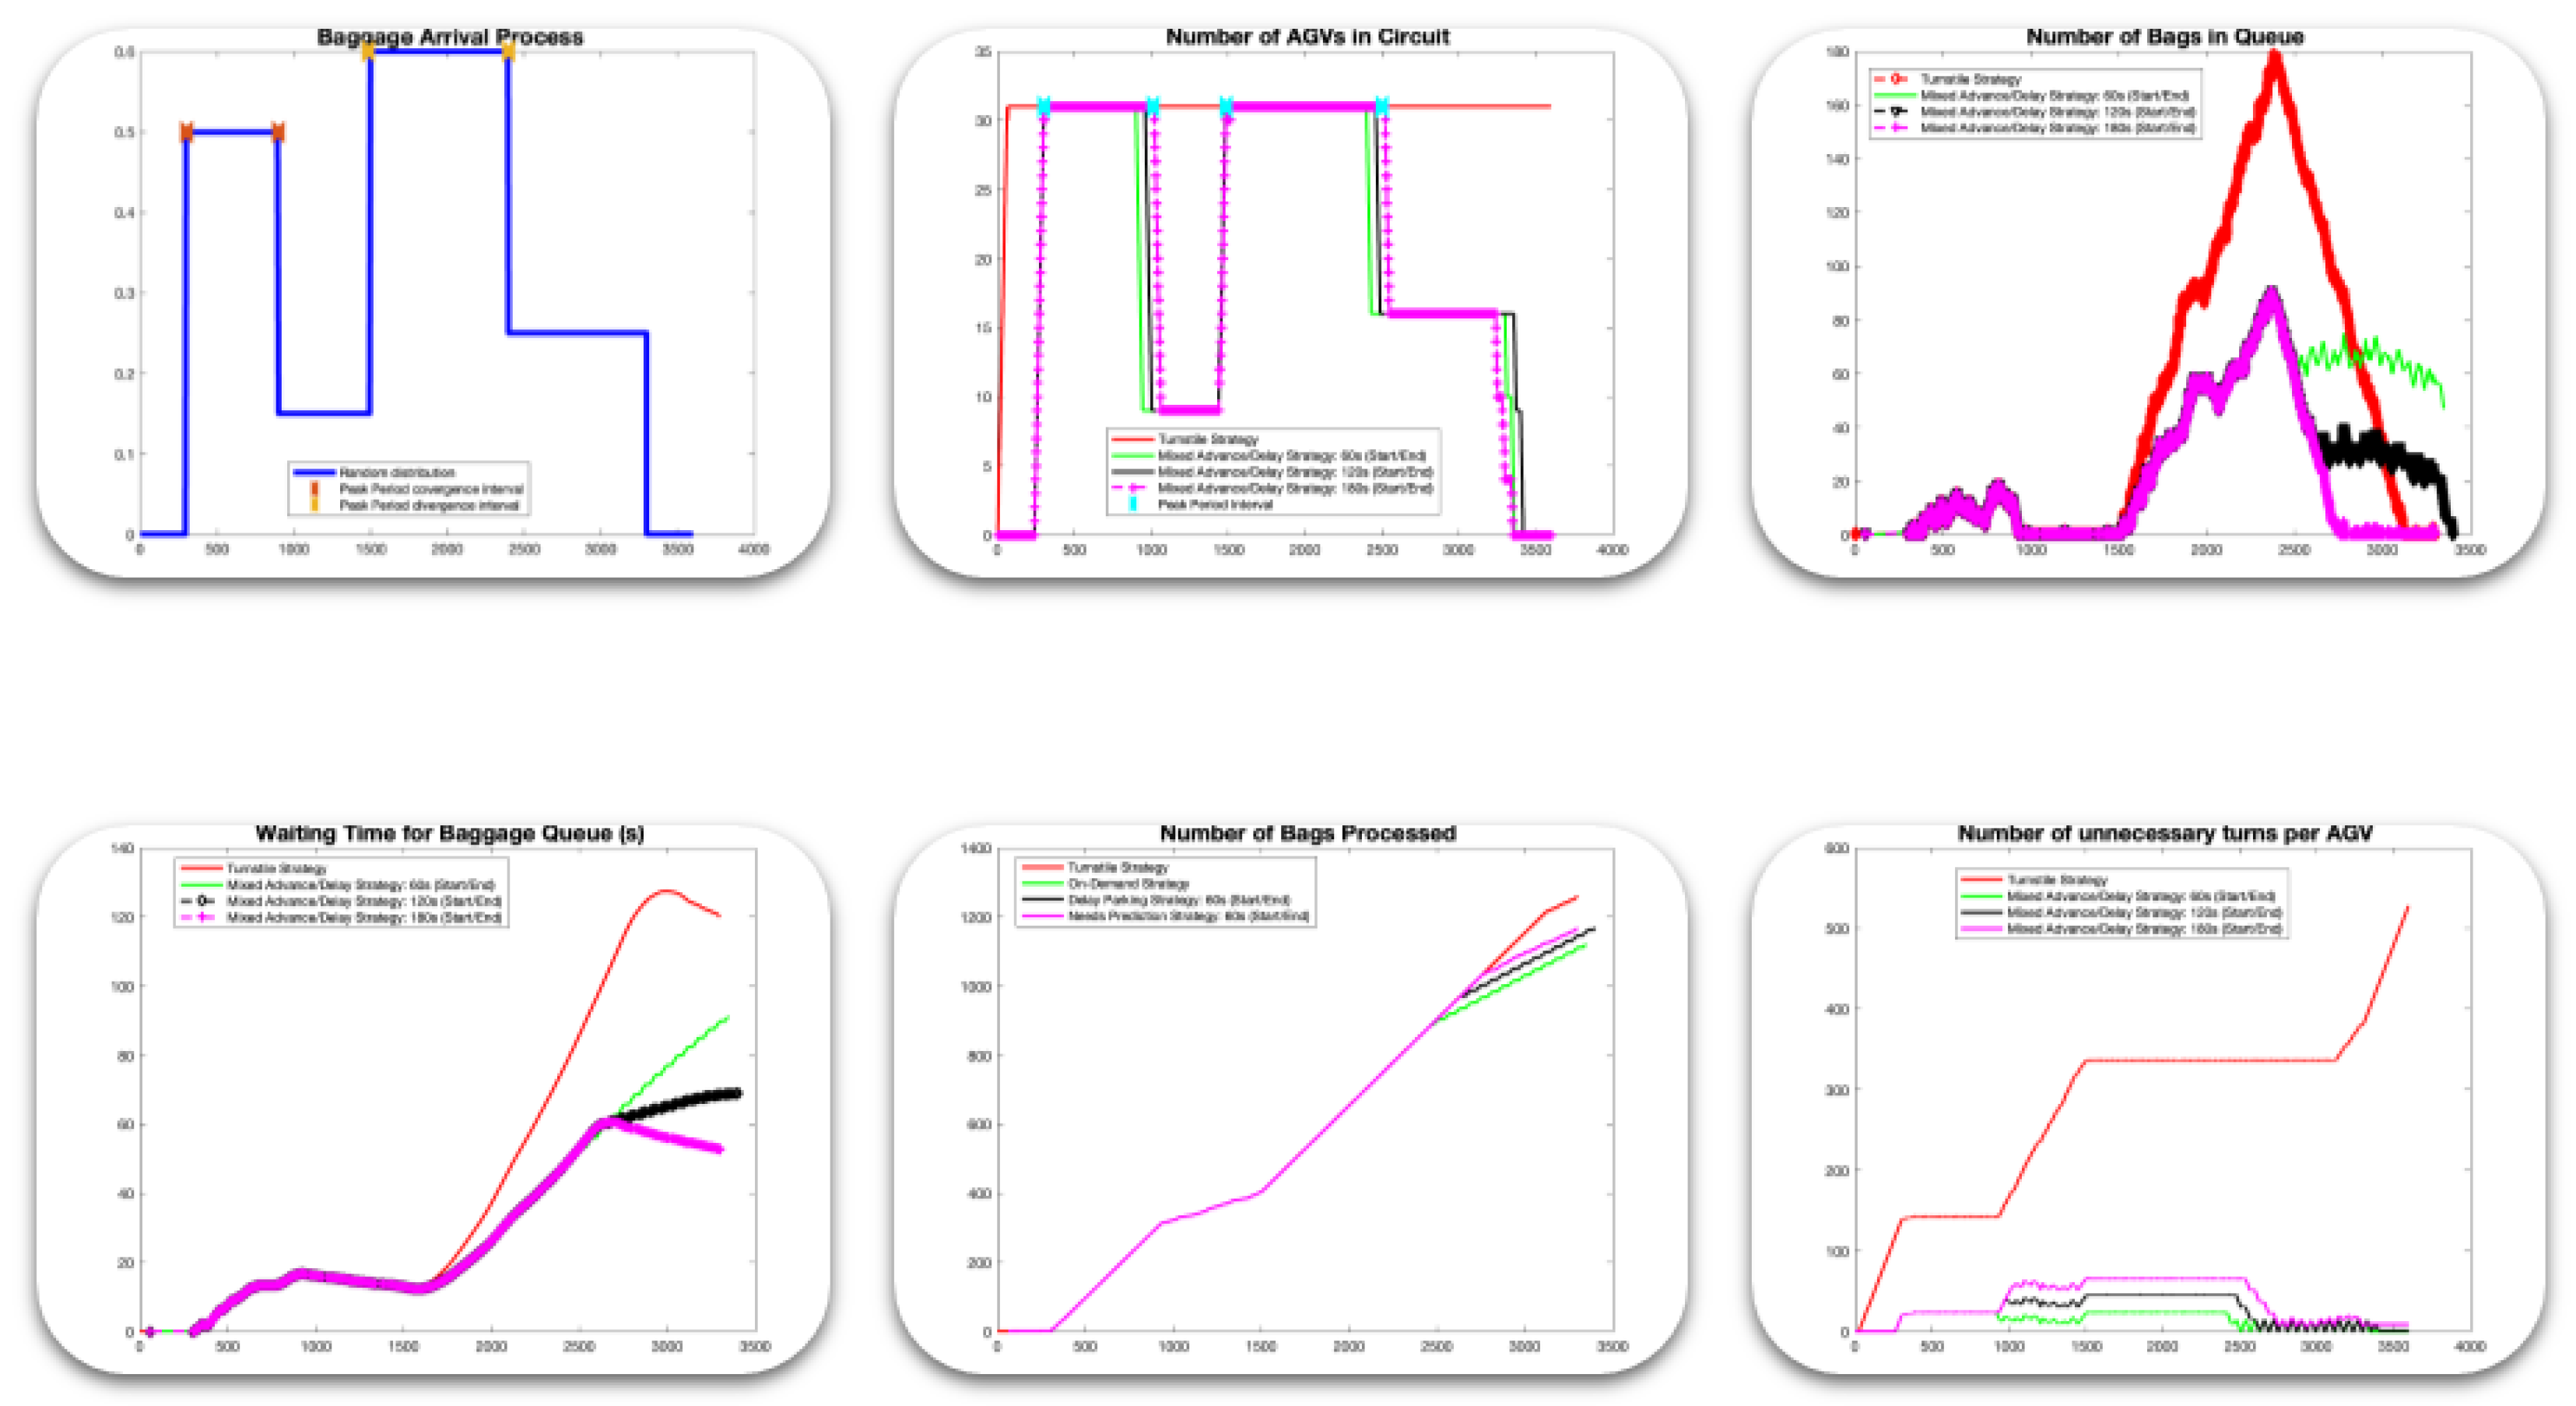
Scenario 1 represents a variable baggage flow, starting with a single peak period (λmax = 0.5), followed by a decrease in large bags, and finally showing a slight increase towards the middle of the peak period.
Figure 5.
Results for scenario 1: (a) Baggage arrival process; (b) Number of AGV in circuit; (c) Number of bags in queue; (d) Waiting time for baggage in queue; (e) Number of bags processed; (f) Number of unnecessary turns per AGV.
Figure 5.
Results for scenario 1: (a) Baggage arrival process; (b) Number of AGV in circuit; (c) Number of bags in queue; (d) Waiting time for baggage in queue; (e) Number of bags processed; (f) Number of unnecessary turns per AGV.
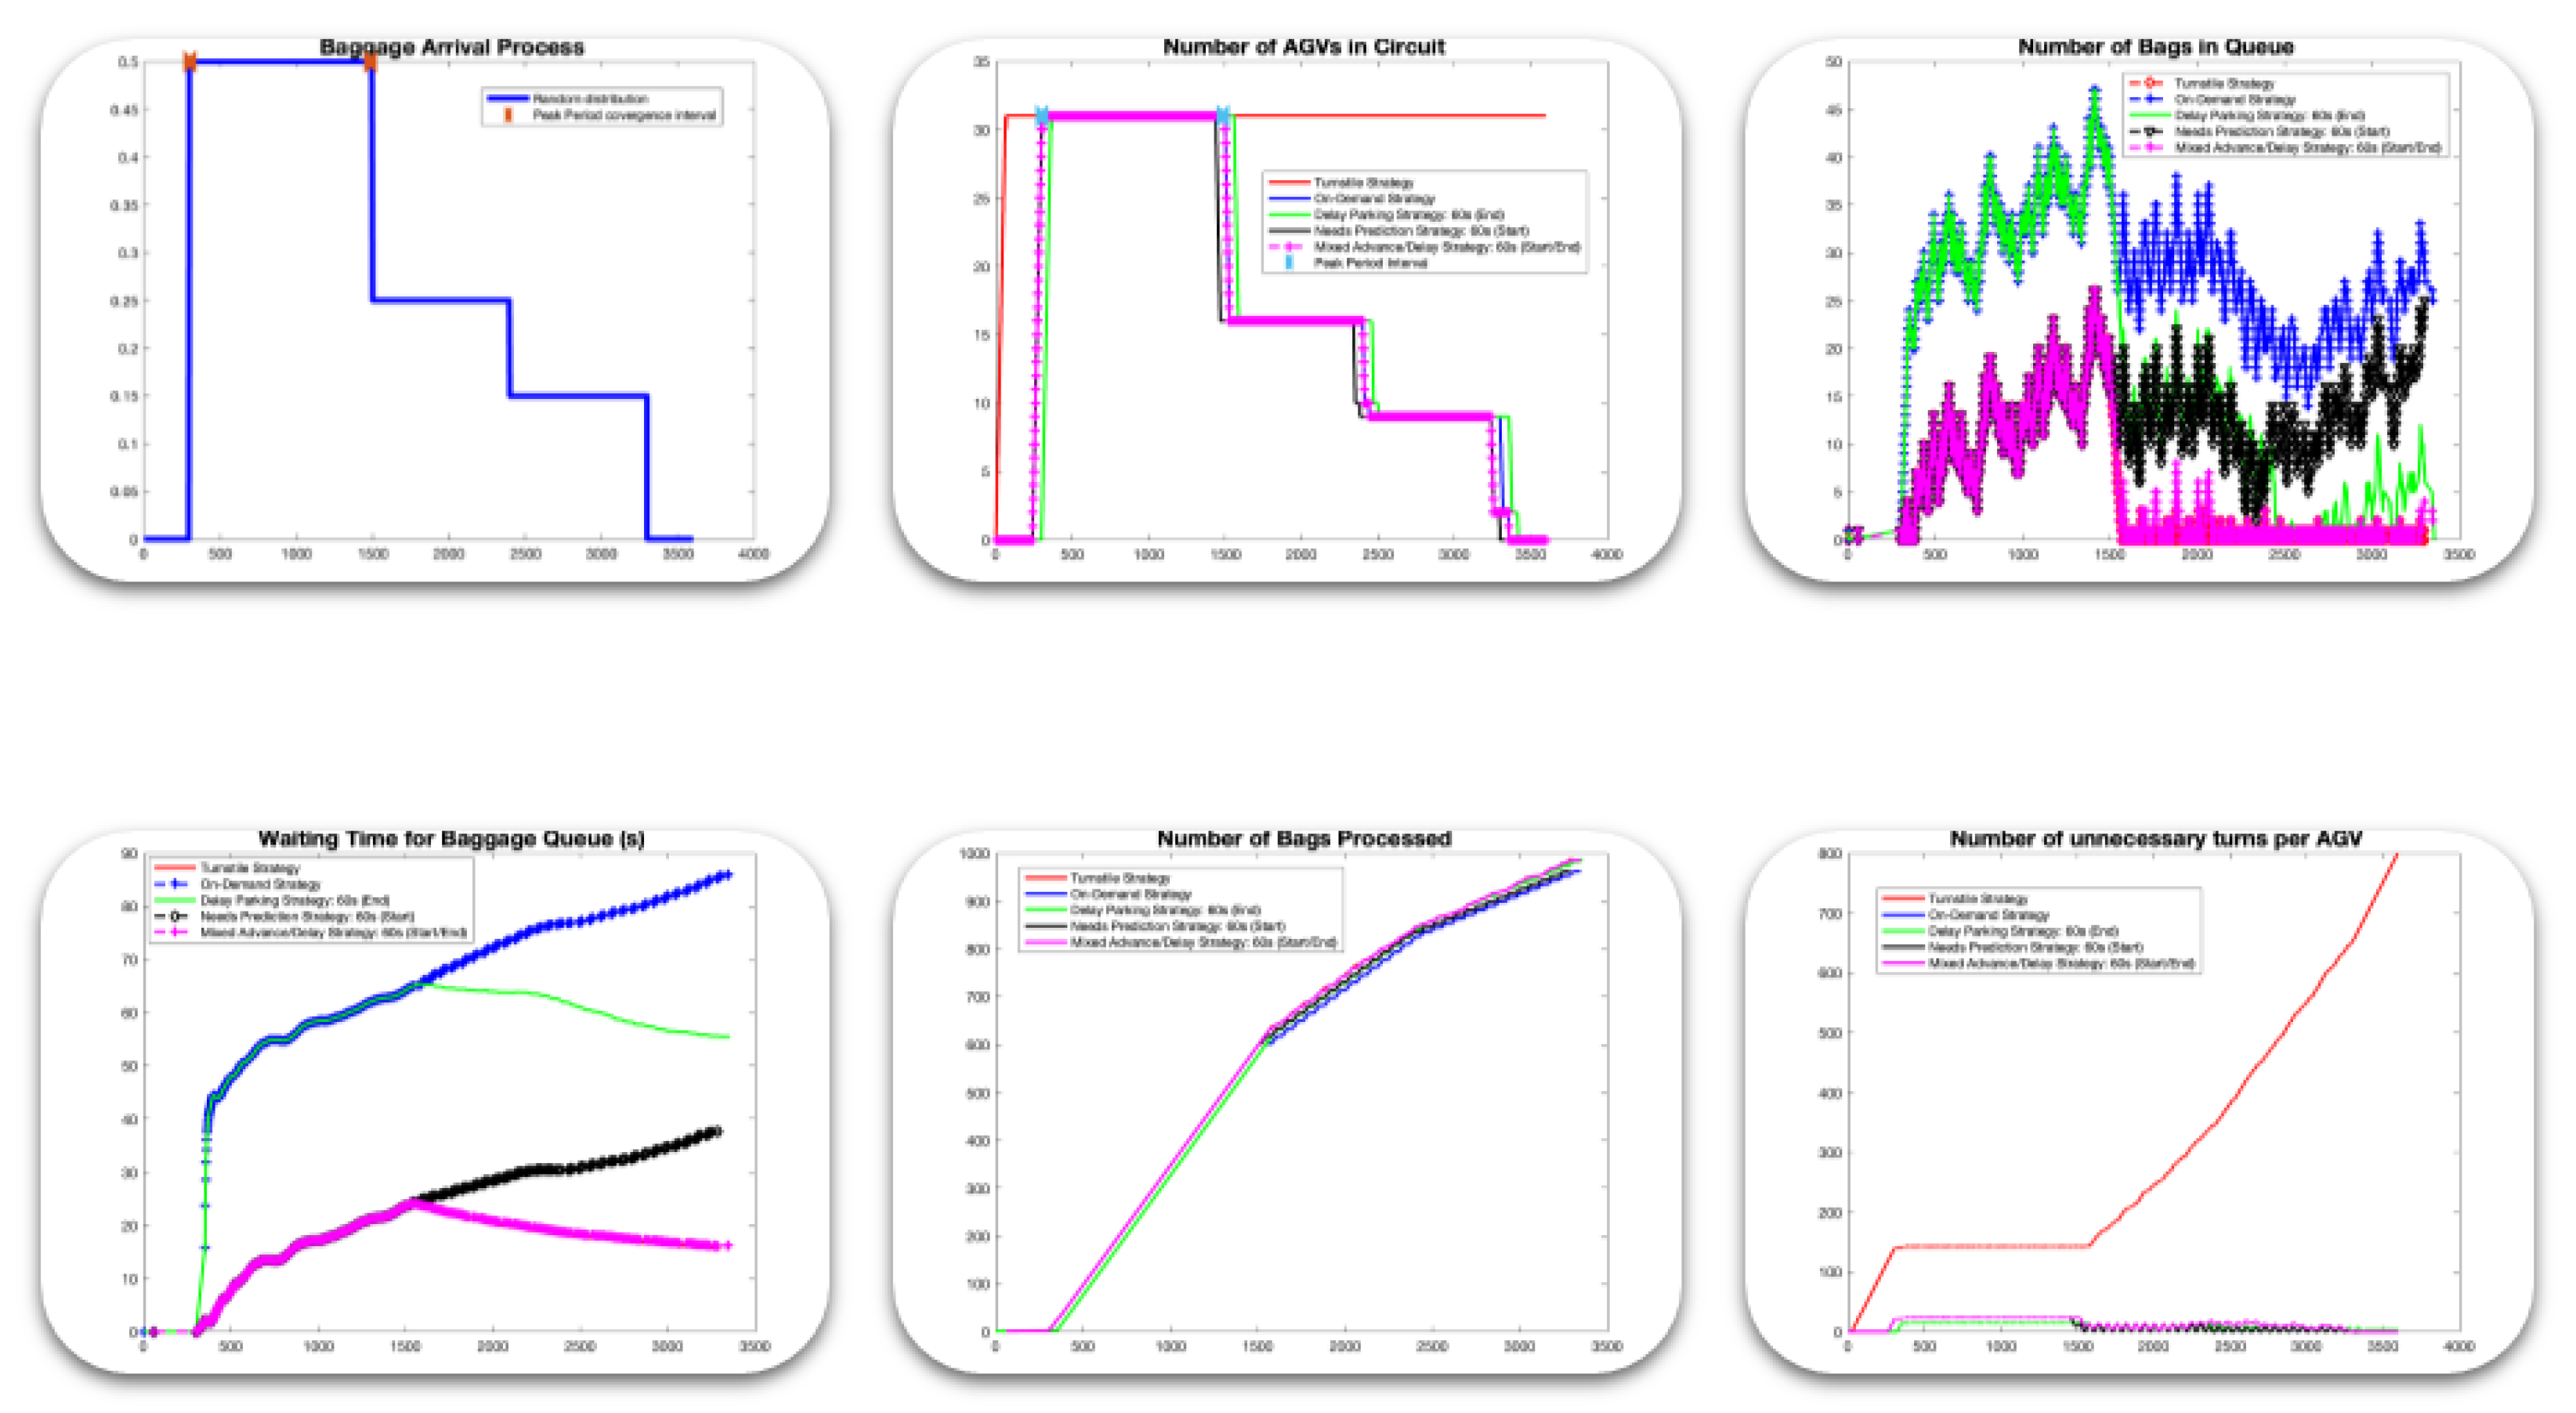
4.2.2. Scenario 2: Variable Baggage Flows with Two Converging Peak Periods
In contrast to Scenario 1, Scenario 2 highlights the variability of the baggage flow through two peak periods. The first peak occurs at the beginning, followed by a decrease in the number of large bags. Subsequently, a second peak period arises, followed by a slight decrease towards the middle of this peak.
Figure 6.
Results for scenario 2: (a) Baggage arrival process; (b) Number of AGV in circuit; (c) Number of bags in queue; (d) Waiting time for baggage in queue; (e) Number of bags processed; (f) Number of unnecessary turns per AGV.
Figure 6.
Results for scenario 2: (a) Baggage arrival process; (b) Number of AGV in circuit; (c) Number of bags in queue; (d) Waiting time for baggage in queue; (e) Number of bags processed; (f) Number of unnecessary turns per AGV.
4.2.3. Scenario 3: Baggage Flows as a Staircase Descending with a Peak Period at the Beginning
Scenario 3 presents baggage flow dynamics that are like those of Scenario 1, but with a staircase pattern. This indicates that there is a peak period at the beginning, during which the baggage volume is high, followed by a gradual decrease until there are no more bags in the queue.
Figure 7.
Results for scenario 3: (a) Baggage Arrival Process; (b) Number of AGV in circuit; (c) Number of Bags in Queue; (d) Waiting Time for Baggage in Queue; (e) Number of Bags Processed; (f) Number of unnecessary turns per AGV.
Figure 7.
Results for scenario 3: (a) Baggage Arrival Process; (b) Number of AGV in circuit; (c) Number of Bags in Queue; (d) Waiting Time for Baggage in Queue; (e) Number of Bags Processed; (f) Number of unnecessary turns per AGV.
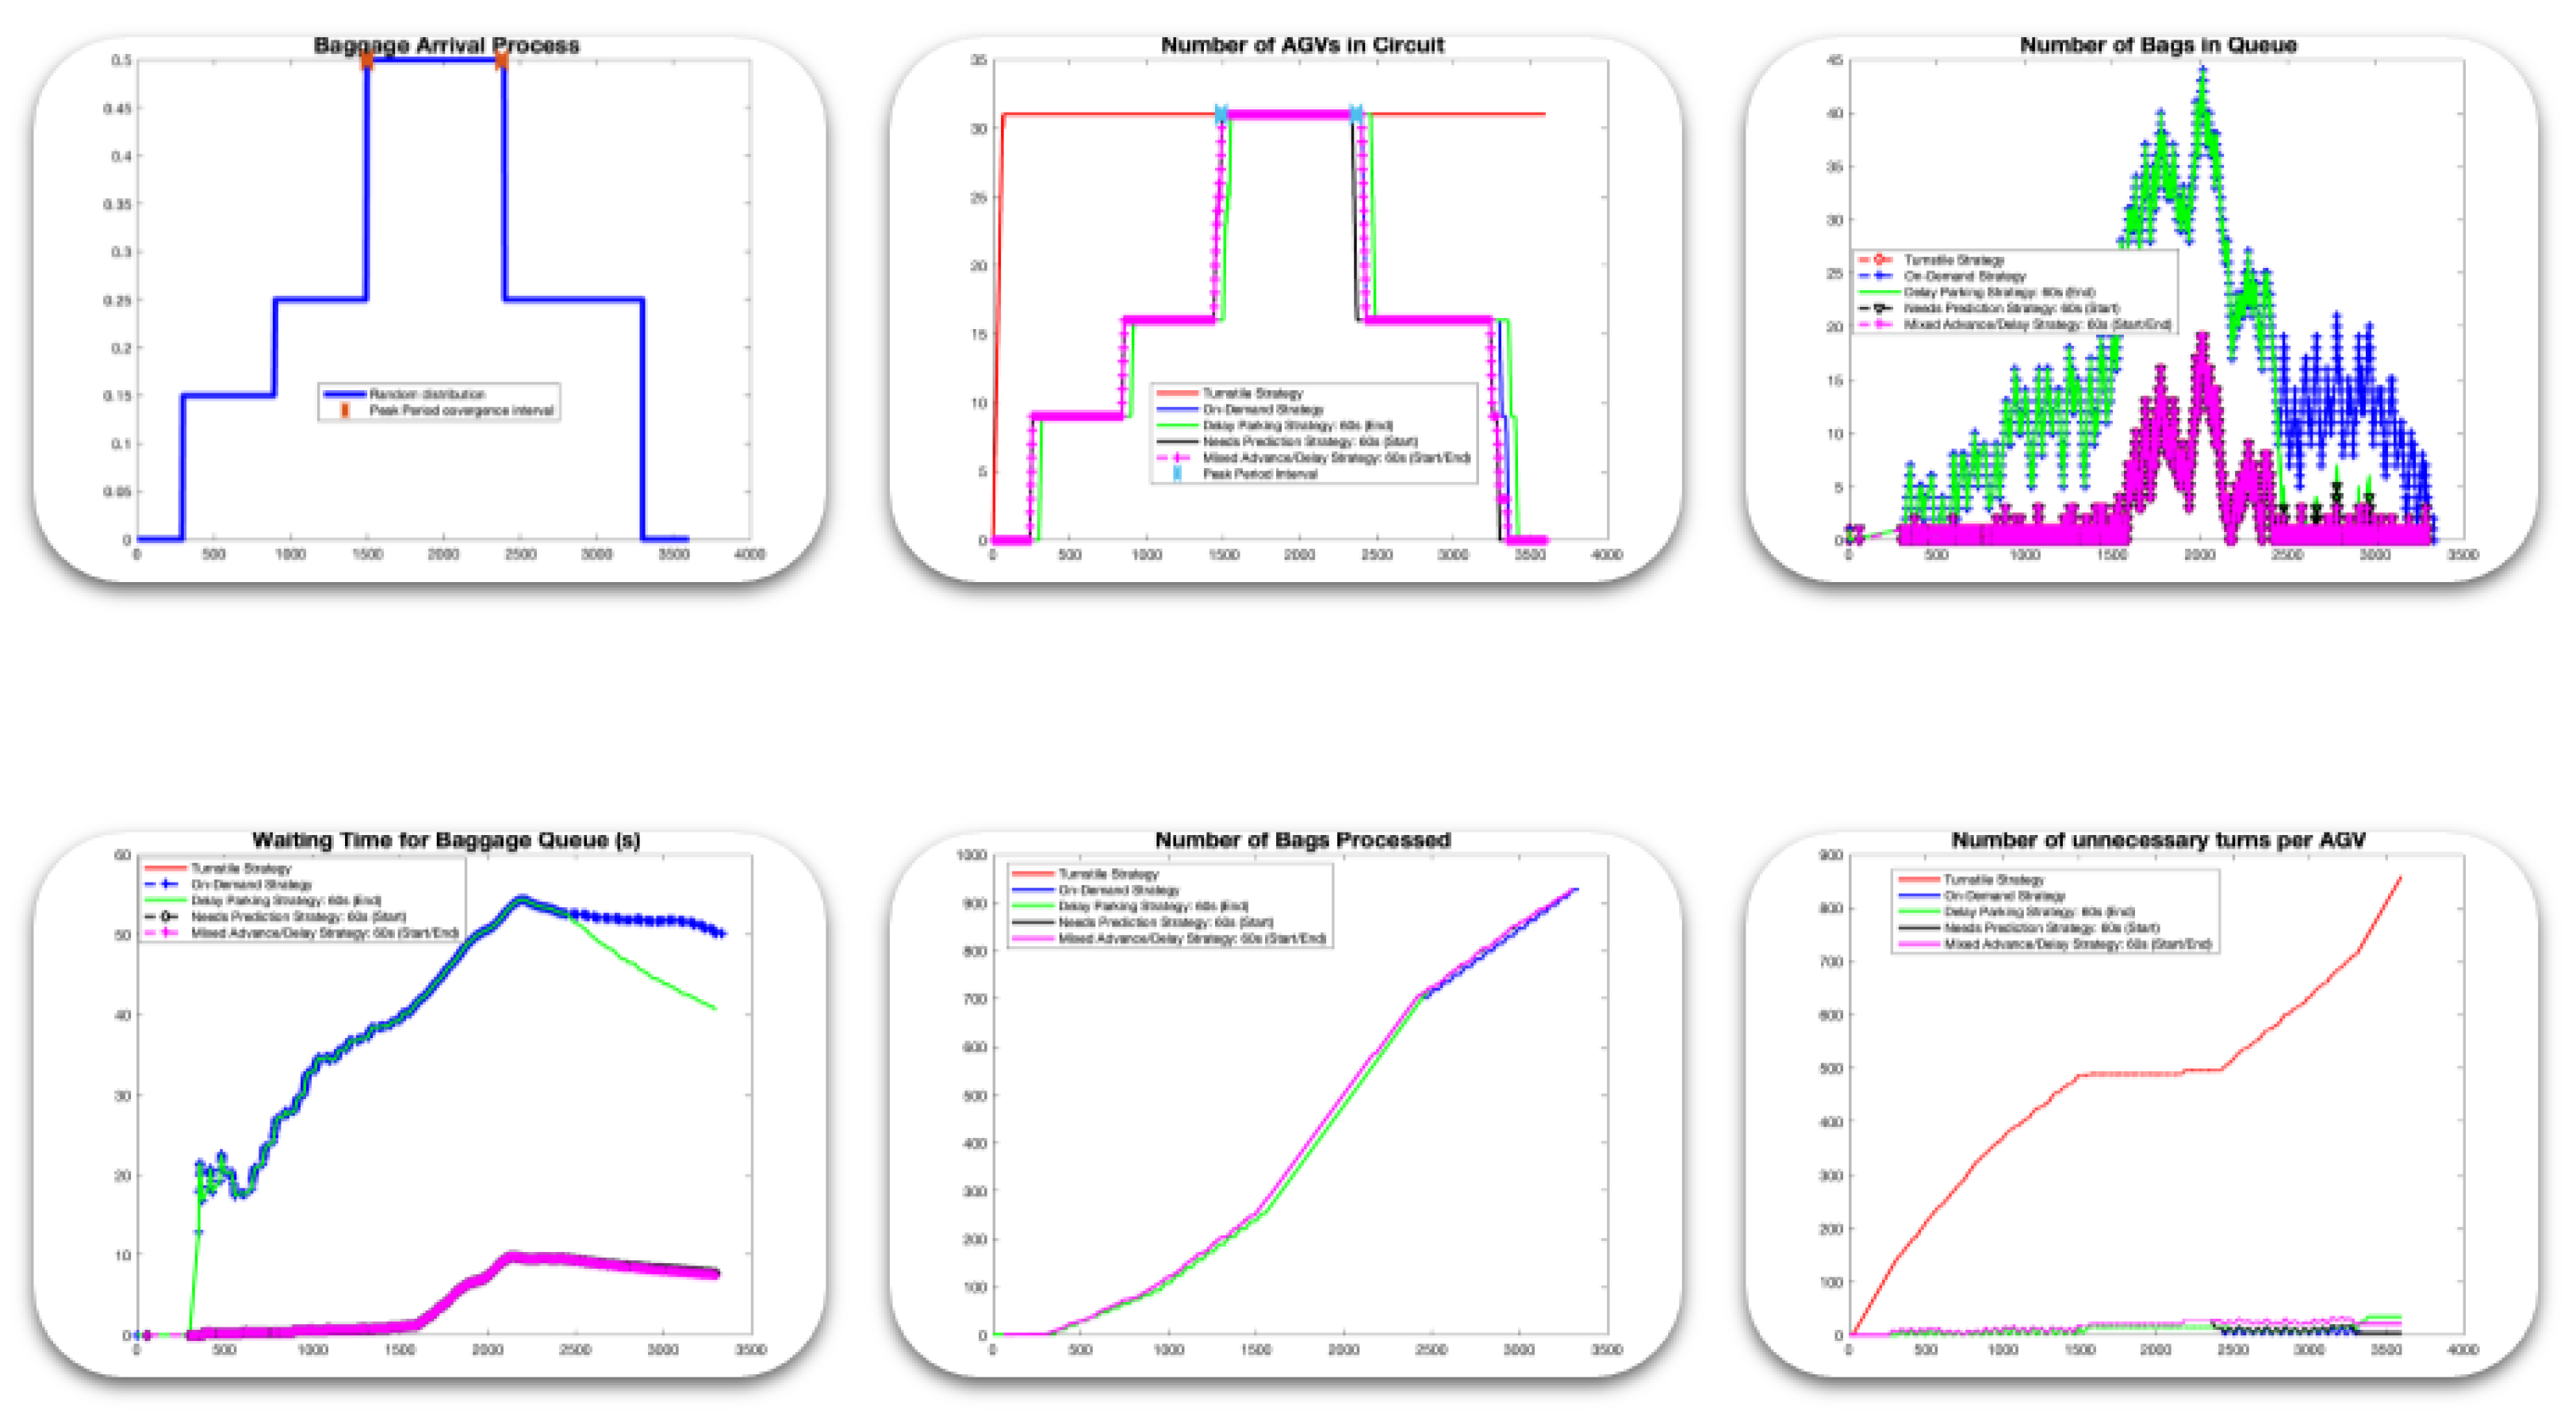
4.2.4. Scenario 4: Baggage Flows as a Staircase, with Both Upward and Downward Movement, Peaking in the Middle
Scenario 4 is a combination of Scenario 2 and Scenario 5 (the opposite of Scenario 3). It represents a baggage flow dynamic that gradually increases to a peak, followed by a slight decrease during the middle of this peak period. This pattern resembles a staircase curve, where a continuous rise is observed before reaching a maximum, followed by a slight decline.
Figure 8.
Results for scenario 4: (a) Baggage Arrival Process; (b) Number of AGV in circuit; (c) Number of Bags in Queue; (d) Waiting Time for Baggage in Queue; (e) Number of Bags Processed; (f) Number of unnecessary turns per AGV.
Figure 8.
Results for scenario 4: (a) Baggage Arrival Process; (b) Number of AGV in circuit; (c) Number of Bags in Queue; (d) Waiting Time for Baggage in Queue; (e) Number of Bags Processed; (f) Number of unnecessary turns per AGV.
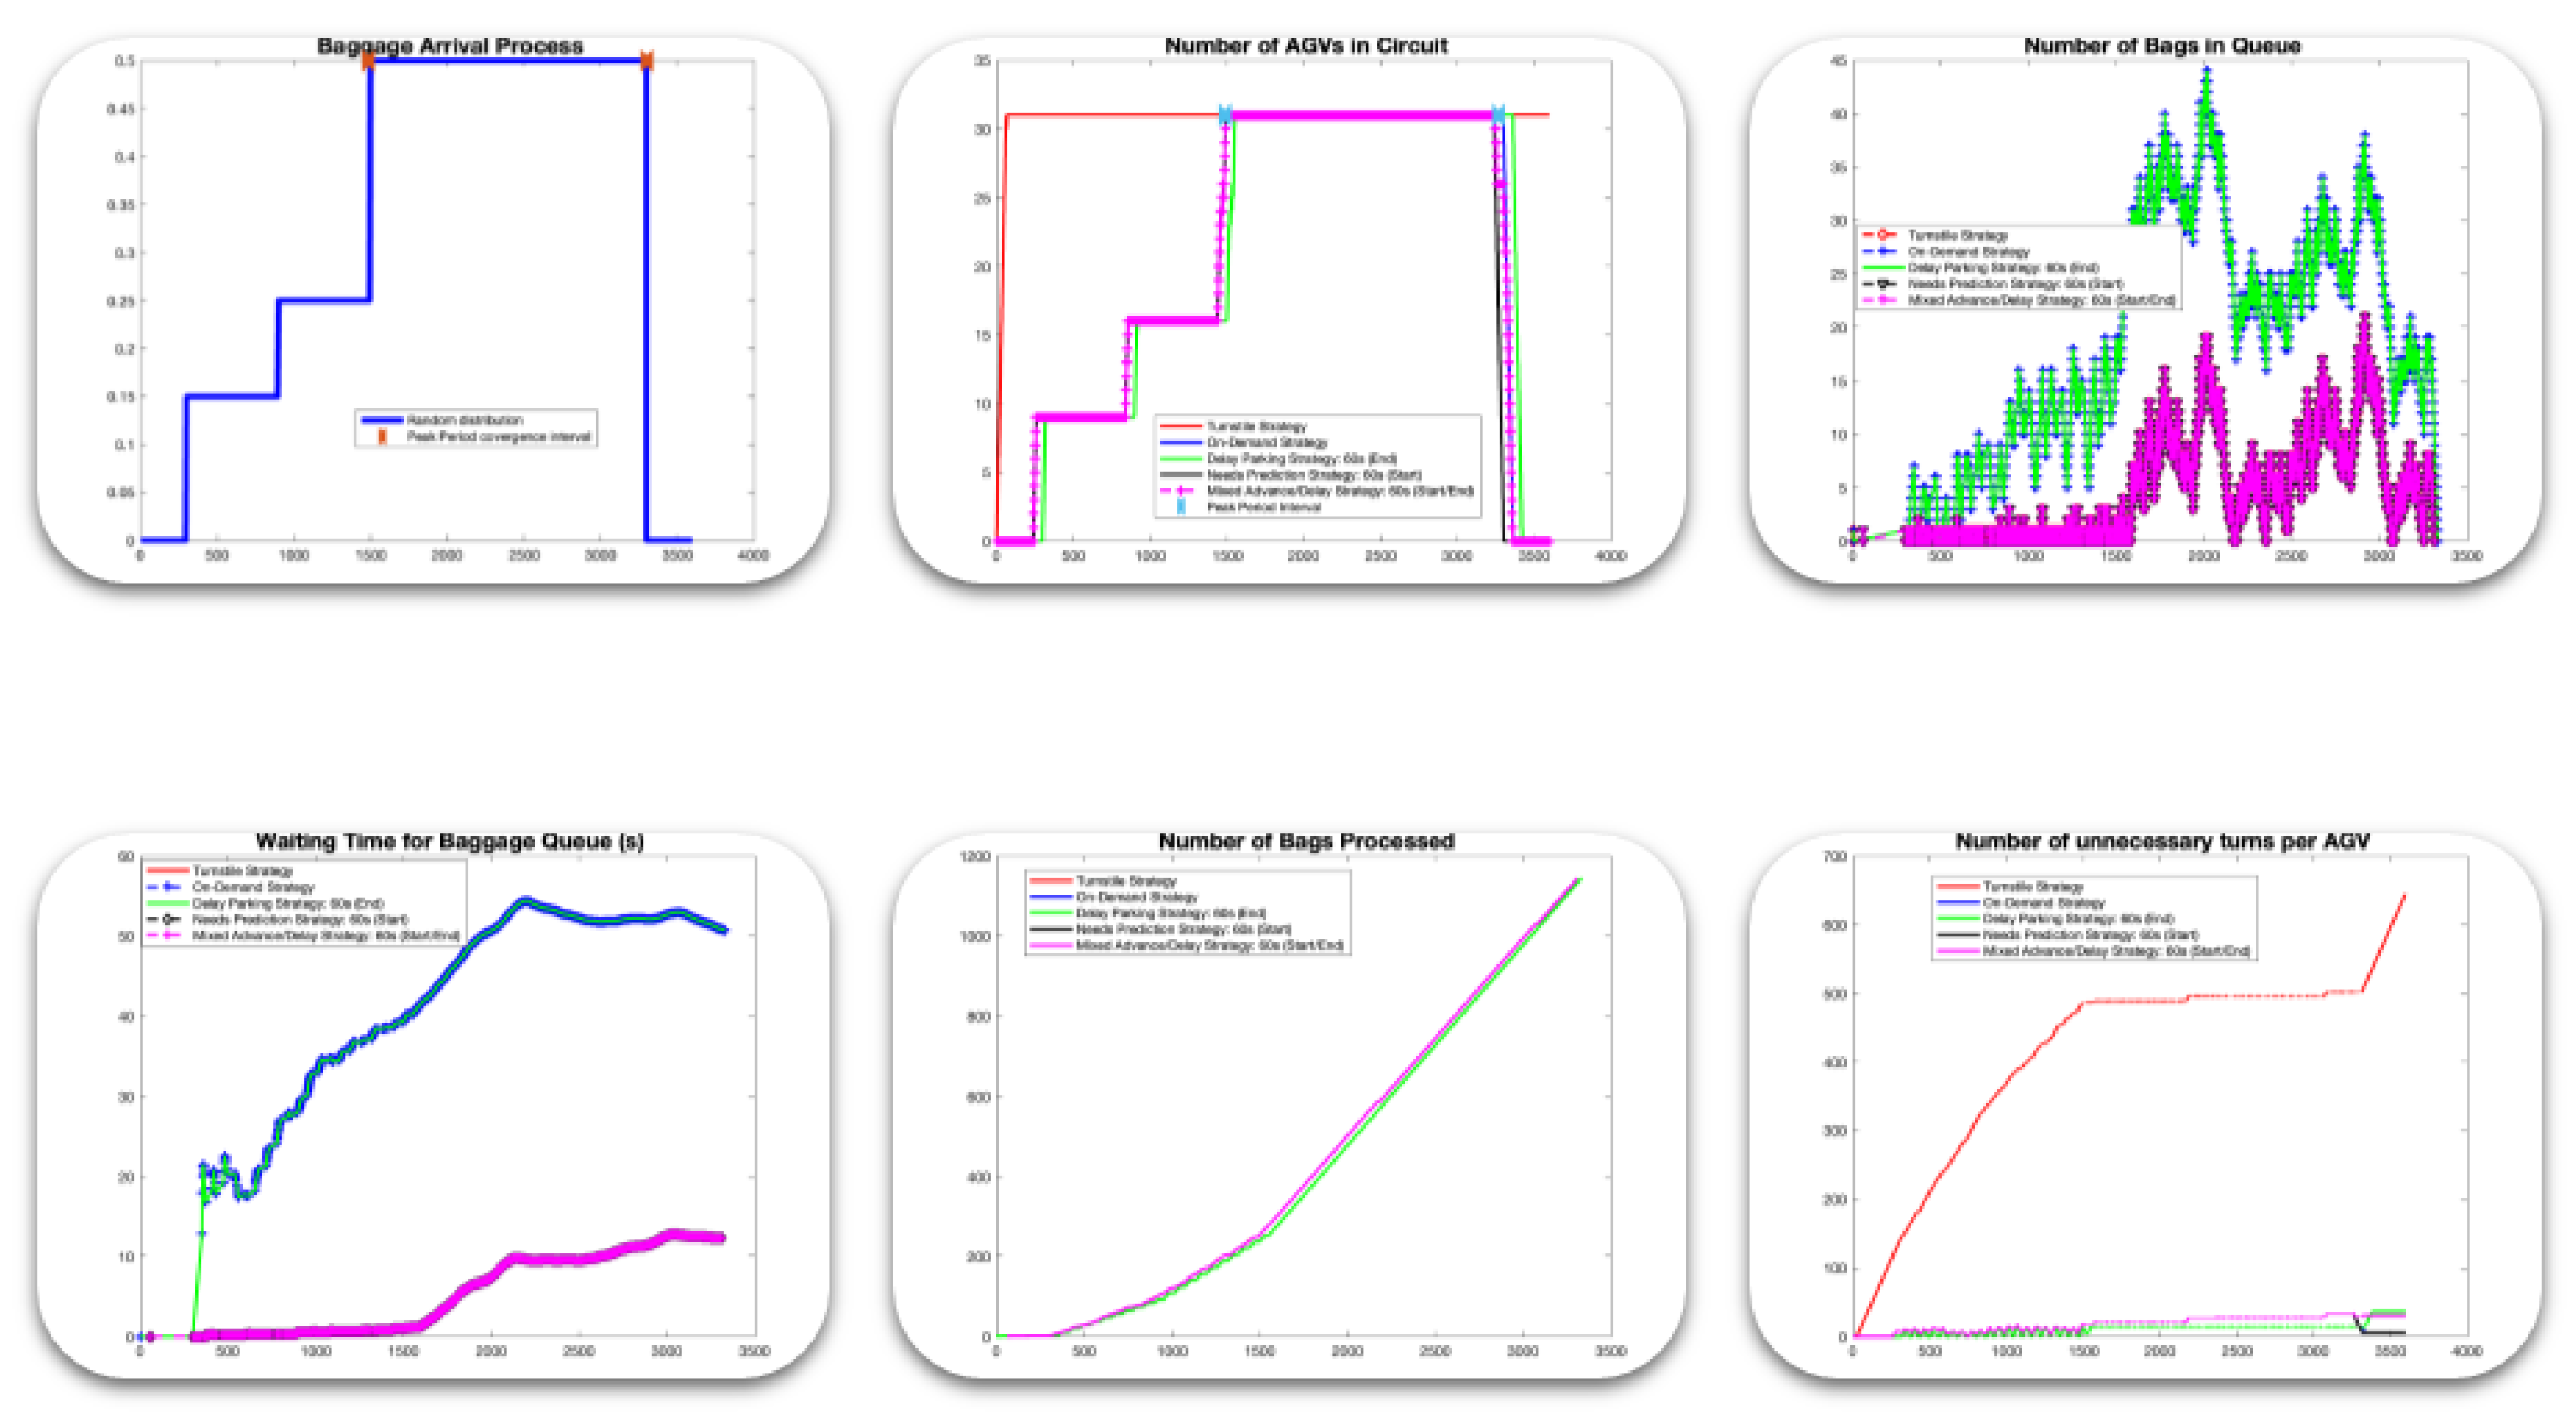
4.2.5. Scenario 5: Baggage Flows as an Upward Staircase, Reaching a Peak During the Final Period
Scenario 5 represents the opposite of Scenario 3. It illustrates a baggage flow dynamic that gradually increases, reaching a peak, somewhat resembling a staircase curve. This pattern could indicate a period of high activity, where the number of bags increases in a controlled manner before reaching its maximum.
Figure 9.
Results for scenario 5: (a) Baggage Arrival Process; (b) Number of AGV in circuit; (c) Number of Bags in Queue; (d) Waiting Time for Baggage in Queue; (e) Number of Bags Processed; (f) Number of unnecessary turns per AGV.
Figure 9.
Results for scenario 5: (a) Baggage Arrival Process; (b) Number of AGV in circuit; (c) Number of Bags in Queue; (d) Waiting Time for Baggage in Queue; (e) Number of Bags Processed; (f) Number of unnecessary turns per AGV.
4.2.6. Scenario 6: Variable Baggage Flows with One Converging and One Diverging Peak Period
Scenario 6 closely resembles Scenario 2, except that the second peak period is represented by a divergent value (λ=0.6) meaning it exceeds the highest baggage handling rate (λmax=0.5).
Figure 10.
Results for scenario 6: (a) Baggage Arrival Process; (b) Number of AGV in circuit; (c) Number of Bags in Queue; (d) Waiting Time for Baggage in Queue; (e) Number of Bags Processed; (f) Number of unnecessary turns per AGV.
Figure 10.
Results for scenario 6: (a) Baggage Arrival Process; (b) Number of AGV in circuit; (c) Number of Bags in Queue; (d) Waiting Time for Baggage in Queue; (e) Number of Bags Processed; (f) Number of unnecessary turns per AGV.
4.3. Discussion on Numerical Simulation
The Turnstile Strategy (red color) is ideal in terms of the number of pieces of baggage and waiting time in the queue, as shown in Figures (c) and (d) in Scenarios 1 to 5. On the other hand, regarding energy consumption, it is quite high due to the number of unnecessary turns it makes, as shown in Figures (a) in all Scenarios 1 to 6.
In this context, an on-demand strategy (blue color) is proposed to reduce energy consumption, specifically by minimizing unnecessary turns, as shown in figure (a) for the six scenarios. However, the number of bags and the waiting time in the queue have increased significantly.
Delay parking strategy (green color) is proposed in the context of allowing some time (60 seconds) to collect all the baggage in the queue before the AGVs enter the parking lot, while implementing an optimal strategy for the AGVs on the circuit. The number of AGVs is adjusted according to the baggage flow, like the On-Demand Strategy. This strategy helps to reduce energy consumption and improves the number of baggage items and the waiting time in the queue, as shown in figures (c) and (d) for scenarios 1 to 4. On the other hand, for scenario 5, there is no improvement due to the low flow of baggage at the beginning.
Needs Prediction Strategy (black color) is suggested to anticipate the arrival of baggage, which will help reduce waiting times, while still maintaining an optimal number of AGVs, as in the On-Demand Strategy. Figures (c) and (d) in scenarios 1 to 5 show that the number of baggage items and the waiting time in the queue are too low compared to the On-Demand Strategy and the Delay Parking Strategy.
To achieve better conditions, we combined two strategies: the Delay Parking Strategy and the Needs Prediction Strategy, which together form the Mixed Advance/Delay Strategy (shown in pink). As demonstrated in Figures (c) and (d), the number of bags and the waiting time in the queue are like those of the Turnstile Strategy, but with lower energy consumption, as illustrated in Figures (a) for scenarios 1 to 5. The Needs Prediction Strategy is quite sufficient for scenarios 4 and 5, as shown in the figures, yielding the same results as the Turnstile Strategy and the Mixed Advance/Delay Strategy, since the flow of baggage is very low at the beginning.
In Scenario 6, we present a simulation with a baggage flow value that diverges from the numerical study. We observe that the strategy with the best performance has a delay of 180 seconds instead of 60 seconds, as 60 seconds is insufficient (60 (s) for the other scenarios 1 to 5). The number of bags and the waiting time in the queue are better compared to the Turnstile strategy, even considering energy consumption. On the other hand, the Turnstile strategy recovers more than 100 pieces of baggage, as shown in Figure (e).
5. Analysis of AGV System Failures and Faults
5.1. Different Types of AGV and Operator Faults During the Baggage Handling Process
The study of system degradation mechanisms in AGVs used in circuit applications involves analyzing various factors that contribute to performance decline, inefficiency, or errors, faults, and failures over time [37]. The following table presents the different types of faults during AGV circulation (Table 1).
In a real-time baggage handling system in an airport, the operator’s role is essential in minimizing baggage delays and ensuring the smooth operation of the system. Table 2 outlines different types of operator failures that can affect the performance of the system, particularly during local and global failures. These failures can lead to significant delays, inefficiencies, and disruptions in baggage handling if not managed effectively.
1. Response Time Failures: The operator’s ability to quickly react to local or global failures determines how long baggage delays last. A slow response will result in increased baggage accumulation and longer processing times, affecting the efficiency of the baggage handling system.
2. Decision-Making Failures: Quick and accurate decision-making is vital for determining the best course of action during failures. Misidentifying the cause of a failure or poor prioritization can exacerbate the issue and cause prolonged delays in baggage processing.
3. Communication Failures: Effective coordination between operators or operators and AGV in different zones is essential to resolve issues quickly. Failure to communicate or use automated system alerts can result in mismanagement, adding to delays and complicating the overall baggage handling process.
4. Stress/Pressure Failures: The ability to manage stress and make calm, informed decisions under pressure is key for an operator. If an operator fails to effectively handle multiple issues simultaneously, the delays can become more extensive, worsening the baggage flow and overall system performance.
In this work, we are interested in failures (or breakdowns) occurring at baggage pick-up points or drop-offs. We distinguish between two types of failures:
- Local failure: This occurs when one of the pick-up points or the depots fails, but not at the same time.
- Global failure: This occurs when two pick-up points, both depots, or a pick-up point and a tomato depot fail simultaneously.
5.2. Numerical Simulations of the Failed System Components
Simulations conducted in MATLAB and Simulink allow the system to simulate failures, evaluate response times, and assess the impact of these failures on baggage flow. Additionally, simulations enable the visualization of effects based on the duration and type of failure, whether global or local, as illustrated in Figure 12, Figure 13, Figure 14 and Figure 15.
Figure 11.
Operator Intervention: (a) Strategy – Zone R, and (b) Strategy – Zone D.
All simulations are run over a period of one hour using MATLAB and Simulink.
5.2.1. Local Failure
In this category, we are dealing with a local failure, which can occur either in zone (R) or zone (D). The quantity of baggage delayed at both points—pick-up and drop-off—is illustrated in Figure 12, which features two pie charts. In these charts, number (1) represents zone (R), and number (2) represents zone (D). This situation is time-dependent, as the duration of the failure relies on how long it takes for a human to resolve the issue.
5.2.2. Global Failure
Unlike local failure, a global failure occurs when issues arise simultaneously at both zone (R) and zone (D). The quantity of baggage delayed at these two points—collection and deposit—is represented in Figure 14, which features two pie charts. In these charts, number (1) corresponds to zone (R) and number (2) corresponds to zone (D). Like a local failure, the duration of global failure depends on how long it takes for a human operator to resolve the issue. However, in this case, if the operator takes more time to address the problem, it will result in even greater delays in the processing of baggage.
5.3. Discussion on the Numerical Simulation of System Failure
Figure 12, Figure 13, Figure 14 and Figure 15 illustrate the percentage of baggage lost at collection and drop-off points relative to the failure duration. The first figure (Figure 12) simulates a local failure based on its duration, unlike the global outage, if the pick-up or drop-off points operate for only half the time (i.e., 30 minutes), the loss at these points is reduced to less than a quarter of the merchandise, specifically, only 22% is lost at the various points.
The two other figures (Figure 14 and Figure 15) simulate a global failure as a function of its duration. Figure 14 shows an AGV or baggage pick-up or drop-off points breaking down over a period ranging from 1 minute to 30 minutes, while Fig. 15 shows two AGVs or two baggage pick-up or two drop-off points breaking down at different times and levels, alternately, during continuous periods. These two figures indicate that the breakdowns depend solely on time, not on the position of the AGVs or the baggage pick-up or drop-off points. Since the simulation spans an hour, if the breakdown lasts for half of the time (i.e., 30 minutes), nearly half of the goods are lost at the pick-up and drop-off points (i.e., 50%), as shown in Figure 14 and Figure 15.
The duration of the breakdown depends on how long the operator takes to resolve the issue at the collection and/or drop-off points, as well as the location of these points in relation to the office. For example, the operator will typically take less time to access the drop-off points than the collection points.
The role of the operator is central to minimizing delays and ensuring the smooth operation of the system. Both local failures and global failures within the system depend heavily on the operator’s response time, decision-making, and overall efficiency. These failures can occur in critical zones such as zone (R) (pick-up) and zone (D) (drop-off), and their impact can significantly disrupt the entire baggage processing flow.
In a local failure, problems arise within either zone (R) or zone (D), but not simultaneously in both. These zones are key to the movement and sorting of baggage, and even small disruptions in these areas can lead to delays in processing. The operator’s reaction time is critical in local failures. When an issue is detected in either zone (R) or zone (D), the operator must act swiftly to identify the root cause and resolve the problem. In a well-designed system, computational support (like automated alerts) can assist the operator by highlighting where the failure occurred. However, the operator’s timely intervention is essential to minimize delays. The longer the operator takes to react, the more baggage will accumulate in the affected zone, leading to extended delays and potentially complicating the baggage sorting process. In addition to speed, the operator’s decision-making is essential. The operator must quickly determine whether to reroute baggage, reset machinery, or engage manual intervention to clear the blockage. Since baggage processing in a real-time system is complex and time-sensitive, the operator’s ability to make the right decision at the right time is key to preventing a small issue from escalating into a larger delay.
A global failure occurs when problems arise in both zone (R) and zone (D) simultaneously. This type of failure is more complex because it involves disruptions at two critical points in the baggage handling process, which can have a much greater impact on overall system efficiency. In the event of a global failure, the operator’s response time becomes even more critical. Since both zones are affected, the operator must address issues across multiple points in the system, which increases the complexity of the situation. With the right computational support, operators can be provided with real-time diagnostic information to identify the nature of the failure in both zones. However, operator efficiency is key to preventing a more severe backlog from developing. A delay in addressing issues in either zone can lead to prolonged delays in baggage processing, increasing the time it takes for baggage to reach its destination. The operator’s decision-making is paramount in a global failure scenario also. The operator must assess whether one zone requires more immediate attention than the other and prioritize actions accordingly. A failure in zone (R) might take precedence if it’s affecting the timely departure of flights, while a failure in zone (D) could be prioritized if it’s preventing baggage from being correctly sorted. However, failure to prioritize effectively could result in significant delays and more serious consequences for baggage handling, further complicating the overall system’s performance. In global failures, the impact on the baggage handling system can be far-reaching. Since both zones are disrupted, delays in processing baggage can increase exponentially if the operator fails to resolve the situation quickly. If system alerts and computational support are not efficiently used, the operator’s slow response time can cause significant disruptions, affecting the baggage processing for multiple flights, and possibly leading to missed connections or customer dissatisfaction.
The computation system should assist the operator by suggesting priority actions or providing alternative solutions to minimize downtime and ensure smooth operation across both zones. Despite computational assistance, the operator’s actions in responding to failures (both local and global) are critical in preventing further delays. The system may be designed to assist the operator, but it is their response time and decision-making abilities that determine how quickly baggage delays are minimized. Slow or incorrect actions on the part of the operator can lead to compounding delays, affecting the entire baggage flow through the airport.
6. Conclusions
This study introduced a real-time baggage handling monitoring system using a computational ergo-design approach, leading to the development of the ARTEMIS architecture. By modeling the system as a directed graph and running simulations, five baggage handling strategies were tested to see how well they balanced efficiency, queue times, and energy consumption. The results show that the Mixed Advance/Delay Strategy is the best all-around option, as it keeps energy use low while ensuring smooth baggage flow and relatively short waiting times. On the other hand, the Turnstile Strategy remains the best choice when the main goal is to minimize queues and maximize baggage collection, even though it requires more energy.
Among the other strategies, the On-Demand Strategy saves energy but results in longer queues and more baggage buildup. The Delay Parking Strategy finds a middle ground between energy use and queue management, while the Needs Prediction Strategy does a good job of reducing waiting times but isn’t as effective at handling baggage. Interestingly, in Scenario 6, increasing the delay time performed better than the Turnstile Strategy.
To better understand how these strategies perform, a simulation was developed to generate key indicators, allowing for the preliminary visualization and analysis of AGV behavior in predefined scenarios. These results are displayed through an intuitive and ergonomic user interface, designed with a strong focus on user-computer interaction as a problem-solving process centered on the user’s experience.
Beyond the system itself, this study also highlights the important role of the operator in keeping baggage handling running smoothly. Simulations show that an operator’s reaction time and decision-making skills have a big impact on overall performance. Any delay in responding to issues can cause baggage pileups, leading to disruptions across the entire airport. To keep things running efficiently, it’s crucial to have a well-designed support system that helps operators make quick and effective decisions.
Future research could explore ways to improve operator decision-making through intelligent agents and automation, helping to make baggage handling even more efficient.
Author Contributions
Conceptualization, O.O., A.-J.F. and E.O.; methodology, O.O. and A.-J.F.; validation, O.O., A.-J.F., M.D.-K. and E.O.; formal analysis, O.O. and A.-J.F.; investigation, O.O., A.-J.F., M.D.-K. and E.O.; writing—original draft preparation, A.-J.F. and E.O.; writing—review and editing, O.O., A.-J.F., M.D.-K. and E.O; project administration, A.-J.F.. All authors have read and agreed to the published version of the manuscript.”.
Funding
Please add: This research was funded by the Brittany region for funding the “AAP PME-ALPHA- Solution de robotique de transport dans les aéroports” project (conv. 23003944), as part of the PME 2022 call for projects entitled “Accelerate time to market of digital technological innovations from SMEs in the Greater West”.
Data Availability Statement
The original contributions presented in this study are included in the article. Further inquiries can be directed to the corresponding author.
Conflicts of Interest
The authors declare no conflicts of interest.
Abbreviations
The following abbreviations are used in this manuscript:
| AGV | Automated Guided Vehicle |
| AMR | Autonomous Mobile Robot |
| ARTEMIS | ARchitecture for real-TimE baggage handling and MonitorIng System |
| BHMS | Baggage Handling Monitoring System |
| HCI | Human-Computer Interface |
| RUL | Remaining Useful Life |
References
- Ostrosi, E.; Fougères, A.-J. Intelligent virtual manufacturing cell formation in cloud-based design and manufacturing. Engineering Application of Artificial Intelligence 2018, 76, 80–95. [Google Scholar] [CrossRef]
- Fougères, A.-J.; Ostrosi, E. Fuzzy engineering design semantics elaboration and application. Soft Computing Letters 2021, 3, 100025. [Google Scholar] [CrossRef]
- Aivaliotis, P.; Arkouli, Z.; Georgoulias, K.; Makris, S. Degradation curves integration in physics-based models: Towards the predictive maintenance of industrial robots. Robotics and computer-integrated manufacturing 2021, 71, 102177. [Google Scholar] [CrossRef]
- Rajapaksha, A.; Jayasuriya, N. Smart Airport: A Review on Future of the Airport Operation. Global Journal of Management and Business Research: A Administration and Management 2020, 20. [Google Scholar] [CrossRef]
- Tan, J.H.; Masood, T. Adoption of Industry 4.0 technologies in airports--A systematic literature review. arXiv preprint 2021, arXiv:2112.14333. [Google Scholar]
- Marmier, F.; Filipas, I.; Zaharia, S.E. Transition 4.0 for the Airport Industry. IFAC-PapersOnLine 2023, 56, 3698–3703. [Google Scholar] [CrossRef]
- Moon, Y.B. Simulation modelling for sustainability: a review of the literature. International Journal of Sustainable Engineering 2017, 10, 2–19. [Google Scholar] [CrossRef]
- An, L.; Grimm, V.; Sullivan, A.; Turner Ii, B.L.; Malleson, N.; Heppenstall, A.; Tang, W. Challenges, tasks, and opportunities in modeling agent-based complex systems. Ecological Modelling 2021, 457, 109685. [Google Scholar] [CrossRef]
- Law, A.M.; Kelton, W.D.; Kelton, W.D. Simulation modeling and analysis; Mcgraw-hill: New York, 2007; vol. 3. [Google Scholar]
- Fiksel, J. Sustainability and resilience: toward a systems approach. Sustainability: Science, Practice and Policy 2006, 2, 14–21. [Google Scholar]
- Macal, C.M.; North, M.J. Tutorial on agent-based modelling and simulation. Journal of Simulation 2010, 4, 151–162. [Google Scholar] [CrossRef]
- Klügl, F.; Bazzan, A.L. Agent-based modeling and simulation. AI Magazine 2012, 33, 29. [Google Scholar] [CrossRef]
- Kagho, G.O.; Balac, M.; Axhausen, K.W. Agent-based models in transport planning: Current state, issues, and expectations. Procedia Computer Science 2020, 170, 726–732. [Google Scholar] [CrossRef]
- López, J.; Zalama, E.; Gómez-García-Bermejo, J. A simulation and control framework for AGV based transport systems. Simulation Modelling Practice and Theory 2022, 116, 102430. [Google Scholar] [CrossRef]
- Jing, P.; Hu, H.; Zhan, F.; Chen, Y.; Shi, Y. Agent-based simulation of autonomous vehicles: A systematic literature review. IEEE Access 2020, 8, 79089–79103. [Google Scholar] [CrossRef]
- Grosset, J.; Oukacha, O.; Fougères, A.J.; Djoko-Kouam, M.; Bonnin, J.M. Fuzzy Multi-Agent Simulation for Collective Energy Management of Autonomous Industrial Vehicle Fleets. Algorithms 2024, 17, 484. [Google Scholar] [CrossRef]
- Shobayo, O.; Olajube, A.; Okoyeigbo, O.; Ogbonna, J. Design and Implementation of an IoT Based Baggage Tracking System. In Information and Communication Technology and Applications: Third International Conference, ICTA 2020, Minna, Nigeria, Revised Selected Papers 3. Springer International Publishing, pp. 618–631, November 2020.
- Wu, X.; Xie, L. On load balancing strategies for baggage screening at airports. J. of Air Transport Management 2017, 62, 82–89. [Google Scholar] [CrossRef]
- Farschtschi, Y.; Formella, D.; Himstedt, K.; Wittmann, J.; Möller, D.P. Macroscopic Modelling of Passenger Streams on the Airport and its Adaptation in MATLAB-Simulink. In Proceedings of the 7th EUROSIM Congress on Modelling and Simulation, Prague, Czech Republic, May 2010. [Google Scholar]
- Sharma, D.; Tege, S.; Mehta, D. Simulation of Queuing process of Airport passenger at security check-in by using Simulink-MATLAB, 2023.
- Mambo, A.D.; Efthekhari, M.; Thomas, S. Fuzzy supervisory control strategies to minimise energy use of airport terminal buildings. In 18th International Conference on Automation and Computing (ICAC), IEEE, pp. 1–6, September 2012.
- Oodo, S.; Owolabi, F.S. Application of a Genetic Algorithm for Improving Voltage Profile with Distributed Generation: A Case Study of 33/0.415 kV Abuja Airport Injection Substation. European J. of Engineering and Technology Research 2019, 4, 64–68. [Google Scholar] [CrossRef]
- Carlson, J.; Murphy, R.R. How UGVs physically fail in the field. IEEE Transactions on robotics 2005, 21, 423–437. [Google Scholar] [CrossRef]
- Ramesh, A.; Chiou, M.; Stolkin, R. Robot vitals and robot health: An intuitive approach to quantifying and communicating predicted robot performance degradation in human-robot teams. In Companion of the 2021 ACM/IEEE international conference on human-robot interaction, pp. 303–307, 2021.
- Tubis, A.A.; Poturaj, H. Risk related to AGV systems—open-access literature review. Energies 2022, 15, 8910. [Google Scholar] [CrossRef]
- Javed, M.A.; Muram, F.U.; Punnekkat, S.; Hansson, H. Safe and secure platooning of Automated Guided Vehicles in Industry 4.0. Journal of systems architecture 2021, 121, 102309. [Google Scholar] [CrossRef]
- Fougères, A.-J. Model of cognitive agents to simulate complex information systems. In Proceedings of IEEE International Conference on Systems, Man and Cybernetics, Yasmine Hammamet, Tunisia, vol.4, pp. 6, October 2002.
- Fougères, A.J. Modelling and simulation of complex systems: an approach based on multi-level agents. Int. J. of Computer Science Issues 2012, 8, 8–17. [Google Scholar]
- Norman, D.A. Emotional Design: Why We Love (or Hate) Everyday Things. Civitas Books, 2004.
- Norman, D.A. Natural user interfaces are not natural. Interactions 2010, 17, 17–10. [Google Scholar]
- Stone, D.; Jarrett, C.; Woodroffe, M; et al. User Interface Design and Evaluation. Elsevier, 2005.
- Shneiderman, B. The Eight Golden Rules of Interface Design. Human-Computer Interaction Lab of University of Maryland, 2023.
- Nielsen, J. Finding usability problems through heuristic evaluation. In Proceedings of the SIGCHI Conference on Human Factors in Computing Systems (CHI ’92) (pp. 373–380). Association for Computing Machinery, 1992.
- Nielsen, J. Usability Heuristics for User Interface Design. Nielsen Norman Group, 2022.
- Lee-Remond, S.; Sagot, S.; Ostrosi, E. A New Design Framework for Comprehensible Graphical User Interfaces for Parametric Computer-Aided Design Tools. Computer-Aided Design & Applications 2025, 22, 150–179. [Google Scholar]
- Huang, J.; Cui, Y.; Zhang, L.; Tong, W.; Shi, Y.; Liu, Z. An Overview of Agent-Based Models for Transport Simulation and Analysis. Journal of Advanced Transportation 2022, 1, 1252534. [Google Scholar]
- Gainaru, A.; Cappello, F. Errors and faults. Fault-Tolerance Techniques for High-Performance Computing 2015, 89–144. [Google Scholar]
Figure 2.
Entry and exit flows in the handling systems.
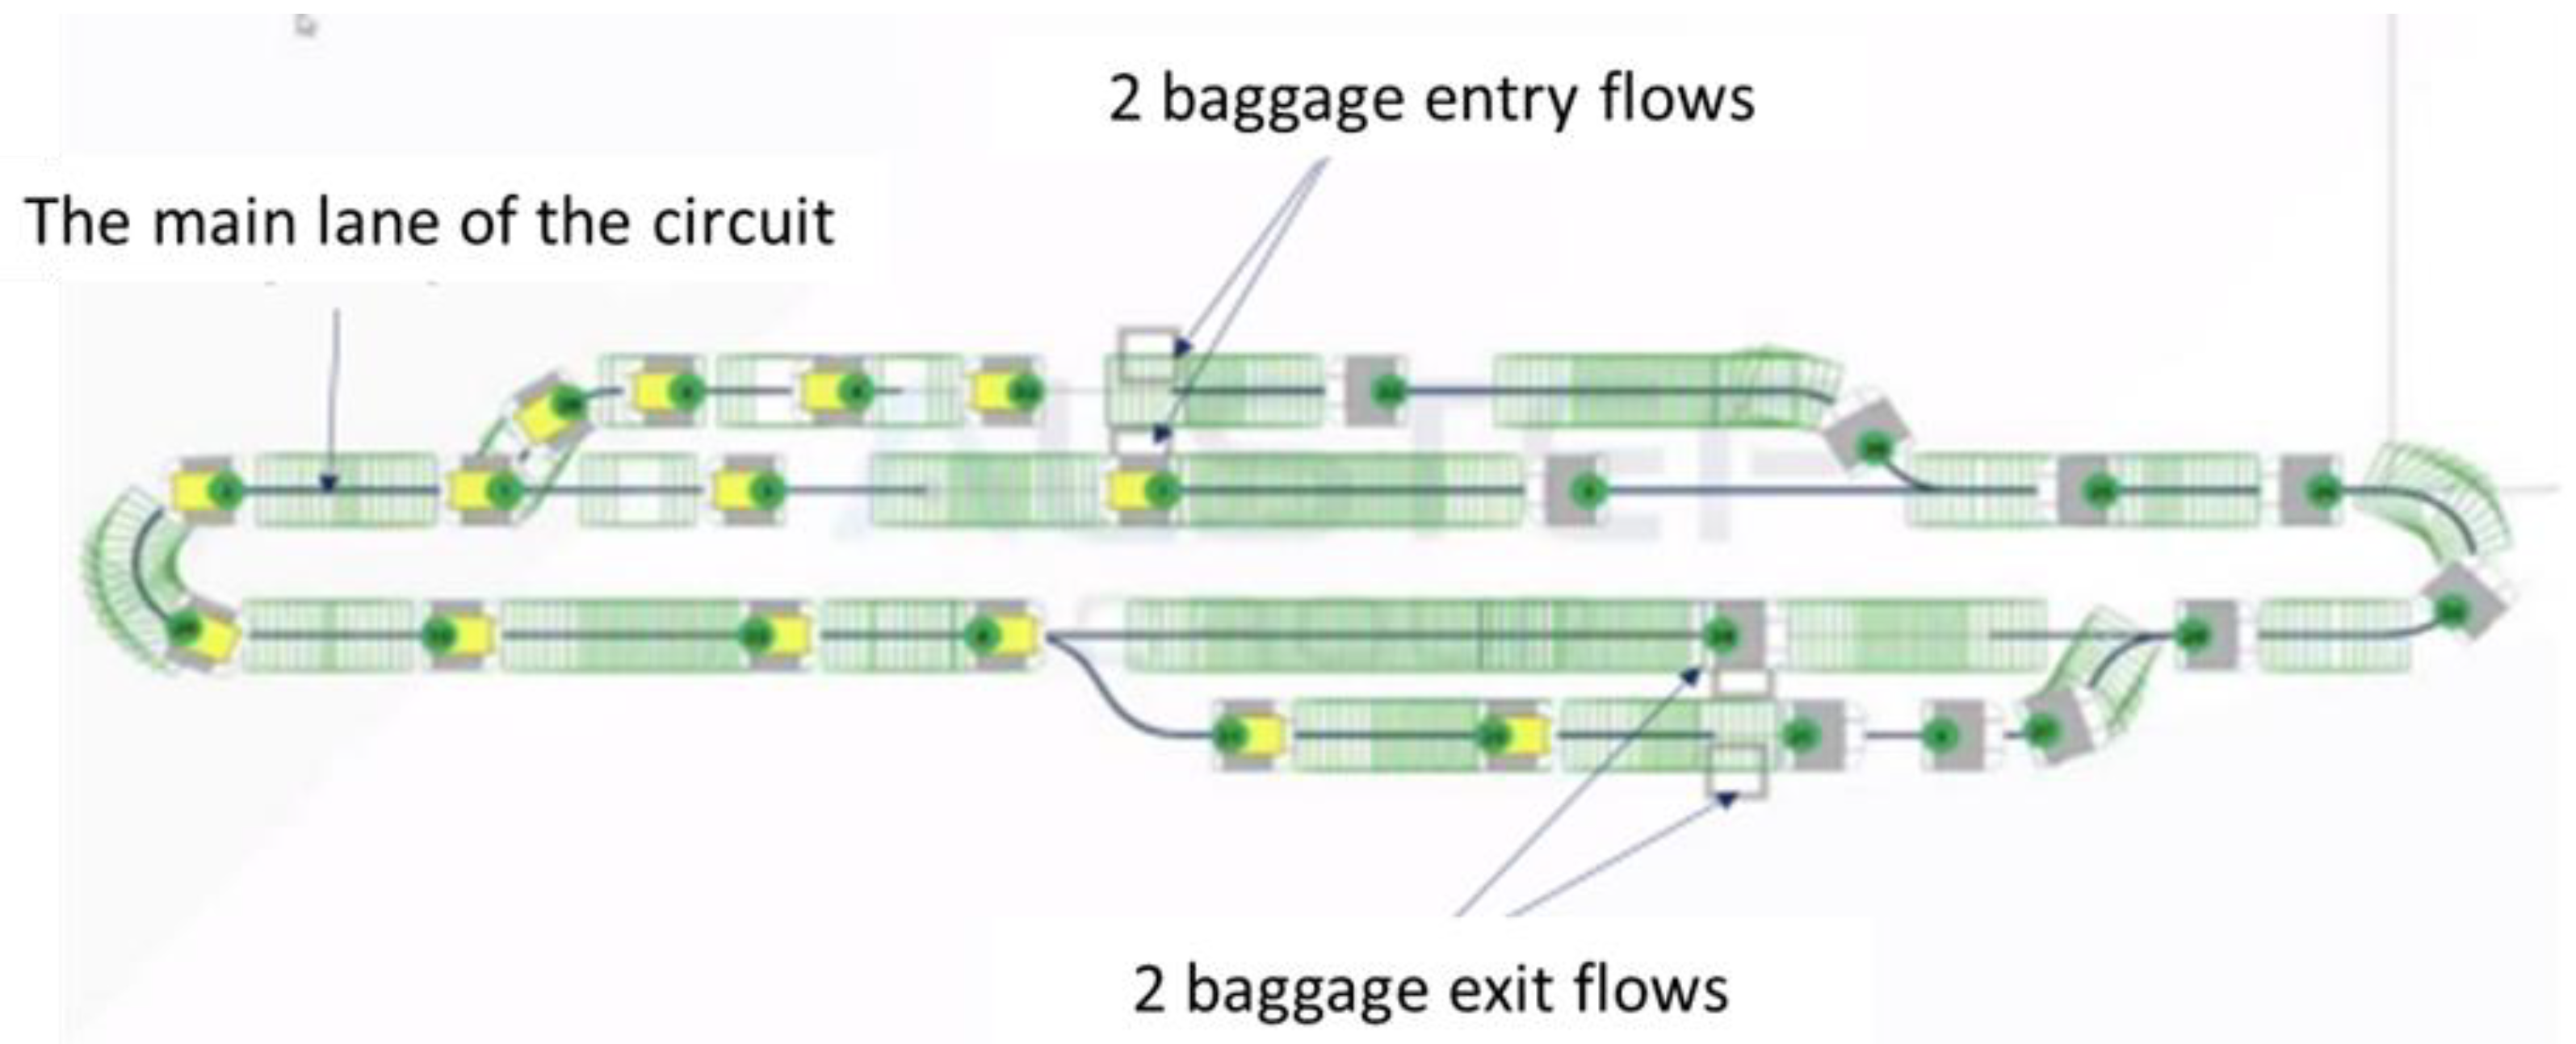
Figure 12.
Breakdown of an AGV: (a) Loss of baggage at collection points, and (b) Loss of baggage at drop-off points.
Figure 12.
Breakdown of an AGV: (a) Loss of baggage at collection points, and (b) Loss of baggage at drop-off points.
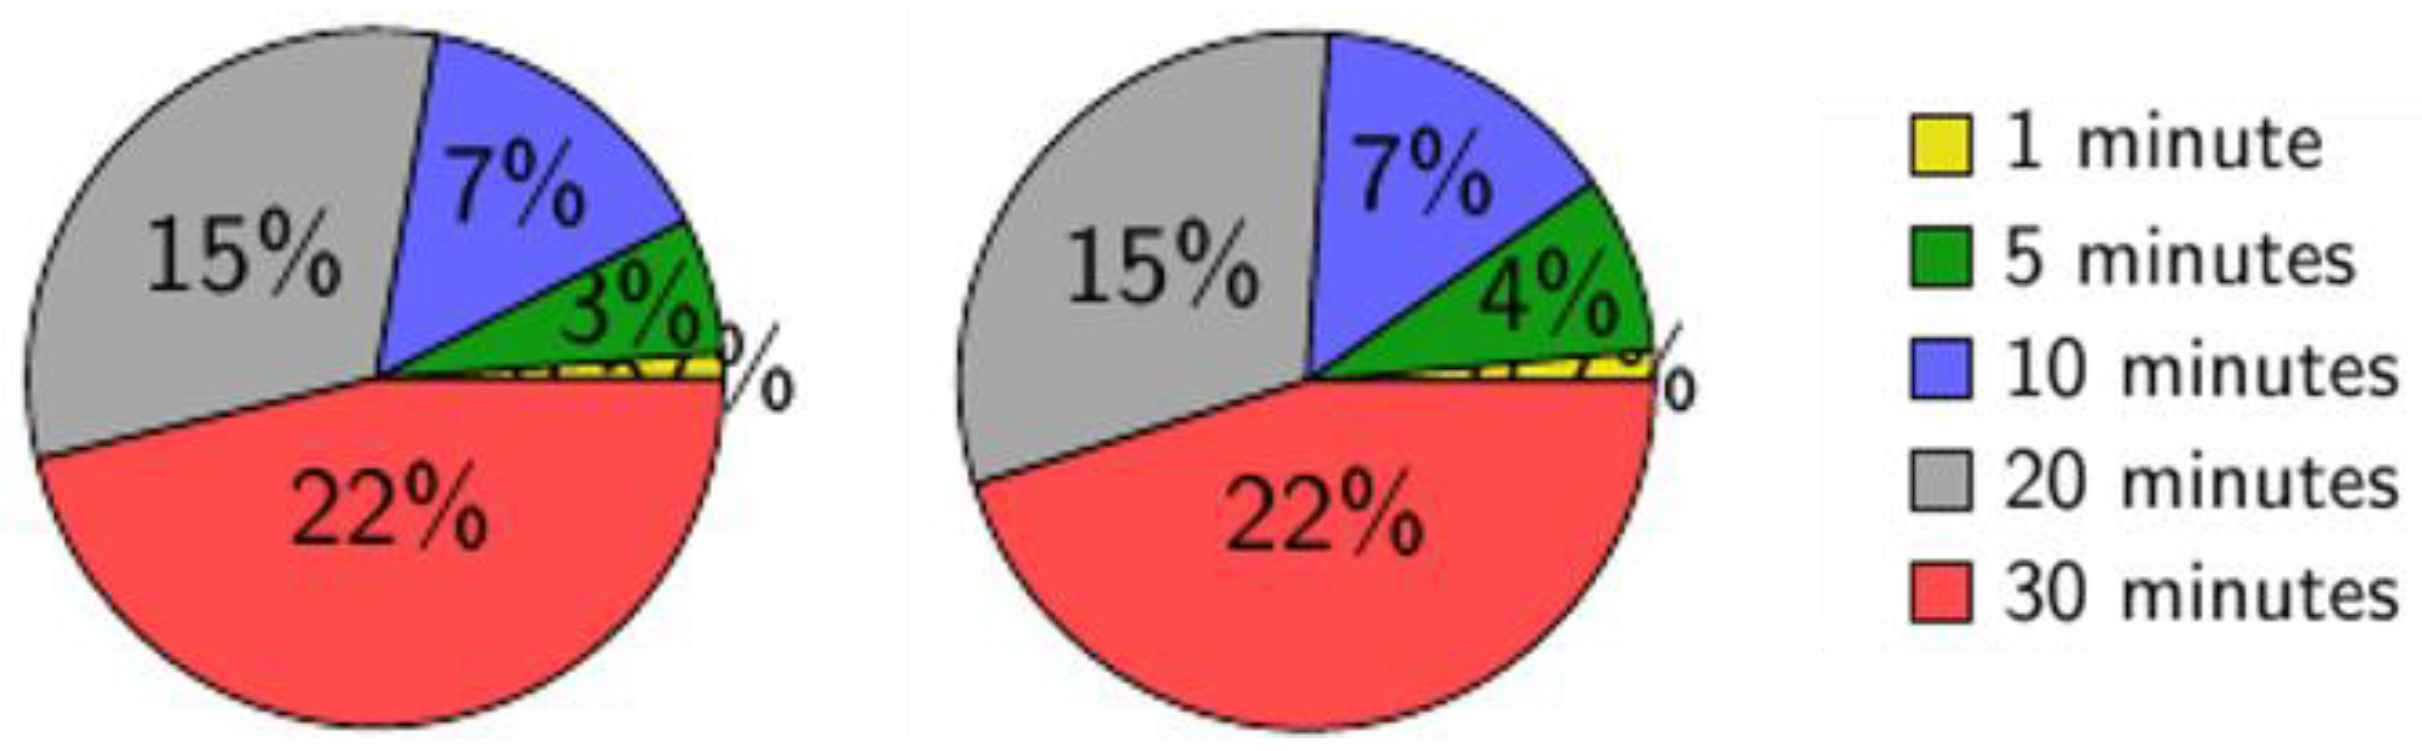
Figure 13.
Operator Intervention: (1) Strategy – Zone R, then (2) Strategy – Zone D.
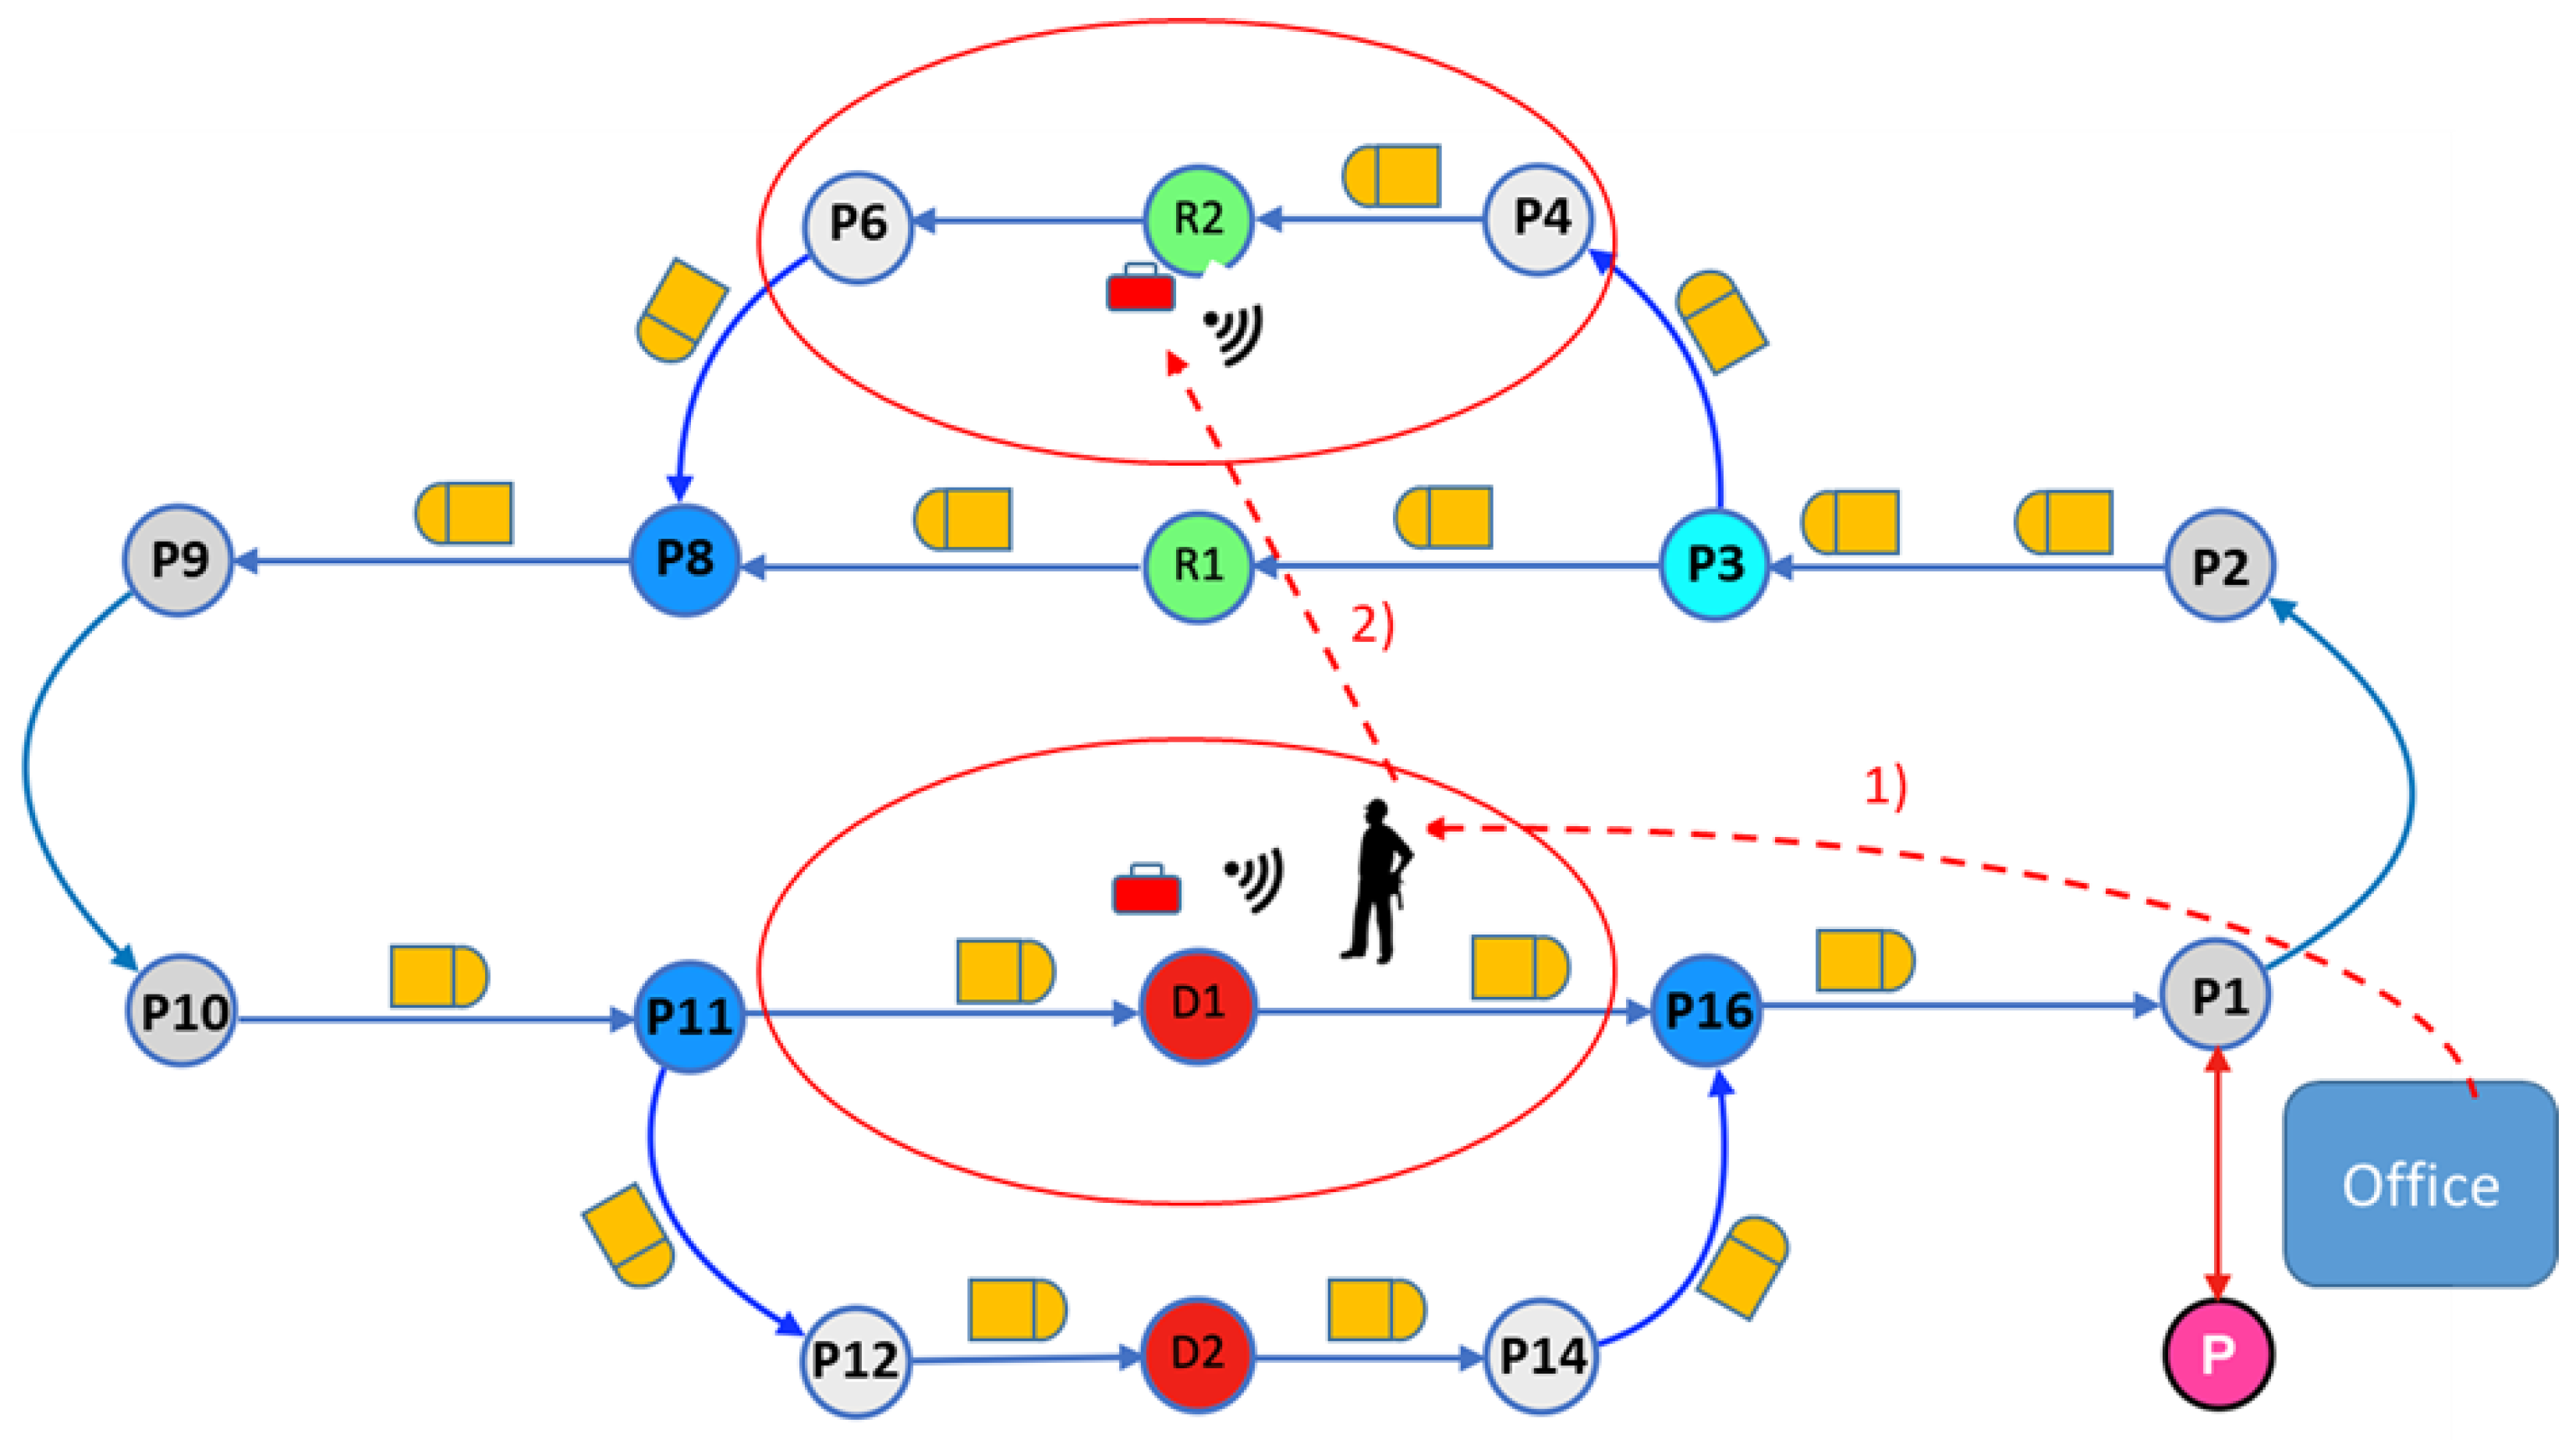
Figure 14.
Breakdown of an AGV: (1) Loss of baggage at collection points, and (2) Loss of baggage at drop-off points.
Figure 14.
Breakdown of an AGV: (1) Loss of baggage at collection points, and (2) Loss of baggage at drop-off points.
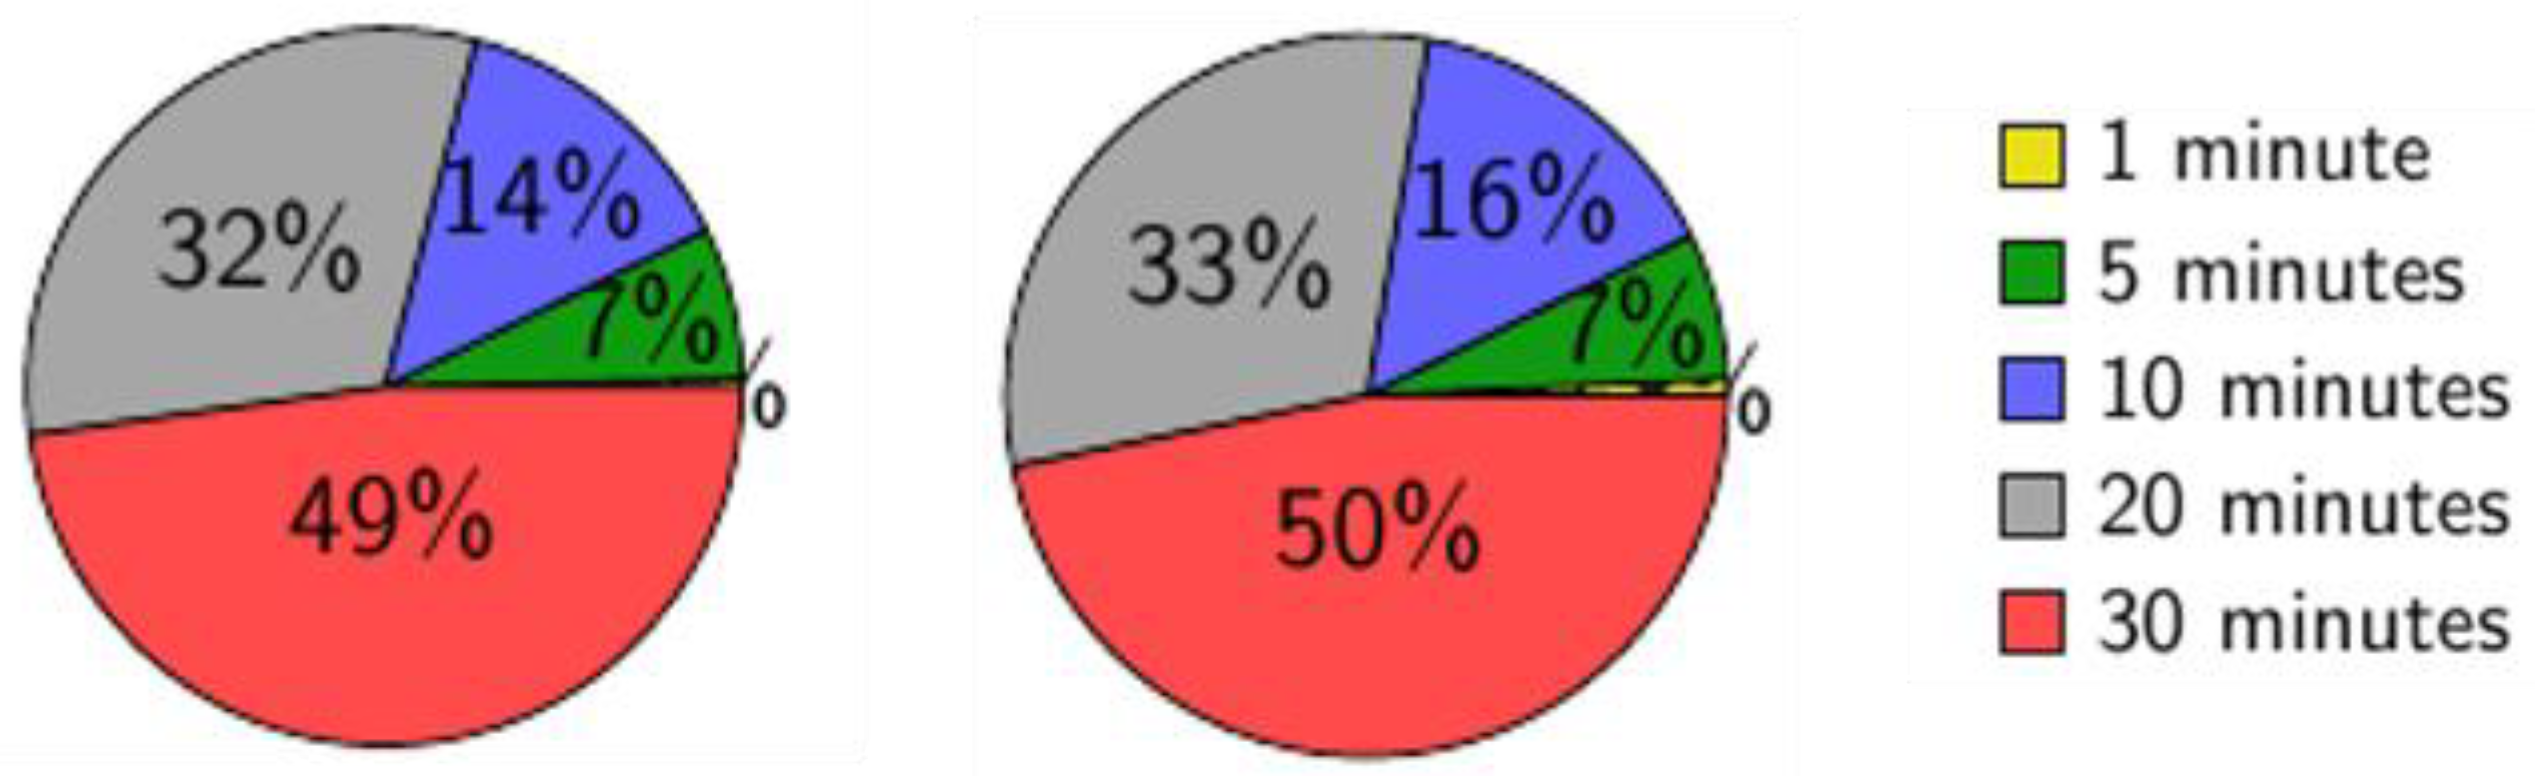
Figure 15.
Two AGVs malfunctioning at different: (1) Loss of baggage at collection points, and (2) Loss of baggage at drop-off points.
Figure 15.
Two AGVs malfunctioning at different: (1) Loss of baggage at collection points, and (2) Loss of baggage at drop-off points.
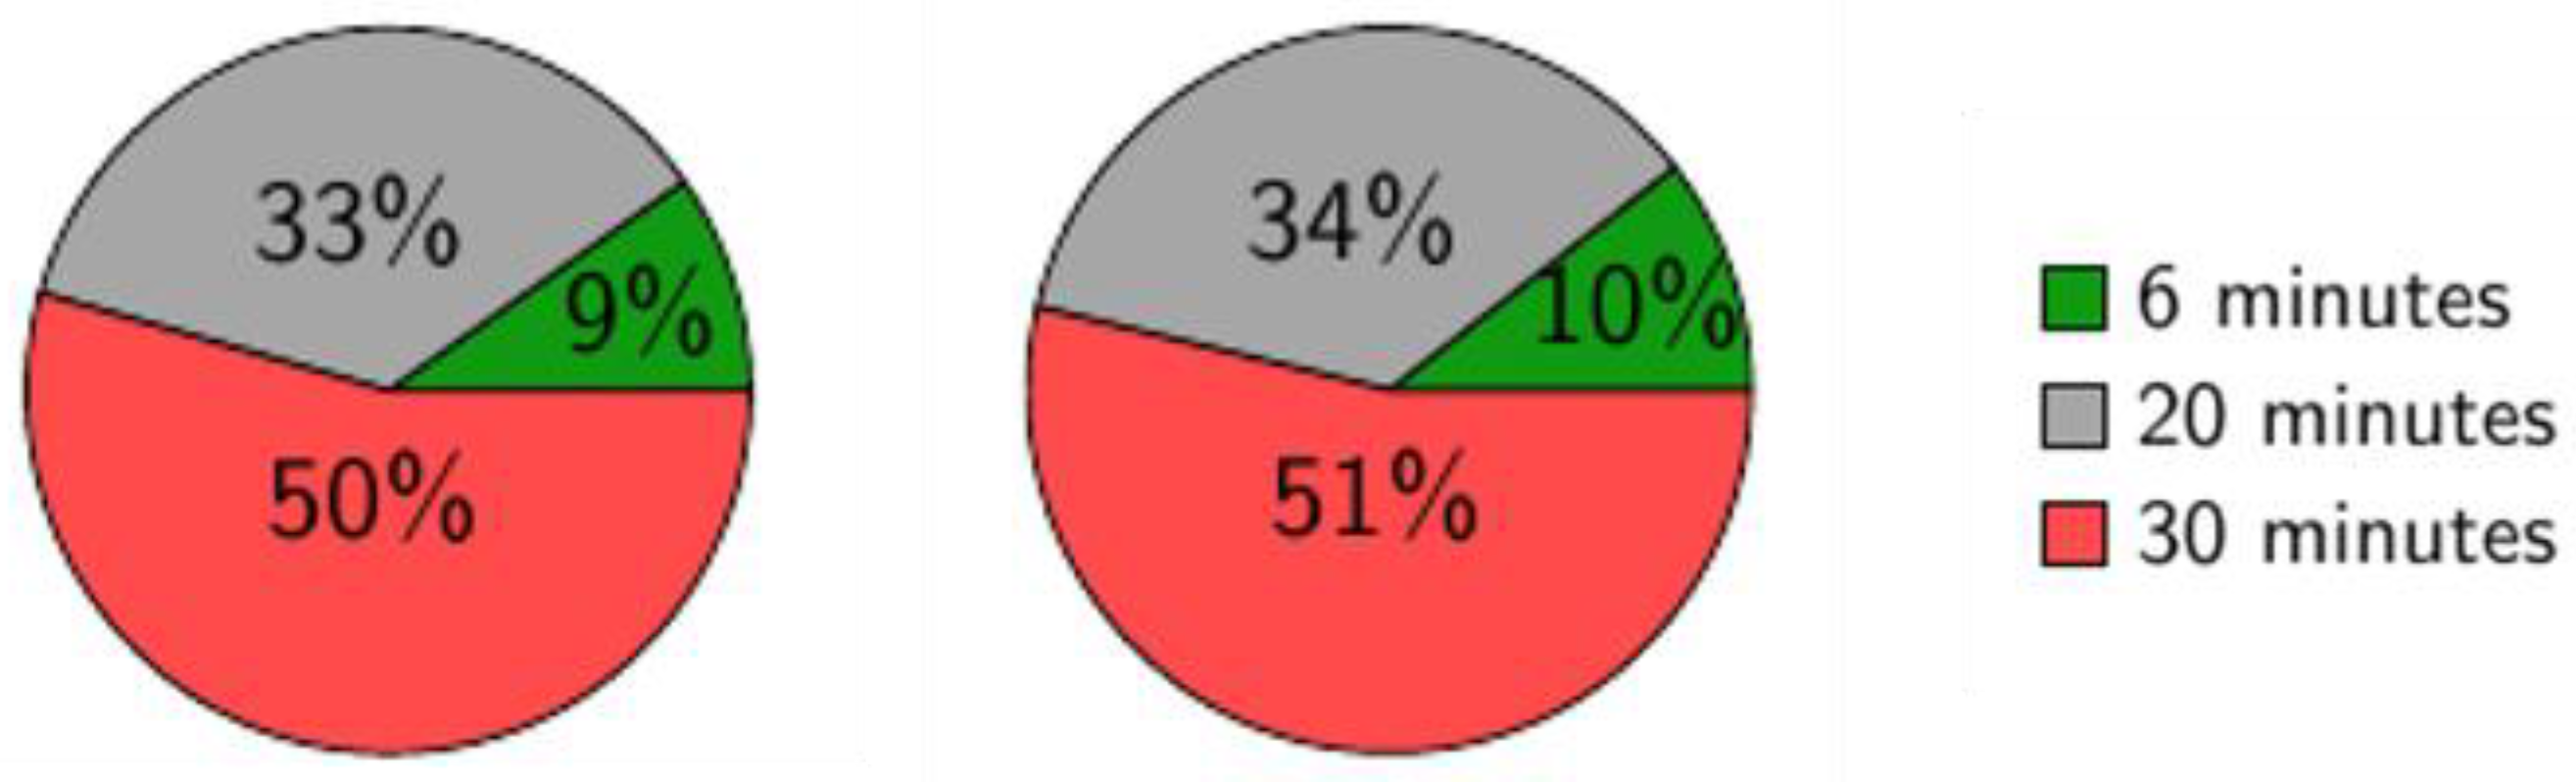

Table 1.
Types of AGV failures.
| Type of failures | Sub-type of failures | Description |
|---|---|---|
| Mechanical Degradation | Wear and Tear on Components Misalignment Chassis Fatigue |
Continuous use of AGVs can result in wear on wheels, bearings, and drive systems. Over time, components such as steering systems may lose precision due to vibration and mechanical stress. Structural components may develop cracks or deformations because of repeated loads or impacts. |
| Electrical and Electronic Failures | Battery Degradation Sensor Failures Control Board Malfunctions |
Batteries gradually lose capacity and efficiency over time due to repeated charge-discharge cycles and exposure to thermal stress. Sensors (e.g., LIDAR, proximity sensors) may degrade because of dirt accumulation, miscalibration, or prolonged exposure to harsh environmental conditions. Electronic components are susceptible to issues such as overheating, corrosion, or interference from electronic noise. |
| Software and Control Systems | Aging of Algorithms Communication Failures Obsolescence |
Control algorithms may become less effective as the physical characteristics of the AGV change over time. Signal degradation or interference can cause delays or result in a loss of control. Older software may be incompatible with newer hardware or updates in the operating environment. |
| Environmental Factors | Dust and Dirt Accumulation Temperature Extremes Humidity and Corrosion |
Affects moving parts, sensors, and cooling systems. Can lead to material fatigue, lubricant breakdown, and electronic failures. Particularly impacts electrical contacts and exposed metal surfaces. |
| Operational Factors | Overloading Frequent Stops and Starts Improper Maintenance |
Operating beyond the design capacity accelerates wear and stresses the system. This increases wear on brakes and motors The lack of regular inspections or incorrect servicing can lead to accelerated degradation. |
Table 2.
Types of operator failures.
| Type of Failures | Sub-type of Failures | Description |
|---|---|---|
| Response Time Failures | Delayed Response to Local Failure Delayed Response to Global Failure |
Operator fails to quickly respond to a malfunction in either zone (R) or zone (D), leading to delays in baggage processing. Longer delays in response result in accumulating baggage, worsening overall system efficiency. Both zone (R) and zone (D) face simultaneous failures, and the operator does not react quickly enough, causing compounded delays across the entire BHMS. |
| Decision-Making Failures | Incorrect Diagnosis Failure to Prioritize Correctly |
Operator misidentifies the source of the failure, causing the wrong course of action to be taken, which prolongs the delay and worsens the overall baggage handling process. Operator is unable to determine which zone (R or D) should be addressed first, leading to poor prioritization and extended delays in baggage handling. |
| Communication Failures | Lack of Coordination Between Zones Failure to Use Automated Alerts |
Operator fails to communicate effectively with other operators working in different zones (R or D), causing delays and confusion in resolving system malfunctions. Operator ignores or fails to act on system alerts or diagnostic tools, which could help quickly identify and resolve issues, leading to unnecessary delays. |
| Stress/Pressure Failures | Impaired Decision-Making Under Pressure Failure to Manage Multiple Issues Simultaneously |
Operator, under the pressure of time or a large failure scenario, makes rushed or incorrect decisions that extend the duration of the failure and lead to further baggage delays. In the event of a global failure, the operator struggles to resolve issues in both zones (R and D) simultaneously, leading to an inability to restore smooth baggage flow efficiently. |
Disclaimer/Publisher’s Note: The statements, opinions and data contained in all publications are solely those of the individual author(s) and contributor(s) and not of MDPI and/or the editor(s). MDPI and/or the editor(s) disclaim responsibility for any injury to people or property resulting from any ideas, methods, instructions or products referred to in the content. |
© 2025 by the authors. Licensee MDPI, Basel, Switzerland. This article is an open access article distributed under the terms and conditions of the Creative Commons Attribution (CC BY) license (http://creativecommons.org/licenses/by/4.0/).
Copyright: This open access article is published under a Creative Commons CC BY 4.0 license, which permit the free download, distribution, and reuse, provided that the author and preprint are cited in any reuse.


