1. Introduction
TiO
2 has been extensively studied as a benchmark catalyst for solar energy conversion to hydrogen fuel because of its compatible bandgap, low cost, and high resistance to photo corrosion [
1]. However, photocatalysis-based technologies for hydrogen production using TiO
2 catalysts have been challenging because of their limited light absorption ability and rapid recombination of photoexcited electrons and holes. Numerous doping strategies, morphology control, defect modulation, and heterostructure design have been developed to enhance the separation of photoinduced charge carriers [
2]. Cocatalyst doping enhances catalytic efficiency by forming a Schottky barrier between the semiconductor and noble metal while extracting photogenerated electrons and inhibiting the recombination of charge carriers [
3].
Single-atom (SA) catalysts have gained attention for various catalytic reactions because of their high reactivity and selectivity, minimal noble metal usage with subsequent cost reduction, and well-defined heterostructure interfaces for efficient charge separation [
4]. The main reason for the development of SA catalysts is to maximize the surface-to-volume ratio and to create novel reaction pathways at the SA level. The higher catalytic activity of SA-deposited nanoparticles can be attributed to a low co-ordination environment, quantum size effect, and improved strong metal support interactions [
5]. SA catalysts have versatile applications in thermal heterogeneous catalysis, organic electrosynthesis, fuel cells, batteries, electrolysis, oxygen reduction or evolution, hydrogen (H
2) evolution or oxidation, carbon dioxide reduction, and nitrogen reduction reactions [
6].
The synthesis method substantially affects the creation of a robust metal SA on semiconductor supports [
7,
8]. SA deposition onto a metal oxide surface by tuning the co-precipitation conditions while controlling the metal precursor concentration can lead to excellent catalytic activity. In addition to the co-precipitation method, incipient wetness co-impregnation, chemical vapor deposition, the newer atom layer deposition, and galvanic replacement are reported as possible SA deposition methods [
7,
9,
10]. The precipitation methods for SA catalysts can be divided into bottom-up and top-down methods. The bottom-up processes use mononuclear metal complexes as precursors to reduce the oxidation state of the metal through subsequent reduction processes [
11,
12]. In contrast, top-down approaches involve energy-related methods to break down the metal into isolated particles without affecting the structure of the support material [
13]. The characteristics of the support (e.g., TiO
2), such as high specific area and high density of heteroatoms or defects, can enhance the metal-support interactions. However, selecting appropriate metal precursors is crucial, and controlling the precursor loading may prevent agglomeration while generating uniformly distributed SAs [
12,
14].
Recent studies suggest that Ag, Au, and Pt nanoparticles have capacitive properties that can trap electrons and discharge them to suitable electron acceptors [
15]. Additionally, the concept of memory catalysis demonstrates the ability of catalysts to perform in the dark, which depends on the number of electrons trapped during the pre-irradiation process [
16]. Controlled size and valence state are crucial for promoting the activity of synthesized catalysts [
17]. The dark deposition method proposed in this study utilizes the capacitive nature of Pt and applies the catalytic memory concept to improve the electron storage capacity and the subsequent catalytic activity in the photo-reforming process. Compared to the dark deposition method, controlling the size and valence state of traditional direct-deposited catalysts is more difficult unless impregnation, atomic-layer deposition, electrodeposition, and chemical reduction methods are applied, which require rigorous operating conditions or expensive equipment [
18]. Furthermore, the traditional direct deposition method results in the coexistence of Pt, PtO, and PtO
2 in the composite, which reduces its electron storage ability [
19]. Hence, this study compares the catalytic activity and characteristics of direct-deposited and dark-deposited Pt on TiO
2.
The choice of strong support plays a critical role because of its influence as physical support as well as on the electronic configuration of the metal [
20]. The annealing temperature significantly affects the photocatalytic activity and microstructural characteristics of the support material (TiO
2), such as crystallinity, morphology, specific surface area, and porous structure of the catalyst, whereas the highest photocatalytic activity was reported for P-25 Degussa TiO
2 calcined at 650°C for 3h [
21,
22]. Calcination above 700°C causes grain growth and phase conversion from anatase to rutile, which hinders the photocatalytic activity of TiO
2 [
21,
23]. Moreover, the calcination atmosphere was found to have a significant effect on H
2 production and decreased in the order Ar>air>N
2>vacuum∼H
2 [
24]. The low activity resulting from vacuum or H₂ calcination can be attributed to the reduced coverage of surface hydroxyl groups and high density of bulk defects [
24]. Annealing the TiO
2 support creates defect sites that assist in establishing strong metal-support interactions and influence the electronic configuration of the deposited SAs [
25,
26,
27,
28].
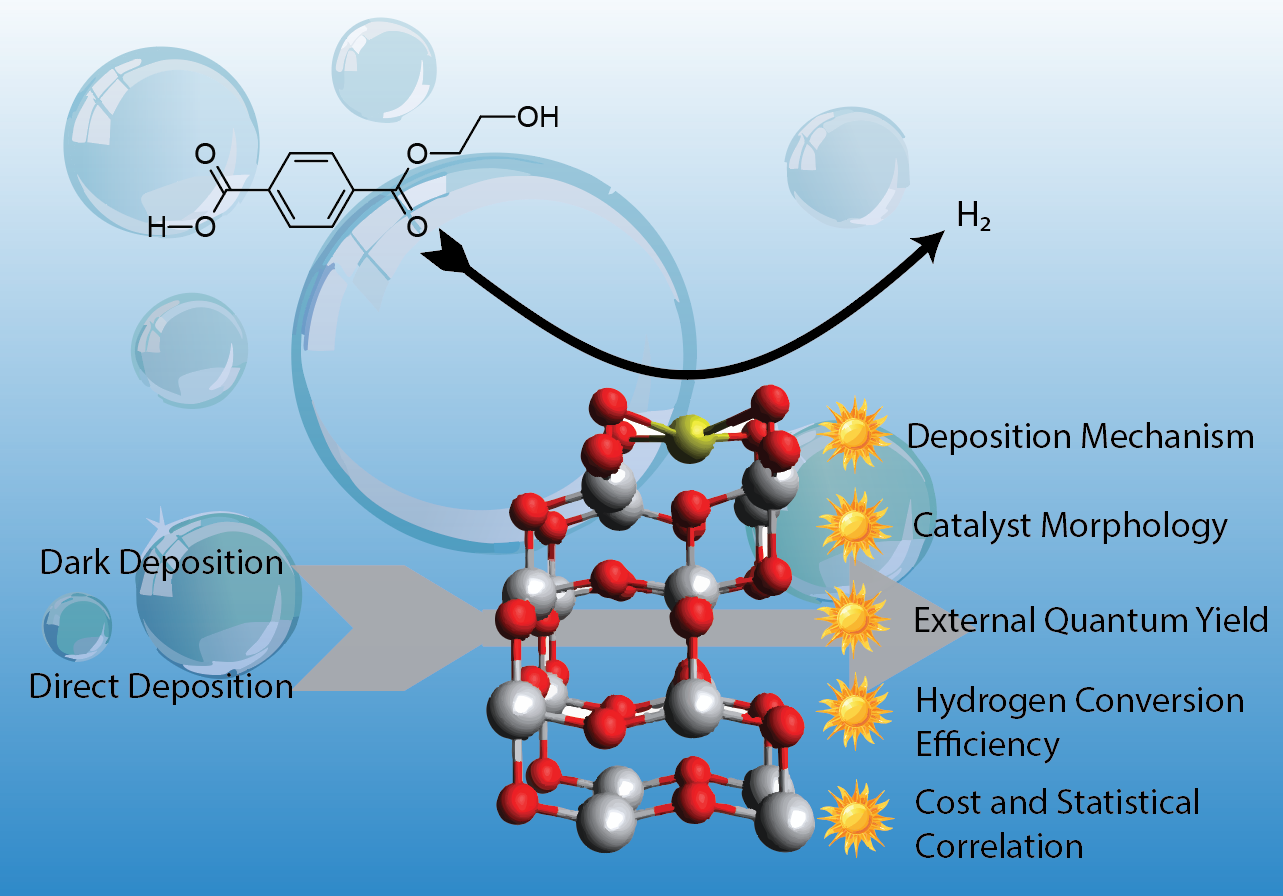
The objective of this study is to develop and optimize the photo-reforming process of polyethylene terephthalate for hydrogen production by synthesizing a dark-deposited Pt single atom on TiO2 nanoparticles with highly efficient catalytic activity at a lower cost. The nature of the catalysts was customized by altering the Pt loading conditions and applying different annealing temperatures to the TiO2 supports. The catalytic activity and characteristics of the dark-deposited Pt/TiO2 were compared with those of their direct-deposited counterparts by analyzing the hydrogen evolution activity during the photo-reforming process. The novelty of this study is the optimization of hydrogen production with improved activity of the Pt/TiO2 catalytic system utilizing minimum Pt loading via highly efficient single-atom deposition using the dark deposition method.
2. Methodology
The Pt/TiO
2 catalysts were synthesized using two different methods, with a detailed discussion of the dark deposition method and a summary of the traditional direct deposition method in sections 2.1 and 2.2, respectively. Optimized hydrogen production in the photo-reforming process via the direct deposition method was reported in our previous work [
29]. The catalysts synthesized using these two methods were characterized using numerous methods to identify their crystalline, morphological, and electronic properties and quantify hydrogen production. Principal component analysis was performed to elucidate the statistical correlation between the characterized catalytic properties and measured hydrogen evolution.
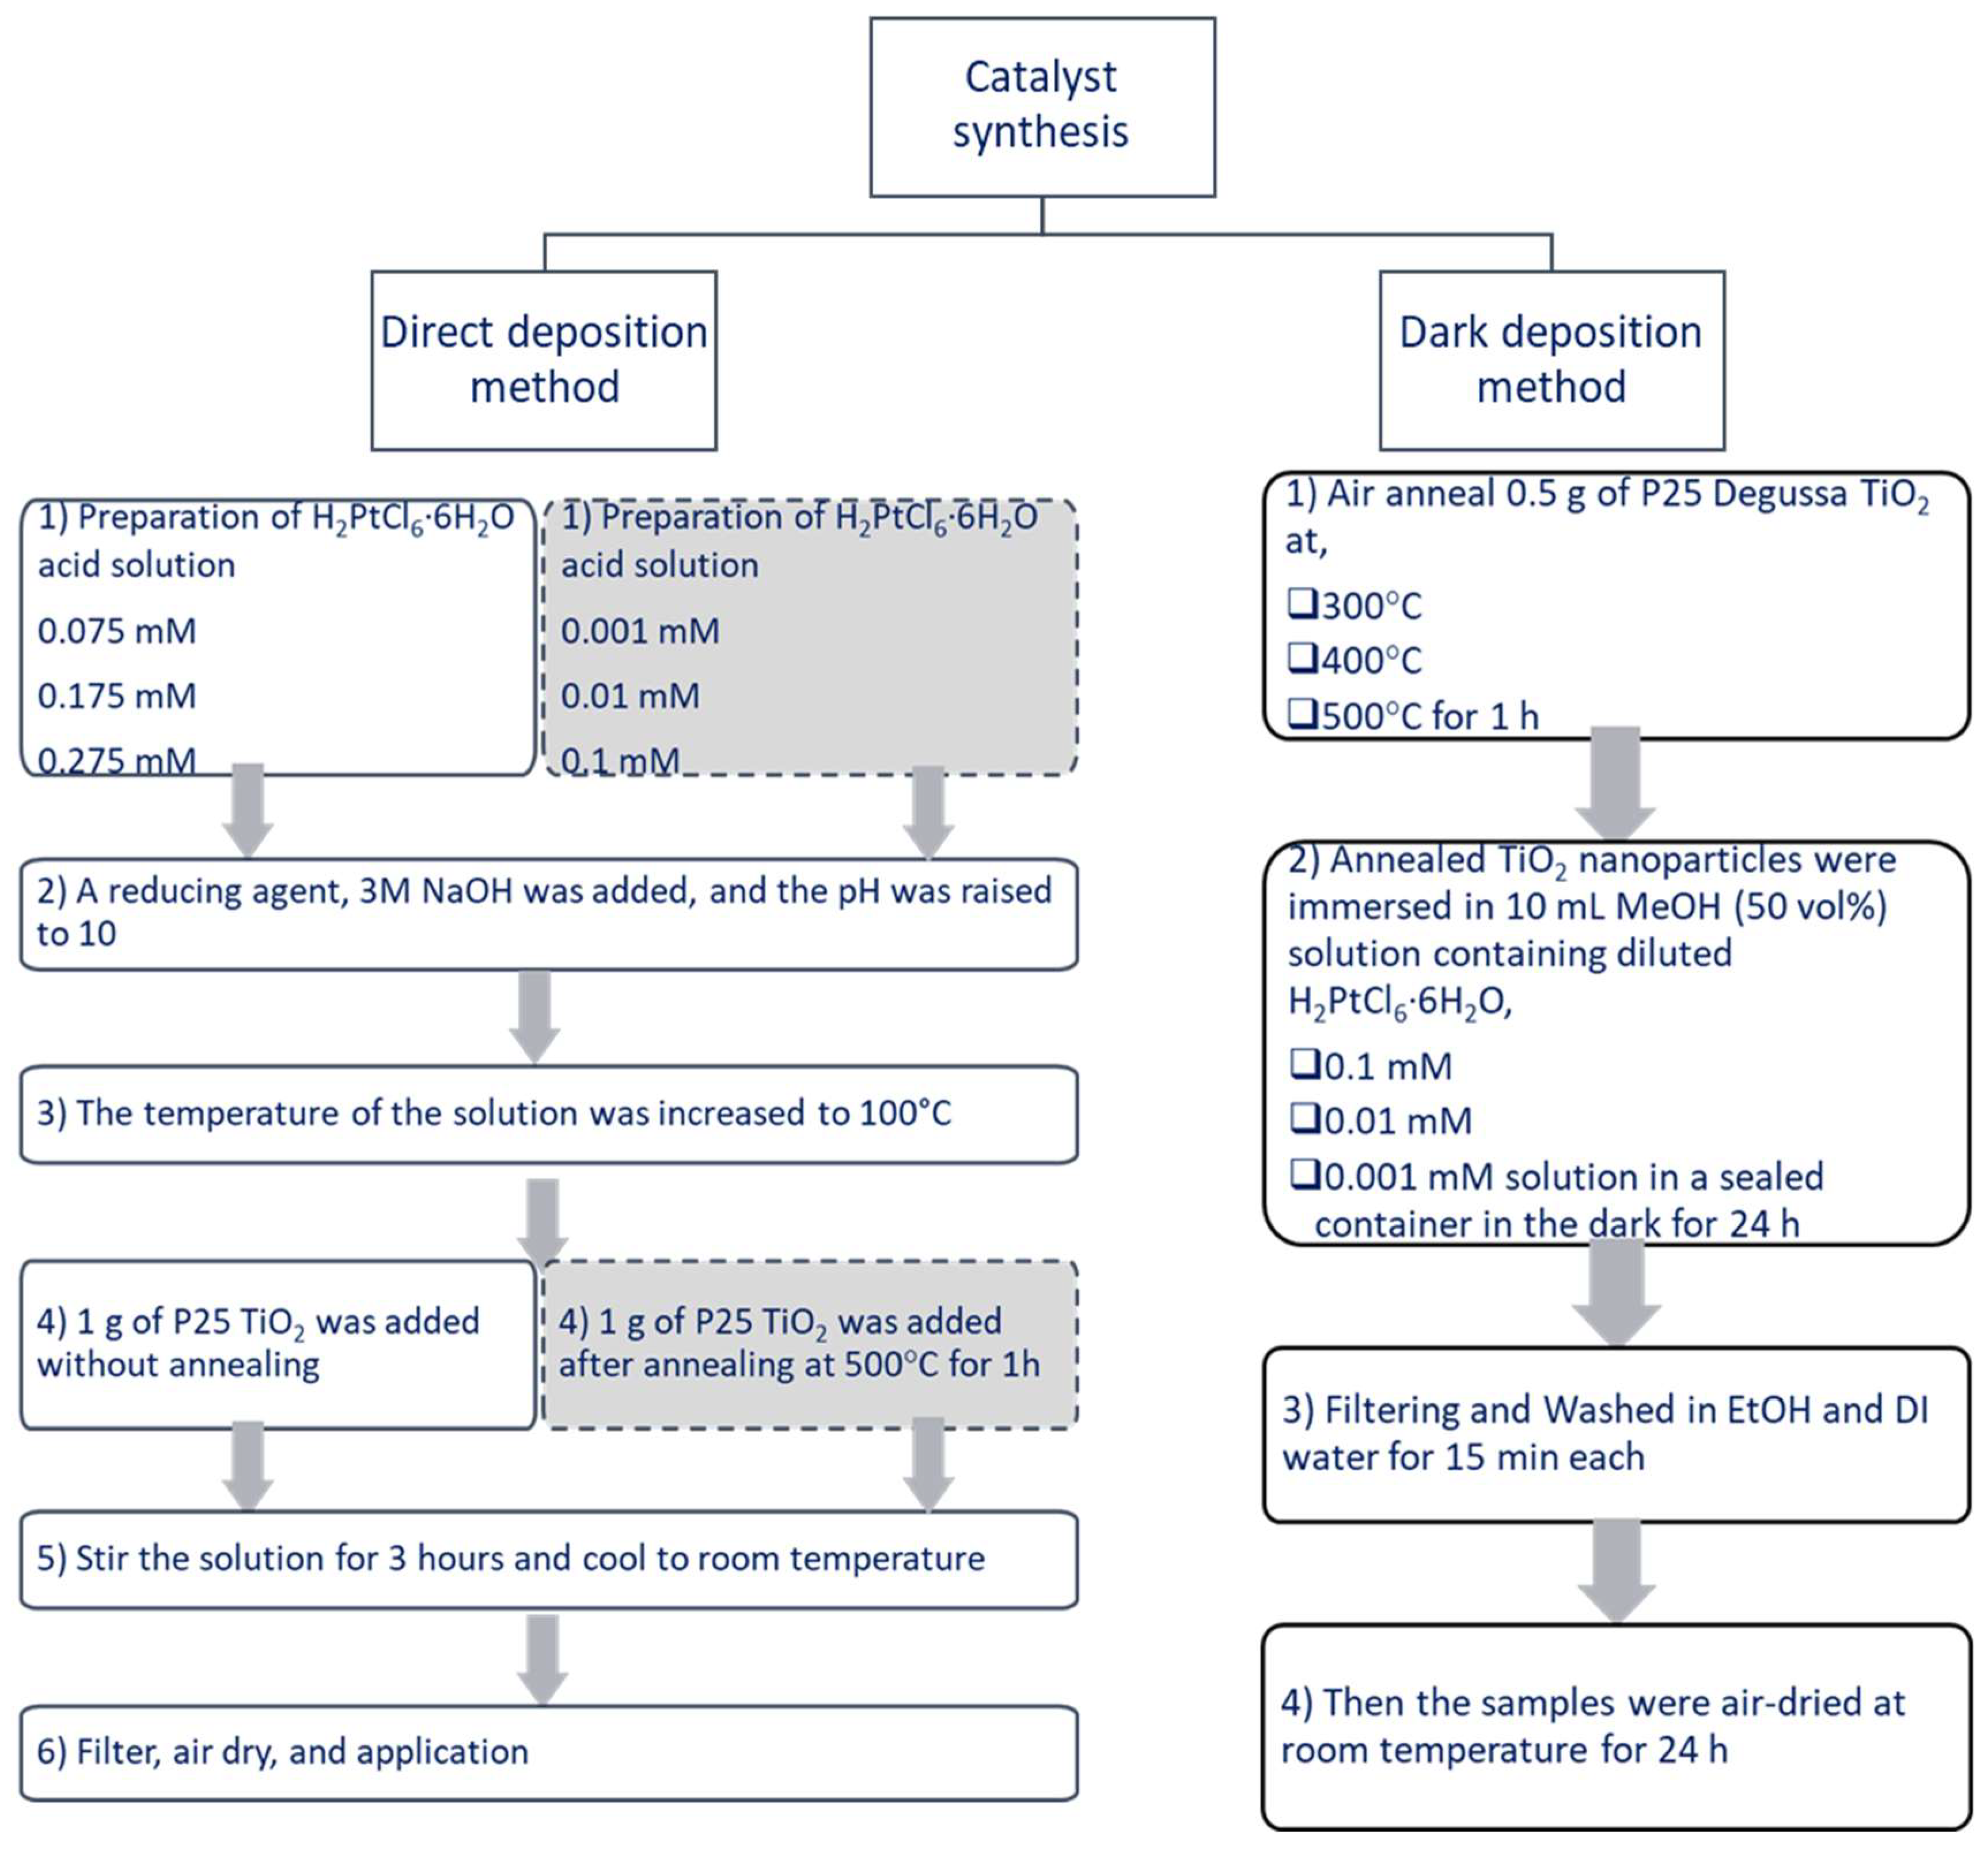
2.1. Dark Deposition Method of Pt/TiO2
The catalysts were synthesized using the dark deposition method by modifying P25 Degussa TiO
2 (P25 with 21 nm primary particle size, ≥99.5%, Sigma-Aldrich Inc., MO, United States). A schematic representation of the preparation method is shown in
Figure 1. The catalytic activity and characteristics of nine different catalysts were analyzed and synthesized under varying annealing temperatures and precursor concentrations. First, 0.5 g of P25 Degussa TiO
2 was annealed in air at 300, 400, and 500°C for 1 h. The annealed TiO
2 nanoparticles were immersed in 10 mL methanol (HPLC grade, ≥99.9%, Sigma-Aldrich Inc., MO, United States) solution (50%(v/v)) containing hexachloroplatinic acid (H
2PtCl
6, 8%(w/w) in H
2O, Sigma-Aldrich Inc., MO, United States) at concentrations of 0.1, 0.01, and 0.001 mM in separate batches. The containers with the solution mixtures were sealed and kept in the dark for 24 h with stirring at 300 rpm and 25°C for dark deposition. The catalysts were separated via a vacuum filtering system with 0.1 µm filter papers and washed with ethanol (HPLC grade, ≥99.9%, Sigma-Aldrich Inc., MO, United States) followed by deionized (DI) water for 15 min. Finally, the samples were air-dried at room temperature for 24 h.
2.2. Direct Precipitation Method
The direct deposition method was performed using hexachloroplatinic acid solutions (H
2PtCl
6, 8%(w/w) in H
2O, Sigma-Aldrich Inc., MO, United States) in 0.075, 0.175, and 0.275mM concentrations to prepare 0.3%(w/w), 0.7%(w/w), and 1.5%(w/w) Pt loadings on TiO
2. A baseline test was conducted using similar Pt dosages applied in the dark deposition method with Pt precursor concentrations of 0.1, 0.01, and 0.001 mM. P25 TiO
2 was added with or without annealing during the synthesis process. The TiO
2 was annealed at 500°C for 1 h. The deposition was performed under natural light conditions using 3M NaOH (ACS reagent, K ≤0.02%, ≥98%, Sigma-Aldrich Inc., MO, United States) as the reducing agent. The detailed preparation method was presented in our previous study, and
Figure 1 summarizes the two methods of Pt deposition on TiO
2.
2.3. Characterization of the Catalysts
The morphology and particle size distribution of Pt/TiO
2 were analyzed using an HT7650 transmission electron microscope (TEM, Hitachi High-Tech America, Inc., Pleasanton, CA). In order to conduct the analysis, 0.1 g of catalyst was dispersed in DI water and diluted 1000 times. Then, 0.1 µL of the sample was placed on a carbon-supported copper grid (Formvar/Carbon-supported Copper Grids, Sigma Aldrich, MO, United States) after sonicating for 10 min. TEM images were analyzed using the Fiji software to understand the impact of the annealing temperature on the TiO
2 particle size distribution and surface profile [
30]. The catalysts prepared under dark deposition with 0.01 mM precursor concentration after annealing at 300°C, 400°C, and 500°C and with 0.1 mM precursor concentration after annealing at 500°C were further investigated under a Jeol NEOARM 200CF Transmission Electron Microscope (JEOL USA, Inc., Peabody, MA) equipped with a Hitachi 3rd-order spherical aberration corrector for the scanning TEM (STEM) probe to visualize the atomic deposition of Pt particles.
The crystallinity of the synthesized catalysts was analyzed using the powder X-ray diffraction (XRD) method, 9430 060 03002 Empyrean Series 2 X-ray diffraction system, Malvern Panalytical Ltd., Malvern WR14 1XZ, United Kingdom). The degree of crystallinity of the catalysts prepared under various conditions was calculated using Equation (1) [
31].
The crystallite sizes of the catalysts for each synthesis method were calculated using the Scherrer formula, as shown in Equation (2) [
32].
where λ is the X-ray wavelength (nm), β is the peak width of the diffraction peak profile at half-maximum height resulting from the small crystallite size in radians, and K is a constant related to the crystallite shape, generally taken as 0.9. The value of β on the 2θ axis of the diffraction profile was in radians. θ is the diffraction angle in degrees or radians, because Cosθ corresponds to the same number. The crystallite size was calculated for all the 2θ values, and the average crystallite size was calculated.
The d-spacing (d), which is the distance between two consecutive lattice planes, was calculated using Bragg’s law (Equation (3)).
where n is the diffraction order, λ is the X-ray wavelength (nm) and θ is the diffraction angle of the XRD profile.
The percentage of anatase in TiO
2 after synthesis was calculated (Equation (4)) by considering the area under the characteristic peaks of anatase (101) at 25.1° and rutile (110) at 27.2°. It is assumed that P25 TiO
2 consists only of anatase and rutile phases.
A Perkin Elmer Avio 550 Max Inductively coupled plasma optical emission spectroscopy (ICP-OES, Perkin Elmer Avio 550 Max ICP-OES) analysis following the EPA 200.7 method was used to analyze the Pt concentration in the synthesized catalysts. The samples were digested using the EPA 3051A method without hydrogen fluoride. Samples were pre-digested for 4 h before being placed in a microwave (Milestone Ethos UP microwave, Milestone Srl, Italy), followed by determination of the elemental concentrations by considering the digestion dilution factors.
X-ray photoelectron spectroscopy (XPS) of the selected synthesized catalyst sample with 0.01 mM precursor concentration at 400°C was collected on the Kratos Axis Ultra 165 DLD Hybrid Ultrahigh Vacuum Photoelectron Spectrometer (Kratos Analytical, Manchester, UK). The sample was mounted on carbon tape and pressed into indium foil before the analysis. The Pt 4f region was observed at a very low intensity, and a fit was performed using a Shirley background, assuming the Pt 4f7/2 was the peak at 72.8 eV and the second peak was added corresponding to the position of the Pt 4f 5/2 with approximately 0.75 times the intensity of the first peak. This was used to calculate the percentage of atomic composition.
The absorbance spectra in the ultraviolet (UV) and visible light range from 200 nm to 900 nm were measured using a spectrophotometer (DR6000 ultraviolet-visible spectrophotometer, Hach Company, Loveland, CO, United States). Direct and indirect bandgaps were estimated using the Tauc plot method, as described in our previous study [
33]. Equation (5) was used to calculate the maximum irradiation wavelength required to initiate the electron transition.
where λ is the wavelength of light (nm), h is Planck’s constant in Jule × s (Js), c is the speed of light (m/s), and E
g is the bandgap energy in J.
The Pearson correlation coefficients between parameters such as precursor concentration, annealing temperature, bandgap energy, and hydrogen yield were calculated using the Origin(Pro) software [
34].
2.4. Evaluation of Hydrogen Production
The hydrogen yield was measured in quartz reactors with photo-reforming of 0.5 g pretreated polyethylene terephthalate (PET) in 10 mL of ethanol and water mixture (3:2) with 5%(w/w) NaOH. The reaction solution was diluted with 40 mL deionized (DI) water. The synthesized catalyst (0.5 g) was added to this mixture and irradiated with light, as described in our previous studies [
33,
35]. Hydrogen was measured at 24-hour intervals using a gas chromatograph equipped with a thermal conductivity detector. Each measurement was replicated, and the standard deviation was calculated.
The hydrogen conversion efficiency was calculated using the stoichiometric hydrogen conversion and the photo-reforming reaction with PET in the substrate. The stoichiometric hydrogen conversion reaction in alkaline media is presented in Equations (6) and (7), assuming that hydrogen production from terephthalate is negligible [
36].
H
2 conversion after 48 h of irradiation was calculated using Equation (8) [
36]:
where N
(H2, obs) is the observed H
2 yield at 48 h in moles, N
(substrate, obs) is the amount of substrate used in the experiment in moles, and N
(H2,ideal)/ N
(substrate, ideal) is the ratio of H
2 in the substrate under stoichiometry derived from Equations (6) and (7).
The external quantum yield (EQY) was determined by considering the H
2 yield after 1 h of light irradiation with UV-LED lamps containing eight single UV-LED components (model: KL265–50 V-SM-WD, manufactured by Crystal IS; UVC LED 70 mW with a single wavelength of 265 nm). Baseline tests were conducted using water, a water-ethanol mixture, and a mixture of water, ethanol, and PET with a constant catalyst dosage. Equation (9) was used to calculate the external quantum yield [
36].
The number of transferred electrons, denoted as k, was assumed to be two in the baseline tests for water splitting and 12 for ethanol reforming. For the photo-reforming of PET (assuming ethylene glycol reforming), k was assumed to be 10, NH2 was the amount of H2 generated in moles after 1 h of reaction, NA was Avogadro’s constant (6.022×10²³ mol−1), h was Planck’s constant (6.626×10⁻³⁴ J s), c was the speed of light (3×10⁸ m s −1), tirr was the irradiation time in seconds (s), λ was the irradiation wavelength in meters (m), I was the light intensity in watts per square meter (W/m2), and A was the irradiated area in square meters (m2).
2.5. Method of Principal Component Analysis
Principal component analysis (PCA) was performed using Origin(pro) 2024 software [
34]. PCA was used to quantify the correlation between catalyst characteristics and hydrogen production. Hence, a scree plot was created from the data concerning parameters such as hydrogen yield at 48h, precursor concentration, annealing temperature, average bandgap, observed Pt loading, average crystallinity, average particle size, degree of crystallinity, and anatase percentage in the catalyst to evaluate the required number of principal components. Scree plot suggests extraction three principal components that represent more than 90% of the data. PCA was based on the correlation matrix of the nine parameters considered. A loading plot was created based on the calculated eigenvalues and eigenvectors, depicting the nature of the correlation between each parameter and the principal component.
3. Results and Discussion
The catalysts synthesized by the dark deposition method were characterized by identifying the particle size distribution, size of the deposited Pt atoms, and surface profiles. The crystallinity of the catalysts was investigated by calculating the crystallite size, degree of crystallinity, and average TiO2 anatase phase percentage. Furthermore, variations in the bandgap energy and actual Pt loading on the catalysts were analyzed. The electronic properties and the influence of Pt deposition on the electronic properties of the catalysts were investigated via XPS analysis. The characteristics of the dark-deposited catalyst were compared to those of the direct-deposited catalysts and pristine TiO2. Hydrogen production using these nine dark-deposited catalysts and three direct-deposited catalysts was compared, and PCA was performed to verify the correlation between catalyst characteristics and hydrogen evolution.
3.1. Characterization of the Catalysts with Transmission Electron Microscopy
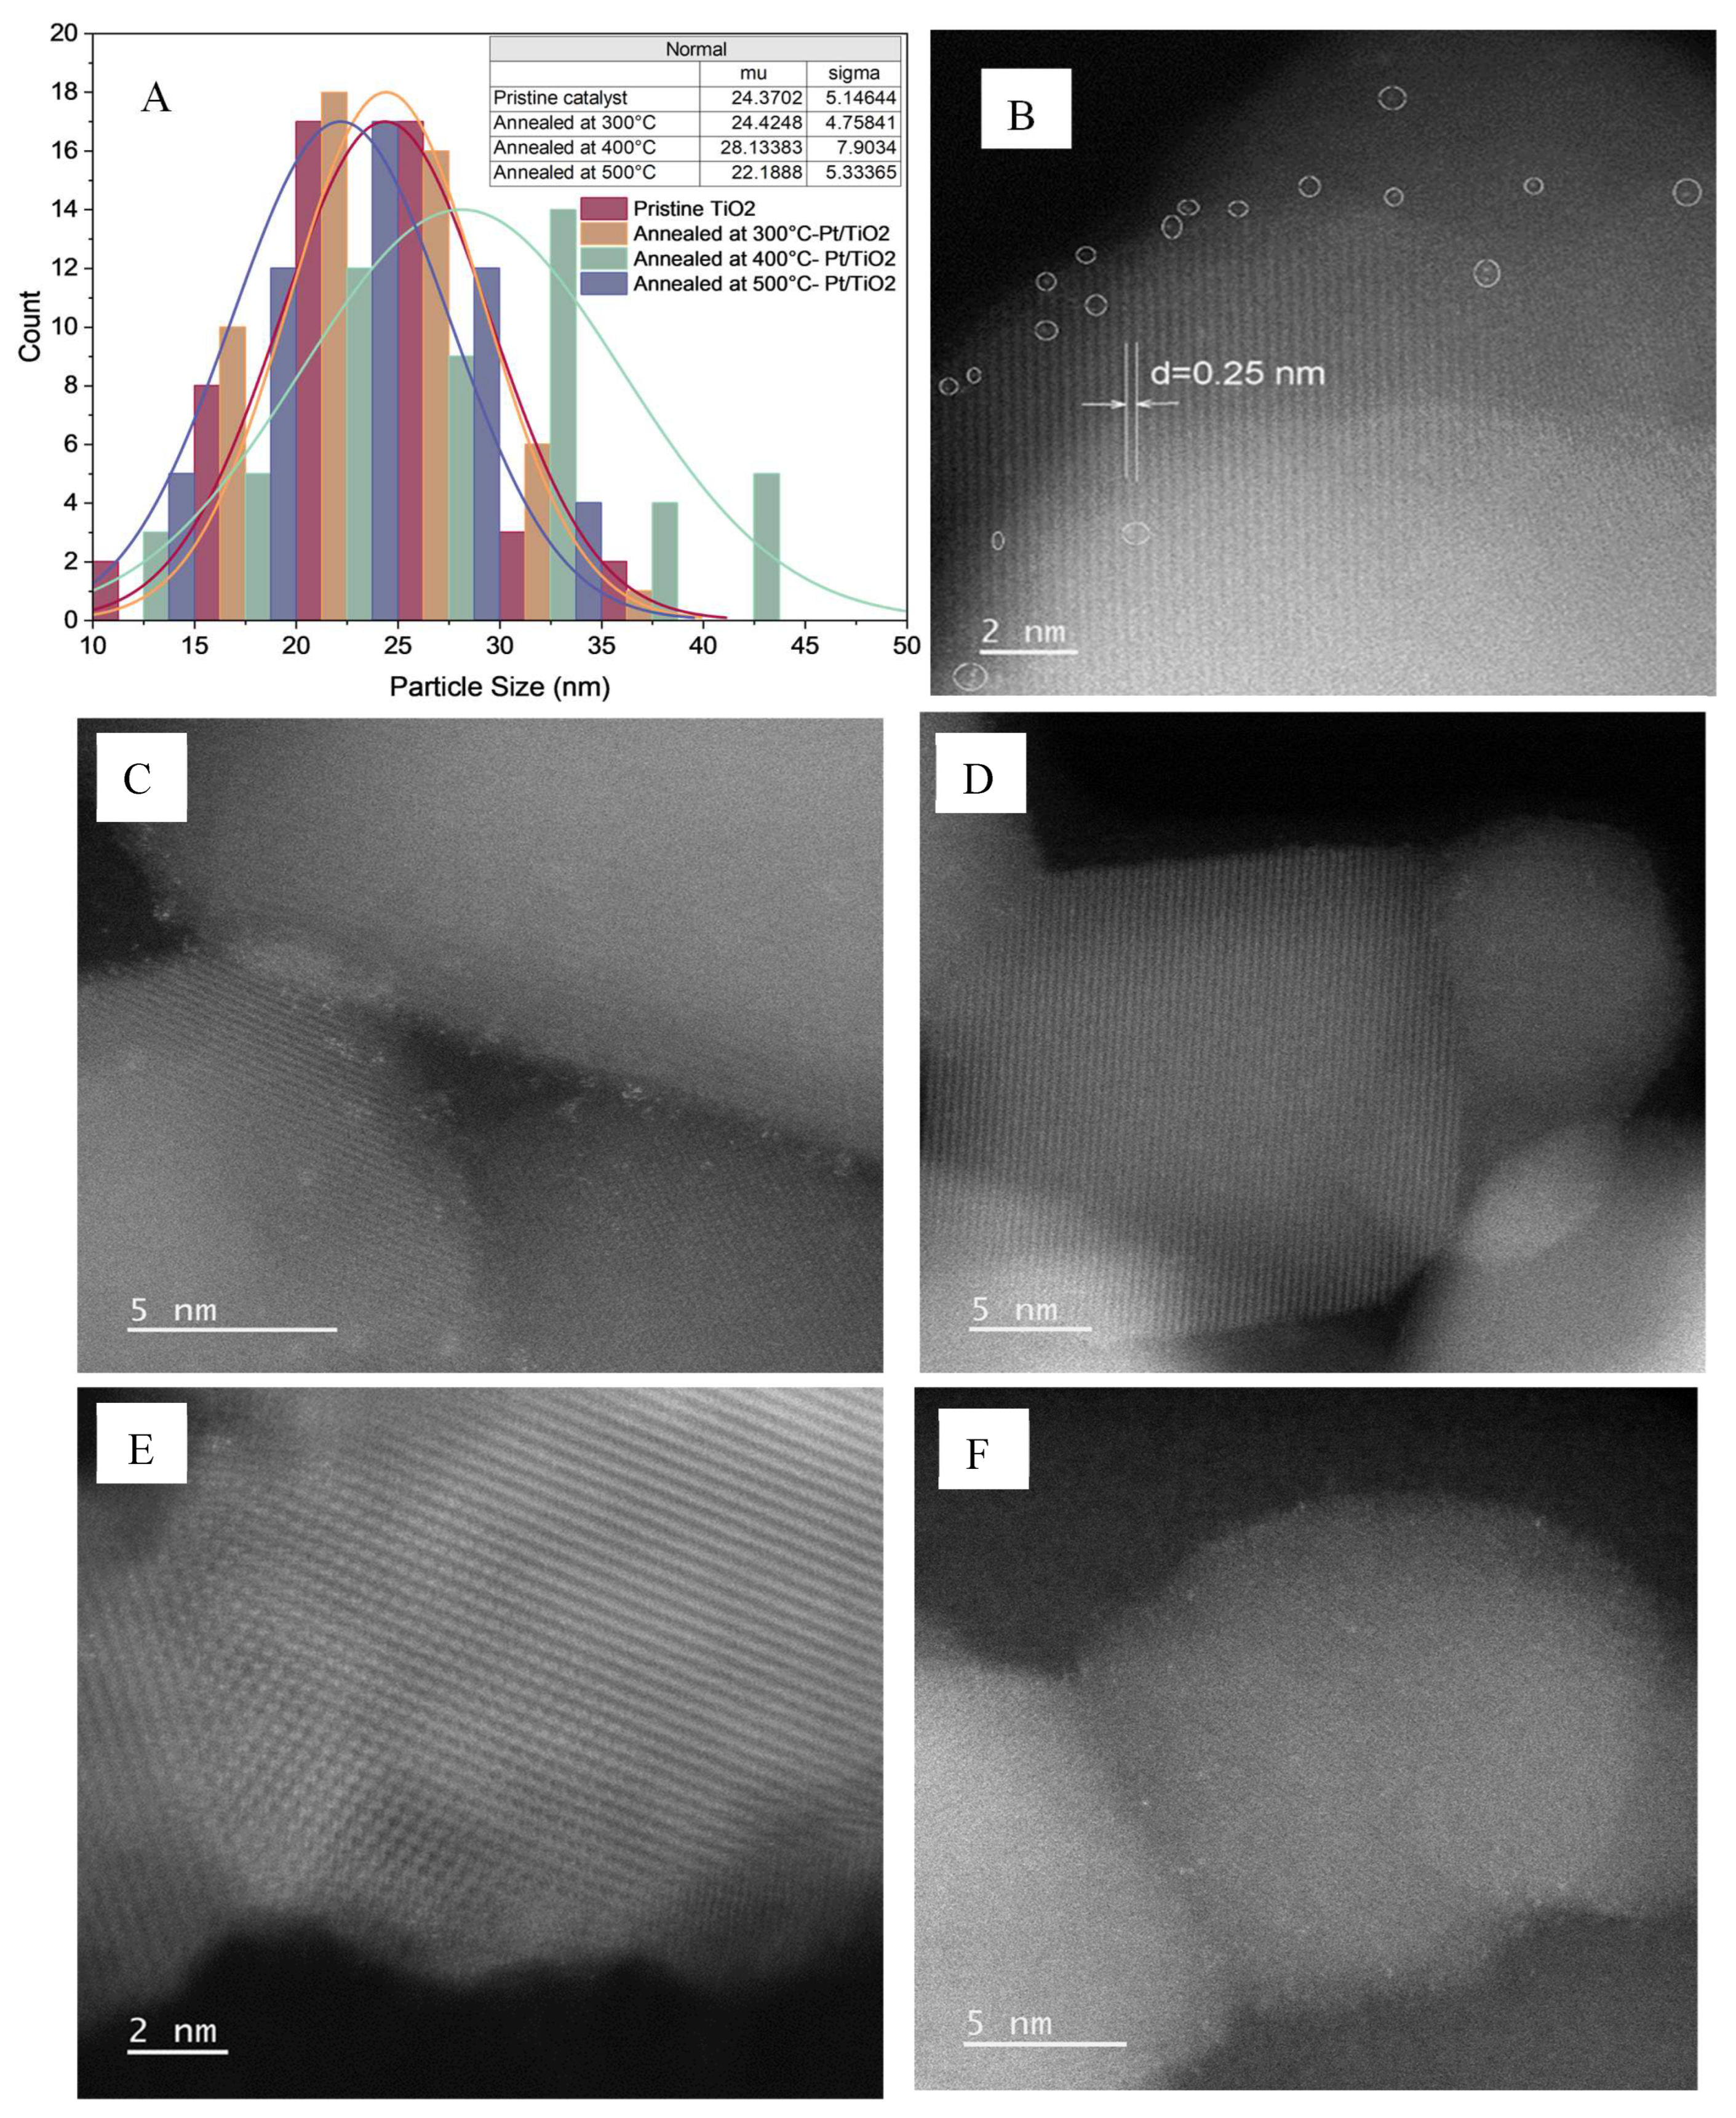
The particle size distributions and morphologies of the catalysts synthesized under different conditions were studied using TEM, as shown in
Figures S1A, S2A and S3A. Surface profile plots of 0.04%(w/w) Pt/TiO
2 annealed at 300°C, 400°C, and 500°C are shown in
Figures S1B, S2B and S3B, respectively. The TEM images obscured the morphological changes. Hence, the effect of annealing on the TiO2 particle size was analyzed based on the particle size distribution curves obtained from the TEM images, as shown in
Figure 2A. In our previous study, the average particle size of pristine TiO
2 was 20.52 nm in our previous study [
33]. The particle size of the TiO
2 was not changed when the direct deposition method was applied [
33].
When the annealing temperature was increased to 300°C, the average particle size of Pt/TiO
2 obtained using the dark deposition method increased. The growth rate of the particles was slow because of the low temperature variation. This crystalline growth result is consistent when the annealing temperature is increased to 400°C the synthesis the catalyst via the dark-deposition method [
37,
38]. However, the average particle size of Pt/TiO
2 decreased when the annealing temperature was increased to 500°C because of its increased density and reduced porosity (
Figure 2A) [
39]. The particle size decreased when observed at an annealing temperature of 500°C, leading to a homogeneous morphology of the catalyst. Hence, the results suggest that the morphology of Pt/TiO
2 is affected by the annealing temperature, thereby changing the specific surface area and catalytic activity of the catalysts.
A scanning transmission electron microscopy (STEM) image of 0.7%(w/w) Pt/TiO
2 prepared using the direct deposition method is shown in
Figure 2B. Pt atoms were observed as individual SA and multimers, as circled in
Figure 2B, and the corresponding particle size distribution of the Pt atoms is included in
Figure 2B. The average particle size of Pt atoms was observed as 0.11 nm, confirming the abundance of Pt single atoms compared to agglomerated dimers and trimers (multimers). Deposition of the Pt atoms was evident on the (004) crystal plane of anatase, which was identified by the corresponding d-spacing of 0.25 nm [
40].
Figure 2C shows a STEM image of 0.4%(w/w) Pt/TiO
2 prepared by applying the dark deposition method. Comparing images in
Figure 2B,C illustrates that the dark deposition method provides more successful Pt deposition, even at a 42% lower Pt loading. However, the agglomeration of Pt atoms was observed when the average particle size was 0.32 nm. Upon reducing the precursor concentration by 10, the atomic size of the deposited Pt was reduced threefold (0.12 nm), irrespective of the annealing temperature (
Figure 2D–F). The deposited size of Pt proves the deposition of single atoms with reduced precursor concentration into 0.01 mM, avoiding agglomeration. Furthermore, the increased annealing temperature improved the crystallinity of the support structure (TiO
2), whereas the crystal planes were visible in
Figure 2C–E.
3.2. X-Ray Diffraction Analysis of the Catalysts
The XRD patterns of the catalysts synthesized under different conditions are shown in Figure. S4. The degree of crystallinity, average crystallite size, and d-spacing were calculated from the XRD profiles, and variations in the parameters with annealing temperature and precursor concentrations were analyzed.
Figure S5A shows the variation in the degree of crystallinity and the average crystallite size under different synthesis conditions. Although greater variability in crystallinity was observed (
Figure S5A), all the dark-deposited catalysts exhibited a high degree of crystallinity, consistently above 85%. Furthermore, the overall degree of crystallinity increased with increasing annealing temperature at a lower rate. The highest degree of crystallinity was observed in the catalysts synthesized at 400°C with a precursor concentration of 0.01 mM (0.04%(w/w) Pt loading). As shown in
Figure S5B, the average crystallite size increased with increasing temperature. During the annealing of P25 at 300 °C, the primary transformation involved crystallite growth and increased crystallinity rather than significant phase changes [
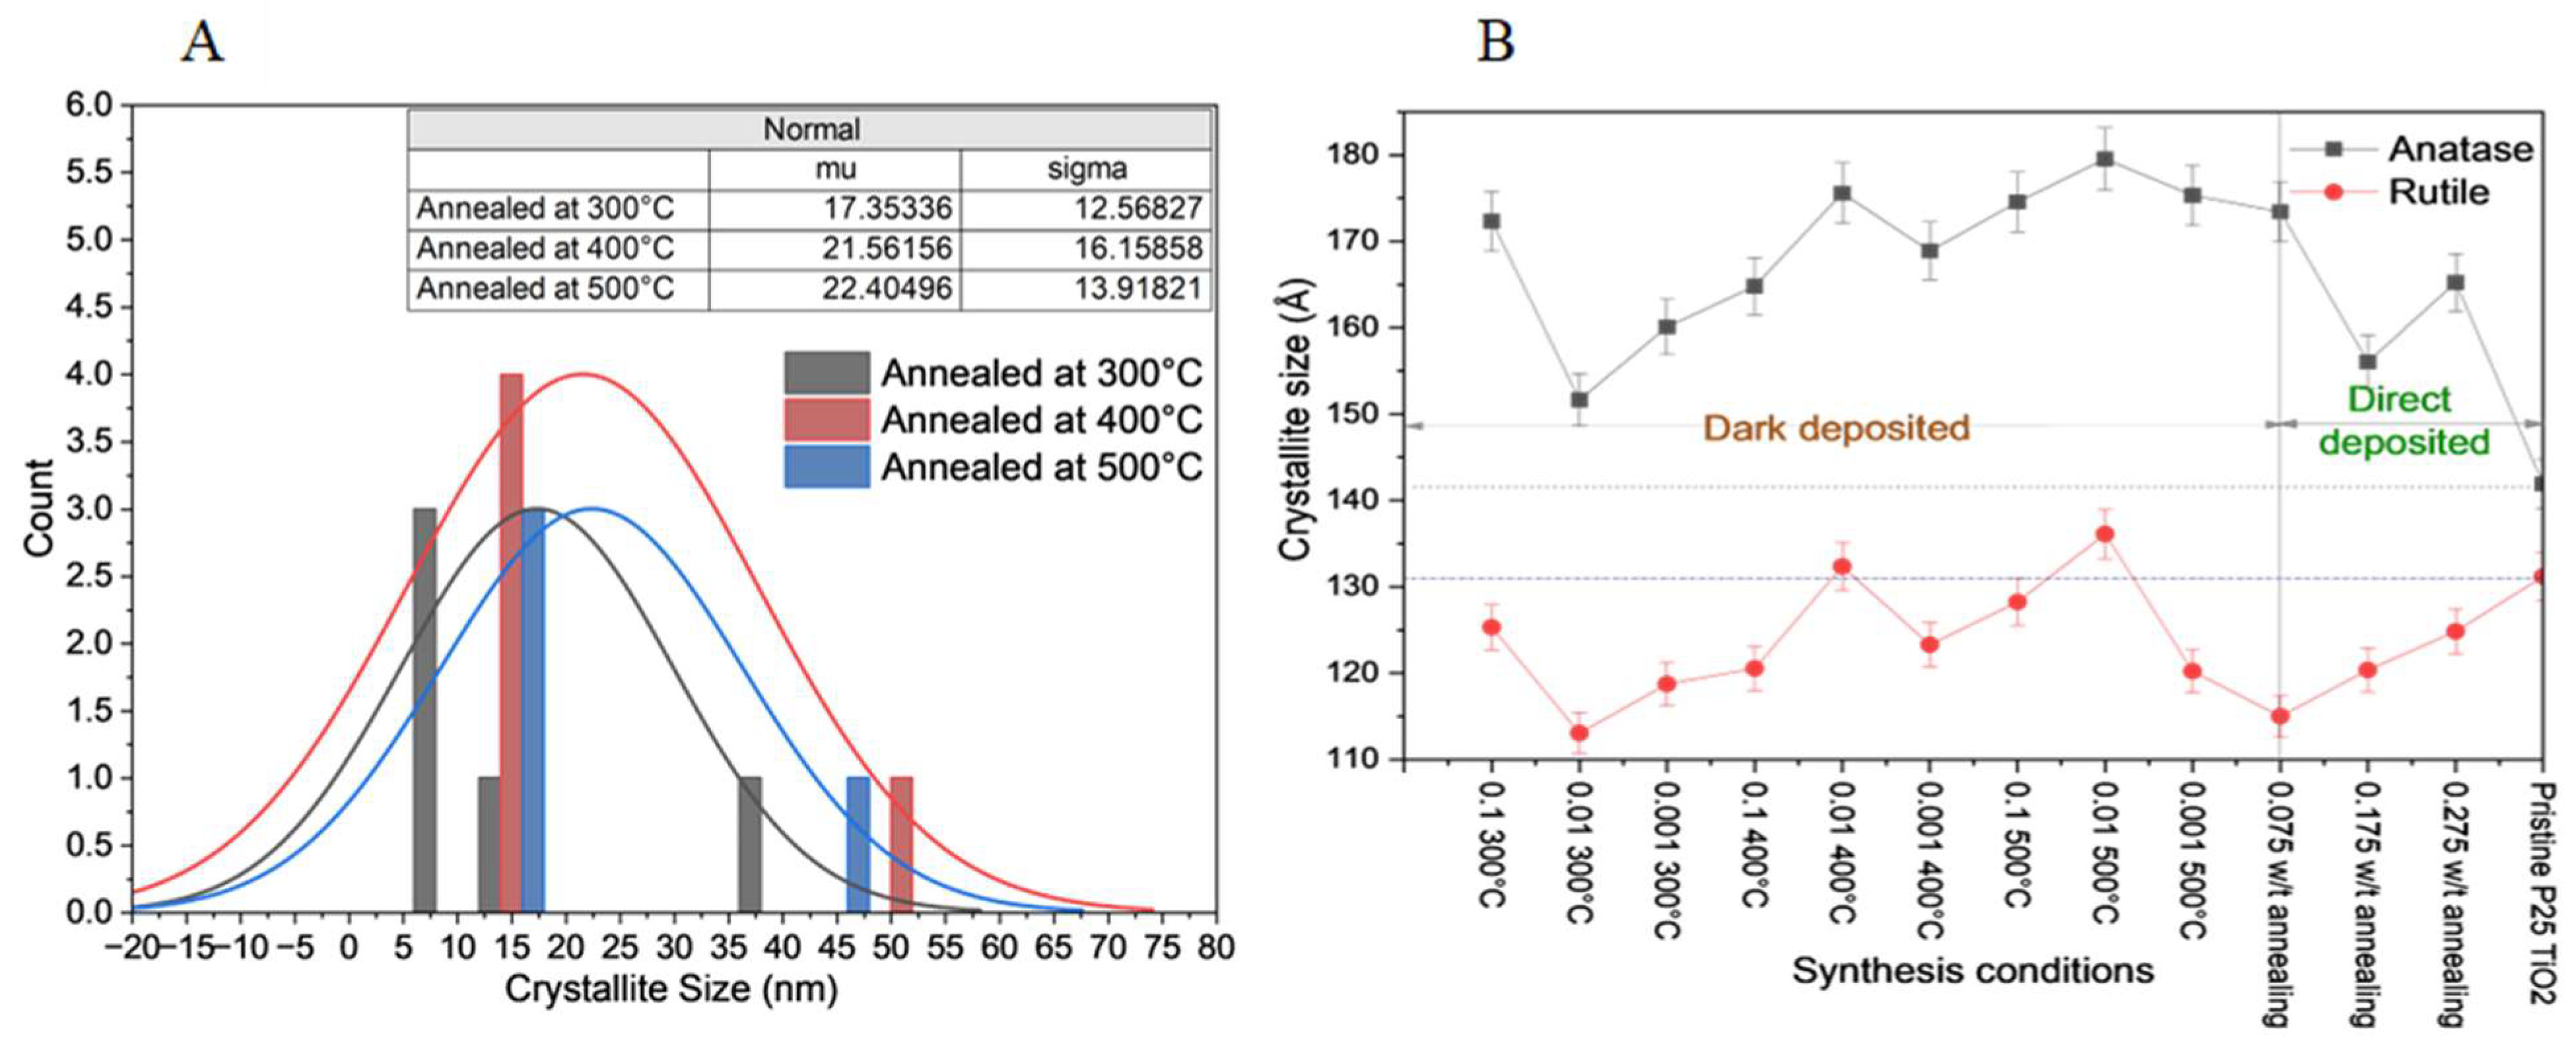
41]. Anatase, a metastable phase, typically transforms into rutile at high temperatures (above 600°C), while rutile remains stable. The variation in crystallite size was further analyzed by plotting the crystallite size distribution curves for catalysts synthesized with 0.01 mM precursor concentration at different annealing temperatures (
Figure 3A). The average crystallite size of the respective catalysts increased from 17 to 22 nm when the temperature was increased from 300 to 500°C. The effect of temperature on the different phases of the catalysts was studied by analyzing the crystallite sizes of the anatase and rutile crystals in the crystalline nanoparticle mixture (
Figure 3B).
Interestingly, the results illustrated that the degree of crystallinity and crystallite size varied in the same subset of samples annealed at the same temperature, regardless of the experimental conditions (
Figure S5). These observed variations in crystallinity and crystallite can be attributed to different Pt precursor concentrations that can influence the nucleation and growth kinetics of TiO
2 crystallites, with higher Pt loadings potentially influencing the crystallites of the composite material depending on the Pt interaction with TiO
2 surfaces [
42]. Additionally, Pt decoration can enhance localized heating, facilitating the mobility of TiO
2 species and influencing Ostwald ripening, leading to differences in crystallite size [
43]. Pt can also affect the internal stress and defect healing in TiO
2 crystallites, contributing to variations in the crystallinity [
44]. Furthermore, Pt decoration alters the surface energy, which can affect the crystallite growth rates and result in differences in the crystallinity and crystallite size [
45]. Overall, these results indicate that Pt loading significantly influences the crystallization dynamics of TiO
2 even when annealed under the same conditions.
Anatase TiO
2 showed a lower resistance to temperature, and a higher rate of crystalline growth was observed with larger crystallite sizes ranging from 15.1 nm to 17.9 nm. However, the rutile phase of TiO
2 showed a slightly lower rate of crystalline growth with more stable crystallite sizes ranging from 11.3 nm to 13.6 nm. Hence, the observed average crystallite growth (
Section 3.1) can be attributed to the lower temperature resistance of anatase TiO
2 [
46]. The degree of crystallinity and average crystallite size were at optimum conditions at 500°C with lower variability. Hence, the XRD results showed a similar trend to that of the particle size distribution observed in the TEM images. The average crystallite size was slightly smaller than the average particle size observed in the TEM images, indicating a combination of crystallites [
47]. The variation in d-spacing was calculated and is presented in
Table S1. The observed d value in STEM analysis was verified as 0.24 nm for the anatase (004) lattice phase. However, the anatase TiO
2 percentage in the synthesized catalysts increased gradually with increasing temperature (
Table 1), likely due to the transformation of the rutile phase into anatase upon increasing the temperature from 300 to 500°C [
48]. Additionally, the phase transitions of TiO
2 strongly depend on the temperature, with minimal changes below 300°C, where brookite and anatase remain stable [
41,
49]. However, when the temperature was between 300 and 500°C, brookite gradually converted to anatase, enhancing the crystallinity.
The degree of crystallinity of P25 TiO
2 was significantly improved after annealing, and the subsequent anatase percentage in the catalysts synthesized using the dark deposition method was higher than that synthesized using the direct deposition method. Regardless of the synthesis method (dark or direct deposition), the crystallite sizes of both anatase and rutile in the pristine TiO
2 increased, as shown in
Figure 3B.
3.3. ICP-OES Analysis
ICP-OES analysis was performed to verify the actual Pt content deposited on TiO
2.
Table 2 summarizes the actual Pt loading deposited on TiO
2 and compares it with the expected maximum Pt loading, assuming that all the Pt in the precursor solution was deposited on the TiO
2 surface. The Pt loading was overestimated in the catalysts synthesized with a precursor concentration of 0.001 mM owing to instrument limitations. The measured Pt loading increased with increasing precursor concentration in the dark deposition method while reaching the expected loading. Furthermore, Pt loading on the TiO
2 surface increased with increasing annealing temperature. The catalyst prepared with a 0.01 mM precursor concentration after annealing at 400°C showed the most effective Pt loading under the dark deposition method.
A higher Pt loading was observed in the catalysts prepared using the dark deposition method than in those prepared using the direct deposition method. Moreover, 98% of expected Pt loading was achieved at 0.01 mM precursor concentration when the dark deposition method was applied. In contrast, even at a higher precursor concentration of 0.175 mM, the maximum precursor loading was 0.029%, which was only 4% of the expected loading in the direct deposition method. These results suggest that the dark deposition method is more efficient for Pt deposition than the direct deposition method. The effect of the annealing temperature on the deposited Pt content under direct and dark deposited catalysts was compared by measuring the Pt content with and without the annealed TiO2. The annealing temperature increased Pt loading when a lower precursor concentration was used in the direct deposition method. When comparing the catalysts prepared with TiO2 annealed at 500°C using the direct and dark deposition methods, a 43% and 88% higher amount of Pt is measured in the catalysts prepared under the dark deposition method at 0.01 and 0.1 mM precursor loadings, respectively, proving an efficient synthesis method in achieving higher precipitant loading in TiO2 surface.
3.4. X-Ray Photoelectron Spectroscopy Analysis
The electronic properties of the selected 0.04%(w/w) Pt/TiO
2 were analyzed using observed X-ray photoelectron spectroscopy (XPS). The atomic and mass concentrations of Pt on TiO
2 were calculated from XPS data. The atomic concentration calculated using XPS for dark-deposited 0.04% (w/w) Pt/TiO
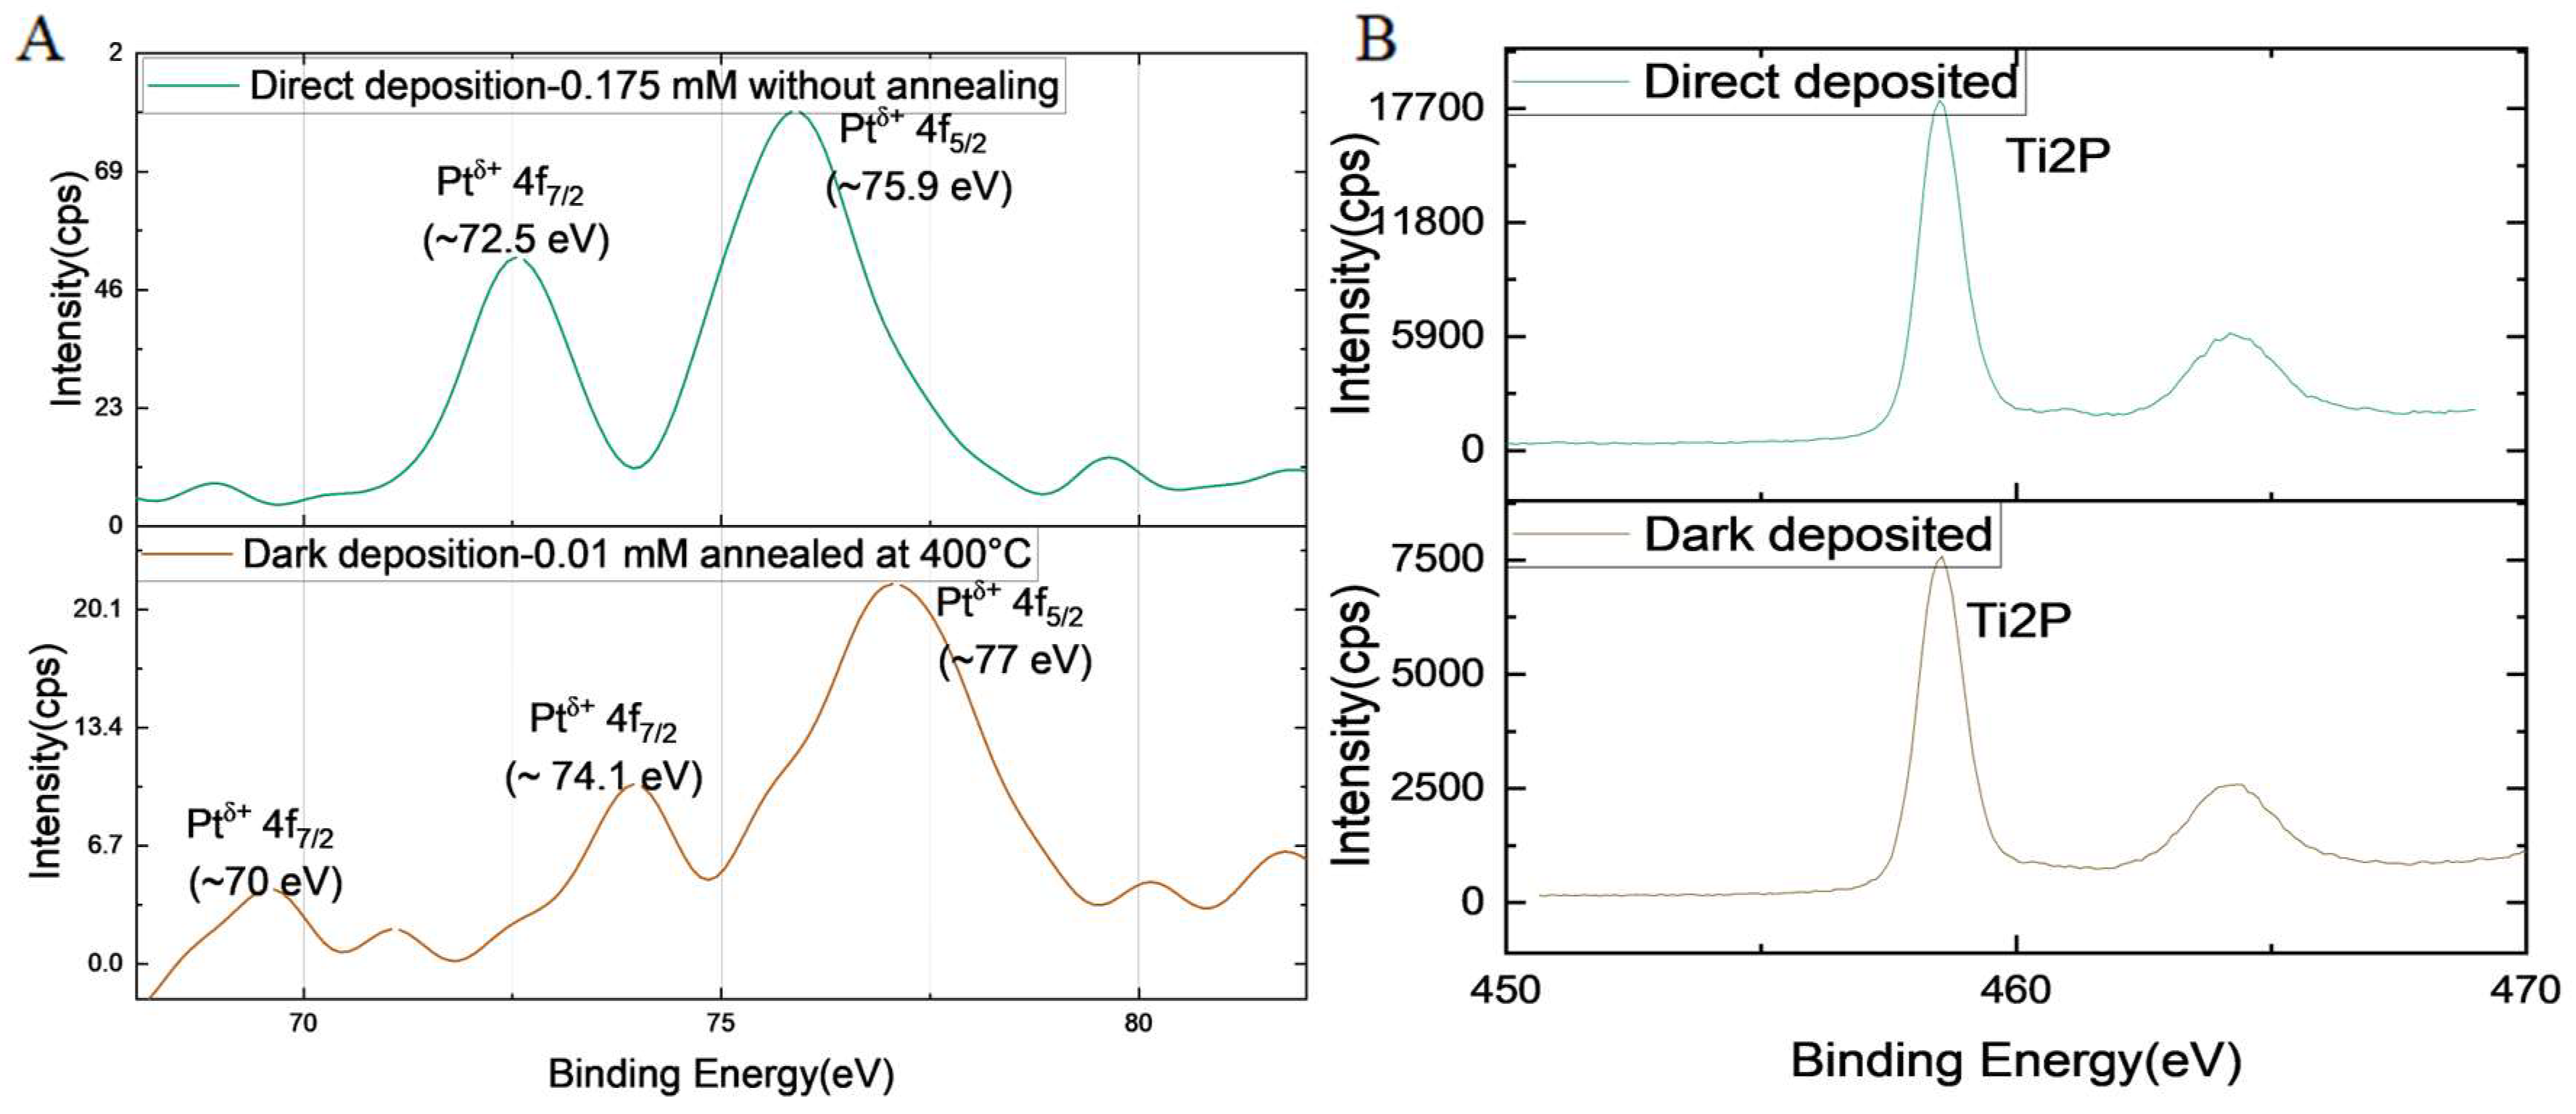
2 was 0.06%, and the respective mass concentration was 0.45%. Hence, the XPS data overestimated the mass concentrations. The XPS spectra were further analyzed to understand the electronic states of the deposited Pt. XPS spectra of Pt 4f and Ti 2p regions of direct-deposited Pt with 0.175 mM precursor concentration and dark-deposited Pt with 0.01 mM precursor concentration are compared in
Figure 4. The peak positions increased in the dark-deposited Pt/TiO
2 spectra with noticeable shape changes. Additional small peaks were evident at ~70, ~71, and ~74 eV, corresponding to the average oxidation states of Pt
0, Pt
2+, and Pt
4+, respectively (
Figure S6) [
50]. These results indicate that the Pt species in the Pt single atoms of the dark-deposited Pt/TiO
2 were partially oxidized with 0 to +4 valences because of the mutual electronic interactions between the Pt atoms and the TiO
2 support. However, Pt
0 and Pt
4+ species were not observed in the direct-deposited Pt/TiO
2, and the Pt
2+ species at ~72.5 eV was evident, illustrating that the oxidation state of the Pt single atoms was +2 [
51]. Because the surface-coordinated Pt
δ+ is critical to the high activity of the Pt/TiO
2 system, it is crucial to understand the nature of the Pt single atoms on the H
2 production activity while optimizing the activity at minimum Pt loading. Overall, the XPS results suggest that the two different synthesis methods deposited different Pt species on TiO
2 while producing catalysts with different activities.
3.5. UV-Vis Absorbance of the Catalysts
The variation in the absorbance of the synthesized catalysts with different annealing temperatures at precursor concentrations of 0.1 mM, 0.01 mM, and 0.001 mM is presented in
Figure S7. Considerable variation was not evident in the absorbance of the catalysts at different annealing temperatures; therefore, the bandgap energy of the catalysts did not change under different annealing temperatures. However, the precursor concentration and Pt loading affected the bandgap energy, as summarized in
Table 3. The lowest bandgap energy was observed for the catalyst prepared with a 0.1 mM precursor concentration after annealing at 400°C. The catalysts prepared with 0.01 mM Pt precursor concentration show a bandgap energy of 2.34 eV under all different annealing temperatures. Overall, a slight difference in the bandgap energies was observed when changing the precursor loading from 0.1 mM to 0.01 mM. However, considerable bandgap broadening was observed when the precursor loading was further reduced to 0.001 mM.
The bandgap values of the different synthesis methods are compared in
Table 3. The bandgaps of the direct-deposited catalysts were much higher than those of the dark-deposited ones. A narrower bandgap results in a lower energy required for electron transition and can subsequently utilize a higher applicable maximum irradiation wavelength. The maximum wavelength that can be applied in the photo-reforming process in the presence of each catalyst was calculated and is presented in
Table 3. All values fall within the visible light region of the light spectrum, indicating the feasibility of performing photocatalytic activity under solar light. Furthermore, the natural bandgap of pristine TiO
2 is ~3.2 eV, and the maximum activating wavelength is 388 nm [
52]. The development of TiO
2 with Pt deposition using the dark and direct deposition methods has improved the bandgap energy while harvesting the optimum energy from the solar spectrum. Moreover, the light-harvesting efficiency of the dark-deposited catalysts was higher than that of the direct-deposited ones.
The correlation between the parameters was evaluated by calculating the Pearson correlation coefficient, as summarized in
Figure S7D. The precursor concentration and annealing temperature exhibited a negative Pearson correlation, confirming a decrease in the bandgap. The correlation coefficient between the annealing temperature and the average bandgap is -0.24, which indicates a weak negative correlation, suggesting a neutral role for the annealing temperature in bandgap modification. However, the precursor concentration and average bandgap have a moderately negative correlation, suggesting that increased precursor loading has a minor effect on the bandgap reduction.
3.6. Analysis of Hydrogen Production with Dark-Deposited Catalysts
The synthesized catalysts were applied to the PET photo-reforming system under optimum conditions, as described in
Section 2.3.
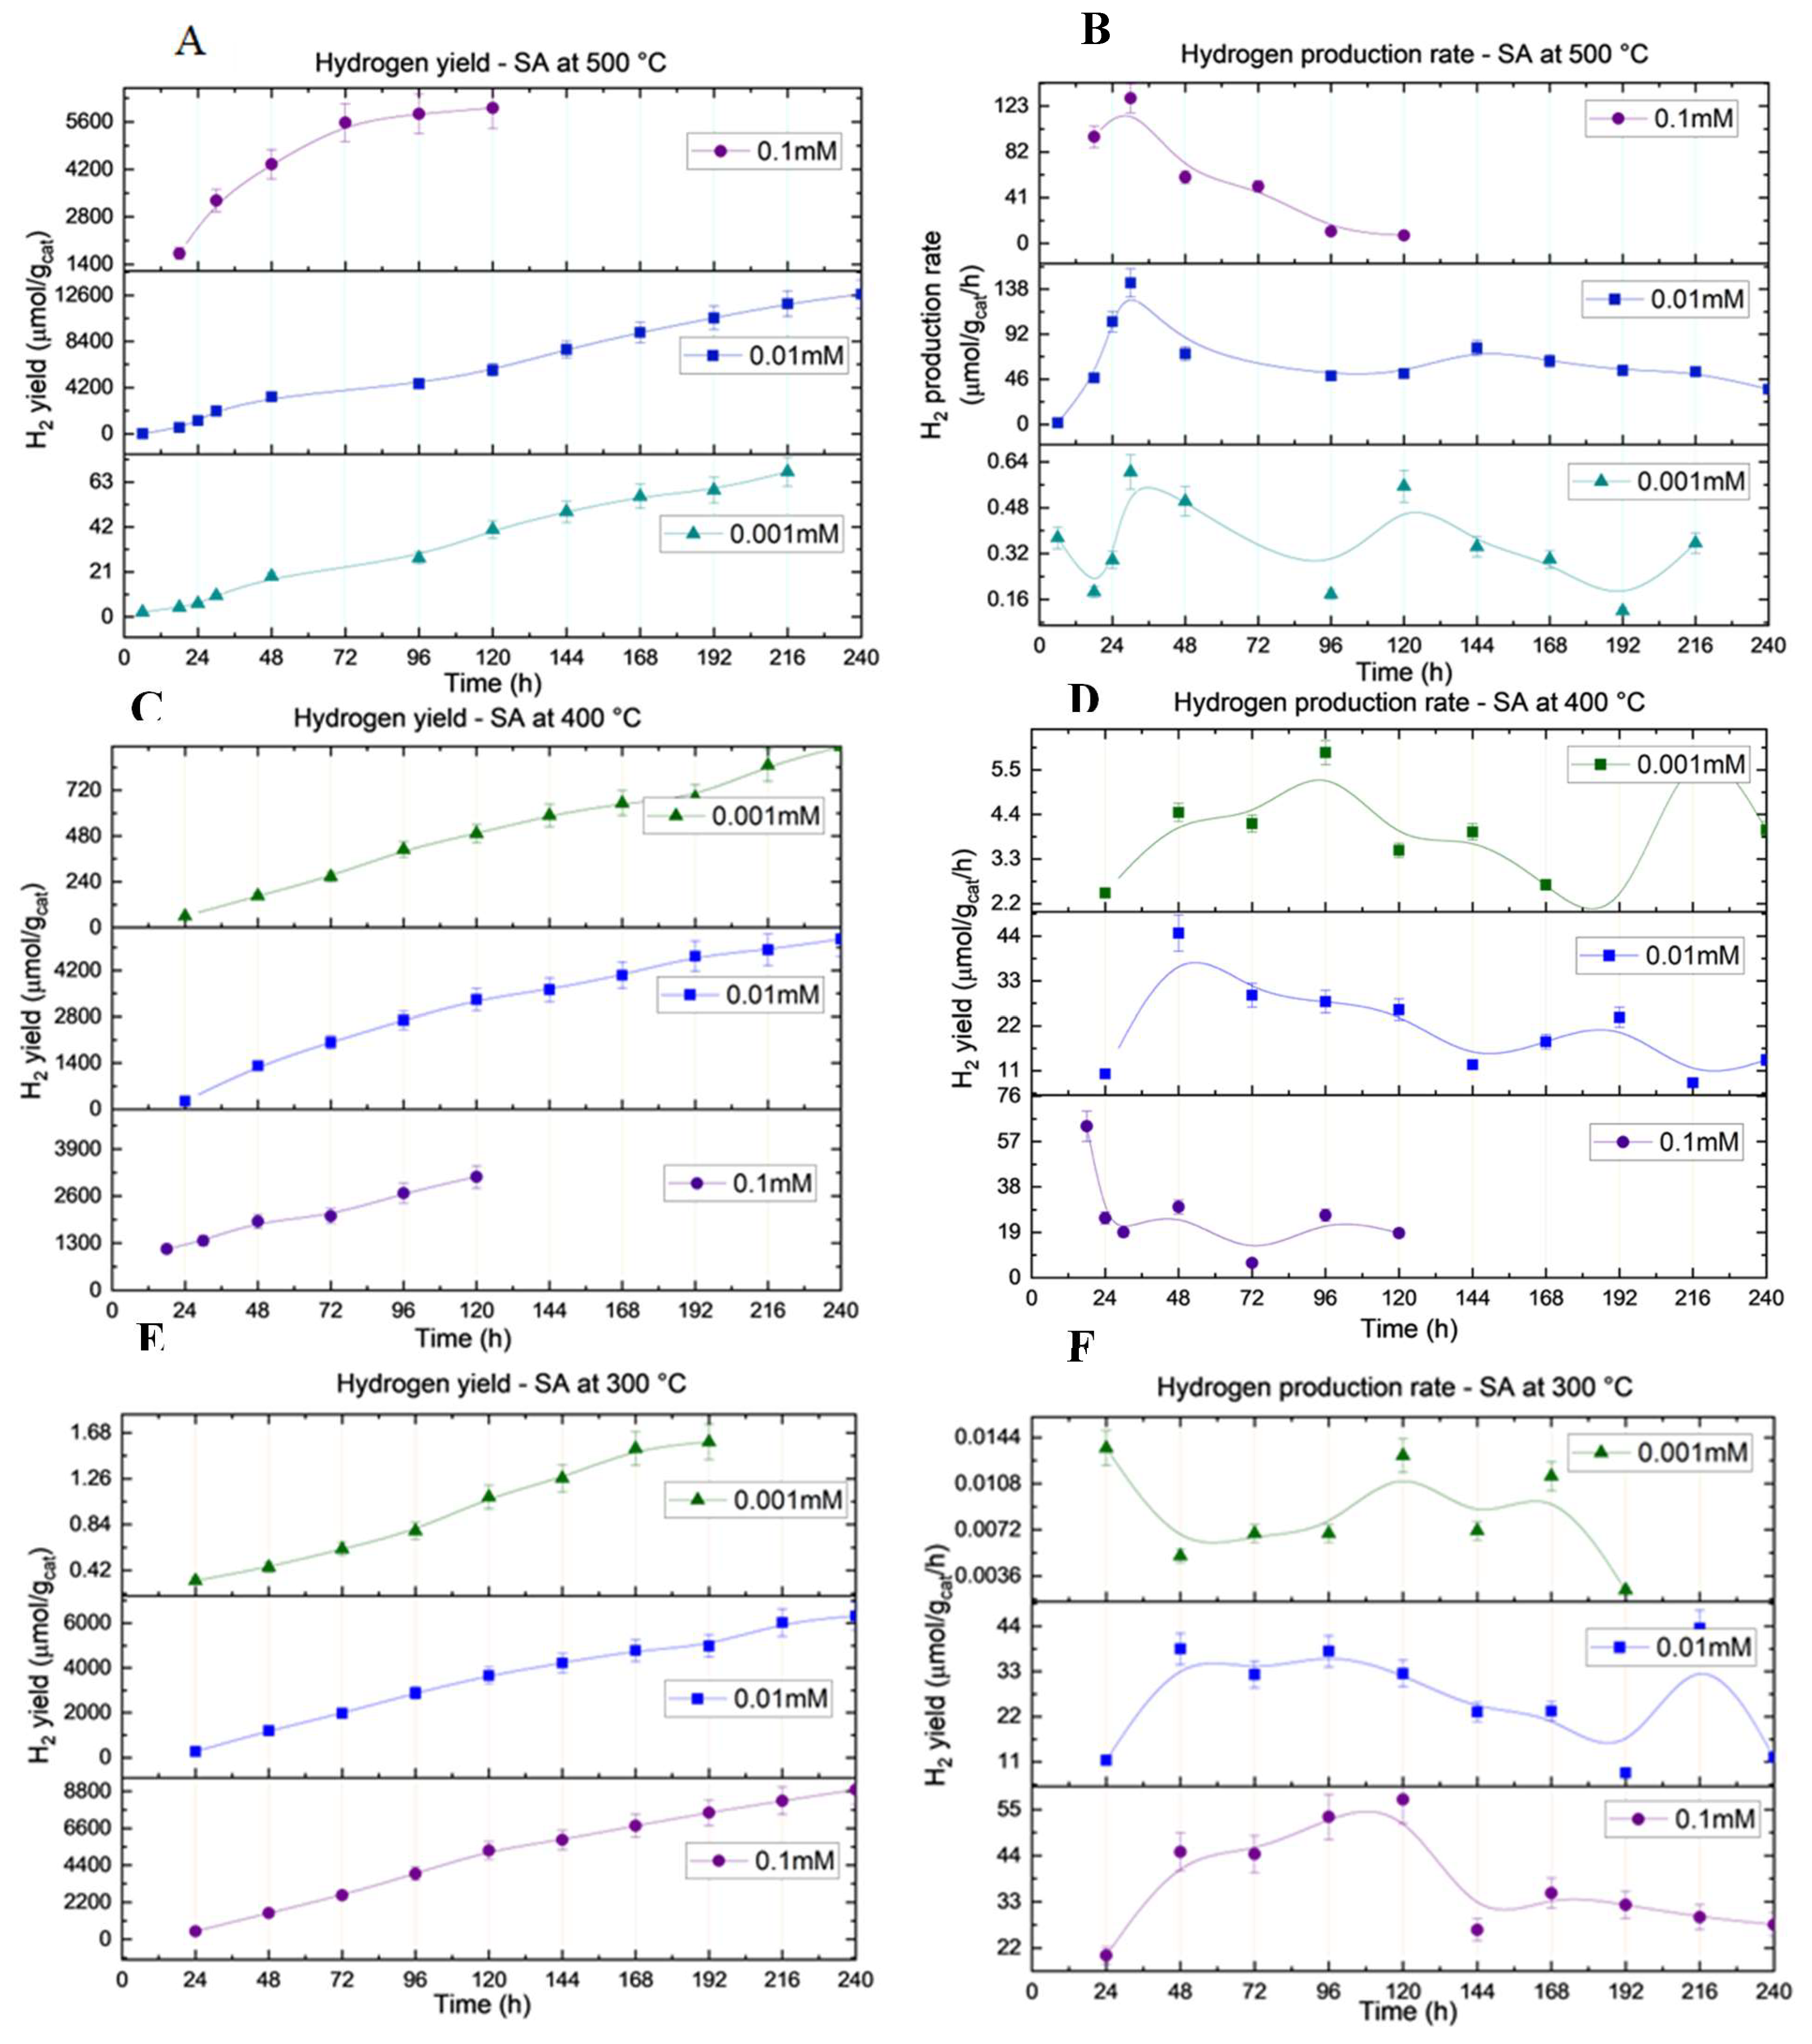
Figure 5 shows the variations in hydrogen yield and hydrogen production rate of the different catalysts. Hydrogen production experiments were conducted for up to 10 d, depending on the hydrogen production rate. maximum hydrogen yield after 10 days was observed in the system photo-reformed with catalysts synthesized with 0.04%(w/w) Pt loading annealed at 500°C. The observed reaction rate after 10 days was 36 μmol/g
cat/h, which was the highest observed rate after 10 days. Other catalysts synthesized with the same precursor concentration varying from annealing temperatures of 300°C to 400°C generated hydrogen at stable rates fluctuating around 12-14 μmol/cat/h. Hence, the catalyst prepared with a 0.01 mM precursor concentration can be identified as the most stable at all considered annealing temperatures. An increase in the precursor concentration positively affected the catalysts annealed at the lowest temperature of 300°C. A decreasing trend in the hydrogen production rate was observed in the systems with 0.1 mM precursor concentration, which were annealed at 400°C and 500°C. However, the lowest hydrogen yield was observed with catalysts prepared with a precursor concentration of 0.001 mM at all annealing temperatures considered. In general, the results suggest that precursor loading has a considerable impact on hydrogen production. Catalysts prepared with moderate precursor concentrations have improved catalytic activity because lower precursor concentrations deplete the active sites, whereas higher precursor dosages increase the charge recombination efficiency.
The differences in hydrogen yield (1100, 3300, and 4400 µmol/g cat) observed for Pt SAs on P25 TiO
2 annealed at 300, 400, and 500°C, despite similar Pt loading values from ICP-OES (0.346-0.380% w/w), can be attributed to a combination of factors beyond just the degree of crystallinity. The annealing temperature affects the crystallinity and phase composition of TiO
2, influencing the charge separation efficiency and electron mobility, which directly affect the photocatalytic performance [
53]. Additionally, the chemical state of Pt, as indicated by the XPS analysis, varies with annealing, with higher temperatures favoring the presence of metallic Pt (Pt
0), which is more catalytically active than the oxidized states (Pt
2+ and Pt
4+) typically observed at lower temperatures. Furthermore, the size and dispersion of the Pt SAs, as determined by TEM analysis, play a crucial role in the catalytic performance, as higher temperatures can lead to particle sintering, reducing the active surface area and consequently affecting hydrogen production [
54]. The interaction between Pt and the TiO
2 support is also influenced by annealing, potentially altering the electronic properties and enhancing the charge-separation efficiency at the interface. Overall, the differences in catalytic activity were driven by a combination of crystallinity, Pt chemical state, and dispersion, necessitating further correlation of the ICP-OES, XPS, and TEM data to establish definitive relationships.
3.7. Comparison of Hydrogen Production with Different Catalysts
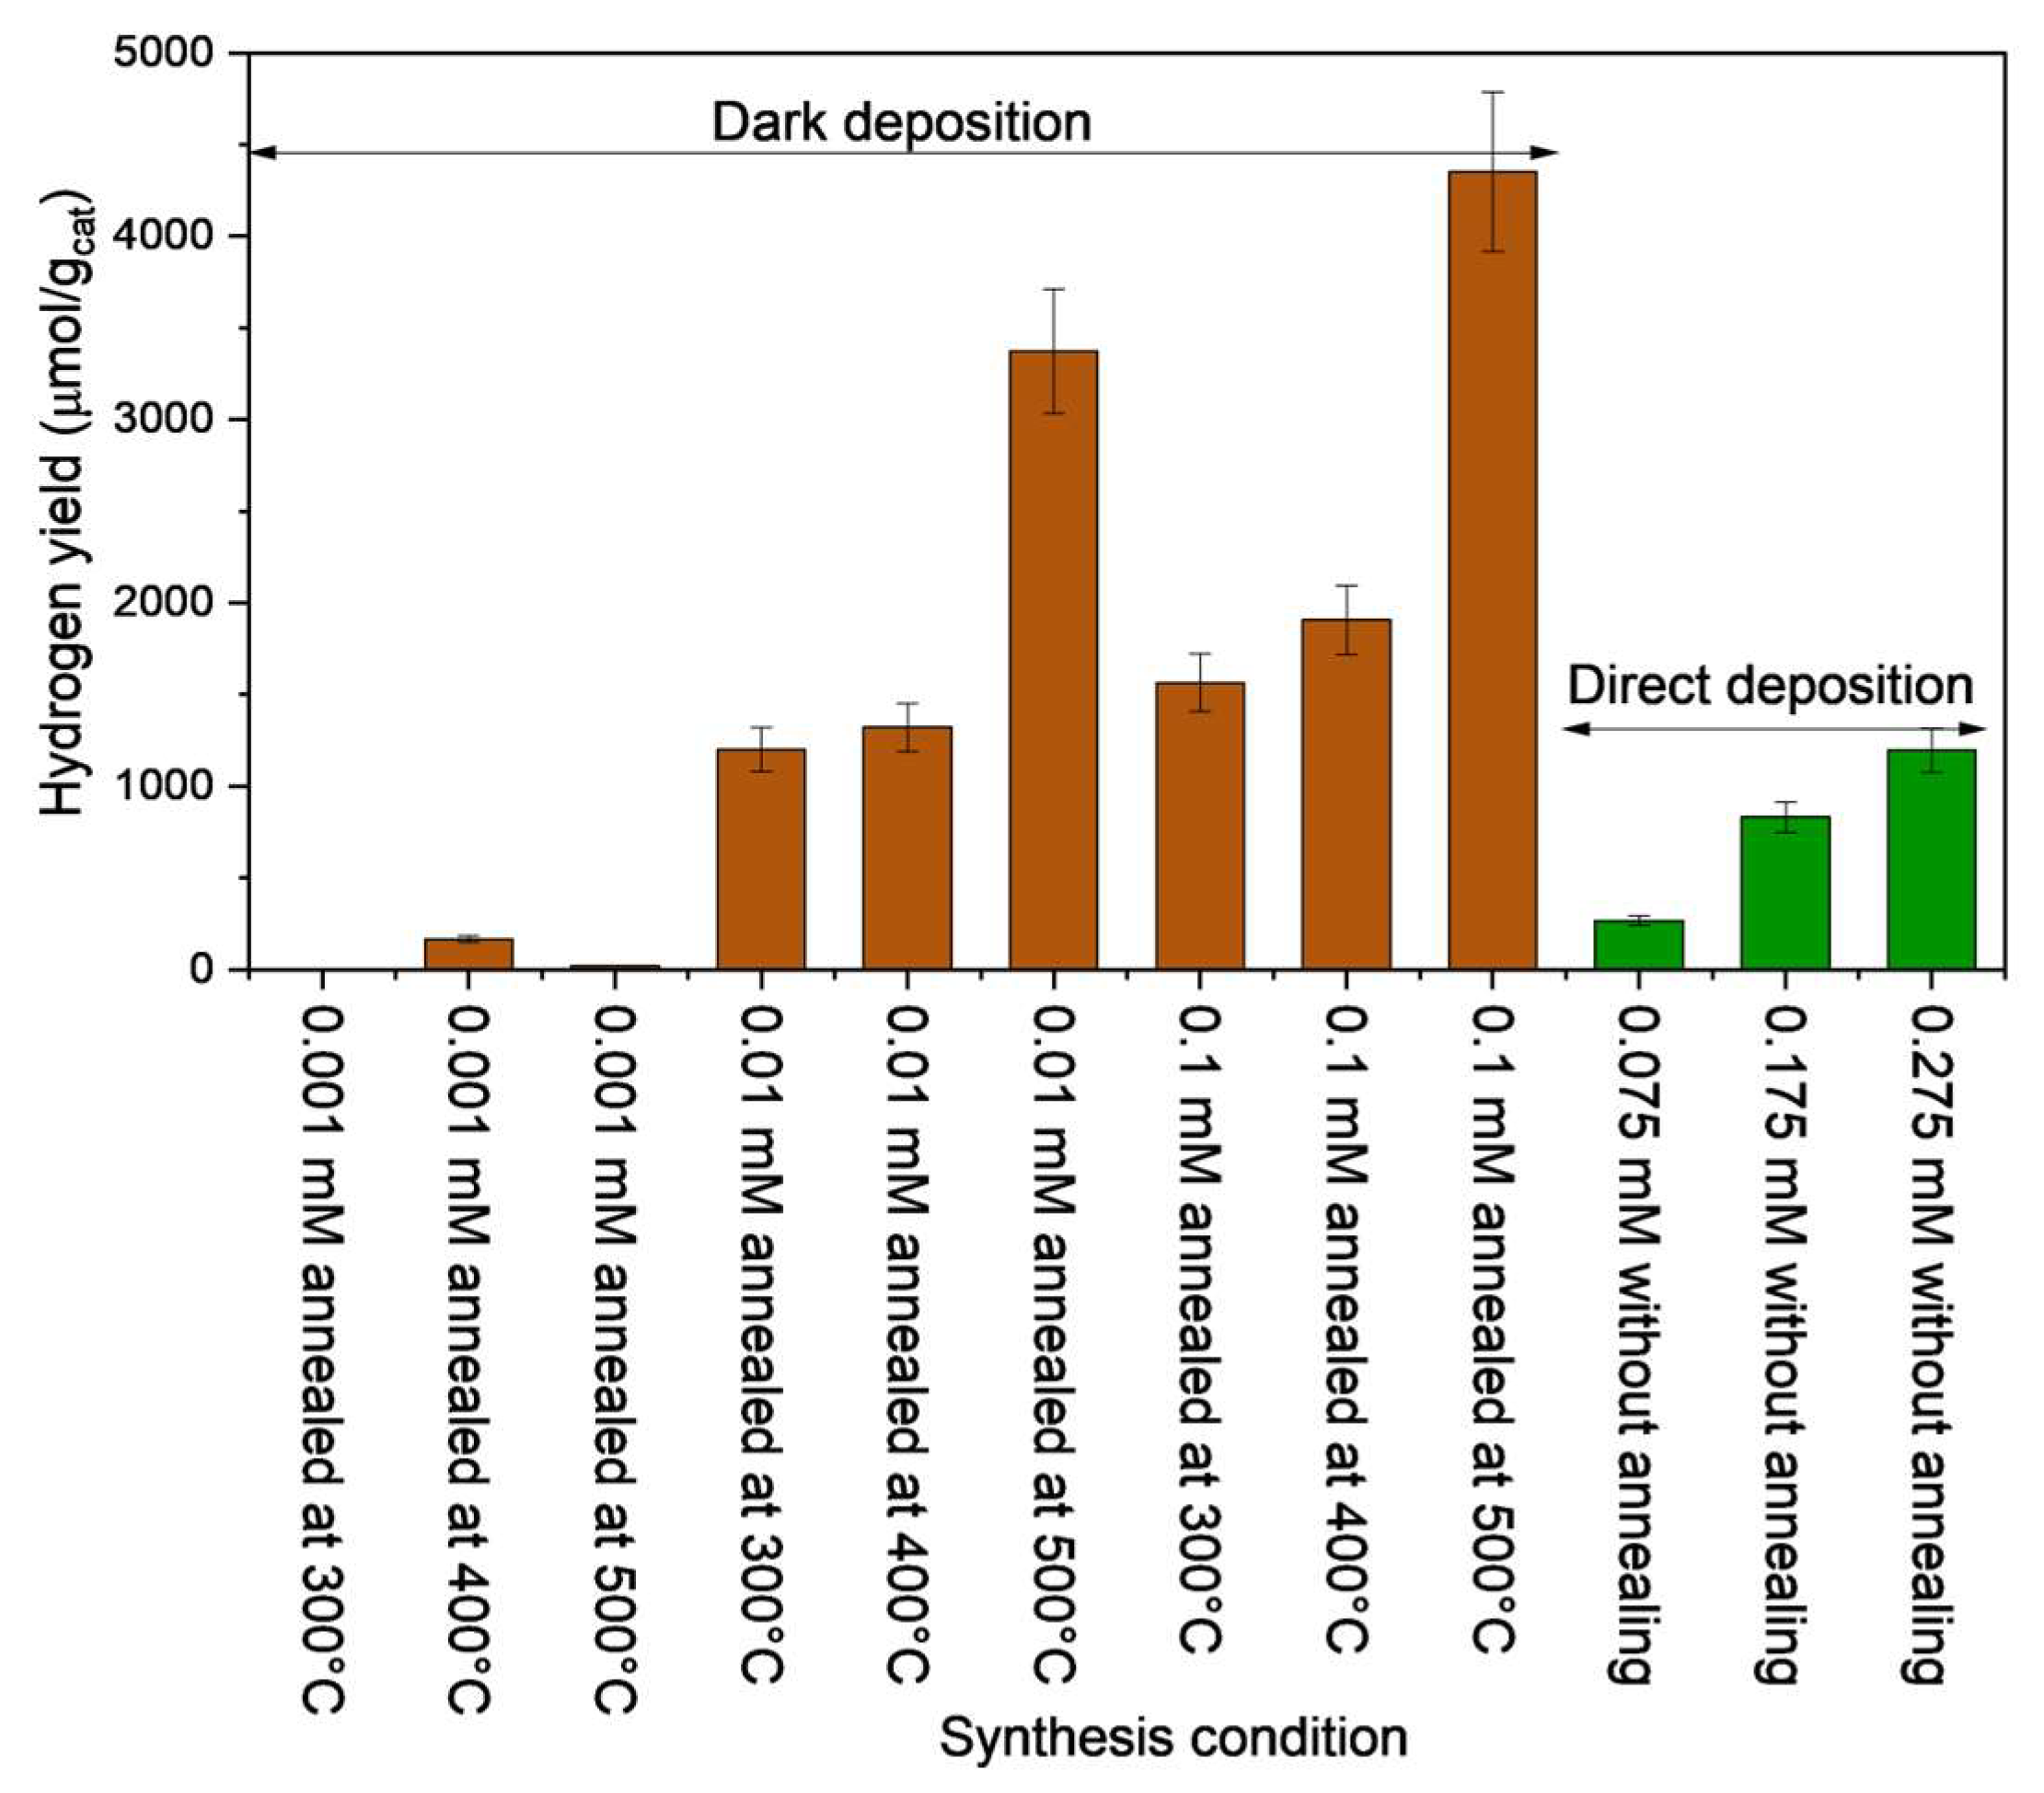
The hydrogen yield after 48 h of photo-reforming PET with catalysts prepared using the dark and direct deposition methods is compared in
Figure 6. The catalysts prepared using the dark deposition method with 0.001 mM precursor loading showed the lowest hydrogen yields, irrespective of the annealing temperature. All the other catalysts prepared under the dark deposition method with precursor concentration more than or equal to 0.01 mM show higher photo-reforming ability with higher hydrogen yield than catalysts prepared under the direct deposition method. An increase in hydrogen yield was observed when the annealing temperature was increased. Baseline tests were conducted using synthesized catalysts with similar Pt precursor concentration and annealed TiO
2 at 500°C using direct and dark deposition methods, as illustrated in
Figure S8. The baseline test results show that the annealing temperature did not enhance the hydrogen production ability of the directly deposited catalysts. In addition, a higher hydrogen yield was observed after 48 h in systems with a higher precursor loading prepared using the dark deposition method. The hydrogen yield with 0.1 mM precursor loading under the direct deposition method with annealed TiO
2 at 500°C was 4.8 μmol/g
cat. In contrast, dark-deposited catalysts (0.1 mM annealed at 500°C) achieved hydrogen yields that were more than 1000 times higher than those of the direct-deposited catalysts. Hence, the Pt loading proportionally increased the hydrogen yield in the direct deposition method, representing a trend similar to that of the dark deposition method. However, the highest hydrogen yield produced after 48 h with the dark-deposited catalysts was four times that observed when the catalyst was prepared using the direct deposition method.
The variations in the hydrogen conversion efficiency and external quantum yield (EQY) under different synthesis conditions using the direct and dark deposition methods are summarized in
Figure S10. Both the hydrogen conversion efficiency and EQY showed similar variations in hydrogen yield. Hydrogen conversion and EQY were higher for the dark-deposited catalysts than for the direct-deposited catalysts. The lowest H
2 conversion and EQY under the dark-deposited catalysts were observed for the catalysts synthesized with a precursor concentration of 0.001 mM, irrespective of the annealing temperature. The maximum hydrogen conversion was observed in the system with catalysts synthesized with a 0.1 mM precursor concentration annealed at 500°C. Increased precursor loading and annealing temperature have a strong positive influence on the hydrogen conversion efficiency. When precursor loading increased 10 times, EQY amplified by three times for the catalyst annealed at 500°C; however, increasing the annealing temperature by 25% increased the EQY by ~2.5 times for constant Pt loading. Hence, tuning the supporting TiO
2 structure at different annealing temperatures for constant Pt loading could improve the catalysts for excellent hydrogen conversion and higher quantum yield using the dark deposition method.
Table 4 compares the hydrogen conversion and external quantum yield of the photo-reforming process applied in this study with other published studies that used a similar approach. Dark-deposited catalysts exhibit extremely high hydrogen conversion efficiencies compared with those reported in the literature. The hydrogen conversion efficiency of dark the catalyst with 0.4%(w/w) Pt loading was five times higher than the directly deposited catalyst with 0.7%(w/w) Pt loading. Although the reduction in Pt loading subsequently reduced the hydrogen conversion efficiency, it was four times higher than that of the direct-deposited catalyst. Additionally, the reported studies with CdS/CdO
x Quantum dots and
NCNCN
x|Ni
2P showed 50% lower hydrogen conversion efficiencies than the applied novel dark deposited catalysts. Furthermore, the EQY of the catalyst synthesized using the dark deposition method was 7% higher than its counterpart, leading to 75% better catalytic performance than CdS/CdO
x Quantum dots. Key factors influencing the differences in EQY include material properties, such as bandgap, defect density, and carrier mobility, as well as charge carrier dynamics and variations in the synthesis processes.
3.8. Principal Component Analysis (PCA)
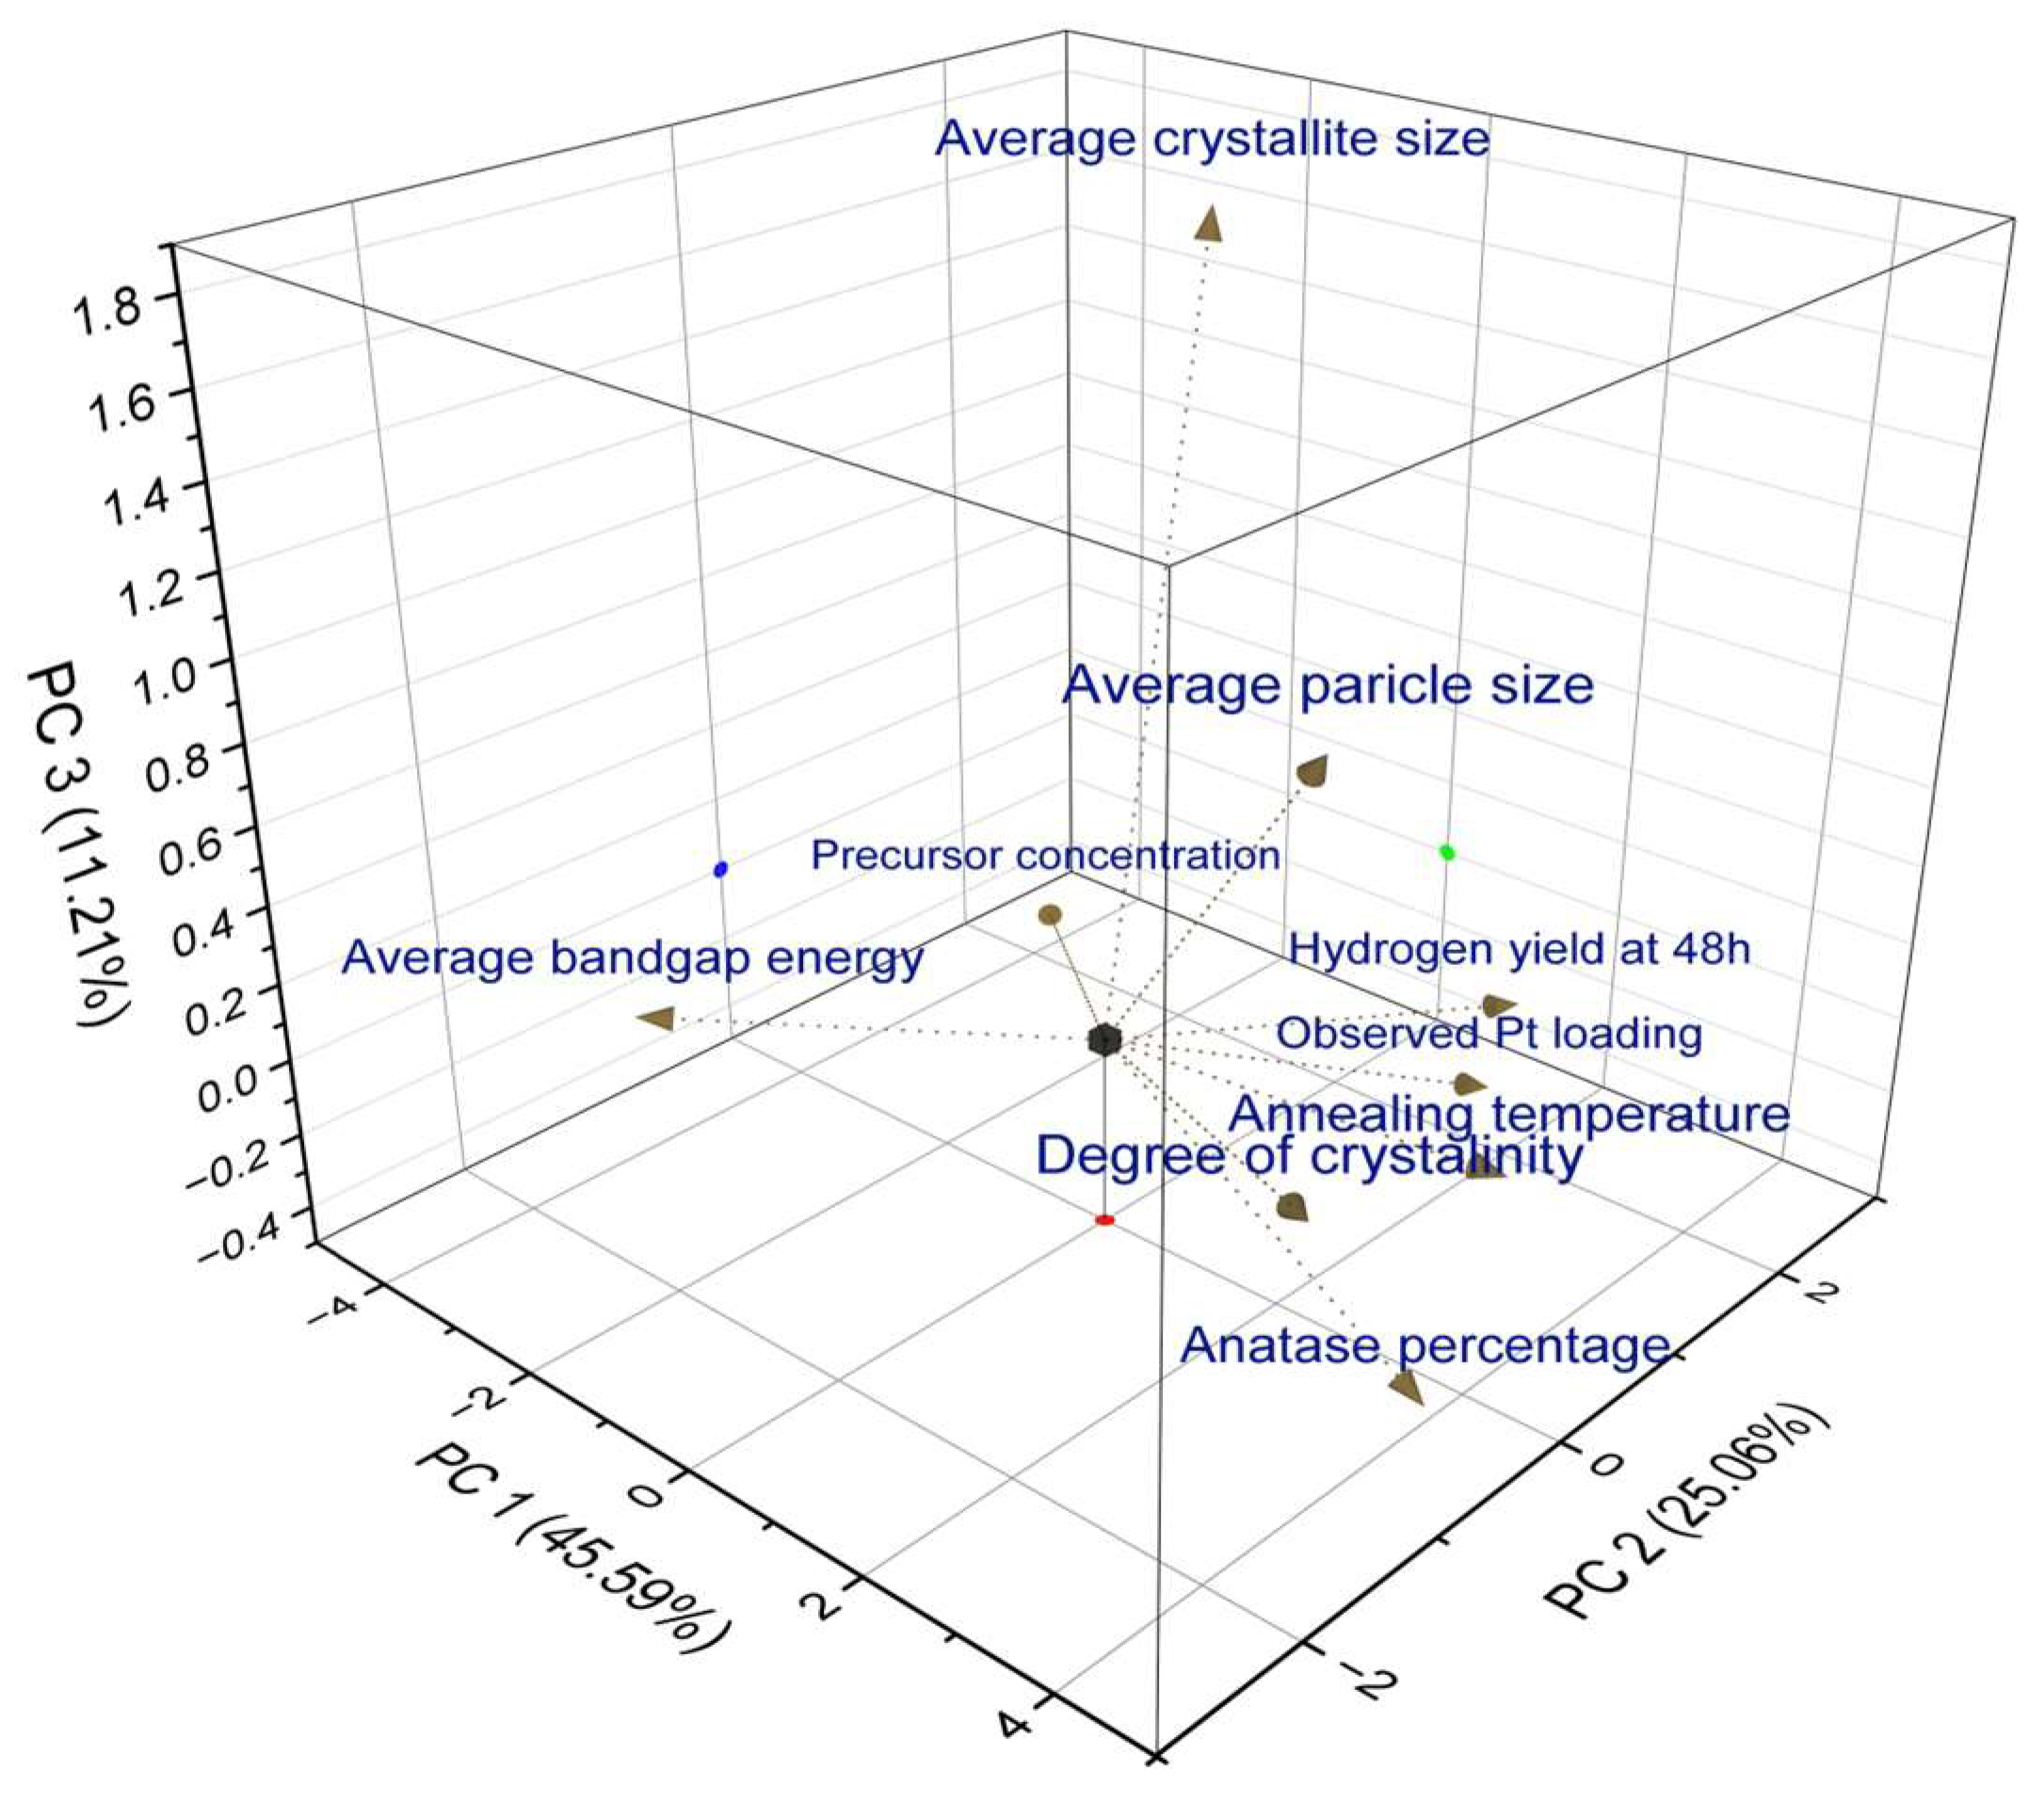
The hydrogen production of different catalysts prepared under different conditions was analyzed in this study by considering the varying characteristics of the catalysts. The correlation between the different catalyst characteristics and hydrogen evolution ability was statistically analyzed using PCA. Nine different parameters were considered during the analysis of hydrogen production at 48 h: average particle size, average bandgap energy, precursor concentration, annealing temperature, degree of crystallinity, average crystallite size, anatase percentage, and measured Pt loading. A scree plot representing the variation in the data-capturing ability of each principal component is shown in
Figure S10. The scree plot suggests that the three principal components adequately describe the data while increasing the eigenvalues to the 4th principal component (PC) and above, resulting in eigenvalues close to zero.
Figure 7 shows the loading plot created by PCA considering the three PCs according to the scree plot. The loading plot illustrates the influence of each characteristic on PC. The lengths and angles of the vectors represent correlations between the considered variables. The cluster of vectors formed by parameters such as hydrogen yield, measured Pt loading, annealing temperature, and degree of crystallinity showed that they were positively correlated. The two vectors forming a 90° angle represent the non-correlated parameters. Therefore, the average crystallite size, precursor concentration, and average bandgap were not correlated. The average bandgap exhibited a strong negative correlation with hydrogen production. Therefore, an increased bandgap reduces hydrogen production, as discussed in
Section 3.5. Furthermore, there is a strong correlation between the measured Pt loading and hydrogen production, whereas the precursor concentration is weakly correlated. Therefore, improving the synthesis process by optimizing parameters such as the measured Pt loading, annealing temperature of TiO
2, degree of crystallinity, and average bandgap is crucial for increasing the hydrogen yield via the photo-reforming process. The results of the statistical analysis further support the experimental analyses of the catalyst characteristics and hydrogen yield.
Table S2 lists the calculated correlation coefficients representing the quantitative correlation between each parameter.
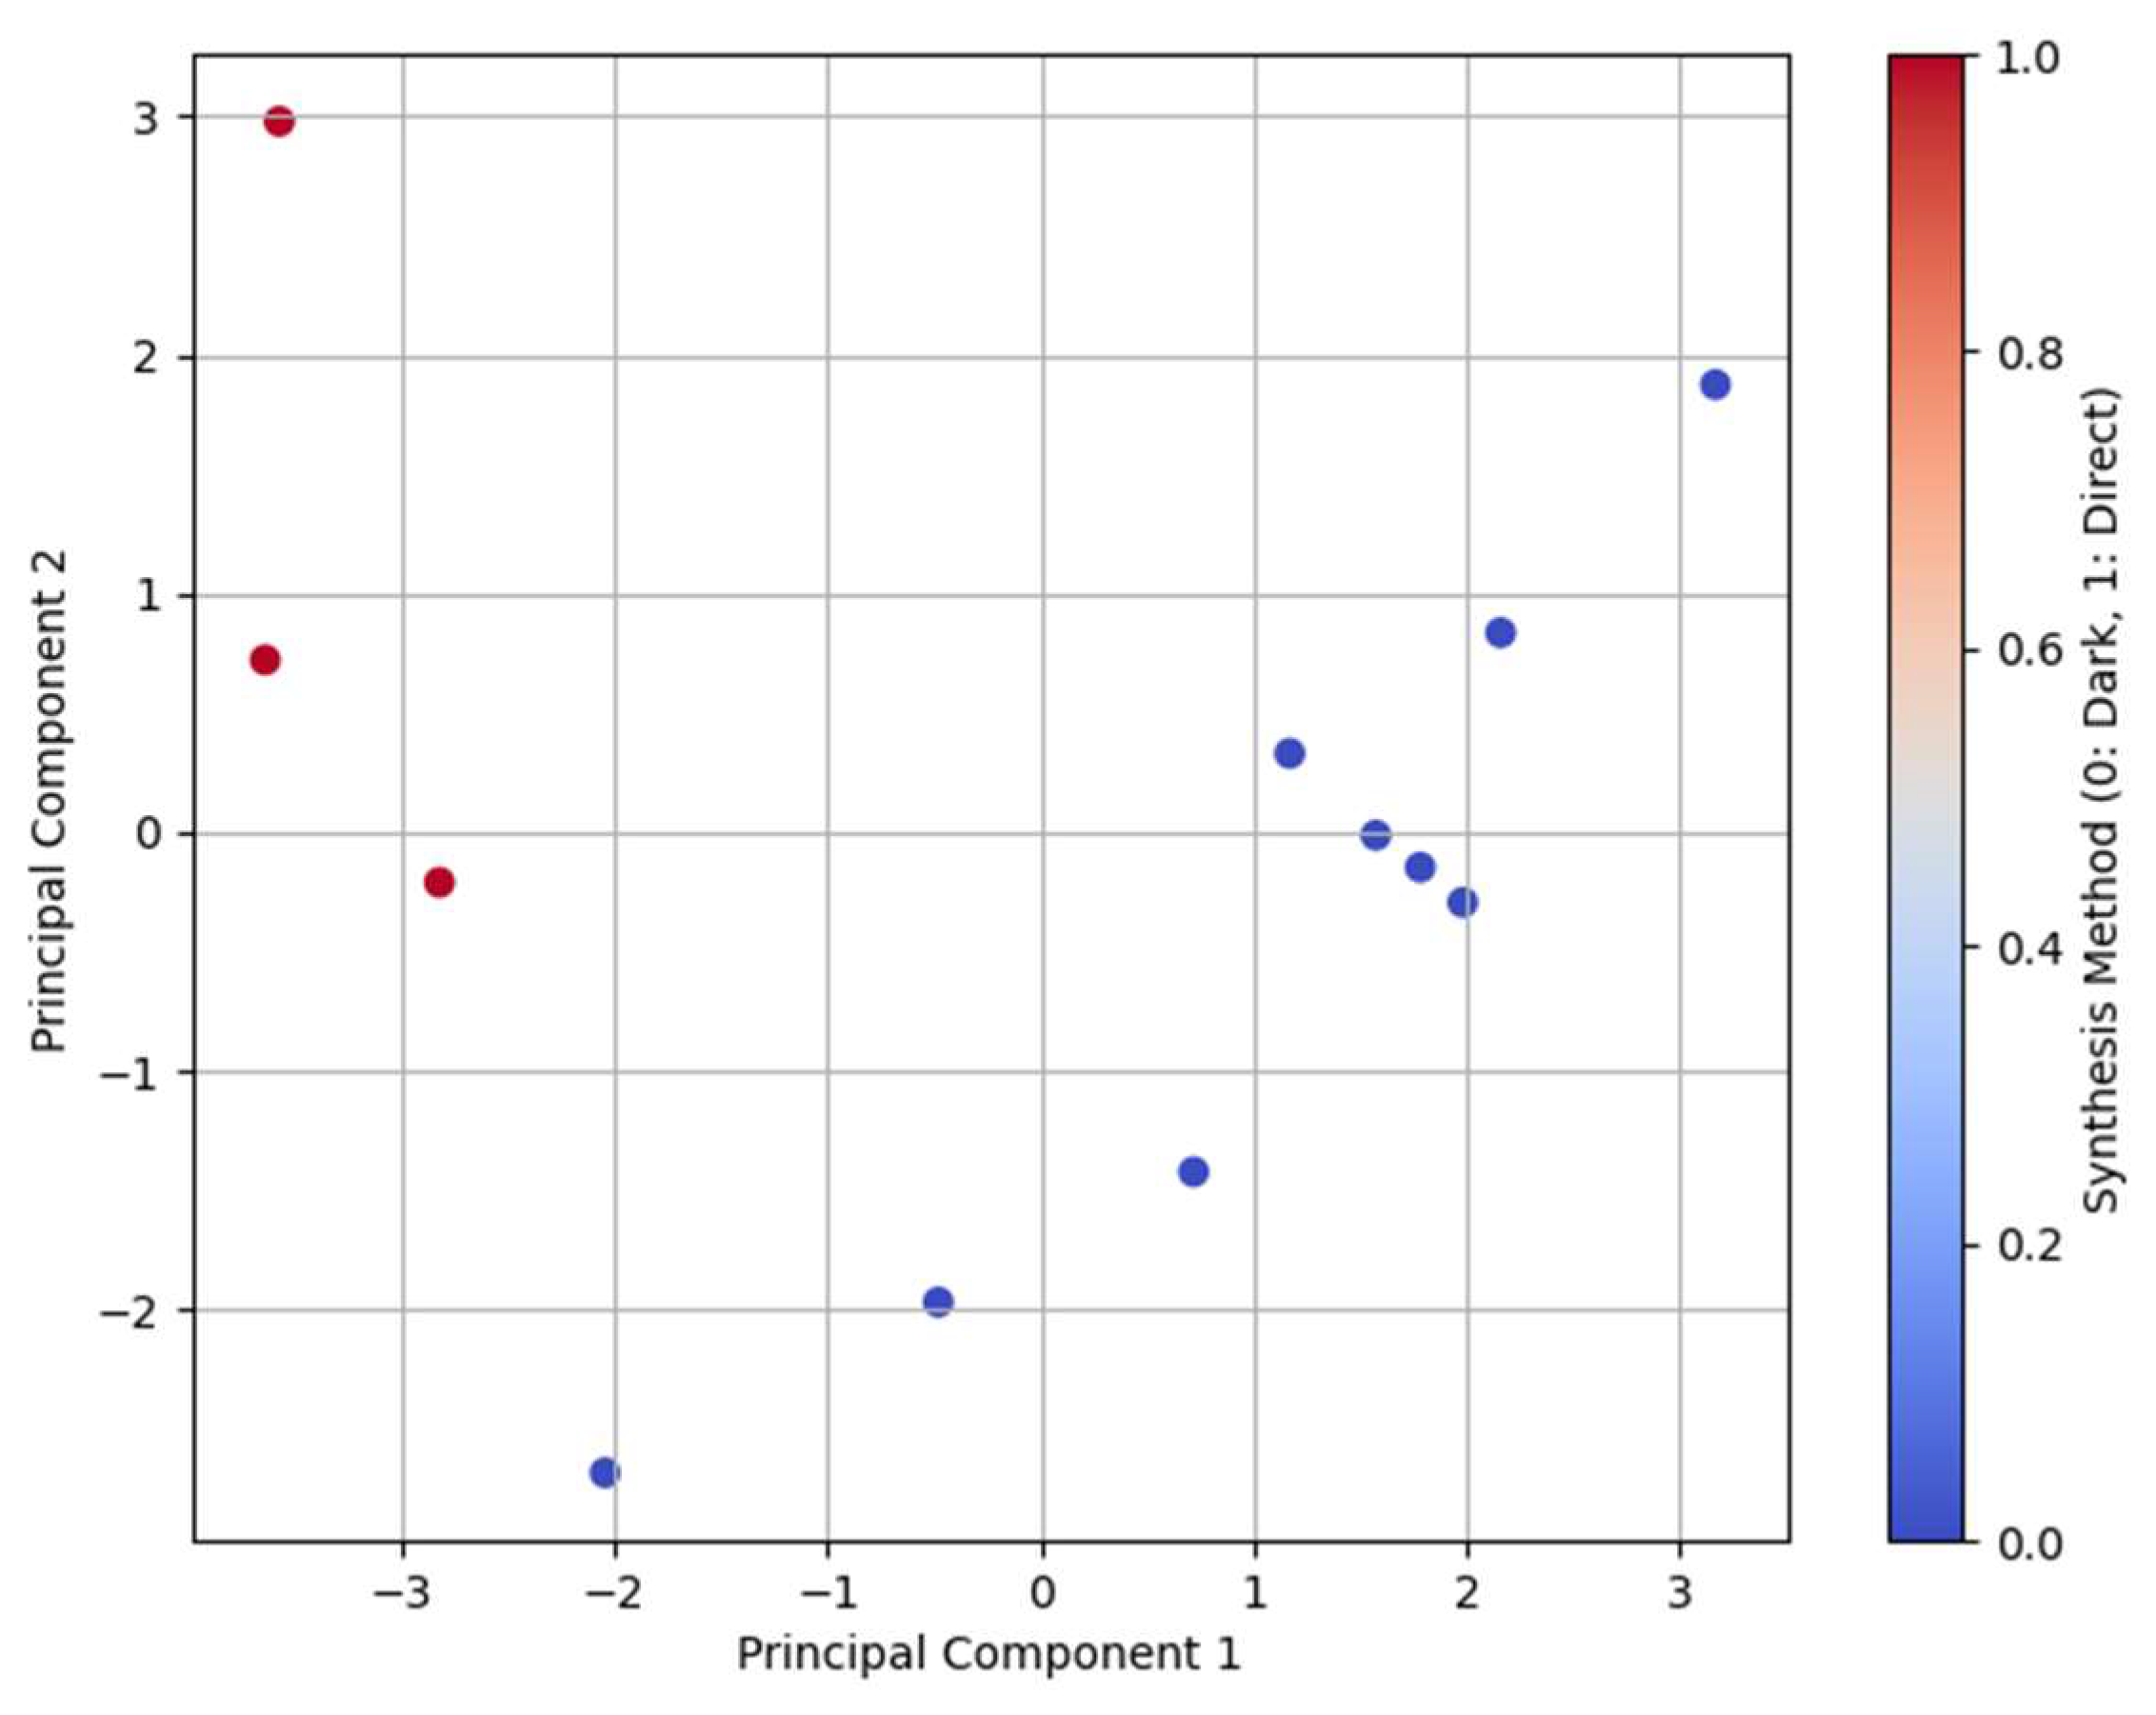
PCA of the Pt loading, XPS, and UV-Vis findings extracted (
Table 2 and
Table 3) illustrate that the first two principal components (PC1 and PC2) in
Figure 8 account for ~59.74% and 24.96% of the total variance, respectively. The expected and measured Pt loading values under different synthesis conditions, bandgap energies, and maximum absorption wavelengths of the catalysts were analyzed to identify their respective trends and correlations. PCA (
Figure 8) shows distinct clustering patterns corresponding to the synthesis methods, with dark deposition (coded as 0) and direct deposition (coded as 1) forming separate groups. The primary contributor to PC1 appears to be the synthesis method and precursor concentration, whereas PC2 represents the variations in the bandgap energies and maximum absorption wavelengths.
A clear separation was observed between the dark deposition and direct deposition methods (
Figure 8), with dark deposition samples clustering closely together, indicating more consistent properties, whereas the direct deposition samples showed greater variability. The precursor concentration also influences clustering, where lower concentrations cluster tightly, whereas higher concentrations exhibit greater dispersion, reflecting variations in the Pt loading efficiency. The annealing temperature plays a significant role, with samples treated at higher temperatures (500°C) forming separate clusters from those annealed at lower temperatures (300°C and 400°C), highlighting its impact on the crystallinity and optical properties. Furthermore, samples with similar bandgap values tend to form distinct clusters, suggesting a strong correlation between the synthesis conditions and material properties. These findings indicate that the synthesis conditions significantly impact the Pt loading and optical behavior, with dark deposition resulting in more stable material properties than direct deposition.
4. Conclusions and Future Perspectives
Pt deposition on TiO2 has been extensively studied to achieve optimum hydrogen conversion in photo-reforming waste PET. The dark deposition method was introduced in this study using the capacitive nature of Pt and applying the memory catalyst concept. The concentration of the Pt precursor was identified as a significant parameter that controlled the size of the deposited Pt particles. Therefore, the Pt precursor concentration was reduced 10 and 100 times while depositing single atoms on the TiO2 surface. Additionally, the surface defects of TiO2 play a significant role in creating strong metal–support interactions, establishing better support for the deposited Pt particles by optimizing the electronic properties of the catalytic system. The surface defects were optimized by annealing the TiO2 at three different temperatures. Increasing annealing temperature to 500°C improved the supported Pt deposition because the 33 % higher hydrogen conversion was observed with the catalysts annealed at 500°C with 0.1 mM precursor concentration. The novel catalysts prepared using the dark deposition method proved to be twice as efficient as other reported conversion efficiencies with CdS/CdOx Quantum dots and NCNCNx|Ni2P. Also, the highest EQY of 7% was observed when dark-deposited catalysts were used in the photo-reforming system. The Single atoms, dimers, and trimers were observed when the precursor concentration was reduced by 10 times, providing a more stable hydrogen yield for 10 days with a hydrogen conversion efficiency of 26%.
The characteristics of the catalysts and the hydrogen yield were compared with those of traditional direct-deposited catalysts. Owing to their different catalytic activities, significant differences in bandgap energy, particle size, crystallite size, and degree of crystallinity were identified between the direct and dark-deposited catalysts. Catalysts prepared by the dark deposition method achieved higher hydrogen yields, hydrogen conversions, and external quantum yields. It can be concluded that the catalysts prepared by the dark deposition method are novel, low-cost, and highly efficient for the photodegradation of waste PET with minimum precursor loading. Single-atom catalysts can be fine-tuned by further increasing their annealing temperature. The effect of calcination on the synthesized catalysts should be studied to improve their stability. The recyclability of the catalysts and the stability of novel catalysts synthesized via dark deposition should be studied. This is important in large-scale economic and environmental applications. The performance of the catalysts under natural light should be studied, and the quantum yield should be calculated before the catalyst is industrialized.
5. Patents
Wang, H.; Edirisooriya E.M.N.T; Xu, P. Method of Hydrogen Manufacture. U.S. Patent Application 18/378586, 2025.
Supplementary Materials
The following supporting information can be downloaded at: Preprints.org, Figure S1: (A) TEM image and (B) surface profile plot of 0.04% Pt/TiO2 annealed at 300°C.; Figure S2: (A) TEM image and (B) surface profile plot of 0.04% Pt/TiO2 annealed at 400°C.; Figure S3: (A) TEM image and (B) surface profile plot of 0.04% Pt/TiO2 annealed at 500°C.; Figure S4: X-ray diffraction patterns of Pt/TiO2 synthesized under different conditions; Figure S5: Variation of (A) degree of crystallinity and (B) average crystallite size of catalysts synthesized under different conditions; Figure S6: Pt 4f fit of Pt/TiO2 nanopowder by X-ray photoelectron spectroscopy.; Figure S7: Absorbance spectra of catalysts prepared under dark deposition method with (A) 0.1 mM, (B) 0.01 mM, and (C) 0.001 mM precursor concentrations and (D) correlation of different parameters on H2 production.; Figure S8: Comparison of hydrogen yield with direct and dark deposited catalysts synthesized with annealed TiO2 at 500°C; Figure S9: Scree plot of the principal component analysis.; Figure S10: Variation of hydrogen conversion efficiency and eternal quantum yield (EQY) for different synthesis conditions.; Table S1: Summary of d-spacing for different lattice phases; Table S2: Correlation matrix after the principal component analysis.
Author Contributions
Conceptualization, T.E., P.S., P.X., and H.W.; methodology, T.E., Z.S., P.S., P.X., and H.W.; software, T.E., P.S.; validation, T.E., P.S., P.X., and H.W.; formal analysis, T.E., P.S.; investigation, T.E., P.S., P.X., and H.W.; resources, T.E., P.S., P.X., and H.W.; data curation, T.E., P.S.; writing—original draft preparation, T.E., P.S., P.X., and H.W.; writing—review and editing, T.E., P.S., P.X., and H.W.; visualization, T.E., P.S.; supervision, P.X., and H.W.; project administration, P.X. and H.W. All authors have read and agreed to the published version of the manuscript.
Data Availability Statement
The authors confirm that data supporting the findings of this study are available within the article and its
supplementary materials.
Conflicts of Interest
The authors declare that they have no affiliations with or involvement in any organization or entity with any financial interest in the subject matter or materials discussed in this manuscript.
References
- Eidsvåg, H.; Bentouba, S.; Vajeeston, P.; Yohi, S.; Velauthapillai, D. TiO2 as a Photocatalyst for Water Splitting—An Experimental and Theoretical Review. Molecules 2021, 26, 1687. [Google Scholar] [CrossRef]
- Wang, S.; Lin, S.; Zhang, D.; Li, G.; Leung, M.K. Controlling charge transfer in quantum-size titania for photocatalytic applications. Appl. Catal. B: Environ. 2017, 215, 85–92. [Google Scholar] [CrossRef]
- Lian, Z.; Wang, W.; Li, G.; Tian, F.; Schanze, K.S.; Li, H. Pt-Enhanced Mesoporous Ti3+/TiO2 with Rapid Bulk to Surface Electron Transfer for Photocatalytic Hydrogen Evolution. ACS Appl. Mater. Interfaces 2017, 9, 16959–16966. [Google Scholar] [CrossRef]
- Wei, T.; Zhu, Y.-N.; Wu, Y.; An, X.; Liu, L.-M. Effect of Single-Atom Cocatalysts on the Activity of Faceted TiO2 Photocatalysts. Langmuir 2018, 35, 391–397. [Google Scholar] [CrossRef] [PubMed]
- Yang, X.-F.; Wang, A.; Qiao, B.; Li, J.; Liu, J.; Zhang, T. Single-Atom Catalysts: A New Frontier in Heterogeneous Catalysis. Accounts Chem. Res. 2013, 46, 1740–1748. [Google Scholar] [CrossRef]
- Cha, G.; Mazare, A.; Hwang, I.; Denisov, N.; Will, J.; Yokosawa, T.; Badura, Z.; Zoppellaro, G.; Tesler, A.B.; Spiecker, E.; et al. A facile “dark”-deposition approach for Pt single-atom trapping on facetted anatase TiO2 nanoflakes and use in photocatalytic H2 generation. Electrochimica Acta 2022, 412. [Google Scholar] [CrossRef]
- Yu, X.; Deng, J.; Liu, Y.; Jing, L.; Hou, Z.; Pei, W.; Dai, H. Single-Atom Catalysts: Preparation and Applications in Environmental Catalysis. Catalysts 2022, 12, 1239. [Google Scholar] [CrossRef]
- Li, C.; Pan, W.; Zhang, Z.; Wu, T.; Guo, R. Recent Progress of Single-Atom Photocatalysts Applied in Energy Conversion and Environmental Protection. Small 2023, 19, e2300460. [Google Scholar] [CrossRef] [PubMed]
- Wang, L.; Huang, L.; Liang, F.; Liu, S.; Wang, Y.; Zhang, H. Preparation, characterization and catalytic performance of single-atom catalysts. Chin. J. Catal. 2017, 38, 1528–1539. [Google Scholar] [CrossRef]
- Wang, L.; Huang, L.; Liang, F.; Liu, S.; Wang, Y.; Zhang, H. Preparation, characterization and catalytic performance of single-atom catalysts. Chin. J. Catal. 2017, 38, 1528–1539. [Google Scholar] [CrossRef]
- Hiragond, C.B.; Powar, N.S.; Lee, J.; In, S. Single-Atom Catalysts (SACs) for Photocatalytic CO2 Reduction with H2O: Activity, Product Selectivity, Stability, and Surface Chemistry. Small 2022, 18, e2201428. [Google Scholar] [CrossRef] [PubMed]
- Li, Z.; Wang, D.; Wu, Y.; Li, Y. Recent advances in the precise control of isolated single-site catalysts by chemical methods. Natl. Sci. Rev. 2018, 5, 673–689. [Google Scholar] [CrossRef]
- Saptal, V.B.; Ruta, V.; Bajada, M.A.; Vilé, G. Single-Atom Catalysis in Organic Synthesis. Angew. Chem. Int. Ed. Engl. 2023, 62, e202219306. [Google Scholar] [CrossRef] [PubMed]
- Majeed, I.; Ali, H.; Idrees, A.; Arif, A.; Ashraf, W.; Rasul, S.; Khan, M.A.; Nadeem, M.A. Understanding the role of metal supported on TiO2 in photoreforming of oxygenates. Energy Adv. 2022, 1, 842–867. [Google Scholar] [CrossRef]
- Choi, Y.; Koo, M.S.; Bokare, A.D.; Kim, D.-H.; Bahnemann, D.W.; Choi, W. Sequential Process Combination of Photocatalytic Oxidation and Dark Reduction for the Removal of Organic Pollutants and Cr(VI) using Ag/TiO2. Environ. Sci. Technol. 2017, 51, 3973–3981. [Google Scholar] [CrossRef] [PubMed]
- Li, Q.; Li, Y.W.; Wu, P.; Xie, R.; Shang, J.K. Palladium Oxide Nanoparticles on Nitrogen-Doped Titanium Oxide: Accelerated Photocatalytic Disinfection and Post-Illumination Catalytic “Memory”. Adv. Mater. 2008, 20, 3717–3723. [Google Scholar] [CrossRef]
- Takai, A.; Kamat, P.V. Capture, Store, and Discharge. Shuttling Photogenerated Electrons across TiO2–Silver Interface. ACS Nano 2011, 5, 7369–7376. [Google Scholar] [CrossRef]
- Cai, T.; Liu, Y.; Wang, L.; Zhang, S.; Ma, J.; Dong, W.; Zeng, Y.; Yuan, J.; Liu, C.; Luo, S. “Dark Deposition” of Ag Nanoparticles on TiO2: Improvement of Electron Storage Capacity To Boost “Memory Catalysis” Activity. ACS Appl. Mater. Interfaces 2018, 10, 25350–25359. [Google Scholar] [CrossRef]
- Herrmann, J.M.; Disdier, J.; Pichat, P. Photoassisted platinum deposition on TiO2 powder using various platinum complexes. J. Phys. Chem. 1986, 90, 6028–6034. [Google Scholar] [CrossRef]
- Lai, W.H.; Miao, Z.; Wang, Y.X.; Wang, J.Z.; Chou, S.L. Atomic-local environments of single-atom catalysts: synthesis, electronic structure, and activity. Advanced Energy Materials 2019, 9, 1900722. [Google Scholar] [CrossRef]
- Porter, J.F.; Li, Y.; Chan, C.K. The effect of calcination on the microstructural characteristics and photoreactivity of Degussa P-25 TiO2. J. Mater. Sci. 1999, 34, 1523–1531. [Google Scholar] [CrossRef]
- He, F.; Ma, F.; Li, J.; Li, T.; Li, G. Effect of calcination temperature on the structural properties and photocatalytic activities of solvothermal synthesized TiO2 hollow nanoparticles. Ceram. Int. 2014, 40, 6441–6446. [Google Scholar] [CrossRef]
- Yu, J.-G.; Yu, H.-G.; Cheng, B.; Zhao, X.-J.; Yu, J.C.; Ho, W.-K. The Effect of Calcination Temperature on the Surface Microstructure and Photocatalytic Activity of TiO2 Thin Films Prepared by Liquid Phase Deposition. J. Phys. Chem. B 2003, 107, 13871–13879. [Google Scholar] [CrossRef]
- Wu, N.-L.; Lee, M.-S.; Pon, Z.-J.; Hsu, J.-Z. Effect of calcination atmosphere on TiO2 photocatalysis in hydrogen production from methanol/water solution. J. Photochem. Photobiol. A: Chem. 2004, 163, 277–280. [Google Scholar] [CrossRef]
- Lu, G.; Linsebigler, A.; Yates, J.T. Ti3+ Defect Sites on TiO2(110): Production and Chemical Detection of Active Sites. J. Phys. Chem. 1994, 98, 11733–11738. [Google Scholar] [CrossRef]
- Savva, A.I.; Smith, K.A.; Lawson, M.; Croft, S.R.; Weltner, A.E.; Jones, C.D.; Bull, H.; Simmonds, P.J.; Li, L.; Xiong, H. Defect generation in TiO2 nanotube anodes via heat treatment in various atmospheres for lithium-ion batteries. Phys. Chem. Chem. Phys. 2018, 20, 22537–22546. [Google Scholar] [CrossRef]
- Goodman, D.W. ?Catalytically active Au on Titania:? yet another example of a strong metal support interaction (SMSI)? Catal. Lett. 2005, 99, 1–4. [Google Scholar] [CrossRef]
- Dulub, W.H.; Diebold, U. Hebenstreit, and U. Diebold, “Imaging cluster surfaces with atomic resolution: the strong metal-support interaction state of Pt supported on TiO 2 (110),” Physical Review Letters, vol. 84, no. 16, p. 3646, 2000. Physical Review Letters 2000, 84, 3646. [Google Scholar] [CrossRef]
- Edirisooriya, E.M.N.T.; Senanayake, P.S.; Xu, P.; Talipov, M.R.; Wang, H. Optimization of green hydrogen evolution from low-density plastics using TiO2-based nano-photocatalysts with techno-economic and carbon footprint assessment. Nanotechnol. Environ. Eng. 2024, 1–16. [Google Scholar] [CrossRef]
- Schindelin, J.; Arganda-Carreras, I.; Frise, E.; Kaynig, V.; Longair, M.; Pietzsch, T.; Preibisch, S.; Rueden, C.; Saalfeld, S.; Schmid, B.; et al. Fiji: An open-source platform for biological-image analysis. Nat. Methods 2012, 9, 676–682. [Google Scholar] [CrossRef]
- Doumeng, M.; Makhlouf, L.; Berthet, F.; Marsan, O.; Delbé, K.; Denape, J.; Chabert, F. A comparative study of the crystallinity of polyetheretherketone by using density, DSC, XRD, and Raman spectroscopy techniques. Polym. Test. 2021, 93. [Google Scholar] [CrossRef]
- Monshi, A.; Foroughi, M.R.; Monshi, M.R. Modified Scherrer Equation to Estimate More Accurately Nano-Crystallite Size Using XRD. World J. Nano Sci. Eng. 2012, 02, 154–160. [Google Scholar] [CrossRef]
- Edirisooriya, E.T.; Senanayake, P.S.; Wang, H.B.; Talipov, M.R.; Xu, P.; Wang, H. Photo-reforming and degradation of waste plastics under UV and visible light for H2 production using nanocomposite photocatalysts. J. Environ. Chem. Eng. 2023, 11. [Google Scholar] [CrossRef]
- OriginLab Corporation, Northampton, MA, USA.
- Edirisooriya, E.T.; Senanayake, P.S.; Xu, P.; Wang, H. Hydrogen production and value-added chemical recovery from the photo-reforming process using waste plastics. J. Environ. Chem. Eng. 2023, 11. [Google Scholar] [CrossRef]
- T. Uekert, “Plastic and mixed waste as feedstocks for solar-driven H₂ production,” University of Cambridge, 2021.
- Muthee, D.K.; Dejene, B.F. Effect of annealing temperature on structural, optical, and photocatalytic properties of titanium dioxide nanoparticles. Heliyon 2021, 7, e07269. [Google Scholar] [CrossRef]
- Goswami, M.; Adhikary, N.C.; Bhattacharjee, S. Effect of annealing temperatures on the structural and optical properties of zinc oxide nanoparticles prepared by chemical precipitation method. Optik 2018, 158, 1006–1015. [Google Scholar] [CrossRef]
- Zaki, M.Y.; Sava, F.; Simandan, I.D.; Buruiana, A.T.; Mihai, C.; Velea, A.; Galca, A.C. Effect of the stacking order, annealing temperature and atmosphere on crystal phase and optical properties of Cu2SnS3. Sci. Rep. 2022, 12, 1–18. [Google Scholar] [CrossRef] [PubMed]
- Zarattini, M.; Dun, C.; Isherwood, L.H.; Felten, A.; Filippi, J.; Gordon, M.P.; Zhang, L.; Kassem, O.; Song, X.; Zhang, W.; et al. Synthesis of 2D anatase TiO2 with highly reactive facets by fluorine-free topochemical conversion of 1T-TiS2 nanosheets. J. Mater. Chem. A 2022, 10, 13884–13894. [Google Scholar] [CrossRef]
- Bhosale, R.; Hyam, R.; Dhanya, P.; Ogale, S. Chlorate ion mediated rutile to anatase reverse phase transformation in the TiO2 nanosystem. Dalton Trans. 2011, 40, 11374–11377. [Google Scholar] [CrossRef]
- Zielińska-Jurek, A.; Wei, Z.; Janczarek, M.; Wysocka, I.; Kowalska, E. Size-Controlled Synthesis of Pt Particles on TiO2 Surface: Physicochemical Characteristic and Photocatalytic Activity. Catalysts 2019, 9, 940. [Google Scholar] [CrossRef]
- Simonsen, S.B.; Chorkendorff, I.; Dahl, S.; Skoglundh, M.; Sehested, J.; Helveg, S. Ostwald ripening in a Pt/SiO2 model catalyst studied by in situ TEM. J. Catal. 2011, 281, 147–155. [Google Scholar] [CrossRef]
- Chen, W.-T.; Chan, A.; Jovic, V.; Sun-Waterhouse, D.; Murai, K.-I.; Idriss, H.; Waterhouse, G.I.N. Effect of the TiO2 Crystallite Size, TiO2 Polymorph and Test Conditions on the Photo-Oxidation Rate of Aqueous Methylene Blue. Top. Catal. 2014, 58, 85–102. [Google Scholar] [CrossRef]
- Zhou, Y.; Muhich, C.L.; Neltner, B.T.; Weimer, A.W.; Musgrave, C.B. Growth of Pt Particles on the Anatase TiO2(101) Surface. J. Phys. Chem. C 2012, 116, 12114–12123. [Google Scholar] [CrossRef]
- Prucnal, S.; Gago, R.; Calatayud, D.G.; Rebohle, L.; Liedke, M.O.; Butterling, M.; Wagner, A.; Helm, M.; Zhou, S. TiO2 Phase Engineering by Millisecond Range Annealing for Highly Efficient Photocatalysis. J. Phys. Chem. C 2023, 127, 12686–12694. [Google Scholar] [CrossRef]
- Hassanzadeh-Tabrizi, S. Precise calculation of crystallite size of nanomaterials: A review. J. Alloy. Compd. 2023, 968. [Google Scholar] [CrossRef]
- Kim, M.G.; Kang, J.M.; Lee, J.E.; Kim, K.S.; Kim, K.H.; Cho, M.; Lee, S.G. Effects of Calcination Temperature on the Phase Composition, Photocatalytic Degradation, and Virucidal Activities of TiO2 Nanoparticles. ACS Omega 2021, 6, 10668–10678. [Google Scholar] [CrossRef]
- Kandiel, T.A.; Robben, L.; Alkaima, A.; Bahnemann, D. Brookite versus anatase TiO2 photocatalysts: phase transformations and photocatalytic activities. Photochem. Photobiol. Sci. 2012, 12, 602–609. [Google Scholar] [CrossRef] [PubMed]
- Shi, Y.; Ma, Z.-R.; Xiao, Y.-Y.; Yin, Y.-C.; Huang, W.-M.; Huang, Z.-C.; Zheng, Y.-Z.; Mu, F.-Y.; Huang, R.; Shi, G.-Y.; et al. Electronic metal–support interaction modulates single-atom platinum catalysis for hydrogen evolution reaction. Nat. Commun. 2021, 12, 1–11. [Google Scholar] [CrossRef]
- Z. Wu et al., “Optimized Pt single atom harvesting on TiO2 nanotubes—Towards a most efficient photocatalyst,” Small, vol. 18, no. 2, p. 2104892, 2022.
- Muthukrishnan, S.; Vidya, R.; Sjåstad, A.O. Band gap engineering of anatase TiO2 by ambipolar doping: A first principles study. Mater. Chem. Phys. 2023, 299. [Google Scholar] [CrossRef]
- Haq, S.; Rehman, W.; Waseem, M.; Meynen, V.; Awan, S.U.; Khan, A.R.; Hussain, S.; Abdin, Z.U.; Din, S.U.; Hafeez, M.; et al. Effect of Annealing Temperature on Structural Phase Transformations and Band Gap Reduction for Photocatalytic Activity of Mesopores TiO2 Nanocatalysts. J. Inorg. Organomet. Polym. Mater. 2020, 31, 1312–1322. [Google Scholar] [CrossRef]
- Wu, B.; Du, F.; Wang, H.; Wu, C.; Chu, J.; Wang, X.; Xiong, S. Effects of annealing temperature of PtCu/MWCNT catalysts on their electrocatalytic performance of electrooxidation of methanol. Ionics 2021, 28, 369–382. [Google Scholar] [CrossRef]
|
Disclaimer/Publisher’s Note: The statements, opinions and data contained in all publications are solely those of the individual author(s) and contributor(s) and not of MDPI and/or the editor(s). MDPI and/or the editor(s) disclaim responsibility for any injury to people or property resulting from any ideas, methods, instructions or products referred to in the content. |
© 2025 by the authors. Licensee MDPI, Basel, Switzerland. This article is an open access article distributed under the terms and conditions of the Creative Commons Attribution (CC BY) license (http://creativecommons.org/licenses/by/4.0/).