Submitted:
27 February 2025
Posted:
27 February 2025
You are already at the latest version
Abstract
Most existing studies on the filtration characteristics of tailings reservoir filter layers assume that soil particles are spherical, neglecting the impact of particle shape on filtration behavior. This study posits that soil particles in the filter layer are ellipsoidal. The effective pore radius of the filter material is calculated for various particle shape parameters and distributions. The relationship between the porosity of the filter material and the ratio of the long to short axes of ellipsoidal particles in a loose arrangement is also examined. The results indicate that the porosity of the filter material initially decreases and subsequently increases with the ratio of the long to short axes; however, the rate of increase progressively slows. A method for transforming irregularly shaped particles into ellipsoidal forms is proposed. The particle shape parameter S is introduced to characterize the shape of irregular particles. The relationship between particle shape parameters and the ratio of the long to short axes is investigated specifically for ellipsoidal particles. It is found that the particle shape parameters exhibit an approximately linear relationship with the ratio of the long to short axes within a specific range. The discrete element method was employed to investigate the impact of particle shape on the filtration characteristics of the filter layer, complemented by comparative experimental analysis. By analyzing the pore structures of spherical and ellipsoidal particles, this study predicts the relationship between pore structure and particle shape parameters for any irregularly shaped natural particle filter layer.
Keywords:
particle shape
; effective pores
; permeability test
; permeability coefficient
; discrete element
; filter layer
1. Introduction
According to incomplete statistics, there are 12,655 tailings reservoirs in China, including 3,032 disease-prone reservoirs, 1,265 hazardous reservoirs, and 613 critically hazardous reservoirs. The risk associated with tailings pond accidents ranks 18th among 93 types of accident hazards globally, making it a significant hazard that cannot be overlooked.
In tailings accidents, dam failures and tailings leakage account for as much as 96% of incidents. Leakage from dams and drainage facilities are the primary causes of these failures and leakages. Therefore, the study of seepage and stability in tailings reservoirs has always been a critical issue in tailings design and research. The study of seepage in tailings reservoir differs from that in general reservoir dams in two key aspects. First, tailings seepage involves muddy water carrying tailings slurry, rather than clear water. Second, tailings sand is a byproduct of ore processing, which involves separating valuable components from waste. If tailings are discharged with water, it can cause severe pollution. Therefore, tailings seepage management must not only ensure effective drainage but also prevent the discharge of tailings sand with the water. This requires the installation of a filter layer in the drainage facilities to achieve.
In the study of filtration characteristics of filter layers, David C. Mays analyzed the clogging mechanisms of granular filter layers from the perspective of fractal dimensions. Dang et al. addressed muddy water seepage as an issue of unstable seepage through variable infiltration paths and proposed an effective theoretical method for calculating such seepage. Indraratna and Raut examined the interaction between the filter layer and the protected soil within the filtration system and developed a method for evaluating the filter layer’s performance when protected soil infiltrates it. Peter To et al. demonstrated that the erosion resistance of granular filter layers is correlated with their relative density. Delgado-Ramos et al. investigated the mechanisms and principles of internal erosion in filter layers where the protected soil is clay. Srivastava and Babu proposed a novel design method for granular filter layers and assessed their performance using probabilistic analysis. Li et al. identified three modes of clogging through laboratory tests and proposed corresponding determination methods. The principles and guidelines for filter layer design have been discussed by Liu and other researchers [8-10].
The aforementioned literature on tailings filter layers predominantly focuses on the effects of gradation and particle arrangement. In these studies, soil particles are typically assumed to be spherical, without accounting for the impact of particle shape. However, as a granular material, tailings sand features complex and variable particle shapes, which significantly affect the clogging characteristics of the filter layer.
In the study of particle shape, Dong et al. investigated the actual shape and internal porosity of carbonate particles and discussed how particle shape influences the crushing behavior of individual particles. Johanson found that the number of contact points between soil particles significantly affects soil strength, based on studies of particle accumulation with varying shapes. Kock and Huhn’s study shows that particle shape significantly affects friction strength, shear band direction, and particle rotation. Khan and Latha studied the effect of particle shape on multi-scale shear at the sand-geomembrane interface. Baten and Garg investigated the effect of particle shape on the sand accumulation process. Shahid and Usman examined the motion and interaction of particles with various shapes in a fluid. Xiong et al. investigated the influence of aspect ratio on the seepage performance of both coarse and fine particles. Wu et al. examined the effect of particle shape on the triaxial mechanical properties of soil samples. Abou-Chakra et al. developed a three-dimensional analysis model of particle shape by projecting particles in various directions and analyzed particle shape across different particle sizes. The results indicate that there is no clear relationship between the shape and size of particles within the same material. Tu and Wang compiled commonly used parameters in particle shape analysis and compared various particle shape parameters.
Despite this, most current research on particle shape remains at a qualitative level and primarily analyzes the shape of individual particles. Furthermore, there is a lack of studies examining the effect of various particle shapes on the pore structure of soil.
In this study, filter soil particles are modeled as ellipsoidal particles, and the pore radius of the filter soil is calculated based on varying particle shape parameters and distributions. The filtration characteristics of the filter layer soil provide a direct reflection of the soil's pore structure. Therefore, this study employs ellipsoidal parameters to model filter layer soil particles using particle flow software. A filtration permeability test is conducted to investigate the impact of these ellipsoidal parameters on soil filtration characteristics and the variation in the permeability coefficient of the filter layer. Additionally, indoor tests are performed for comparison and validation.
2. Analysis of the pore structure characteristics of the filter layer
Soil pores are classified as effective or ineffective [21,22]. Seepage can only occur through effective pores. In this study, the effective pore radius refers to the maximum pore radius through which tailings sand can pass during the seepage process of the filter layer. This radius reflects the clogging characteristics of the filter layer. This parameter is essential for analyzing seepage clogging within the filter layer and will be referred to as the effective pore radius of the filter hereinafter.
2.1. Ideal spherical particle filter layer
Firstly, it is assumed that the filter layer consists of spherical particles. The plane projections for both the loose arrangement and the tight arrangement are shown in Fig. 1 and Fig. 2, respectively.
Figure 1.
Spherical Particles in a Loose Arrangement.
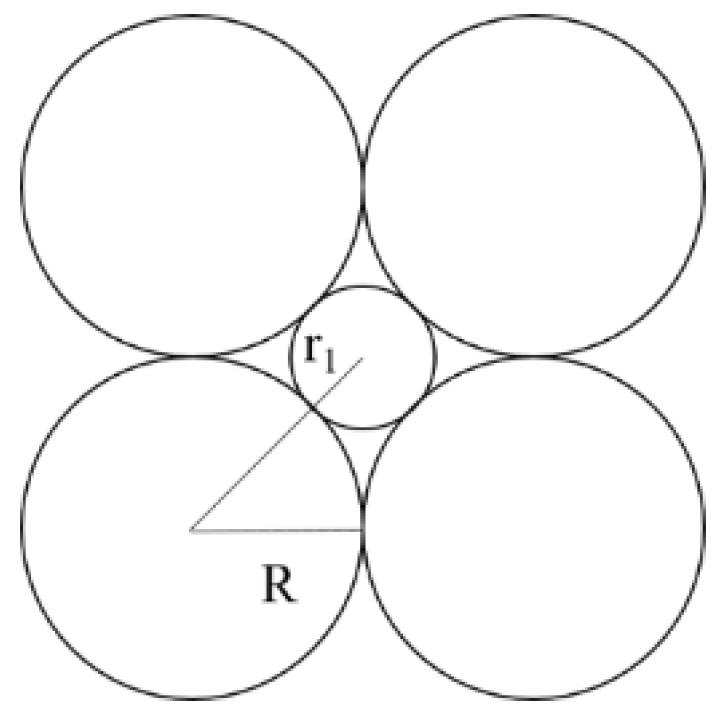
Figure 2.
Spherical Particles in a Close-Packed Arrangement.
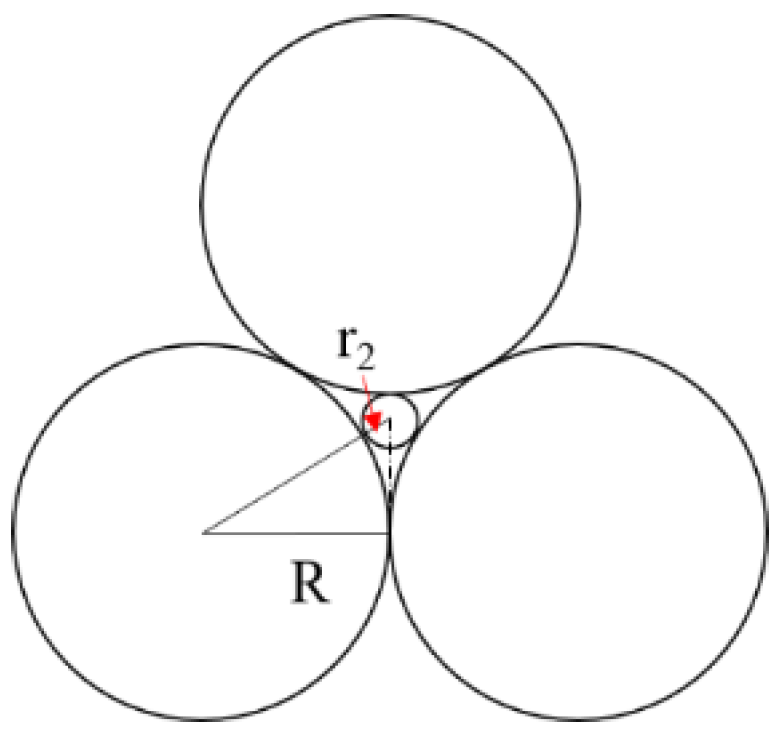
Assuming that the radius of the uniform spherical particles is R, and that the effective pore radius of the filter are r1 and r2 for the loose and close-packed arrangements, respectively, The values can be calculated from Fig. 1a and 1b, as presented in Eq. (1) and Eq. (2).
Thus, for ideal uniform spherical particles, the effective pore radius of the filter ranges from 0.155 R to 0.414 R.
2.2. Ideal ellipsoidal particle filter layer
Secondly, it is assumed that the filter layer consists of ellipsoidal particles.
2.2.1. Theoretical maximum pore radius
Under ideal conditions, the particles in the filter layer that theoretically maximize the effective pore radius are arranged as depicted in Fig.3. The analysis is conducted using the upper left portion of the axisymmetric diagram. The long axis radius, OA, is denoted as a, and the short axis radius, OB, is denoted as b. The contact point between the two ellipsoidal particles is denoted as C, with OC=c. The effective pore radius of the filter for this particle arrangement is BD=rmax.
Figure 3.
The maximum effective pore size of ellipsoidal particle in terms of theory.
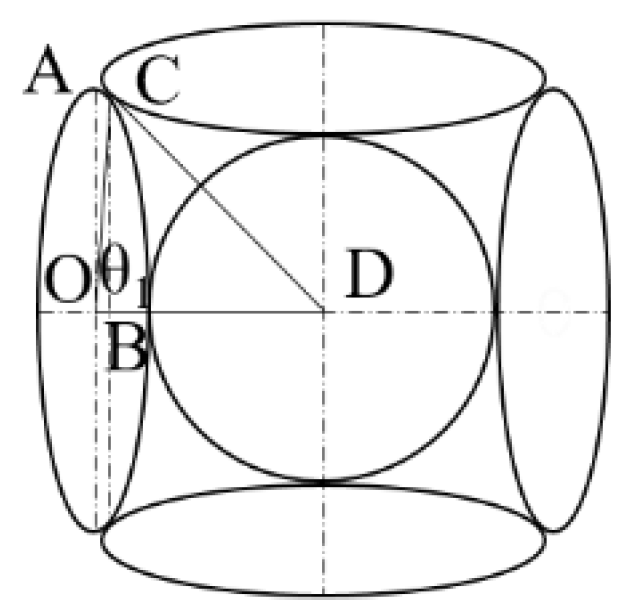
By geometric derivation, rmax can be determined using Eq. (3):
The relationship between tanθ1 and the radii a and b of the long and short axes of the ellipsoid can be derived mathematically. The final solution is as Eq. (4):
When a=b, the ellipsoid degenerates into a sphere, and θ1 is 45°, which is consistent with the previously obtained calculation results.
2.2.2. Theoretical minimum pore radius
Under ideal conditions, the particles in the filter layer which form the minimum effective pore radius are arranged as shown in Fig.4. The long axis length of the filter particles OA is represented by a; the short axis radius OB is represented by b. The effective pore radius of the filter in this particle arrangement is denoted as AD=rmin.
Figure 4.
The minimum effective pore size of ellipsoidal particle in terms of theory.
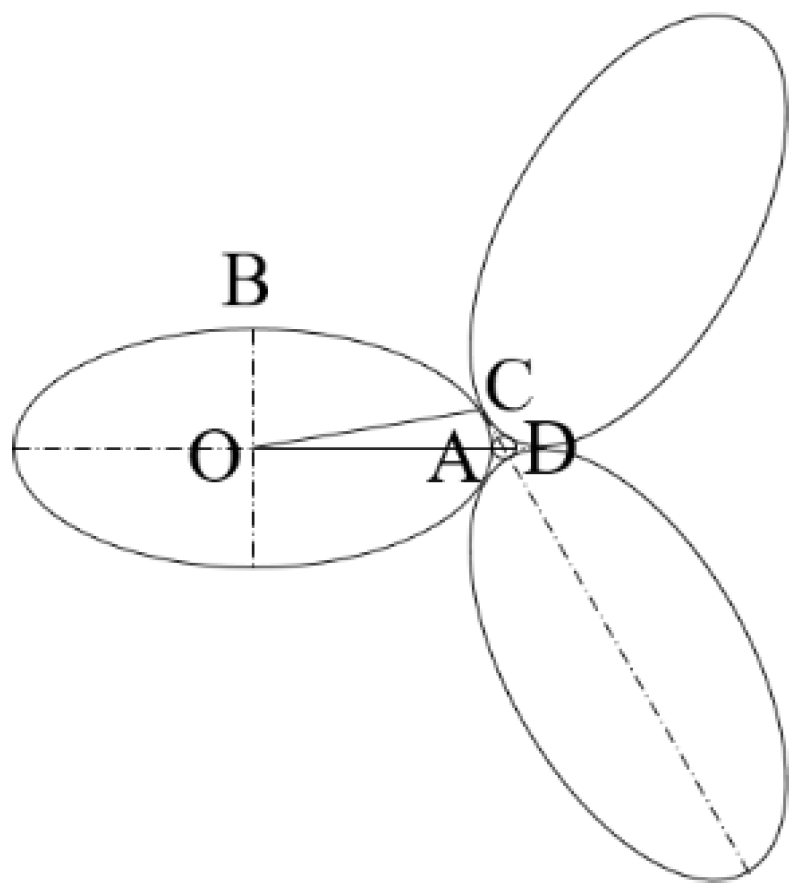
Through the geometric derivation process, rmin can be expressed Eq. (5):
2.2.3. Particles in a loose arrangement
Figs.3 and 4 illustrate the maximum and minimum effective pores that can occur in the filter layer under ideal conditions, which are seldom observed in practice and represent extreme scenarios. When considering the overall particle distribution of the filter layer, the stability of the particle arrangement should also be taken into account. An unstable particle arrangement (Fig.3) is unlikely to be prevalent within the filter layer. Therefore, the loose arrangement and tight arrangement of the overall particles in the filter layer are depicted as illustrated in Figs.5 and 7, respectively.
Figure 5 illustrates the loose arrangement of particles in the filter layer. Similar to the solution process in Section 2.2.1, the maximum effective pore radius and tanθ2 value of the filter can be derived as Eq. (6) and Eq. (7):
The three-dimensional spatial structure of the particles in the filter layer under this particle arrangement is expected to resemble the structure of a regular tetrahedron. If all the particle sizes in the filter layer are the same, the porosity of the filter layer in three-dimensional space is given by Eq. (8):
Assuming that the ratio of the long to short axes is a/b=λ, the porosity n of the soil in a loose arrangement for different values of λ is calculated. The results of these calculations are presented in Table 1. As shown in Table 1, the porosity of the soil in a loose arrangement is minimized at a λ value of 1.2, with a porosity of 0.498. For λ<1.5, the porosity of ellipsoidal particles is less than that of spherical particles. When λ>1.5, the porosity of ellipsoidal particles exceeds that of spherical particles. Additionally, the porosity increases with λ, with the growth rate initially rising and then decreasing, as shown in Figure 6.
However, it should be pointed out that the porosity calculated here is based on a single particle size. Due to the presence of particles with varying sizes in the actual filter layer, small particles will fill the pores of larger particles, and the particle arrangement may not be loose. Consequently, its porosity is expected to be lower than that calculated here.
2.2.4. Particles in a close-packed arrangement
Figure 7 illustrates the close arrangement of particles in the filter layer. In this case, let ; then, the maximum effective pore radius of the filter can be obtained by Eq. (9):
3. Ellipsoidization of arbitrary particle shape
3.1. Ellipsoidization of arbitrary particle shape
The shape of the actual filter layer particles varies, and it is almost impossible for them to assume a regular spherical or ellipsoidal form. Therefore, it is necessary to characterize the particle shapes using specific shape parameters and attempt to approximate the irregular shapes of the filter layer soil particles as ellipsoids.
It is assumed that the plane projection area of the filter layer soil particles is denoted as A and the perimeter as P. The projection is approximated as an ellipse with a constant area and perimeter, and its long and short axis radii are defined as a and b, respectively. From the formulas for the area and perimeter of an ellipse, the following relationships can be derived by Eq. (10):
The value of the radius b of the short axis can be obtained by Eq. (11):
When the particle shape is spherical with a radius r, the formulas for the area and perimeter of a projection circle are substituted into Eq. (11) to obtain b=r, which confirms the validity of the formula.
At this time, the long axis radius a can be obtained by Eq. (12):
The prerequisite for deriving Eq. (11) is Eq. (13):
This can also be expressed by Eq. (14).:
For a given area, a circle has the smallest circumference, resulting in the maximum value of Eq. (14). Therefore we can obtained Eq. (15):
Specifically, for the plane projection of any particle shape, Eq. (11) can be applied. Consequently, the plane projection of any particle shape can be approximated as an ellipse using the semi-major and semi-minor axes defined by Eq. (11) and Eq. (12).
3.2. Ellipsoidization method associated with particle analysis results
The grading curve of particle analysis is determined by the screening method. Assuming that the particle shape is a sphere, the diameter of the sphere represents the screening particle size. If the particle shape is assumed to be an ellipsoid, the screening particle size should be defined as the short axis diameter of the ellipsoid particle, specifically 2b. At this time, the radius of the long and short axes of the ellipsoid can be determined using the following two methods:
(1) By comparing the particle size obtained from the analysis with the short axis radius determined by the previous Eq. (11), if the difference is minimal, the short axis radius can be approximated using the particle size results, while the long axis radius can still be calculated using Eq. (12).
(2) When the particle size obtained from the analysis is treated as the short axis radius, the long axis radius can then be determined by calculating the projection area. Using this method to determine the radii of the long and short axes, the area of the figure before and after conversion to an ellipse remains constant, while the perimeter differs.
3.3. The particle shape parameter
It can be seen from the previous article that the value on the left side of Eq. (14) is minimized when the particle shape is spherical, thus allowing for the evaluation of particle shape using this formula. From Eq. (15), the value of Eq. (14) can be derived when the particle shape is circular. The Eq. (14) and Eq. (15) are combined to define a particle shape parameter S, indicating that the particle shape is circular when S=1. The parameters are defined as Eq. (16):
The value range of S is (0,1]. The closer S is to 1, the more closely the particle projection shape approximates a circle.
The shape parameter S presented here is the square of the shape parameter S11 in Reference [20], though the methods for obtaining the two parameters differ. In Reference [20], S11 is defined as the ratio of the circumference of a circle with equal area to the circumference of the projection.
The particle shape parameter S corresponding to different values of λ is calculated, and the results are presented in Table 2. Additionally, the relationship between S and λ is illustrated in Figure 8. From Figure 8, it can be observed that before λ reaches 2.5, the relationship between S and λ can be approximately considered linear. However, as λ increases further, the range of change in S gradually decreases.
In Reference [23], the shape parameters of soil particles with varying particle sizes were computed. In this paper, the parameter is converted to the particle shape parameter S; the mean value is 0.764, and the corresponding λ value is approximately 1.9. This indicates that, generally, the particle shape parameter S of soil particles can be regarded as linear in relation to the ratio of the long and short axes λ. Therefore, the data with λ values less than 2.5 in Table 2 are selected for linear regression analysis. When λ values are less than 2.5, the relationship between S values and λ values can be approximately represented by Eq. (17):
4. Construction of ellipsoidal particle unit in particle flow software
The following model is constructed using the particle flow software PFC to verify the influence of particle shape on the seepage characteristics of the filter layer. Because ellipsoid particles cannot be directly created within PFC, it is necessary to utilize the clump unit within PFC to create an approximate ellipsoid by combining spheres, and employ circular splicing to create an approximate ellipse in the plane projection.
4.1. Construction basis of ellipsoid particles
When the ellipsoidal model is compared with the pre-ellipsoidal model, the volume of the ellipsoidal pattern must be equal to the volume of the spherical particles to ensure that the model’s porosity remains unchanged during the transformation into an ellipsoid. As shown in Figure 9, the particle with radius r in the original model is transformed into a model characterized by a long axis a and a short axis b.
Let the ratio of the long axis to the short axis be a/b=λ. This method for constructing the ellipsoid unit must satisfy 1≤λ≤2. If λ exceeds 2, the ellipsoid unit must be reconstructed. Otherwise, errors will occur in the calculation of particle volume in PFC, which will alter the porosity of the model.
The radii of the large and small circles required to construct the ellipse are determined by the values of a and b. Consequently, an elliptical particle model with constant porosity can be approximately constructed in PFC.
To construct ellipsoidal particles in PFC, the ratio λ of the long to short axes must be determined. In this study, tailings sand particles with a size range of 2-5 mm were scanned to obtain their projection images. Particle shapes were analyzed using ImageJ software to obtain size information for each particle. Subsequently, the corresponding λ parameters were determined by calculating the ovalization of each particle. The mean value of λ for each particle is used as the basis for the λ parameter in the construction of ellipsoidal particles in PFC. The tailings used for scanning were screened from the Lixigou tailings reservoir.
4.2. Image acquisition and information extraction
Figure 10 shows the shapes of tailings sand particles ranging from 2 to 5 mm. The parameters of particle projection are analyzed using image analysis software. Details of the specific process are outlined as follows:
This image clearly displays the projection shape of each particle, with the lighter areas representing the particles. ImageJ software can automatically detect the boundaries of each individual particle and assign them unique labels, facilitating the subsequent extraction of their shape parameters.
Table 3 shows the area and perimeter of selected particles analyzed using ImageJ software. The parameters in the software are measured in image pixels. To determine the specific size, a reference size must be established on the image to determine the proportional relationship between pixel dimensions and actual dimensions, allowing for the calculation of the true shape parameters of the particles. The average value in Table 3 represents the mean of each parameter for all 13 particles.
The reference size in Figure 10 is determined by the width of the slide, which measures 25.4 mm. By comparing the actual size of the slide with the pixel width of the picture, the particle pixel sizes in Table 3 can be converted into actual sizes. The average value in Table 3 represents the mean of each parameter for all 13 particles.
4.3. Shape parameters of ellipsoidal particles
The area and perimeter of each particle are presented in Table 3. The long and short axis radii of each particle after ellipsoidization can be determined using Eq. (11) and Eq. (12), from which the corresponding long and short axis ratio λ and the particle shape parameter S are derived, as shown in Table 4.
The scanned particles have a size range of 2-5 mm, and the shape parameters in Table 4 correspond to this particle size range. (The average values presented in Table 4 represent the means of the parameters for all 13 particles.) Figure 11 shows that the ratio of the long to short axes λ for each particle is approximately linearly related to the corresponding particle shape parameter S, which is consistent with the conclusion drawn in Section 3.3.
Based on the calculation results presented in Table 4, λ=1.9 is used as the basis for constructing ellipsoidal particles in PFC, with the corresponding particle shape parameter being 0.769.
5. Numerical simulation results analysis
The spherical particles and ellipsoidal particles were utilized to construct a three-dimensional filter layer soil column model with a height of 20 cm and a diameter of 10 cm in PFC. Tailings sand particles of varying sizes were then added above the soil column to perform a muddy water seepage simulation test. The particle size of the filter layer is 2-5 mm, with spherical and ellipsoidal particle shapes used for modeling, respectively. The ratio of the long to short axes of the ellipsoidal particles, λ, is 1.9. The tailings sand muddy water particles are uniformly assumed to be spherical, with particle sizes of 0.5-1 mm, 0.25-0.5 mm, and 0.075-0.25 mm. The walls are designated as impermeable. The model contains a total of 5 × 5 × 10 fluid units, with each fluid unit measuring 2 cm × 2 cm × 5 cm. The initial porosity of the model is set at 0.4, with a water pressure of 20 kPa applied at the top. The seepage direction is from top to bottom. A layer of filter with a pore size of 1.25 mm is placed at the bottom of the model.
5.1. Comparison of seepage simulation test results of filters with different particle shapes
Figure 13 shows the muddy water seepage of 0.5-1 mm tailings sand particles through the spherical particle filter layer and the ellipsoidal particle filter layer, respectively. Comparing the seepage and clogging of tailings sand muddy water particles under both working conditions, it can be seen that 2-5 mm filter layers with different particle shapes effectively protect 0.5-1 mm tailings sand particles. Most of the tailings sand muddy water particles accumulate on the upper surface of the filter layer or are located at a depth of 15-20 cm within the filter layer, and no particles penetrate the filter layer. However, the muddy water particles of tailings sand in the spherical particle filter layer are located significantly deeper than those in the ellipsoidal particle filter layer.
Figure 14 shows the muddy water seepage of 0.25-0.5 mm tailings sand particles through the spherical particle filter layer and the ellipsoidal particle filter layer, respectively. Compared with 0.5-1 mm tailings sand particles, 0.25-0.5 mm particles almost all enter the filter layer during seepage, with most particles remaining at a depth of 10-20 cm within the filter layer, while a small number of particles penetrate the filter layer (the particles located below the filter layer indicate those that have seeped through the filter layer). Among them, the intrusion depth of tailings sand muddy water particles in the spherical particle filter layer is significantly greater, and the number of seepage particles that penetrate the filter layer is also considerably higher than in the ellipsoidal particle filter layer.
Figure 15 shows the muddy water seepage and clogging of 0.075-0.25 mm tailings sand particles through the spherical particle filter layer and the ellipsoidal particle filter layer, respectively. The intrusion depth of 0.075-0.25 mm tailings particles through both the spherical and ellipsoidal particle filter layers is nearly identical, indicating that for these tailings particles, the pores of the 2-5 mm filter layer are too large to provide effective protection. Furthermore, the different shapes of filter layer particles have no significant impact on their behavior.
The filter layer is divided into four layers, and the number of muddy water particles within each of the four filter layers, as well as those above and those that have penetrated the filter layer during the seepage process, is recorded to further analyze the filtering characteristics of layers with different particle shapes.
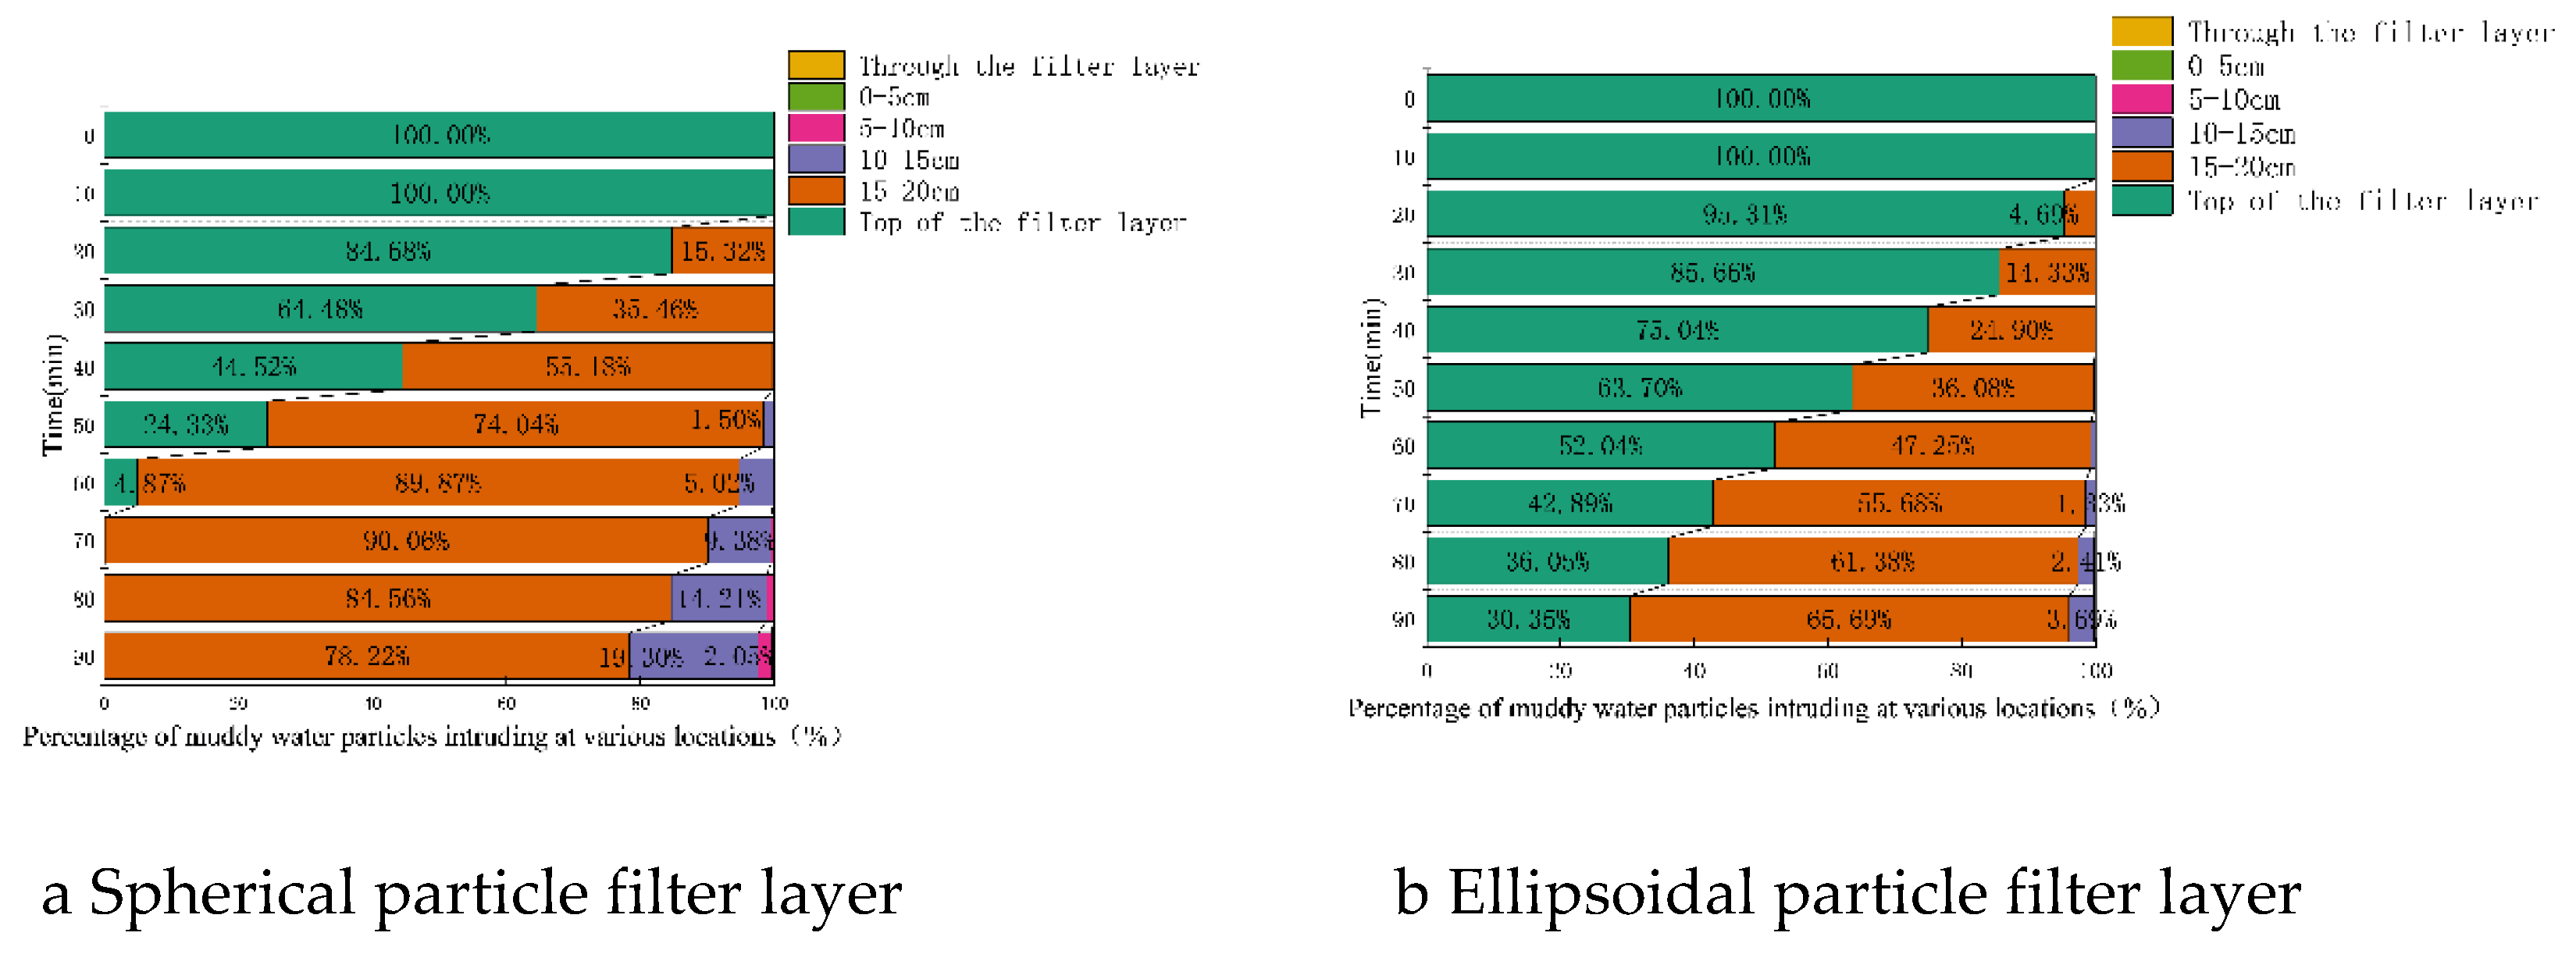
Figs. 16-18 present the statistical results for tailings sand particles of various sizes (specific proportions are omitted in the figure when they are less than 1%). It can be observed that as the particle size of tailings sand decreases, the proportion of particles infiltrating the filter layer and the depth of infiltration both increase. With the exception of 0.075-0.25 mm tailings sand particles, for other particle sizes, the proportion of infiltrating particles and the depth of infiltration for the spherical particle filter layer are greater than those for the ellipsoidal particle filter layer.
Figs. 16-18 illustrate various forms and the evolution of clogging in the filter layer during muddy water seepage. For the uniform filter layer ranging from 2 to 5 mm, 0.5-1 mm tailings sand particles are concentrated above the filter layer and at a depth of 15-20 cm within the first layer of the filter layer, indicating surface-internal deposition. Most of the 0.25-0.5 mm tailings sand particles are retained at a depth of 15-20 cm within the first layer of the filter layer, while a small amount continues to migrate to 10-15 cm within the second layer, indicating internal clogging. For the 0.075-0.25 mm tailings particles, although Figure 18 suggests that the clogging morphology is similar to that of the 0.25-0.5 mm tailings particles, this similarity arises from the significant size difference between the 0.075-0.25 mm particles and the filter layer. The finite element software processes data very slowly, making it challenging to reach an equilibrium state, and observations and calculations indicate that the infiltration of tailings particles of this size exerts minimal influence on the filter layer's permeability coefficient, which is why only a portion of the calculation results are presented. In fact, because the tailings sand particles are significantly smaller than the pore diameter of the filter layer, the filter layer cannot provide effective protection for the tailings sand particles, resulting in the eventual passage of tailings sand particles through the filter layer, constituting a form of seepage failure.
Figure 16.
The proportion of 0.5-1mm turbid water particles in different positions of the filter layer.
Figure 16.
The proportion of 0.5-1mm turbid water particles in different positions of the filter layer.
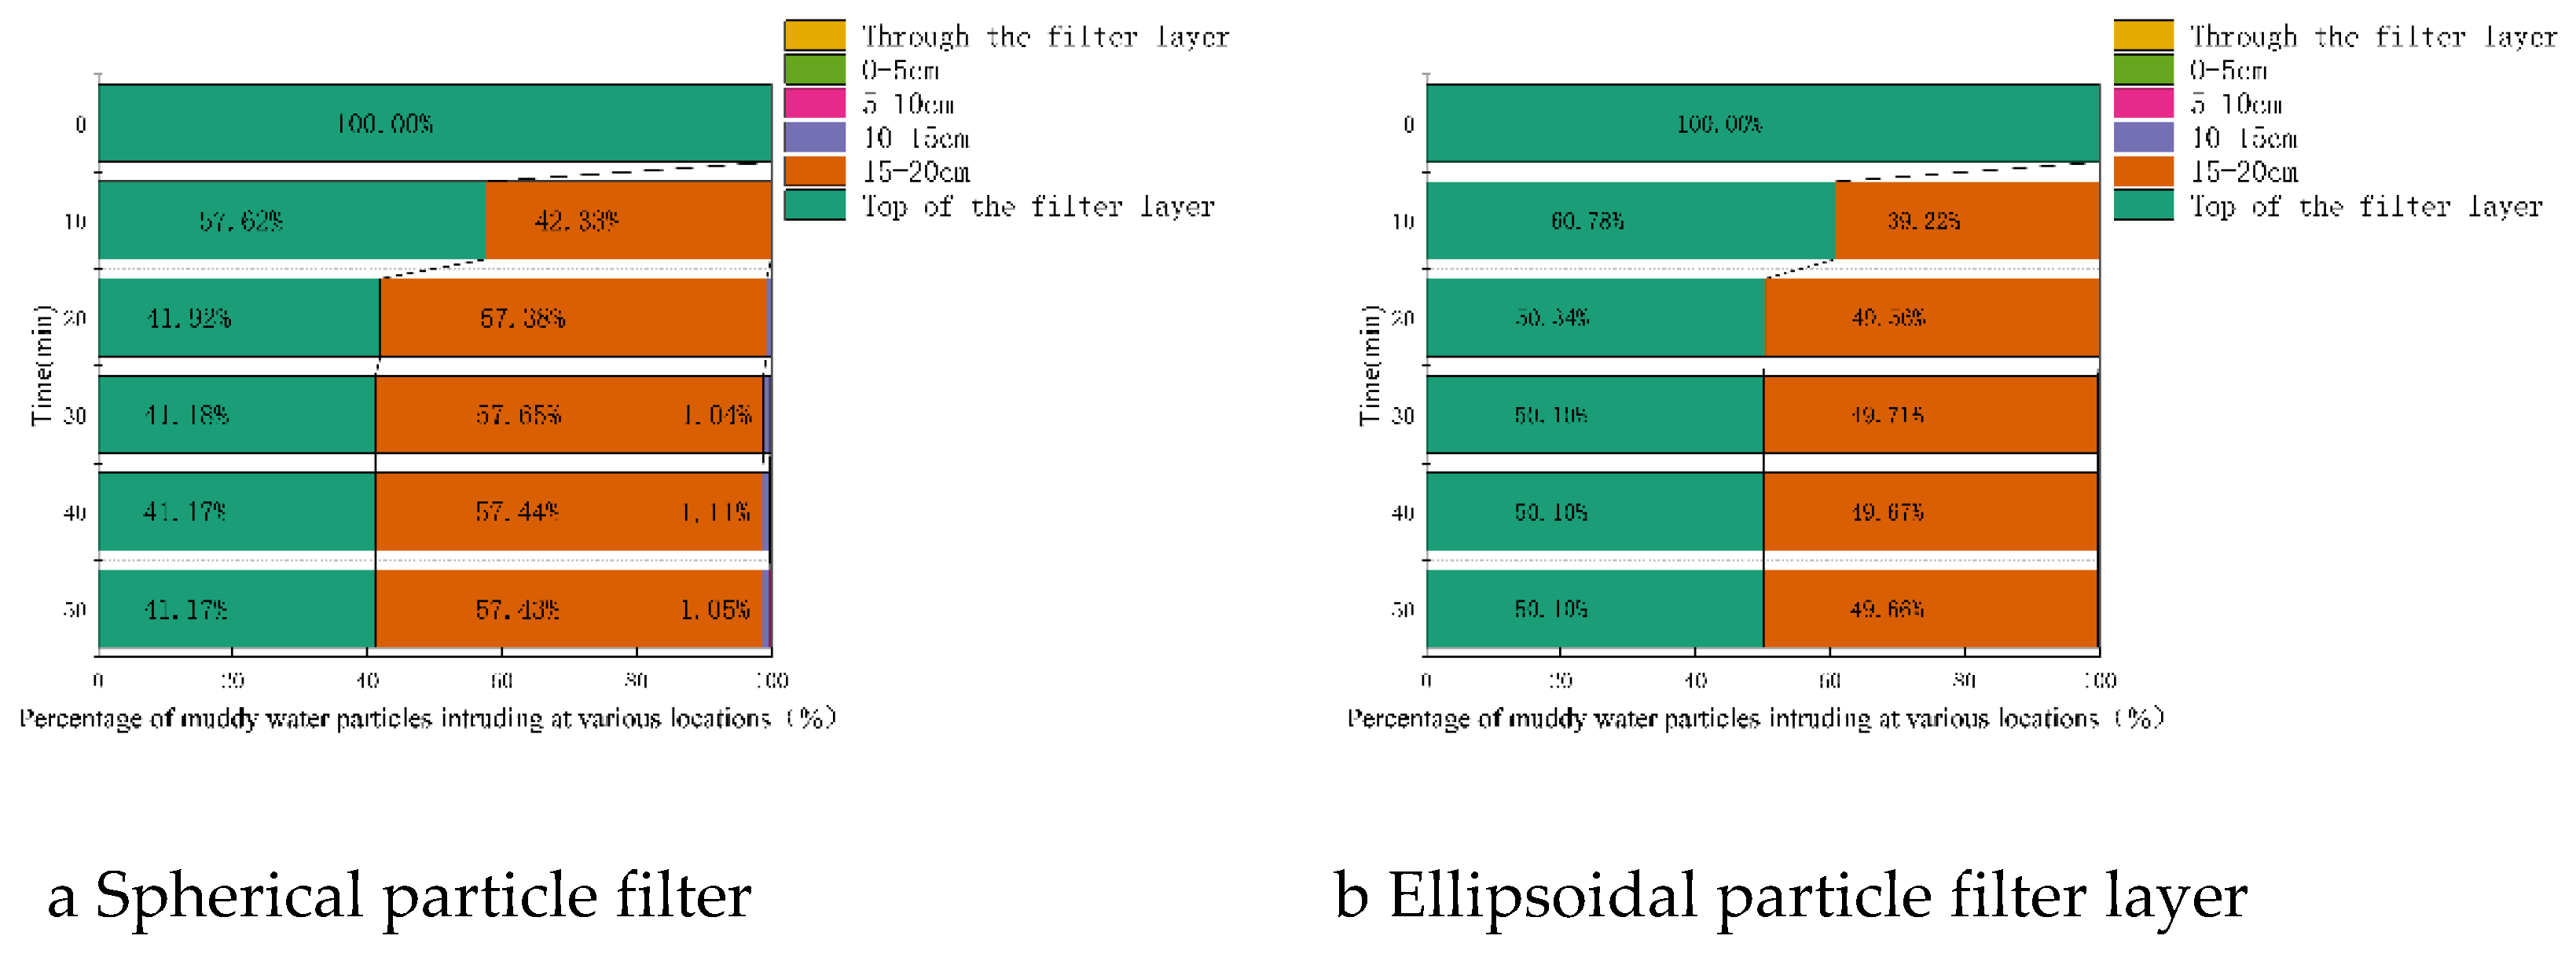
Figure 17.
The proportion of 0.25-0.5mm turbid water particles in different positions of the filter layer.
Figure 17.
The proportion of 0.25-0.5mm turbid water particles in different positions of the filter layer.
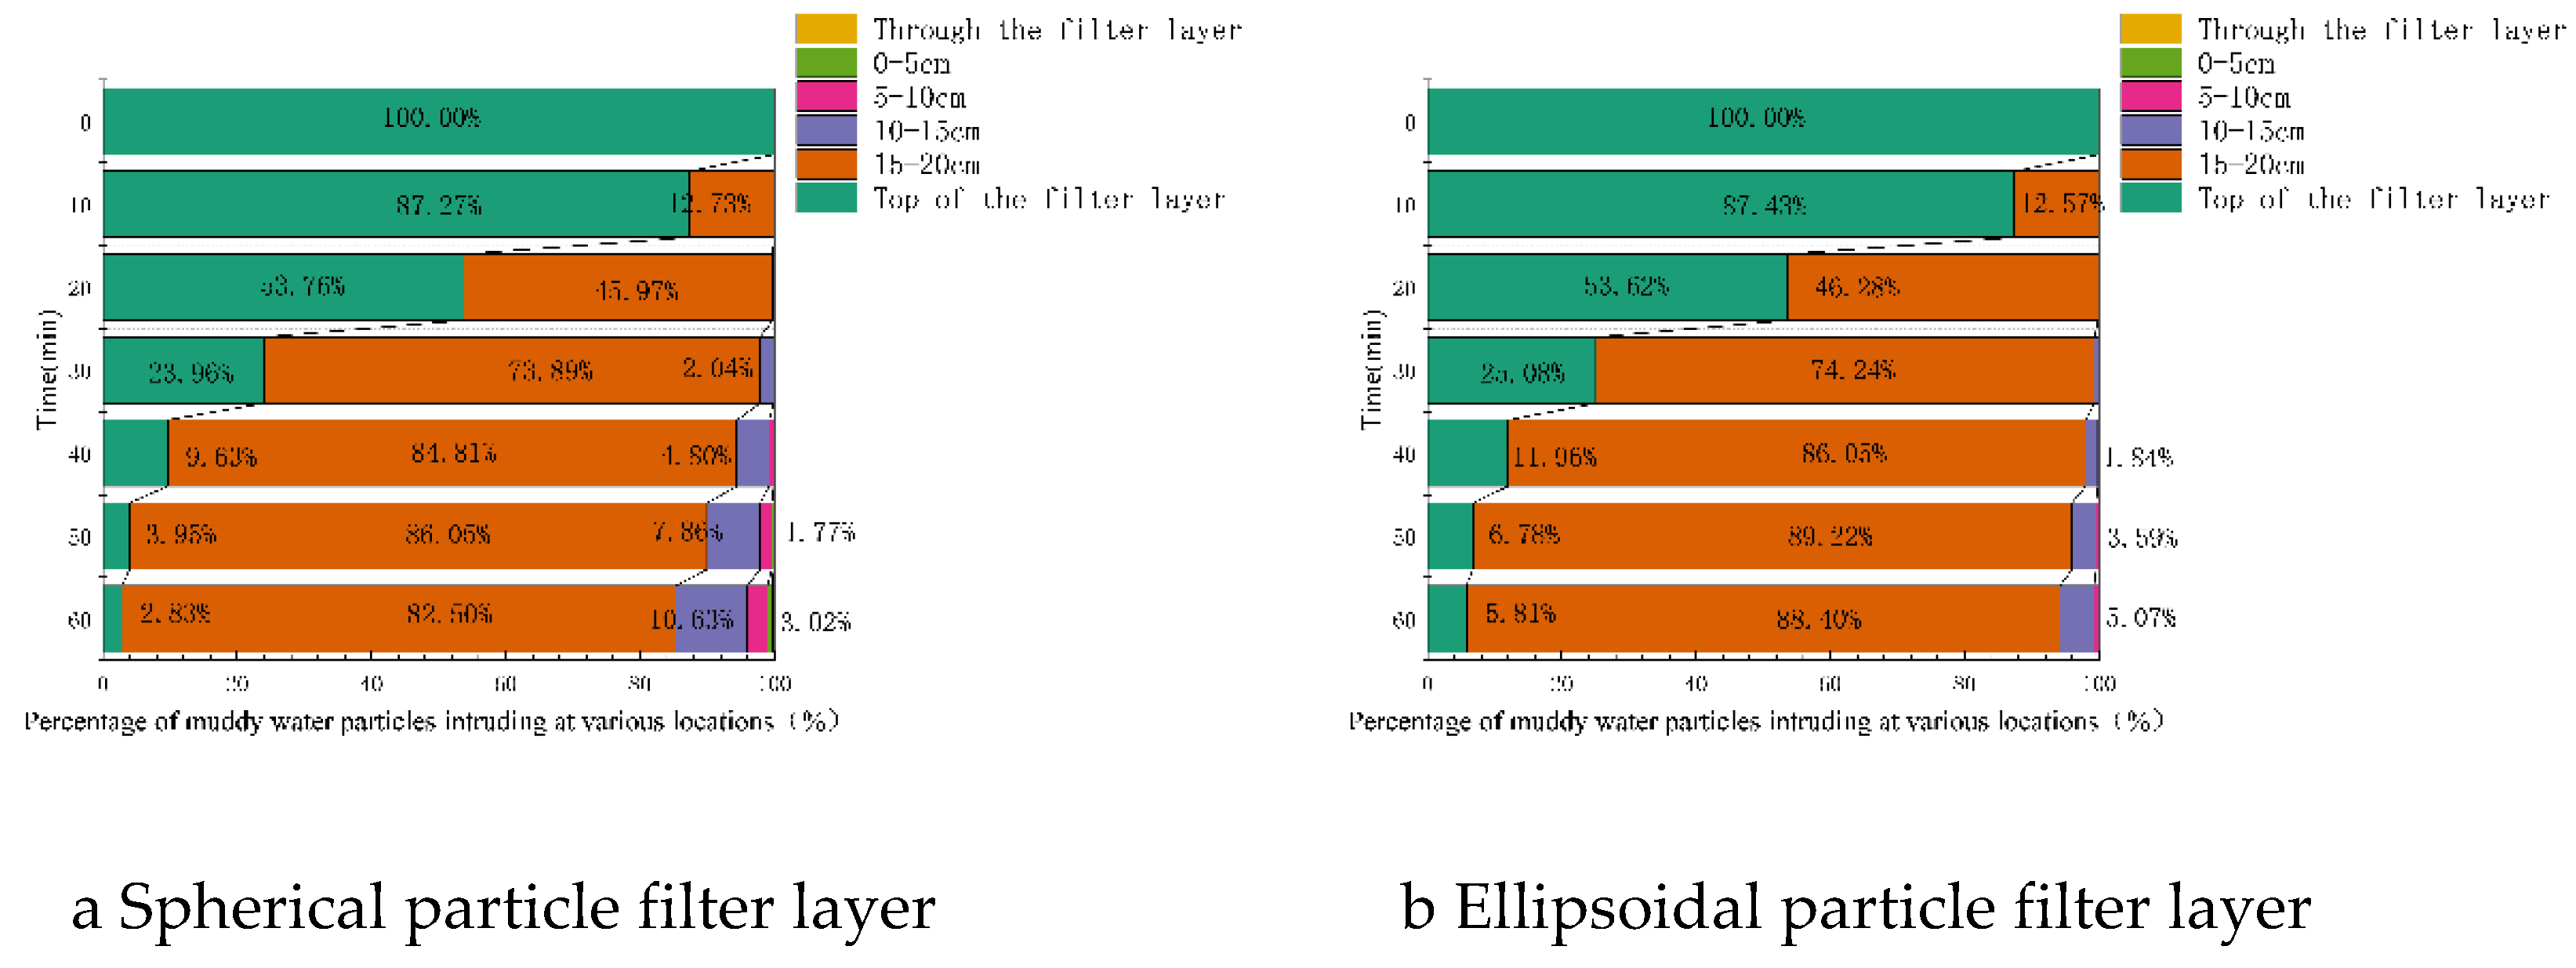
Figure 18.
The proportion of 0.075-0.25mm turbid water particles in different positions of the filter layer.
Figure 18.
The proportion of 0.075-0.25mm turbid water particles in different positions of the filter layer.
Through equations (1), (2), (3), and (5), the maximum and minimum effective pore radii for both the spherical particle filter layer and the ellipsoidal particle filter layer are calculated. The theoretical effective pore radius for the spherical particle filter layer is 0.31-2.07 mm, whereas that for the ellipsoidal particle filter layer is 0.11-4.12 mm. It can be observed that the effective pore radius of the ellipsoidal particle filter layer exhibits a wider range of variation, and the maximum effective pore radius of the ellipsoidal particle filter layer exceeds that of the spherical particle filter layer. The observations from Figs. 16-18 indicate that the effective pore radius of the ellipsoidal particle filter layer is greater than that of the spherical particle filter layer. This suggests that the permeability of the ellipsoidal particle filter layer is likely greater than that of the spherical particle filter layer, a conclusion that will be validated through the analysis of the permeability coefficient of the filter layer.
5.2. The change process of permeability coefficient of filter layer with different particle shapes
The permeability coefficient of the model cannot be directly obtained using PFC and must be calculated by employing appropriate theoretical formulas. In this paper, the Darcy permeability coefficient Eq. (18) is employed to estimate the permeability coefficient, and the results of these calculations are subsequently analyzed.
In the equation, v represents the seepage velocity, while i denotes the hydraulic gradient.
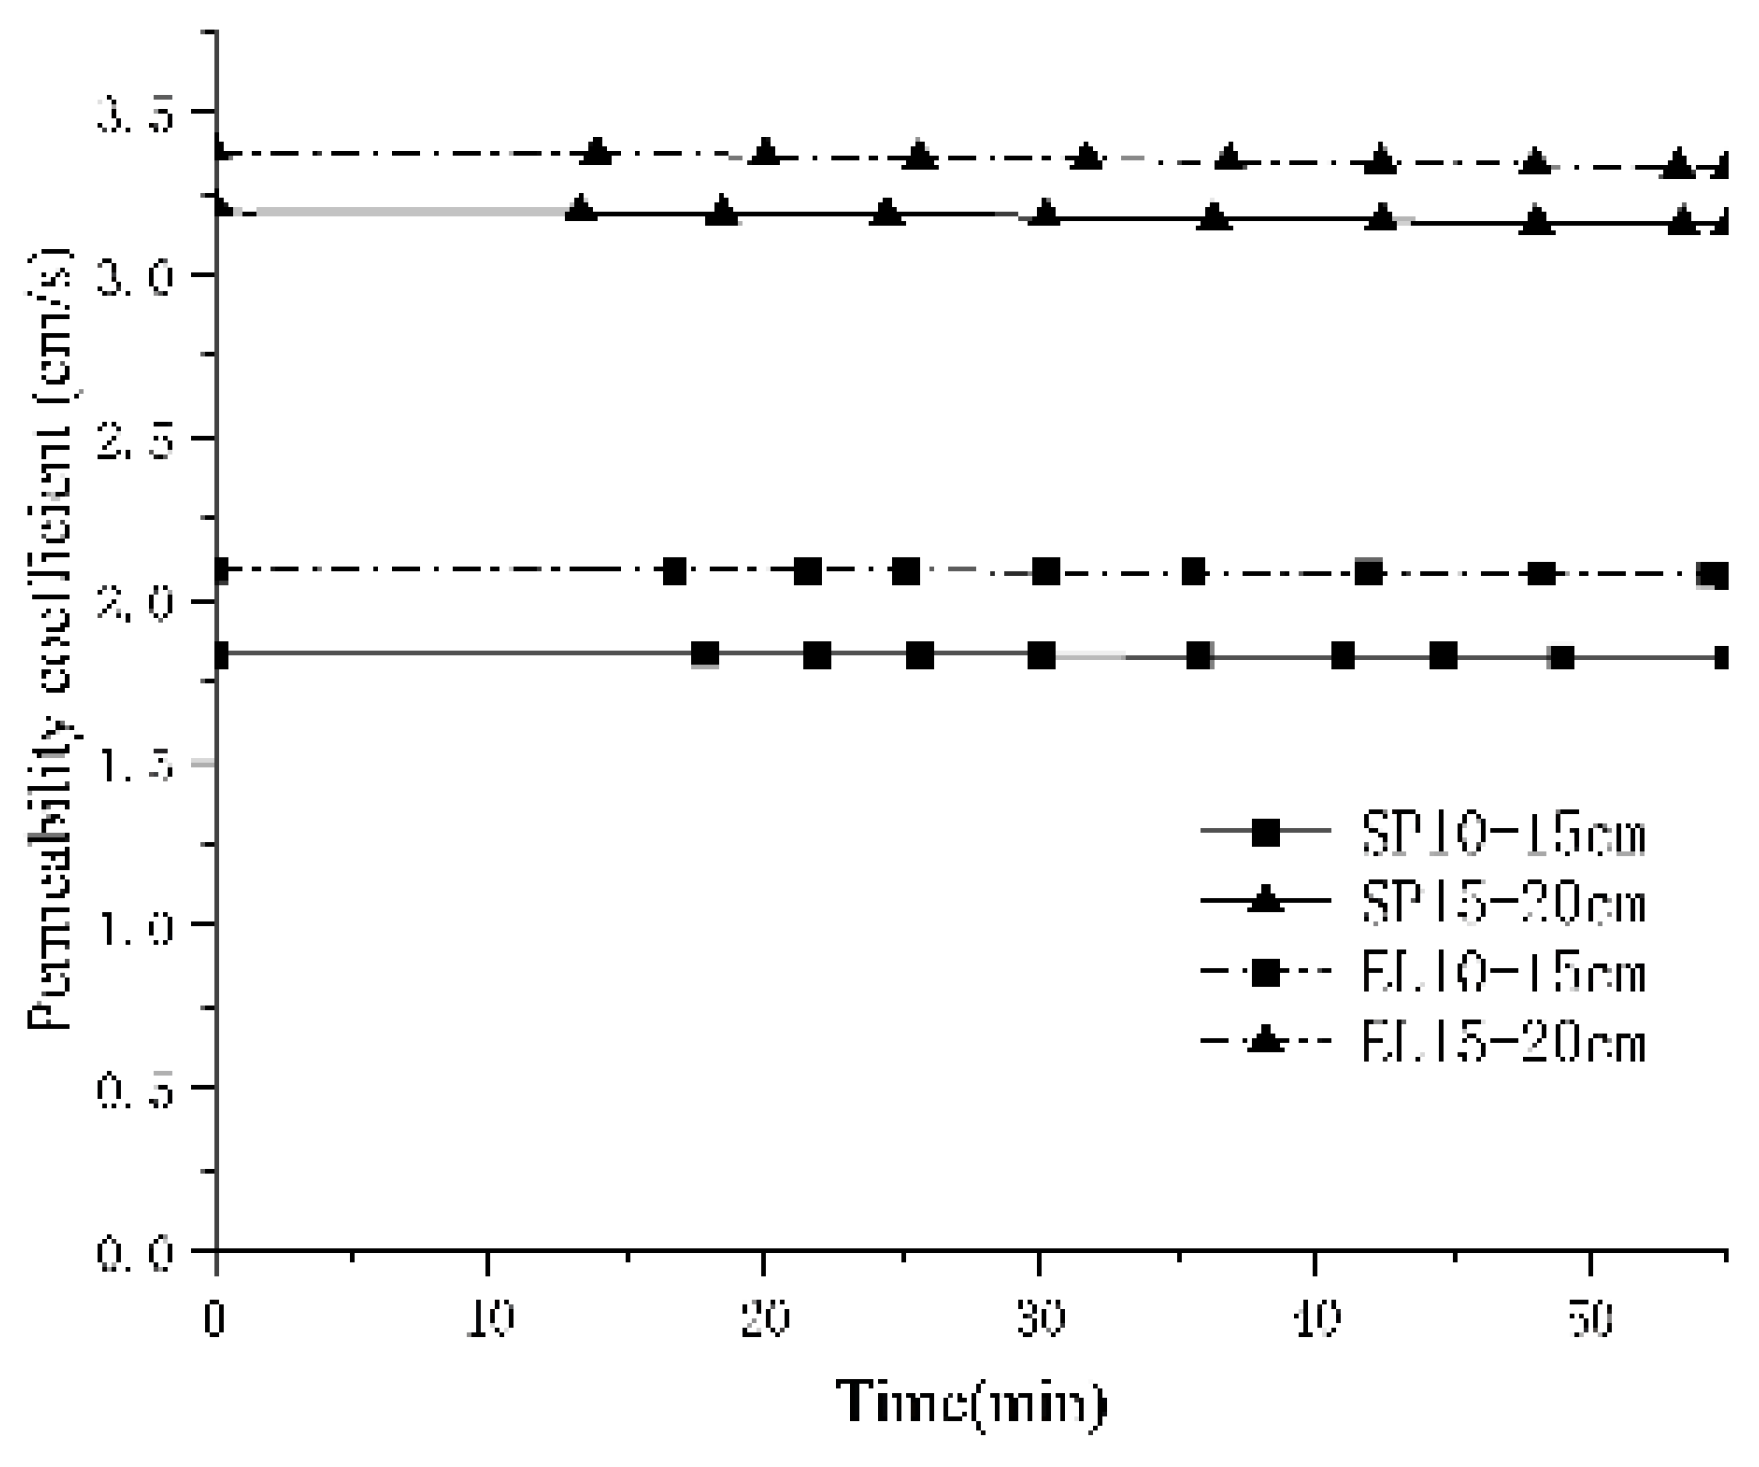
The calculated permeability coefficients for filters with varying particle shapes are presented in Figs. 19-21. In the figures, SP represents a spherical particle filter layer, whereas EL denotes an ellipsoidal particle filter layer. Analysis of Figs. 19-21 indicates that, based on the results derived from Darcy's formula, the permeability coefficient of the spherical particle model is lower than that of the ellipsoidal particle model.
Figure 19.
The permeability coefficient of 0.5-1mm turbid water particles.
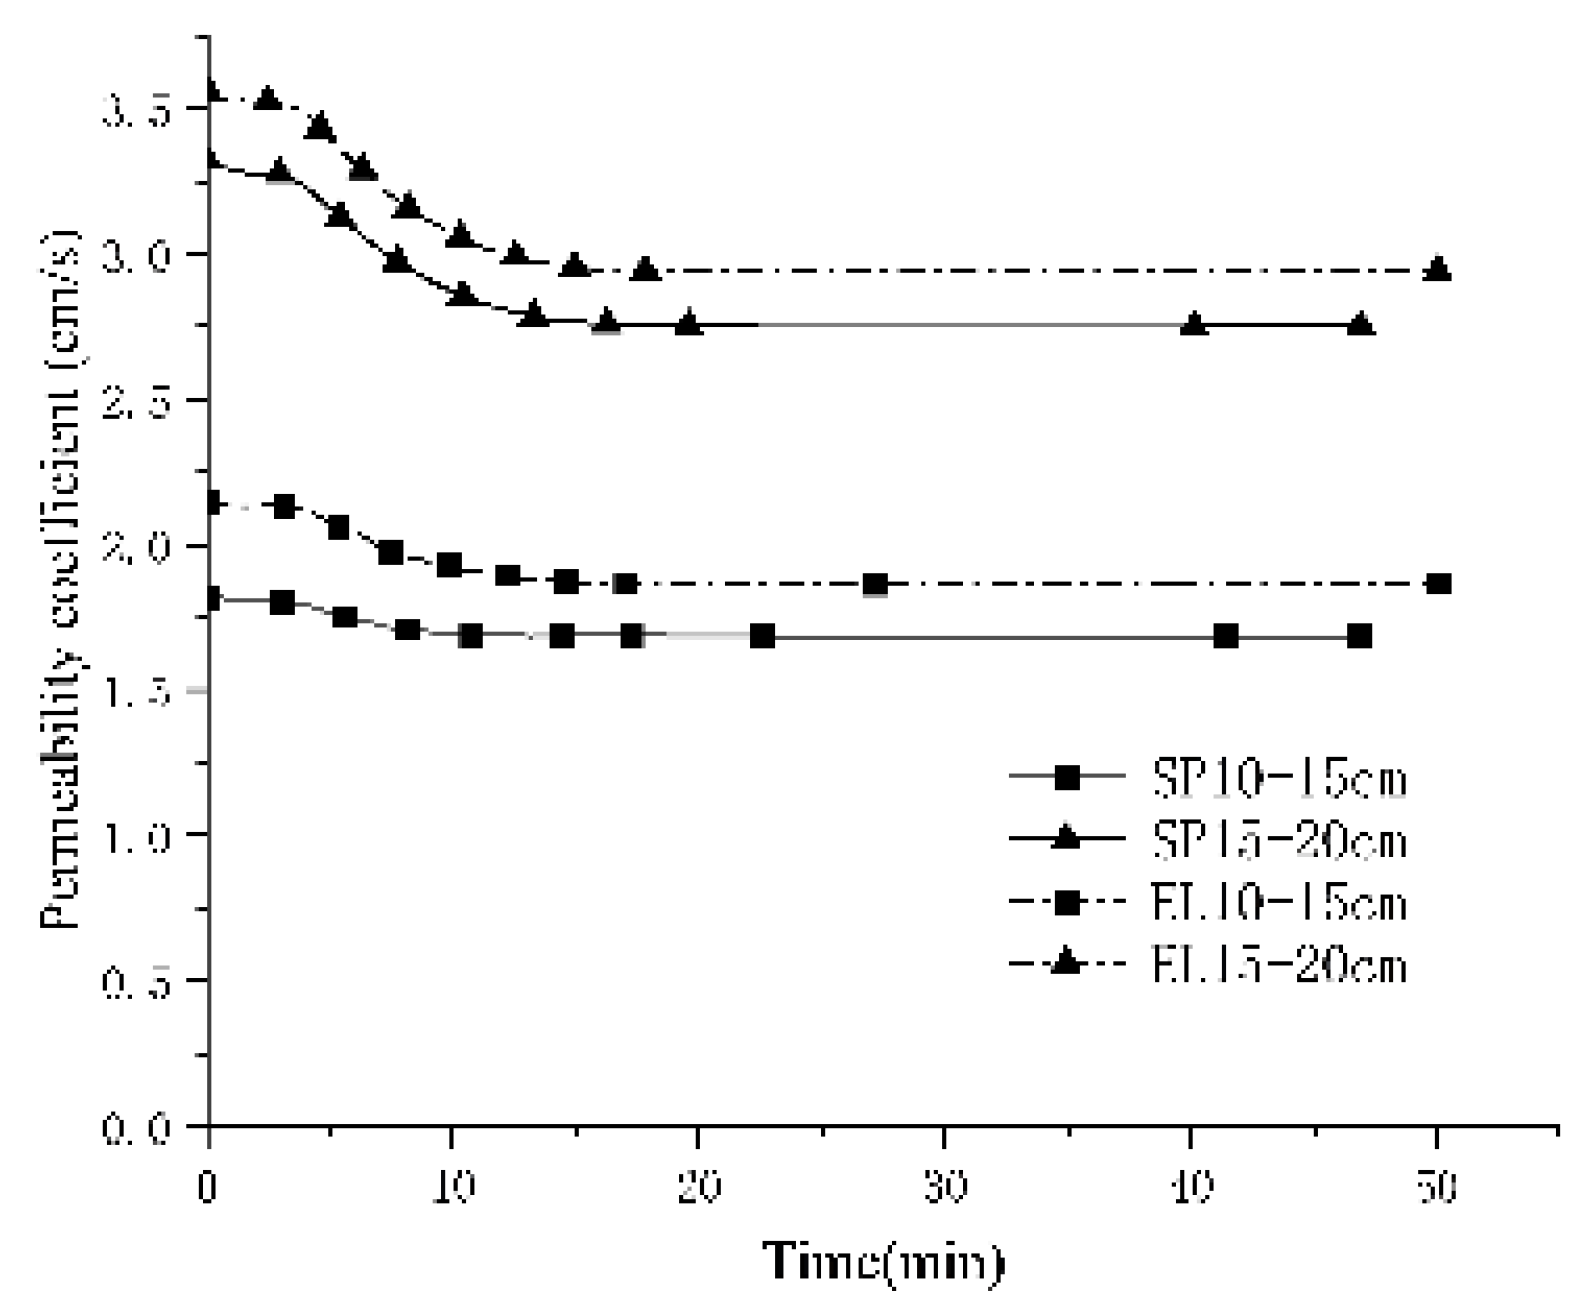
Figure 20.
The permeability coefficient of 0.25-0.5mm turbid water particles.
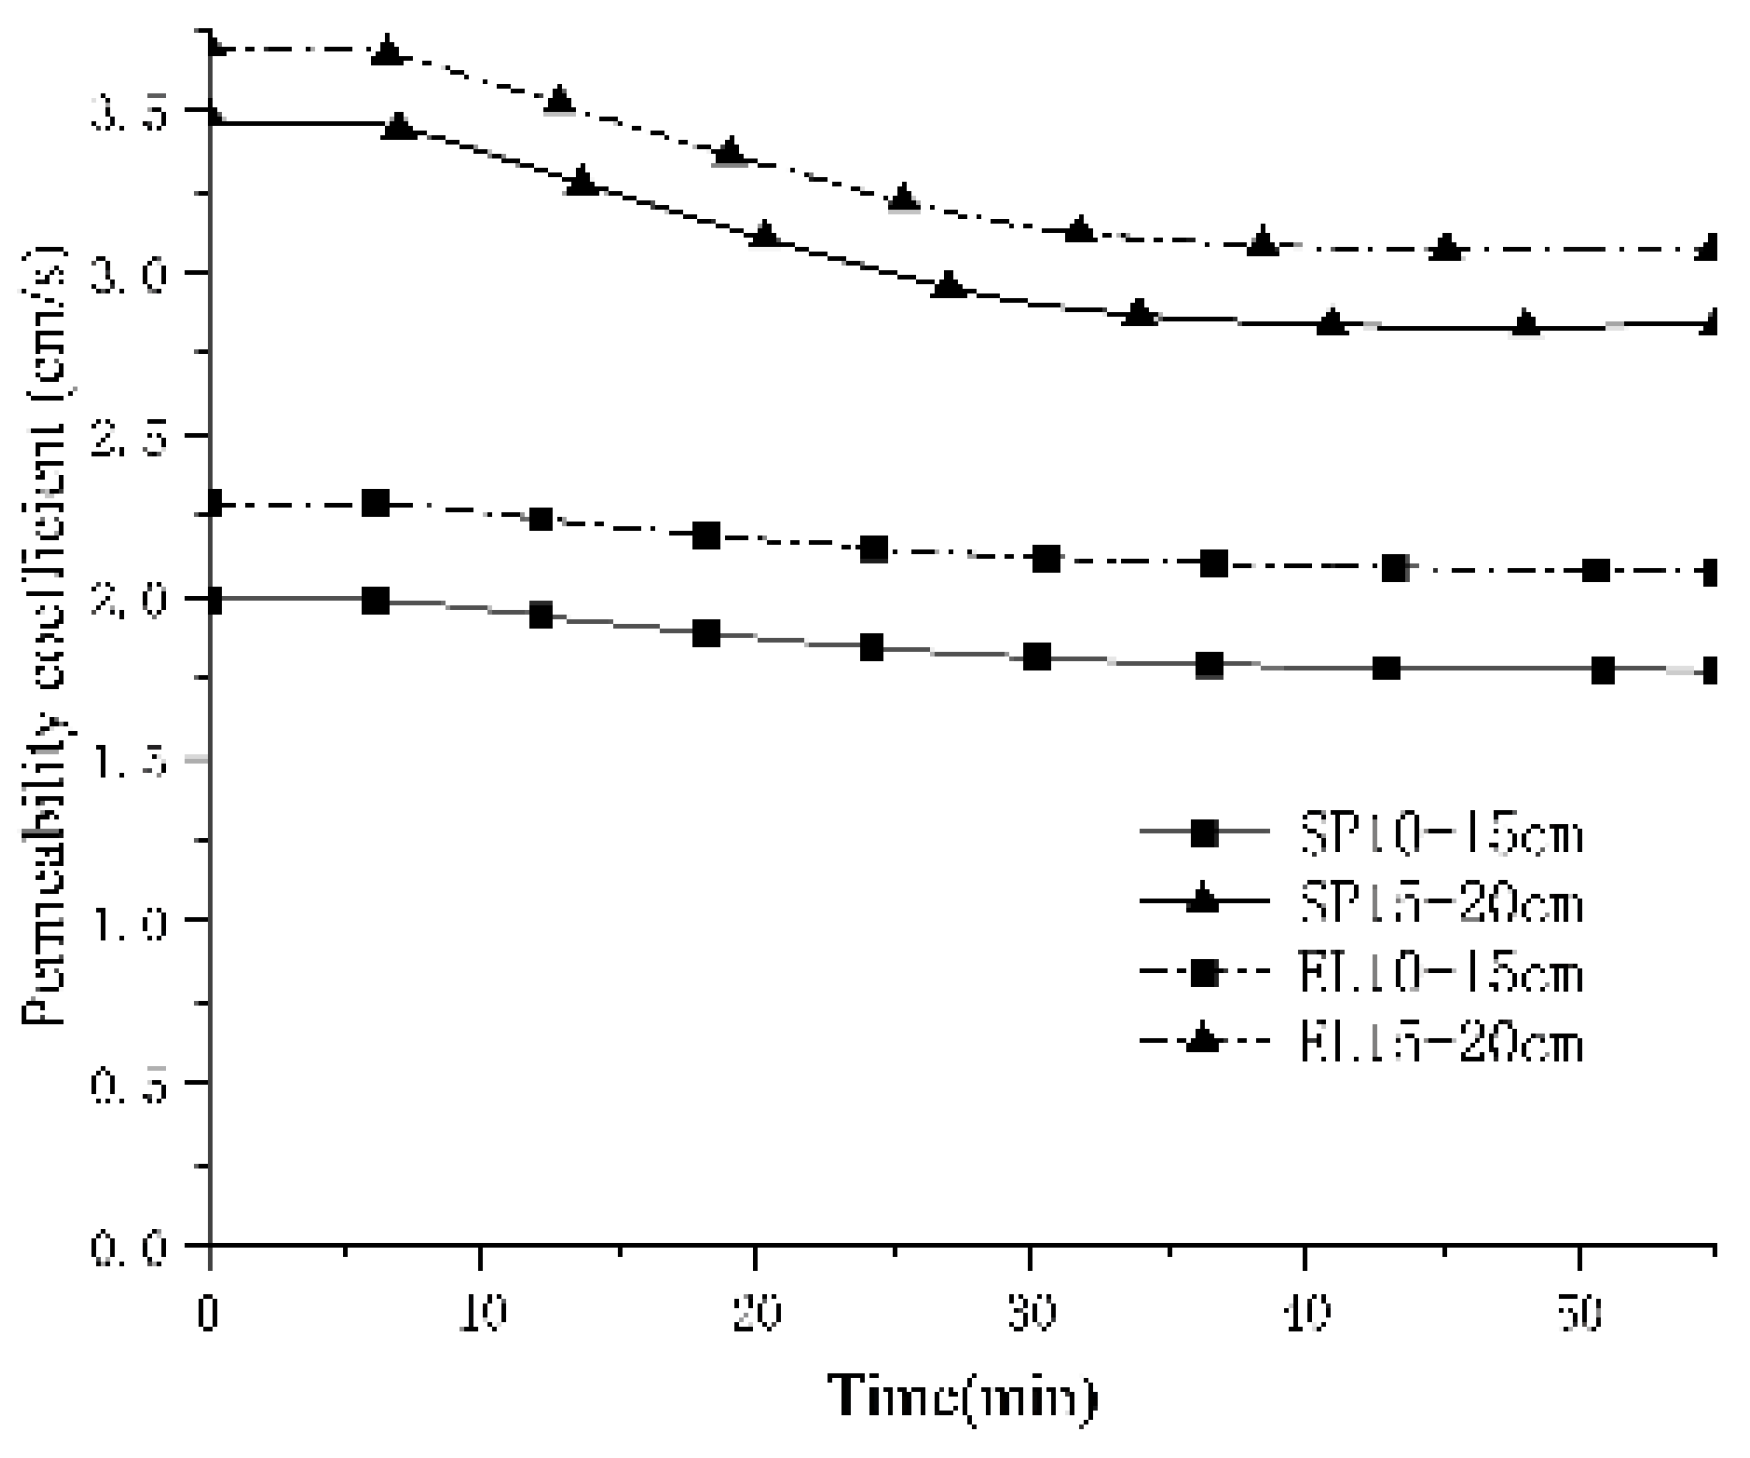
Figure 21.
The permeability coefficient of 0.075-0.25mm turbid water particles.
5.3. Indoor test verification
In this paper, three sets of indoor muddy water seepage tests are conducted under the same conditions as the prior numerical simulation using a custom-designed muddy water seepage apparatus. The test apparatus is illustrated in Figure 22.
The preparation material for the muddy water consists of tailings sand particles sourced from the dry beach of the Lixigou tailings dam, while the filter layer is composed of spherical transparent glass beads. The particle sizes of the tailings sand were 0.5-1 mm for Test 1, 0.25-0.5 mm for Test 2, and 0.075-0.25 mm for Test 3. The results of the indoor tests are presented in Figure 23.
The results of the indoor tests align with those of the numerical simulations. In terms of their influence on the clogging of the filter layer, the variation in 0.075-0.25 mm tailings sand particles is minimal, whereas that in 0.25-0.5 mm particles is maximal. This indicates that, within a certain particle size range, smaller tailings sand particles have a greater impact on the permeability of the filter layer, although this influence diminishes beyond a certain threshold. This range can be assessed using the effective pore size of the filter layer, as analyzed in the previous section, so it will not be elaborated here; however, the variation in the permeability coefficient observed in laboratory tests is significantly greater than that derived from numerical simulations. For instance, in Tests 1 and 2, the permeability coefficient of the 15-20 cm filter layer is greater than that of the 10-15 cm layer at the beginning but is less at the end of the tests. The change in the permeability coefficient in Test 3 is also significantly greater than that of the numerical simulation results. This discrepancy arises from the differences in the number of tailings sand particles. In the numerical simulation, to maintain calculation speed, the number of tailings sand particles must be limited; otherwise, it would significantly hinder computational efficiency. The model for the 0.075-0.25 mm group, which contains the highest number of tailings sand particles, is limited to only 50,000 particles. In the indoor tests, the number of tailings sand particles is significantly greater, resulting in a different variation range for the permeability coefficient.
5.4. The influence of particle shape on the permeability coefficient of filter layer
The conclusion of the previous section indicates that the permeability coefficient of the spherical particle filter model is lower than that of the ellipsoidal particle filter model, consistent with findings in the literature [25]. This discrepancy is hypothesized to arise from the varying permeability coefficients of filter layer models based on different particle shape parameters. Consequently, this section simulates and validates the muddy water seepage tests of ellipsoidal filter layer models under varying particle shape parameters.
It has been confirmed that the particle shape parameter S exhibits a linear relationship with the ratio of the long to short axes, denoted by λ, within a reasonable range. For simplicity, this ratio will be referred to as λ in the following discussion.
Figure 24 shows the permeability coefficient of the model (without the inclusion of tailings sand particles) under different particle shape parameters, calculated using Darcy's formula. With the increase of the ratio of the long axis to the short axis λ, the permeability coefficient of the model initially decreases and then increases. When the λ value is between 1.3 and 1.4, the permeability coefficient of the model is minimized; at λ values of 1.7 to 1.8, the permeability coefficient reaches its maximum, and subsequently, the rate of change in permeability coefficient diminishes. The value of λ = 1.6 can be regarded as a boundary for the permeability coefficient of the model. Prior to this point, the permeability coefficient of each particle shape model is lower than that of spherical particles; beyond this threshold, it becomes greater.
The difference in the calculation results of the permeability coefficient under different particle shape parameters is illustrated by Figure 25. When the particle shape parameter is close to 1, as illustrated on the left side of Figure 25, the pore size of the filter layer decreases with decreasing particle shape parameters, corresponding to the reduction in the permeability coefficient shown in Figure 24. After reaching a certain critical value, as the particle shape parameter further decreases, as shown on the right side of Figure 25, the pores of the filter layer begin to increase gradually, which corresponds to the subsequent increase in permeability coefficient observed in Figure 24.
5.5. Prediction of the effect of particle shape on the pore structure of the filter layer
In section 2.2.3, the pore structure of the filter layer with different particle shapes under the loose arrangement of single particle size particles is examined. It is observed that under this arrangement, the porosity of the filter layer reaches its minimum at λ=1.2. Furthermore, for λ values less than 1.5, the porosity of the ellipsoidal particle filter layer is lower than that of the spherical particle filter layer. When λ exceeds 1.5, the porosity of the ellipsoidal particle filter layer surpasses that of the spherical particle filter layer, with an initial increase in growth rate, followed by a decrease.
In section 5.4, the seepage performance of the mixed tailings model with different particle sizes and varying particle shape filter layers is investigated. It is observed that the permeability coefficient of the filter layer model is minimized when λ is between 1.3 and 1.4. For λ values less than 1.6, the permeability coefficient of the ellipsoidal particle filter layer model is lower than that of the spherical particle filter layer. Conversely, for λ values greater than 1.6, the permeability coefficient of all particle shape filter layer models exceeds that of the spherical particle filter layer. When λ is between 1.7 and 1.8, the permeability coefficient of the filter layer model reaches its maximum, followed by a deceleration in the rate of change of the permeability coefficient.
The conclusions of these two sections are consistent; however, the λ values differ for two reasons. In section 2.2.3, a single particle size filter layer is investigated, while in section 5.4, a filter layer with a certain particle size range is analyzed. Second, the ellipsoidal particles in Section 5.4 are approximated using spherical particles, which differs from the ellipsoidal particles described in Section 2.2.3.
In these two sections, the shape of ellipsoidal particles is examined and described by λ; however, for various atypical particles (such as those in Figure 10), this representation is inadequate. Thus, these particles are characterized using the particle shape parameter S introduced in Section 3.3.
A comprehensive analysis of the contents of these two sections reveals that the particle shape does have an impact on the pore structure. It is reasonable to speculate that irregular natural particles of various shapes may also influence the pore structure of the filter layer. With the decrease of the particle shape parameter S (corresponding to the increase of the ratio of the long axis to the short axis λ), the porosity of the filter layer initially decreases and subsequently increases, although the rate of increase gradually diminishes. There exists a critical particle shape parameter, Sa. Under the same particle arrangement, when S is less than Sa, the pore size of the ellipsoidal filter layer is smaller than that of the corresponding spherical filter layer. Conversely, when S exceeds Sa, the pore size of the ellipsoidal filter layer becomes larger than that of the corresponding spherical filter layer.
6. Conclusion
This paper primarily investigates the impact of particle shape on the pore structure and filtration characteristics of the filter layer. This paper primarily presents the following conclusions:
(1) The effective pore radius of the ellipsoidal particles in various spatial arrangements was calculated, and the relationship between the porosity of the filter layer and the ratio of the major to minor axes of the ellipsoidal particles in a loosely arranged configuration was established.
(2) A method for ellipsoidalizing arbitrarily shaped particles is presented, and the particle shape parameter S is defined to characterize the shape of these particles.
(3) The relationship between the particle shape parameter S of ellipsoidal particles and the ratio of the major axis to the minor axis λ is summarized. Within a certain range, the particle shape parameter S is approximately linear with respect to the ratio of the major axis to the minor axis λ.
(4) The basis and construction method for creating ellipsoidal particles in particle flow software are presented. In conjunction with the shape of the actual tailings particles from Jinduicheng Molybdenum Industry, the particle shape was analyzed, and the foundational parameters for the construction of ellipsoidal particles were provided.
(5) In the particle flow software, the differences between spherical particles and ellipsoidal particles in the muddy water seepage simulation tests were compared and analyzed. The analysis revealed that the particle shape influenced the permeability coefficient of the filter layer model. As the ratio of the major axis to the minor axis λ increases, the permeability coefficient of the filter layer model first decreases and then increases, as verified by laboratory tests.
(6) Through the analysis of the pore structure of spherical and ellipsoidal particles in this paper, the relationship between the pore structure and the particle shape parameters of the irregular natural particle filter layer with arbitrary shapes is predicted. It is proposed that there exists a boundary particle shape parameter Sa. Under the same particle arrangement, when S is less than Sa, the pores of the filter layer are smaller than those of the corresponding spherical particle filter layer. When S is greater than Sa, the pore size of the filter layer is larger than that of the corresponding spherical particle filter layer.
Author Contributions
Conceptualization, W.B; Methodology, W.B; Software, W.B; Visualization. W.B; Writing – original draft, W.B; Funding acquisition, F.D; Project administration, F.D; Supervision, F.D; Validation, F.D; Writing – review and editing, F.D; Investigation, W.Z; Resources, Y.Y; Data curation, H.X; Formal analysis, J.G.
Funding
This work was supported by Supported by the National Natural Science Foundation of China(Grant Nos:51979225;52009107;52309172);Shaanxi Key R & D Program Key Industry Innovation Chain ( Group ) Project(Grant No:2022ZDLSF07-02);Shaanxi Natural Science Basic Research Program Youth Project(Grant No:2020JQ-627);China Postdoctoral Science Fund Project(Grant No:2019M663943XB).The financial support is gratefully acknowledged.
Data Availability Statement
The data presented in this study are available on request from the corresponding author.
Conflict of interest
The authors declares that they do not have conflict of interests.
References
- Mays, D.C. Contrasting Clogging in Granular Media Filters, Soils, and Dead-End Membranes. J Environ Eng-Asce 2010, 136, 475–480. [Google Scholar] [CrossRef]
- Dang, F.-N.; Liu, Y.-H.; Chen, J.-Q.; Zhen, Z.-A.; Wang, Z.-Y. Muddy water seepage theory and its engineering application. Sci China Ser E 2006, 1029–1036. [Google Scholar] [CrossRef]
- Indraratna, B.; Raut, A.K. Enhanced Criterion for Base Soil Retention in Embankment Dam Filters. J Geotech Geoenviron 2006, 132, 1621–1627. [Google Scholar] [CrossRef]
- To, P.; Agius, D.; Cussen, L. Influence of relative density of the granular base soil on filter performance. Acta Geotech 2020, 15, 3621–3627. [Google Scholar] [CrossRef]
- Delgado-Ramos, F.; Poyatos, J.M.; Osorio, F. Internal Erosion of Clayey Soils Protected by Granular Filters. Houille Blanche 2012, 98, 42–47. [Google Scholar] [CrossRef]
- Srivastava, A.; Babu, G.L.S. System reliability analysis of granular filter for protection against piping in dams. IOP Conference Series: Earth Env Sci T R So 2015, 26, 012055. [Google Scholar] [CrossRef]
- Li, S.-B.; Wang, C.-M.; Wang, G.-C.; Ma, J.-Q. Clogging types distinguishing of coarse-grained soil and determination of optimal range of clogging grain size. J Hydraul Eng-Asce 2013, 44, 1217–1224. [Google Scholar] [CrossRef]
- Liu, J.; Xie, D.-S. Design principles and guidelines of filters. Chin J Geotech Eng 2016, 39, 609–616. [Google Scholar] [CrossRef]
- Mao, C.-X.; Duan, X.-B.; Feng, Y.-B. Study on piping and filters: Part II of filters. Rock Soil Mech 2005, 680–686. [Google Scholar] [CrossRef]
- Hu, D.-B.; Lu, S.-Q.; Wang, Z. Design Criteria for Permeability of Geotextile Filters. Chin J Geotech Eng 1994, 93–102. [Google Scholar]
- Dong, Z.-L.; Cheng, Y.P.; Tong, C.-X.; Liu, H.; Zhang, S.; Sheng, D. DEM modelling of particle crushing of single carbonate sand using the improved bonded particle model. Powder Technol 2024, 445, 120121. [Google Scholar] [CrossRef]
- Johanson, K. Effect of particle shape on unconfined yield strength. Powder Technol 2009, 194, 246–251. [Google Scholar] [CrossRef]
- Kock, I.; Huhn, K. Influence of particle shape on the frictional strength of sediments — A numerical case study. Sediment Geol 2007, 196, 217–233. [Google Scholar] [CrossRef]
- Khan, R.; Latha, G.M. Integrated Digital Image Analyses for Understanding the Particle Shape Effects on Sand-Geomembrane Interface Shear. Int J Geosynth Groun 2023, 9. [Google Scholar] [CrossRef]
- Baten, B.; Garg, N. Introducing Particle Shape Metric (PSM): A fundamental parameter that encapsulates role of aggregate shape in enhancing packing and performance. Cement Concrete Res 2024, 182, 107558. [Google Scholar] [CrossRef]
- Shahid, M.; Usman, K. Kinetics of suspended particles with different shapes interacting in a fluid channel. Comput Part Mech 2023, 11, 1257–1269. [Google Scholar] [CrossRef]
- Xiong, H.; Zhang, Z.; Bao, X.; Wu, H.; Yin, Z.; Chen, X. Micro-mechanical analysis of particle shape effect on suffusion of gap-graded soils. Comput Geotech 2024, 165, 105925. [Google Scholar] [CrossRef]
- Wu, M.; Fan, Y.; Wang, J.; Yin, Z.-Y. Modeling a Flexible Membrane for Triaxial Tests with Coupled FDM-DEM: Considering Realistic Particle Shape Effects. Int J Geomech 2024, 24. [Google Scholar] [CrossRef]
- Abou-Chakra, H.; Baxter, J.; Tüzün, U. Three-dimensional particle shape descriptors for computer simulation of non-spherical particulate assemblies. Adv Powder Technol 2004, 15, 63–77. [Google Scholar] [CrossRef]
- Tu, X.-B.; Wang, S.-J. Particle Shape Descriptor in Digital Image Analysis. Chin J Geotech Eng 2004, 659–662. [Google Scholar]
- Dang, F.-N.; Liu, H.-W.; Wang, X.-W.; Xue, H.-B.; Ma, Z.-Y. Empirical Formulas of Permeability of Clay Based on Effective Pore Ratio. Chin J Rock Mech Eng 2015, 34, 1909–1917. [Google Scholar] [CrossRef]
- Liu, H.-W.; Dang, F.-N.; Tian, W.; Mao, L.-M. Prediction of Permeability of Clay by Modified Kozeny-Carman Equation. Chinese Journal of Geotechnical Engineering 2021, 43, 186–191. [Google Scholar]
- Zhang, J.-F.; Ye, J.-B.; Chen, J.-S.; Li, S.-L. A Preliminary Study of Measurement and Evaluation of Breakstone Grain Shape. Rock Soil Mech 2016, 37, 343–349. [Google Scholar] [CrossRef]
- Liu, Q.-B.; Xiang, W.; Bodhania, M.; Cui, D.-S. Study of Particle Shape Quantification and Effect on Mechanical Property of Sand. Rock Soil Mech 2011, 32, 190–197. [Google Scholar] [CrossRef]
- Peng, J.-Y.; Zhang, J.-F.; Shen, Z.-F.; Ye, J.-B. Effect of Grain Shape on Pore Characteristics and Permeability of Coarse-Grained Soil. Rock Soil Mech 2019, 41, 592–600. [Google Scholar] [CrossRef]
Figure 5.
Ellipsoid Particles in a Loose Arrangement.
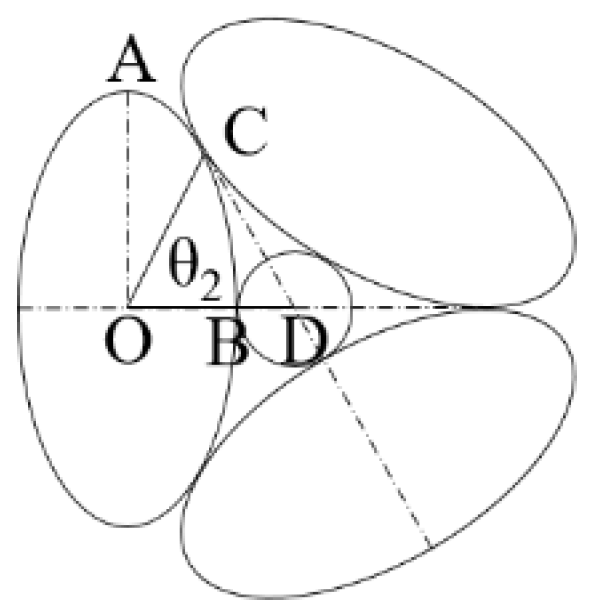
Figure 6.
The relationship between long and short axis ratio and porosity under loose arrangement.
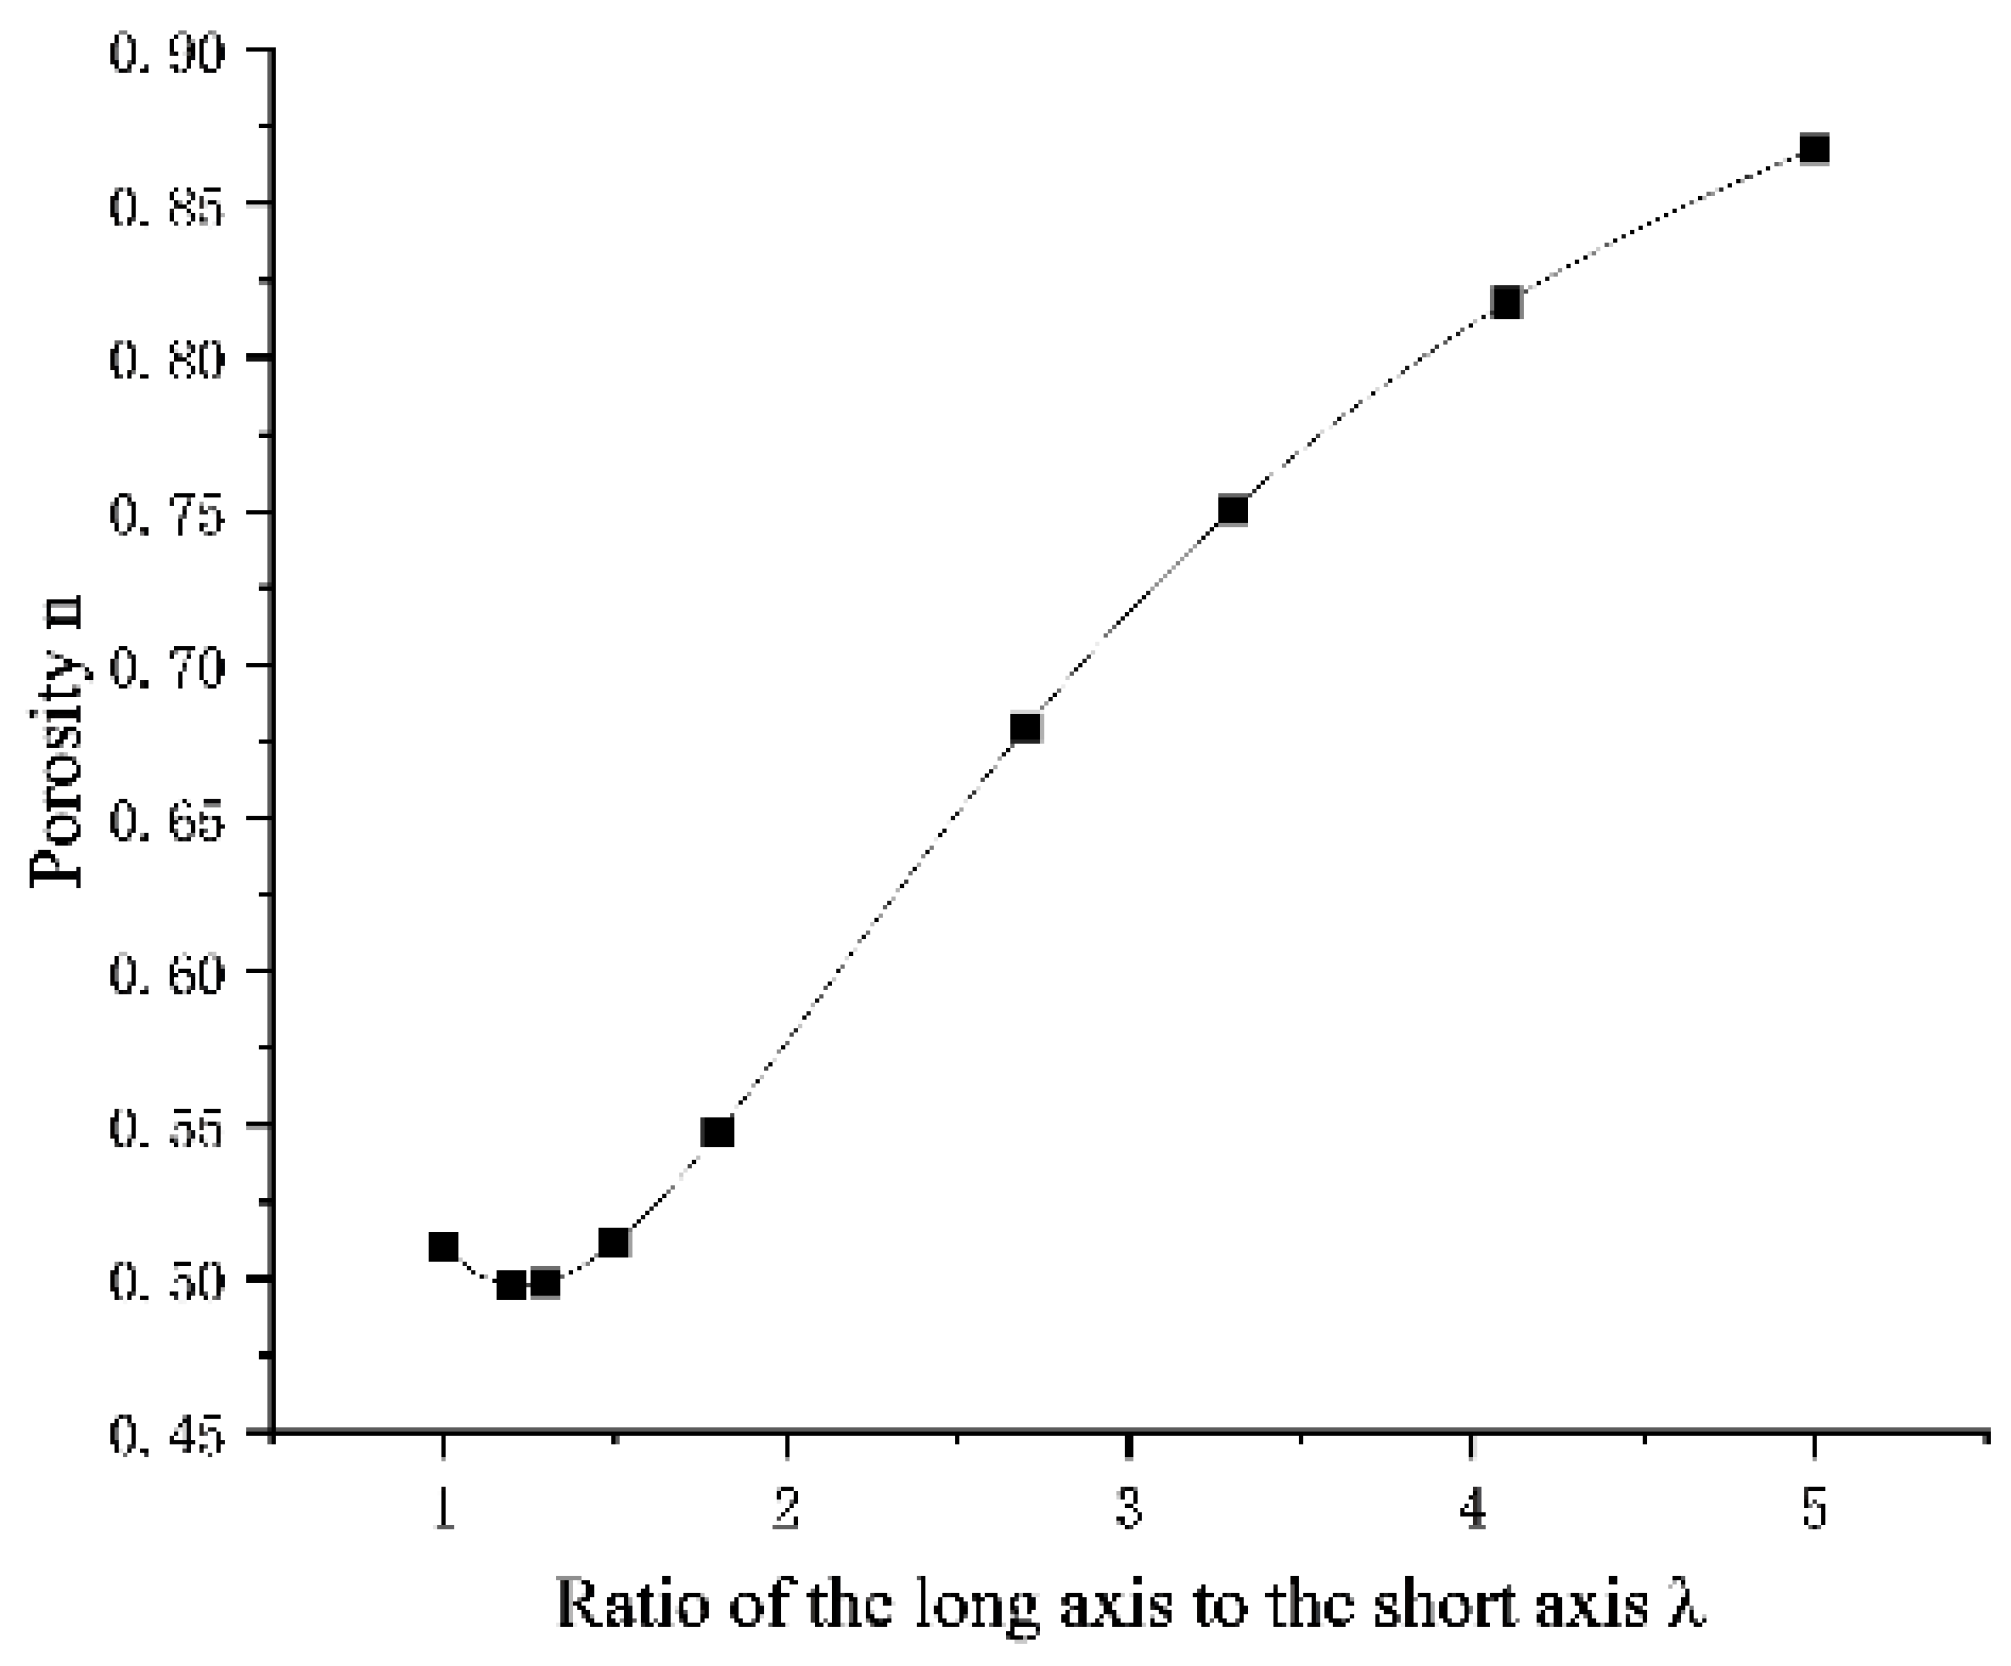
Figure 7.
Ellipsoid Particles in a Close-Packed Arrangement.
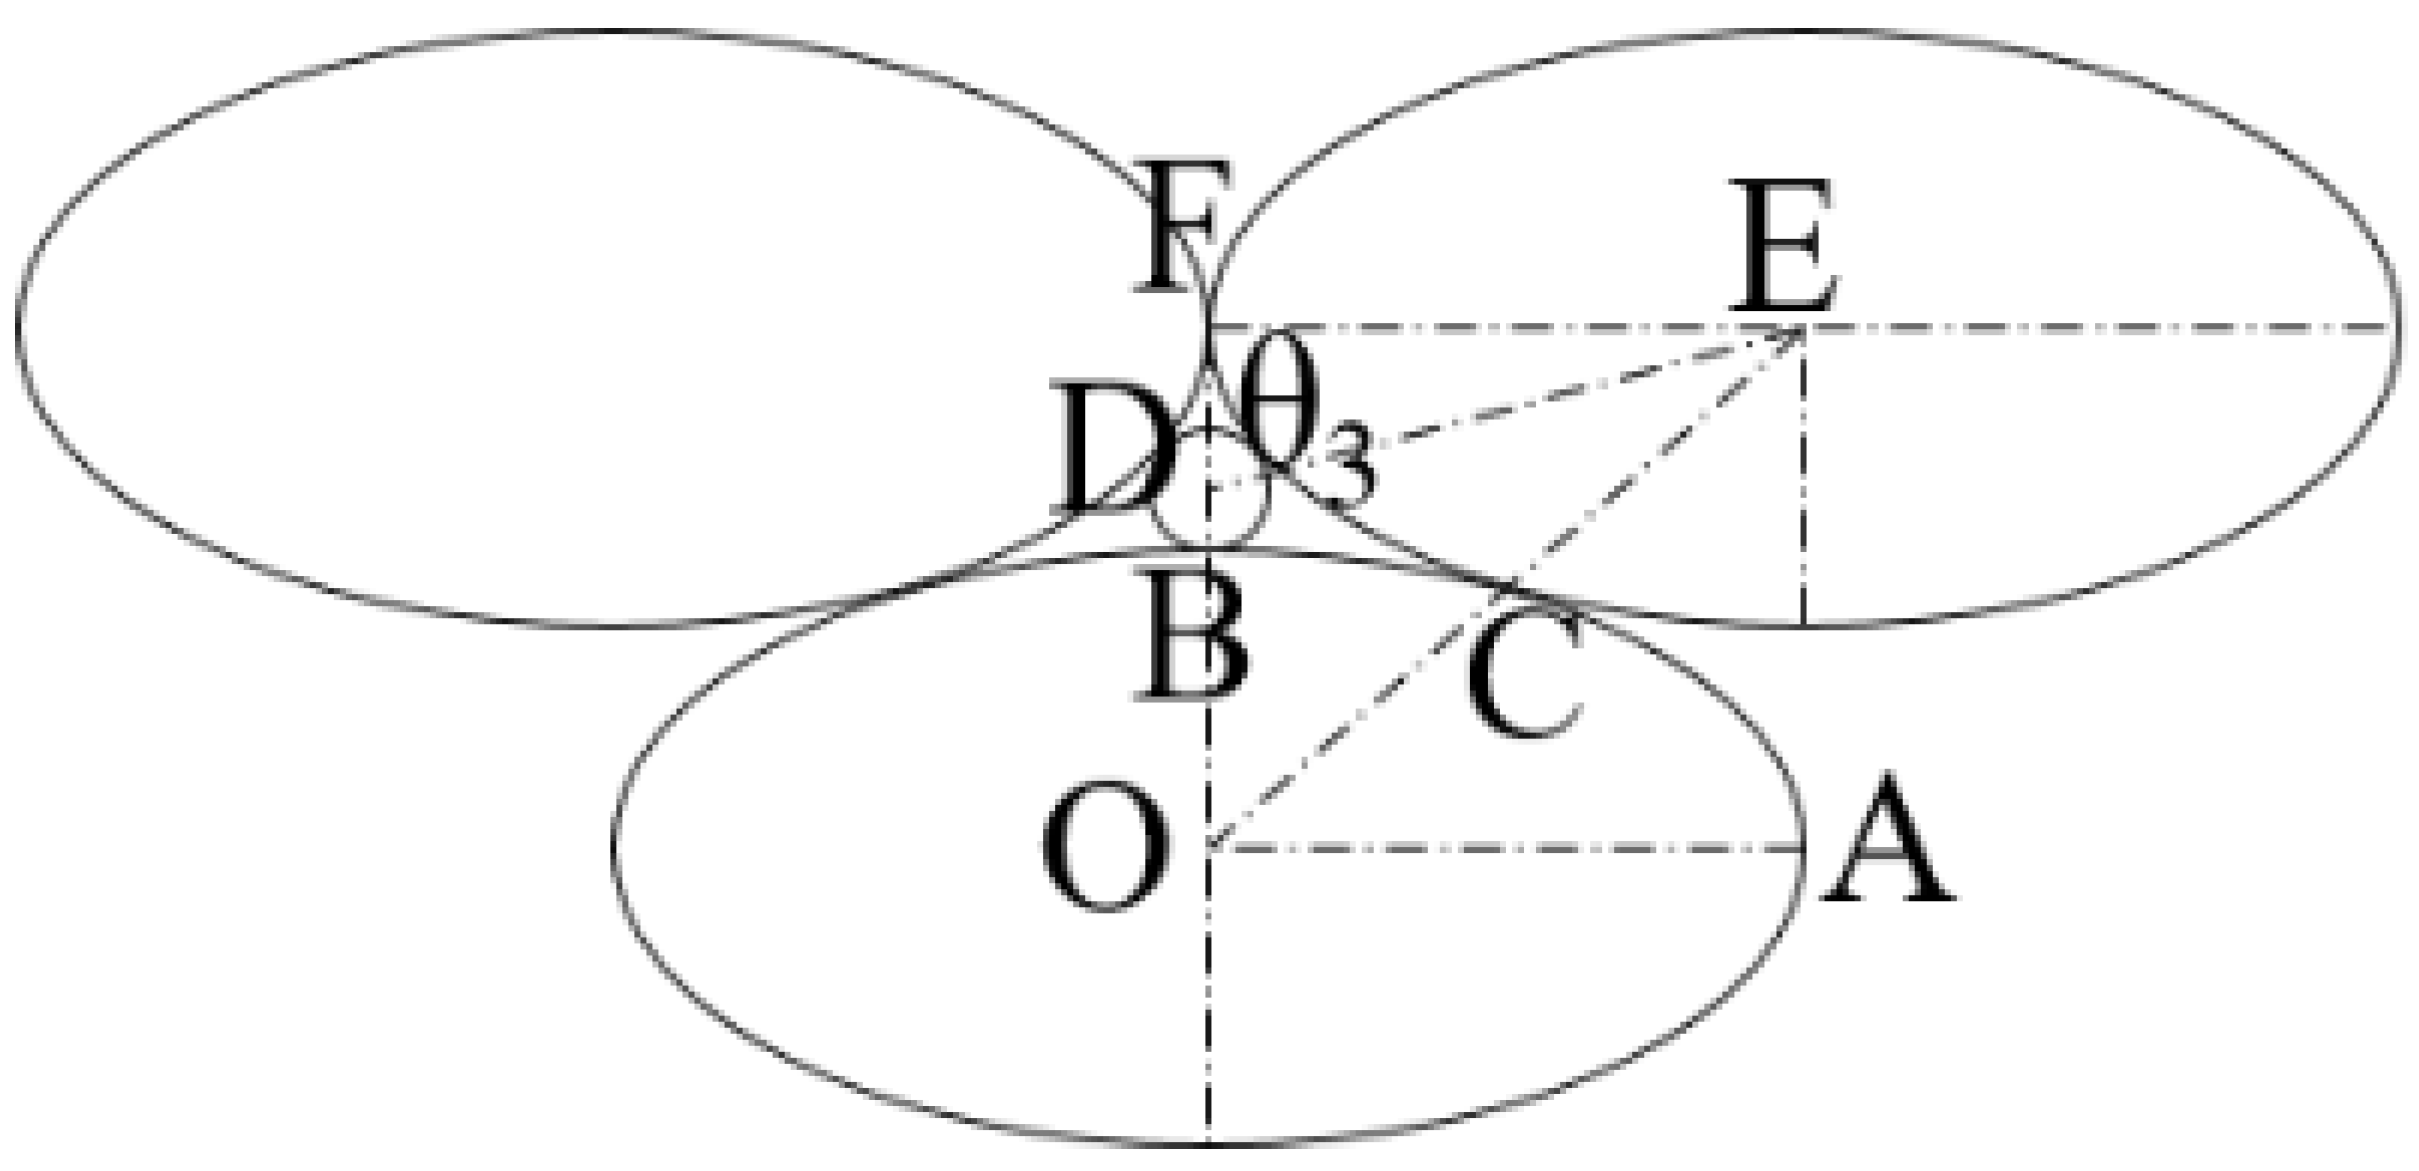
Figure 8.
The particle shape parameter S corresponding to the ellipsoid under different λ.
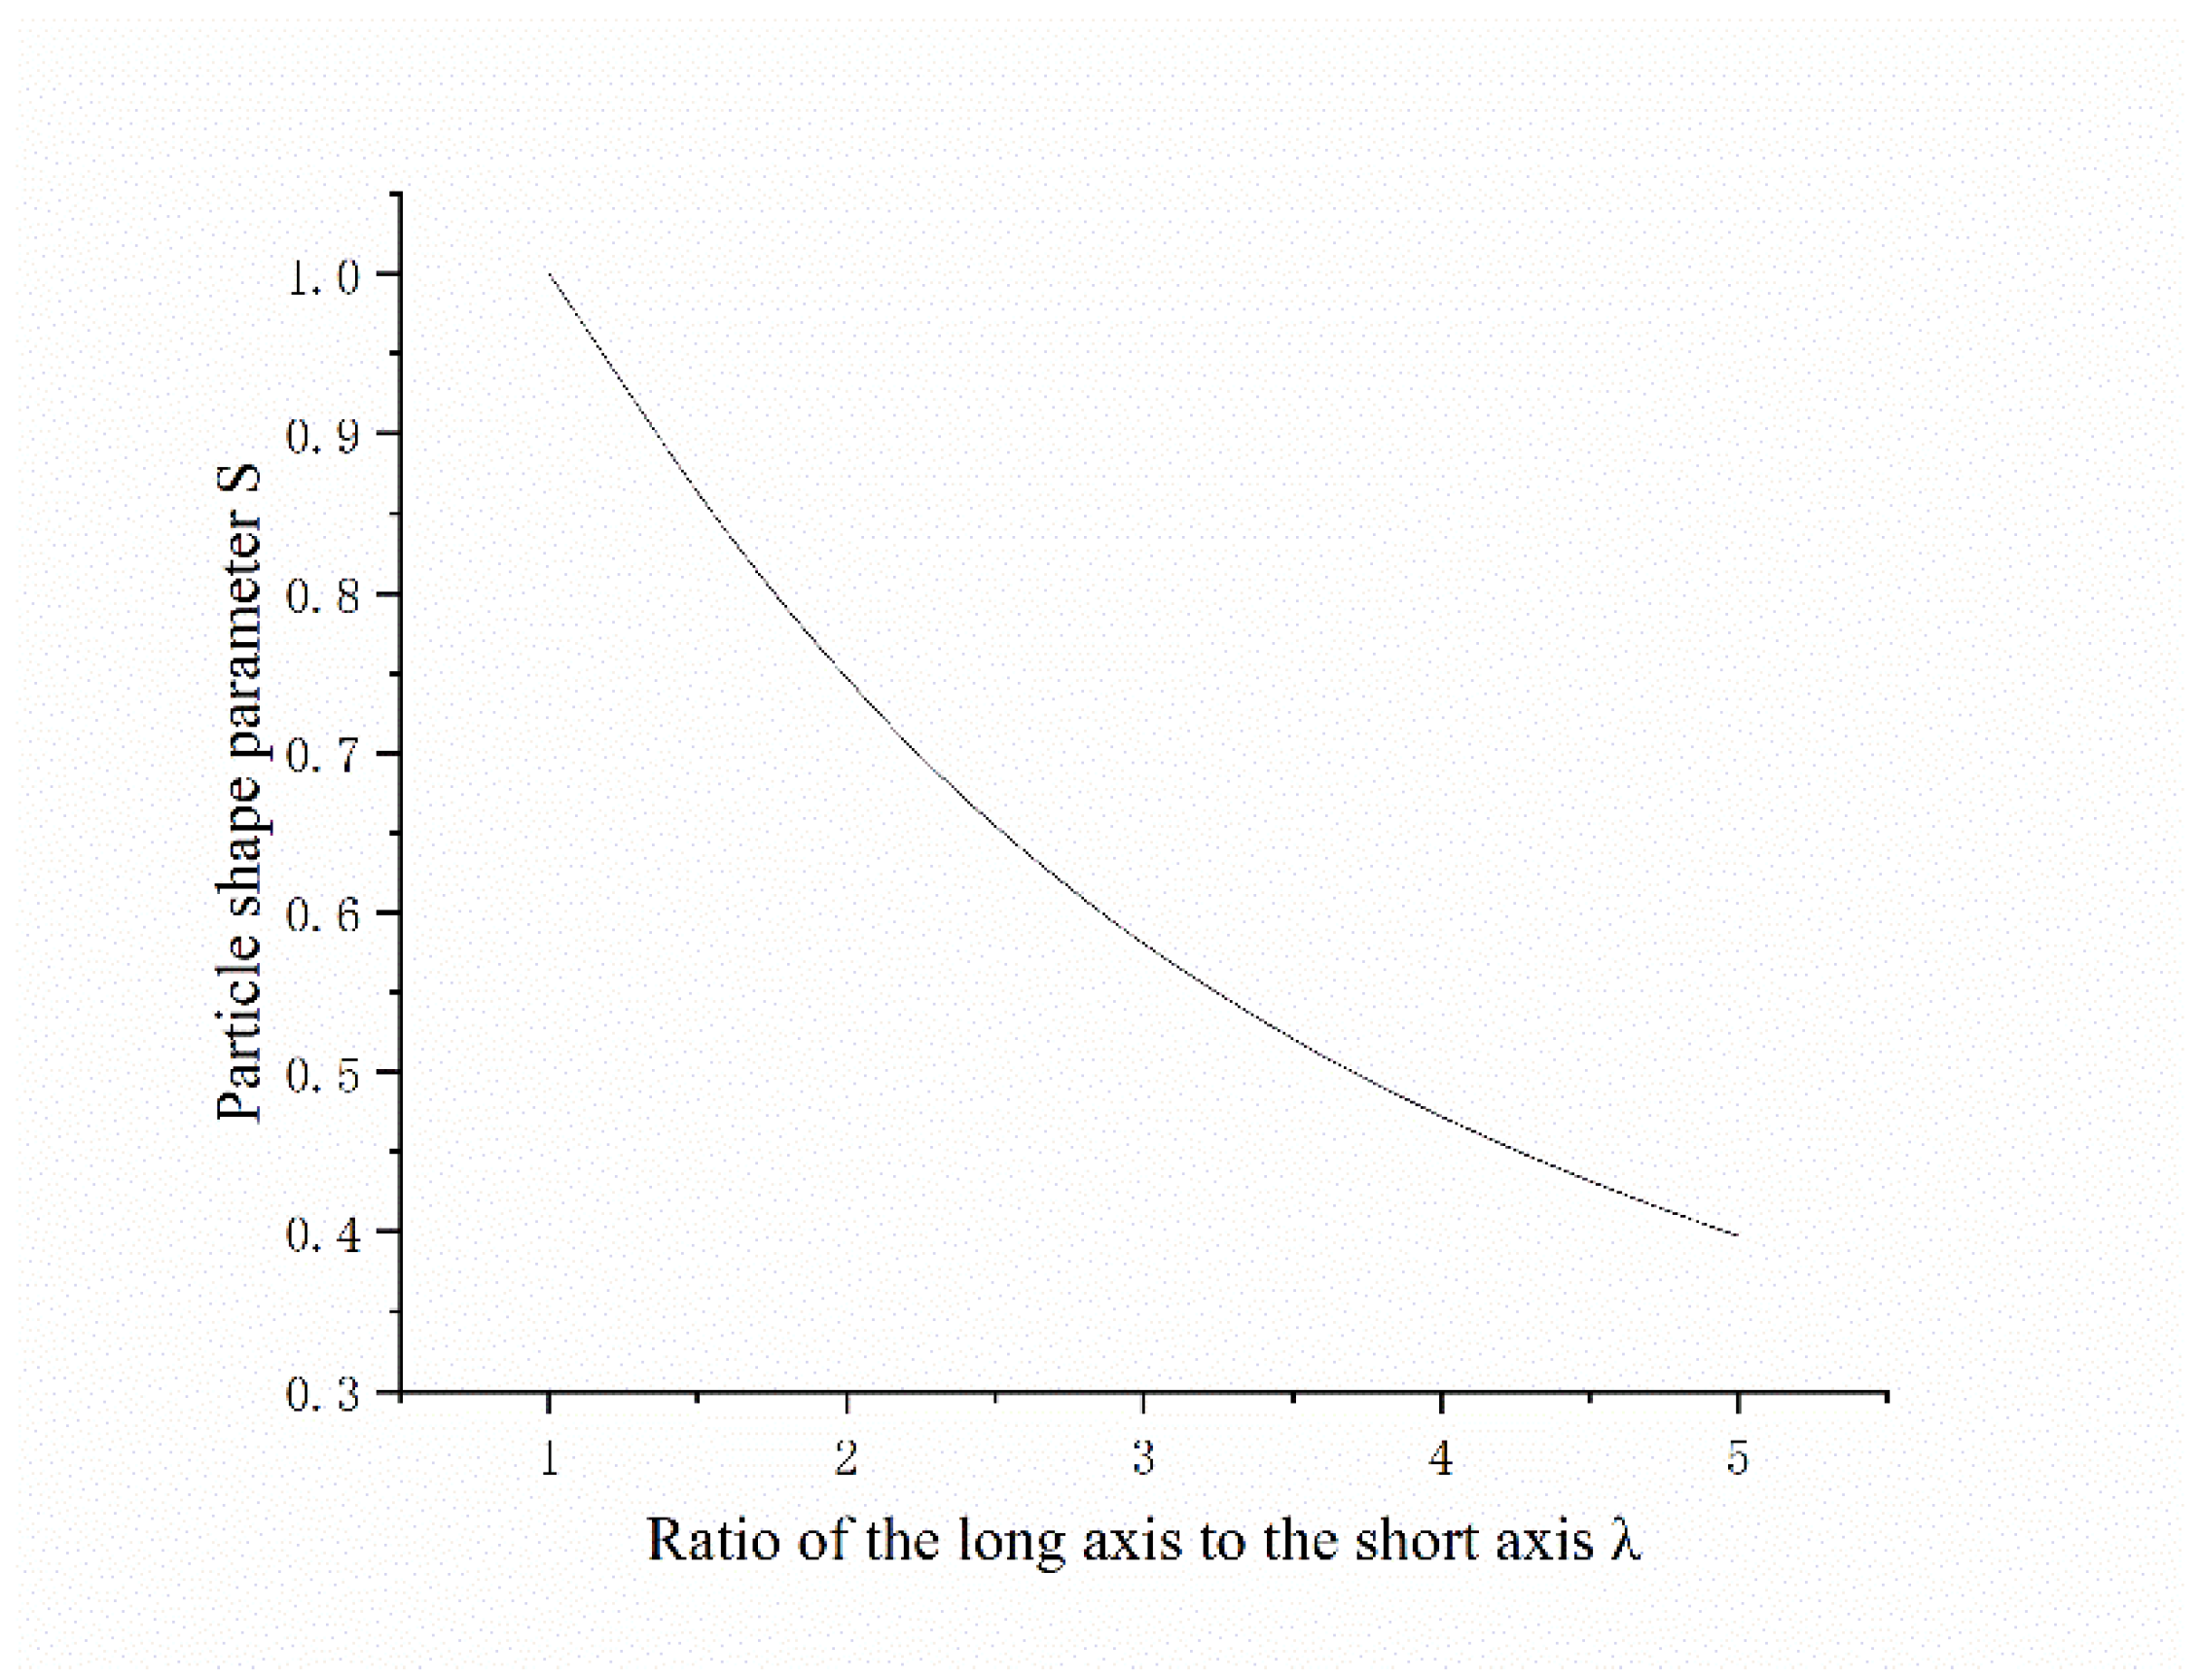
Figure 9.
Construction of approximate ellipsoid model in PFC.
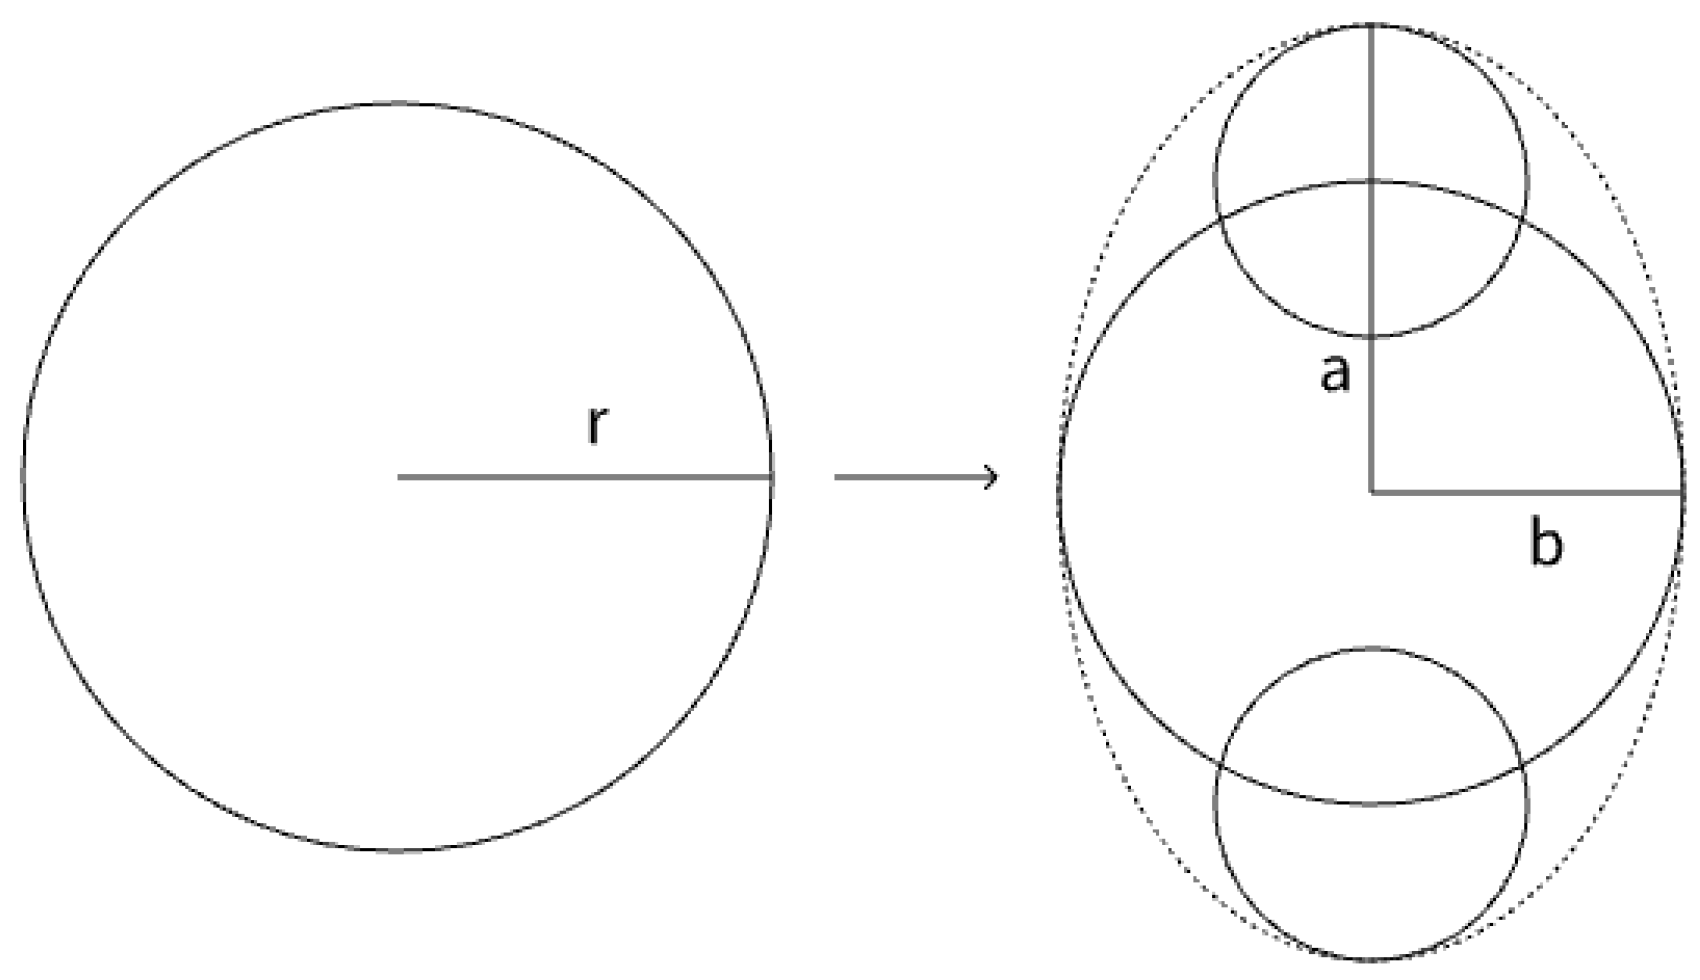
Figure 10.
Image of 2-5mm particles.
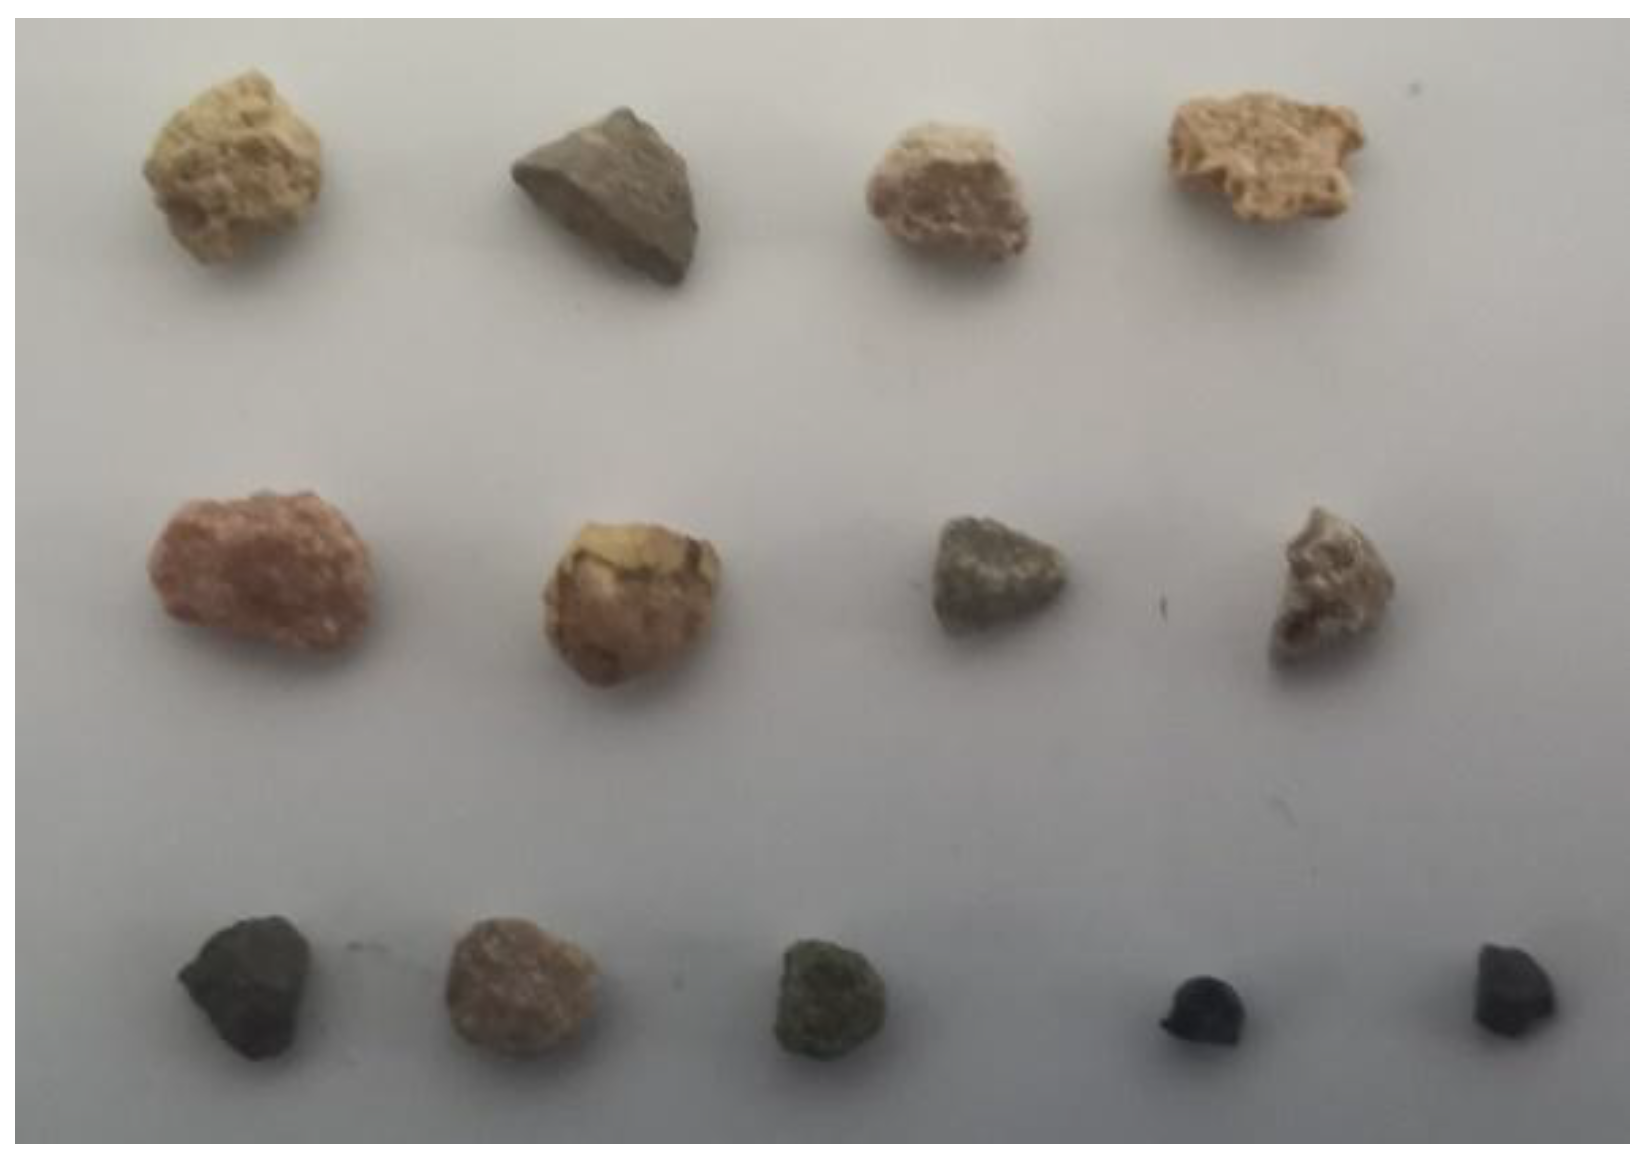
Figure 11.
Particle image numbering and information processing.
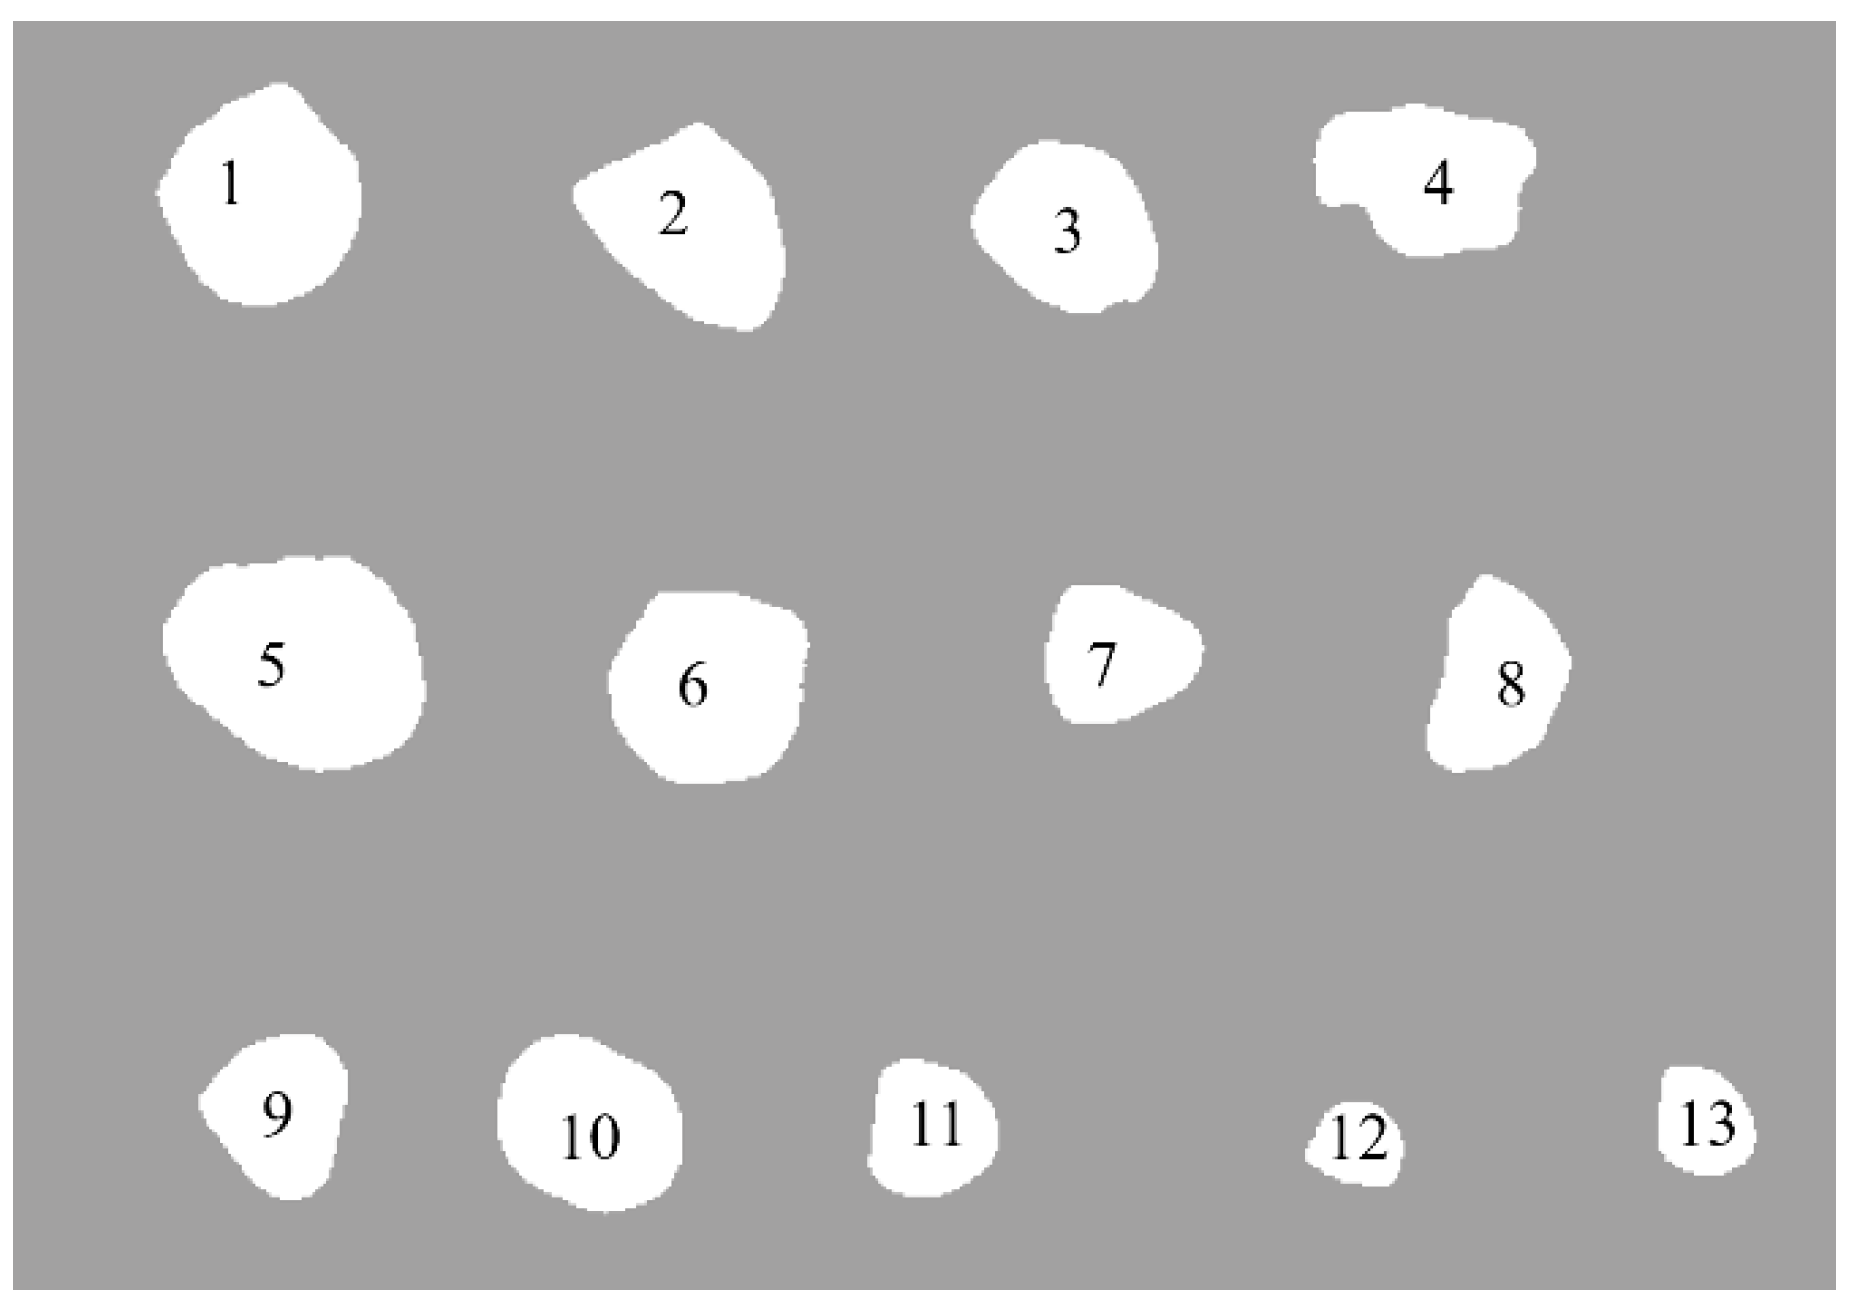
Figure 12.
Particle shape parameters corresponding to different λ values.
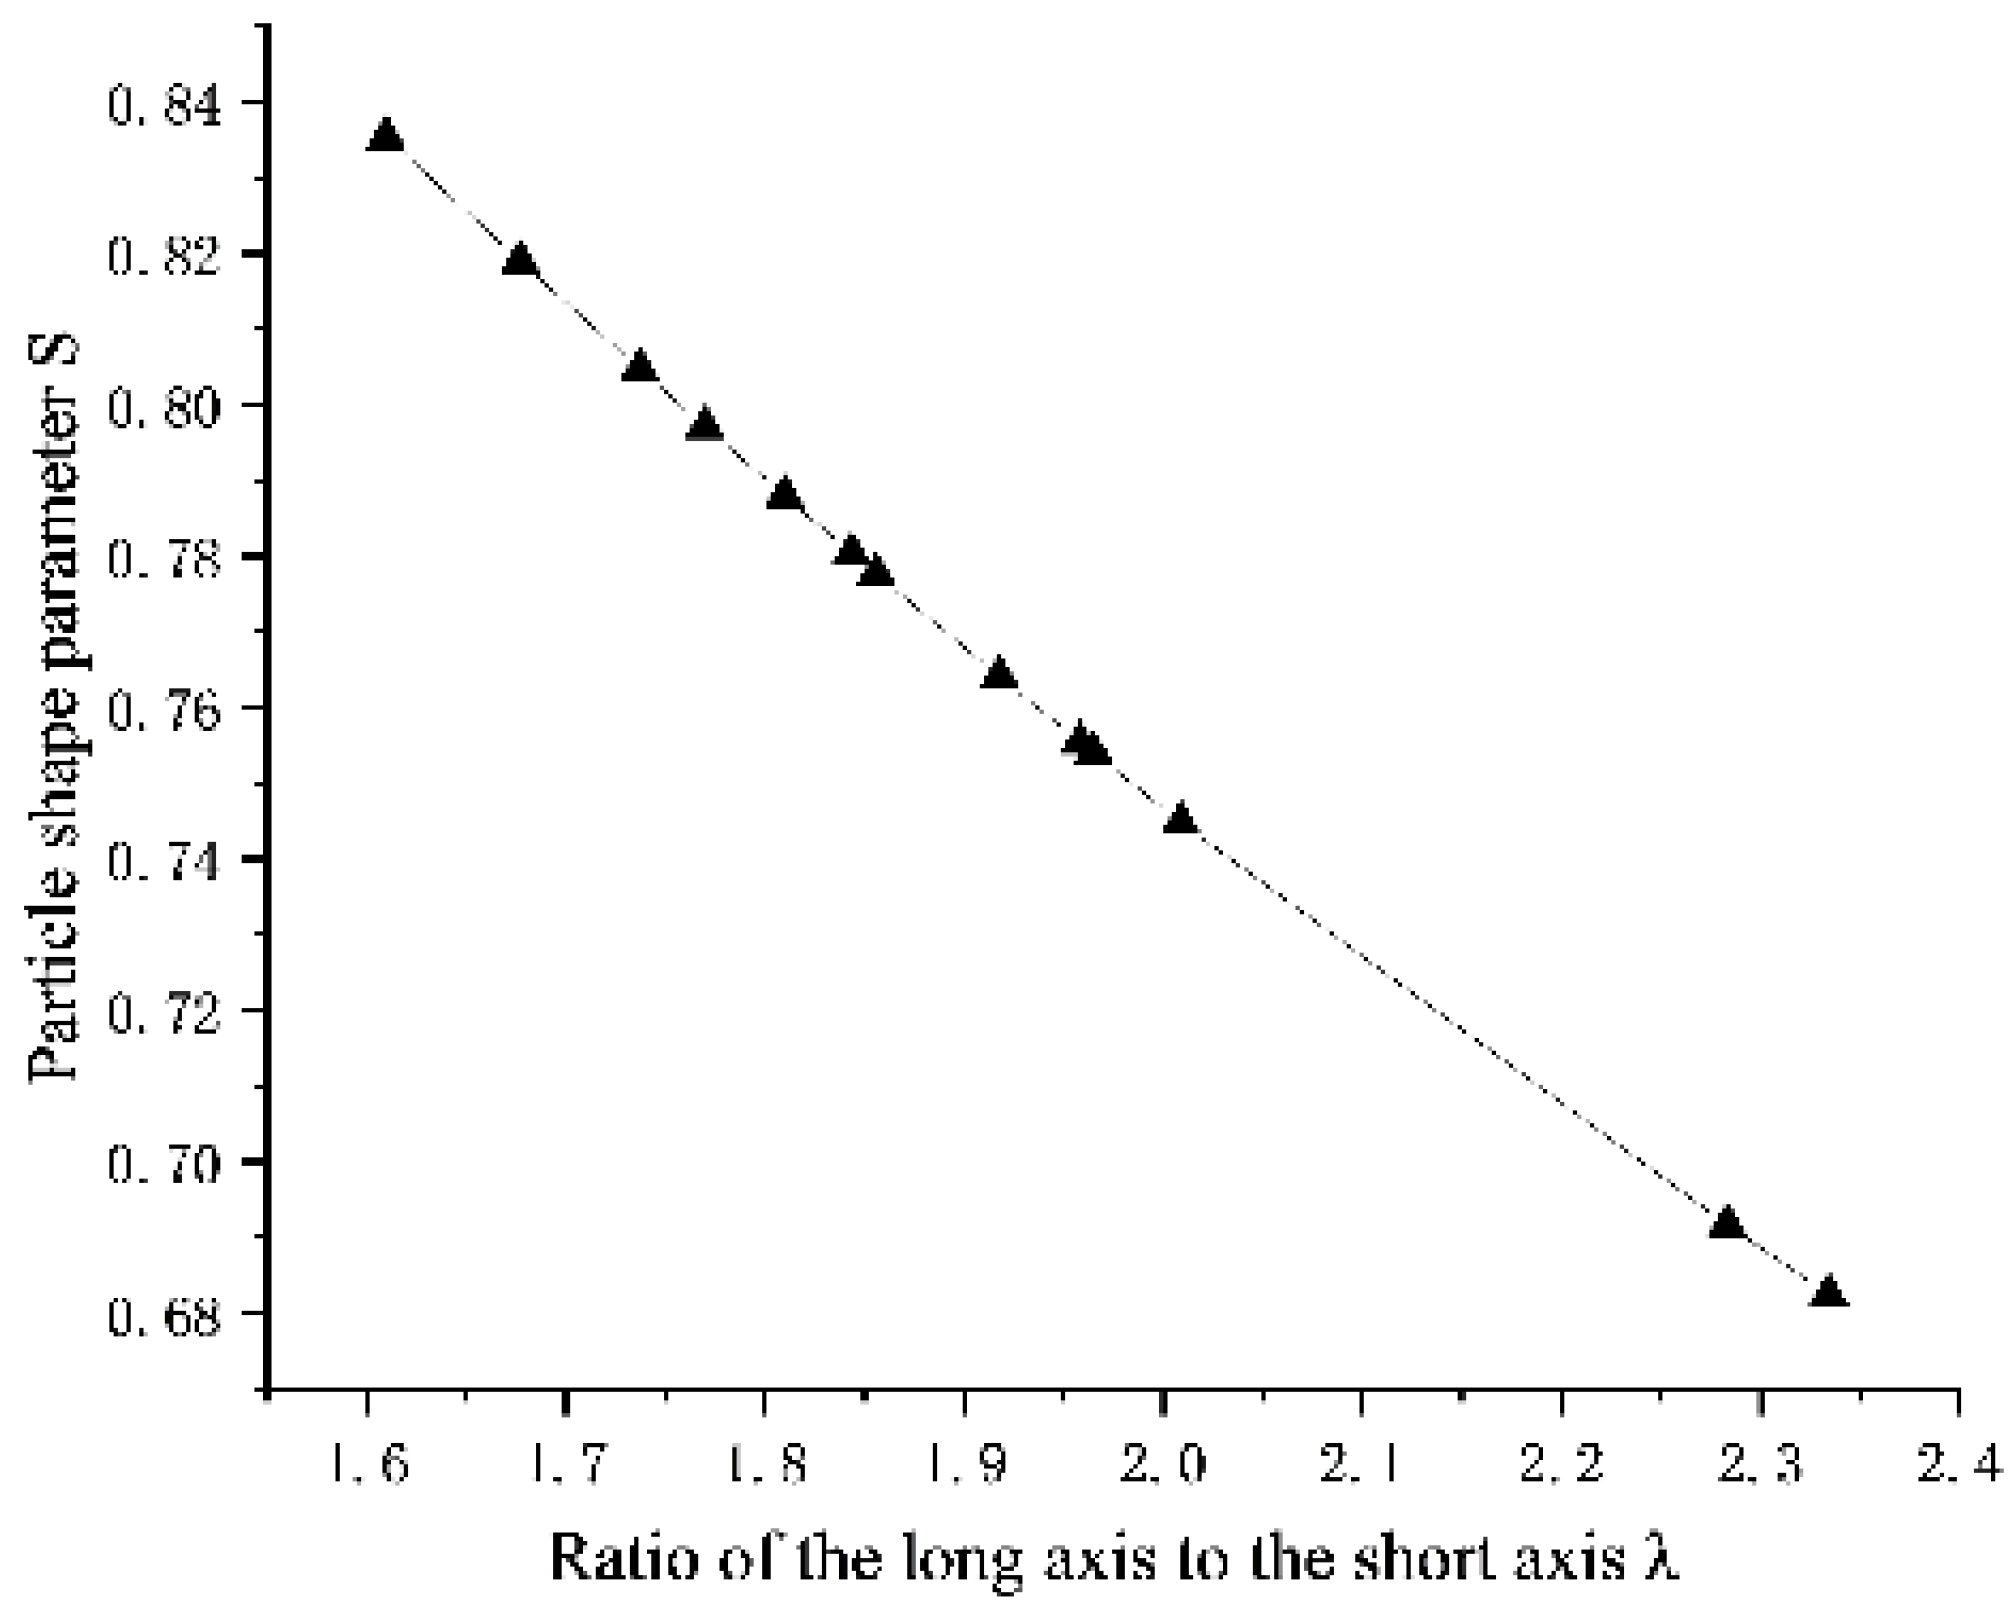
Figure 13.
Infiltration of 0.5-1mm turbid water particles.
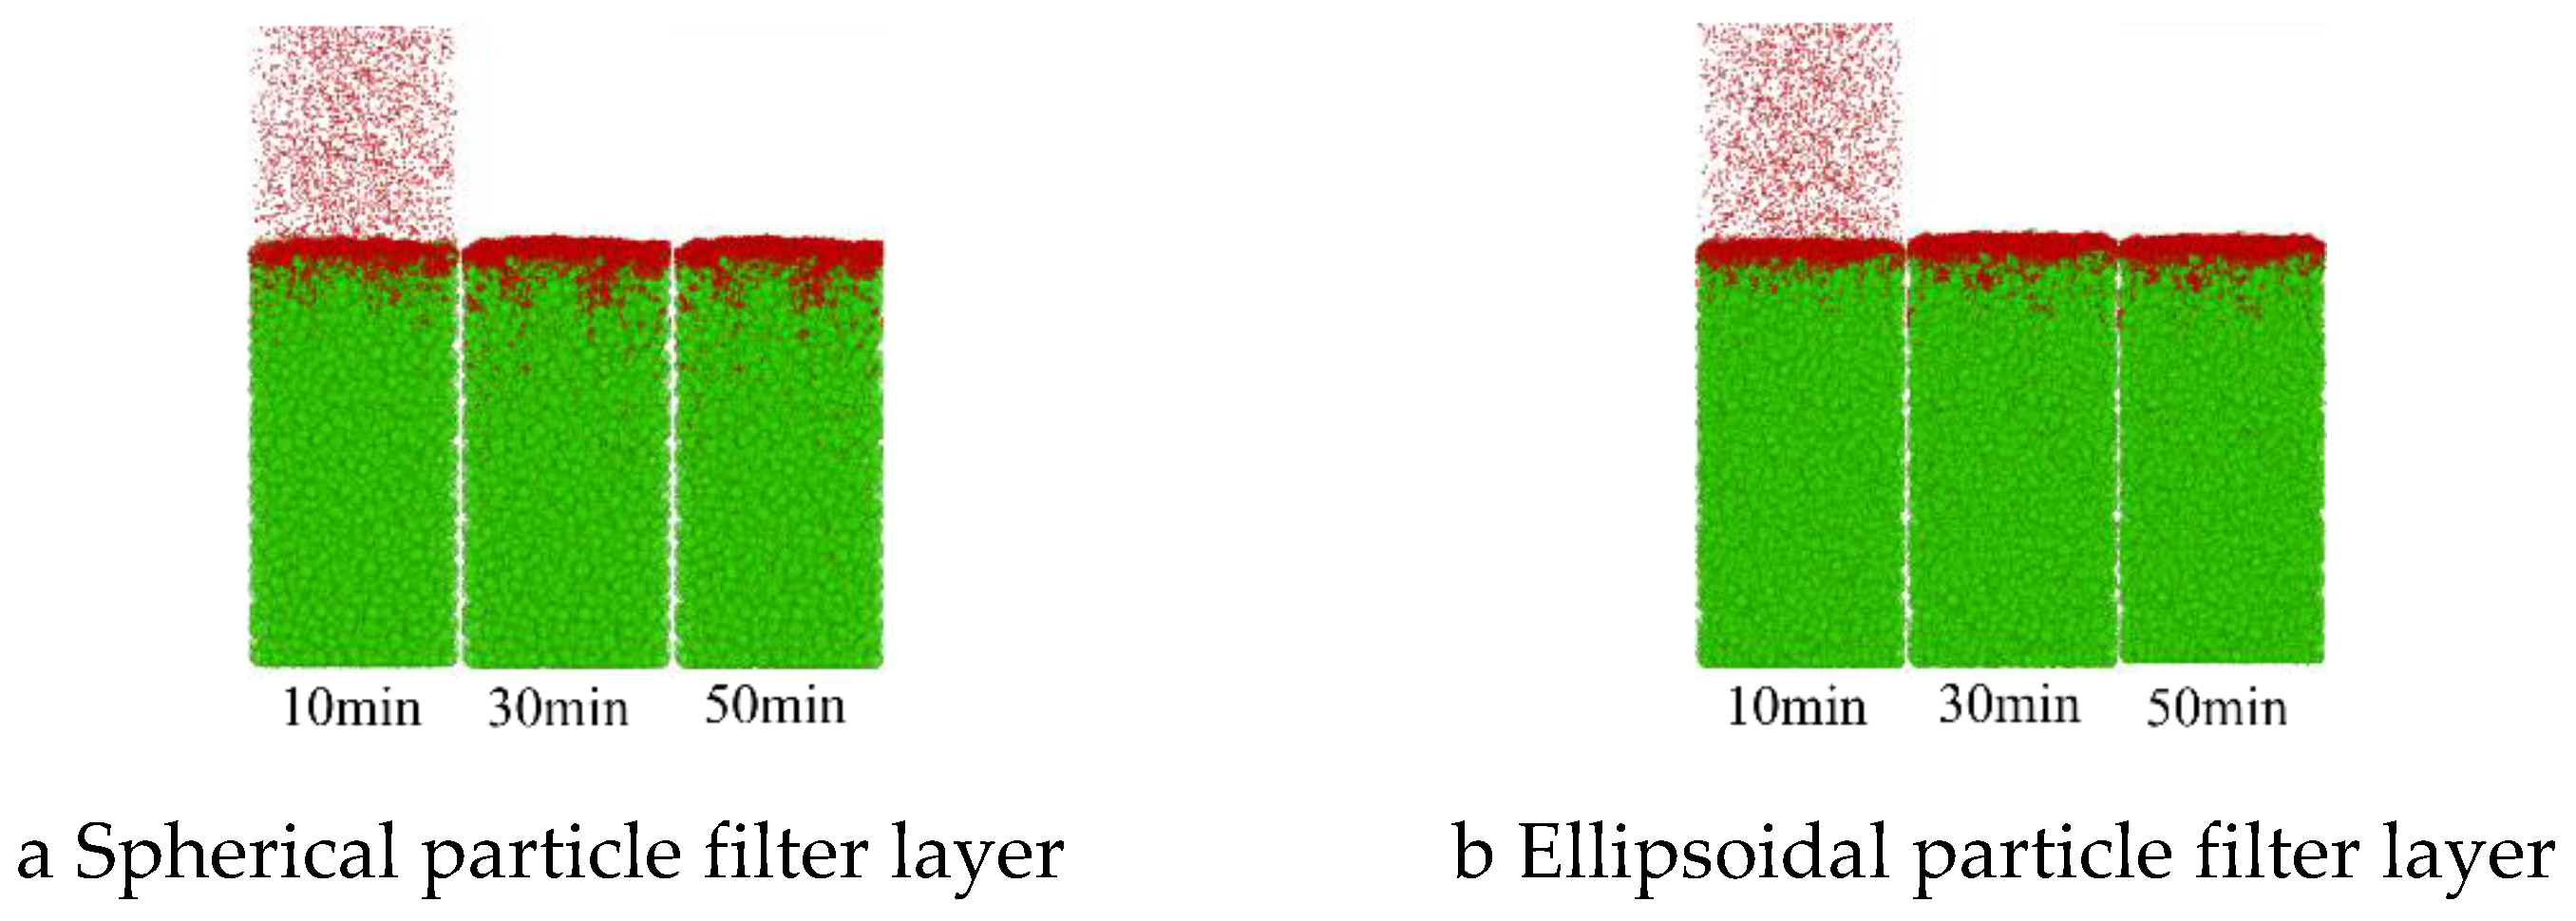
Figure 14.
Infiltration of 0.25-0.5mm turbid water particles.
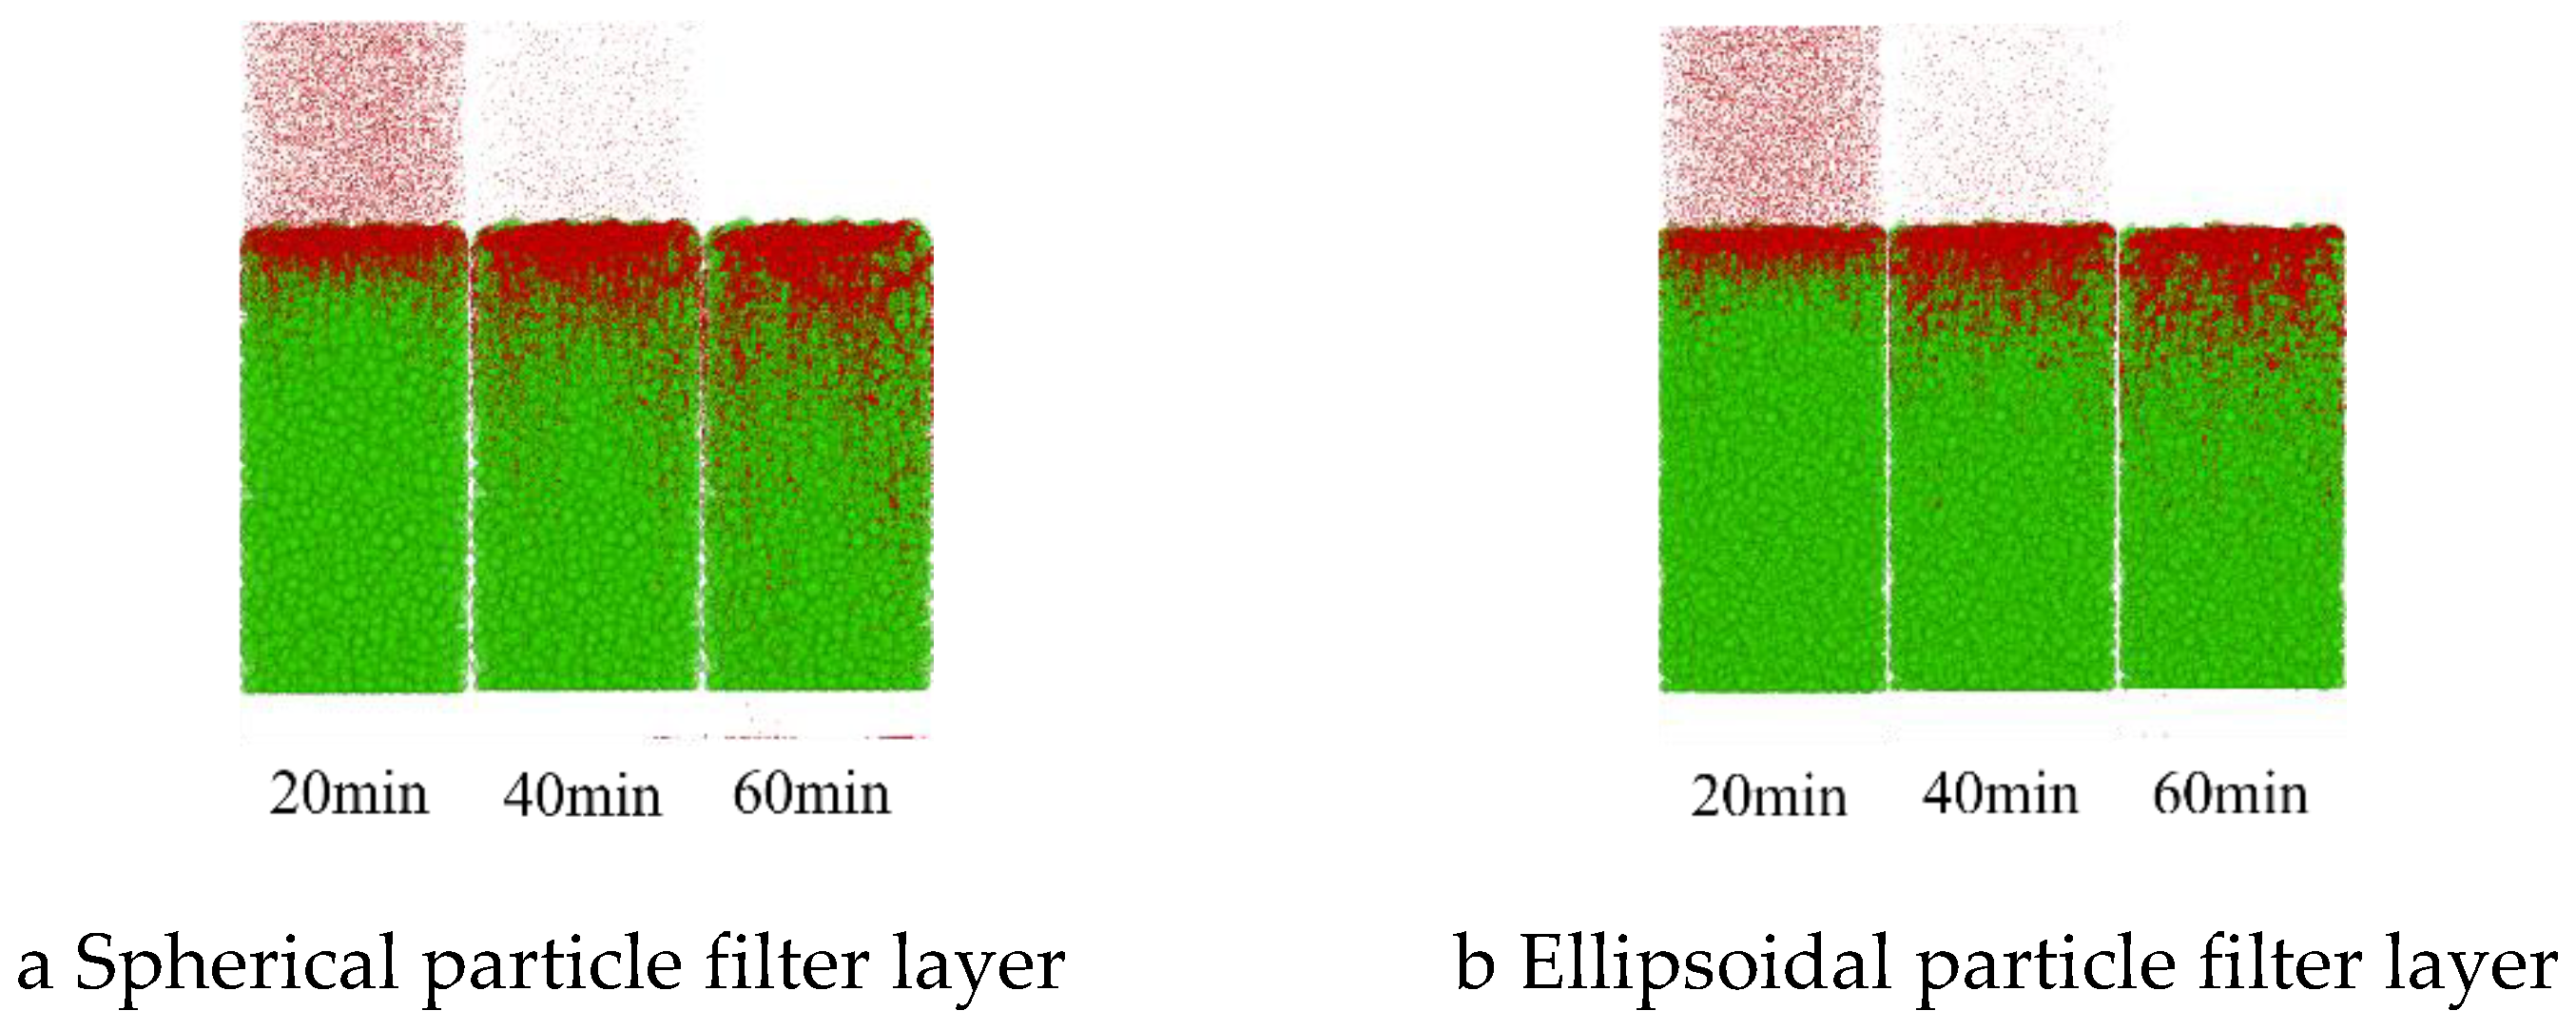
Figure 15.
Infiltration of 0.075-0.25mm turbid water particles.
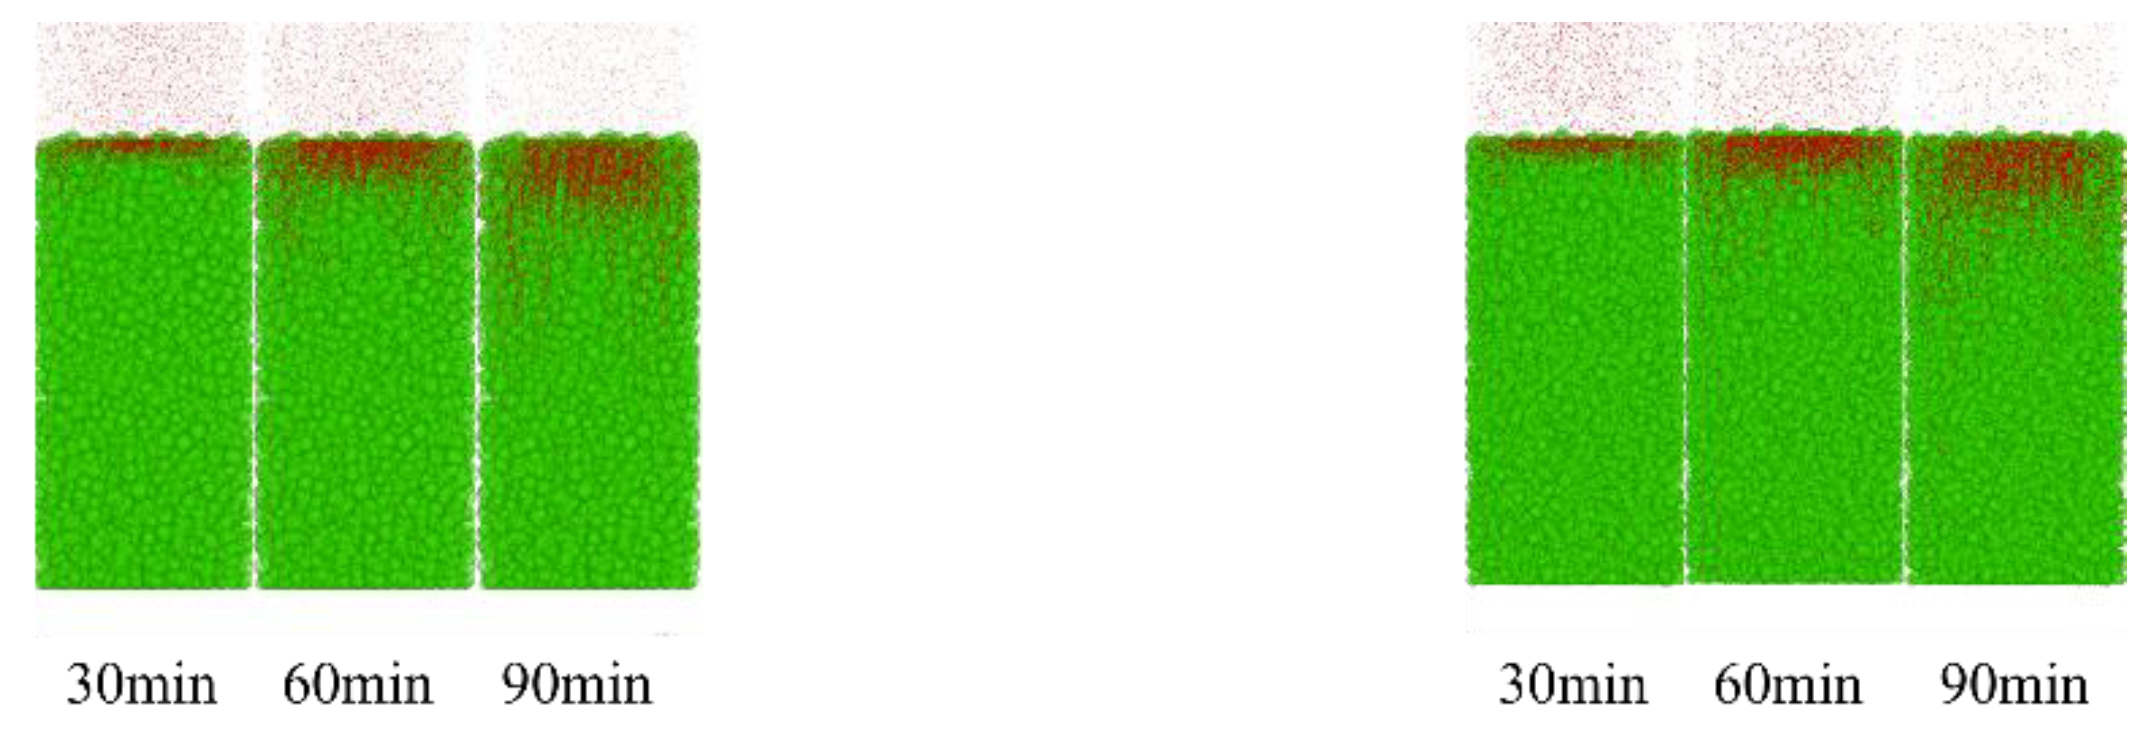
Figure 22.
Muddy water seepage test instrument.
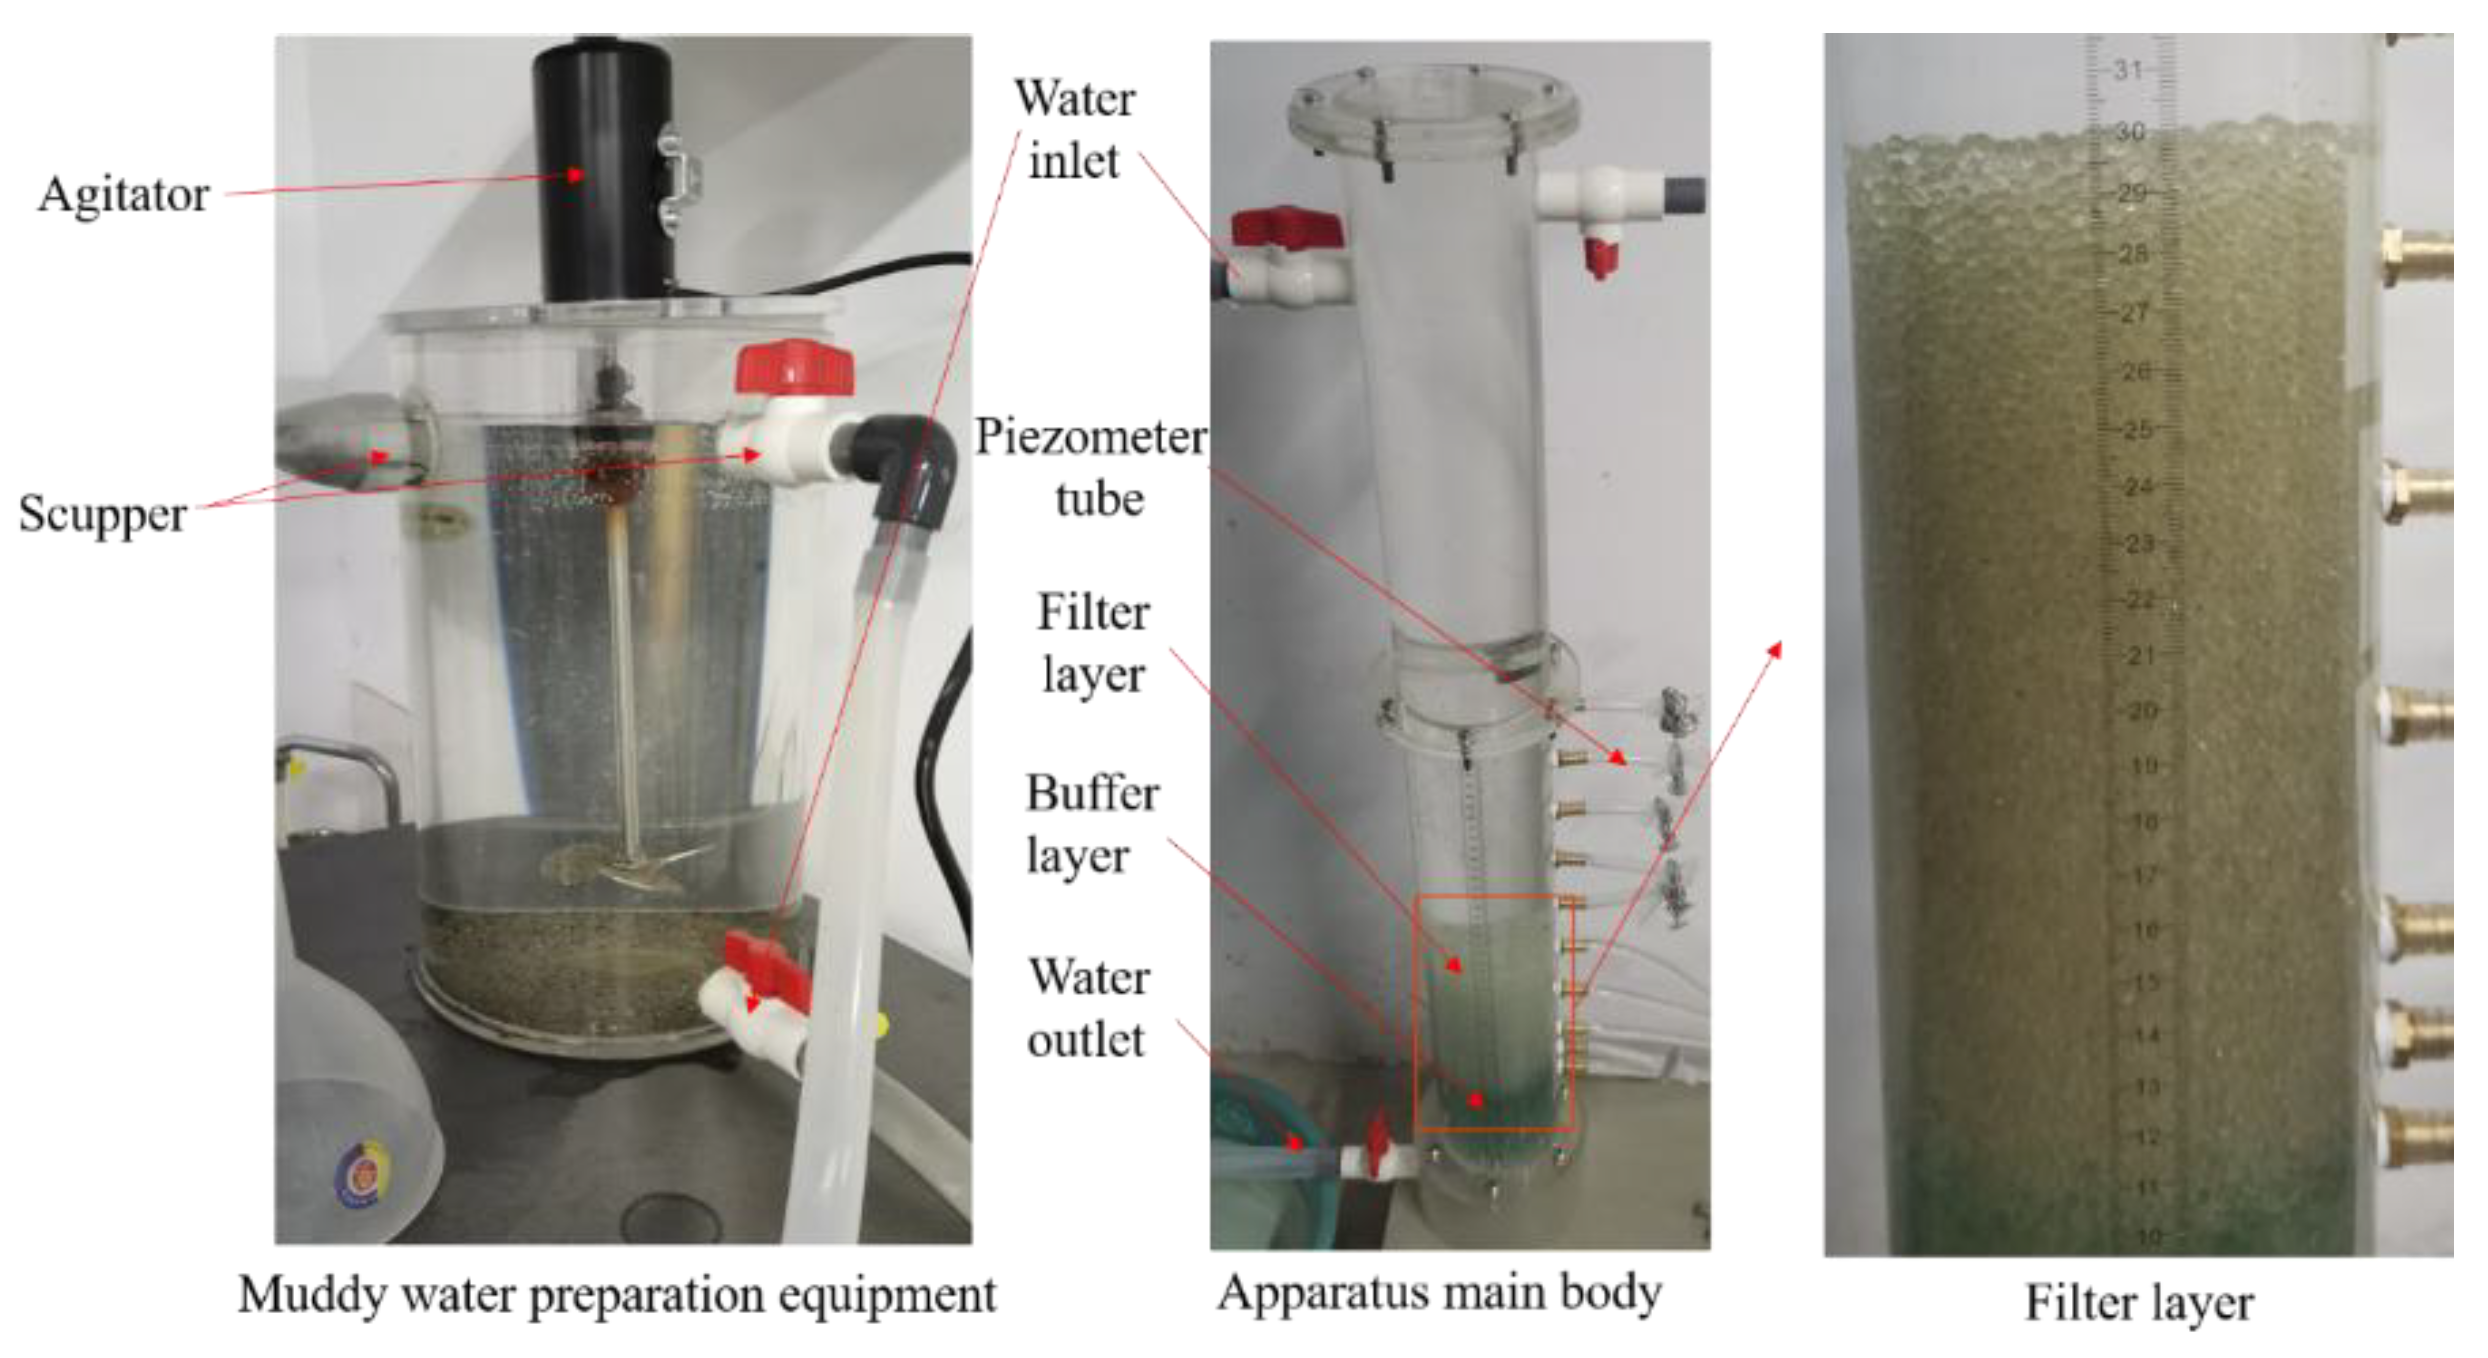
Figure 23.
Permeability coefficient by test.
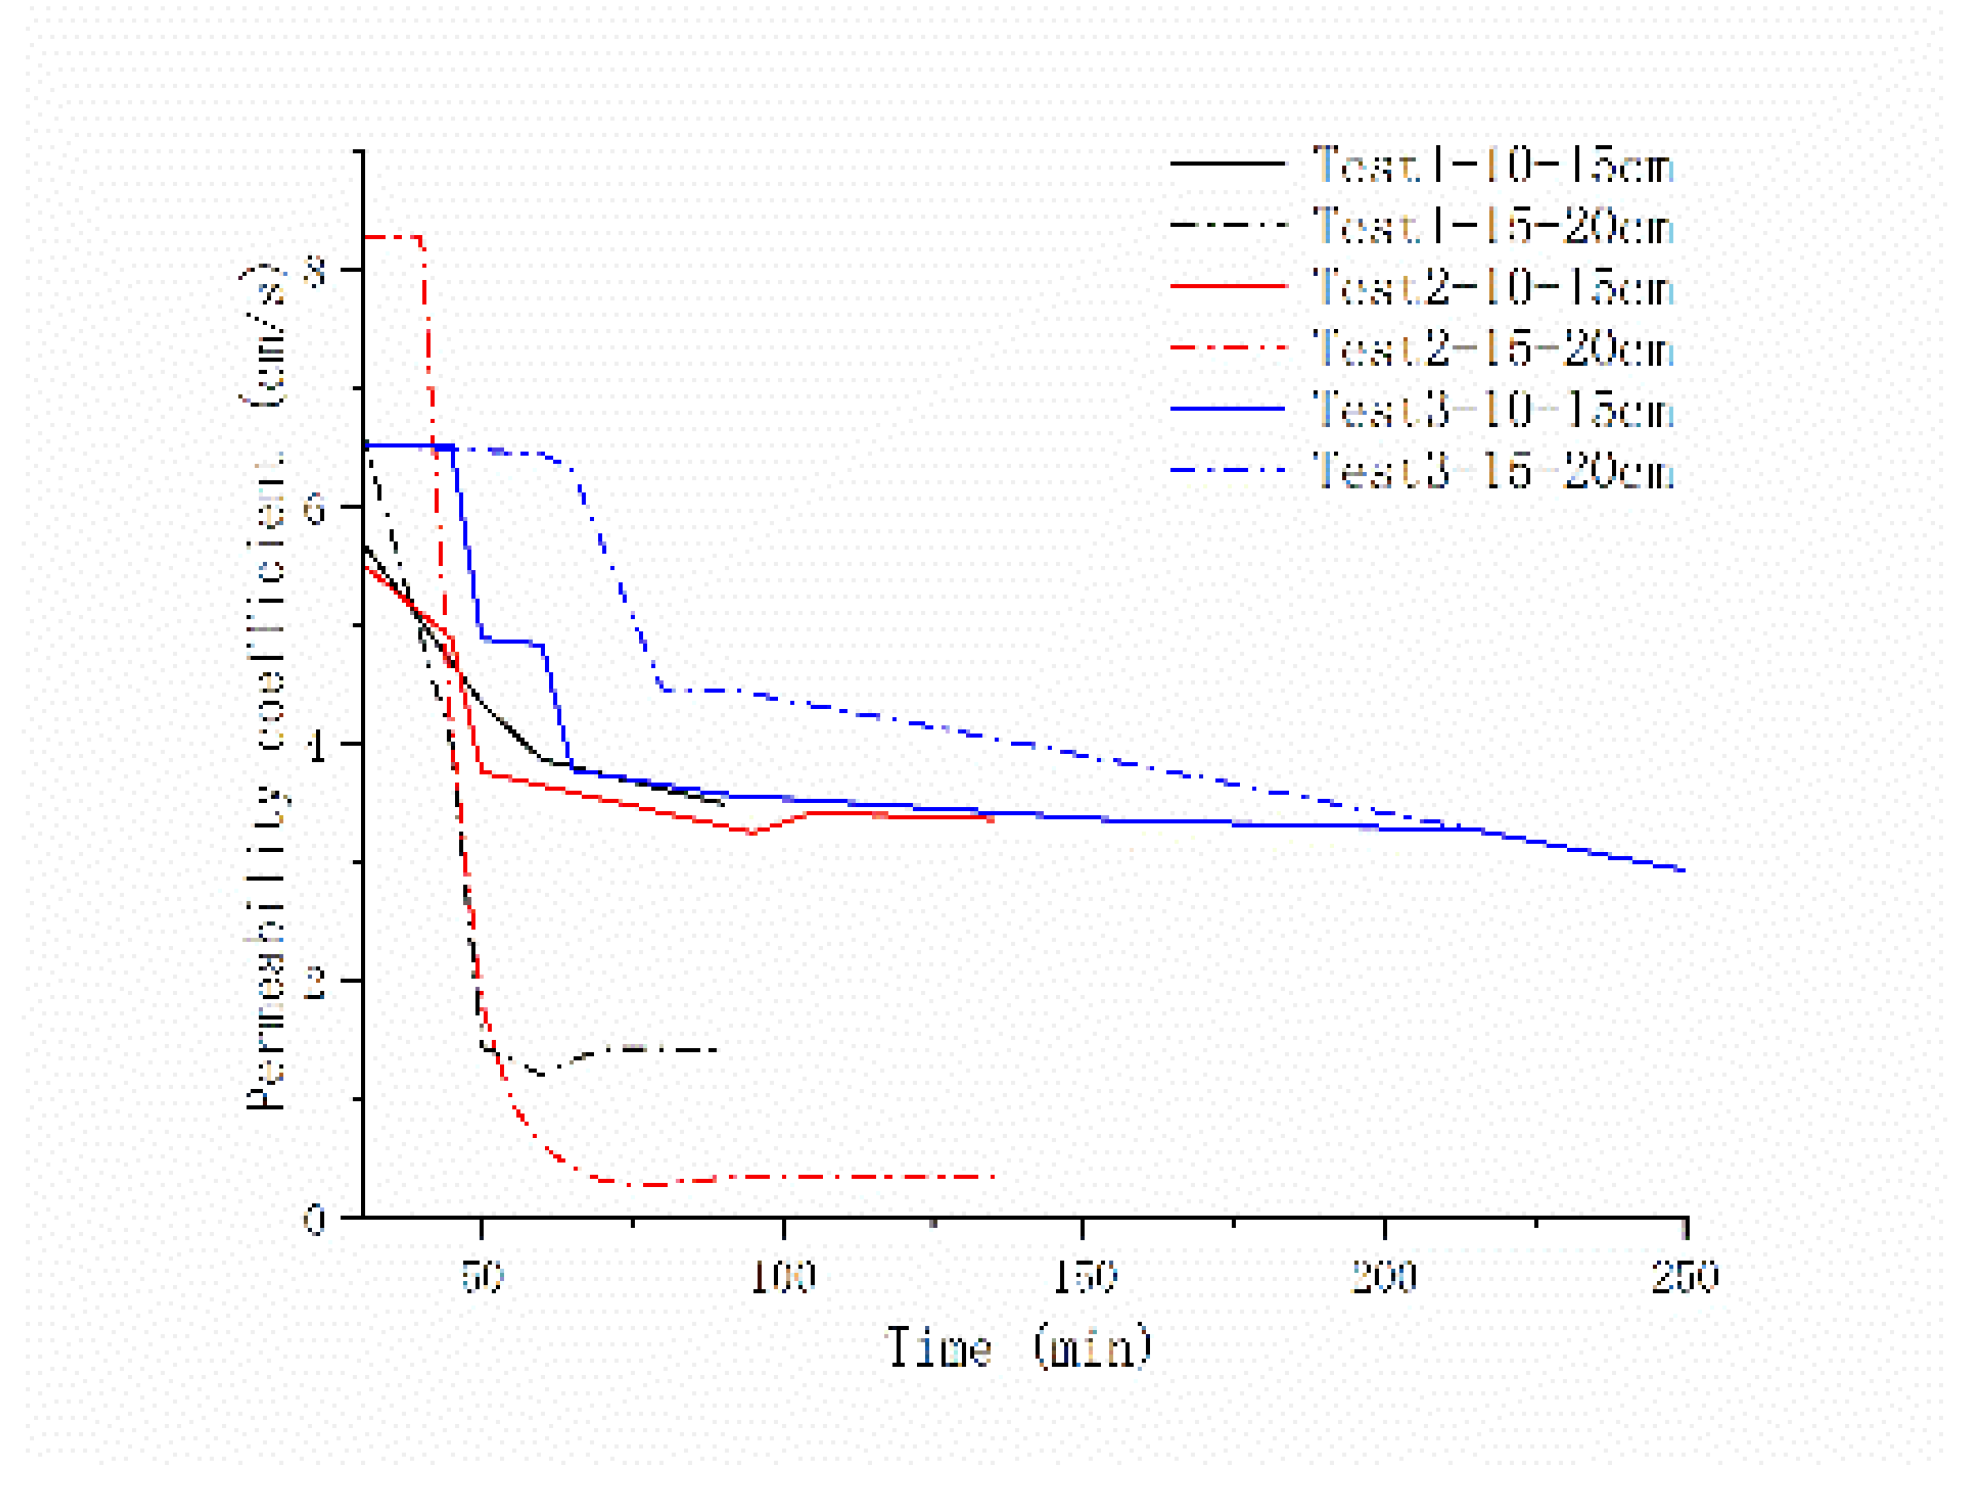
Figure 24.
The permeability coefficient of Darcy 's formula under different particle shapes.
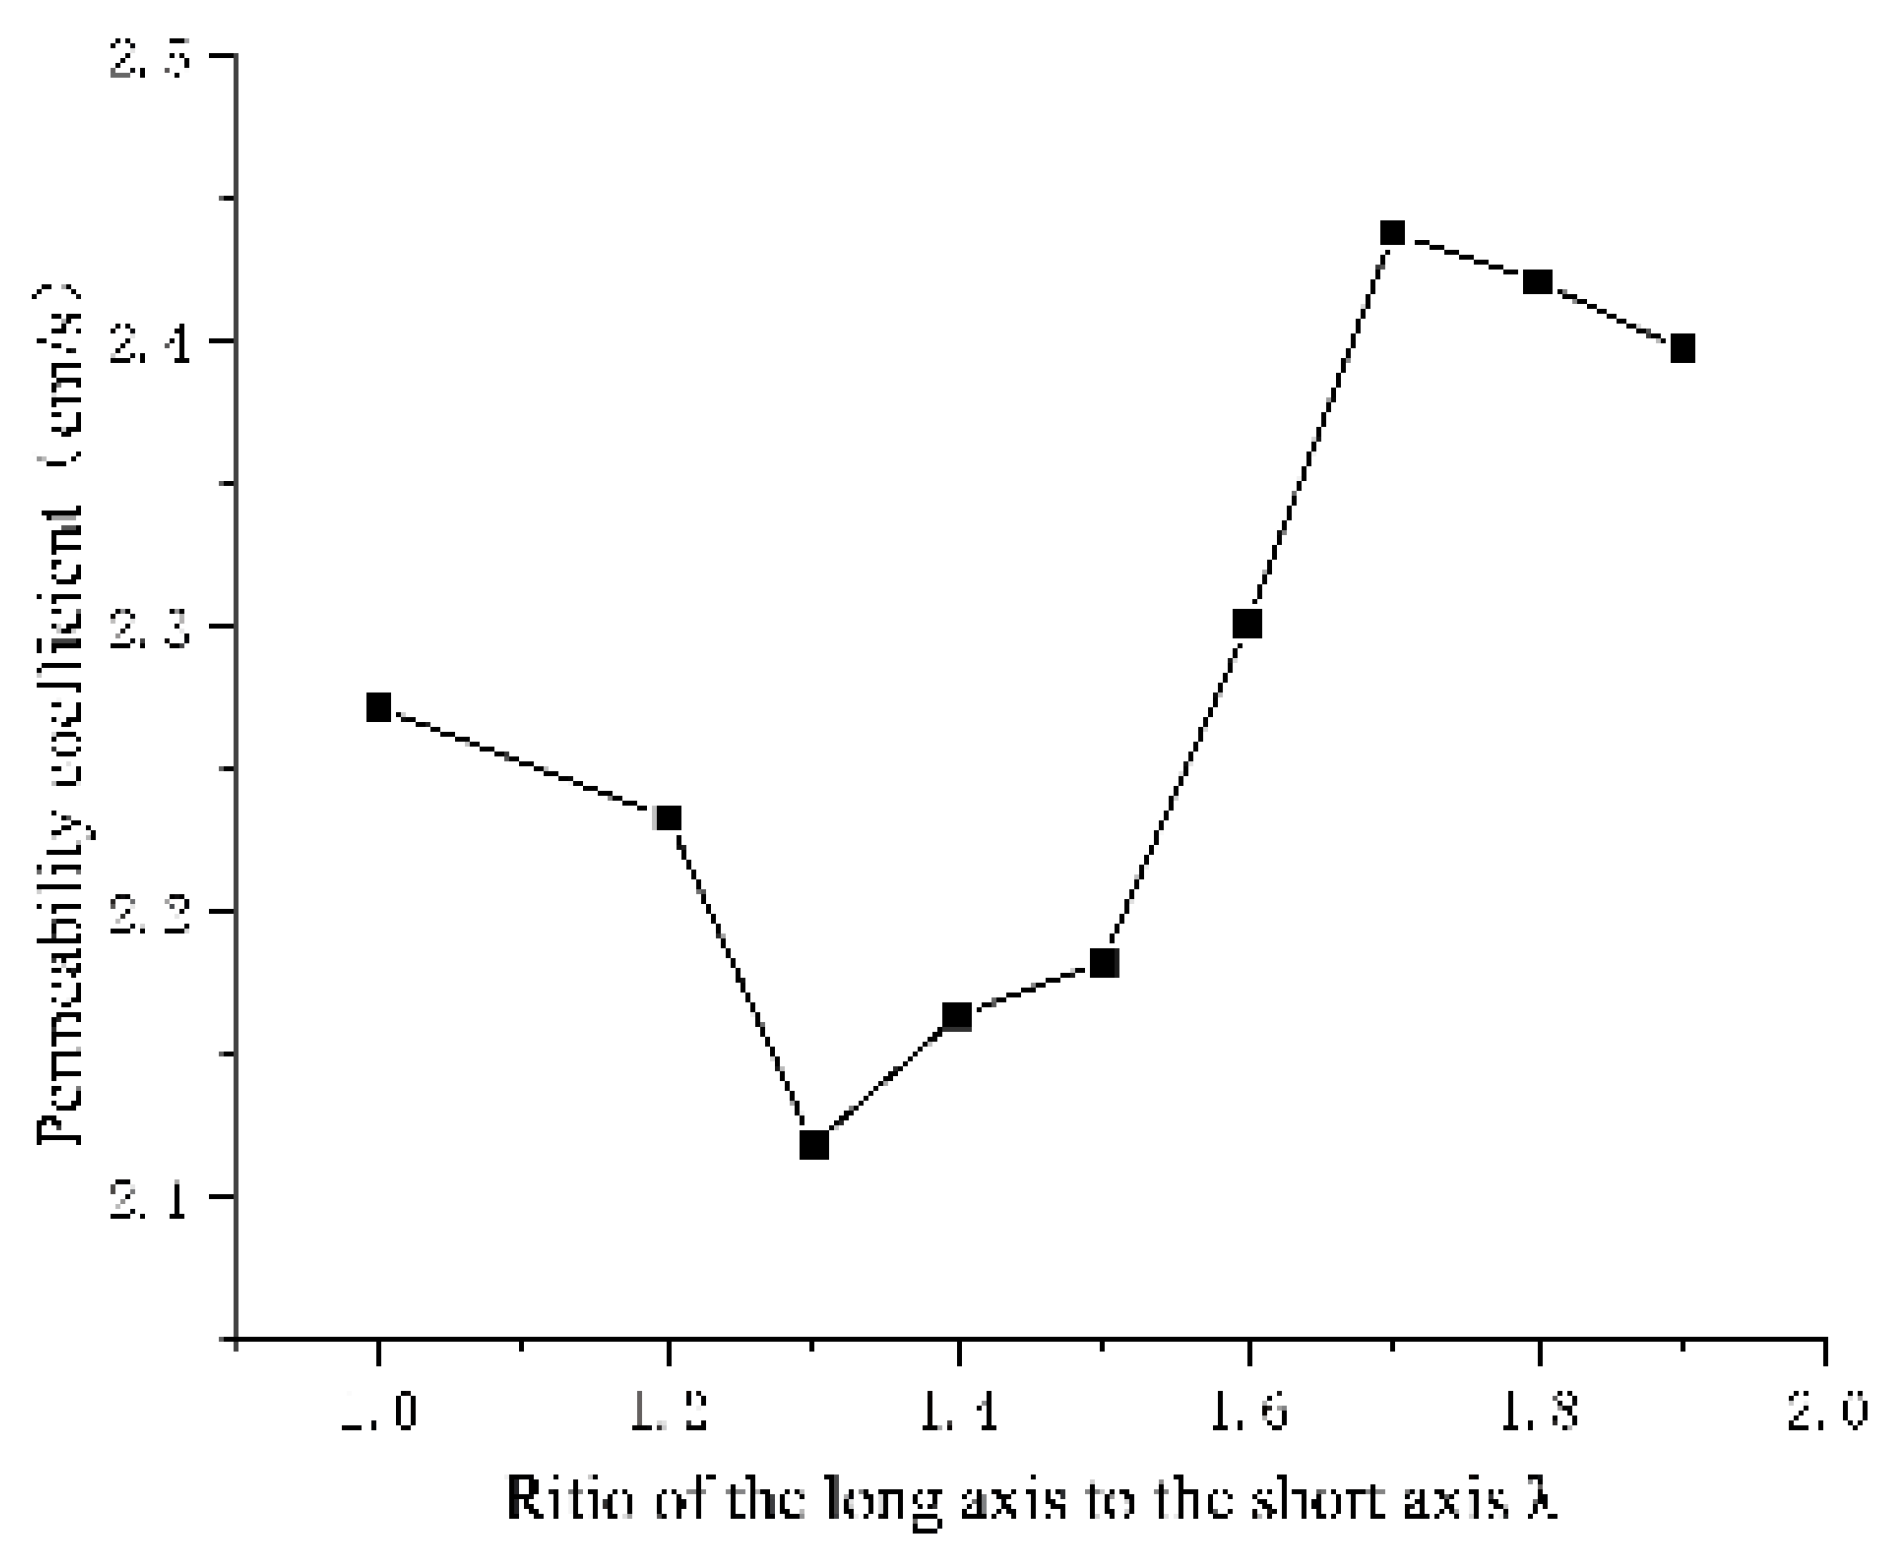
Figure 25.
The variation of soil porosity with particle shape parameters.
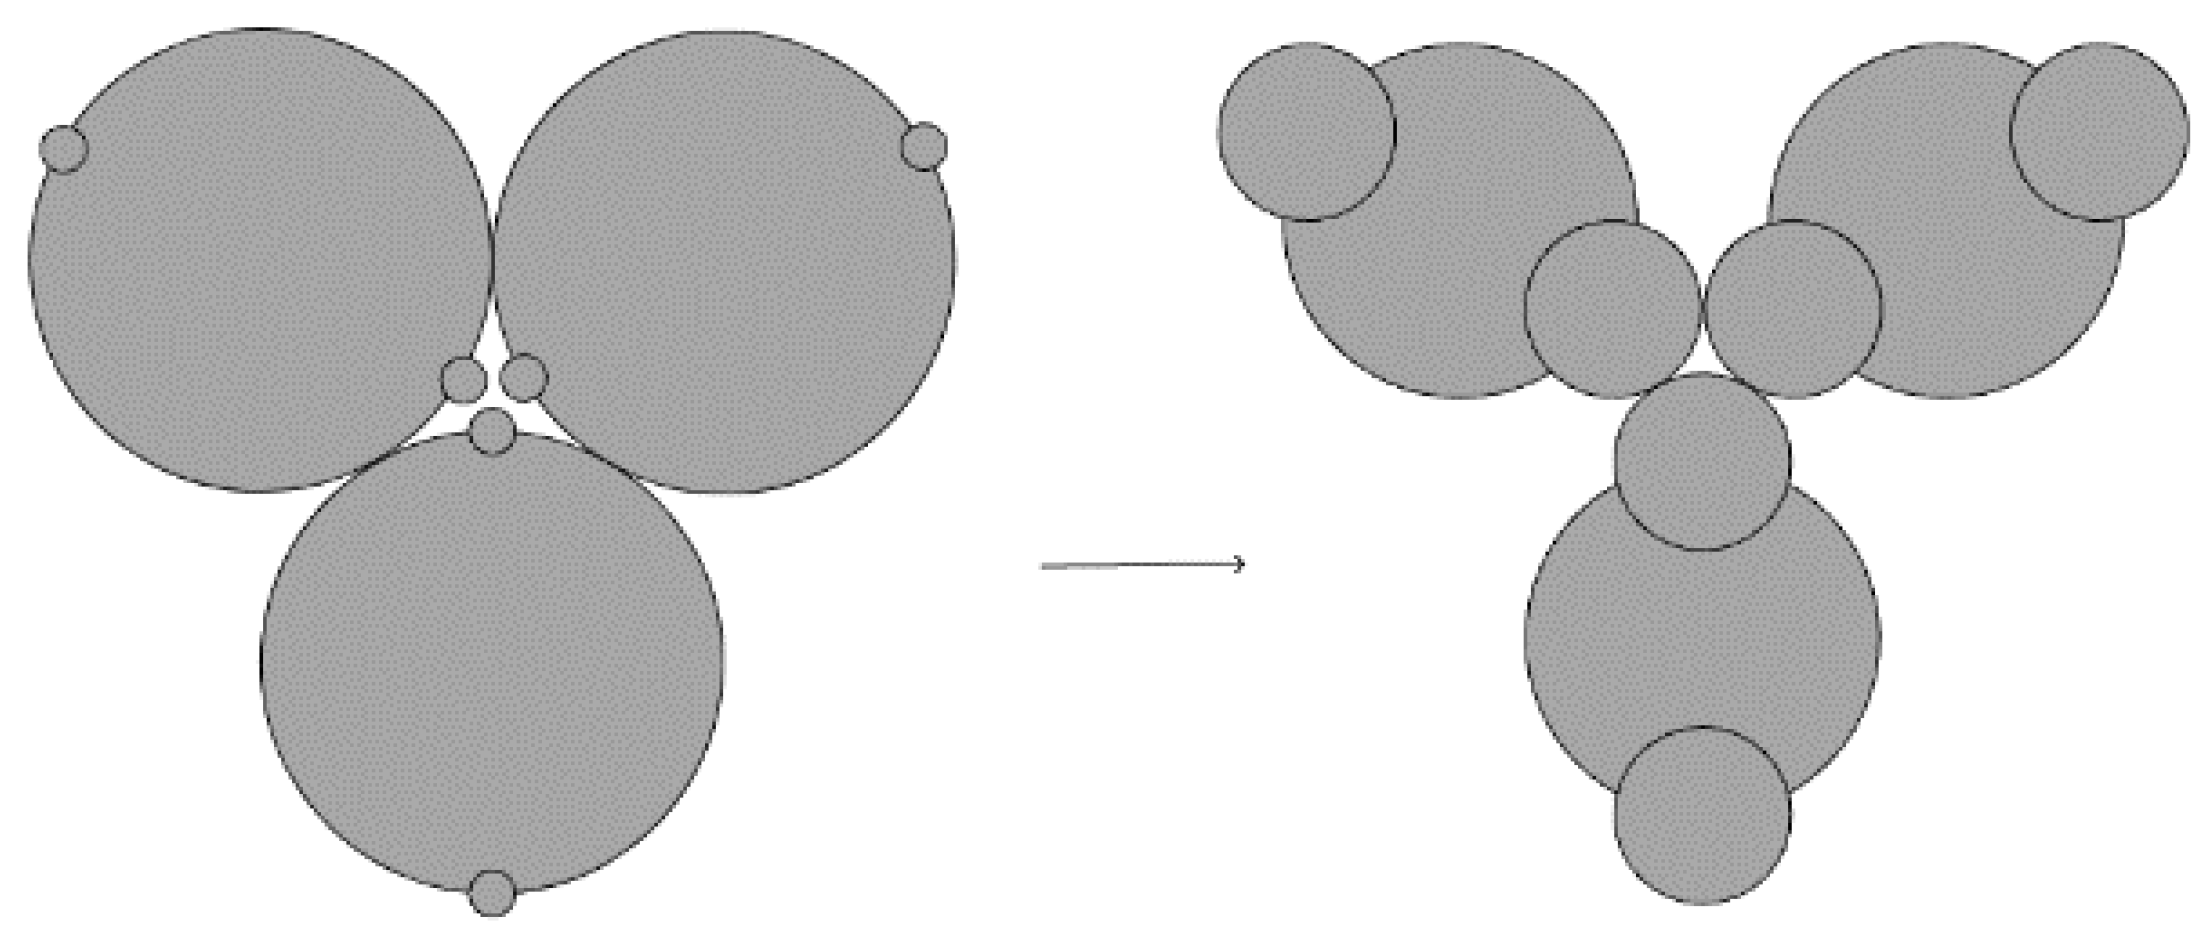

Table 1.
The relationship between λ and n in loose arrangement.
| Long and short axis ratio λ | 1 | 1.1 | 1.2 | 1.4 | 1.5 | 1.7 | 2 | 2.5 | 3 | 3.5 | 4 | 5 |
| Porosity n | 0.510 | 0.501 | 0.498 | 0.503 | 0.512 | 0.534 | 0.577 | 0.652 | 0.717 | 0.770 | 0.811 | 0.868 |
Table 2.
The particle shape parameter S corresponding to the ellipsoid under different λ.
| Long and short axis ratio λ | 1 | 1.2 | 1.5 | 1.8 | 2 | 2.3 | 2.5 | 3 | 4 | 5 |
| Particle shape parameters S | 1 | 0.944 | 0.863 | 0.790 | 0.747 | 0.689 | 0.654 | 0.581 | 0.472 | 0.398 |
Table 3.
Graphic information processing.
| number | Particle area and perimeter in ImageJ software | The real area and perimeter of the particles | ||
| area | perimeter | area (mm2) | perimeter (mm) | |
| 1 | 7645 | 356.617 | 10.333 | 13.111 |
| 4 | 6855 | 335.765 | 9.266 | 12.344 |
| 8 | 5486 | 287.279 | 7.415 | 10.562 |
| 13 | 4659 | 274.392 | 6.297 | 10.088 |
| average | 7137.69 | 331.552 | 9.648 | 12.189 |
Table 4.
Particle shape parameters after ellipsoidization of each particle.
| number | Equivalent elliptic diameter(mm) | Long and short axis ratio λ | Particle shape parameters S | |
| long axis | short axis | |||
| 1 | 6.883 | 2.949 | 2.334 | 0.682 |
| 4 | 4.756 | 2.480 | 1.918 | 0.764 |
| 8 | 3.899 | 2.421 | 1.610 | 0.835 |
| 13 | 5.076 | 2.592 | 1.958 | 0.755 |
| average | 4.690 | 2.461 | 1.906 | 0.769 |
Disclaimer/Publisher’s Note: The statements, opinions and data contained in all publications are solely those of the individual author(s) and contributor(s) and not of MDPI and/or the editor(s). MDPI and/or the editor(s) disclaim responsibility for any injury to people or property resulting from any ideas, methods, instructions or products referred to in the content. |
© 2025 by the authors. Licensee MDPI, Basel, Switzerland. This article is an open access article distributed under the terms and conditions of the Creative Commons Attribution (CC BY) license (http://creativecommons.org/licenses/by/4.0/).
Copyright: This open access article is published under a Creative Commons CC BY 4.0 license, which permit the free download, distribution, and reuse, provided that the author and preprint are cited in any reuse.


