
Submitted:
16 September 2025
Posted:
18 September 2025
You are already at the latest version
Abstract
The strength and liquefaction characteristics of soil are influenced by the particle shape of the soil. In this paper, the numerical model of stress-controlled was established using PFC2D, and we conducted a series of stress-controlled biaxial compression numerical simulations with particles of different shapes. Then, the simulation results were validated based on laboratory tests, and the impact of particle shape on the macro- and micro-mechanical properties of granular soil was discussed. Finally, the influence of particle shape effects is discussed based on the development process of slope deformation, which is obtained from an engineering example of a cohesionless slope instability by an applied external force. The results show that: (1) Under similar conditions, irregular particle samples exhibit a higher peak stress than regular particle samples. This also means that the instability of regular particle samples occurs in a shorter time; (2) There are differences in contact force, coordination number and form of particle motion in samples with different shapes of particles. Therefore, the differences in shear and instability characteristics between different shapes may be related to the contact mode between particles, the form of motion and other factors; (3) The engineering case indicates that under shape-influenced conditions, slope is more stable when it is composed of irregular particles.
Keywords:
granular material
; stress-controlled compression
; particle shape
; discrete element method (DEM)
1. Introduction
Particle shape has been recognized as an important factor influencing the mechanical properties of granular materials. That is because different shapes of particles have different particle arrangements and contact forms, which affects the strength and liquefaction characteristics of soil [1,2,3,4,5,6,7,8]. For example, Cho et al., [1] found that when the degree of irregularity of particle shape increased, and the maximum and minimum void ratio (emax / emin) of the materials also increased, but the shear stiffness decreased; Yang and Luo [2] found that irregularly shaped particles usually have a higher liquefaction resistance strength, and that the shape difference of the particles also affects the critical state characteristics. And the more irregular the shape of the particles, the higher the critical state friction angle of the materials. It is important to note that these characteristics are usually obtained by strain-controlled tests. Here, the strain-controlled test is defined as the shearing of a sample at a constant displacement shear rate, through which the stress-strain relationship of the granular materials can be obtained, and the strength characteristics can be analyzed. The advantage of this test method is that it accurately determines the peak and critical strengths of granular materials, so strain-controlled test is widely used in determining failure conditions of granular materials with different shapes [9,10].
Nowadays, with the development of economic construction, researchers have paid more and more attention to the problem of deformation-time effect of soil [11,12,13,14,15,16,17,18]. Here, the deformation-time effect refers to the tendency of soil deformation over time, and this effect is generally obtained by means of stress-control tests. Through the stress-control tests, it is possible to obtain the stress-strain-time relationship of the soil, to analyse the trend of deformation and strength of the soil with time. it is important for the characterisation of stress development and strain development in granular materials before the peak stress state [12]. However, it is important to note that previous studies have primarily focused on the creep behavior of the underlying soil during the operational phase following building construction. In this phase, the loads remain constant, and the accumulation of strains over time is observed [19,20]. However, during the construction phase, which involves activities like foundation stacking and building construction, the applied loads on the soil will increase continuously over time. During this phase, the mechanical properties of the soil are influenced by factors such as the compaction degree, particle shape gradation, and the rate of load application. However, most of the studies on particle shape have been carried out by strain-controlled tests [2,21,22], which means that they focus on the stable shear behaviour of granular materials under constant displacement conditions, but this approach does not reflect the instability characteristics of the soil when the overlying load is continuously increased. It is still unclear how particle shape affects its instability characteristics.
To solve the above problems, a series of numerical simulations were carried out in this paper. Firstly, we investigated the effect of particle shape on the macroscopic instability characteristics of granular materials, then we analyzed the differences in the microscopic mechanisms, and finally, the applicability of particle shape effect was analyzed through an engineering case of a cohesionless slope instability by an applied external force.
2. DEM Modeling
To explore the differences in microscopic scale between samples with different particle shapes, a numerical simulation analysis using the discrete element method (DEM) was performed. The numerical simulations were performed using the well-established DEM program PFC2D, and the linear contact model for both particle-particle and particle-wall interactions. The numerical simulation parameters are given in Table 1.
Here, The normal stiffness of inter-particle contacts kn is calculated according to kn = 2rtEc/(ra + rb) [5,23], where t is the size of particles in the z direction (the simulations were carried out in the x-y plane) and its default value is 1 m, Ec represents the effective modulus, ra and rb are the radii of constituent sub-circles of two particles in contact, and r denotes the minimum between ra and rb . The kn value approximates 1 * 108 N/m due to the small dispersity of the particle radius; this value is similar to the normal contact stiffness used in Gong et al. [10], Nie et al. [5,23]. The kn/ks value (ks refers to the tangential contact stiffness) is within the range of (1.0, 1.5). Hence, kn/ks = 4/3 was used in the present study. And others parameters were adjusted accordingly based on the existing literature [5,10,23,24].
It should also be noted that the “maximum wall servo speed (umax)” is a particularly important yet often overlooked parameter in discrete element simulation software [8,18]. Generally, umax governs the maximum stress rate achievable by the wall servo mechanism. To investigate this issue, our prior research focused on the relationship between “maximum wall servo speed” and “wall stress loading rate” (Figure 1) [18]. Figure 1 illustrates how different combinations of stress loading rate and maximum wall servo speed intervals affect specimen shear behavior, with distinct types corresponding to computational accuracy and efficiency of the model. Further details on the stress-control mechanism for biaxial compression testing can be found in Huang et al. [18]. Through multiple trials, we ultimately selected umax = 1 × 10⁻³ m/s.
The effect of different shapes of particles was investigated by using circular particle and the clump of triangular-like particle formed by three circle particles (Figure 2a). Then, isotropic compressive consolidation was used to generate samples of the same relative density. The procedure of this method is as follows: First, about 5000 particles were generated without contact in a large rectangular area modelled by four walls, with particle diameter ranging from 1.6 to 2.4 mm [5]. Next, to achieve an isotropic and loose sample, the friction coefficient between the particles was set to 0.4. Hence, the walls compressed the particles isotopically at a low strain rate. and a servo-controlled mechanism was used to provide the required confining stress of 200 kPa. Finally, the sample was balanced, as the ratio of the mean unbalanced force to the mean contact force was less than 10-5 and the stress of the walls was less than a tolerance of 0.5% compared with the required confining stress. The dimensions of all samples following preparation are approximately 95 mm × 190 mm. Figure 2b shows a schematic representation of the sample generation process by using circular particle: (i) initial stage, (ii) isotropic compression stage, and (iii) final stage. The undrained stress-controlled test can be performed after the sample generation is complete, with a stress shear rate of 0.1 kPa/s. Note that the undrained condition for discrete element numerical simulation of shear is achieved by maintaining a constant volume of the sample [25,26].
3. Macroscopic Results and Discussions
Figure 3 shows the macroscopic simulation curves of the two particle shape samples along with the marking of their respective peak deviatoric stress point (qpeak). It can be seen that: ① the qpeak of the triangular-like particle sample (38.9 kPa) is greater than that of the circular particle sample (26.6 kPa). That is, the time to reach the peak point of deviatoric stress is shorter for the regular particle sample compared to the irregular triangular-like particle sample, which indicates that the regular particles are more easily instability phenomenon; ② the axial strain to reach qpeak point is less than 1% for both particle shape samples, and the time required to reach the same axial strain (e.g., 0.1%) is less for the circular particle sample than triangular-like particles. Moreover, the trend of the Δu-t curve is like that of the ε1- t curve.
In addition, we have made similar attempts from the laboratory test [24]. Here, the rounded shaped Ottawa Sand (OS) and angular White Quartz Sand (WS) were used in laboratory tests. Note that the properties of the test materials are similar except for the inconsistency in particle shape (Figure 4a). Figure 4b shows that the sample with irregular particle shape (WS) can withstand a greater axial force (ΔF) compared to the sample with regular particle shape (OS), and therefore the WS appears to instability later. Meanwhile, a stick-slip behaviour occurs in the regular particle shape sample (OS), while the axial force in the irregular particle shape sample (WS) is almost smooth in the increasing period. Remark that the axial force of the specimen decreases rapidly after reaching the peak deviatoric stress point (qpeak) and then increases again (i.e. WS). However, it should be noted that the sample was badly distorted after the instability. Therefore, the stress-strain behaviour measured after the qpeak point may not be representative of the behaviour of the element, as discussed by Chu [11,12]. Hence, the test curve after the qpeak point is represented by the dashed line.
Figure 4c shows the axial strain development curve of the sample. It can be found that before the qpeak point, both specimens are loaded with large stresses at small axial strains (ε1<1%). And after the deviatoric stress reaches the qpeak point, the axial strain of the sample increases rapidly; In addition, the ε1 - time (t) curve of the sample with regular particle shape (OS) first shows a slowly increasing trend, then suddenly rises and continues to be stable, showing a "step-like" sudden change behaviour. Whereas the ε1- t for the sample with irregular particle shape (WS) shows a smooth growth. Furthermore, the relationship between excess pore water pressure (Δu) and time (t) follows a similar evolutionary trend as the relationship between axial strain and time.
Based on the differential behaviour of axial force, axial strain and excess pore water pressure of the two different particle shape samples in Figure 4b–d, the stress paths for the different particle shape samples are plotted in Figure 4e. The stress paths of the samples all show a contractive behavior, but the stress paths of sample with regular particle shape (OS) show a " sawtooth " pattern, while the stress path of samples with irregular particle shape (WS) are relatively smooth.
The above findings indicate that the simulation results are the same as the laboratory results, and this also means that irregularly shaped particles have a longer stress accumulation stage and can resist greater overburden loads. This difference may be related to the contact mode of particle-particle. And this can be confirmed by the contents of Section three.
4. Microscopic Results and Discussions
4.1. Contact Force Evolution
The external loads on the particle system are transmitted through the contact between the particles, forming contact forces, which are an important factor influencing the mechanical properties of the particle system. In addition, the magnitude of the particle contact force is characterised by the strength of the force chain. The strong force chain provides support for the entire structure, while the weak force chain aids in supporting and stabilising the strong force chain [5,24,27]. It is necessary to first visualise the contact force network to intuitively understand the physical mechanisms of the particle system during the shearing process.
Figure 5 shows the contact force network diagrams for different particle shape samples in the initial, peak and liquefaction (or critical) states. It should be noted that the width of the contact force network lines is proportional to the magnitude of the contact force. It can be observed that for a given sample, the magnitude of the contact force in the vertical and horizontal directions is almost equal in the initial state. and the samples in the peak state do not show significant anisotropy. This is different from the results of the distribution of the peak state contact force configuration in the literature. In the literature [5], their tests are drained, and the peak state corresponds to a strain greater than 1 %, whereas in this paper it is undrained and the peak strain is less than 0.5 %. Therefore, this difference may be caused by the difference in the strain state and drainage state between the two articles. In addition, in the liquefaction state, the value of the contact force was significantly reduced compared to the peak state, and the number of force chains on the horizontal sides was less than that in the vertical direction, showing an hourglass shape. It is also worth noting that, in the same state, the contact force is affected by the shape of the particles. Specifically, the triangular-like samples have a more complex force chain network, which is significantly more than the samples with round particles. This is mainly because the more irregular the shape of the particle, the more contact it has with the surrounding particles, with more weak force chains present.
Figure 6 shows the distribution of normal and tangential contact forces in different directions for the sample in the peak state. As shown in Figure 6a, the polar diagram of the normal contact force is nearly peanut-shaped, indicating that the normal contact force in the vertical direction is larger than the normal contact force in the horizontal direction. Remark that previous researchers have indicated that the horizontal contact forces are relatively small and provide lateral support for the propagation of relatively large contact forces. This indicates that there is anisotropy in the contact force network of the peak state in Figure 7, where the vertical contact force is larger than the horizontal contact force. Alternatively, the shape of the distribution of tangential contact forces resembles a butterfly (Figure 6b), which means that tangential contact forces in the directions of 45° + k × 90° (k = 0, 1, 2, 3) are obviously greater than those in the other directions. This corresponds with observations in Azéma et al., [28], Nguyen et al., [29] and Yang and Dai [25]. In addition, the contact force is affected by the shape of the particles. With increasing particle irregularity, the peanut-shaped and butterfly-shaped gradually becomes larger.
To further observe the trend of the strong and weak force chains during the shearing of the samples, the ratio of the normal contact force to the average normal contact force (f) is introduced:
where Fi is the normal contact force of contact i and N is the total number of contacts. Here, Define f > 1 as a strong force chain and f < 1 as a weak force chain. Hence, the entire contact network is divided into the strong contact network and the weak contact network.
Figure 7 quantifies the trend of the strong contact network with time. The strong contact network is a minor contributor to the shear strength during shear, with a contribution of less than 50 %. With the growth of time, the percentage of strong contacts fluctuated in a small range. Afterwards, even though the strength of the sample had reached a peak state and the sample strength began to decline, the percentage of strong contacts did not immediately decrease and even showed a small increase. This stage may be due to the fact that after the specimen reaches the peak strength, the upper and lower walls will compress the specimen rapidly (Figure 3b) to reach the target stress requirement, at which time the wall velocity no longer meets the quasi-static loading requirement [16], that is, it is too late for the specimen to adjust the relative position of its particles, which is thus manifested as a rise in the strong force chain percentage. In addition, the circular granular sample has a larger percentage of strong force chains and exhibits a coarser strong force chain network. This is because in the transmission of contact forces, the greater the contact number is, the more easily contact forces are dispersed.
4.2. Coordination Number Evolution
Coordination Number (CN) is one of the most important indicators of the microstructure of a granular material, it is the average number of contacts of the particles in a granular system and is defined as follows:
where N is the total number of particles and Ci is the contact number of a certain particle (particle i). Here, Figure 8a describes the trend of the CN with time for the two shaped samples. From the figure, it can be seen that CN of each sample firstly decreases slowly with the increase of time, and then occurs a steep decrease after reaching the peak state; In addition, the CN values of samples with different particle shapes differed in the initial stage, with the sample of circle having CN = 3.27 in the initial stage and triangular-like particles having CN = 3.88; When there is a steep decrease in CN for both shapes of particles, a smaller strain is required for circle particles (Figure 3b), which is similar to the macro-mechanical behaviour.
The distribution of coordination number in different directions for samples with different particle shapes in the peak state also confirms the above conclusion (Figure 8b), that is, the distribution of coordination numbers for triangular particles is larger than that for round particles in all directions. The above simulation results indicate that the CN is larger when the particles tend to be irregular, that is why irregular particle samples are more resistant to liquefaction or flow failure.
4.3. The Pattern of Motion of Particles
The particles adjust the overall deformation of the sample by both rotation and contact sliding, where particle rotation is the rotational movement of a particle about its own specific point. In particular, it is important to note that rotation of round particles about the centre of the circle does not change their contact properties with the surrounding particles, whereas rotation of non-round particles will change their contact properties with the surrounding particles.
The cumulative rotation angle of the samples shows a low increase during the stress accumulation phase (before the peak state) (Figure 9). This is because the overall structure of the sample is still in a relatively stable state with a small axial strain (less than 0.3%, e.g., Figure 3b). However, the cumulative rotation angle of the round particle samples is larger than that of the irregular particle samples, and this difference further increased with time. For example, at a time of 100 s, the difference in cumulative rotation angle between the two is only 85.1 °, whereas when the time is 200, the difference in cumulative rotation angle is 1267.3 °, which is a 15-fold increase.
To investigate the sliding contacts, the fiction sliding index (Sc) is introduced:
Where ftc and fnc are the tangential and normal contact forces, respectively, for contact c, μ is the frictional coefficient. In this study, contact sliding is believed to occur, when Sc is greater than 0.9999 [5,10].
Therefore, the percentage of sliding contacts (Sp) within the particle system is defined as Sp = Nsc / Nc × 100%, where Nsc denotes the number of contacts where sliding occurs, and Nc is the total number of contacts. Figure 10 shows the trend of Sp - t of samples. As can be seen from the figure, the pattern of the percentage of sliding contacts with time of the two samples is basically the same. Firstly, Sp basically increases with time, then there are swings, and there is a little decrease after reaching the peak state, followed by a rapid increase. And the figure also shows that the contact sliding rate in the samples increases with the increase of the degree of particle irregularity, that is, the Sp of the triangular-like particles is larger than that of the circle particles. And the simulation curves of irregular particles are relatively smooth, while the curves of spherical particles have more swings appearing. This corresponds with observations in Gong and Liu, [4], and Nie et al., [5]. It could be because round particles are less resistant to rotation.
4.4. Discussions
A comprehensive analysis of Figure 5, Figure 6, Figure 7, Figure 8, Figure 9 and Figure 10, in the stress-controlled test, there are differences in the contact force, coordination number, and the form of particle movement in the particle system, which are shown as follows: The percentage of strong force chains for regularly shaped particles is large, while the percentage of strong force chains for irregularly shaped particles is small. As the degree of irregularity of the particle shape increases, the coordination number of the particles increases. This increases the rotational resistance of the particles; the angle of rotation decreases but the contact sliding rate increases. And this also indicates that the irregular particles are more resistant to rotation and are more likely to impose contact sliding to adjust the overall deformation of the sample. This may be responsible for the differential behaviour exhibited by differently shaped particles at the macroscopic level (Figure 3 and Figure 4). And it should be noted that other researchers have found similar conclusions to this section through numerical simulations of drained condition with different particle shapes (i.e., Gong and Liu, [4]; Nie et al., [5]).
5. Case Analysis
5.1. Simulation Procedure of Slope Model
In general, the problem of deformation-time effect of stress shear instability usually occurs, when there is a load accumulation at the top of the slope. Compared with the slope in the natural state, the slope with additional loads at the top of the slope will show lower stability, and at the same time, its displacement field and stress field will show more complex characteristics. And in the stress-controlled tests, it has been proved that particle shape has a significant effect on both deviatoric stress and displacement deformation of the soil, among others. To further analyse the applicability of the particle shape effect under stress-controlled conditions, a numerical model for the instability of cohesionless soil slopes under external forces is developed, and the influence of particle shape is discussed. The numerical parameters of the slope model are the same as those of the stress- controlled tests, as shown in Table 1. Following the previous section, in the numerical simulations, regular soil particles are represented by circular particles and irregular soil particles are represented by triangular-like particles. The process of modelling the cohesionless soil slope is shown in Figure 11:
- ①
- Firstly, particles were generated in a large rectangular area modelled by four walls, with particle diameter ranging from 0.16 to 0.24 m;
- ②
- The particles fall by gravity to the bottom wall. Then, the sample was considered to be balanced, as the ratio of the mean unbalanced force to the mean contact force was less than 10-5;
- ③
- To delete the particles outside the computational area and to colour the particles within the computational area. Here, the colouring was achieved by dividing the grid horizontally by 20 meshes and vertically by 15 meshes;
- ④
- Finally, particles outside the slope model were removed. And a force wall was generated and allowed to compress the top of the slope at a rate of 1 kPa/s, stopping when the calculation time was 50s.
It should be noted that the angle of repose of the triangular-like particles and the round particles was determined to be greater than 25° by the angle of repose test, and therefore the angle of the soil slope can be set to 20°.
5.2. The Process of Slope Instability
Here, the displacements of the force walls of slopes composed by differently shaped particles are significantly different after experiencing the same load application (Figure 12). In particular, the force wall displacement of slopes consisting of circular particles show a rapid increase, while displacement of triangular particle slope shows a slow increase. When t = 50 s, the force wall displacement of the circular granular slope is 2.01 m, which is approximately 20 times the force wall displacement of the triangular granular slope (0.09 m). This is like the trend observed in the previous simulation (see Figure 3b).
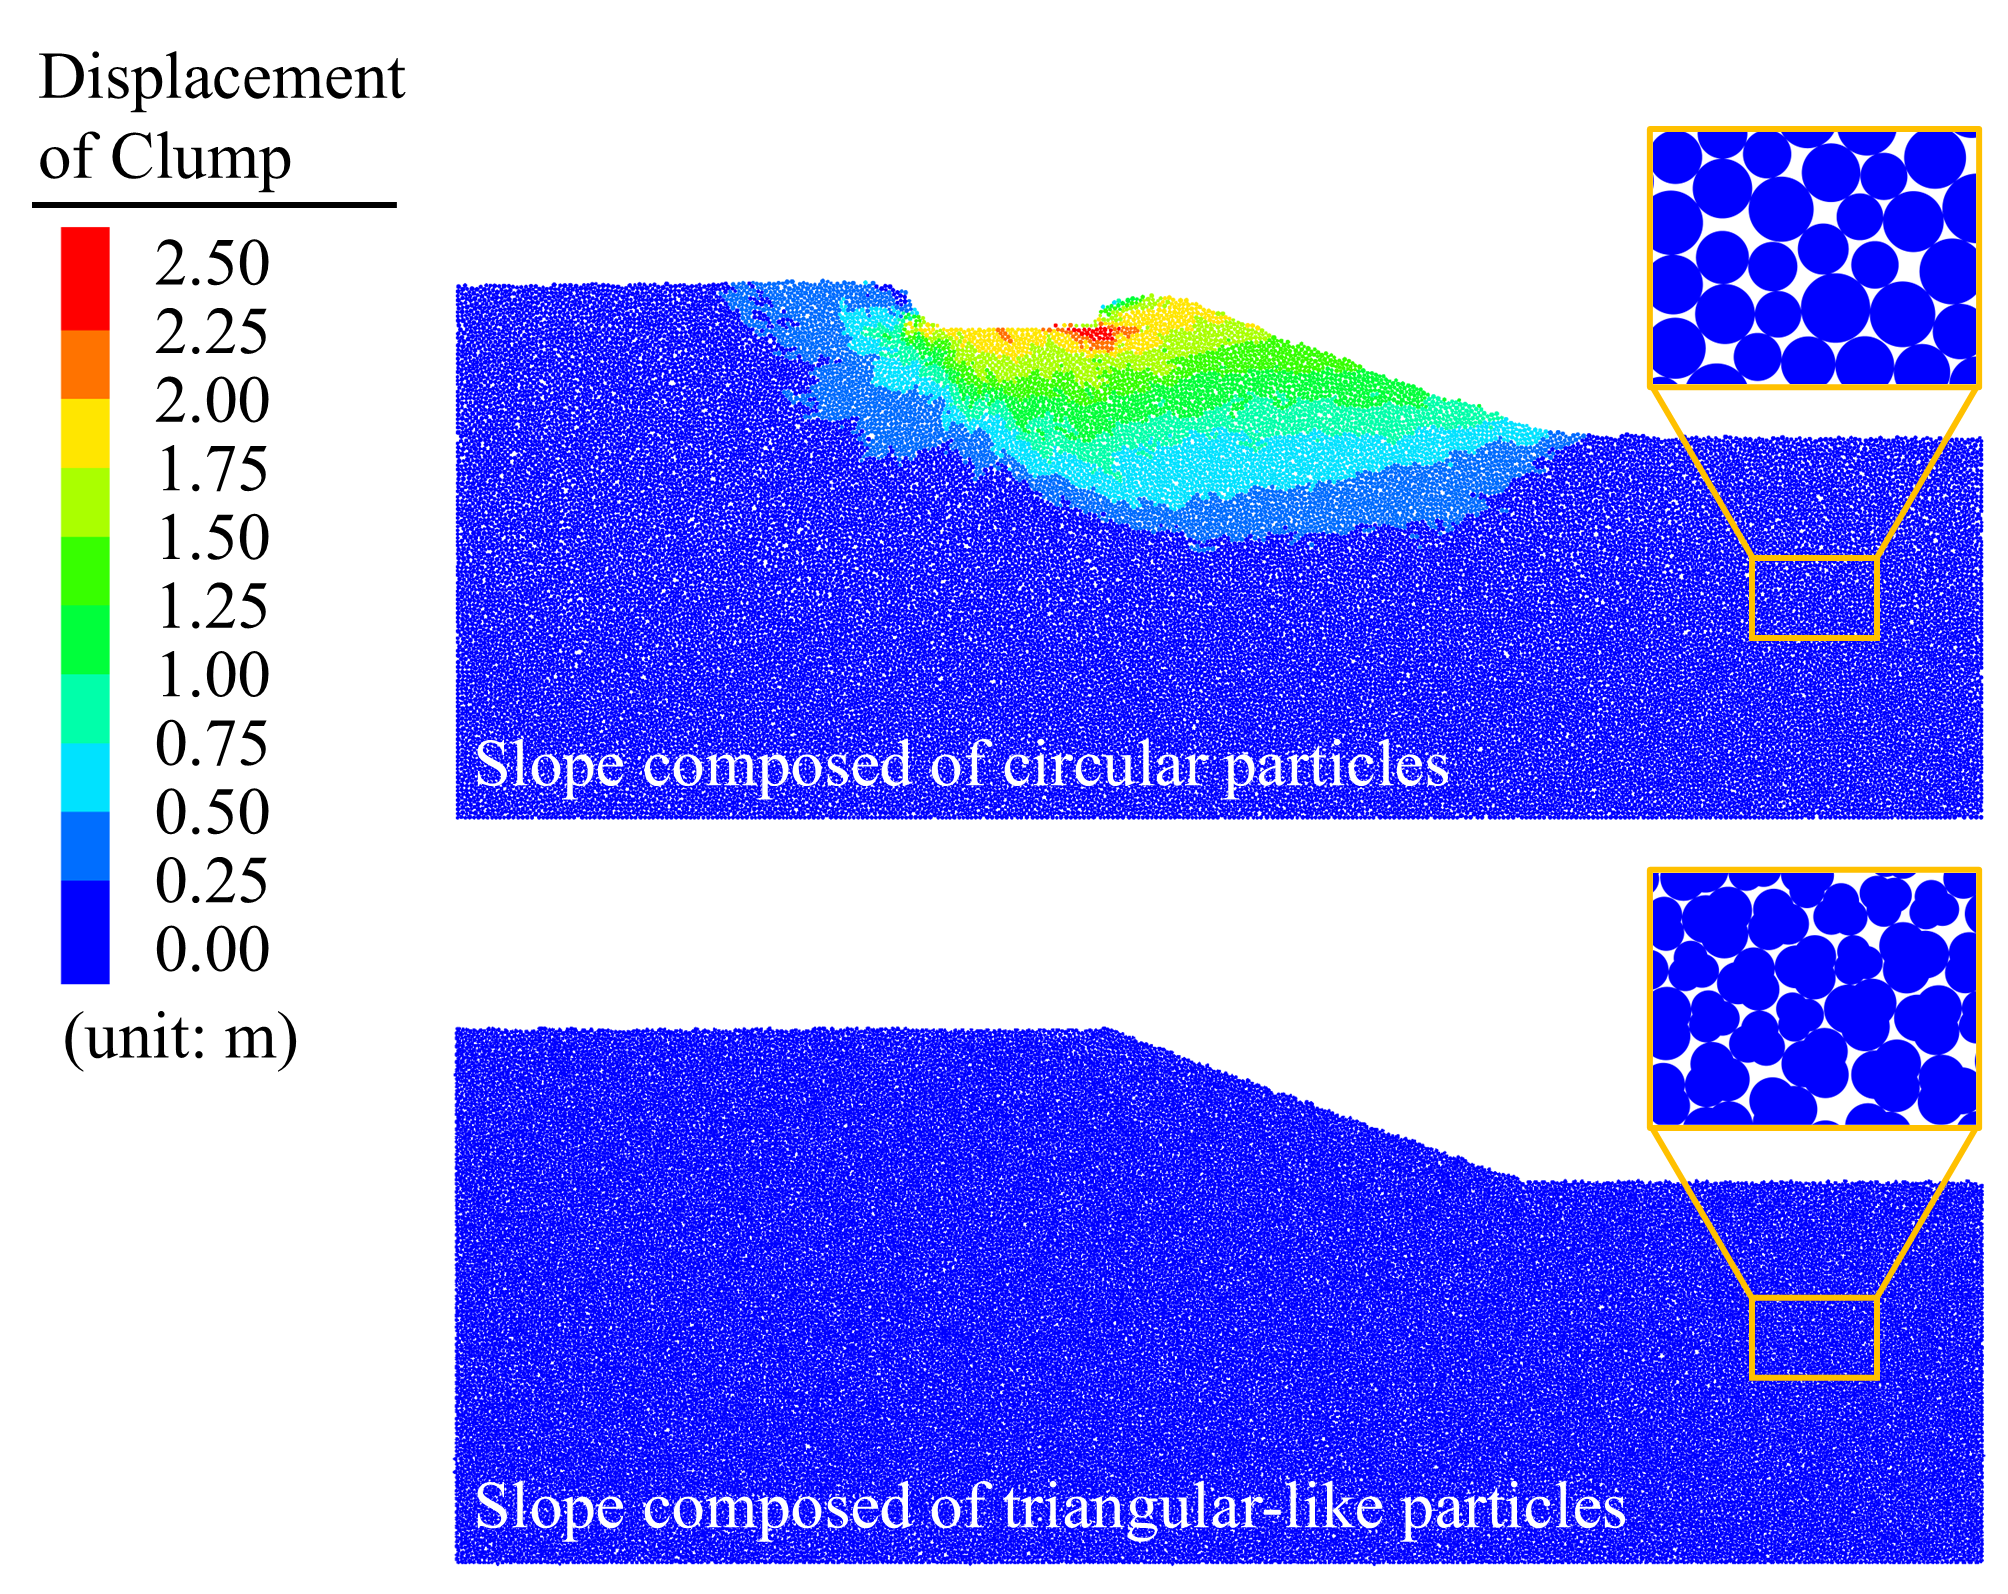
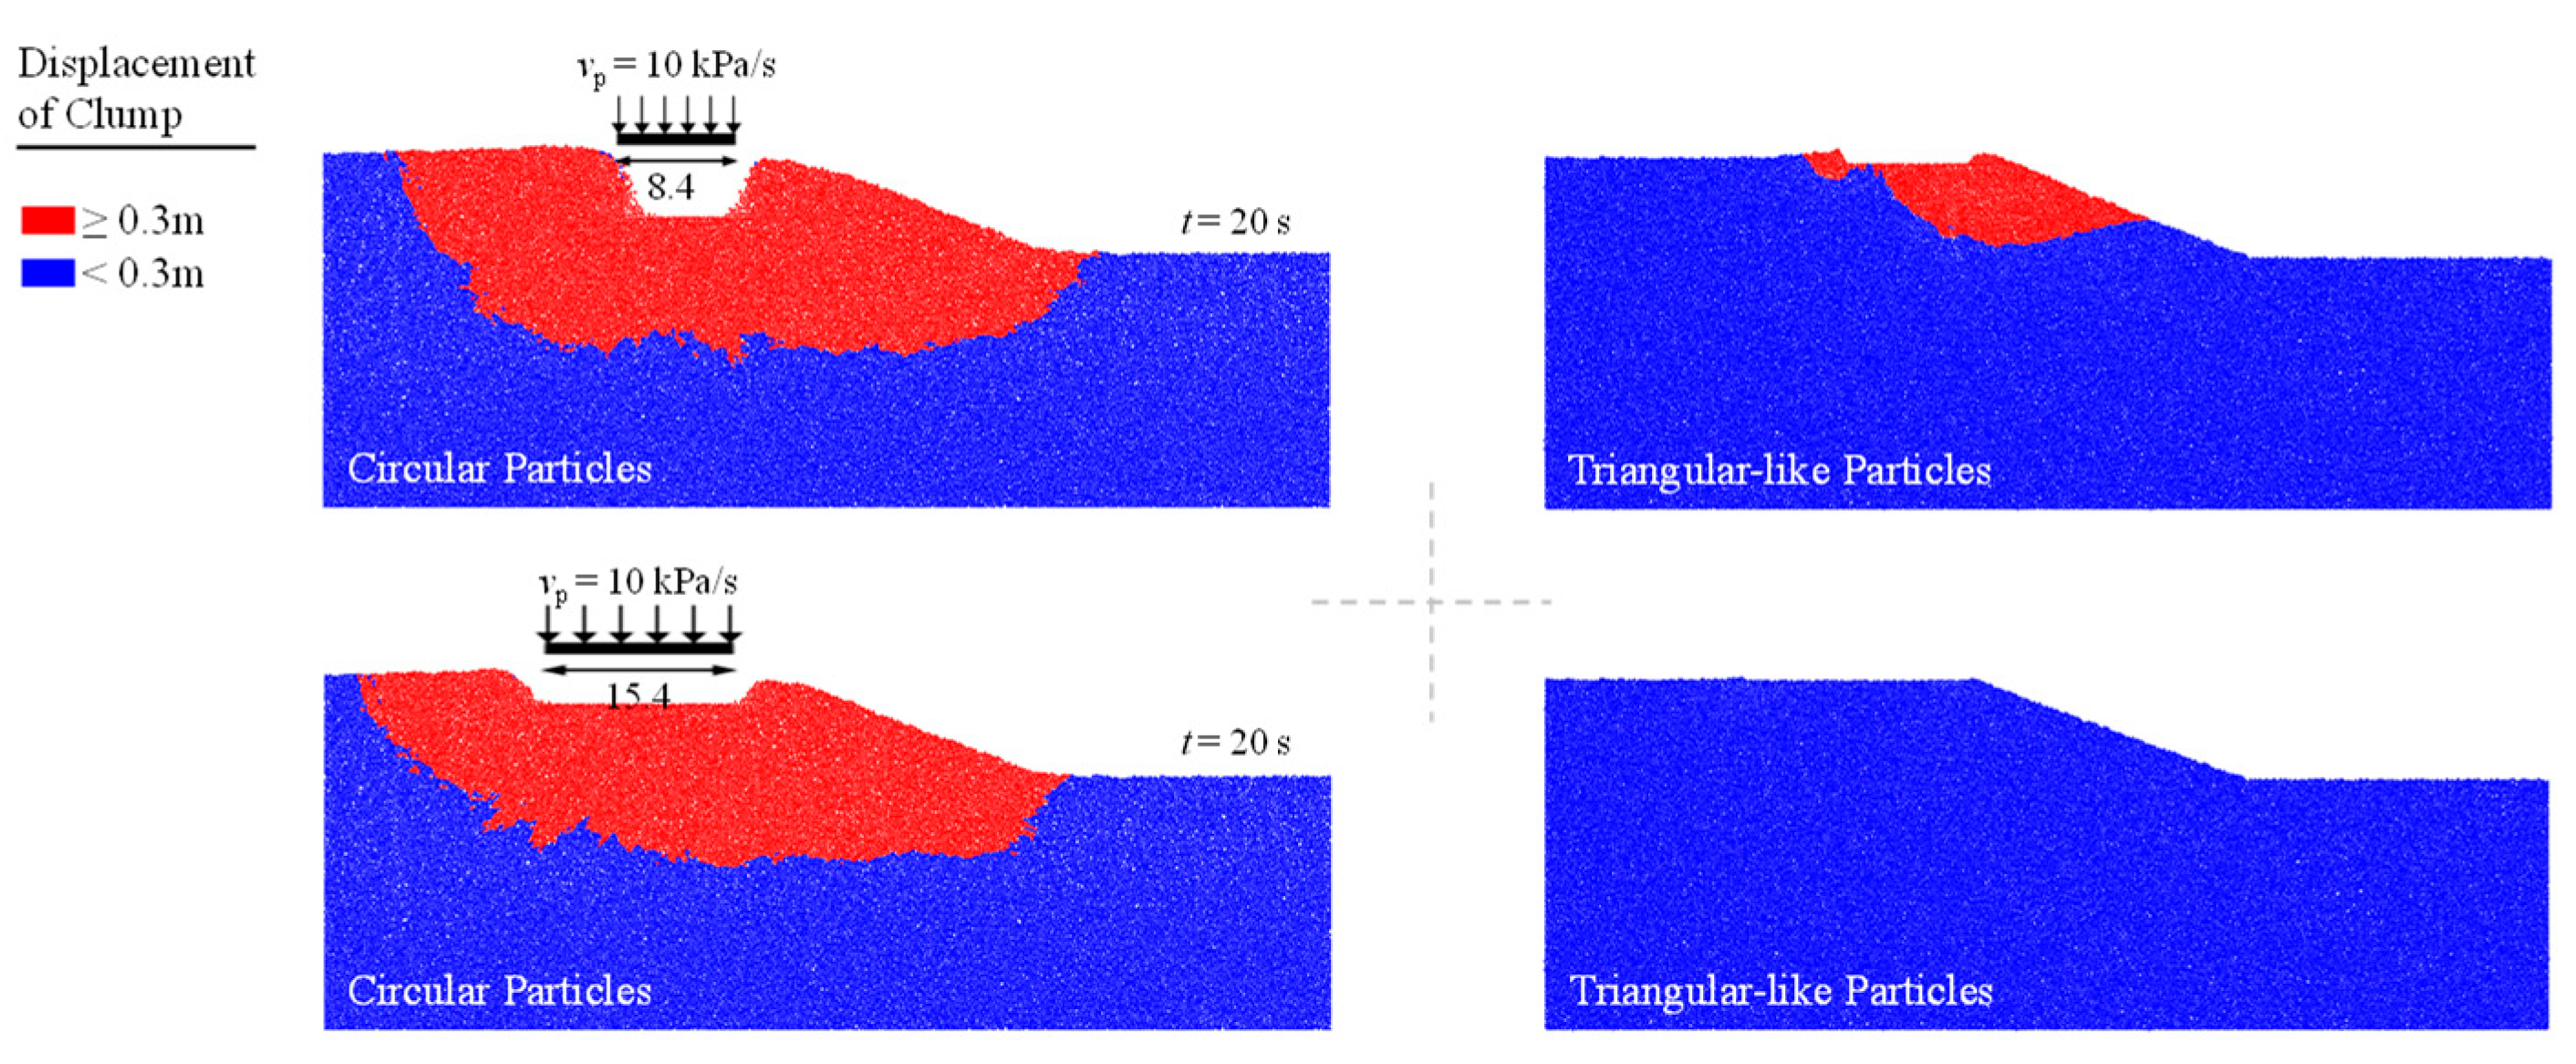
Figure 13 shows the deformation between the slopes with different particle shapes. Here, corresponding to Figure 12, it can be observed through the grid that the top of the slope composed of circular particles showed a large displacement, and the lower particles of the force wall were compressed to the bottom and sides of the force wall. In contrast, no significant deformation is observed for the slope composed of triangular-like particles (Figure 13a). The displacement characteristics of the particles inside the slope also verified these conclusions (Figure 13b). At the same displacement scale, circular particles near the force wall were displaced between 0.25 and 2.5 m, whereas triangular particles were displaced less than 0.25 m. To further investigate the particle deformation after top load application, particle displacement greater than 0.1 m is marked as relatively moving particles (red clump) and displacement less than 0.1 m is marked as relatively stationary particles (blue clump) (Figure 13c). It is found that circular particles on an incline have an area of relative motion that is considerably greater than that of triangular particles. More conditions can be referred to in Figure A1 and Figure A2 of the Appendix A.
In addition, the stress distribution of the slope was also obtained by arranging a measuring circle with a radius of 1.22 m in the slope (Figure 14a). By comparing Figure 14b,c, the direction of the principal stresses in the lower part of the force wall is vertical, while the principal stresses on both sides of the force wall undergo a rotation in favour of the force wall, and the rotation of the principal stresses is related to the application of the overlying load and the displacement of the force wall. In particular, the distribution of principal stresses was influenced by the shape of the particles. Specifically, the bottom stress cross of the force wall with triangular-like particles showed a "+ - shape", indicating that the bottom particles were in a homogeneous pressure environment, and the application of the overlying load did not affect the force transfer between the bottom particles. On the other hand, the bottom principal stresses of the force wall with circular particles were still in the vertical direction († - shape), and the application of the overlying load affected the force transfer between the bottom particles.
It can be concluded that particle shape affects the results of slope deformation. This may be related to the previous statement that particle shape affects the contact mode and the form of motion. And it is also further the applicability and effectiveness of the numerical method proposed in this paper.
6. Conclusions
In this paper, we conducted a series of stress-controlled numerical simulations, laboratory triaxial tests, and simulation of instability of cohesionless soil slopes. The conclusions can be made as shown in follows:
(1) Both numerical simulations and laboratory tests have shown that, under a similar condition, irregular particle samples exhibit a higher peak stress than regular particle samples. This also means that the instability of regular particle samples occurs in a shorter time; A stick-slip behaviour is observed in a sample with regular particle shape, and the curves of ε1- t and Δu-t show a "step-like" behaviour, and the stress path shows a " sawtooth " pattern. In contrast, the test curve for sample with irregular particle shape remains smooth.
(2) Numerical simulation results show that, there are differences in contact force, coordination number and form of particle motion in samples with different shapes of particles. And this is shown by the fact that the coordination number (CN) and contact sliding rate of irregular particles are larger than those of circular particles, while the cumulative rotation angle of particles and the percentage of strong chains of irregular particles are smaller than those of circular particles. Therefore, the differences in shear and instability characteristics between different shapes may be related to the contact mode between particles, the form of motion and other factors.
(3) The engineering case of cohesionless slope instability under external force indicates that under shape-influenced conditions, there are differences in the displacement trends of the force wall, the deformation of the slope and the displacement of the internal particles, as well as the distribution of the stresses. It also shows that the slope is more stable when it is composed of irregular particles.
Author Contributions
Conceptualization, L.H. J.J. Z.Z. and A.Z.; methodology, L.H..; software, L.H.; validation, Y.Z., Y.H. Z.Z. and A.Z.; resources, L.H.; data curation, L.H.; writing—original draft preparation, L.H.; writing—review and editing, L.H. J.J. Z.Z. Y.Z. Y.H. and A.Z.; visualization, L.H. and J.J.; supervision, Q.D. Y.Z. and Y.H.; project administration, L.H. and Q.D.; funding acquisition, L.H. and Q.D. All authors have read and agreed to the published version of the manuscript.
Funding
This study is supported by the funding from the China Scholarship Council (CSC) and the National Natural Science Foundation of China (No. 42077269). These financial supports are gratefully acknowledged. The author (L. H.) would like to express his thanks to Dr X. Liu, an outstanding teacher from Chang’an University.
Data Availability Statement
Data will be made available on request.
Acknowledgments
The author (L. H.) would like to express his thanks to Ms. Wenwei Li, an outstanding Senior Associate Publisher from MDPI. The author thanks her for the invitation and generous assistance that made this paper possible.
Conflicts of Interest
The remaining authors declare that the research was conducted in the absence of any commercial or financial relationships that could be construed as a potential conflict of interest.
Appendix A
Figure A1.
Deformation of slopes at different force wall loading rates under different particle shape.
Figure A1.
Deformation of slopes at different force wall loading rates under different particle shape.
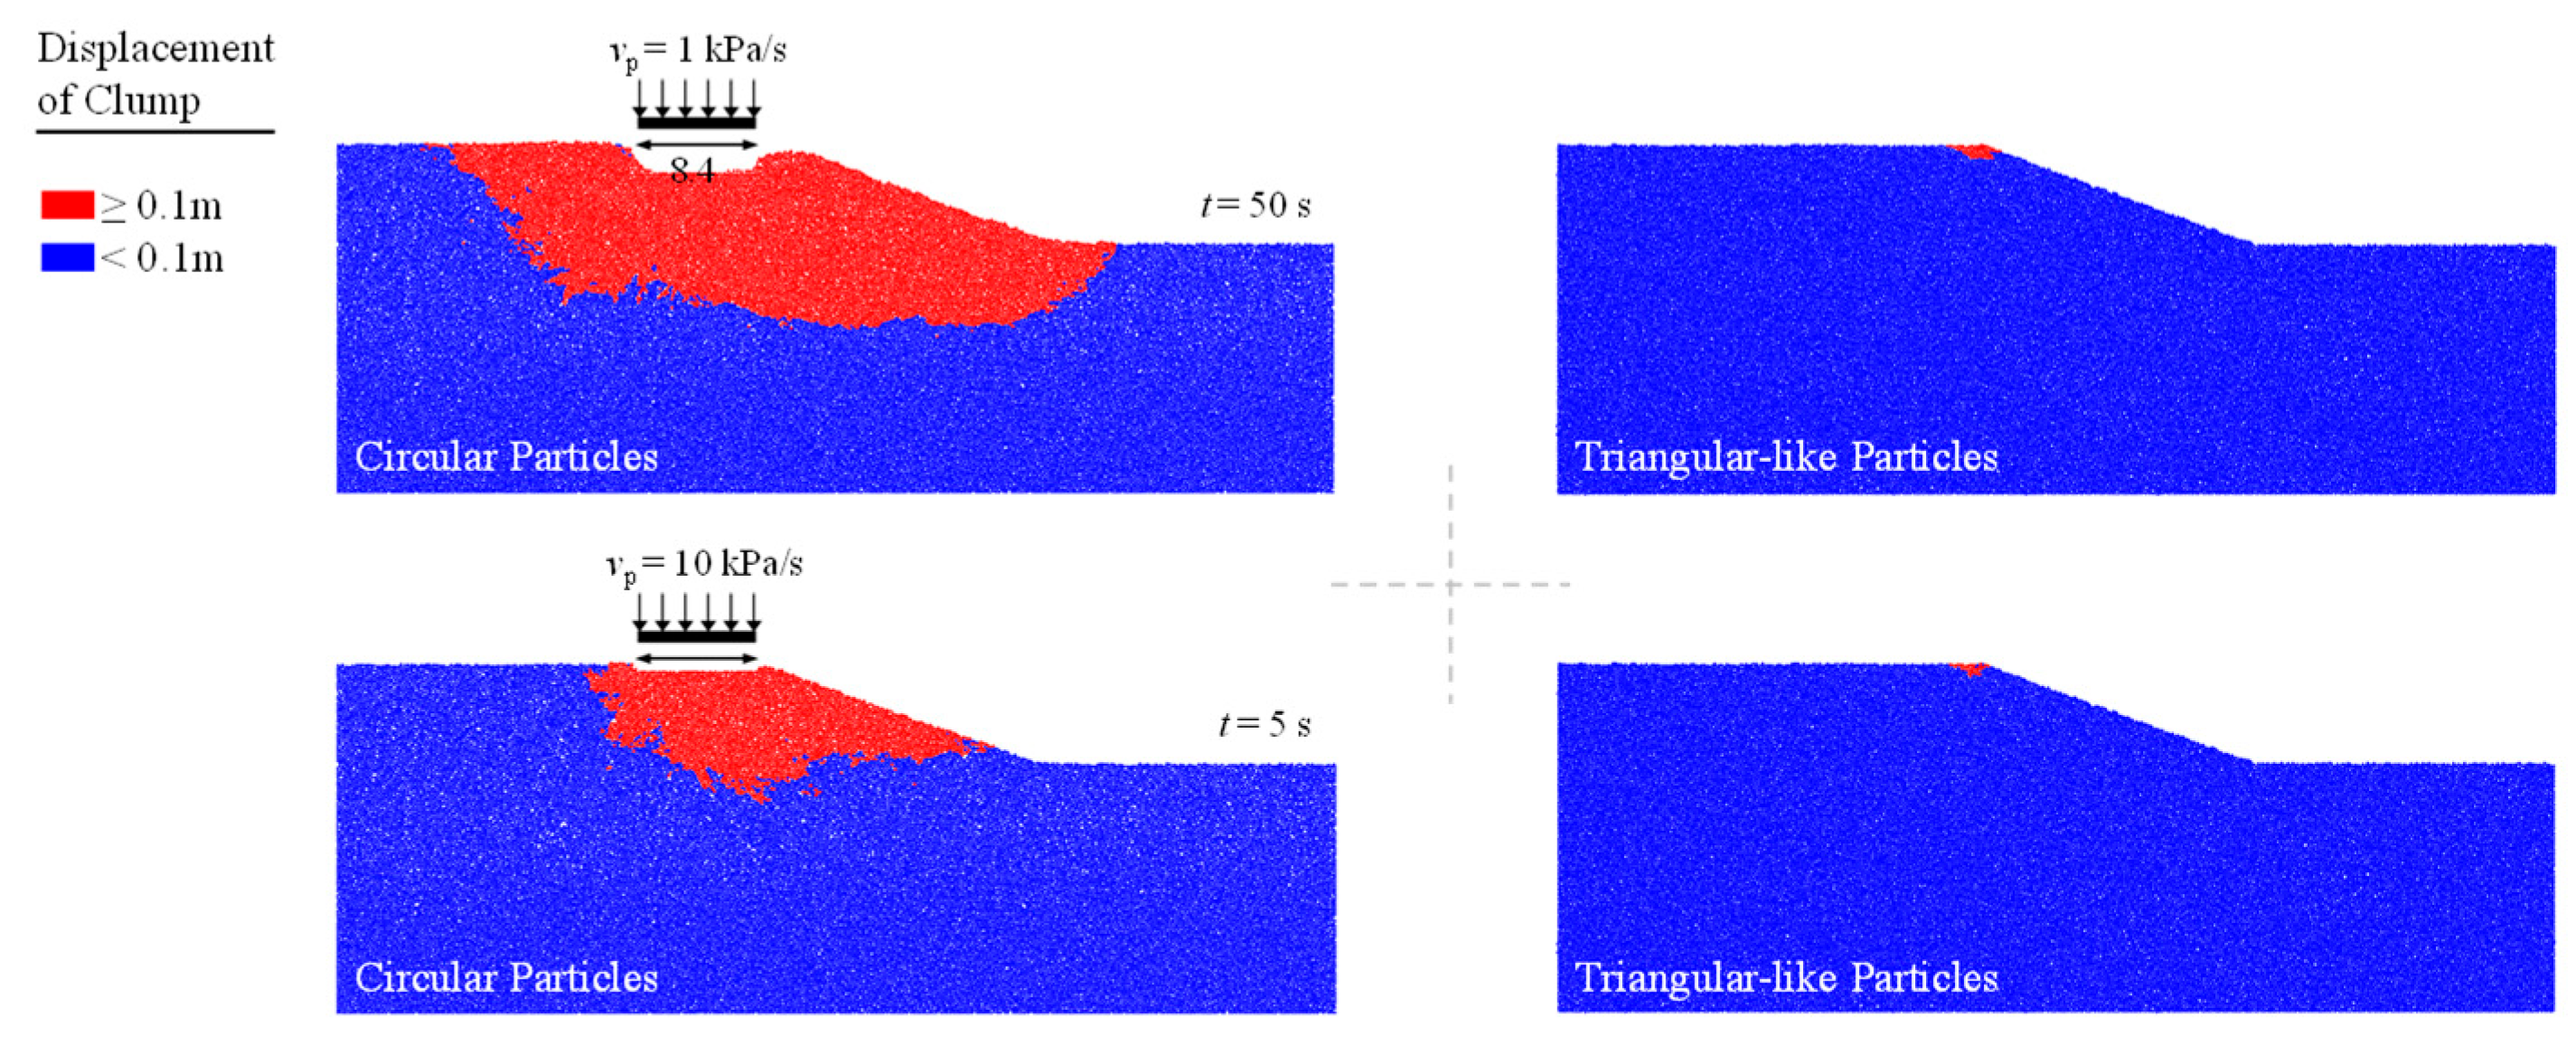
Figure A2.
Deformation of slopes at different force wall widths under different particle shape.
References
- Cho, G.C.; Dodds, J.; Santamarina, J.C. Particle shape effects on packing density, stiffness, and strength: natural and crushed sands. J. Geotech. Geoenviron. Eng. 2006, 132, 591–602. [Google Scholar] [CrossRef]
- Yang, J.; Luo, X.D. Exploring the relationship between critical state and particle shape for granular materials. J. Mech. Phys. Solids 2015, 84, 196–213. [Google Scholar] [CrossRef]
- Zhao, S.; Zhou, X.; Liu, W. Discrete element simulations of direct shear tests with particle angularity effect. Granul. Matter 2015, 17, 793–806. [Google Scholar] [CrossRef]
- Gong, J.; Liu, J. Effect of aspect ratio on triaxial compression of multi-sphere ellipsoid assemblies simulated using a discrete element method. Particuology 2017, 32, 49–62. [Google Scholar] [CrossRef]
- Nie, Z.H.; Zhu, Y.G.; Wang, X. Investigating the effects of Fourier-based particle shape on the shear behaviors of rockfill material via DEM. Granul. Matter 2019, 21, 22. [Google Scholar] [CrossRef]
- Gong, J.; Pang, X.; Tang, Y.; Liu, M.; Jiang, J.; Ou, X. Effects of particle shape, physical properties and particle size distribution on the small-strain stiffness of granular materials: A DEM study. Comput. Geotech. 2024, 165, 105903. [Google Scholar] [CrossRef]
- Huang, L.; Du, Y.; Deng, Q. Evaluating the reasonableness of mechanical characterization of the indexes of granular soil sparsity in engineering constructions: Insights from the collapsibility index. Results Eng. 2025, 26, 105291. [Google Scholar] [CrossRef]
- Wu, Z.; Huang, L.; Deng, Q. Analysis of factors effect on the shear characteristics of granular soils under conditions of increasing axial stress in biaxial compression test via DEM. Comput. Particle Mech. 2025, 12, 2151–2162. [Google Scholar] [CrossRef]
- Wei, L.M.; Yang, J. On the role of grain shape in static liquefaction of sand-fines mixtures. Géotechnique 2014, 64, 740–745. [Google Scholar] [CrossRef]
- Gong, J.; Nie, Z.; Zhu, Y.; Liang, Z.Y.; Wang, X. Exploring the effects of particle shape and content of fines on the shear behavior of sand-fines mixtures via the DEM. Comput. Geotech. 2019, 106, 161–176. [Google Scholar] [CrossRef]
- Chu, J. Discussion on 'Quasi-steady state: a real behaviour? '. Can. Geotech. J. 1999, 36, 190–191. [Google Scholar] [CrossRef]
- Chu, J.; Leong, W.K. Pre-failure strain softening and pre-failure instability of sand: a comparative study. Géotechnique 2001, 51, 311–321. [Google Scholar] [CrossRef]
- Zhou, Q.J.; Chen, X.; Huang, L. Reconstruction and application of the stress control Tri-axial apparatus. Chin. J. Undergr. Space Eng. 2011, 7, 469–473. (in Chinese). [Google Scholar]
- Wanatowski, D.; Chu, J. Factors affecting pre-failure instability of sand under plane-strain conditions. Géotechnique 2012, 62, 121–135. [Google Scholar] [CrossRef]
- Gutiérrez-Ch, J.G.; Senent, S.; Graterol, E.P. Rock shear creep modelling: DEM-Rate process theory approach. Int. J. Rock Mech. Min. Sci. 2023, 161, 105295. [Google Scholar] [CrossRef]
- Da Cruz, F.; Emam, S.; Prochnow, M.; Roux, J.N.; Chevoir, F. Rheophysics of dense granular materials: discrete simulation of plane shear flows. Phys. Rev. E 2005, 72, 021309. [Google Scholar] [CrossRef] [PubMed]
- Zhang, W.G.; Lin, S.; Wang, L.Q.; Wang, L.; Jiang, X.; Wang, S. A novel creep contact model for rock and its implement in discrete element simulation. Comput. Geotech. 2024, 167, 106054. [Google Scholar] [CrossRef]
- Huang, L.; Deng, Q.L.; Wang, H.N. Instability behavior of loose granular material: A new perspective via DEM. Granul. Matter 2024, 26, 84. [Google Scholar] [CrossRef]
- Li, J.P.; Li, L. Theoretical analysis of long-term setup of driven piles considering soil anisotropy, destructuration and creep effects. Ocean Eng. 2021, 239, 109821. [Google Scholar] [CrossRef]
- Hu, Q.B.; Li, Y.L.; Wu, N.Y. Study on creep behaviors and nonlinear creep constitutive model for sandy marine hydrate-bearing sediments. Ocean Eng. 2023, 286, 115717. [Google Scholar] [CrossRef]
- Xiao, Y.; Long, L.; Evans, T.M.; Zhou, H.; Liu, H.L.; Stuedlein, A.W. Effect of particle shape on stress-dilatancy responses of medium-dense sands. J. Geotech. Geoenviron. Eng. 2019, 145, 04018105. [Google Scholar] [CrossRef]
- Zhang, X.L.; Wang, X.L.; Chen, S.L.; Xu, C.S. Biaxial compression test and application considering interparticle rolling resistance and particle shape effects. Soil Dyn. Earthq. Eng. 2020, 139, 106394. [Google Scholar] [CrossRef]
- Nie, Z.H.; Liu, S.K.; Hu, W.; Gong, J. Effect of local non-convexity on the critical shear strength of granular materials determined via the discrete element method. Particuology 2020, 52, 105–112. [Google Scholar] [CrossRef]
- Huang, L. Experimental and numerical simulation study on the influence of sand shape on shear characteristics. Master’s Thesis, Chang’an University, Xi’an, China, 2023. (in Chinese). [Google Scholar]
- Yang, J.; Dai, B.B. Is the quasi-steady state a real behaviour? A micromechanical perspective. Géotechnique 2011, 61, 175–183. [Google Scholar] [CrossRef]
- Yang, Z.X.; Yang, J.; Wang, L.Z. Micro-scale modeling of anisotropy effects on undrained behavior of granular soils. Granul. Matter 2013, 15, 557–572. [Google Scholar] [CrossRef]
- Zhu, Y.G.; Nie, Z.H.; Gong, J.; Zou, J.F.; Zhao, L.H.; Li, L. An analysis of the effects of the size ratio and fines content on the shear behaviors of binary mixtures using DEM. Comput. Geotech. 2020, 118, 103353. [Google Scholar] [CrossRef]
- Azéma, E.; Radjaï, F.; Peyroux, R. Force transmission in a packing of pentagonal particles. Phys. Rev. E 2007, 76, 011301. [Google Scholar] [CrossRef]
- Nguyen, D.H.; Azéma, E.; Sornay, P.; Radjaï, F. Effects of shape and size polydispersity on strength properties of granular materials. Phys. Rev. E 2015, 91, 032203. [Google Scholar] [CrossRef]
Figure 1.
Conceptual framework considering the different stress loading rates and maximum wall servo speed of loose granular material (modified from Huang et al [18]).
Figure 1.
Conceptual framework considering the different stress loading rates and maximum wall servo speed of loose granular material (modified from Huang et al [18]).
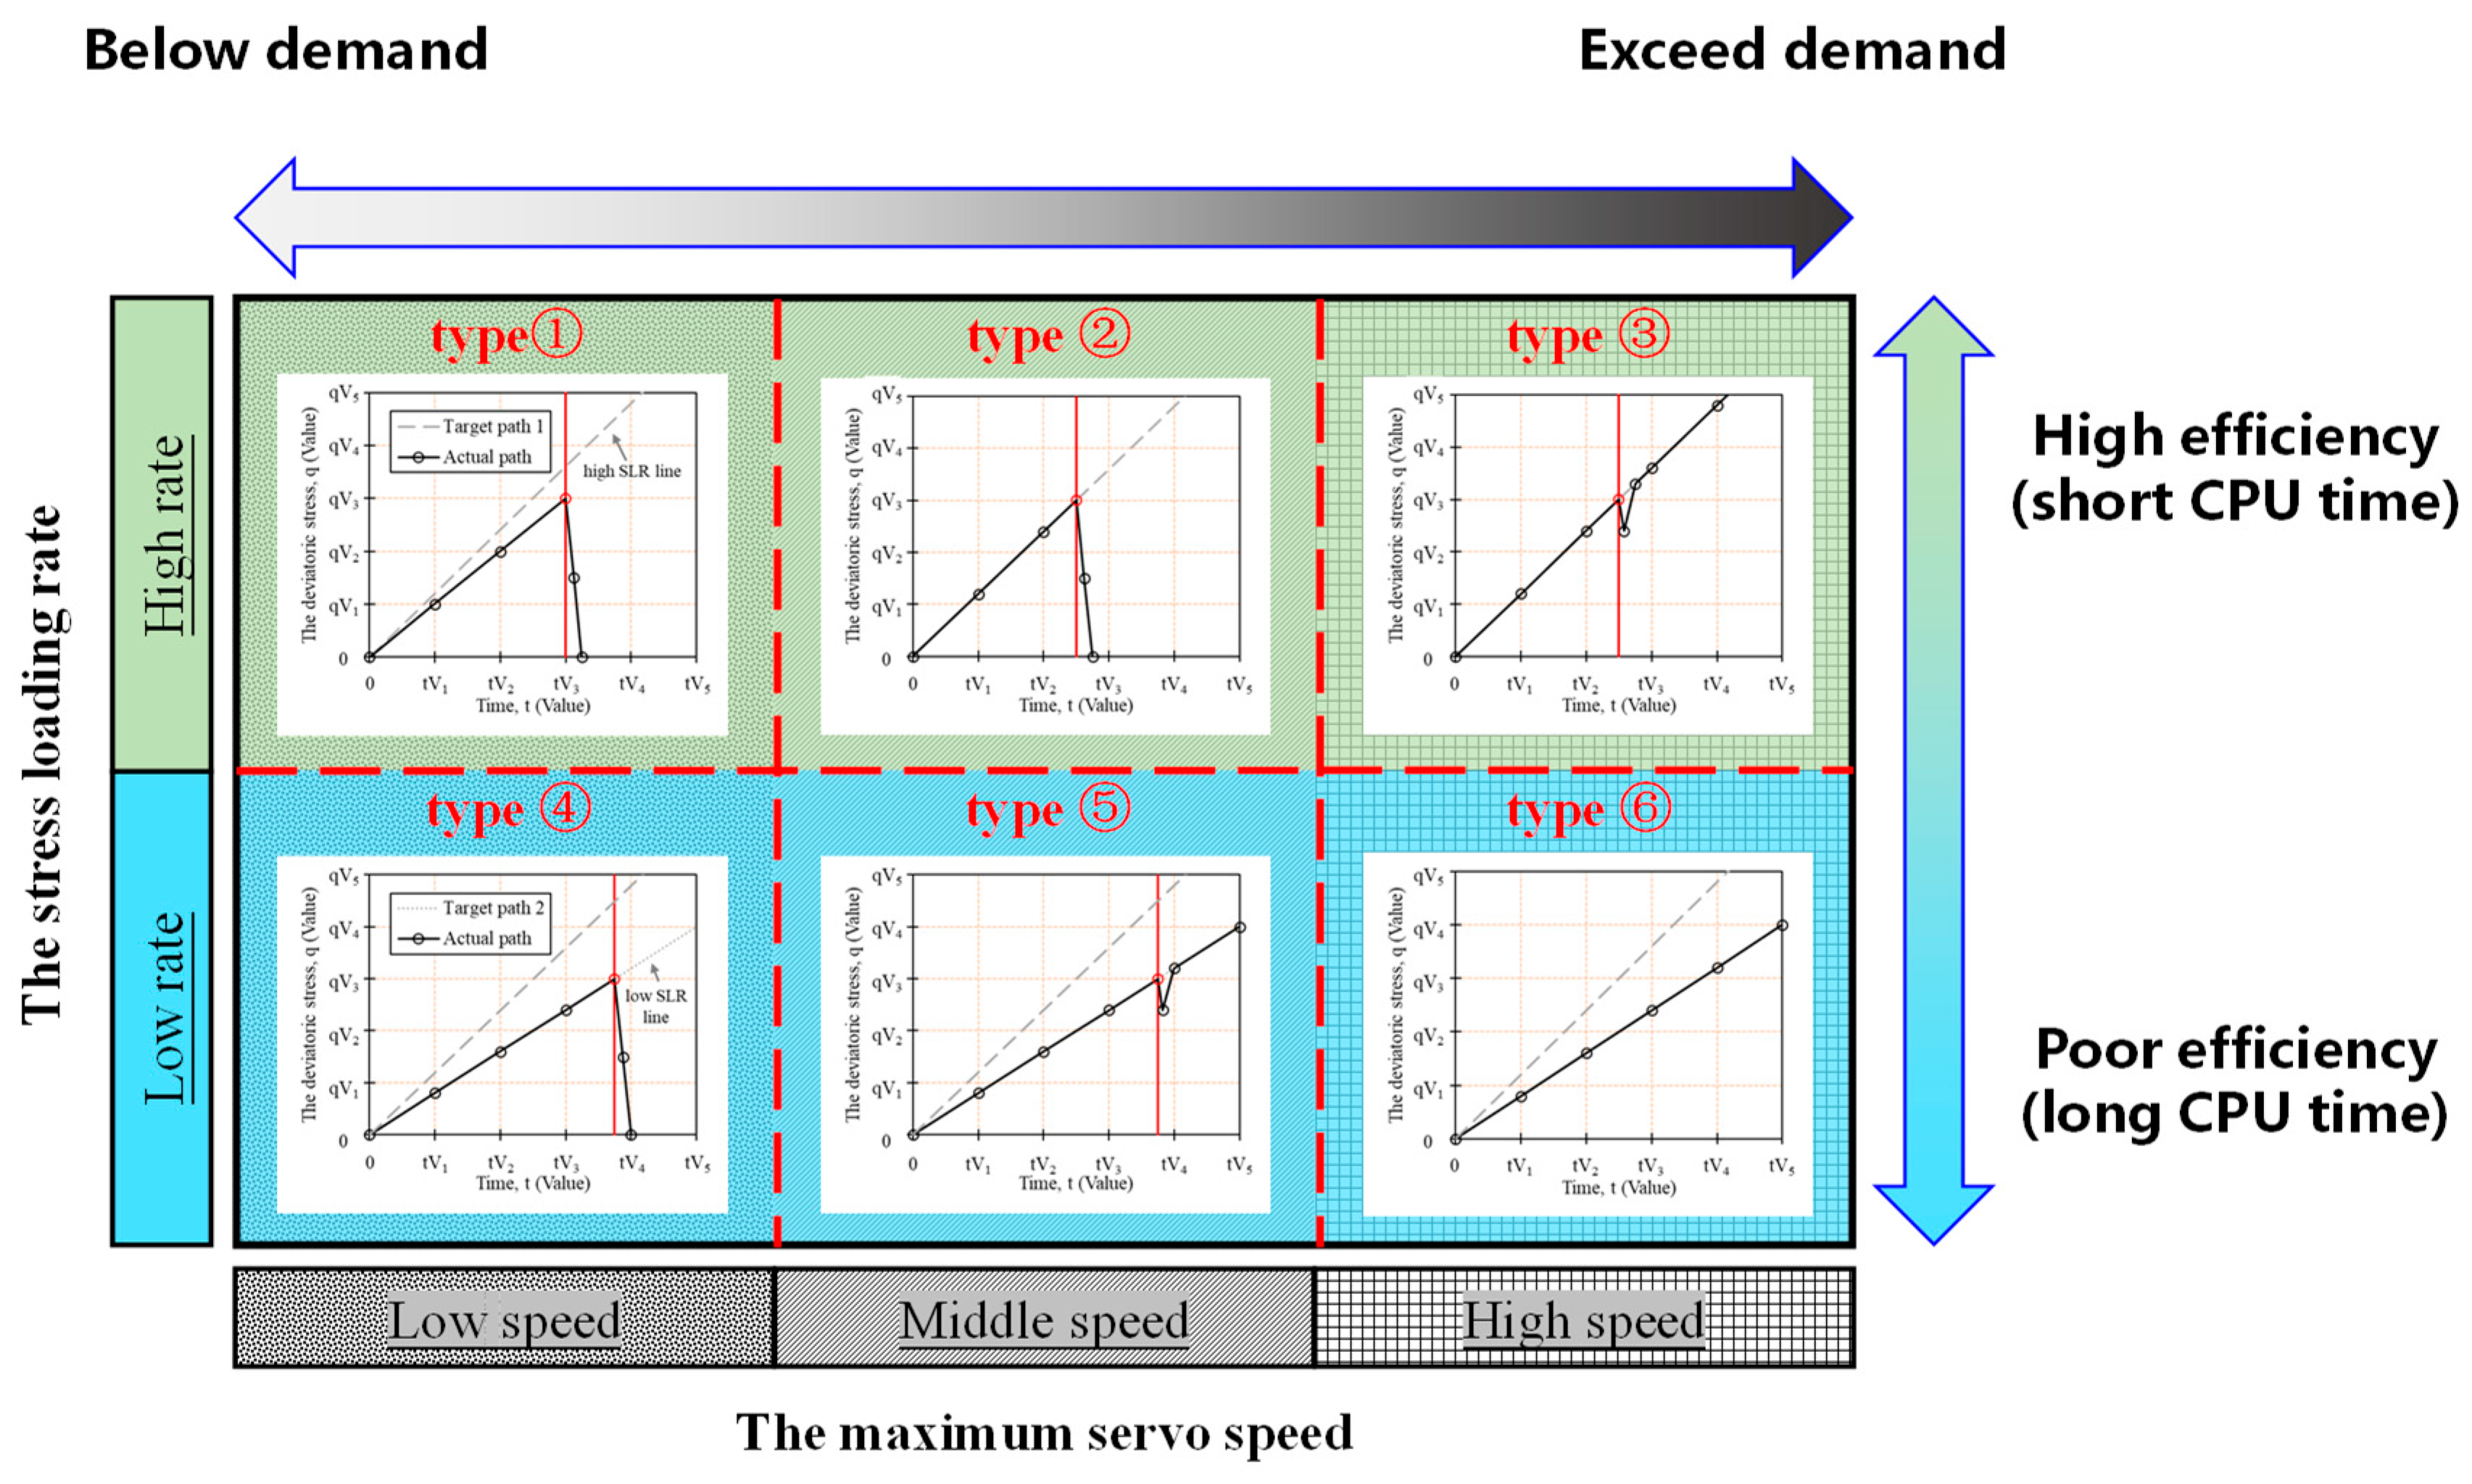
Figure 2.
Particle shape and sample preparation.
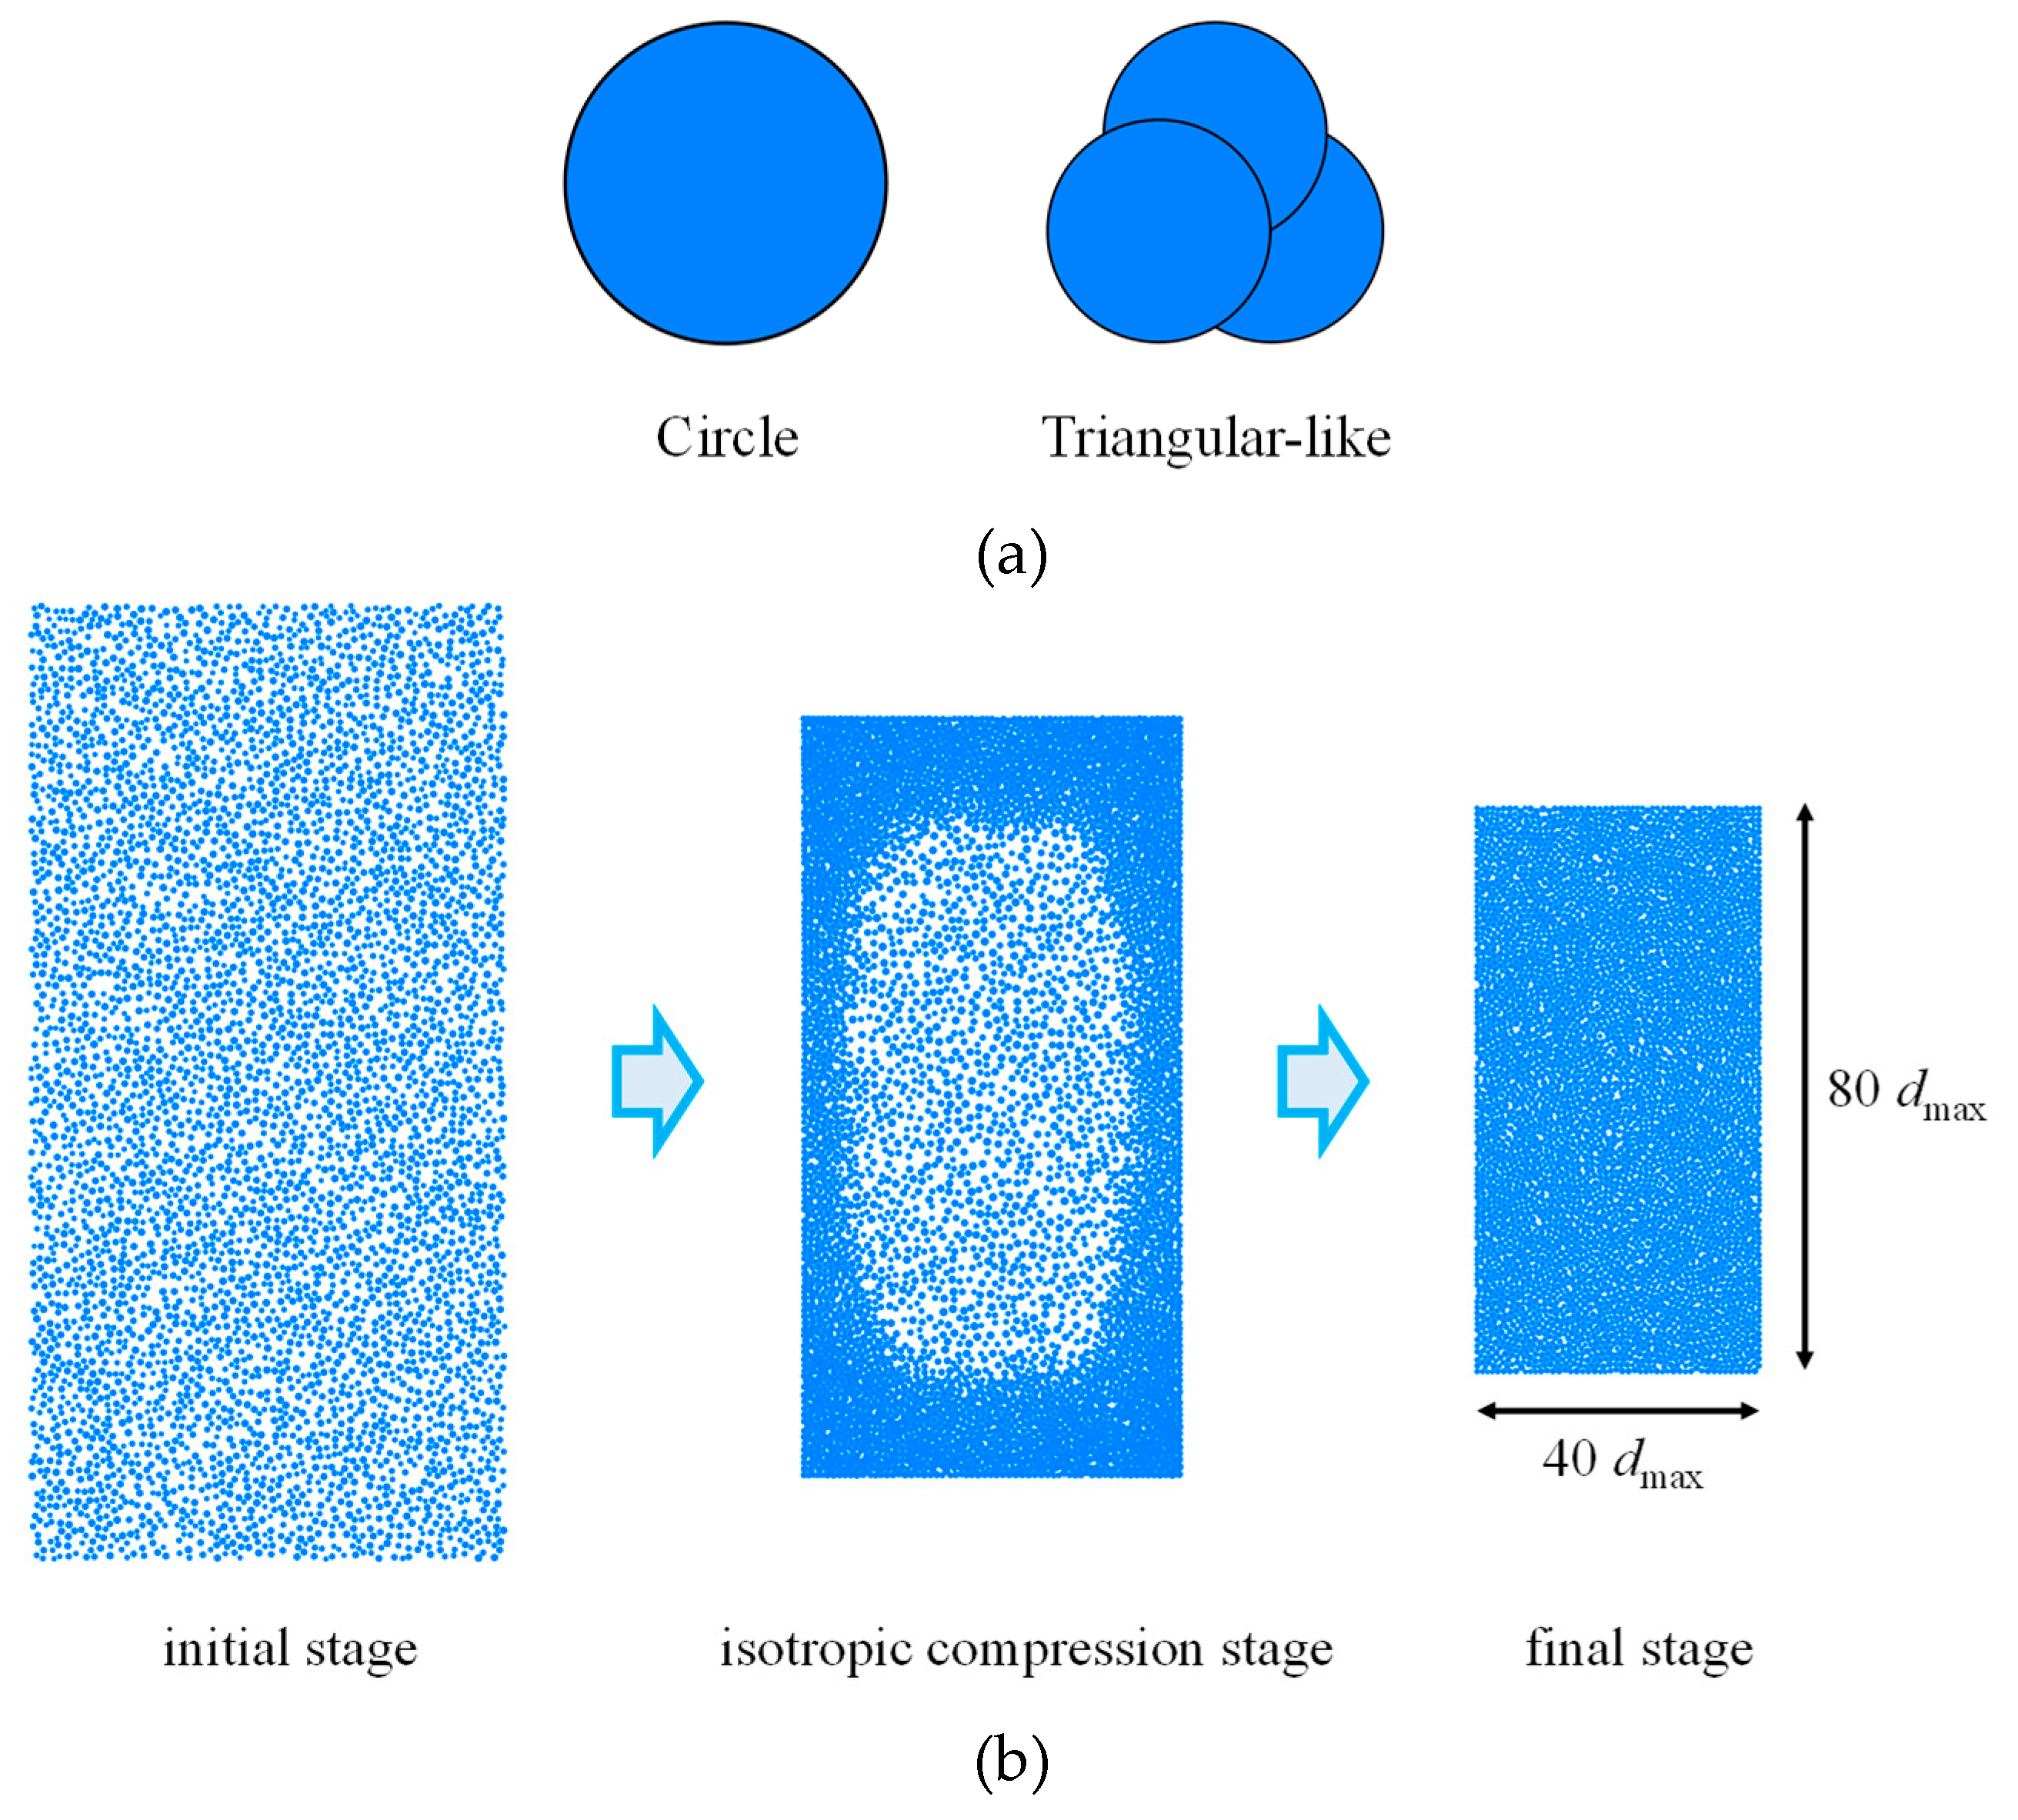
Figure 3.
Simulation results of different shape (confining stress = 200 kPa): (a) Evolutions of deviatoric stress (b) axial strain curves; (c) excess pore water pressure curves; (d) stress paths.
Figure 3.
Simulation results of different shape (confining stress = 200 kPa): (a) Evolutions of deviatoric stress (b) axial strain curves; (c) excess pore water pressure curves; (d) stress paths.
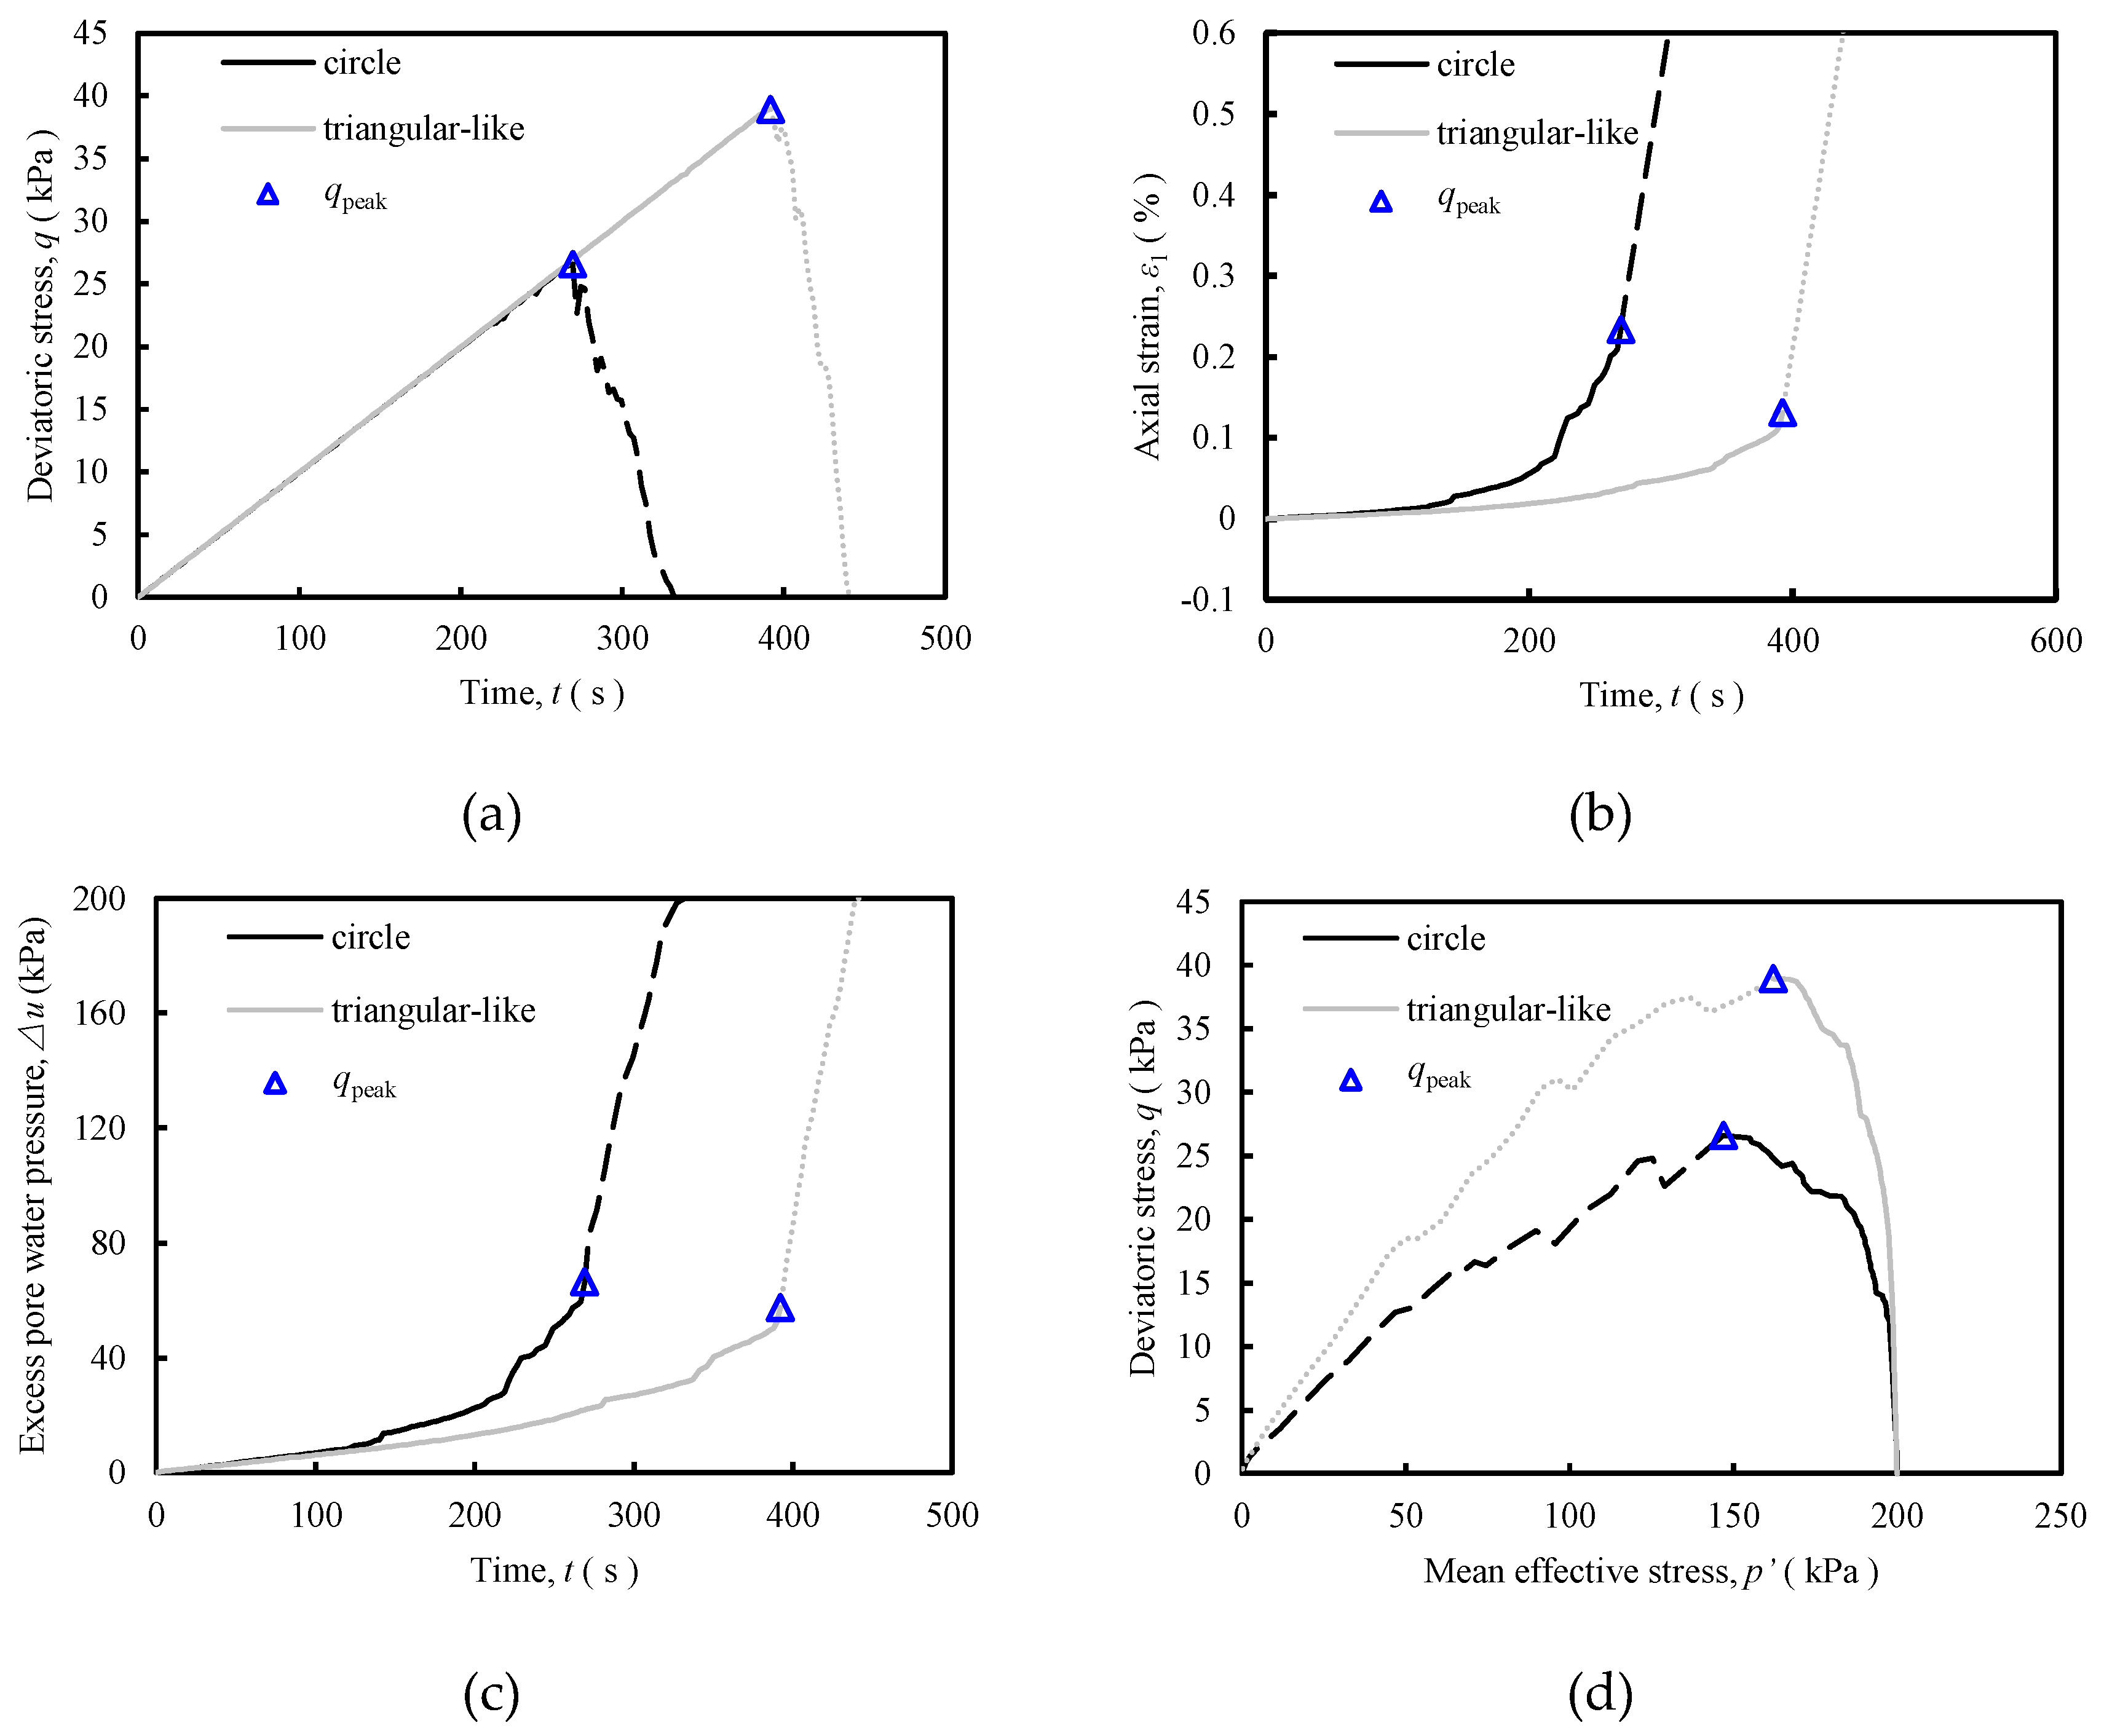
Figure 4.
Test results of different shape (σ’3 = 100 kPa, initial relative density of sample = 0.2, force loading rate = 0.5 N/min) (data from Huang [24]): (a) microscopic images of tested materials; (b) Evolutions of axial force; (c) axial strain curves; (d) excess pore water pressure curves; (e) stress paths.
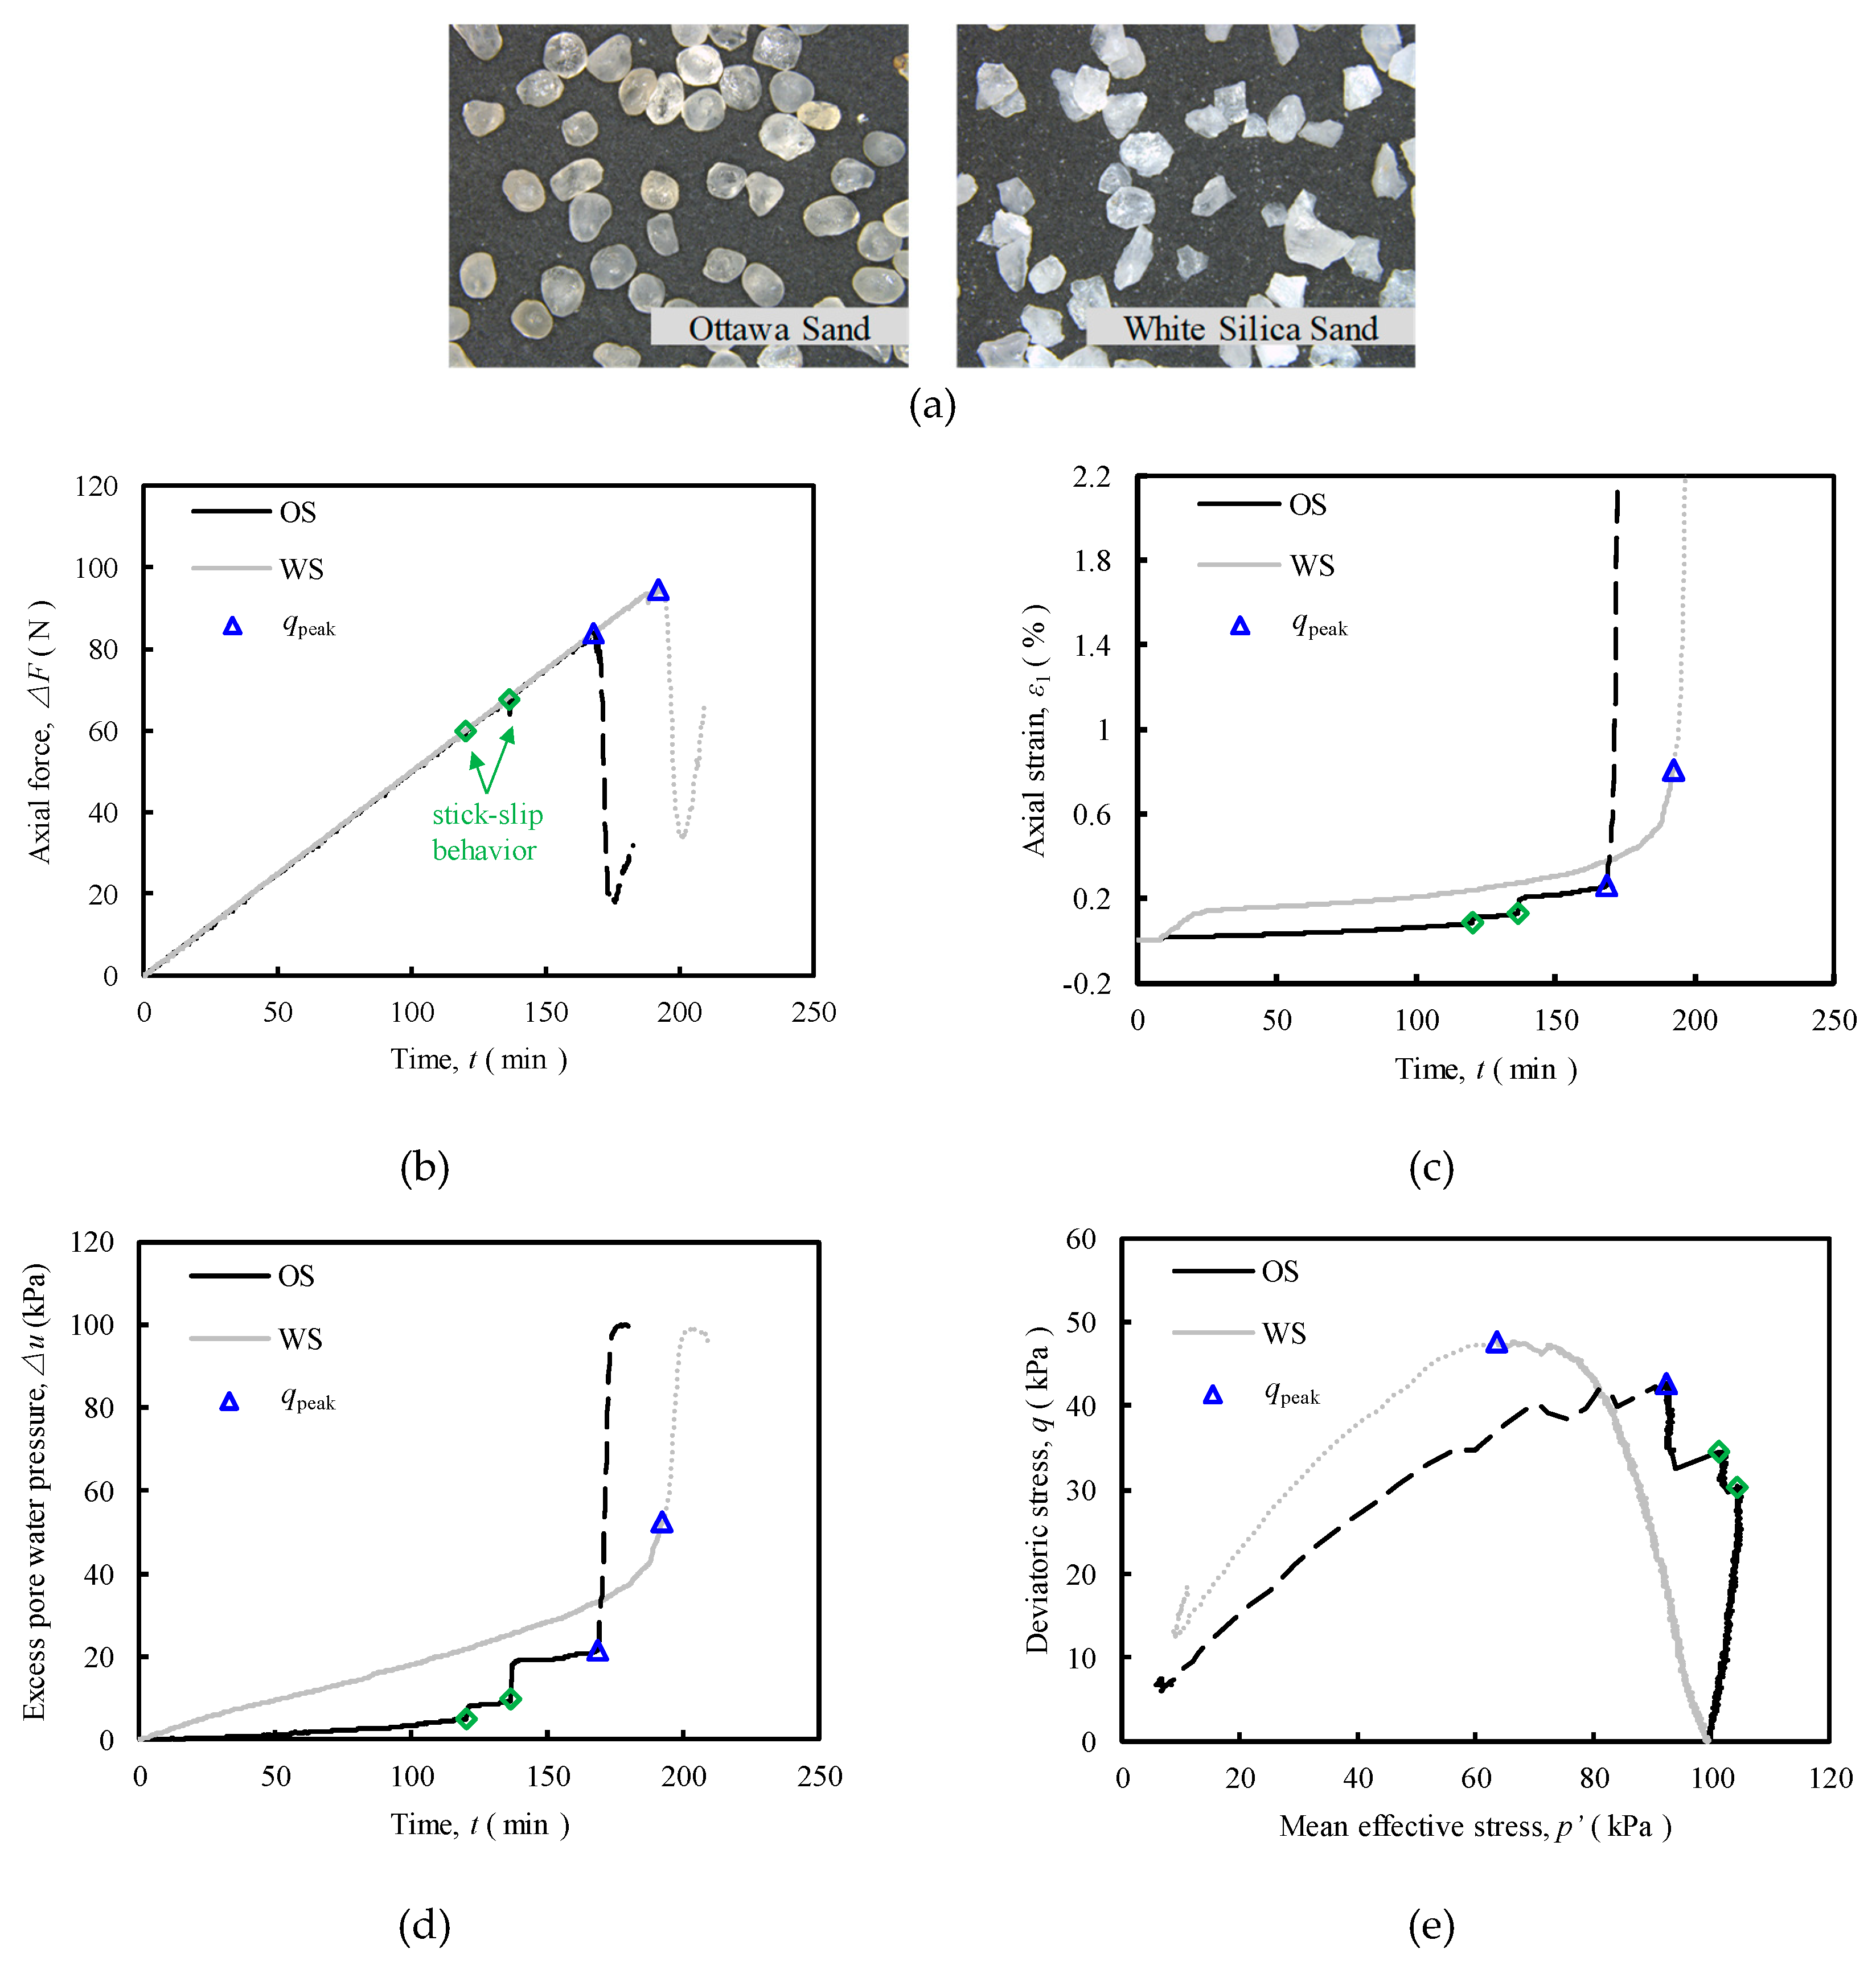
Figure 5.
Contact force networks at the initial, peak and liquefaction state.
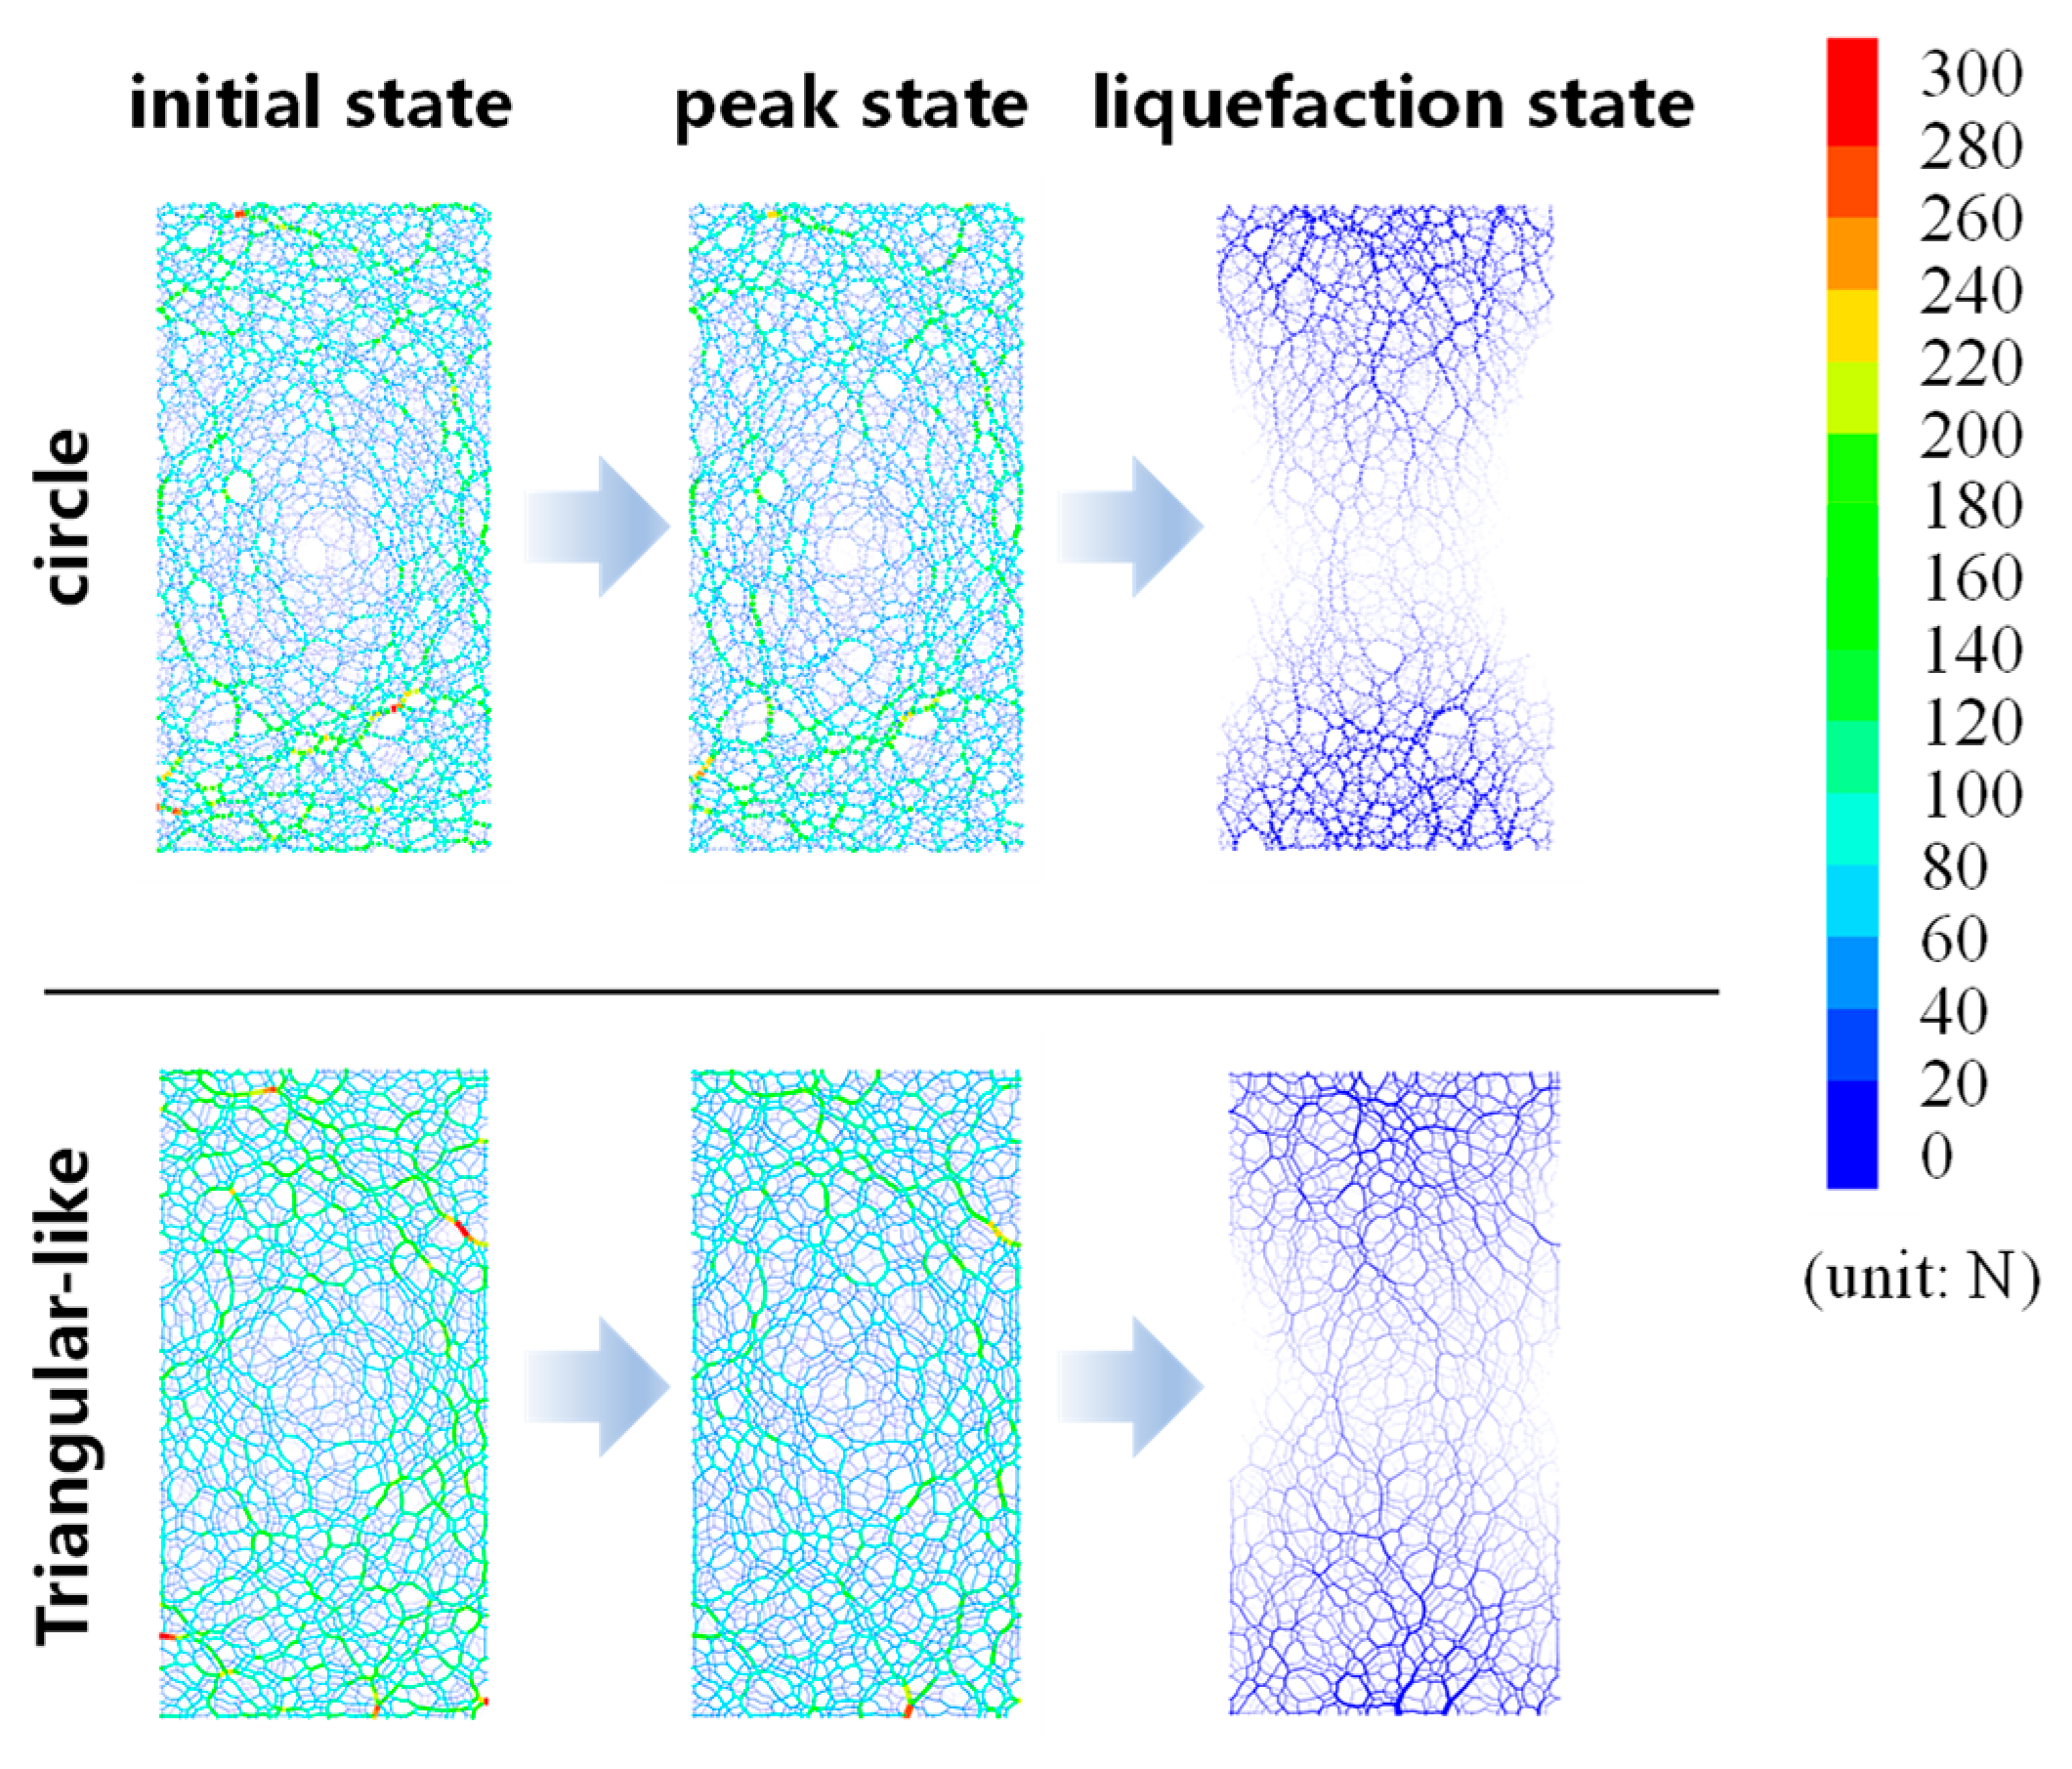
Figure 6.
Contact force networks at the initial, peak and liquefaction state.
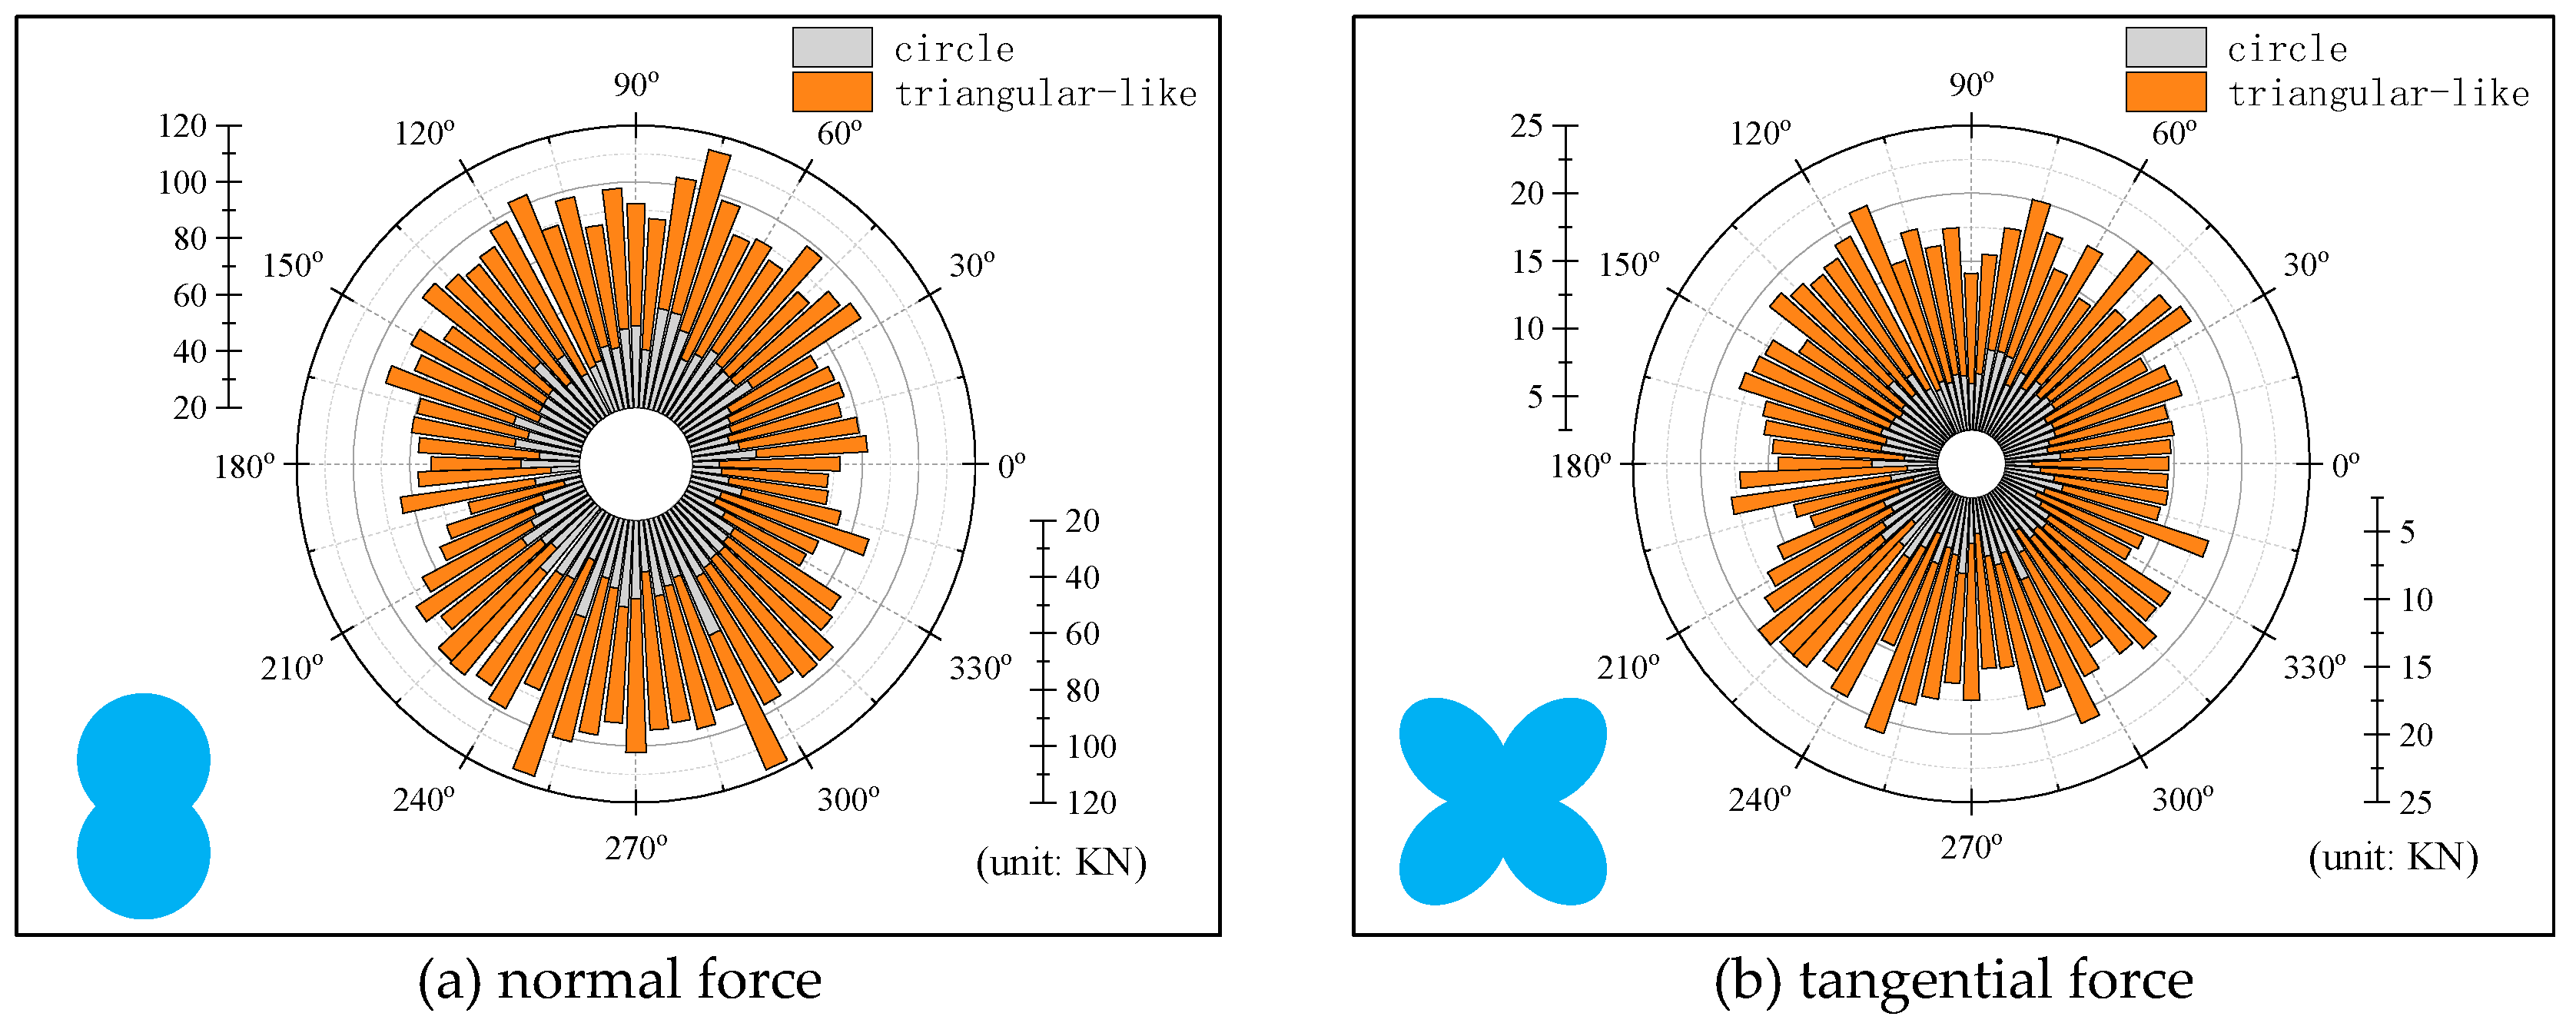
Figure 7.
Evolutions of the percentage of strong contacts during the shear process (red and blue represent respectively the strong and weak force chains).
Figure 7.
Evolutions of the percentage of strong contacts during the shear process (red and blue represent respectively the strong and weak force chains).
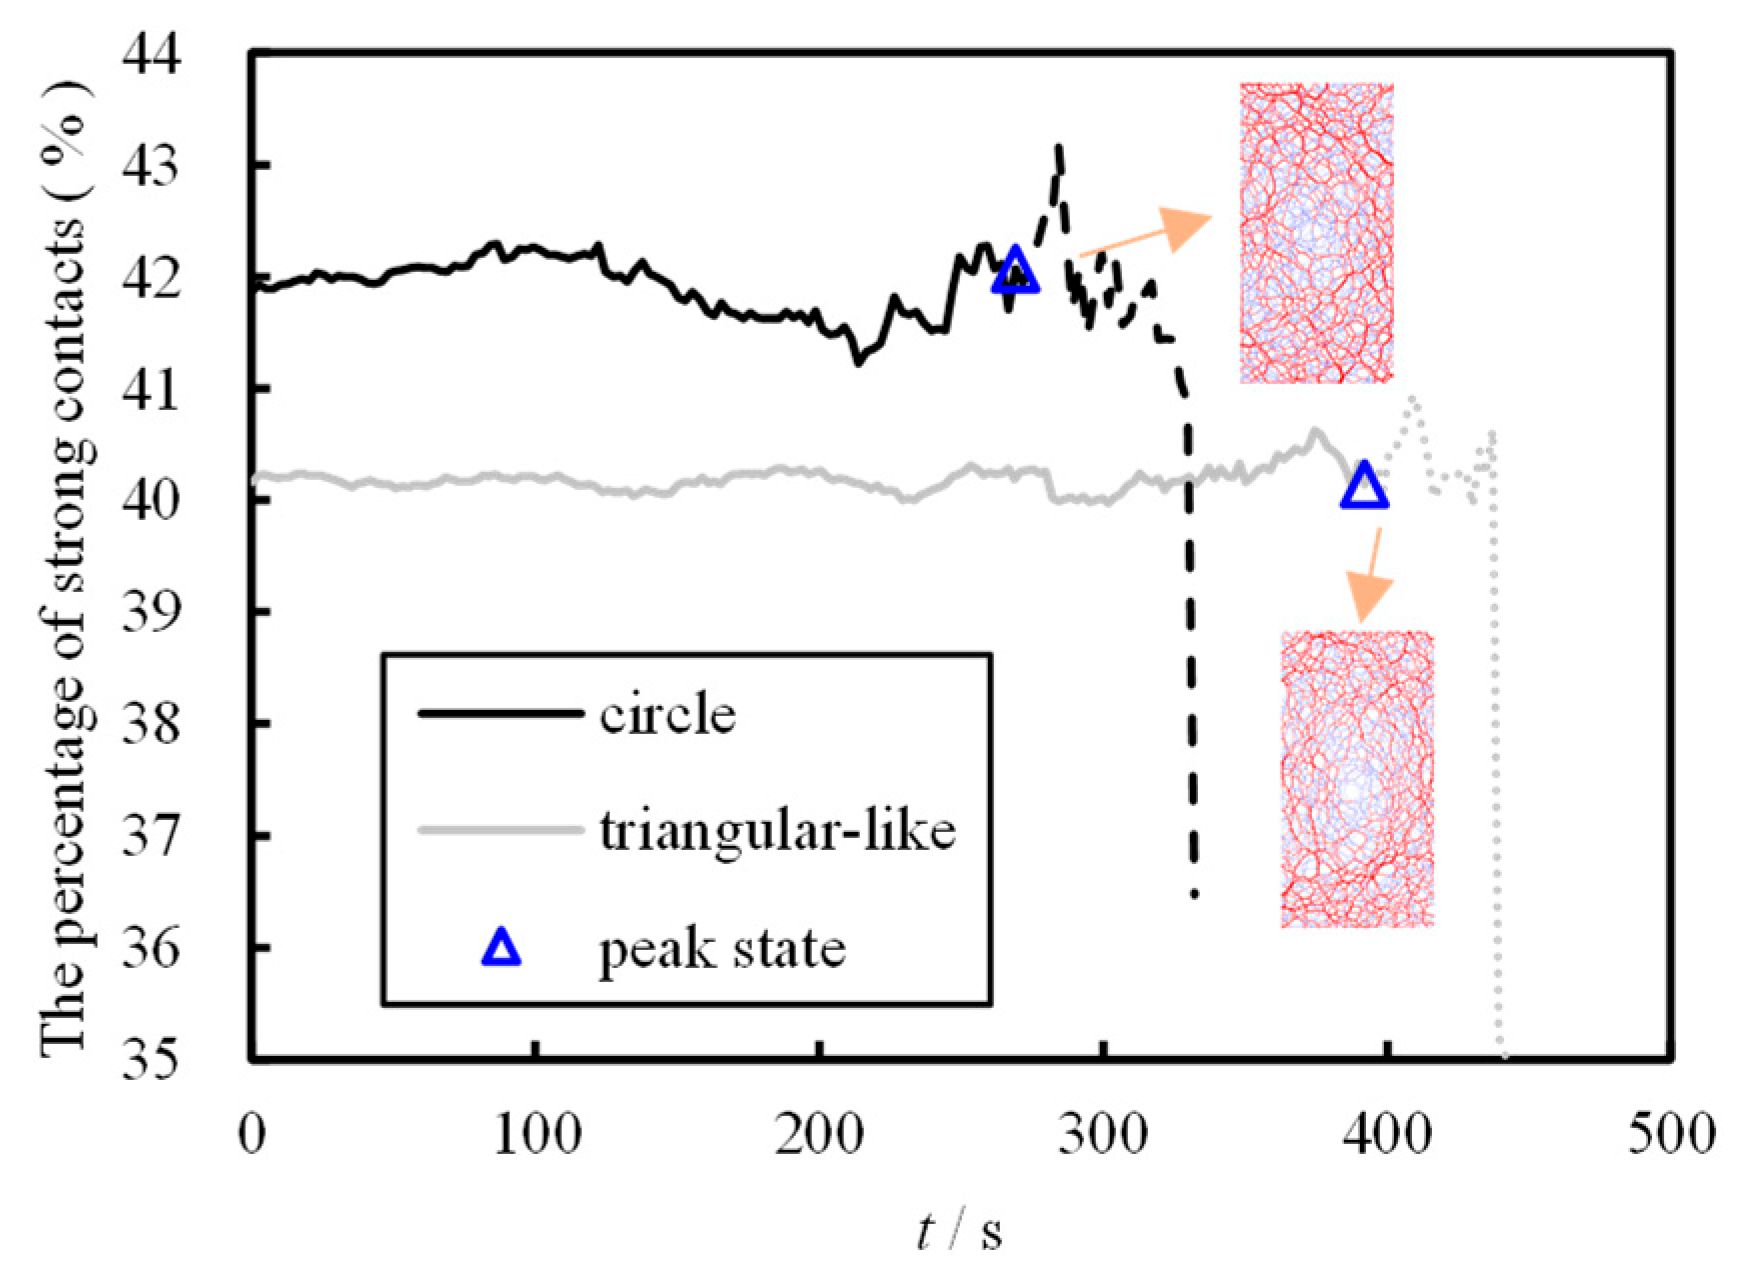
Figure 8.
Variations of the coordination number during the shear process: (a) Evolutions of the coordination number; (b) Polar diagrams of the coordination number at the peak state.
Figure 8.
Variations of the coordination number during the shear process: (a) Evolutions of the coordination number; (b) Polar diagrams of the coordination number at the peak state.
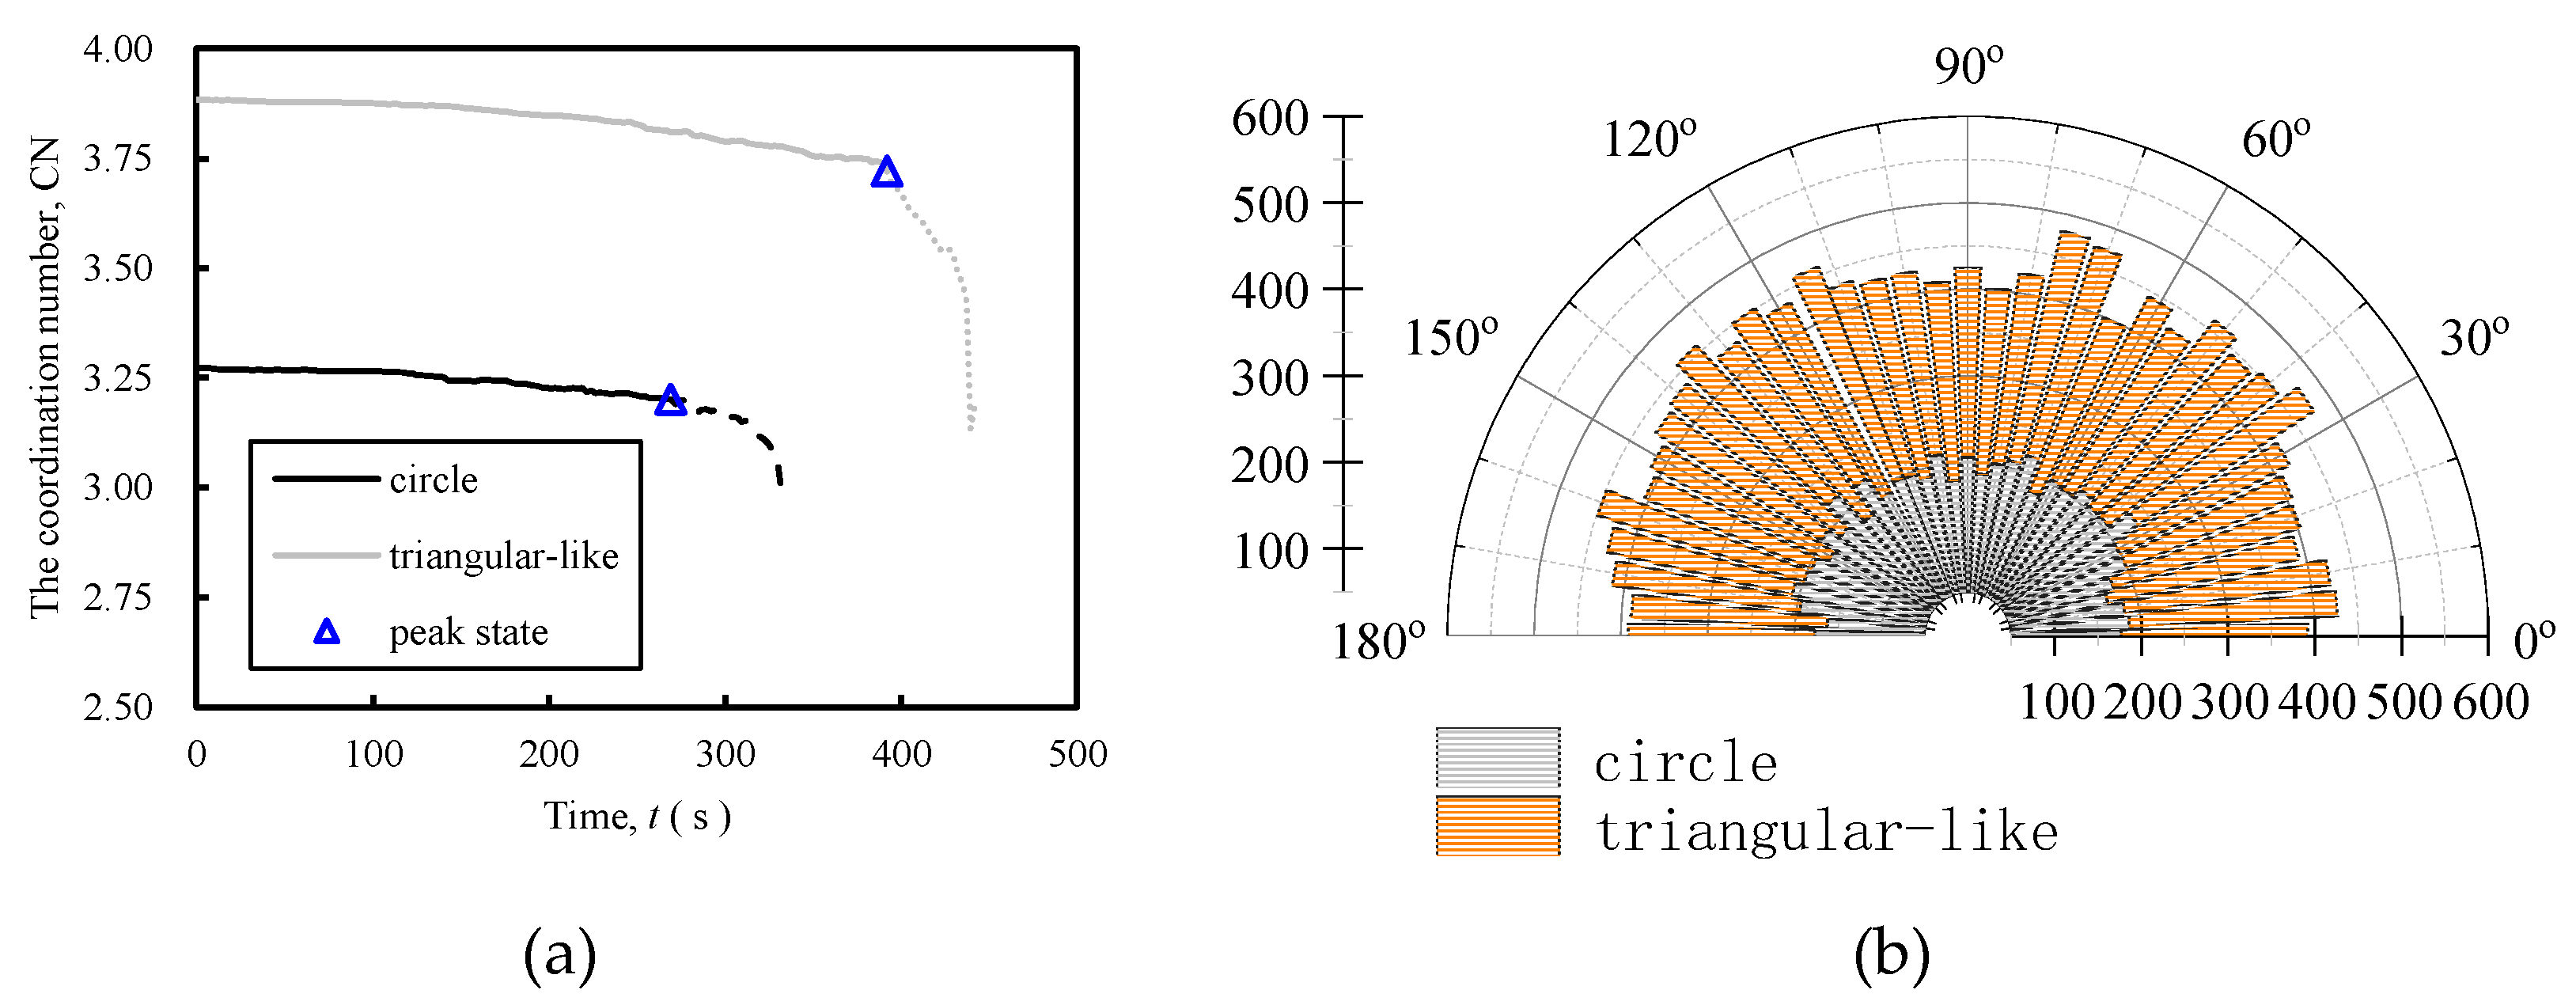
Figure 9.
Evolutions of the cumulative rotation angle of particles.
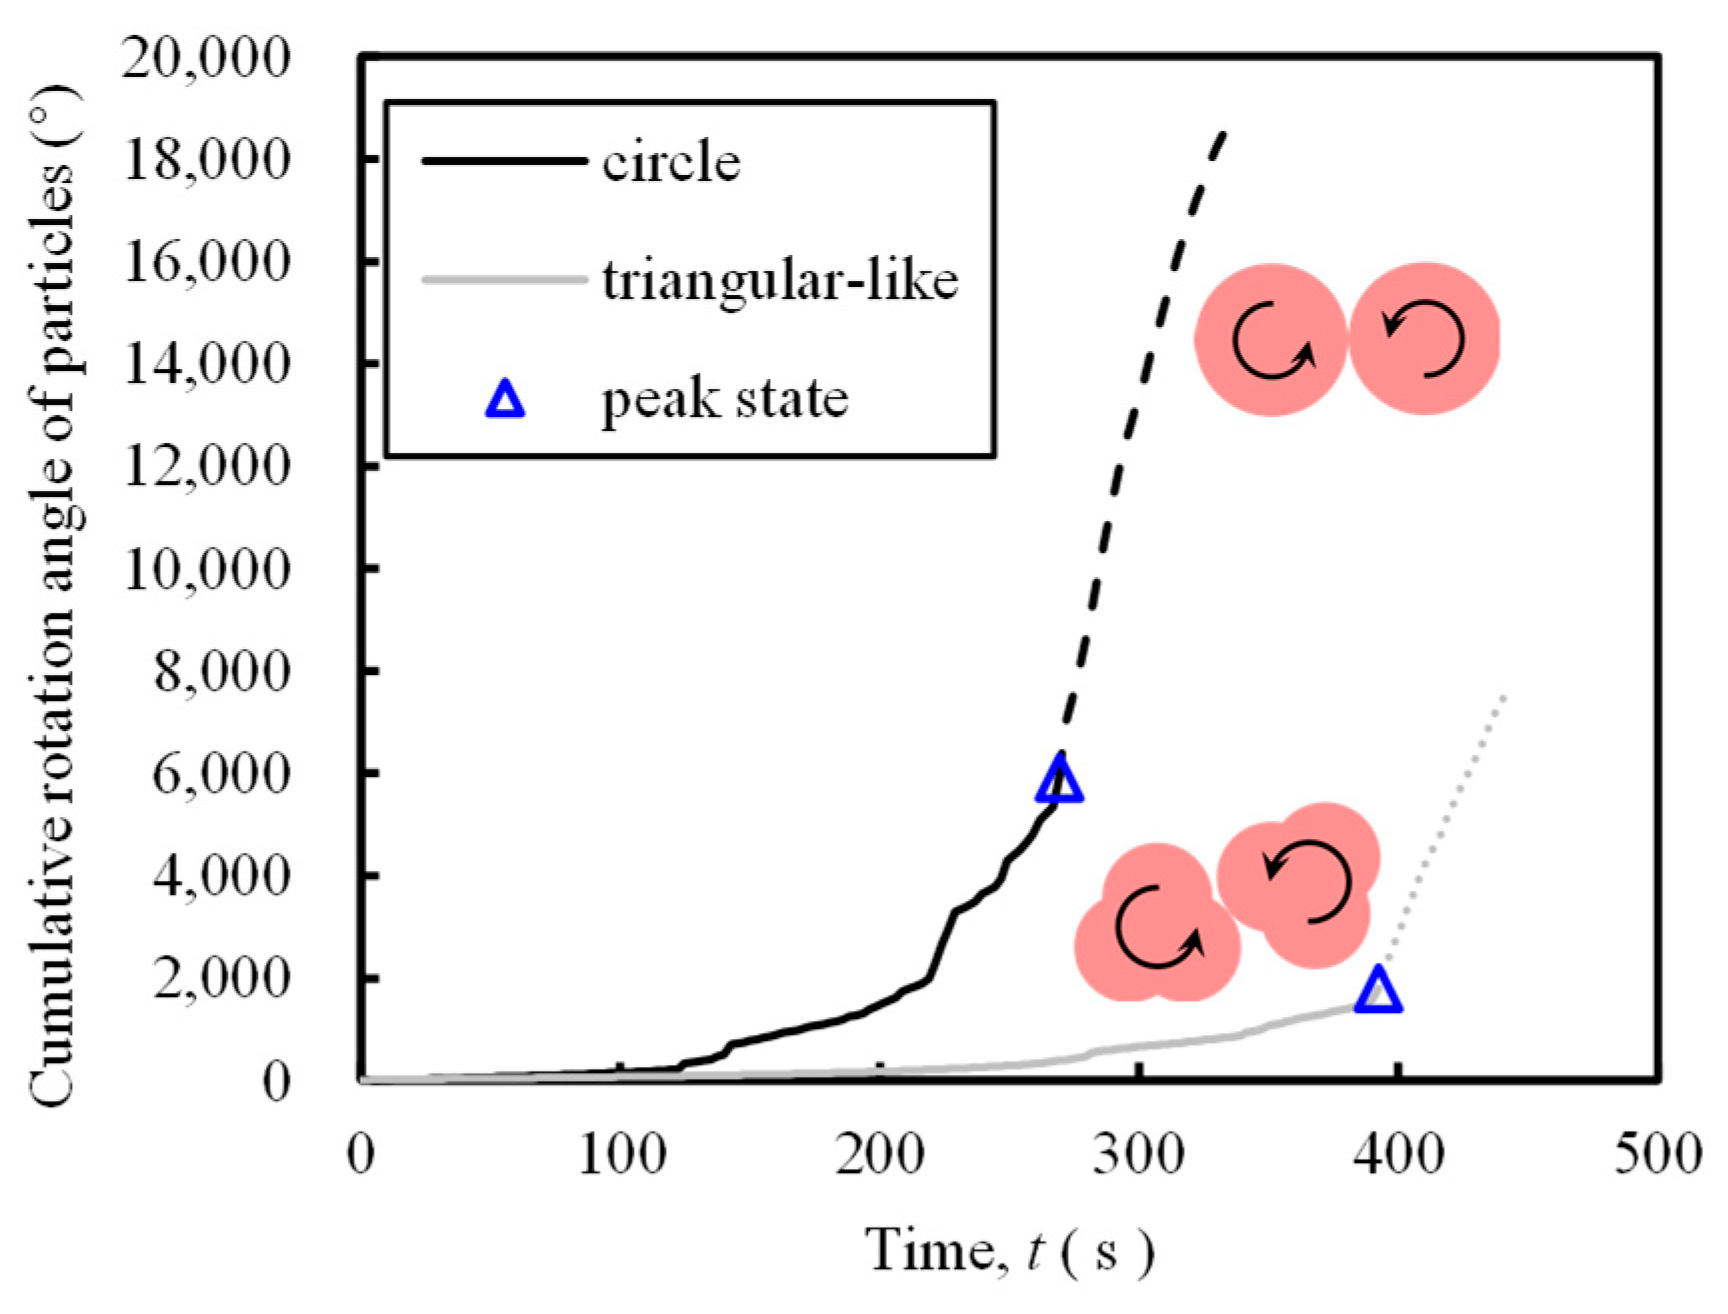
Figure 10.
Evolutions of the percentage of sliding contact.
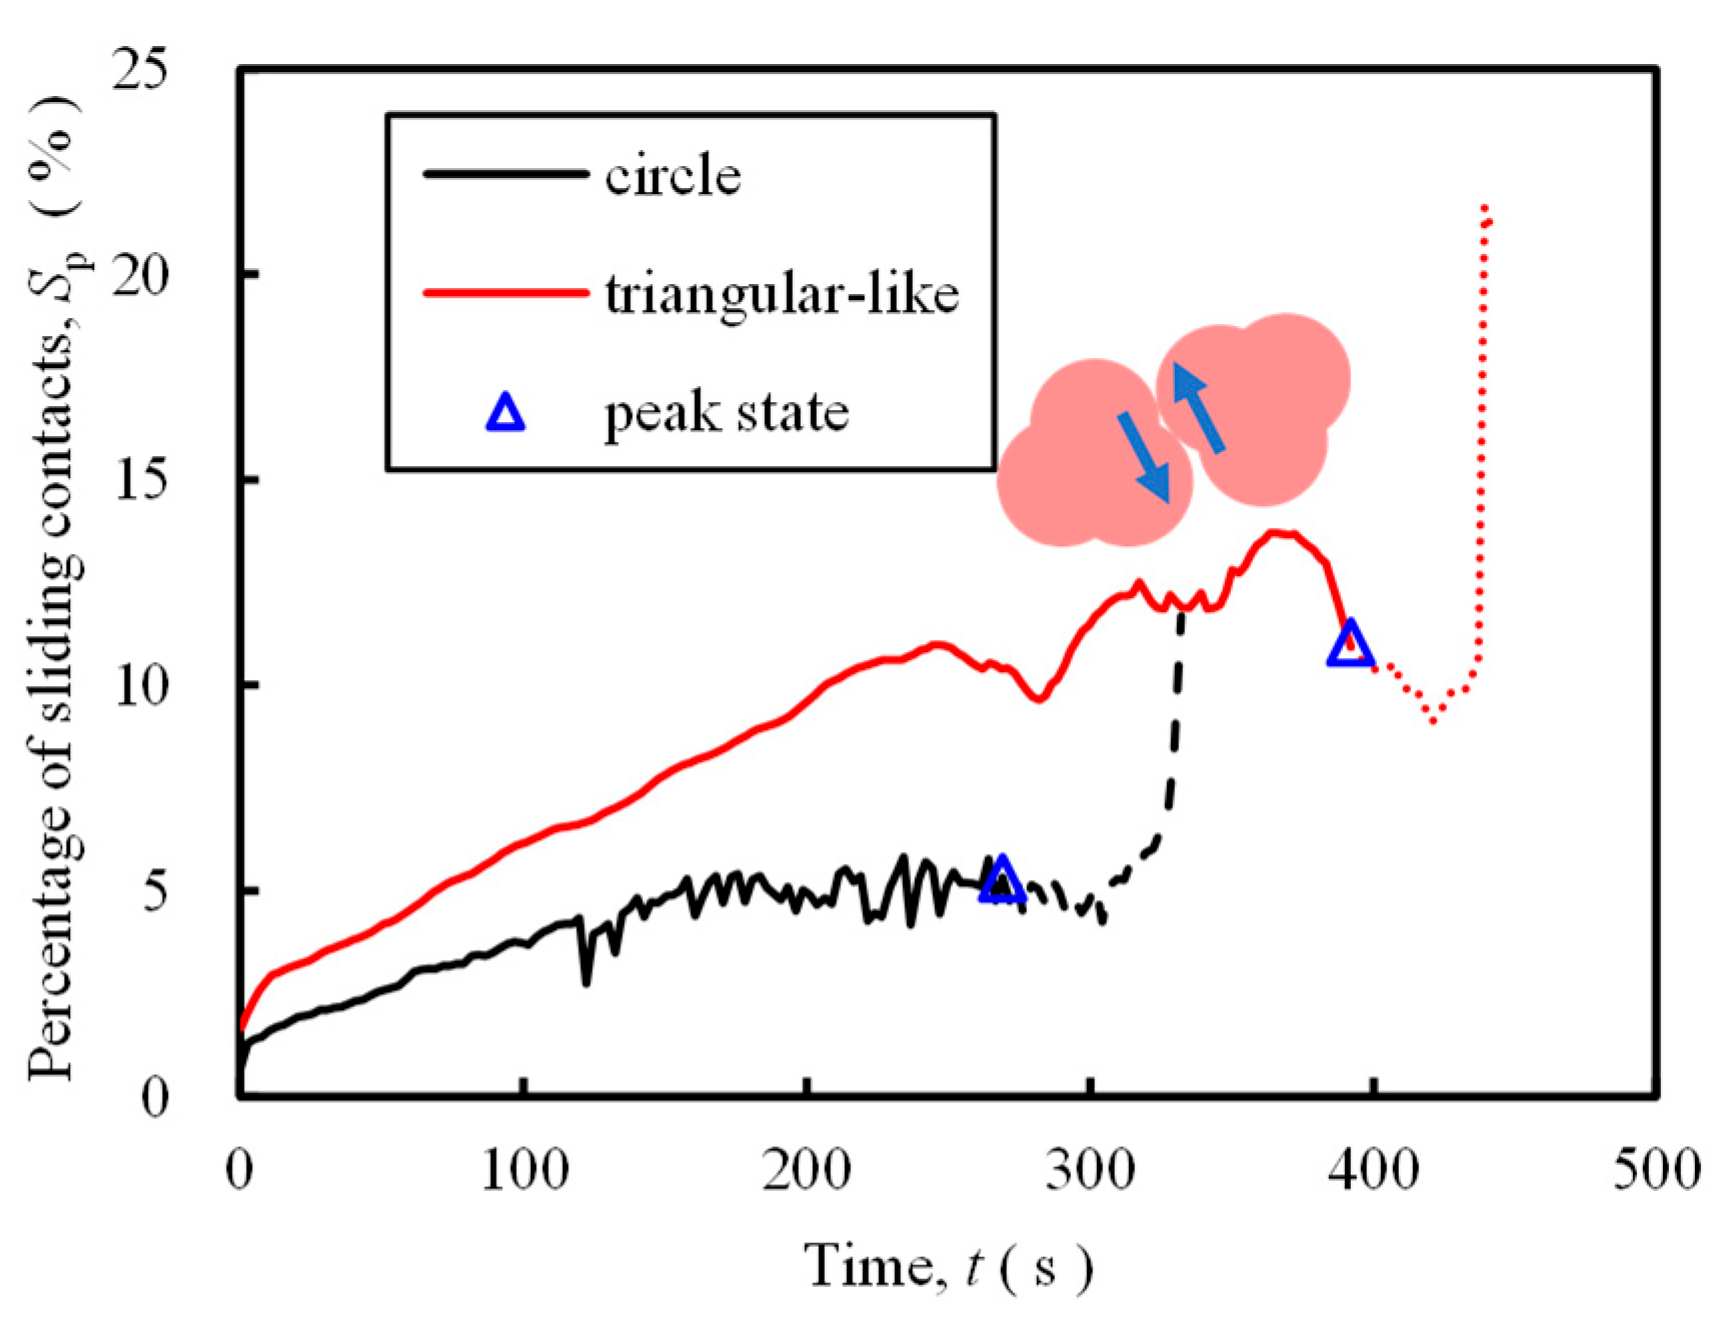
Figure 11.
Numerical modeling process of slope model.
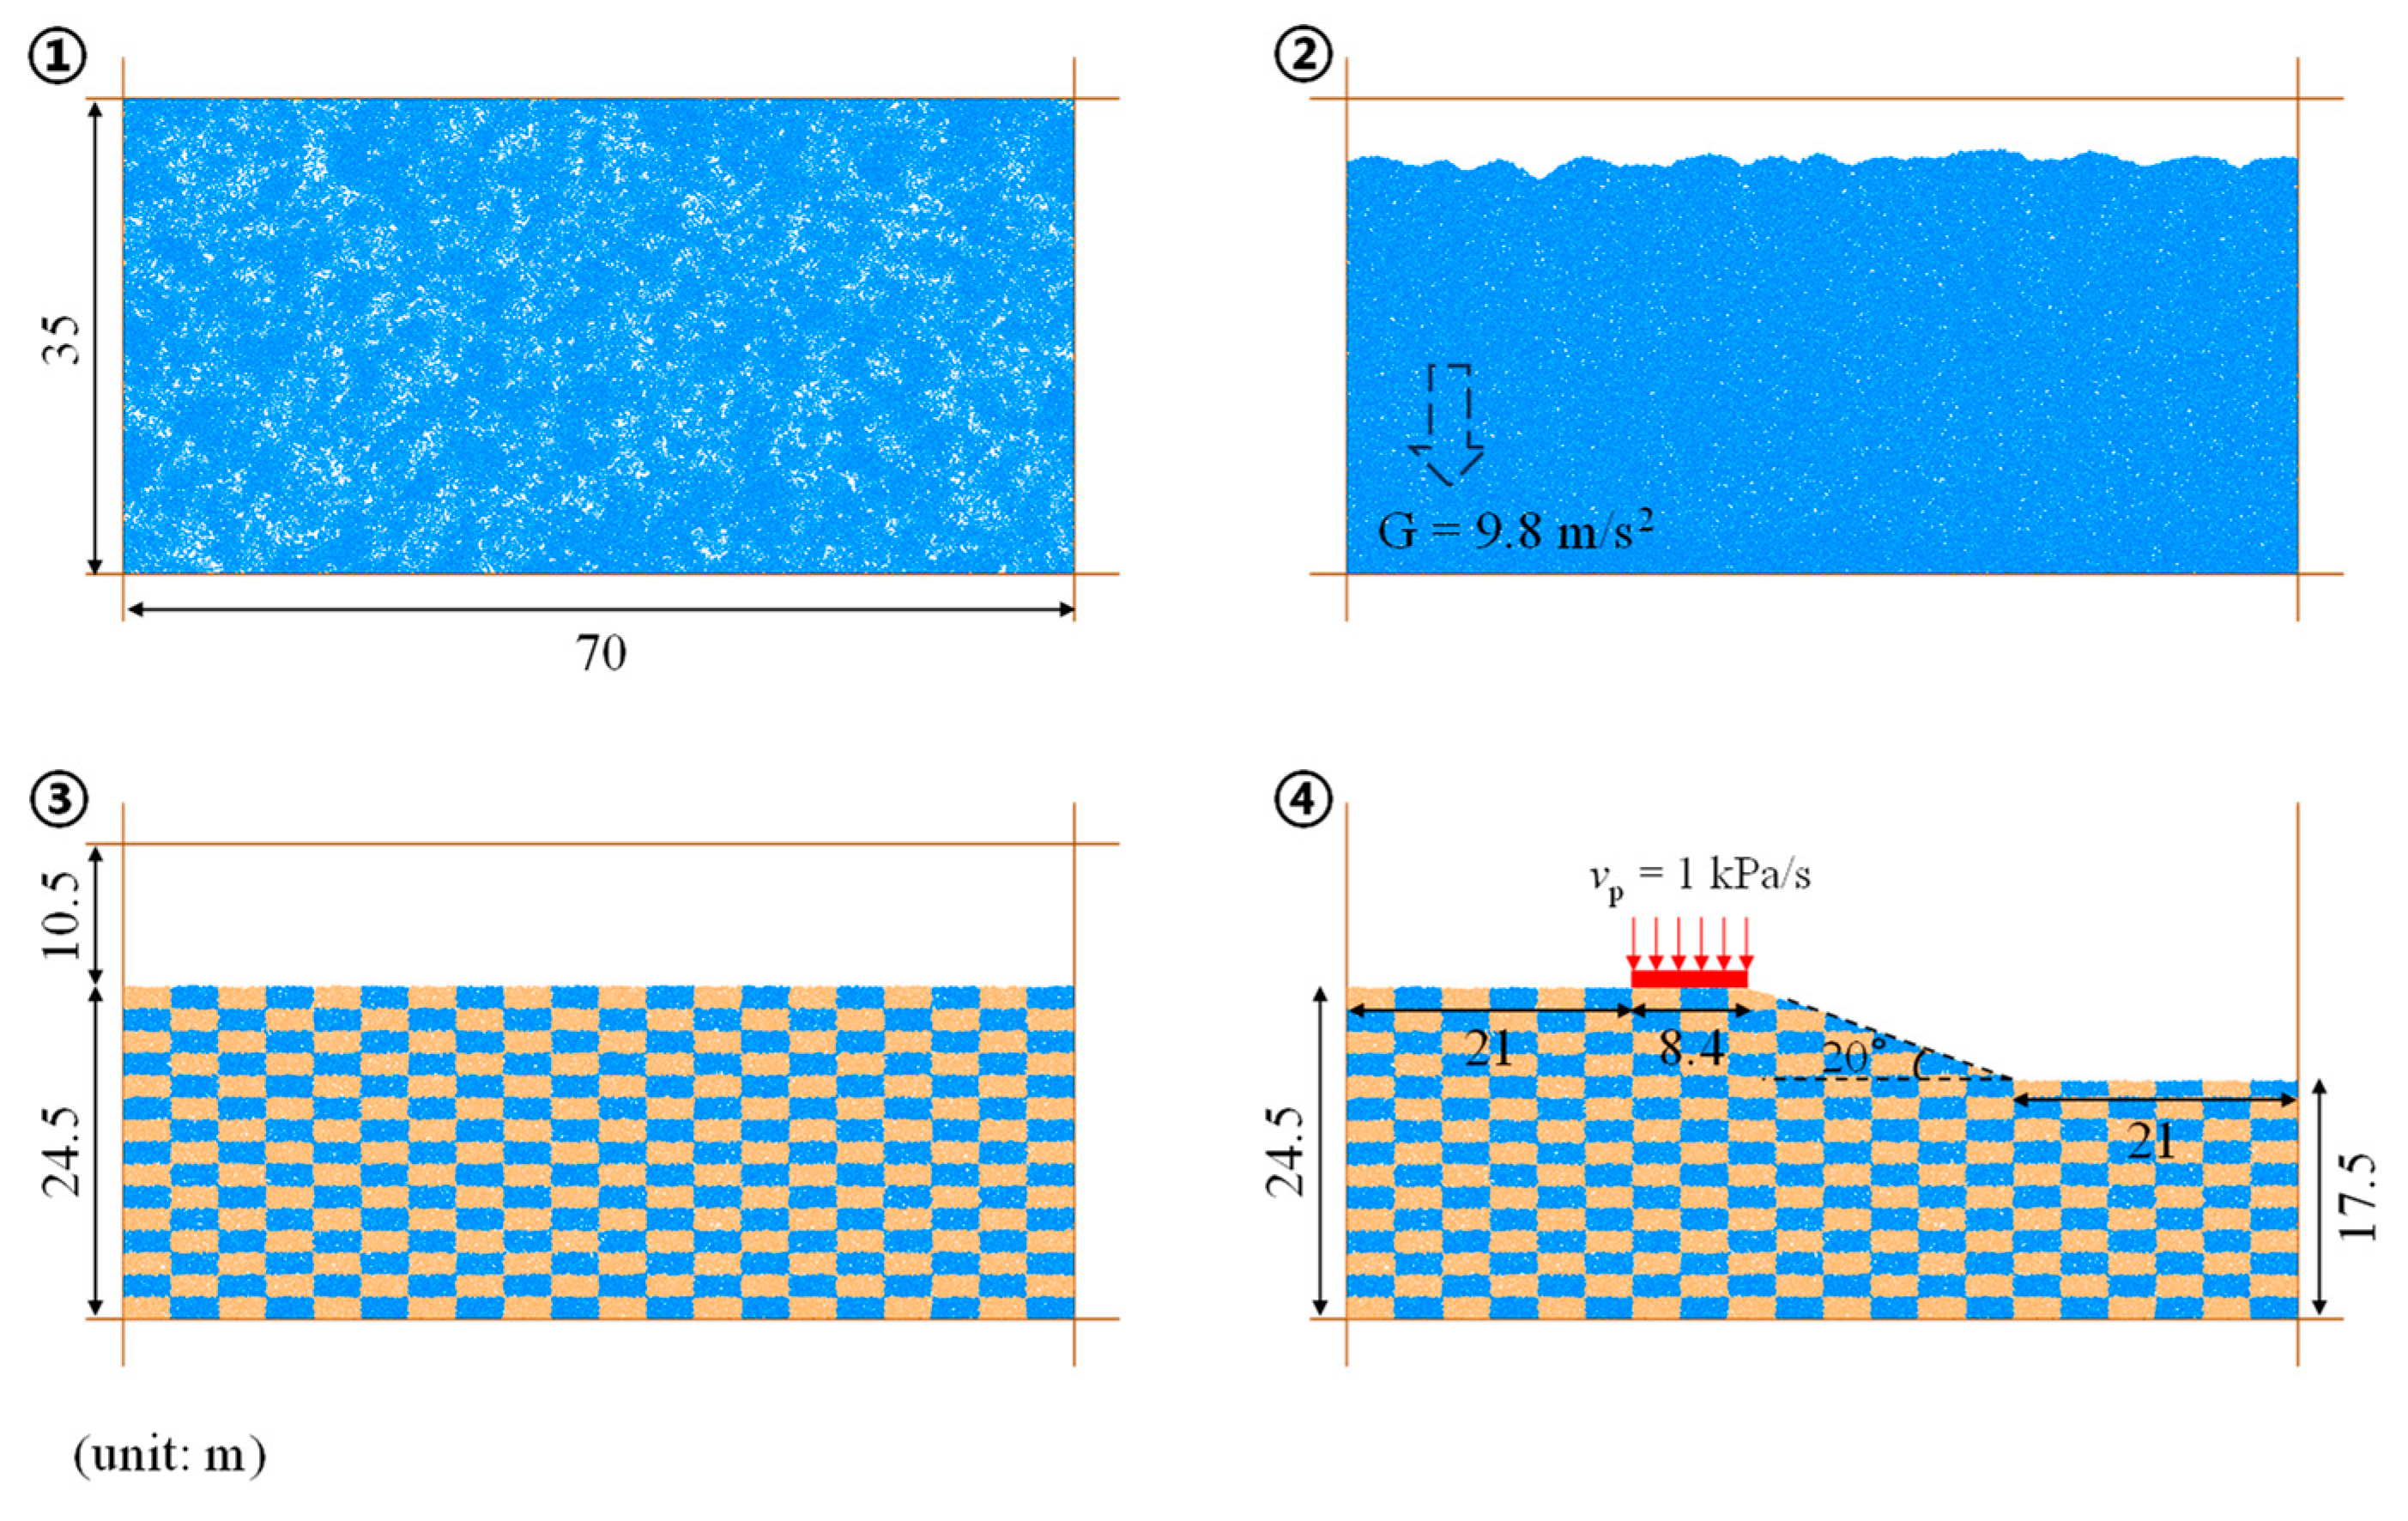
Figure 12.
Force and displacement evolution of the force wall.
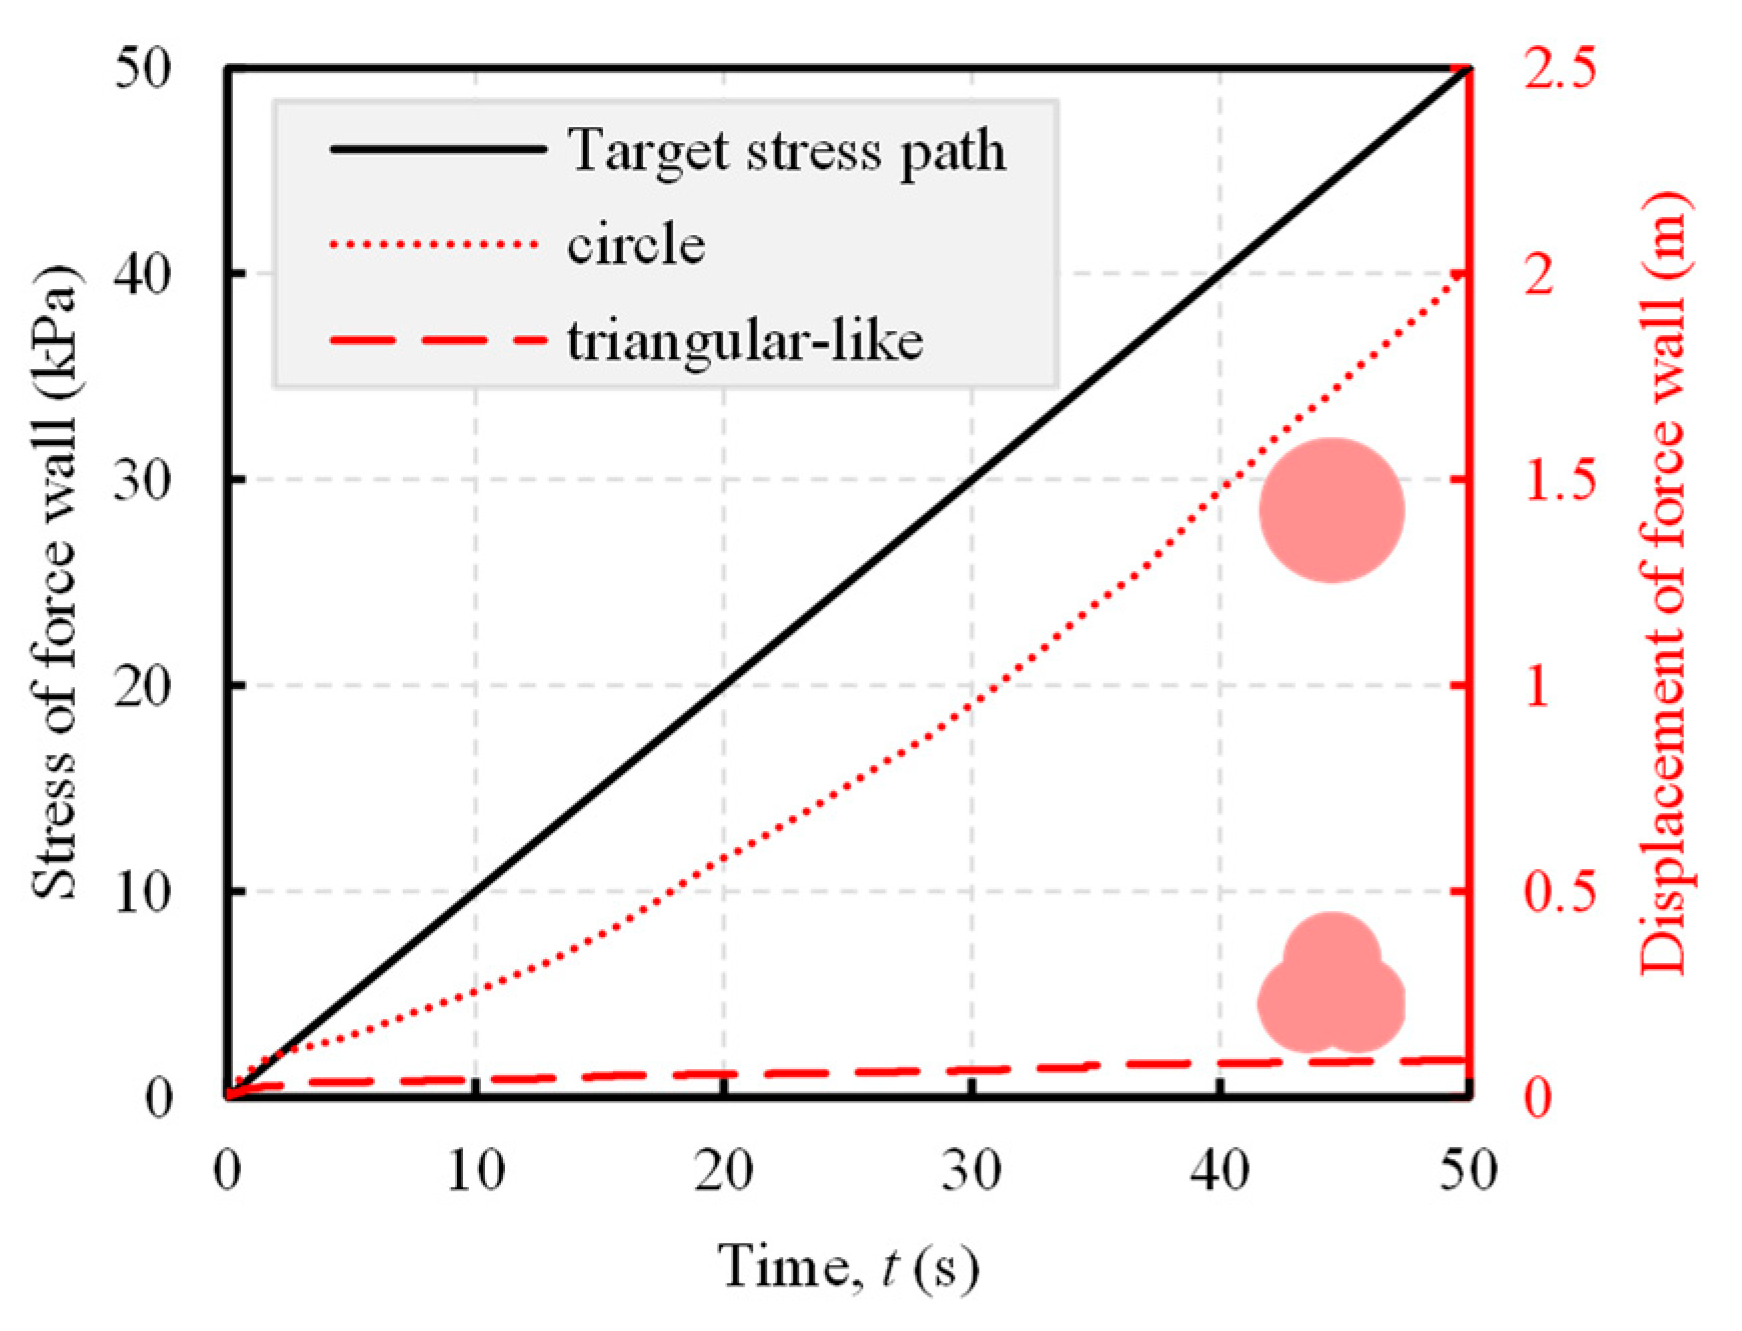
Figure 13.
Deformation characteristics of slopes with different particle shapes (t = 50 s).
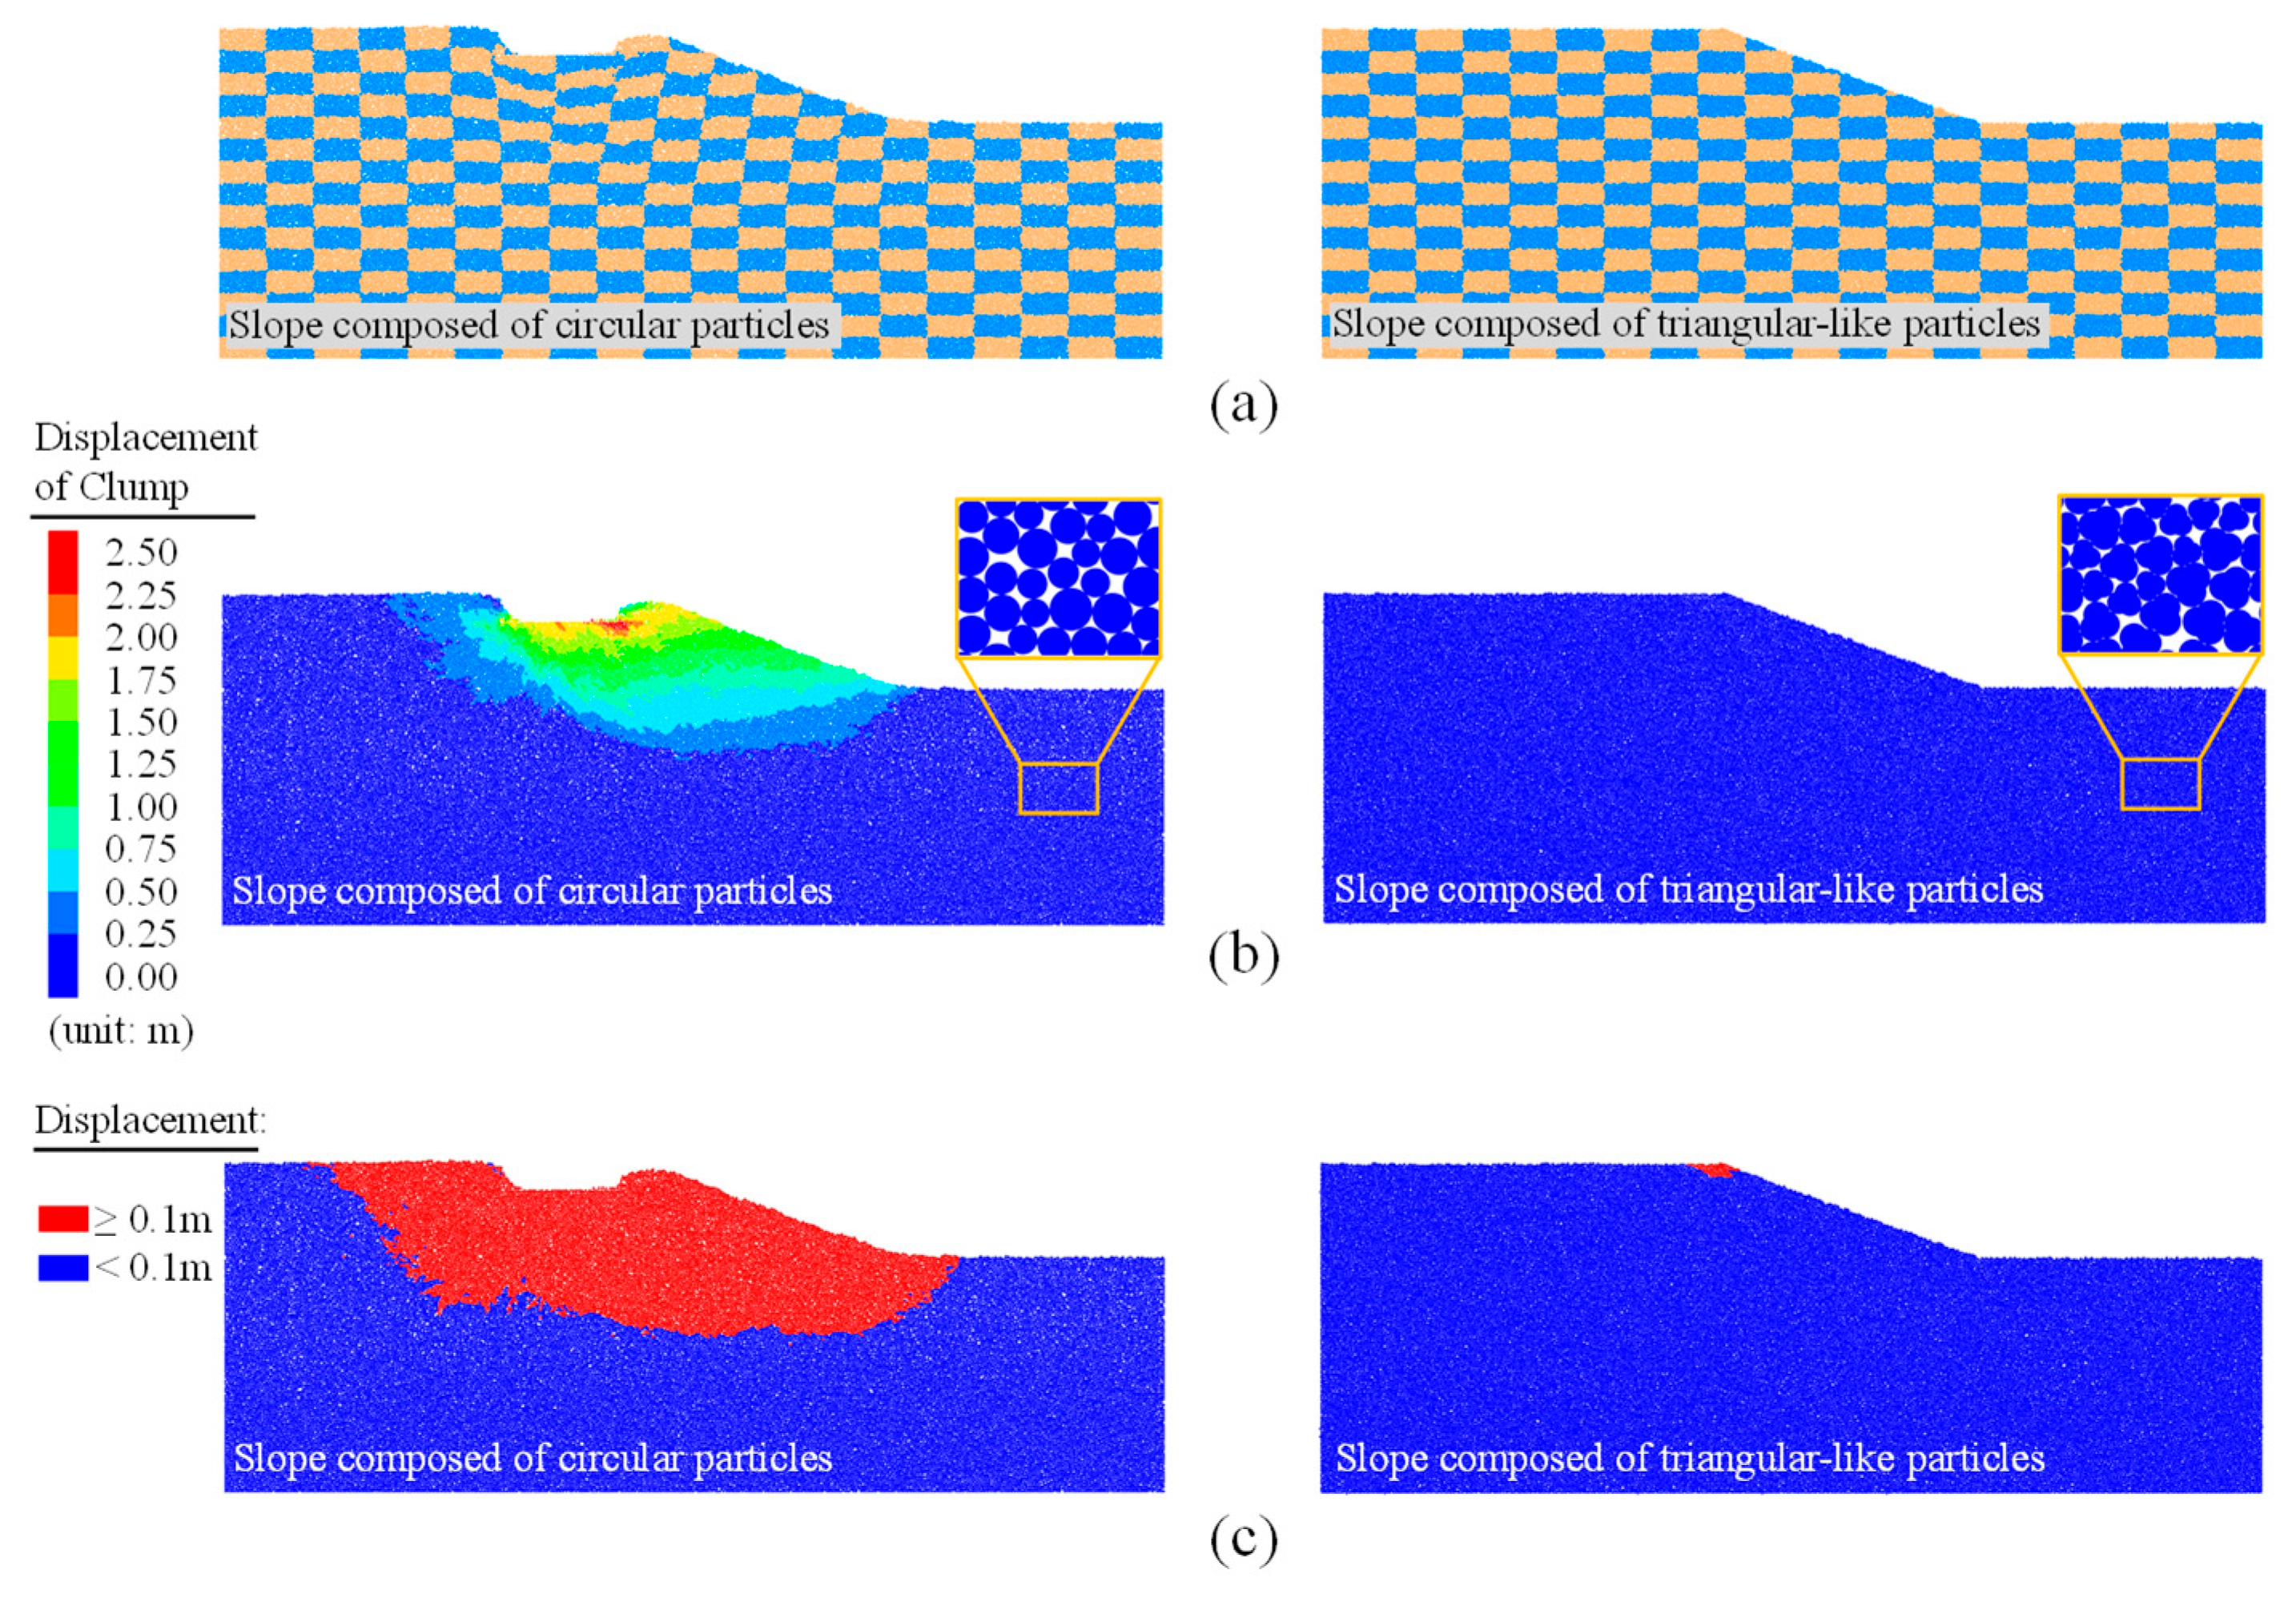
Figure 14.
Schematic diagram of the measurement circle and the principle stress field of different particle shape (t = 50 s).
Figure 14.
Schematic diagram of the measurement circle and the principle stress field of different particle shape (t = 50 s).
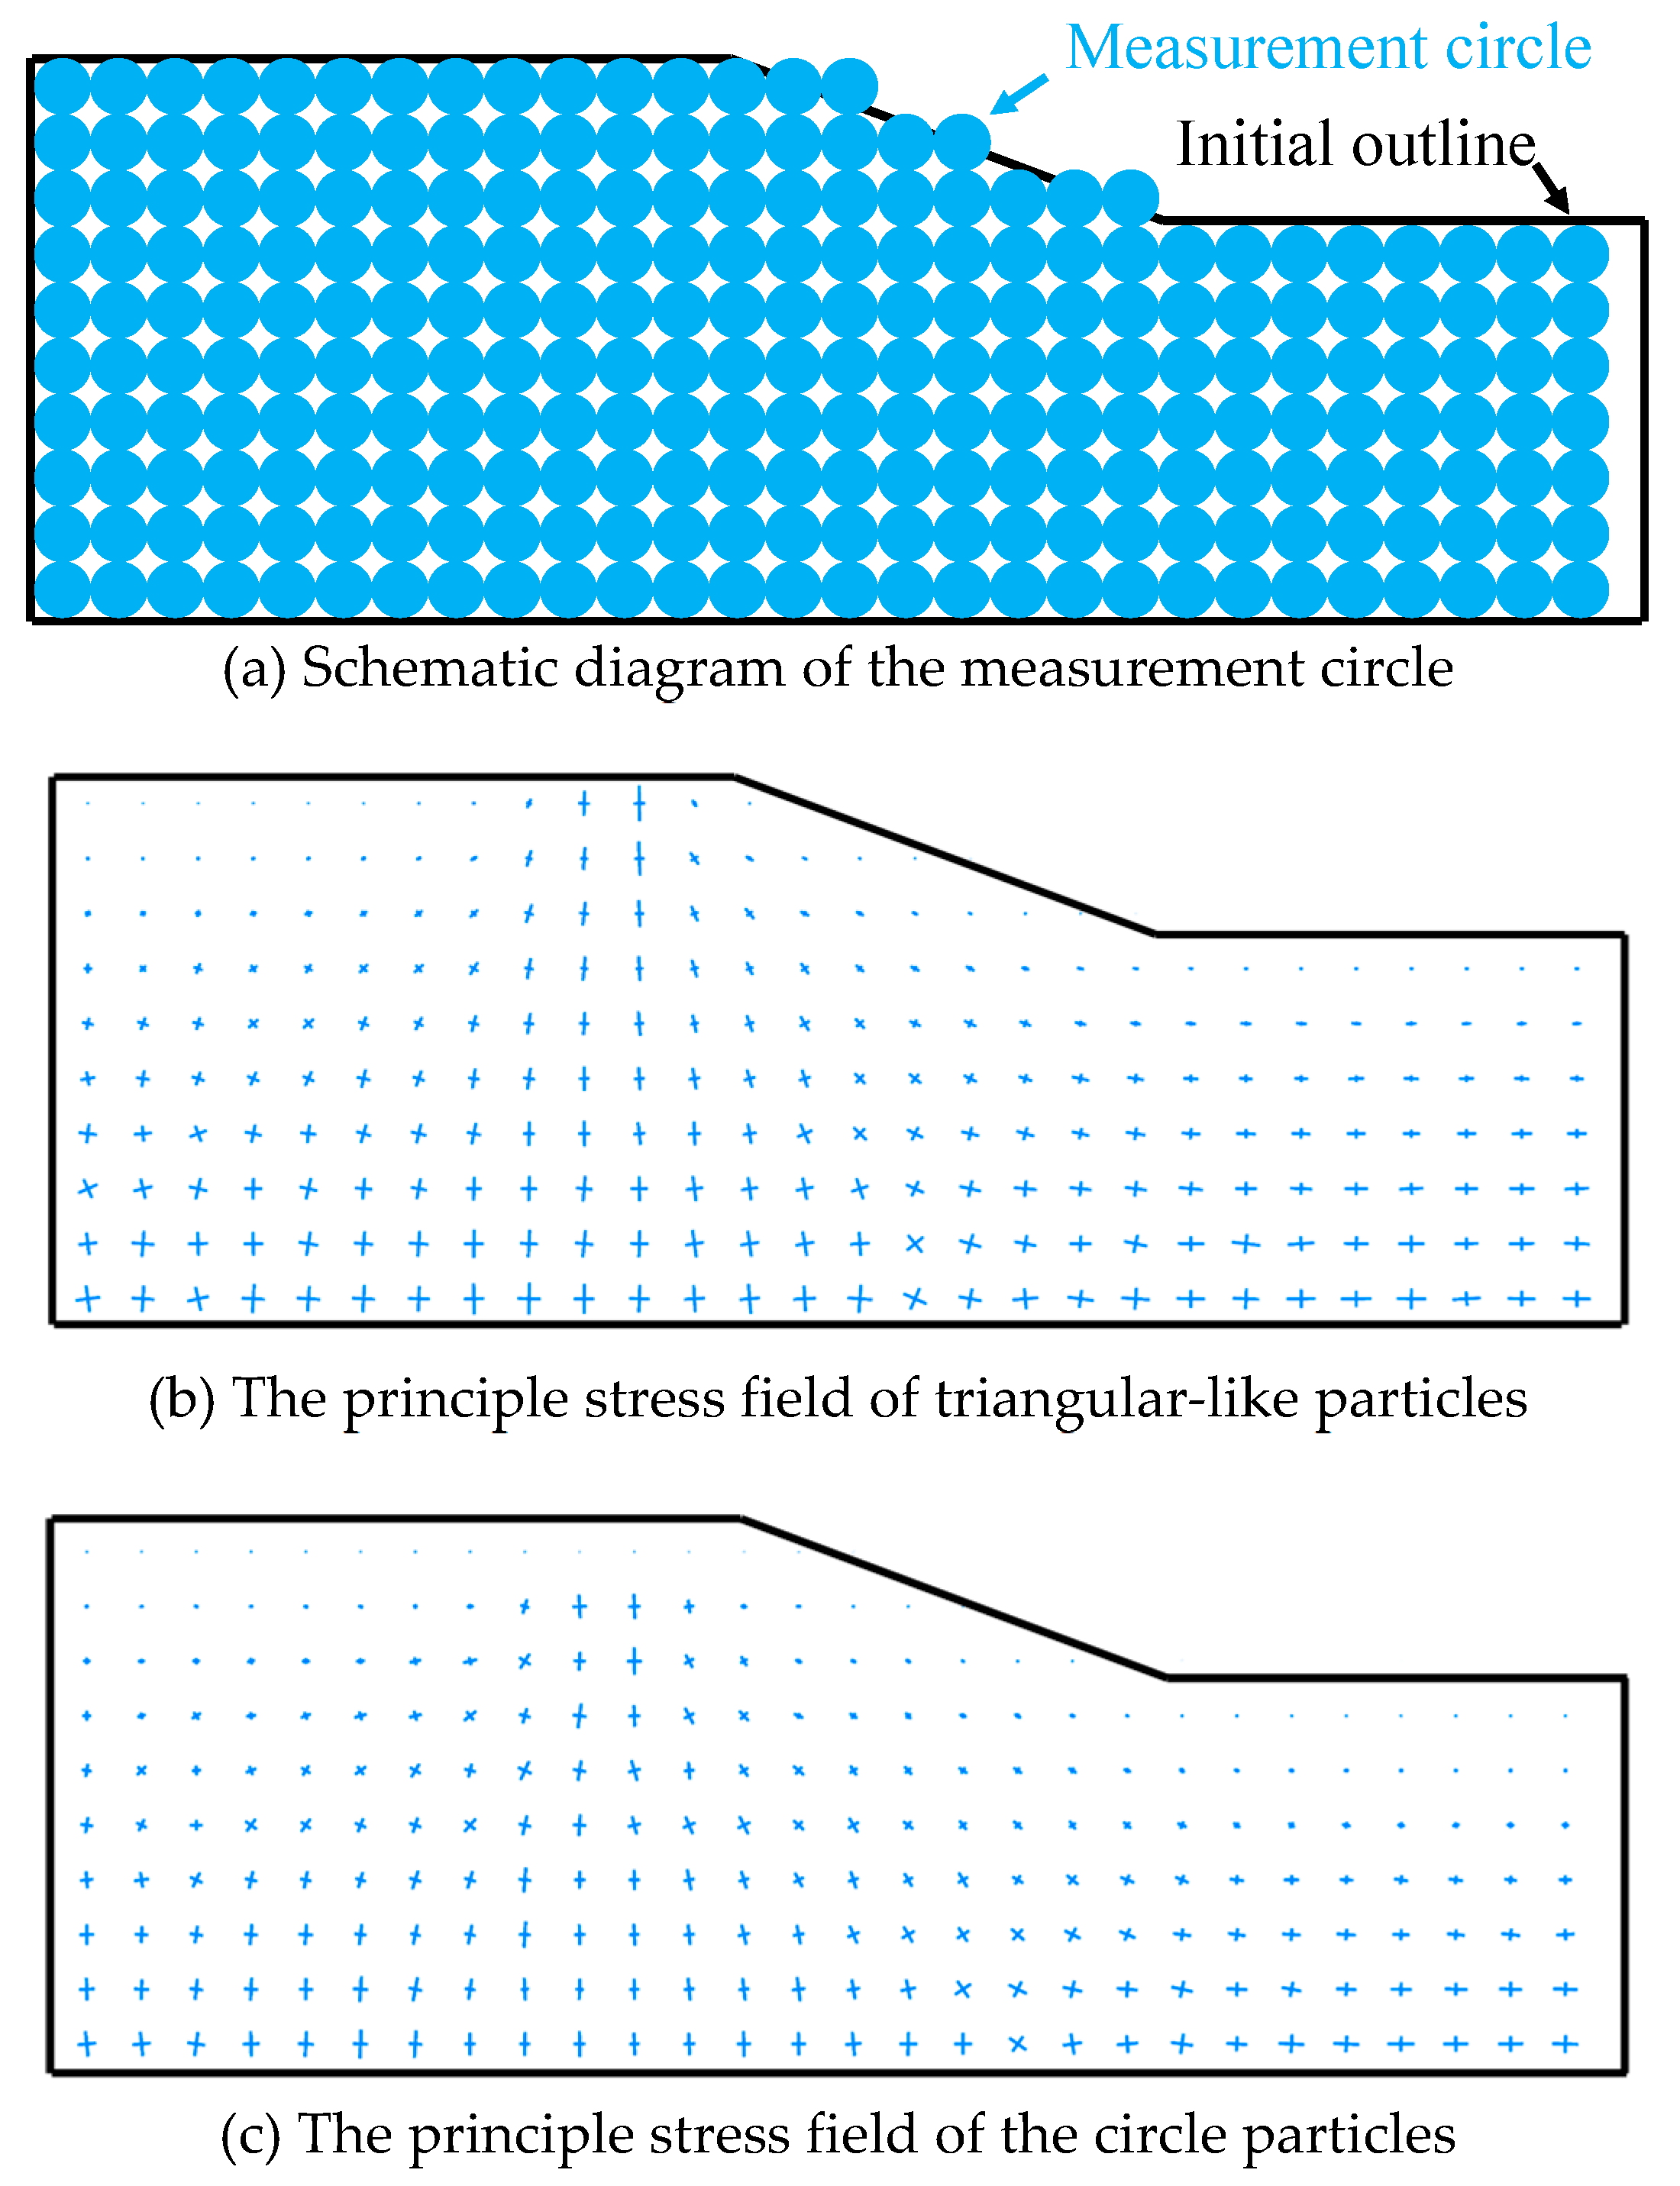

Table 1.
Microscale parameters used in the DEM simulations.
| Parameter | Value |
| Particle density, ρ (kg/m3) | 2650 |
| Effective modulus, Ec (Pa) | 1×10⁸ |
| Stiffness ratio, kn/ks | 4/3 |
| Inter-particle frictional coefficient | 0.4 |
| Wall-particle frictional coefficient | 0 |
| Normal stiffness of wall-particle contacts, (N/m) | 2×10⁸ |
| Maximum wall servo speed, umax (m/s) | 1×10⁻³ |
| Damping factor | 0.7 |
Disclaimer/Publisher’s Note: The statements, opinions and data contained in all publications are solely those of the individual author(s) and contributor(s) and not of MDPI and/or the editor(s). MDPI and/or the editor(s) disclaim responsibility for any injury to people or property resulting from any ideas, methods, instructions or products referred to in the content. |
© 2025 by the authors. Licensee MDPI, Basel, Switzerland. This article is an open access article distributed under the terms and conditions of the Creative Commons Attribution (CC BY) license (http://creativecommons.org/licenses/by/4.0/).
Copyright: This open access article is published under a Creative Commons CC BY 4.0 license, which permit the free download, distribution, and reuse, provided that the author and preprint are cited in any reuse.


