Submitted:
26 February 2025
Posted:
27 February 2025
You are already at the latest version
Abstract
This study investigates the electrochemical behavior of Ti₃C₂Tₓ MXene for supercapacitor applications, focusing on its charge storage mechanisms using Electrochemical Impedance Spectroscopy (EIS). A novel equivalent circuit (EC) model, incorporating a diffusion layer resistance and a constant phase element, was developed to represent the impedance spectra, achieving a low error margin of 4.6%. Cycling stability of MXenes and charge storage parameters were evaluated using the developed EC model. The study demonstrated that irreversible anodic oxidation of MXene begins around 0.3 V due to water molecule attack from the aqueous electrolyte, forming a titanium oxide layer that increases charge transfer resistance and impairs charge storage. It was further revealed that the cycling stability of MXene is also related to the oxidation of MXene and the initial capacitance of 493 F/g at 100 mV/s reduces by 27.5% after 1000 cycles. The contribution of charge storage factors was analyzed and 85% of MXene’s capacitance was found to be surface controlled. This research offers a deeper understanding of MXene's charge storage mechanisms, providing critical insights into optimizing its electrochemical performance and stability. By establishing advanced modeling approaches and addressing challenges related to oxidation and resistance, this work advances MXene’s potential for high-performance energy storage applications.
Keywords:
Electrochemical Impedance Spectroscopy
; Equivalent Circuit model
; MXene
; charge storage mechanism
1. Introduction
MXenes, a family of two-dimensional (2D) transition metal carbides, nitrides, and carbonitrides, have emerged as a revolutionary material class in energy storage research, particularly in the development of supercapacitors. Their exceptional properties, including metallic conductivity, hydrophilicity, tunable surface chemistries, and layered structures, make MXenes ideal for energy storage applications that demand high capacitance, fast charge-discharge rates, and robust stability [1,2,3]. Among a wide variety of MXene species, Ti₃C₂Tₓ MXene is reported to have shown the highest electrical conductivity and has been studied most extensively for energy storage, especially in supercapacitor applications [4,5]. However, unraveling the intricacies of their charge storage mechanisms remains critical. Addressing these knowledge gaps is essential to fully harness their potential and optimize their performance in energy storage systems.
Charge storage mechanisms in Supercapacitors are primarily governed by two factors: electrical double-layer capacitance (EDLC) and pseudocapacitance. In EDLCs, charges are stored in the porous electrodes in a purely capacitive manner within an Electrical Double-Layer (EDL) [6,7]. In several cases, additional pseudo-capacitive energy storage is possible, through redox reactions and/or ion intercalation [8]. This is the case including 2D materials such as graphene oxide (GO) and MXenes [8,9]. Energy density is thus improved in these cases. MXenes exhibit a dominant pseudocapacitive charge storage behavior, facilitated by redox reactions at the surface functional groups and intercalation of ions within the interlayer spacing [10].
Advanced electrochemical techniques, including Cyclic Voltammetry (CV), Galvanostatic Charge-Discharge (GCD), and Electrochemical Impedance Spectroscopy (EIS), collectively provide a comprehensive understanding of the electrochemical processes involved in the charge storage mechanisms of MXene-based systems, guiding the optimization of their design. EIS is a very powerful technique to characterize electrochemical phenomena, such as, ion transport kinetics, interfacial resistance, and charge transfer processes, occurring at different frequencies in supercapacitors and provides information about their resistive and capacitive behavior and the identification of diffusion-limited processes.
In addition, EIS is well suited for studying separately the contribution of the double layer capacitance and the contribution of the faradaic reaction of redox-active molecules to the charge storage since these two processes occur at different frequencies [11]. EIS is a powerful tool for characterizing MXene interfaces with various redox probes or electrolytes, helping to model electrochemical processes through equivalent electrical circuit (EC) [12,13,14]. EC assists in quantifying charge storage parameters like different resistances and capacitances involved in the system. Till date, very few studies have been done on exploring MXene’s charge storage mechanism using EIS study. Aguedo et al studied MXene modified electrode using EIS to prepare effective electrochemical biosensors [15]. Mainka et al studied EIS data and a general EC model to characterize fiber shaped MXene/graphene oxide supercapacitors [16]. Elsewhere, Hui et al. used EIS and a basic EC to model hydrothermally treated MXene and study its electrochemical activities [17]. In some other studies, EIS was used to observe the qualitative electrochemical behavior of MXenes, without using any EC for quantitative studies [17,18]. Hence, the knowledge on MXene’s electrochemical processes for film-type supercapacitor application is still scarce. A low-error general EC to represent the electrochemical charge storage mechanisms in MXene is yet to be established.
Development of an EC from the EIS data requires in-depth understanding of electrochemical behavior of MXene at different conditions. Chen et al. investigated how transitions in surface functionalization affect MXenes' pseudocapacitive behavior in acidic environments. It concludes that the pseudocapacitance is largely dependent on the surface chemistry, with particular functional groups enhancing electron storage and mobility [18]. Boota et al. studied the functionalization of titanium carbide MXenes with quinones and identified that specific surface functional groups can stabilize redox reactions, improving energy storage efficiency [19]. Huang et al. found that Ti₃C₂Tₓ MXene undergoes reversible H+ ion intercalation in acidic electrolyte. This reversible process is characterized by a transformation between Ti3C2O2 and Ti3C2(OH)2 on the MXene surface, highlighting the role of oxygen-rich functional groups in enhancing pseudocapacitive behavior [20]. In addition to this, short ion diffusion and intercalation pathways of MXene is a unique property that leads to improvements in pseudocapacitive performance. It was demonstrated in several studies that modification of surface functional group can simultaneously enhance surface redox reaction and ion diffusion and hence improve overall pseudocapacitance [21,22].
Representing such complexities in charge storage behavior in the developed EC necessitates a detailed understanding of the physical processes involved in the charge storage mechanism and interplays between structure, synthesis, and performance. To optimize performance of supercapacitor, it is also important to understand the electrochemical behavior of MXene in an anodic and a cathodic potential window and to examine suitable potential window for electrochemical stability. Furthermore, understanding the electrochemical processes involved during charging and discharging is crucial to ensure enhanced cycle life.
The contribution of this research lies in its detailed investigation of the electrochemical behavior of MXenes for energy storage application. Electrochemical processes at different voltage ranges were studied to understand the physical processes involved during charging and discharging and to determine a suitable voltage range for the desired application. EIS technique was employed, and a modified EC with low error percentage was developed that resembles the investigated charging processes of MXenes. Furthermore, oxidative degradation of MXene during CV cycling is observed and studied to quantify different involved resistive and capacitive elements using the developed EC. Finally, the contribution of different types of pseudocapacitance like surface-controlled and diffusion-controlled capacitance is studied and quantified. This research adds to the growing body of knowledge on MXene-based materials, paving the way for their broader application in energy storage technologies.
2. EIS to Understand Electrochemical Behavior of MXene
EIS provides critical insights into various systems, enabling the study of processes such as the resistance of the electrolyte between a working electrode and a reference electrode, interfacial charge transfer resistance due to adsorbed species (ions, organic, and water molecules), resistance from Faradaic processes, diffusion processes (Warburg factor), and adsorption of reactants/products on interfaces. The method employs alternating current (AC) to perturb redox processes on a working electrode. To obtain EIS spectra, a sinusoidal AC voltage with low amplitude is applied to the conductive interface, and the system's response is recorded in terms of the current's amplitude and phase. By varying the frequency of the AC signal, the overall impedance of the cell is monitored as a function of frequency, enabling the identification of processes occurring on different timescales and the separation of electronic and ionic processes in mixed conductors.
The impedance is represented as a complex quantity where (real part) corresponds to resistance (R) and (imaginary part) corresponds to , with C as capacitance and ω as angular frequency. A Nyquist plot is often used to visualize these components, plotting on the x-axis and on the y-axis. This graphical representation provides quantitative insights into various electrochemical processes. Complex behaviors in these systems are modeled using equivalent circuits (ECs) composed of resistances, inductances, and capacitances [23]. The shape of the Nyquist plot reveals critical information about physical processes on conductive interfaces. Based on this inspection, Nyquist plots can be fitted with ECs that allow researchers to derive device properties quantitatively. For example, a semicircular plot indicates a capacitor C in parallel with either an interfacial charge transfer resistance Rct or an electrolyte resistance, Rs in series with interfacial charge transfer resistance Rct (Figure 1a). A vertical line following the semicircle implies the presence of a capacitance in series with the earlier circuit, as shown in Figure 1b. A 45-degree line suggests the involvement of the Warburg factor, requiring the addition of a Warburg impedance element in the circuit (Figure 1c) [24].
Data near the origin of a Nyquist plot corresponds to the high-frequency spectrum. For supercapacitive electrodes, A typical Nyquist plot is shown in Figure 2. It exhibits three distinct features: a semicircle at high frequency, a tilted linear section at middle frequencies, and a vertical tail at low frequencies. At very high frequencies, ions cannot penetrate pores or layers due to insufficient time, leaving only the external surface accessible, which makes resistive components dominant [25,26]. Conversely, at very low frequencies, ions fully penetrate the layers, charge saturation dominates, and the electrode behaves as an ideally polarizable porous interface, resulting in a vertical line on the Nyquist plot. In the intermediate frequency range, resistance and capacitance become frequency-dependent, and diffusion processes play a significant role [27].
The Nyquist plot allows for the extraction of various resistive parameters by analyzing different frequency zones. At high frequencies, the first intersection with the x-axis (Rs) is attributed to electric resistance, which encompasses measurement connections, contact resistance between the active material and the current collector, and the resistance of the bulk electrolyte [28]. The diameter of the high-frequency semicircle (Rct) represents the resistance at the electrode/electrolyte interface, often called charge transfer resistance. At low frequencies, the real part of the impedance reflects diffusion resistance (Rd), which arises from ions penetrating deeper into the electrode's layers, resulting in longer diffusion paths within the electrolyte [27].
The examination of Nyquist plots, combined with system knowledge, facilitates accurate modeling of ECs, capturing the involved processes in detail. However, interpreting EIS data can be challenging without a clear understanding of interfacial processes, making it difficult to select an appropriate EC. Proper circuit elements identified from Nyquist plot fitting provide qualitative and quantitative parameters such as time constants or activation energies for specific processes [24]. Modification of the basic ECs shown in Figure 1, is often necessary, as they deviate from the ideal behavior. For example, in cases where rough surfaces are involved, redox properties cannot be adequately described using capacitive elements alone. Instead, a constant phase element (CPE) is utilized to account for these complexities [29].
The Randles circuit is commonly employed to model MXene-film-based supercapacitors. It consists of a parallel connection of charge-transfer resistance (Rct) and capacitance (C), which represent faradaic processes. Ion diffusion is modeled through a finite Warburg impedance (W) connected in series with Rct. This Warburg impedance assumes that diffusion is inherently coupled to charge transfer in faradaic reactions [30]. Additionally, a series resistance (Rs) accounts for electrical and connective losses at high frequencies. The circuit is similar to the one shown in Figure 1c.
The Randles circuit simplifies the complex interactions in MXene-based systems, often overlooking critical phenomena such as non-uniform charge distribution and dynamic interactions at the electrode-electrolyte interface [31]. Furthermore, the circuit model does not adequately account for the mixed ionic-electronic conduction behavior of MXene, leading to less accurate predictions of performance in hybrid systems [16]. Hence, in this study a modified EC is proposed for MXene electrode in supercapacitor application.
3. Experimental
3.1. Materials
Lithium fluoride (LiF, 98.5%) was obtained from Alfa Aesar, while concentrated hydrochloric acid (37% HCl) was sourced from Thermo Fisher Scientific. Ti₃AlC₂ MAX phase (≥90%, ≤100 μm mesh size) was purchased from Sigma-Aldrich. Nafion dispersion (5 wt% in water and 1-propanol, density 0.93 g/mL) was acquired from Beantown Chemical. A PVDF membrane with a 0.45 μm pore size was sourced from Millipore Sigma.
3.2. Synthesis of MXene
MXene was synthesized using a modified MILD etching method, as outlined in our previous study, with an HCl and LiF etchant solution. First, 10 mL of 9M HCl and 1 g of LiF were stirred for 10 minutes. Then, 0.5 g of Ti₃AlC₂ MAX was slowly added to control the exothermic reaction. The mixture was stirred at 200 rpm for 24 hours at 35°C. After etching, it was washed with deionized (DI) water until the pH reached around 5, resulting in a dark-green supernatant containing delaminated MXene flakes. At this stage, the supernatant appeared dark green, while a black slurry of etched Ti₃C₂Tₓ settled above a gray layer of unetched or partially etched Ti₃AlC₂-Ti₃C₂Tₓ. The supernatant was transferred to a beaker, and 50 mL of DI water was added to the centrifuge tube to disperse the remaining sediment by manual shaking. The mixture was ultrasonicated for 2 minutes, centrifuged at 3500 rpm for 5 minutes, and the supernatant was collected. This process was repeated until the supernatant became clear, ensuring complete delamination of MXene. Finally, the collected supernatant was vacuum-filtered through a PVDF membrane and dried at room temperature to form thin films. Proper PPE and safety measures were followed throughout.
3.3. Preparation of Drop-Cast Electrode for Electrochemical Testing
To prepare the working electrode, a 3 mm diameter glassy carbon electrode was first polished with a 0.05 μm alumina suspension, rinsed with deionized water, and air-dried. A solution was prepared by mixing 5 mg of ground active material with 20 μL of 5% Nafion binder and 100 μL of DI water or DMSO. Subsequently, 1.0 μL of this solution was drop-cast onto the electrode and allowed to dry at room temperature for 6 hours. The electrochemical setup included an Ag/AgCl reference electrode, a platinum wire counter electrode, and 1 M Na₂SO₄ solution as the electrolyte.
3.4. Preparation of Punch-Paste Electrode for Electrochemical Testing
A 3 mm glassy carbon electrode was polished, rinsed, and dried as described earlier. A 3 mm disk was punched from the corresponding active material film. The binder solution was prepared by mixing 20 mL of 5% Nafion with 100 µL of deionized water. A 1 µL drop of the binder was applied to the glassy carbon electrode, and the punched 3 mm film was carefully placed on top. The electrode was then left at room temperature for an hour to dry.
3.5. Characterization
Electrochemical properties were studied using a CH Instruments Electrochemical Analyzer in a three-electrode system, measuring cyclic voltammetry (CV), galvanostatic charge-discharge (GCD), and electrochemical impedance spectroscopy (EIS). Scanning electron microscopy (SEM) and energy-dispersive spectroscopy (EDS) were conducted using a Phenom XL G2 SEM (Thermo Scientific). X-ray diffraction (XRD) was performed using a SmartLab SE Automated Multipurpose X-ray diffractometer (Rigaku) with Cu Kα radiation at 40 kV and 45 mA. The EIS data was analyzed by fitting it to an equivalent circuit model using the built-in fitting tool of the CH Instruments potentiostat software. Initial parameter values for circuit elements were assigned to 0, and the software iteratively optimized them to achieve the best fit. The simulated data was then generated, and the goodness of fit was evaluated by examining residuals and chi-square values.
The specific capacitance of the electrode was calculated from the CV curve using equation 1.
where, C= specific capacitance, A=area of the CV plot, m= mass loading in electrode, k= scan rate, ∆V= voltage range of CV.
4. Results and Discussion
4.1. Electrode Preparation
Ti₃C₂Tₓ MXene film was prepared using LiF+HCl etchant as described in the experimental section.
The working electrode for a three-electrode system was initially prepared using a drop-casting method. A dense MXene solution (5 mg MXene powder dispersed in 100 µL of deionized (DI) water and 20 µL of Nafion) was dropcast onto a 3 mm Glassy Carbon (GC) electrode (Figure 3a) and left to dry for one hour. However, as MXene loses its internal water molecules upon drying and grinding, it becomes less hydrophilic, making dispersion in DI water challenging. [32] Consequently, the dried film showed cracks and failed to cover the GC surface completely. The microscopic image of this dropcast electrode is shown in Figure 3b.
To address this, a solution of MXene in dimethyl sulfoxide (DMSO) with Nafion was prepared. DMSO provided better dispersibility, although the surface wasn’t completely uniform. But it resulted in a crack-free film that fully covered the GC surface (Figure 3c). Moreover, drying this electrode at room temperature required over 10 hours.
An alternative approach involved punching a 3 mm MXene film and attaching it to the GC surface using a solution of DI water and Nafion as a binder. This method offered a uniform and smooth surface of the MXene film with better integration with the GC surface (Figure 3d) and significantly reduced drying time to less than one hour. In the inset of Figure 3d the punched film is shown.
Figure 4 presents a comparison of CV curves obtained from electrodes prepared using three different methods. The results indicate that the dropcast DI water-MXene electrode showed poor capacitance, masking the true electrochemical potential of MXene. This limitation was attributed to the exposed electrode surface hindering proper current development. The electrode prepared by pasting the MXene film demonstrated the best performance owing to its uniform surface. Due to its efficiency and improved results, this approach was adopted for subsequent electrochemical analyses.
4.2. Suitable Potential Window for Charge Storage
MXene was characterized by CV in the negative potential window ranging from -1 V to 0 V, where it exhibited high stability with negligible changes during the initial cycles. The CV curves for the first and the tenth scan, shown in Figure 5a, display a nearly rectangular shape, resembling electric double-layer capacitor (EDLC) behavior. However, MXenes primarily act as pseudocapacitors, storing charge through rapid redox reactions facilitated by surface terminations. This fast redox activity, combined with swift ion intercalation, gives the I-V response a near-EDLC-like appearance. The rounded edges observed in the CV curves are attributed to internal resistances inherent to electrochemical processes.
A slight peak appears at approximately -0.6 V during charging and another at -0.8 V during discharging. These peaks suggest the occurrence of Faradaic redox reactions, likely at the electrode surface, which contribute to the pseudocapacitive behavior of MXenes in this potential window [33].
The Nyquist plot obtained from the EIS study of MXene before and after a CV run in the negative potential window is shown in Figure 5b. The applied bias voltage is 0 V. At high frequencies, the plot exhibits a depressed semicircle which is a characteristic of Faradaic charge transfer processes [34]. A deviated vertical low-frequency line is observed, indicating electrostatic charge storage mechanisms such as ion intercalation. In addition to that, this vertical low frequency line also indicates absence of leakage resistance, signifying negligible self-discharge [35]. However, as the low-frequency line deviates slightly from an ideal capacitive behavior, this indicates electrolyte ion diffusion and resulting adsorption of oxidized MXene [36].
No notable alteration in the charge transfer resistance or the capacitive behavior was observed from Figure 5 during the first few cathodic runs, emphasizing the stability of MXene in this potential window and its effectiveness as an electrode material for electrochemical applications.
Figure 6a presents the first two anodic CV scans from 0 V to 1 V at a scan rate of 5 mV/s. During the first scan, a prominent peak appears around 0.8 V, but it disappears in subsequent scans and does not reappear even after sweeping the electrode in negative potentials. This behavior indicates an irreversible oxidation reaction occurring at this voltage. Tian et al.’s study on the potential-dependent oxidation of Ti3C2O2 MXene, using grand canonical free energy curves, supports this observation. They reported an oxidation potential of 1.3 V for MXene attacked by water [37]. Experimentally, this potential is found to be significantly lower, around 1.094 V vs. the standard hydrogen electrode (SHE, pH = 0) [38]. Tian et al. found that presence of defects or oxygen-containing species in the carbon layer can lower the oxidation potential by nearly 1 V [37].
Further insights into this process were gained from EIS conducted before and after the anodic CV sweep. The Nyquist plot (Figure 6b) shows a substantial enlargement of the semicircle after the anodic run, indicating a significant increase in charge transfer resistance. This behavior confirms the deposition of an insulating oxide layer on the MXene surface.
From these findings and the CV data, it can be inferred that MXene is oxidized in the presence of aqueous electrolyte in the anodic potential window. Oxidation begins at approximately 0.2 V and shows peak at around 0.8 V, forming an irreducible titanium oxide layer. This oxide layer acts as a solid barrier, significantly hindering charge and ion transfer and drastically reducing the capacitance of the MXene electrode.
To further support this claim, XRD spectra and SEM images were analyzed. The SEM image showed that the layered Ti3C2Tx MXenes (Figure 7a) had transformed into a porous structure (Figure 7b). Additionally, the elemental analysis (atomic number %) obtained from EDS, displayed in the inset of Figure 7a,b, demonstrated a significant increase in oxygen content. The XRD spectra of MXenes after the anodic run revealed the presence of rutile TiO₂ phases, while the characteristic MXene peaks disappeared (Figure 7 (c)). These findings confirm that MXenes are highly stable in the negative potential window but are electrochemically unstable in the positive potential window due to oxidation reactions caused by water attack from the aqueous electrolyte.
4.3. Developing EC Model
The optimization of supercapacitors requires advanced modeling techniques to accurately capture the physical phenomena occurring at the material scale and to characterize their electrical performance effectively. In EIS, these phenomena can be modeled using ECs. A commonly used model for supercapacitors is the Randles circuit, as previously discussed in Section 2.
In this work, an EC was developed to fit the impedance spectra of the MXene samples. The model was designed to meet two key criteria: it needed to be accurate enough to represent the main physical processes occurring at the material level while being simple enough for practical use in in-situ characterization.
Circuit-a, as shown in Figure 7a, represents the basic Randles circuit. However, the simulated Nyquist plot generated using this circuit failed to accurately depict the MXene electrode system due to its simplicity, resulting in an error percentage of 19.3% compared to actual data. To modify this circuit, Circuit-b (Figure 7b) was introduced, incorporating an additional capacitive element (C2) in series with Circuit-a. This element represents the double-layer capacitance of blocked electrodes, such as those in supercapacitors [39]. The simulated plot using Circuit-b showed improved accuracy, reducing the error percentage to 14.1%.
Ti3C2Tx MXene undergo aqueous oxidation in the anodic potential range, and over repetitive cycling. This results in a second semicircle in the Nyquist plot due to oxide layer formation as will be discussed in the next two sections. To account for this phenomenon, Circuit-c (Figure 7c) was developed by adding a capacitive element (C3) in parallel with a resistance (Rd) and placing it in series with the original circuit. This addition accounts for the diffusion resistance arising from the formation of the solid oxide layer. Similar strategies have been employed in literature to model the Solid Electrolyte Interphase (SEI) in lithium-ion batteries [40]. This circuit further reduced the error percentage to 6.2%.
The second semicircle in Nyquist plot deviates from the perfect round shape. This deviation might be due to practical resistive factors, like surface roughness, chemical inhomogeneity, and heterogeneous electrode–electrolyte interfaces caused by ion adsorption [41]. One notable modification to account for these phenomena is the use of constant phase elements (CPEs), denoted as Q1, instead of conventional capacitance (C3). CPEs account for real life application factors mentioned above and results in a depressed semicircle on the Nyquist plot, with its center falling below the horizontal axis. [33] This modified circuit (circuit-d) is shown in Figure 7d which further reduced the error percentage to 4.6%.
The fitted Nyquist plots simulated from these four circuits are shown in Figure 7e, and it can be seen that the circuit-d best resembles the recorded MXene system and demonstrates the effectiveness of the model in accurately representing the impedance behavior of MXene-based supercapacitors while maintaining a practical level of complexity.
4.4. Voltage Dependent Electrochemical Behavior Using EC
EIS data has been recorded applying different bias voltages in both anodic and cathodic regions. This provides detailed insights into the electrochemical behavior of the MXene electrode in these ranges.
In the cathodic range, the Nyquist plots retain a similar shape (Figure 8a), but the Warburg region shifts to the right as the bias voltage becomes more negative. This shift reflects an increase in diffusion resistance with increasing negative potential.
Figure 8b shows Nyquist plots for various anodic bias. The curves at 0 V, 0.2 V and 0.25 V show a semicircle and a sloping line. Interestingly, at 0.3 V, a second semicircle appears in the Nyquist plot, which further enlarges as the potential is increased. This second semicircle, typically observed in the lower frequency region, often arises from adsorption and desorption processes at the electrode–electrolyte interface [42,43]. It is often linked to the formation of a solid interphase film [44]. In the MXene electrode, as previously discussed, water molecules are adsorbed at anodic potentials, and a solid oxidized MXene layer begins to form at around 0.3 V. Thus, the second semicircle at 0.3 V represents both the adsorption of water molecules and the onset of the oxide layer's formation. From 0.4 V, the first semicircle becomes significantly larger, indicating increased polarization resistance. This resistance results from the oxide layer formation, which inhibits Faradaic currents and limits subsequent electrochemical processes detectable within the test frequency range.
In the low-frequency region, the sloping line reflects the Warburg impedance, associated with ion diffusion. The ion diffusion coefficient (D) can be determined using the equation 2 [45].
where R is the gas constant, n is the number of electrons, F is the Faraday constant and σ is the Warburg factor. Thus, D is inversely proportional to σ2.
In Figure 8b, the slope of the Warburg region is infinite at lower voltage, which depicts a capacitive behavior and tends to bend down towards finite space with increasing voltage. This change in slope indicates a decrease in D and suggests reduced ion diffusion at higher voltages prior to oxide layer formation. This also indicates a reduction of capacitive behavior in higher positive potential. Hence, it can be concluded that, due to a resistive oxide layer formation, the capacitance of Ti3C2Tx MXene reduces dramatically at voltages higher than 0.3 V.
Table 1 summarizes the values of resistances (Rs, Rct, and Rd) obtained from the developed EC model. The series resistance (Rs) remains consistently low and shows minimal variation across all bias voltages. The charge transfer resistance (Rct) initially decreases slightly up to 0.3 V, as the higher potential facilitates charge transfer. However, beyond this point, Rct increases sharply, corresponding to the formation of an insulating oxide layer. Similarly, the diffusion resistance (Rd) increases slightly as the voltage increases to 0.3 V but then rises significantly due to the greater diffusion hindrance caused by the oxidized layer.
4.5. Analysis of Cyclic Stability Using Developed EC
As Ti3C2Tx MXene undergoes charging and discharging cycles, it faces a degradation in capacitance. To understand cyclic stability, Ti3C2Tx MXene was characterized using CV at a scan rate of 100 mV/s over 1000 cycles, and the changes in capacitance and resistances were analyzed. Initially, the MXene exhibited a capacitance of 493 F/g at this scan rate. After 1000 cycles, the capacitance decreased to 357 F/g, reflecting a retention of 72.5%. Figure 9a illustrates the corresponding CV curves at various cycle intervals. This reduction in capacitance can be attributed to the adsorption of water molecules and/or oxidation of MXene and the resulting increase in resistance, as analyzed through Nyquist plots and the developed EC model.
The Nyquist plots at different cycle numbers, shown in Figure 9b. Initially, only a single semicircle, corresponding to charge transfer resistance (Rct), is observed. However, after 200 cycles, a second semicircle begins to appear, becoming more prominent with continued cycling. This second semicircle can be attributed to the adsorption of water molecules and gradual formation of a resistive layer likely due to oxidation, as discussed previously. Using the EC model, the charge transfer resistance (Rct) and the diffusion resistance (Rd) were quantified. Figure 9c highlights the progressive increase in Rct and Rd with the number of cycles. The rate of Rd increase is initially higher, likely because a larger MXene surface is exposed to water attack. As oxidation proceeds, and a resistive layer forms, it inhibits further water diffusion, causing the oxidation rate to slow. In contrast, Rct increases at a comparatively slower rate, with its underlying cause requiring further investigation in future studies.
Figure 9d shows a reduction in capacitance as the Rd increases with cycling. These findings underscore that the cycling stability of Ti3C2Tx MXene in aqueous electrolytes is primarily governed by its susceptibility to oxidation and the associated rise in resistances. This highlights the need for strategies to mitigate oxidation and enhance the long-term performance of MXene-based energy storage systems.
4.6. Analysis of Surface-Controlled and Diffusion-Controlled Capacitance
Figure 10a shows CV curves of the MXene electrode at various scan rates. The variation of capacitive current (i) with scan rate (v) provides insight into whether surface-controlled reactions or diffusion-controlled processes dominate the charge storage mechanism. To better understand the charge storage behavior during the charge−discharge process, a series of kinetic analyses were performed on the electrode at specific charging and discharging states.
The b value calculated from the equation 3 serves as a critical indicator of the dominant charge storage mechanism of pseudocapacitive electrode [10]:
b can be derived from plotting the logarithm of the current () at a given potential as a function of the logarithm of the scan rate (), if the plot generates a linear relationship. Then b is obtained by calculating the slope of the resulting curve using equation 3. When b≈1, the charge storage process is dominated by surface-controlled behavior, whereas b≈0.5 indicates a diffusion-controlled mechanism. For the MXene electrode, Figure 9b demonstrates the linear relationship of vs at a specific potential with b being close to 1.
Figure 9c highlights the b value obtained from the kinetic analysis at various potentials during the charging and discharging branches of the CV curves. The b values remain close to 1 across most of the voltage range during both charging and discharging. This suggests that surface-controlled reactions primarily dominate the electrochemical process. However, at the beginning of the charging and discharging cycles, the b values decrease. This reduction is attributed to the rounding edges observed in the CV curves (instead of a pure rectangular form) during these stages, indicating a deviation from the ideal capacitive behavior caused by internal resistances. The relationship between log(i) and log(v) in this range is not perfectly linear, leading to a compromised slope. Additionally, a slight decrease in b values is observed in the potential range of -0.5 V to -0.8 V. This reduction indicates that the charge accumulation in this potential range is associated with a more diffusion dominant process, which can be supported by the redox peaks observed in this potential in Figure 5a. Furthermore, the redox peak at this potential become negligible as the scan rate is increased (Figure 10a), which is likely because at higher scan rates diffusion becomes less dominant due to time constraints.
A more quantitative approach is adopted to separate the capacitive effects into surface (pseudocapacitive) and diffusion-controlled (Faradaic) processes. Surface capacitance is primarily related to charge storage on the electrode surface and can be calculated by isolating the k1 term in equation 4.
where i is the current, v is the scan rate, k1 accounts for the surface-controlled process, and k2v0.5 represents the diffusion-controlled contribution. By plotting i/v0.5 against v0.5, the intercept gives k2, and the slope provides k1. The respective capacitances are then derived based on these constants.
Figure 11.
(a) Surface controlled capacitance in comparison with the total capacitance (b) Variation of surface-controlled capacitance at different scan rates.
Figure 11.
(a) Surface controlled capacitance in comparison with the total capacitance (b) Variation of surface-controlled capacitance at different scan rates.
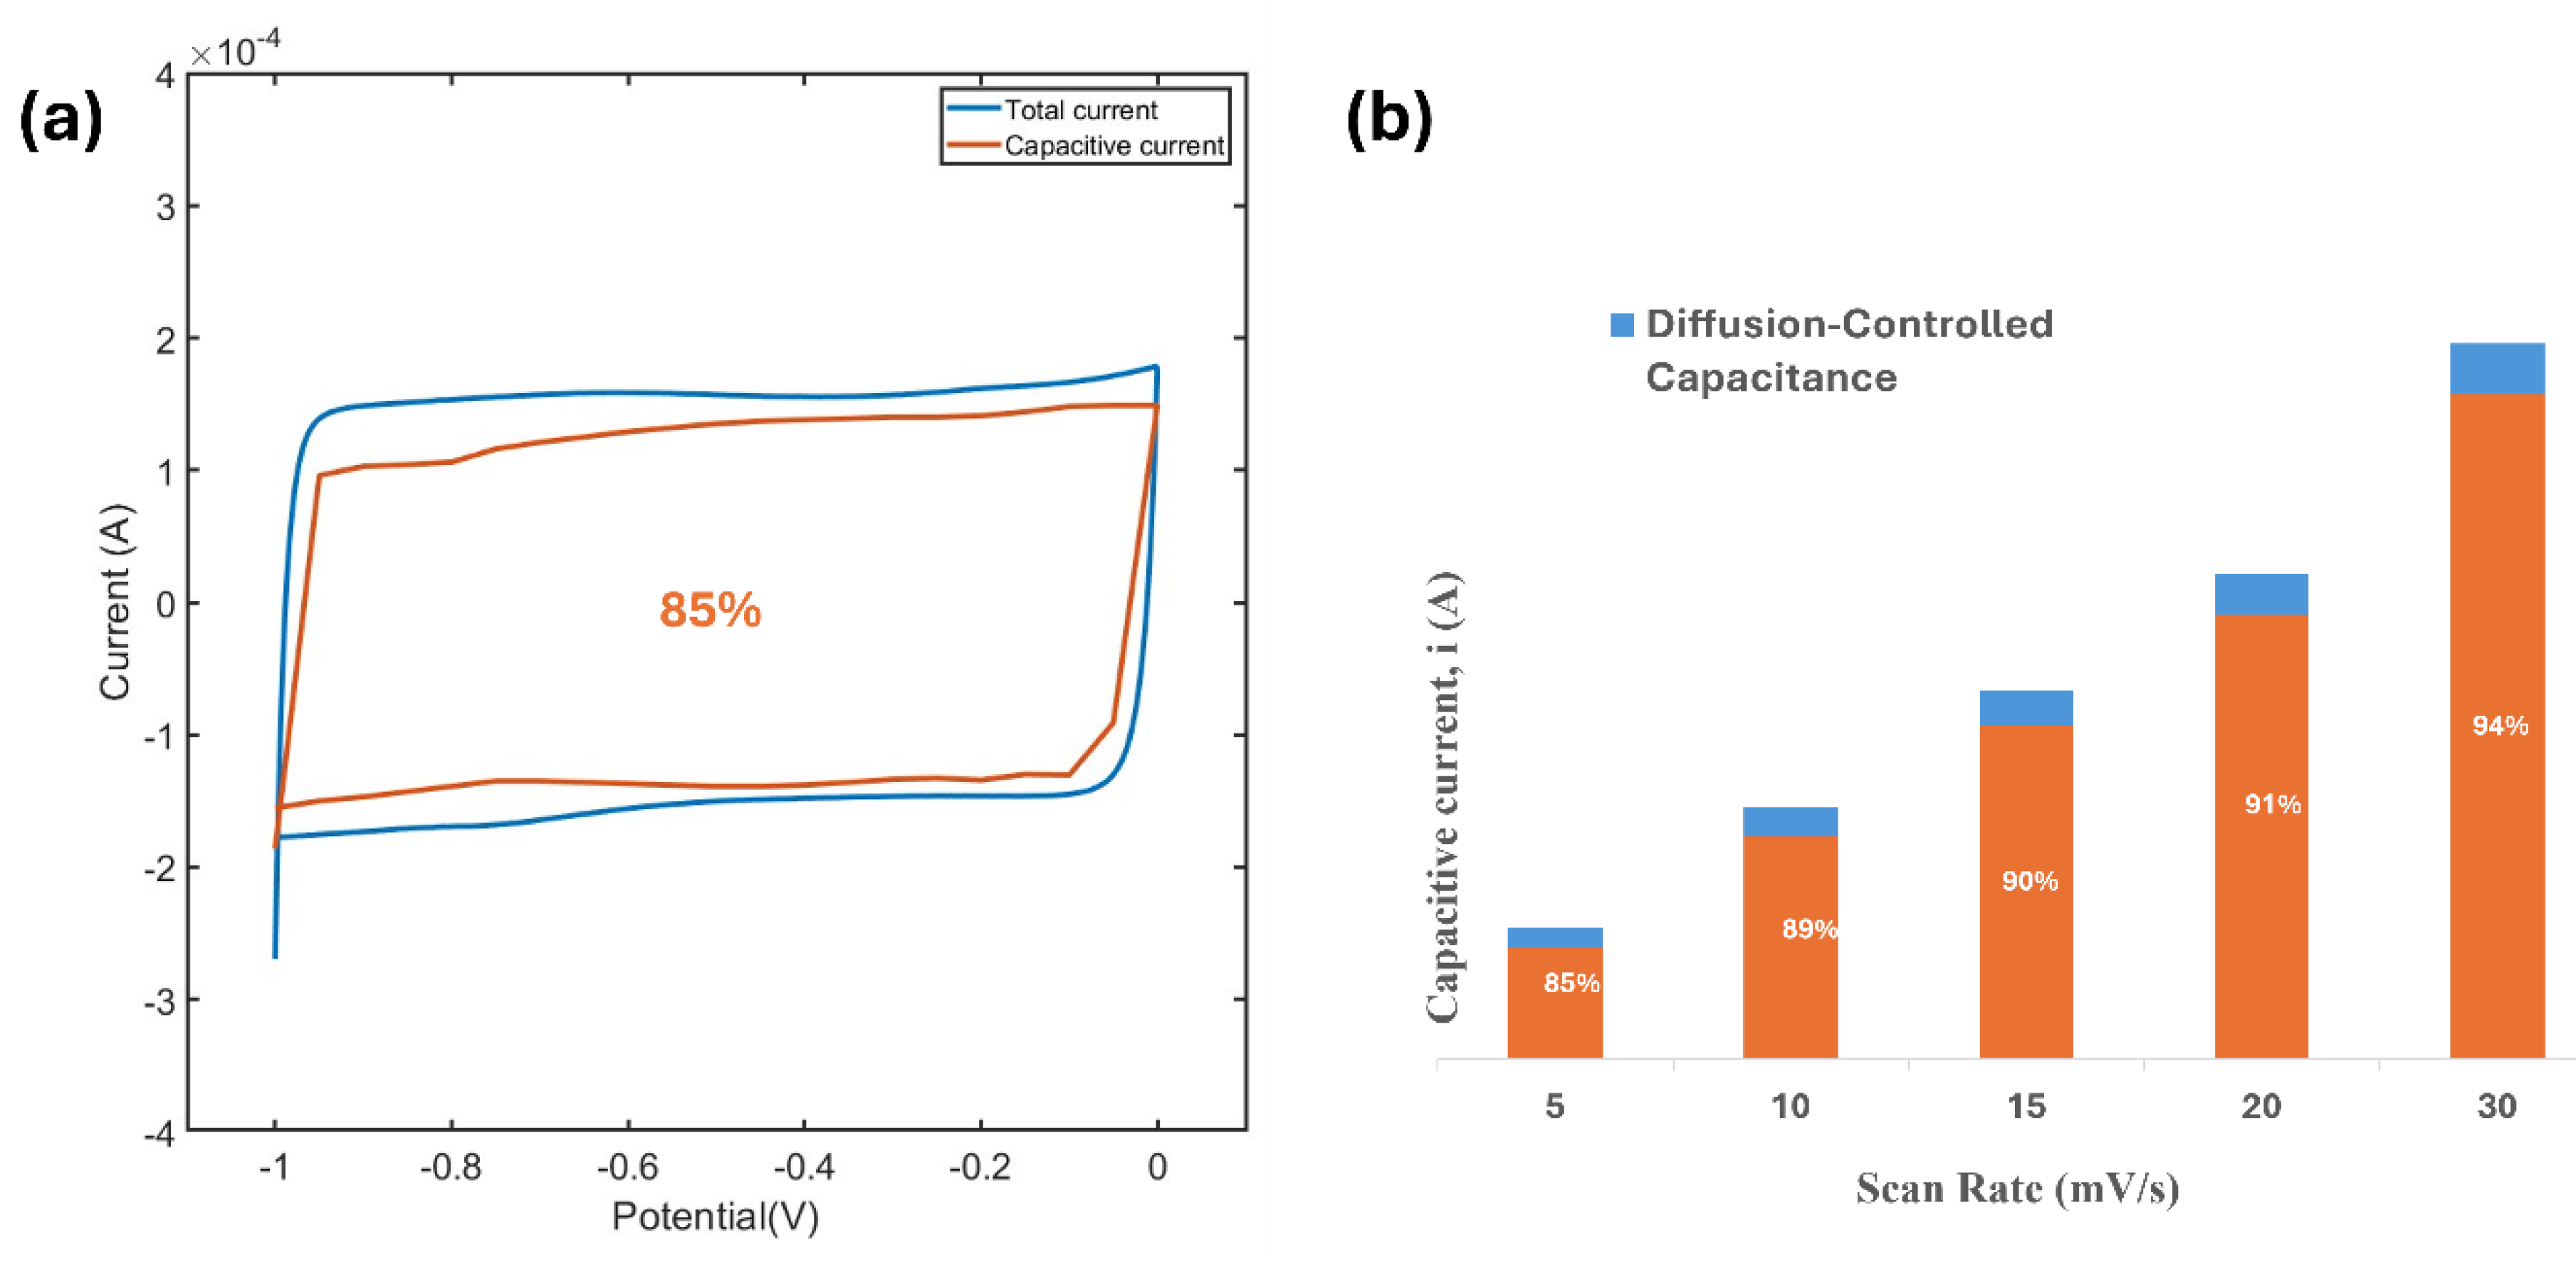
The calculation of capacitive and diffusion-limited contributions to the total capacitance reveals that the overall capacitance in MXene is predominantly surface-controlled (Figure 10a). However, there is a noticeable contribution from diffusion-limited processes, particularly near the peaks observed in the CV curves. In MXene, two distinct pseudocapacitive charge storage mechanisms coexist: electrostatic charge accumulation within the interlayer space and Faradaic protonation at the O-terminated surface [10]. These mechanisms divide the overall electrochemical behavior into two parts. The rectangular-shaped regions of the CV curve correspond to surface-controlled pseudocapacitance, characterized by a b value close to 1, indicating rapid, non-diffusion-dependent charge storage. In contrast, the peaks in the CV curve are associated with diffusion-controlled Faradaic charge storage processes.
The surface-controlled contribution is further increased with increasing scan rate as depicted in Figure 10b. This indicates that at higher scan rate, diffusion becomes even less dominant likely because of the intrinsic time-limitations.
These findings highlight the complex interplay between surface and diffusion phenomena in MXene, contributing to its high electrochemical performance and versatility as an electrode material.
5. Conclusion
This study provides a comprehensive analysis of the electrochemical behavior of Ti₃C₂Tₓ MXene. The developed equivalent circuit model accurately captures the impedance behavior with a low error margin of 4.6%. Analysis of the EIS data using the developed model emphasizes the need to address oxidation-related limitations, particularly cycling stability and anodic degradation. Due to aqueous oxidation, the capacitance of Ti₃C₂Tₓ MXene degrades with a 72.5% retention after 1000 cycles. In the positive potential range, this MXene shows an irreversible oxidation reaction that makes it unsuitable for anodic use. The contributions of surface-controlled and diffusion-controlled processes were also quantified, highlighting the dominant pseudocapacitive behavior facilitated by surface functional groups and ion intercalation. By addressing the challenges associated with determining suitable potential window and oxidation, this research lays the groundwork for the development of high-performance MXene-based supercapacitor systems.
Author Contributions
Nafiza Anjum: Designing and planning the experiments, Synthesis and characterization of materials, data analysis, and writing the primary draft of the manuscript. Abdullah Al Noman: Data analysis and writing draft of the manuscript. Debashish Sen: Electrochemical characterization. Robert A Lazenby and Okenwa I Okoli: Overall supervision, reviewing and editing.
Acknowledgments
The experiments were funded in part by NSF Award #1950500.
References
- R. Akhter and S. S. Maktedar, “MXenes: A comprehensive review of synthesis, properties, and progress in supercapacitor applications,” J. Materiomics, vol. 9, no. 6, pp. 1196–1241, Nov. 2023. [CrossRef]
- A. J. Borah, V. Natu, A. Biswas, and A. Srivastava, “A review on recent progress in synthesis, properties, and applications of MXenes,” Oxf. Open Mater. Sci., vol. 5, no. 1, p. itae017, Jan. 2025. [CrossRef]
- R. M. Ronchi, J. T. Arantes, and S. F. Santos, “Synthesis, structure, properties and applications of MXenes: Current status and perspectives,” Ceram. Int., vol. 45, no. 15, pp. 18167–18188, Oct. 2019. [CrossRef]
- B. Song et al., “The electrical properties and charge transport mechanism of MXenes,” Chin. Chem. Lett., p. 110823, Jan. 2025. [CrossRef]
- L. Jia et al., “Tuning MXene electrical conductivity towards multifunctionality,” Chem. Eng. J., vol. 475, p. 146361, Nov. 2023. [CrossRef]
- L. Zubieta and R. Bonert, “Characterization of double-layer capacitors (DLCs) for power electronics applications,” in Conference Record of 1998 IEEE Industry Applications Conference. Thirty-Third IAS Annual Meeting (Cat. No.98CH36242), Oct. 1998, pp. 1149–1154 vol.2. [CrossRef]
- R. German, A. Hammar, R. Lallemand, A. Sari, and P. Venet, “Novel Experimental Identification Method for a Supercapacitor Multipore Model in Order to Monitor the State of Health,” IEEE Trans. Power Electron., vol. 31, no. 1, pp. 548–559, Jan. 2016. [CrossRef]
- M. Boota, B. Anasori, C. Voigt, M.-Q. Zhao, M. W. Barsoum, and Y. Gogotsi, “Pseudocapacitive Electrodes Produced by Oxidant-Free Polymerization of Pyrrole between the Layers of 2D Titanium Carbide (MXene),” Adv. Mater., vol. 28, no. 7, pp. 1517–1522, Feb. 2016. [CrossRef]
- J. Zhang et al., “Highly Conductive Ti3C2T MXene Hybrid Fibers for Flexible and Elastic Fiber-Shaped Supercapacitors,” Small, vol. 15, no. 8, p. 1804732, Feb. 2019. [CrossRef]
- M. Hu et al., “Intensifying Electrochemical Activity of Ti3C2Tx MXene via Customized Interlayer Structure and Surface Chemistry,” Molecules, vol. 28, no. 15, 2023. [CrossRef]
- C. Rozain and P. Millet, “Electrochemical characterization of Polymer Electrolyte Membrane Water Electrolysis Cells,” Electrochem. Impedance Spectrosc., vol. 131, pp. 160–167, Jun. 2014. [CrossRef]
- S. A. Melchior et al., “High-Voltage Symmetric Supercapacitor Based on 2D Titanium Carbide (MXene, Ti2CTx)/Carbon Nanosphere Composites in a Neutral Aqueous Electrolyte,” J. Electrochem. Soc., vol. 165, no. 3, p. A501, Feb. 2018. [CrossRef]
- X. Zhang, Y. Liu, S. Dong, Z. Ye, and Y. Wei, “Low-temperature synthesized nanocomposites with amorphous FeOOH on Ti3C2Tx for supercapacitors,” J. Alloys Compd., vol. 744, pp. 507–515, May 2018. [CrossRef]
- R. Syamsai and A. N. Grace, “Ta4C3 MXene as supercapacitor electrodes,” J. Alloys Compd., vol. 792, pp. 1230–1238, Jul. 2019. [CrossRef]
- V. Gajdosova et al., “Remarkable differences in the voltammetric response towards hydrogen peroxide, oxygen and Ru(NH3)63+ of electrode interfaces modified with HF or LiF-HCl etched Ti3C2Tx MXene,” Microchim. Acta, vol. 187, no. 1, p. 52, Dec. 2019. [CrossRef]
- J. Mainka, W. Gao, N. He, J. Dillet, and O. Lottin, “A General Equivalent Electrical Circuit Model for the characterization of MXene/graphene oxide hybrid-fiber supercapacitors by electrochemical impedance spectroscopy – Impact of fiber length,” Electrochimica Acta, vol. 404, p. 139740, Feb. 2022. [CrossRef]
- H. Shao et al., “Unraveling the Charge Storage Mechanism of Ti3C2Tx MXene Electrode in Acidic Electrolyte,” ACS Energy Lett., vol. 5, no. 9, pp. 2873–2880, Sep. 2020. [CrossRef]
- Z. Bo, Y. Chen, Q. Yu, J. Yan, K. Cen, and Z. Liu, “Unveiling the Energy Storage Mechanism of MXenes under Acidic Conditions through Transitions of Surface Functionalizations,” J. Phys. Chem. C, vol. 128, no. 6, pp. 2352–2361, Feb. 2024. [CrossRef]
- M. Boota et al., “Understanding Functionalization of Titanium Carbide (MXene) with Quinones and Their Pseudocapacitance,” ACS Appl. Energy Mater., vol. 3, no. 5, pp. 4127–4133, May 2020. [CrossRef]
- J. Hao Ran Huang, S.-W. Tseng, and I.-W. Peter Chen, “In-situ electrochemical XRD and raman probing of ion transport dynamics in ionic liquid-etched Ti3C2Tx MXene for energy storage applications,” Chem. Eng. J., vol. 503, p. 158232, Jan. 2025. [CrossRef]
- Z. Liu et al., “Ultrafast Ion Transport in 2D Confined MXene for Improved Electrochemical Performance: Boron-Atom-Substituted −OH Termination,” ACS Nano, vol. 18, no. 47, pp. 32950–32958, Nov. 2024. [CrossRef]
- J. Wang et al., “Wedge-Like Microstructure of Al2O3/i-Ti3C2Tx Electrode with ‘Nano-Pumping’ Effect for Boosting Ion Diffusion and Electrochemical Defluoridation,” Adv. Sci., vol. n/a, no. n/a, p. 2411659, Nov. 2024. [CrossRef]
- T. Bertok et al., “Electrochemical Impedance Spectroscopy Based Biosensors: Mechanistic Principles, Analytical Examples and Challenges towards Commercialization for Assays of Protein Cancer Biomarkers,” ChemElectroChem, vol. 6, no. 4, pp. 989–1003, Feb. 2019. [CrossRef]
- M. Bag et al., “Kinetics of Ion Transport in Perovskite Active Layers and Its Implications for Active Layer Stability,” J. Am. Chem. Soc., vol. 137, no. 40, pp. 13130–13137, Oct. 2015. [CrossRef]
- X. Li et al., “Nonoxidized MXene Quantum Dots Prepared by Microexplosion Method for Cancer Catalytic Therapy,” Adv. Funct. Mater., vol. 30, no. 24, p. 2000308, Jun. 2020. [CrossRef]
- H. Lin, S. Gao, C. Dai, Y. Chen, and J. Shi, “A Two-Dimensional Biodegradable Niobium Carbide (MXene) for Photothermal Tumor Eradication in NIR-I and NIR-II Biowindows,” J. Am. Chem. Soc., vol. 139, no. 45, pp. 16235–16247, Nov. 2017. [CrossRef]
- P. Navalpotro, M. Anderson, R. Marcilla, and J. Palma, “Insights into the energy storage mechanism of hybrid supercapacitors with redox electrolytes by Electrochemical Impedance Spectroscopy,” Electrochimica Acta, vol. 263, pp. 110–117, Feb. 2018. [CrossRef]
- R. Kötz and M. Carlen, “Principles and applications of electrochemical capacitors,” Electrochimica Acta, vol. 45, no. 15, pp. 2483–2498, May 2000. [CrossRef]
- J. Aguedo, L. Lorencova, M. Barath, P. Farkas, and J. Tkac, “Electrochemical Impedance Spectroscopy on 2D Nanomaterial MXene Modified Interfaces: Application as a Characterization and Transducing Tool,” Chemosensors, vol. 8, no. 4, 2020. [CrossRef]
- D. Wang et al., “Biomimetic, biocompatible and robust silk Fibroin-MXene film with stable 3D cross-link structure for flexible pressure sensors,” Nano Energy, vol. 78, p. 105252, Dec. 2020. [CrossRef]
- J. Chen, P. Tong, L. Huang, Z. Yu, and D. Tang, “Ti3C2 MXene nanosheet-based capacitance immunoassay with tyramine-enzyme repeats to detect prostate-specific antigen on interdigitated micro-comb electrode,” Electrochimica Acta, vol. 319, pp. 375–381, Oct. 2019. [CrossRef]
- T. Wu, P. R. C. Kent, Y. Gogotsi, and D. Jiang, “How Water Attacks MXene,” Chem. Mater., vol. 34, no. 11, pp. 4975–4982, Jun. 2022. [CrossRef]
- N. O. Laschuk, E. B. Easton, and O. V. Zenkina, “Reducing the resistance for the use of electrochemical impedance spectroscopy analysis in materials chemistry,” RSC Adv., vol. 11, no. 45, pp. 27925–27936, 2021. [CrossRef]
- S. Touhami, J. Mainka, J. Dillet, S. A. H. Taleb, and O. Lottin, “Transmission Line Impedance Models Considering Oxygen Transport Limitations in Polymer Electrolyte Membrane Fuel Cells,” J. Electrochem. Soc., vol. 166, no. 15, p. F1209, Nov. 2019. [CrossRef]
- L. M. Da Silva et al., “Reviewing the fundamentals of supercapacitors and the difficulties involving the analysis of the electrochemical findings obtained for porous electrode materials,” Energy Storage Mater., vol. 27, pp. 555–590, May 2020. [CrossRef]
- H.-K. Song et al., “Electrochemical Porosimetry,” J. Electrochem. Soc., vol. 151, no. 3, p. E102, Feb. 2004. [CrossRef]
- Y. Tian et al., “Theoretical insights on potential-dependent oxidation behaviors and antioxidant strategies of MXenes,” Nat. Commun., vol. 15, no. 1, p. 10099, Nov. 2024. [CrossRef]
- J. Tang et al., “Tuning the Electrochemical Performance of Titanium Carbide MXene by Controllable In Situ Anodic Oxidation,” Angew. Chem. Int. Ed., vol. 58, no. 49, pp. 17849–17855, Dec. 2019. [CrossRef]
- C. Masarapu, H. F. Zeng, K. H. Hung, and B. Wei, “Effect of Temperature on the Capacitance of Carbon Nanotube Supercapacitors,” ACS Nano, vol. 3, no. 8, pp. 2199–2206, Aug. 2009. [CrossRef]
- Y. Wu, S. Sundaresan, and B. Balasingam, “Battery Parameter Analysis through Electrochemical Impedance Spectroscopy at Different State of Charge Levels,” J. Low Power Electron. Appl., vol. 13, no. 2, 2023. [CrossRef]
- J. K. Bhattarai, Y. H. Tan, B. Pandey, K. Fujikawa, A. V. Demchenko, and K. J. Stine, “Electrochemical impedance spectroscopy study of Concanavalin A binding to self-assembled monolayers of mannosides on gold wire electrodes,” J. Electroanal. Chem., vol. 780, pp. 311–320, Nov. 2016. [CrossRef]
- J. Wang et al., “Systematic investigation on determining chemical diffusion coefficients of lithium ion in Li1 + xVPO4F (0 ≤ x ≤ 2),” J. Solid State Electrochem., vol. 19, no. 1, pp. 153–160, Jan. 2015. [CrossRef]
- L. Manjakkal, E. Djurdjic, K. Cvejin, J. Kulawik, K. Zaraska, and D. Szwagierczak, “Electrochemical Impedance Spectroscopic Analysis of RuO2 Based Thick Film pH Sensors,” Electrochimica Acta, vol. 168, pp. 246–255, Jun. 2015. [CrossRef]
- N. Chen et al., “LiFe(MoO4)2 as a Novel Anode Material for Lithium-Ion Batteries,” ACS Appl. Mater. Interfaces, vol. 6, no. 13, pp. 10661–10666, Jul. 2014. [CrossRef]
- S. Zhao et al., “Li-ion uptake and increase in interlayer spacing of Nb4C3 MXene,” Energy Storage Mater., vol. 8, pp. 42–48, Jul. 2017. [CrossRef]
Figure 1.
Basic shapes of Nyquist plots and corresponding ECs.
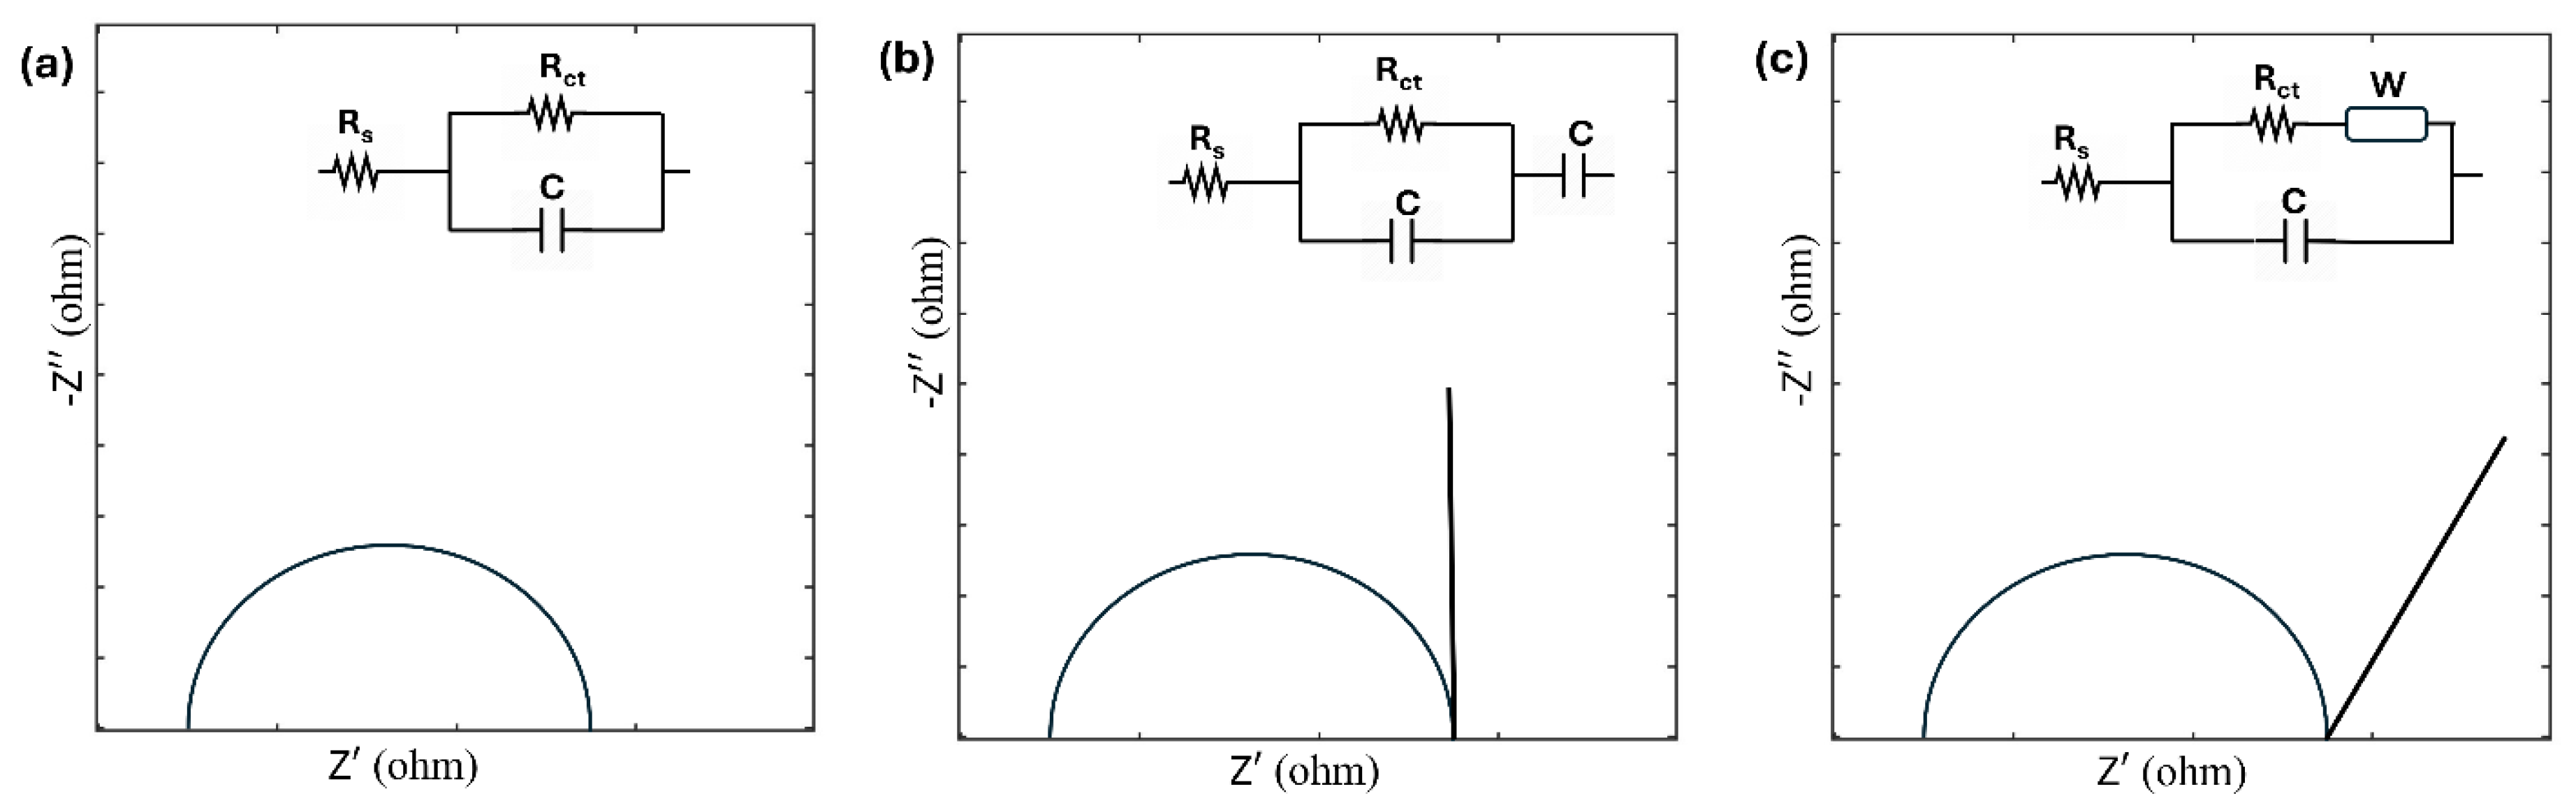
Figure 2.
Typical Nyquist plot for a supercapacitor.
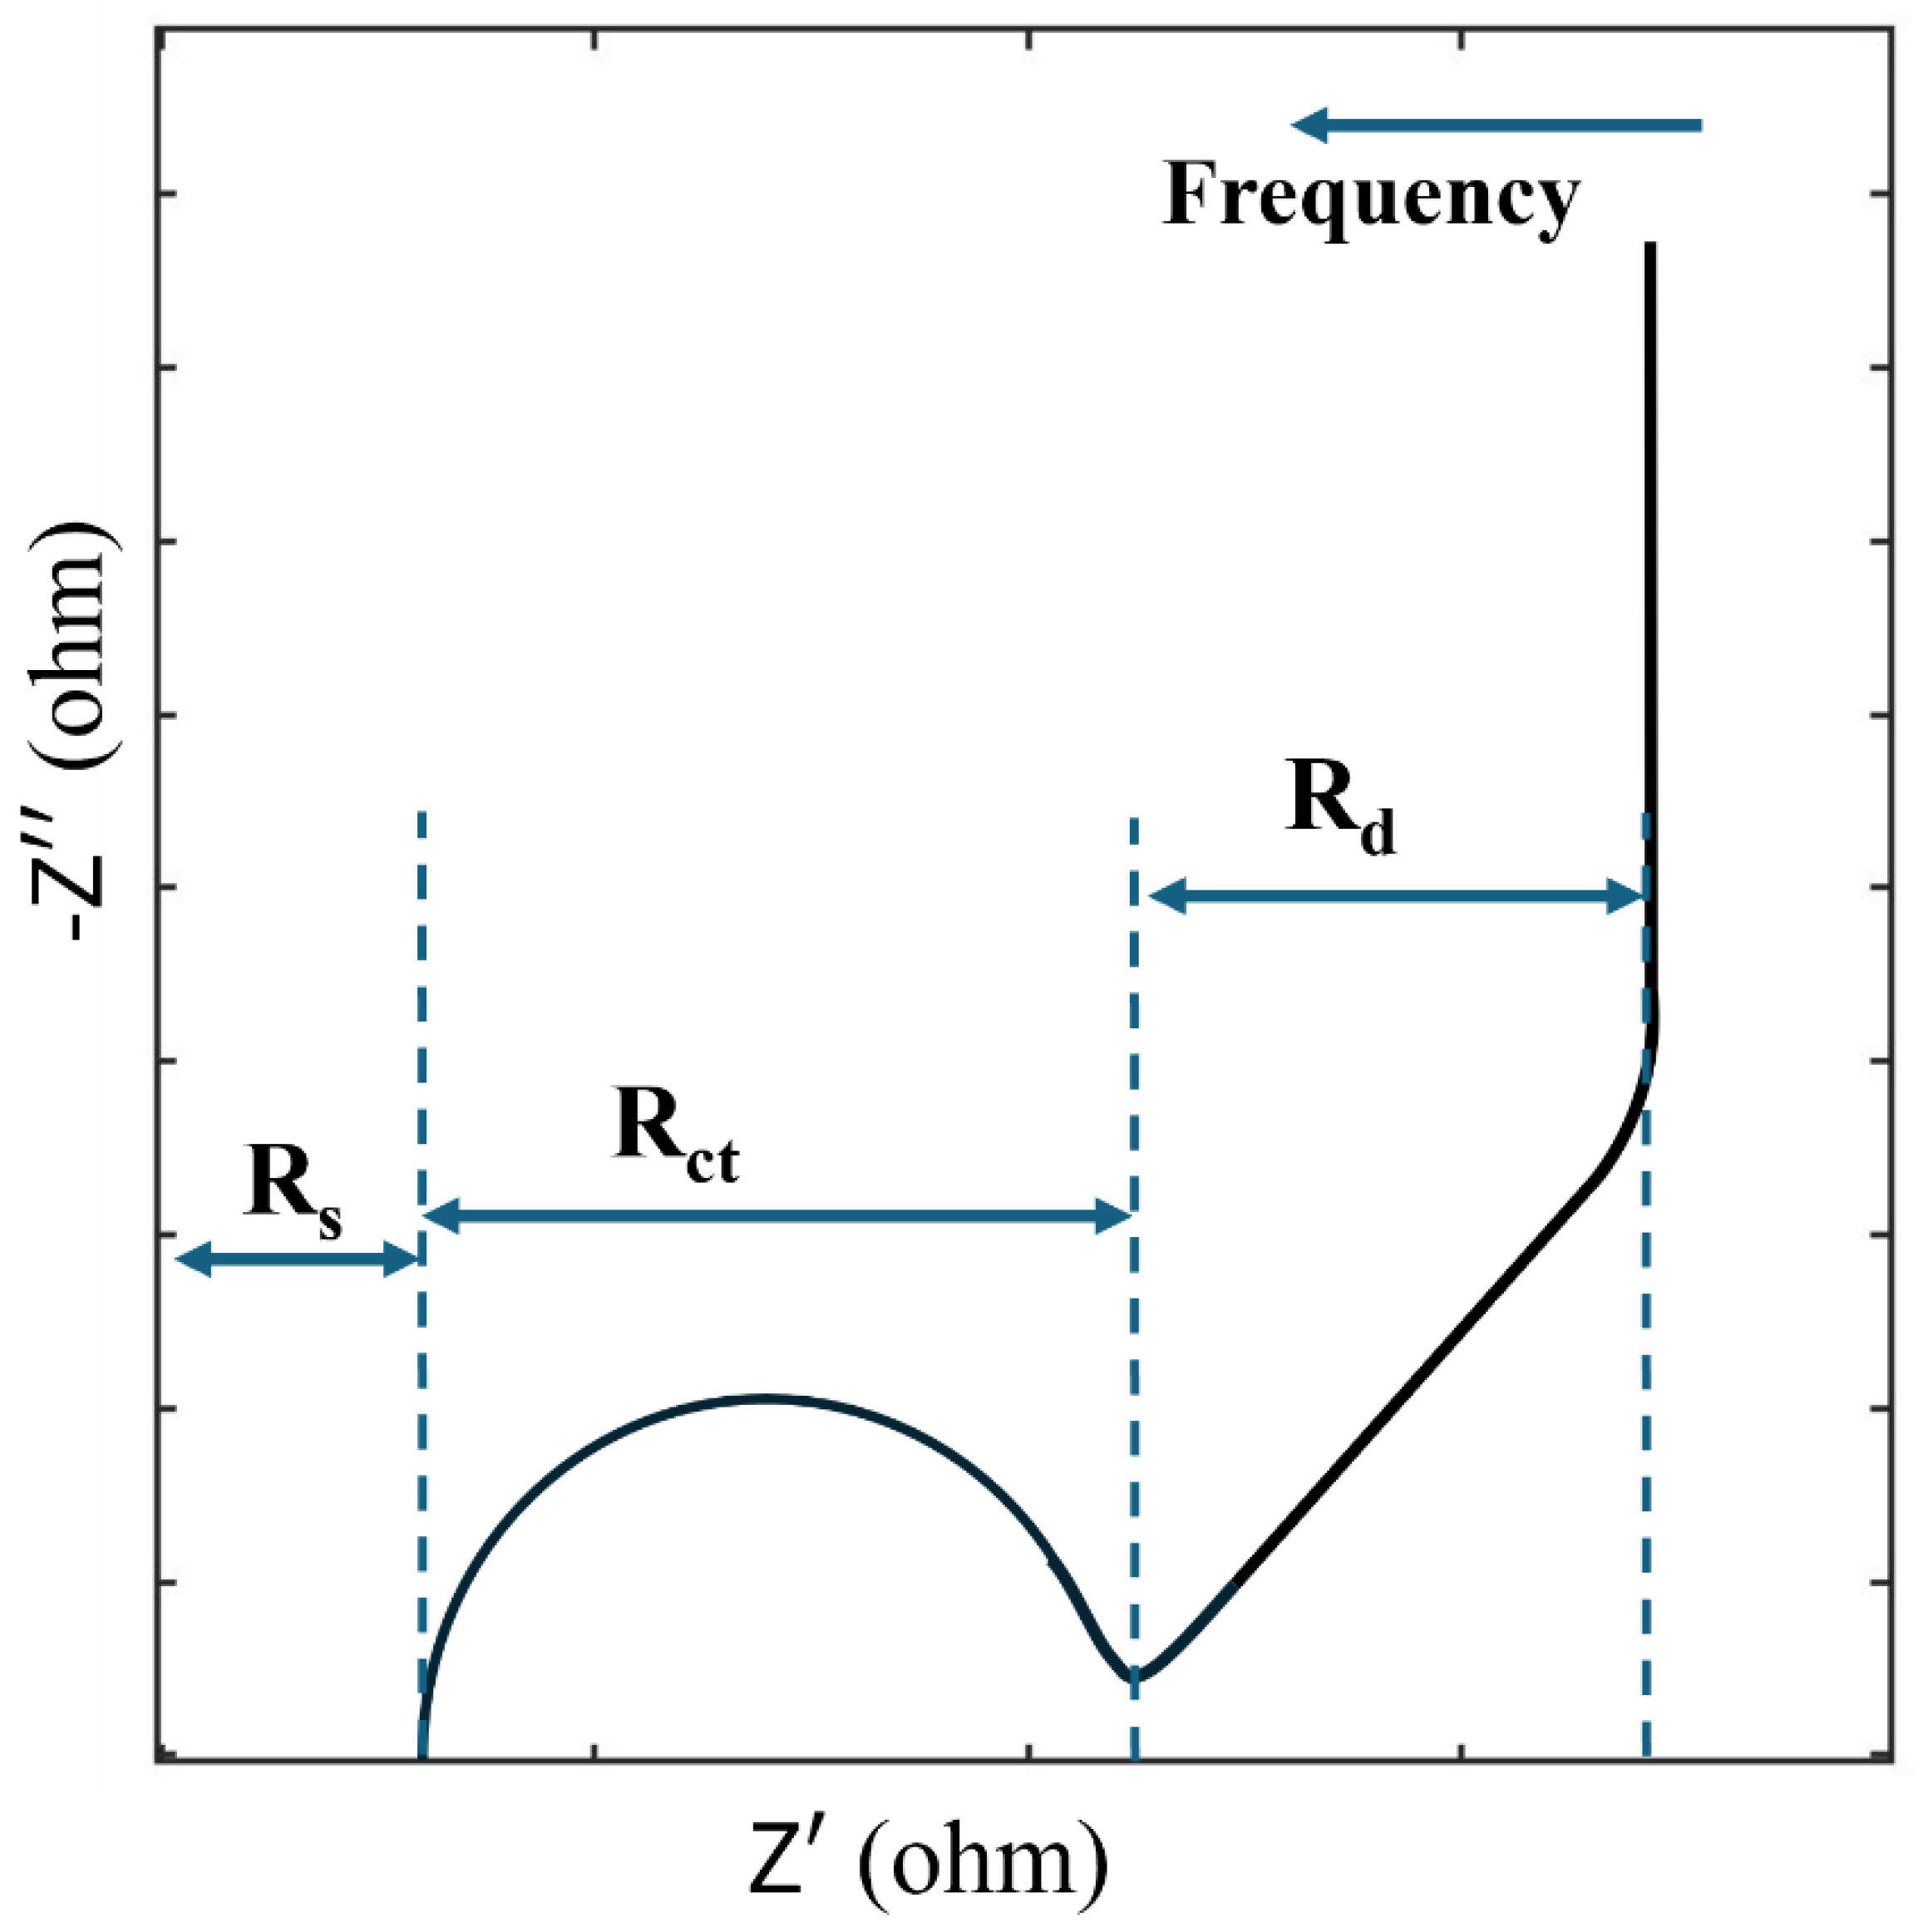
Figure 3.
Microscopic images of (a) bare electrode, MXene electrodes prepared by (b) dropcasting DI water-MXene solution (c) dropcasting DMSO-MXene solution (d) pasting punched MXene film.
Figure 3.
Microscopic images of (a) bare electrode, MXene electrodes prepared by (b) dropcasting DI water-MXene solution (c) dropcasting DMSO-MXene solution (d) pasting punched MXene film.
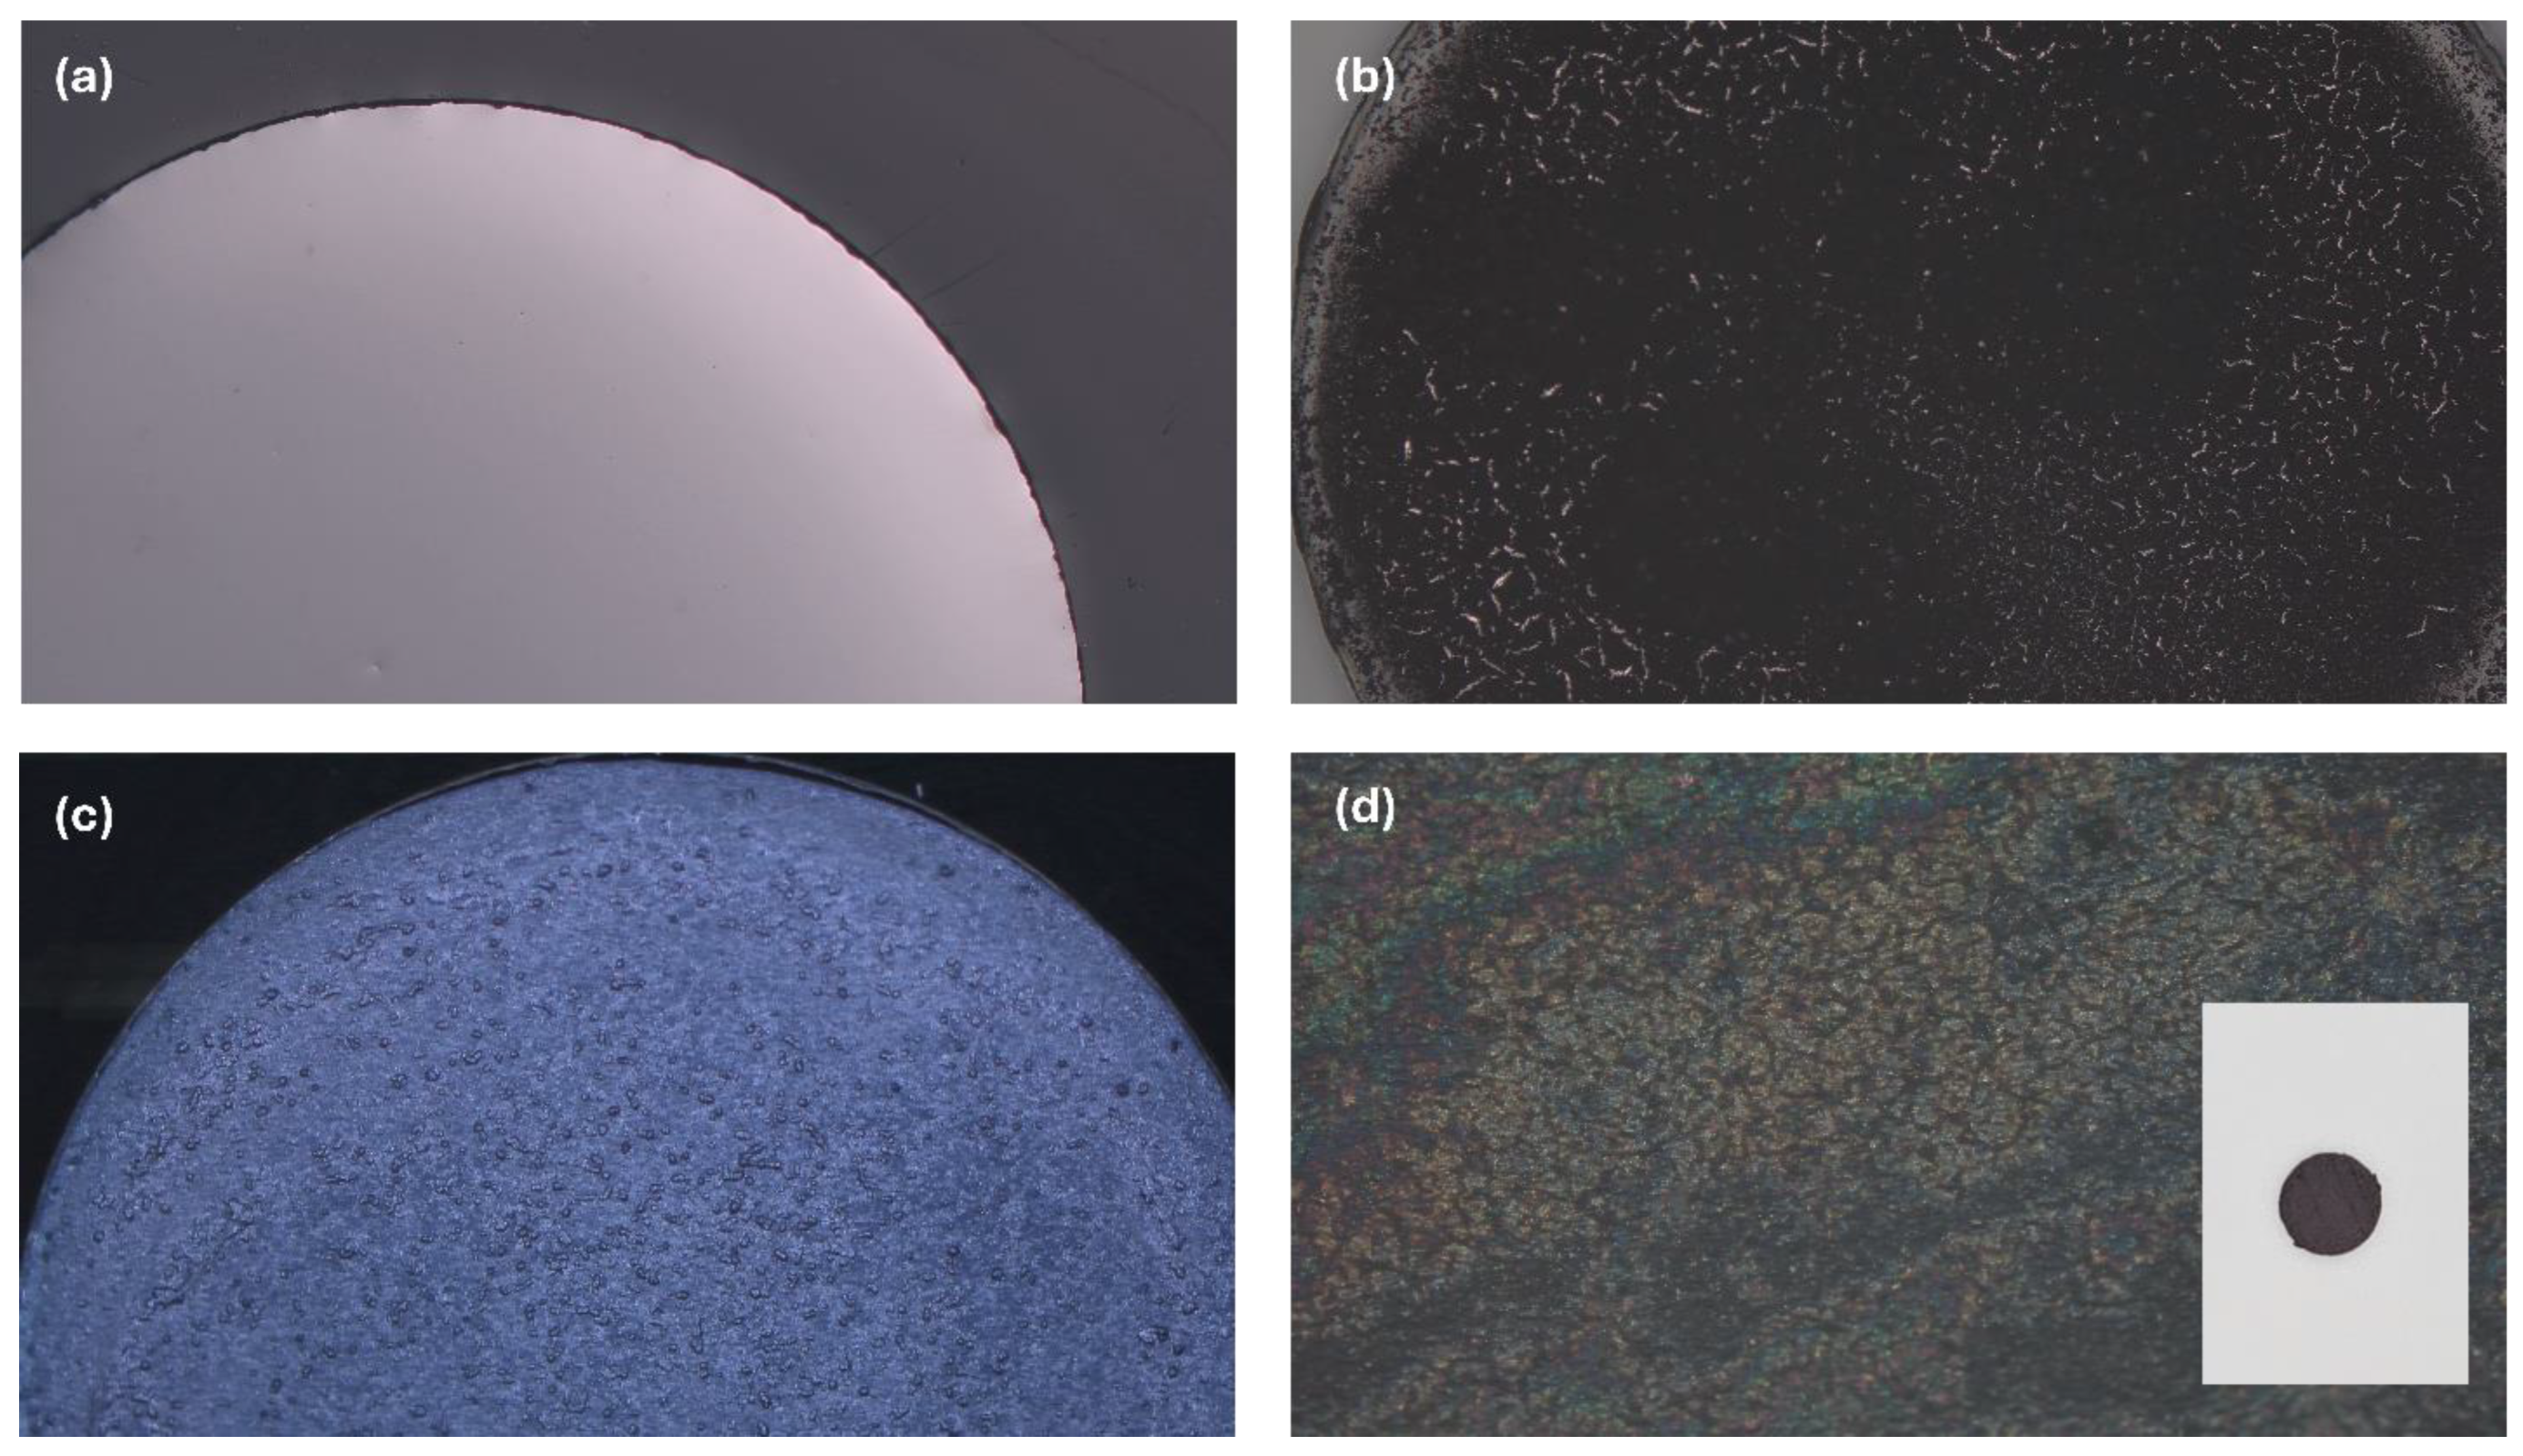
Figure 4.
CV curves for MXene electrode prepared by dropcasting DI water-MXene solution, dropcasting DMSO-MXene solution, and pasting MXene film.
Figure 4.
CV curves for MXene electrode prepared by dropcasting DI water-MXene solution, dropcasting DMSO-MXene solution, and pasting MXene film.
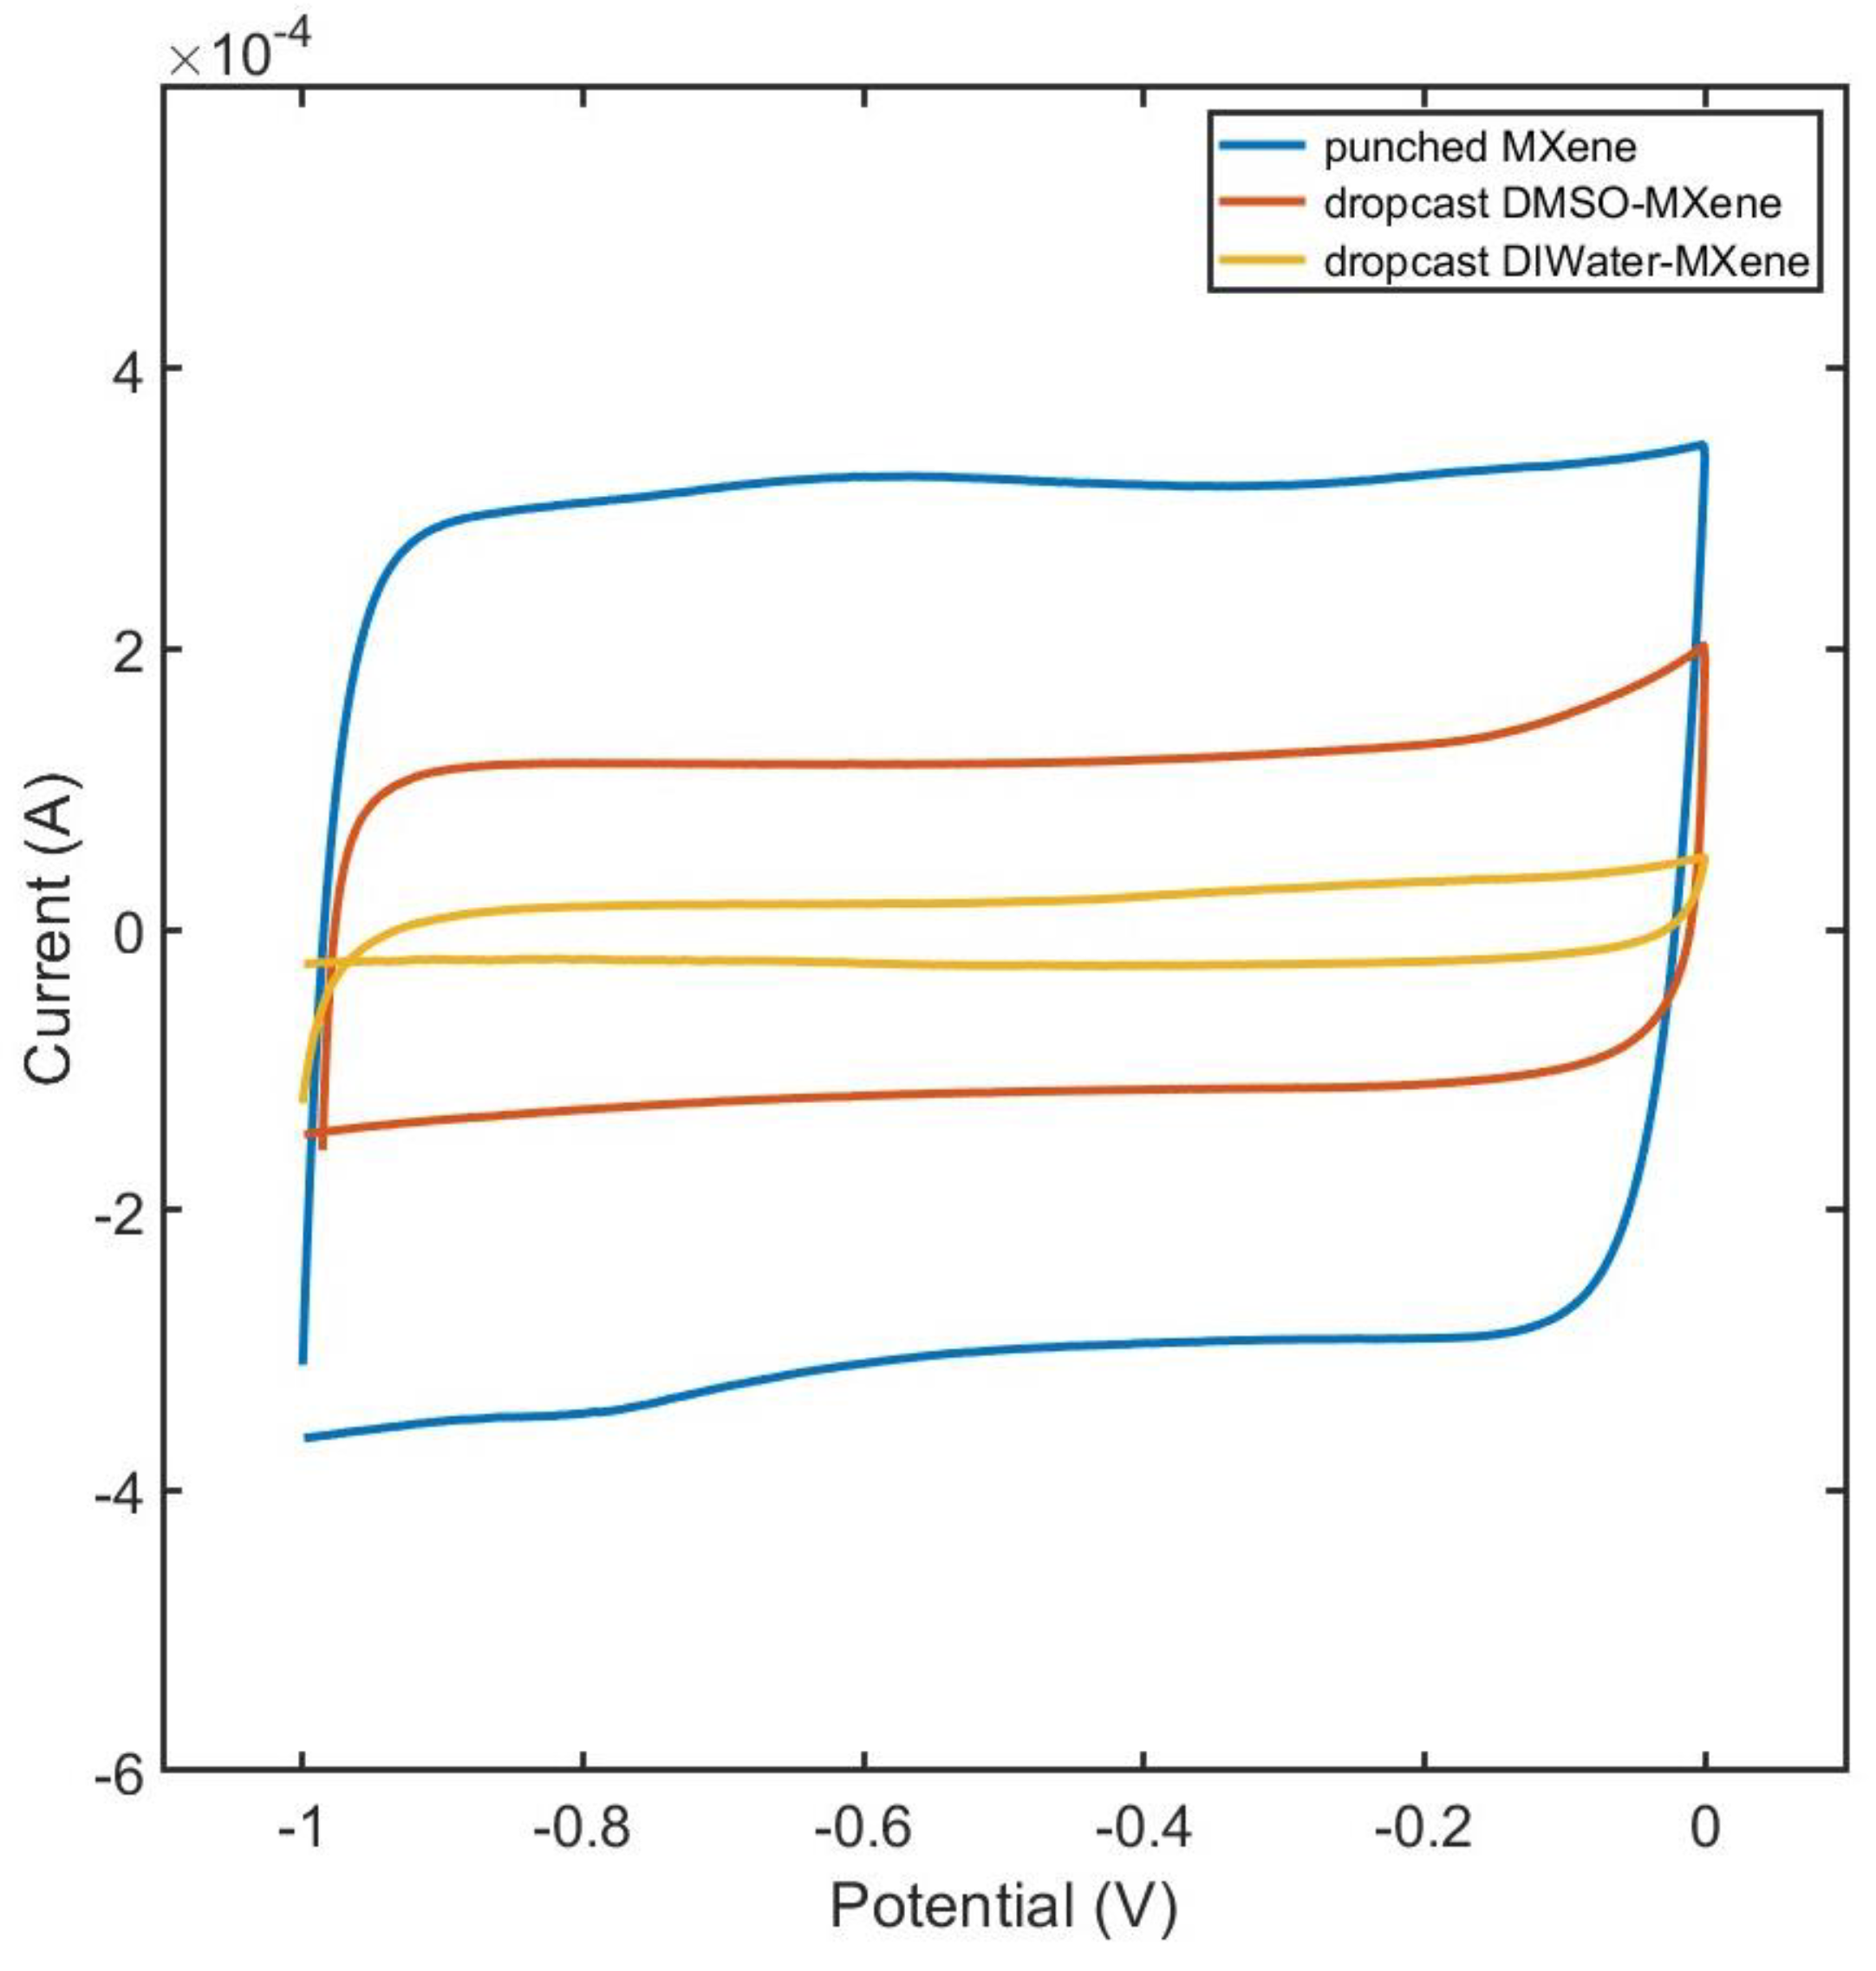
Figure 5.
(a) 1st and 10th CV scan of MXene in cathodic potential window at a scan rate of 5 mV/s, (b) Nyquist plots obtained after the 1st and 10th cathodic CV run at a bias voltage of 0 V.
Figure 5.
(a) 1st and 10th CV scan of MXene in cathodic potential window at a scan rate of 5 mV/s, (b) Nyquist plots obtained after the 1st and 10th cathodic CV run at a bias voltage of 0 V.
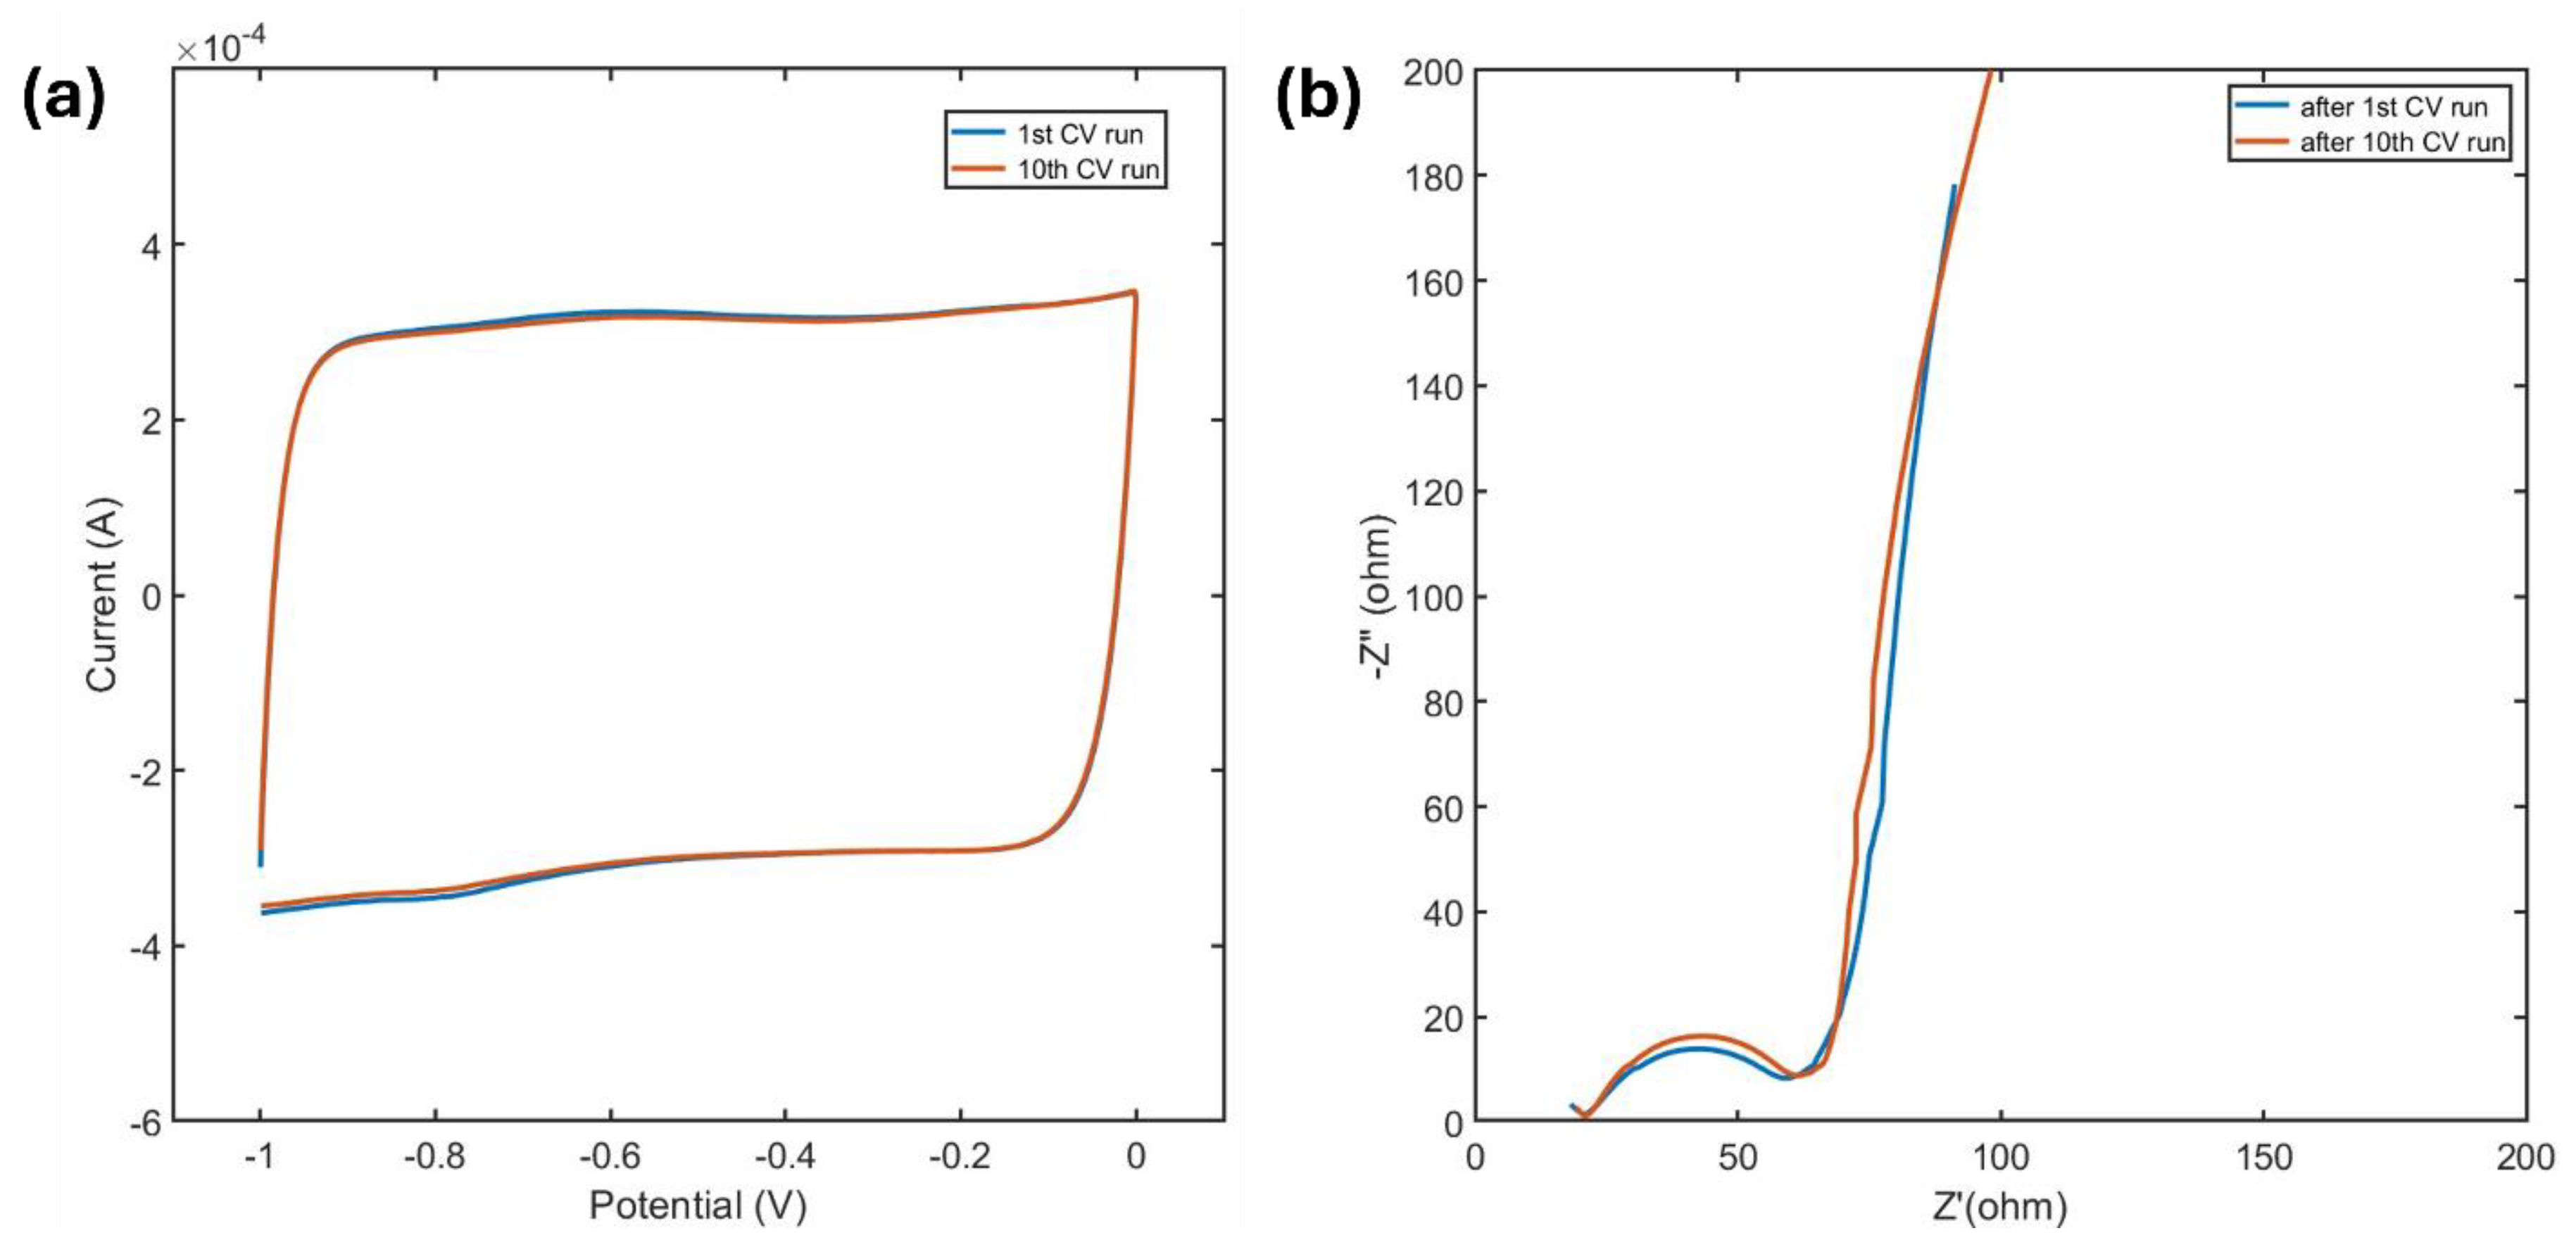
Figure 6.
(a) First two CV scan of MXene in anodic potential window at a scan rate of 5 mv/s, (b) Nyquist plot obtained before and after the 1st anodic CV run.
Figure 6.
(a) First two CV scan of MXene in anodic potential window at a scan rate of 5 mv/s, (b) Nyquist plot obtained before and after the 1st anodic CV run.
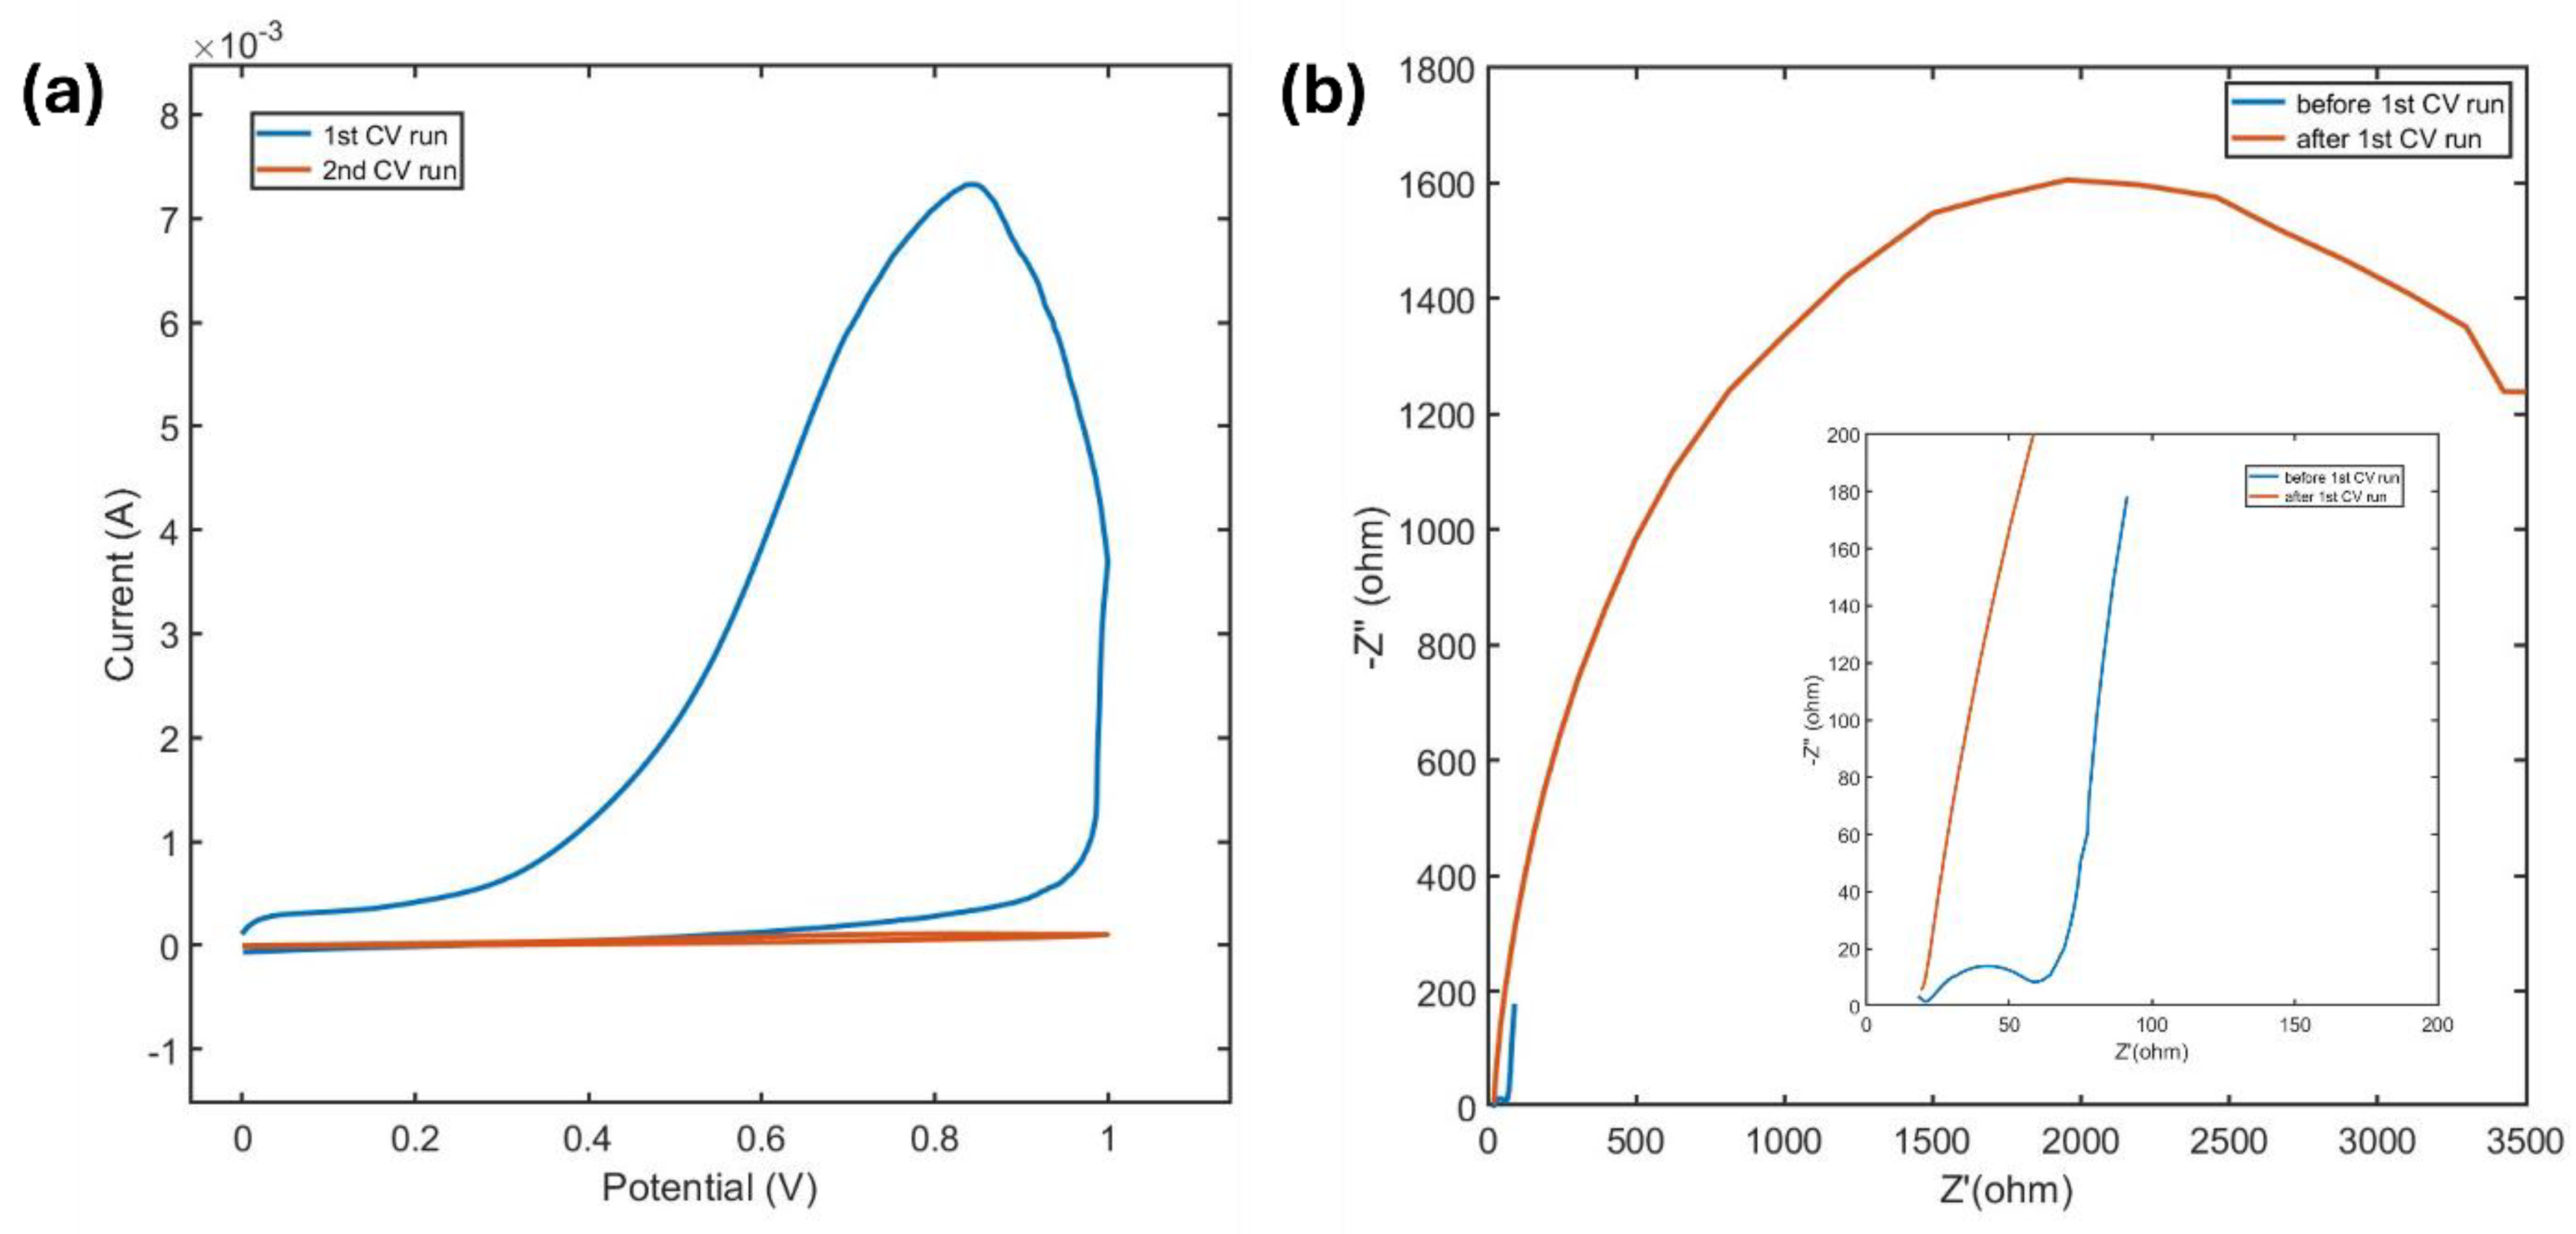
Figure 7.
SEM image of MXene (a) before and (b) after anodic run, EDS results in atomic % is shown in inset. (c) XRD data before and after anodic run.
Figure 7.
SEM image of MXene (a) before and (b) after anodic run, EDS results in atomic % is shown in inset. (c) XRD data before and after anodic run.
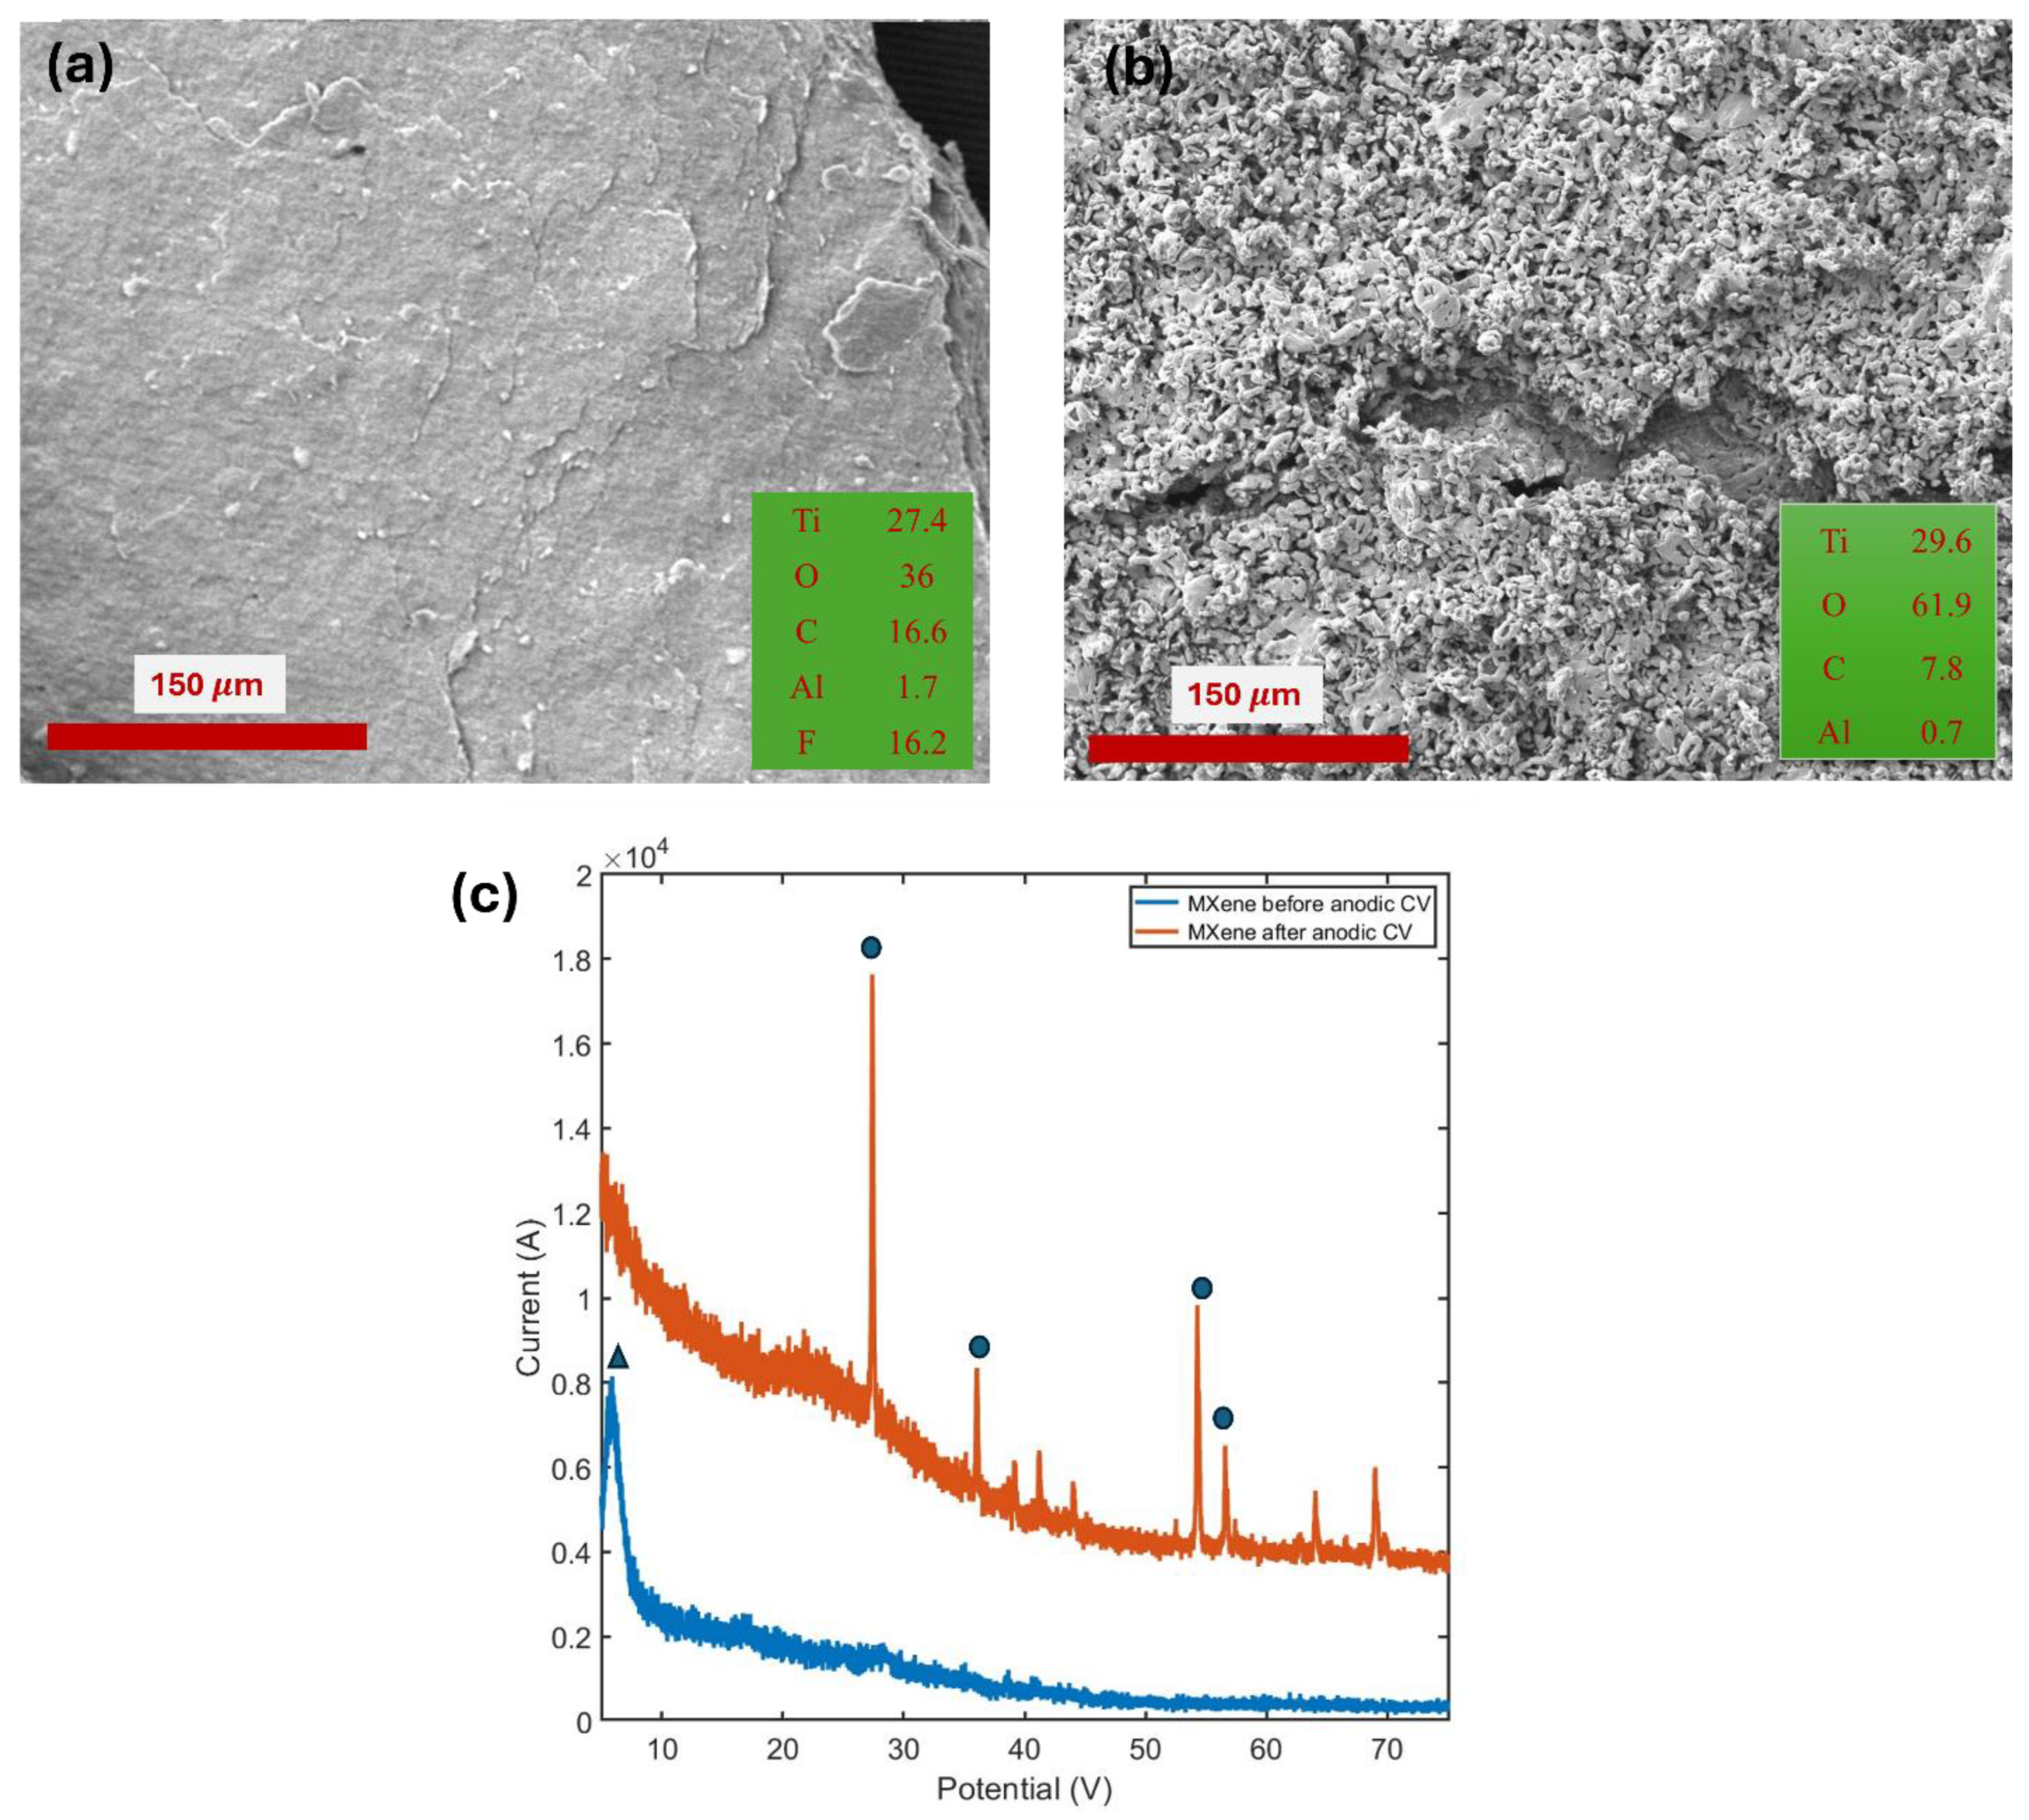
Figure 7.
(a-d) different ECs studied. (e) Fitted data derived from the ECs vs the actual recorded data in Nyquist plot.
Figure 7.
(a-d) different ECs studied. (e) Fitted data derived from the ECs vs the actual recorded data in Nyquist plot.
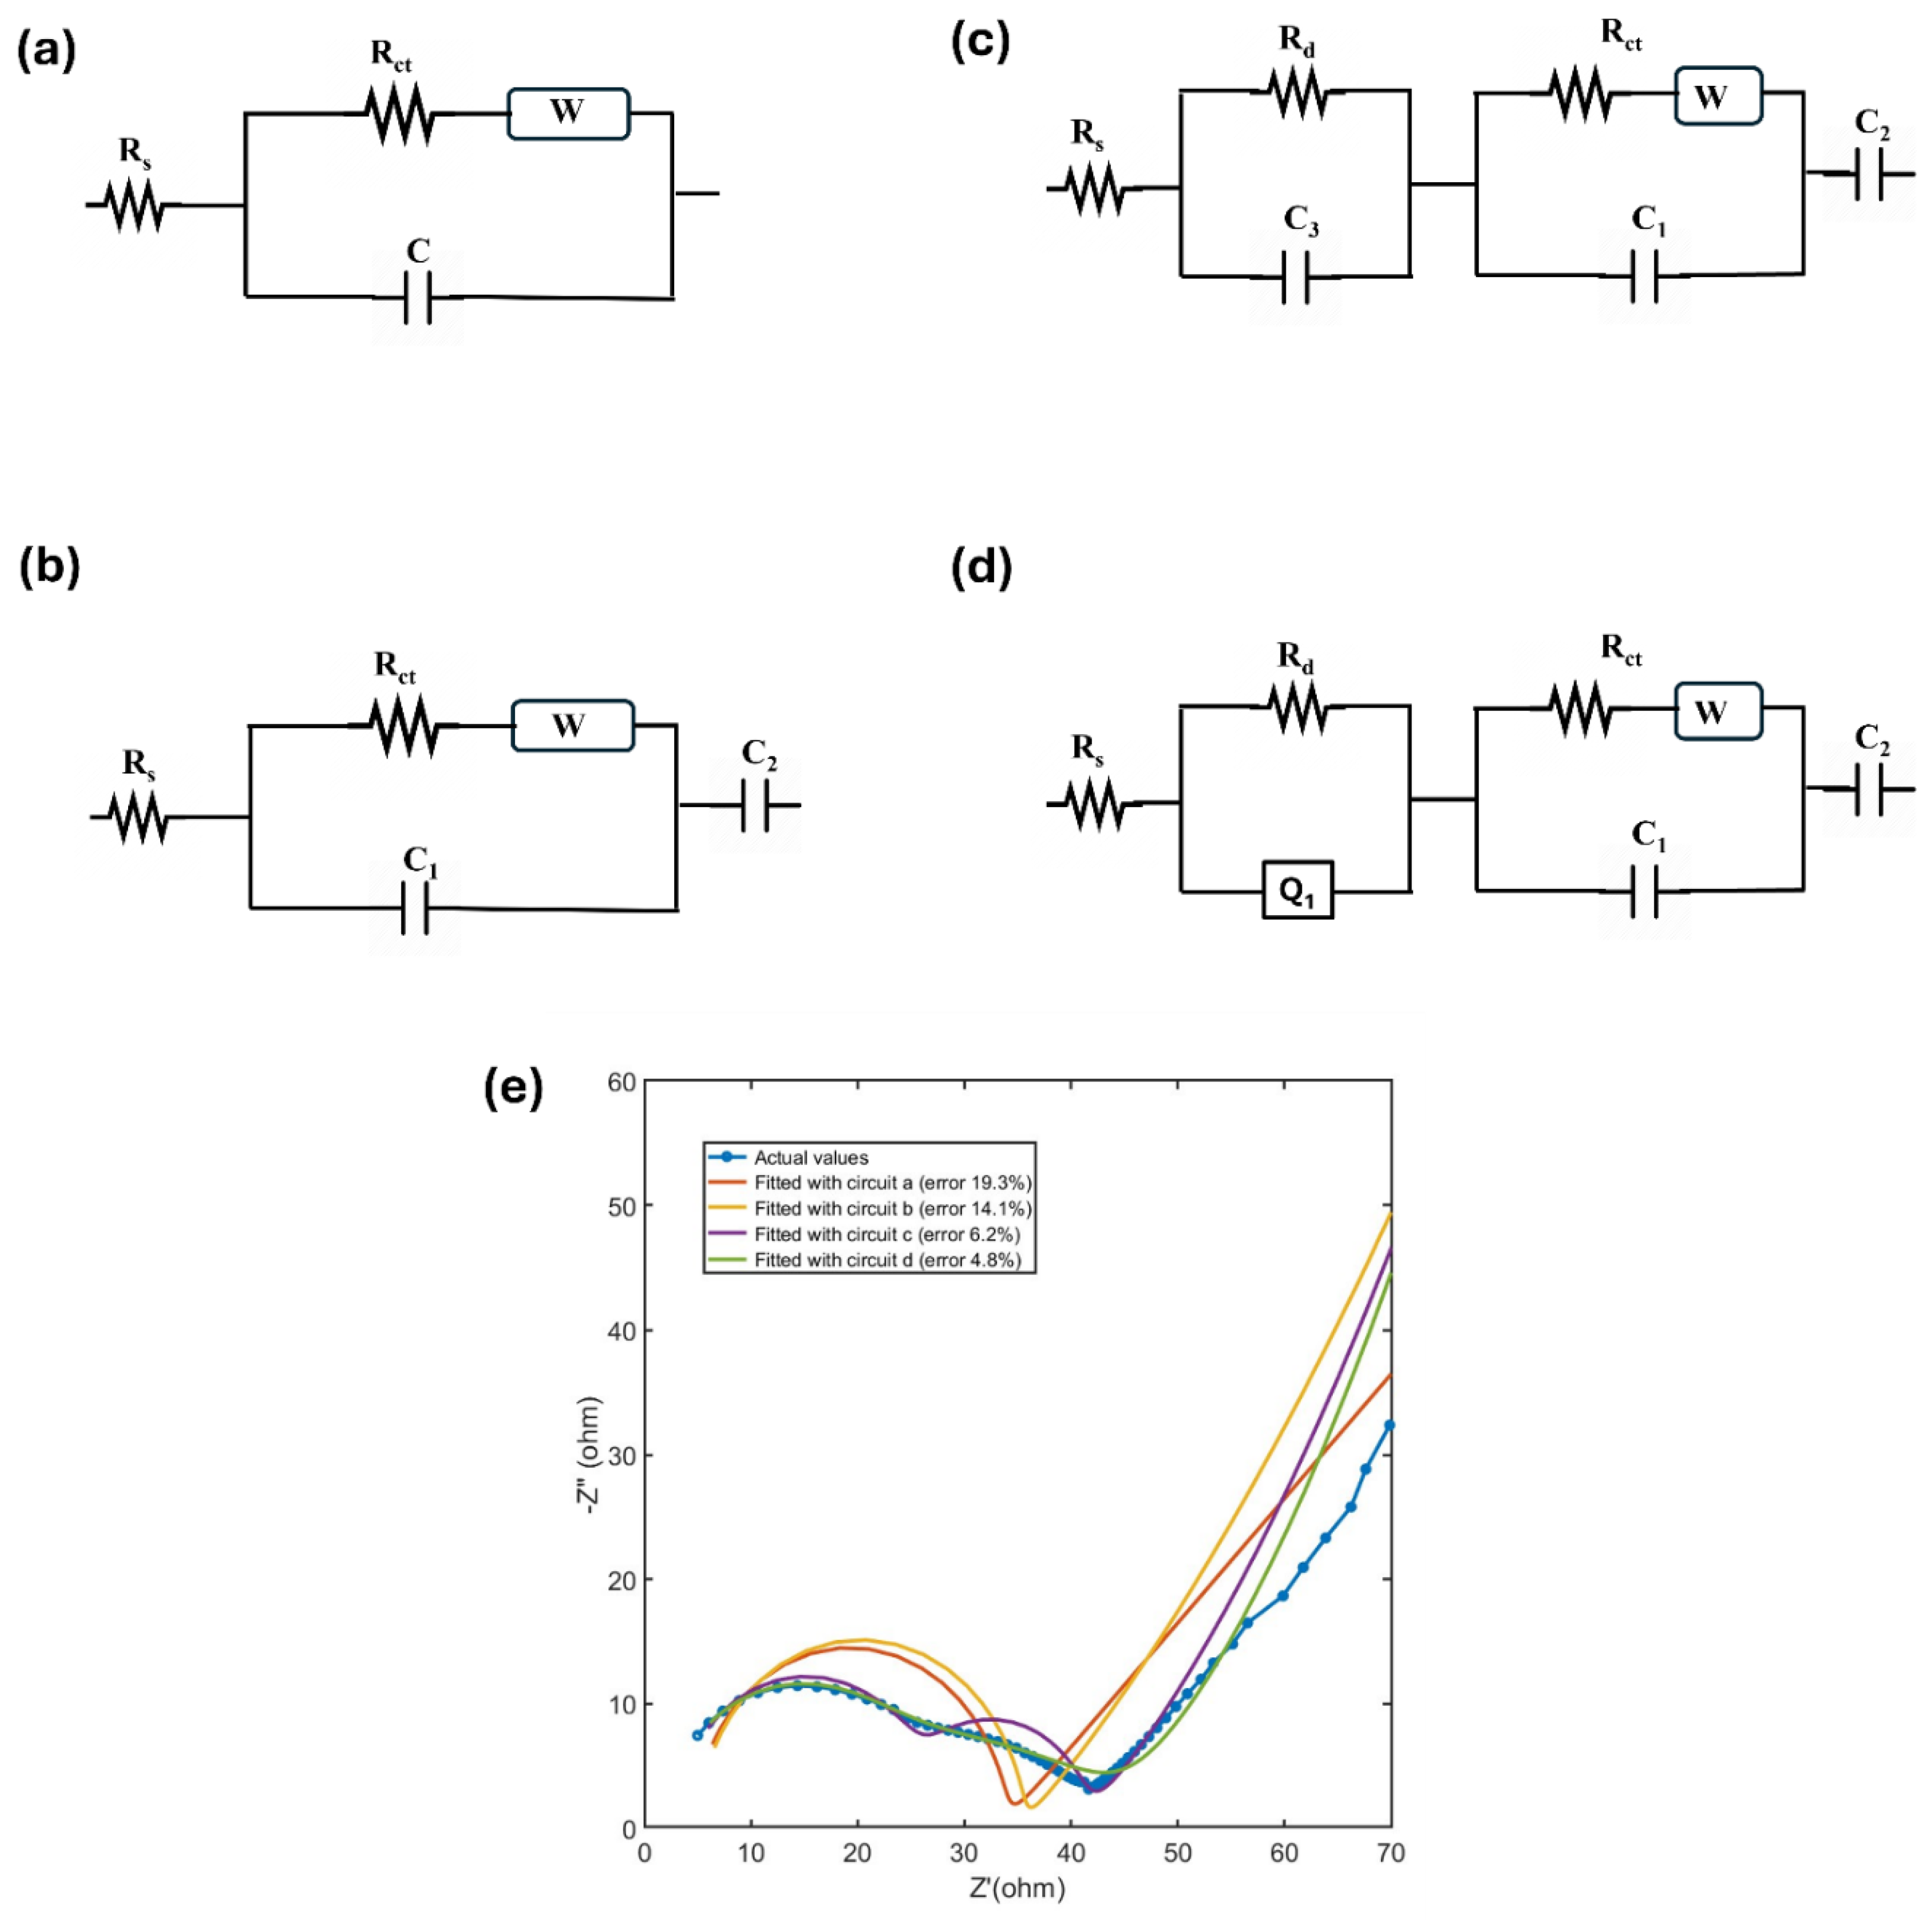
Figure 8.
Nyquist plot of MXene electrode obtained from recorded EIS data at different bias voltage in (a) cathodic potential range and (b) anodic potential range.
Figure 8.
Nyquist plot of MXene electrode obtained from recorded EIS data at different bias voltage in (a) cathodic potential range and (b) anodic potential range.
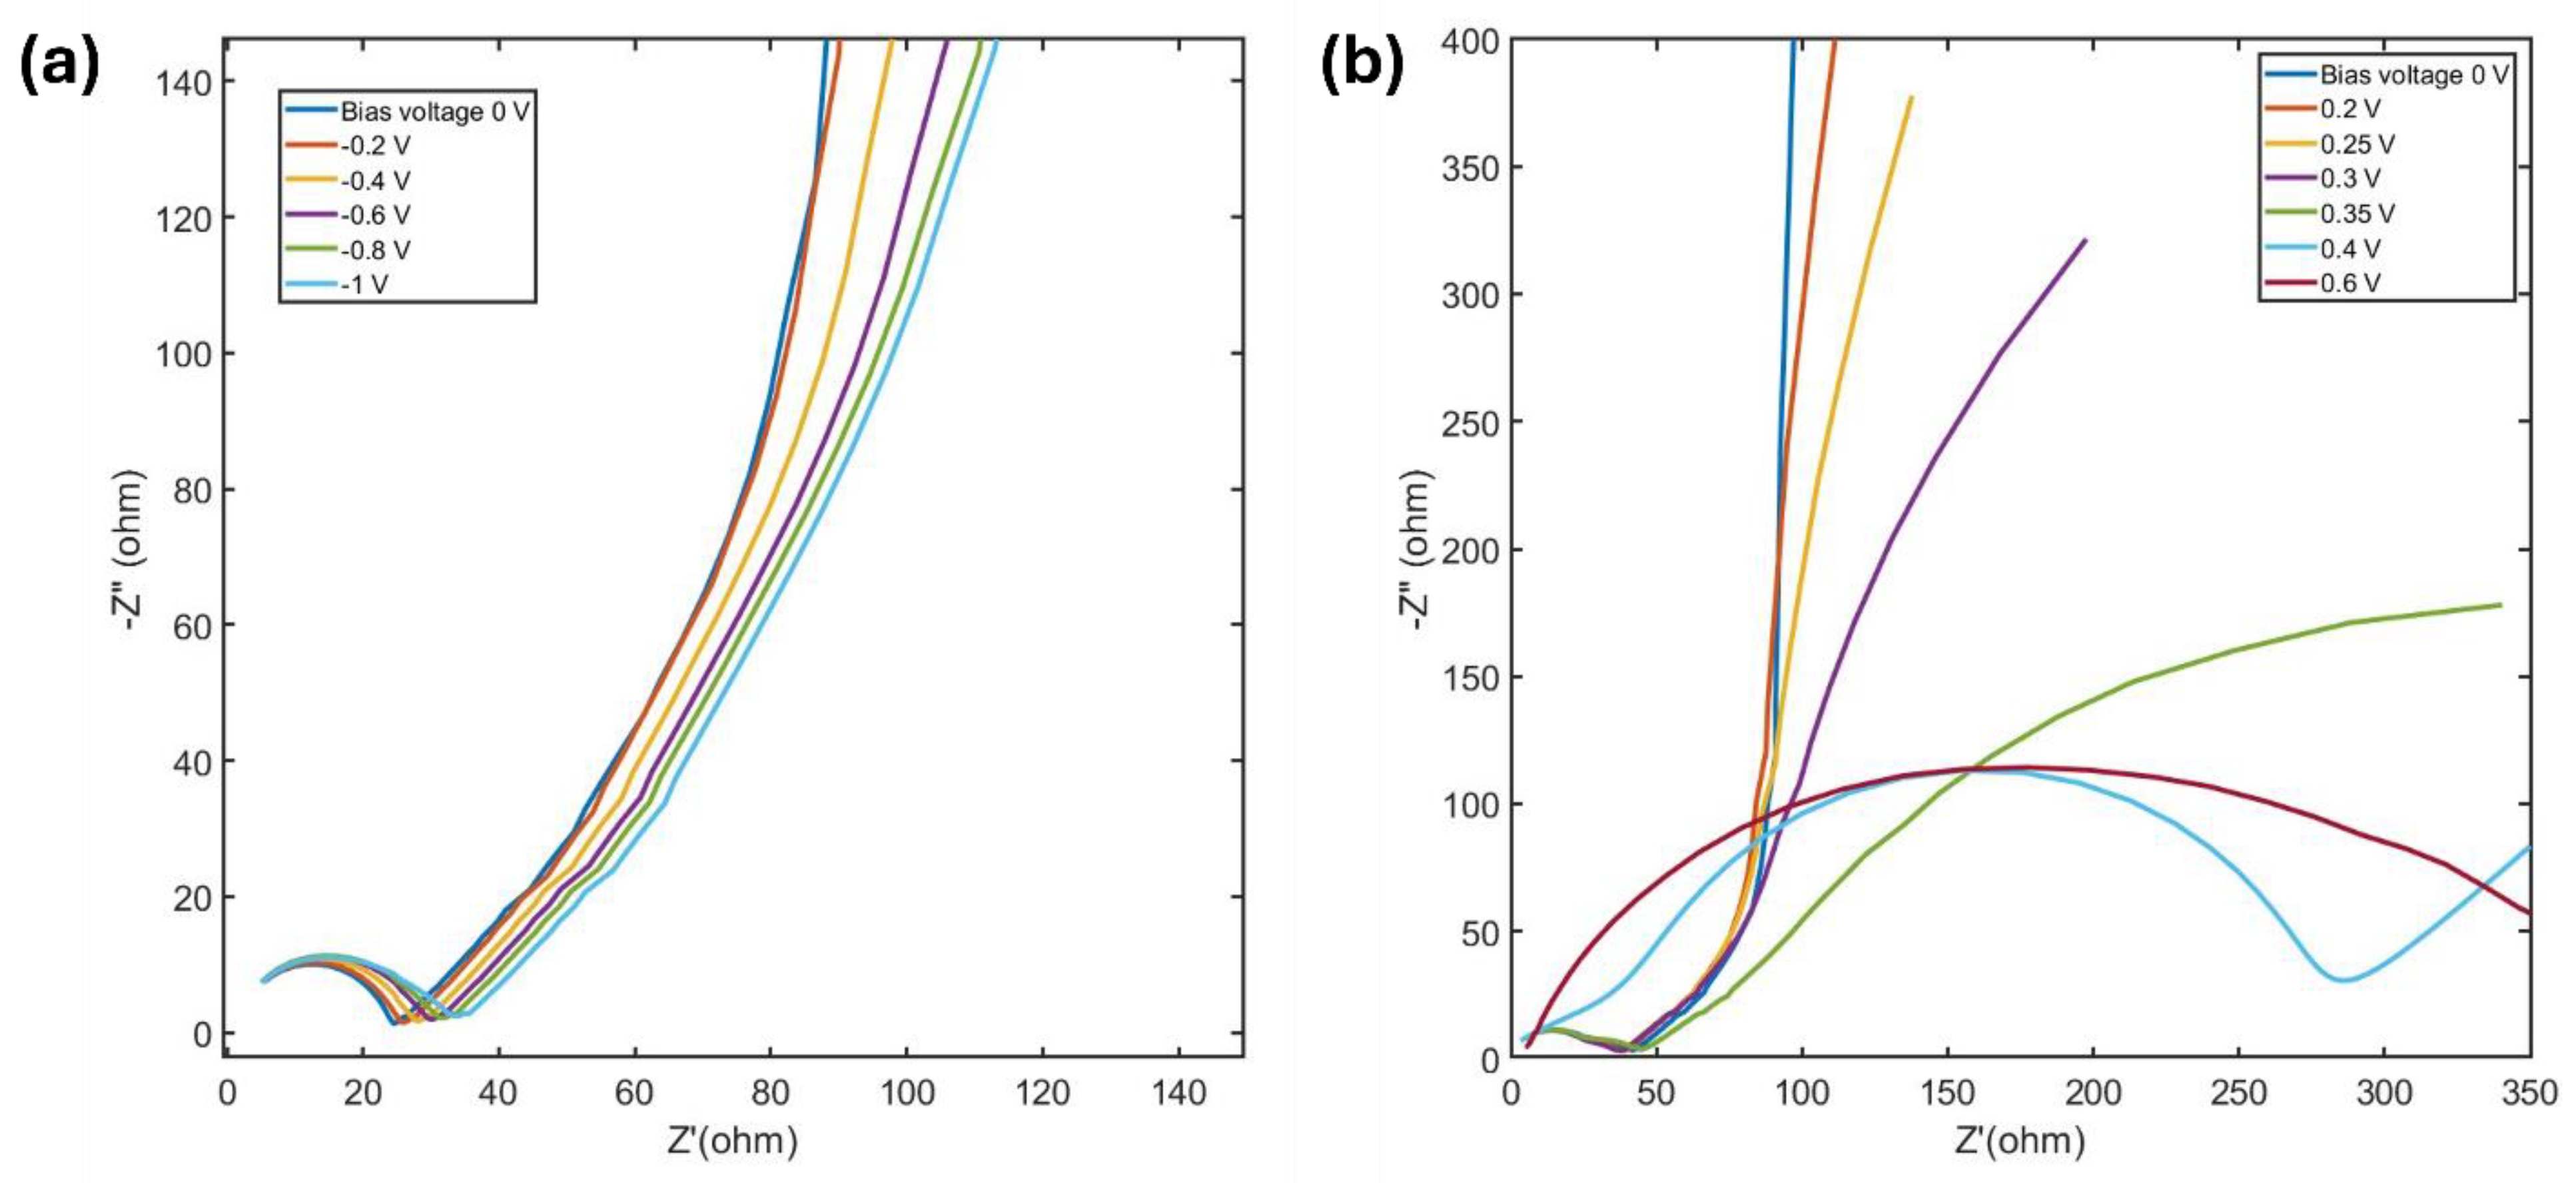
Figure 9.
(a) CV curves of MXene at 100 mV/s over different cycle intervals, (b) Nyquist plots at various cycles, (c) Variation of charge transfer resistance (Rct) and diffusion resistance (Rd) with cycling, and (d) Correlation between the reduction in capacitance and the increase in Diffusion layer resistance (Rd) during cycling.
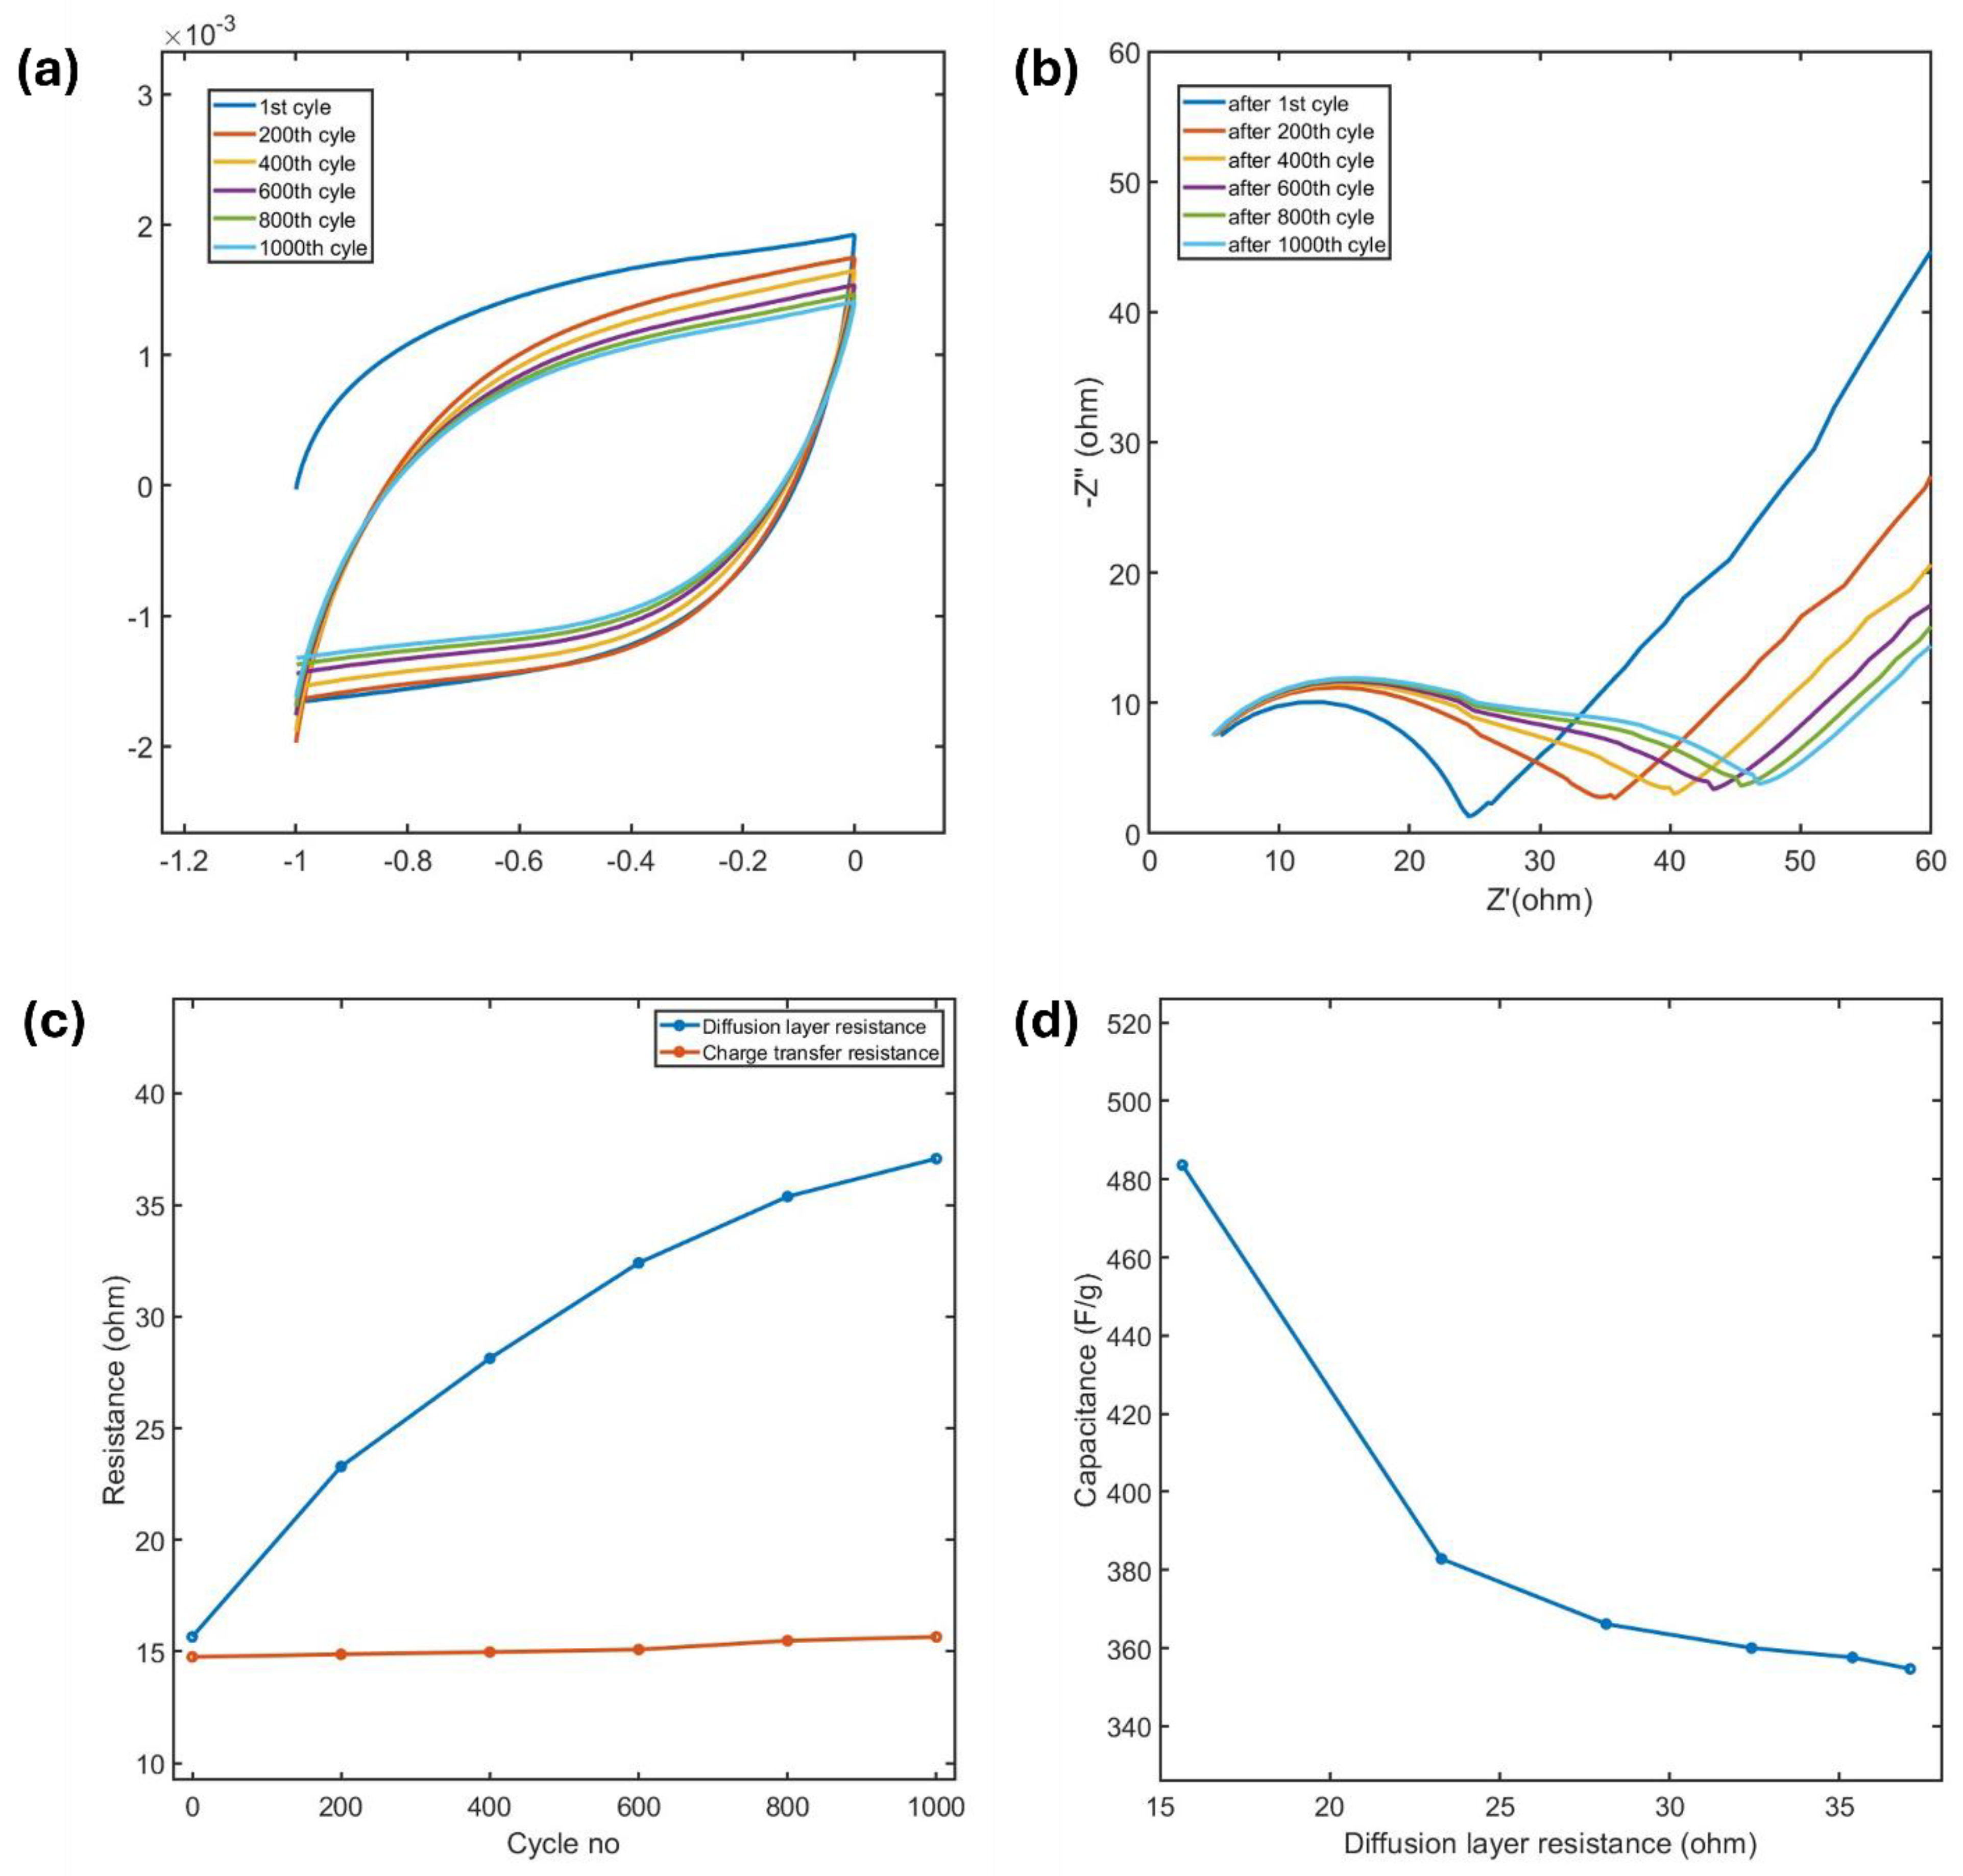
Figure 10.
(a) CV plots of MXene at different scan rates (b) linear fitting of log(i) vs log(v) to calculate b value (c) variation of b values at different cathodic potential in both charging and discharging condition.
Figure 10.
(a) CV plots of MXene at different scan rates (b) linear fitting of log(i) vs log(v) to calculate b value (c) variation of b values at different cathodic potential in both charging and discharging condition.
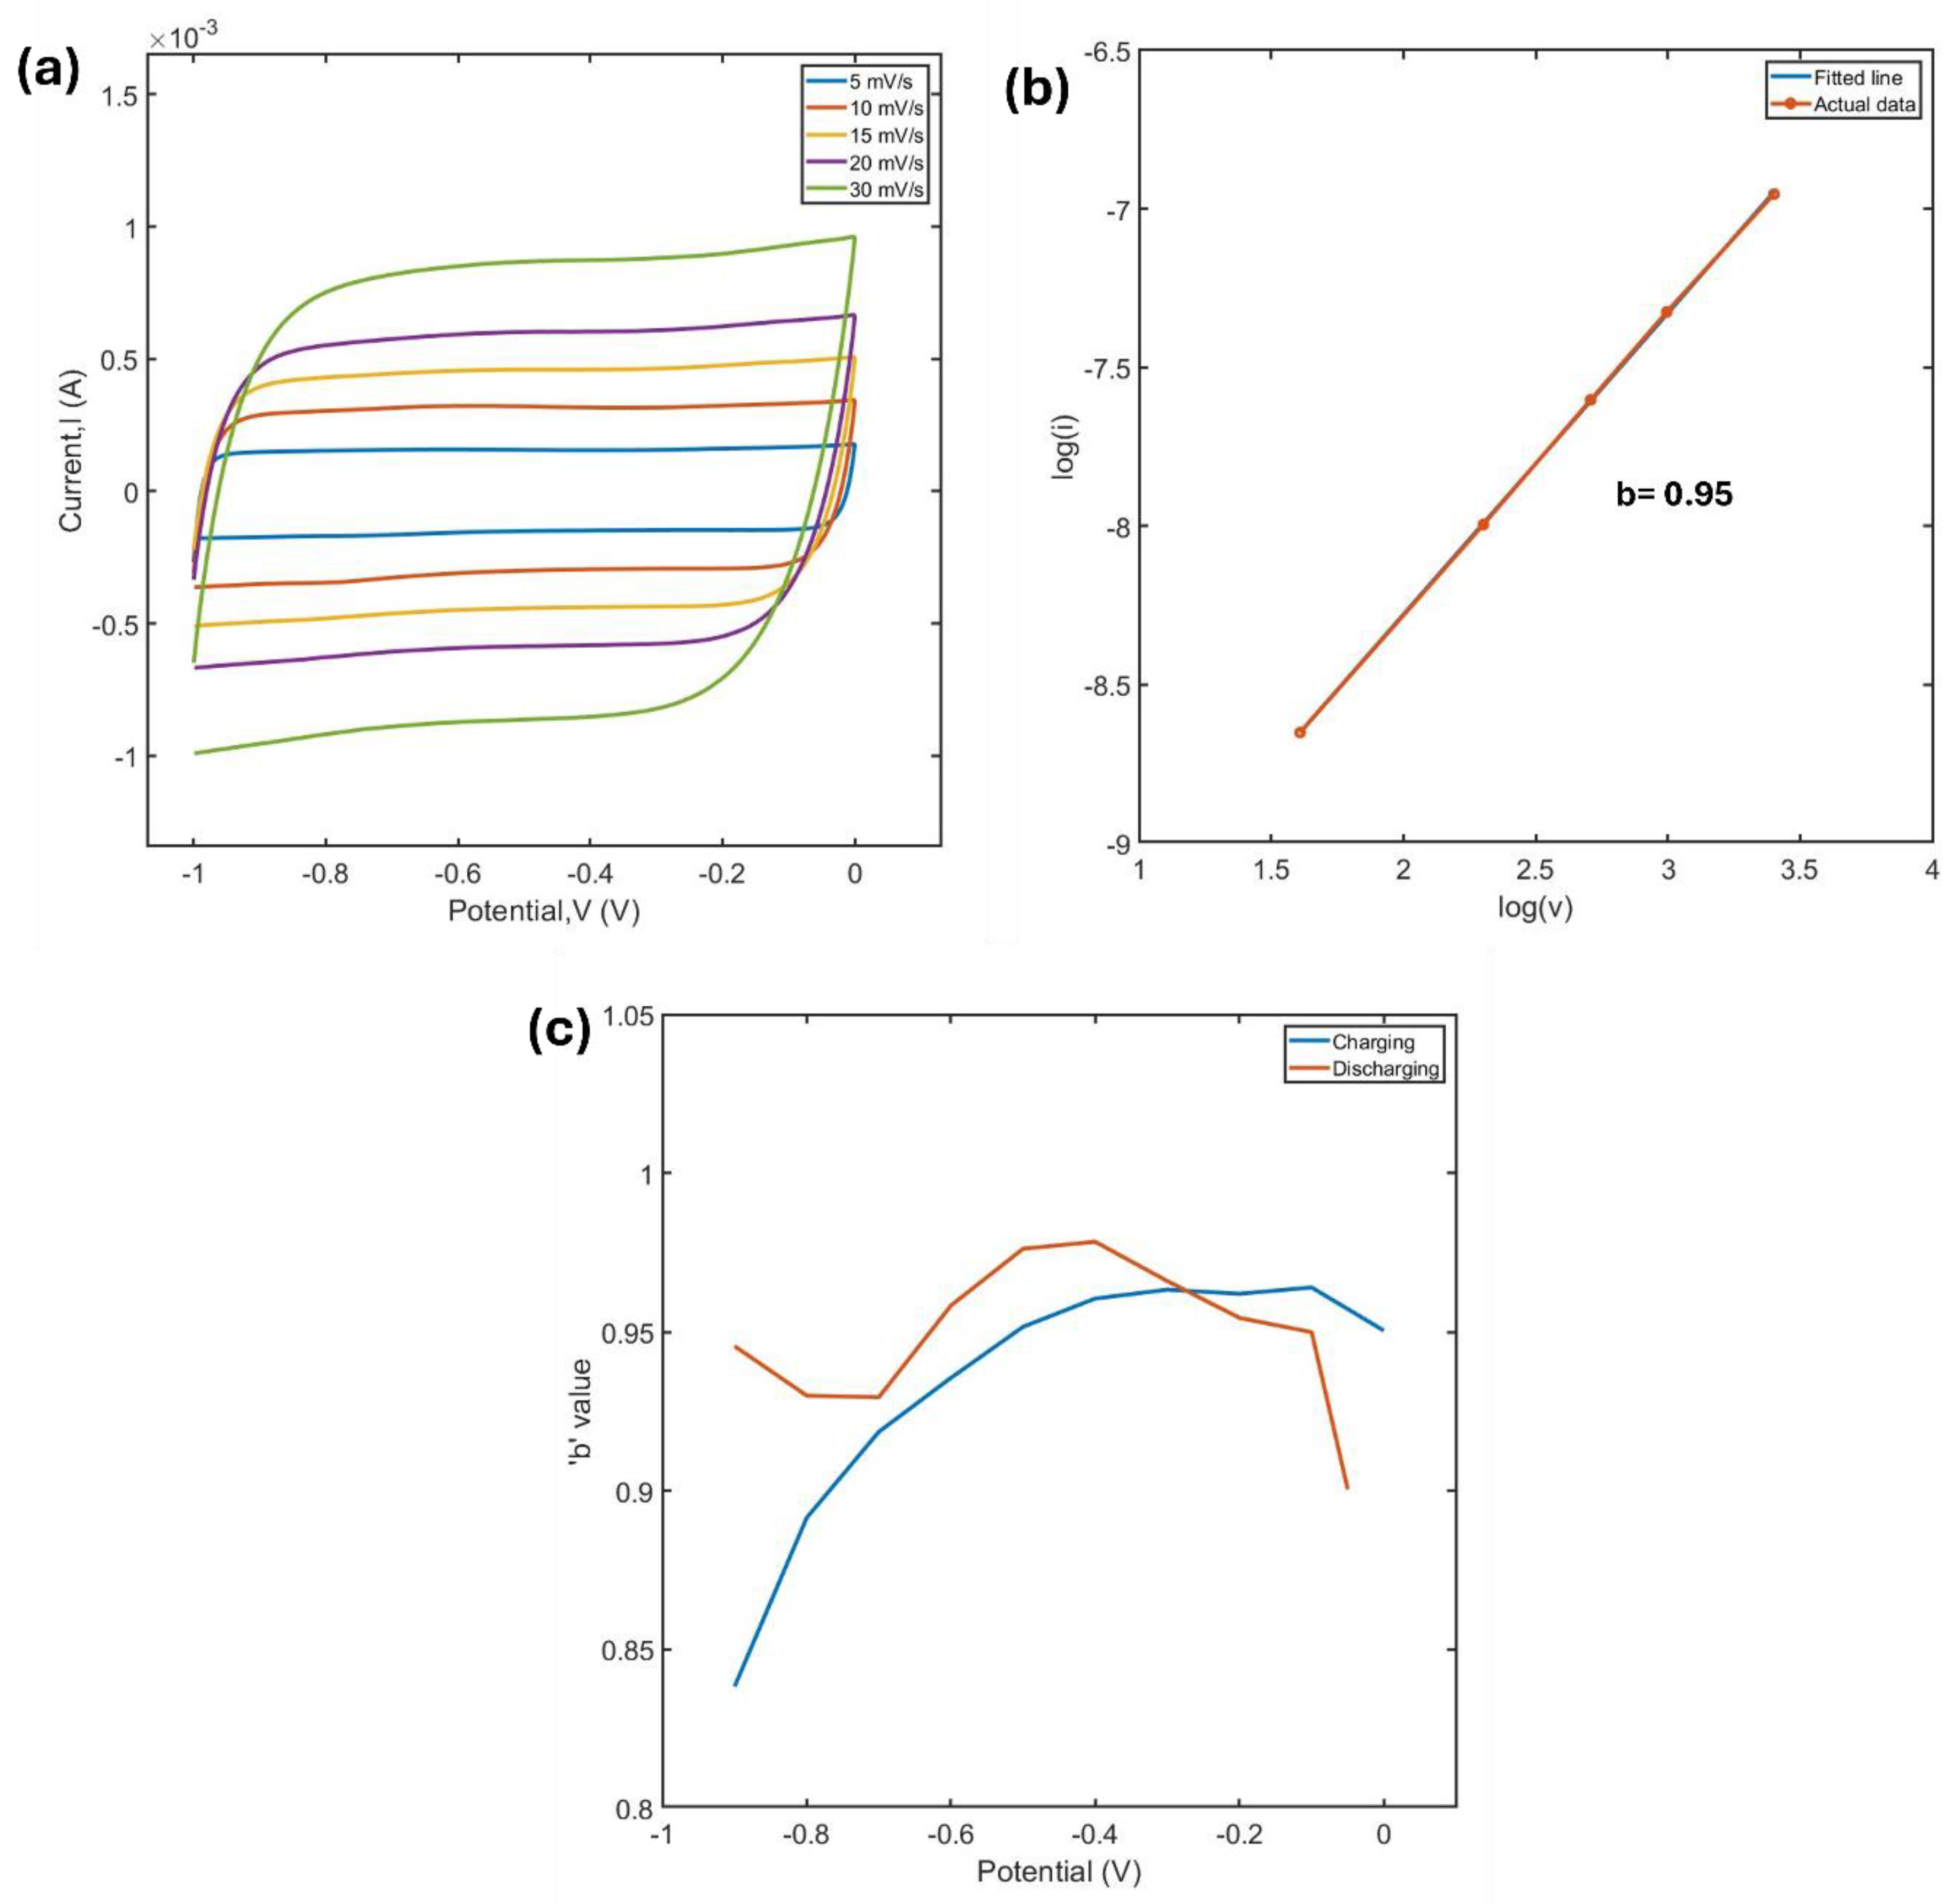

Table 1.
Values of the resistances (Rs, Rct, and Rd) and CPE values obtained from the EC model.
| Voltage (V) | ) | ) | ) |
|---|---|---|---|
| -1 | .001 | 32.41 | 14.93 |
| -0.8 | .001 | 31.65 | 14.94 |
| -0.6 | .001 | 30.3 | 14.95 |
| -0.4 | .001 | 29.8 | 14.99 |
| -0.2 | .001 | 28.13 | 15.01 |
| 0.0 | .001 | 27.2 | 15.0 |
| 0.2 | .001 | 26.26 | 15.03 |
| 0.25 | .001 | 24.44 | 15.23 |
| 0.3 | .001 | 23.96 | 15.96 |
| 0.35 | .001 | 31.38 | 19.51 |
| 0.4 | .001 | 72.86 | 233.3 |
| 0.6 | .001 | 558 | 1570 |
Disclaimer/Publisher’s Note: The statements, opinions and data contained in all publications are solely those of the individual author(s) and contributor(s) and not of MDPI and/or the editor(s). MDPI and/or the editor(s) disclaim responsibility for any injury to people or property resulting from any ideas, methods, instructions or products referred to in the content. |
© 2025 by the authors. Licensee MDPI, Basel, Switzerland. This article is an open access article distributed under the terms and conditions of the Creative Commons Attribution (CC BY) license (http://creativecommons.org/licenses/by/4.0/).
Copyright: This open access article is published under a Creative Commons CC BY 4.0 license, which permit the free download, distribution, and reuse, provided that the author and preprint are cited in any reuse.


