Submitted:
26 February 2025
Posted:
27 February 2025
You are already at the latest version
Abstract
Titanium oxide (TiO2) is of great interest for the manufacture of solar cells, hydrogen production and for the photodegradation of organic compounds. The synthesis variables, as well as the type of method, affect the morphology, texture, crystalline structure, phase mixtures of TiO2, and in turn, these affect the optical and catalytic properties of TiO2. In this work, the role of acetic acid as a catalyst and chelating agent on morphology, texture, crystal structure, optical properties, and photocatalytic activiy of TiO2 samples obtained by sol gel method assisted with sodium dodecyl sulfate as template was investigated. The results obtained indicated that acetic acid, in addition to catalyzing the hydrolysis of the TiO2 precursor, acts as a chelating agent causing the decrease of the crystallite size from 18.643 nm (T6 sample, pH=6.8, without addition of acetic acid) to 16.536 nm (T2 sample, pH=2). At pH values of 2 and 3, only the anatase phase is formed (T2 and T3 samples), whereas at pH values 5 and 6.8, in addition to the anatase phase, 11.4% and 15.61% of the brookite phase is formed (T5 and T6 samples, respectively). The band gap of TiO2 decreased with the decrease of the pH used in its synthesis. Although T2 sample has the highest values of specific surface area and pore volume (232.02 m2g-1 and 0.46 gcm-3, respectively), sample T3 had better efficiency in methylene blue dye photodegradation.
Keywords:
anatase
; acetic acid
; brookite
; catalyst
; chelating agent
; morphology
; photocatalysis
; sol-gel
; TiO2
1. Introduction
Semiconductor materials are currently an important part of human activities and have allowed the development of telecommunications and transport; In addition to this, their properties are so versatile that they can also be used in energy and environment. Within this field, TiO2 (titanium oxide) has acquired great interest in the manufacture of solar cells [1,2], in hydrogen production [3,4] and in the degradation of toxic organic compounds [5], within other applications. What makes TiO2 popular in these types of applications is its ability to absorb photons and generate electron-hole pairs and act as a catalyst in oxide-reduction reactions [6] and function as a load conveyor material [7]. This material has three main polymorphs (anatase, rutile and brookite), among which anatase stands out because it is obtained at a lower temperature than the other polymorphs, in addition to having a higher degree of hydroxylation on its surface and can generate mobile hydroxyl radicals on it [6,8].
It should be noted that, although TiO2 has been extensively studied previously, it is important to take special care in the selection of the synthesis method, since the characteristics and properties of this semiconductor will depend on it, affecting its efficiency in the process in which it is used. For example, it has been shown that the morphology of TiO2 can be linked to its efficiency in degrading organic compounds by photocatalysis [9]. The sun-gel method is the most popular for its synthesis because it allows the obtaining of this oxide at low temperatures, but the variables to be controlled can make the process somewhat complex. In some works, the use of surfactants in sun-gel synthesis has been reported to control the characteristics and properties such as morphology and texture of TiO2, obtaining porous materials with the use of cationic surfactants such as cetyltrimethylammonium bromide (CTAB [10]. Nagamine et al. mention that the use of anionic surfactants such as dodecyl sodium sulfate (SDS) and using hydrochloric acid (HCl) as a catalyst for ITTP hydrolysis favor the formation of TiO2 with Titania phase [11]. Estrada-Flores et al. investigated the relationship between morphology, porosity, and the photocatalytic activity of TiO2 obtained by sol–gel method assisted with ionic and nonionic surfactants; in their synthesis procedure they used acetic acid as a catalyst at pH 3. The crystalline phase obtained was anata, regardless of whether an ionic surfactant (CTAB and SDS) or a nonionic one (polyethylene glycol, PEG) was used, however, the morphology, texture and band-gap of the TiO2 samples were very different, resulting in different degrees of photocatalytic activity [12]. Therefore, it is important to consider, in addition to the type of surfactant used as a template in obtaining TiO2 particles, the type of acid catalyst to be used and its concentration for pH adjustments.
Yuenyongsuwan et al investigated the influence of the type of surfactant on the control of TiO2 synthesis with a given phase; pH, temperature, and method (microemulsion and surfactant-assisted hydrothermal methods) were varied. They used the ionic surfactants SDS and CTAB, and as nonionic surfactants they used TritonX-100; in the microemulsion synthesis method they used sodium hydroxide (NaOH) as catalysts to adjust the pH to 10 and HCl to adjust the pH to 2. On the other hand, when they used the hydrothermal synthesis method, they did not use a catalyst to adjust the pH (the pH value is not reported). The results indicated that the stability, size, and shape of the surfactant micelles were the main factors that determined the phase formed of TiO2. With the micro-emulsion method at pH 2 and 30 C, the Rutile and Anatase phases were formed with the surfactants CTAB and TritonX, whereas only the Anatase phase was formed with the use of the SDS surfactant. An increase in temperature to 90 C led to the formation of pure phases, with the surfactants CTAB and TritonX the Rutile phase was obtained and with the SDS surfactant the Anatase phase. Contrastingly, with the use of the hydrothermal method, only the Anatase phase was formed, regardless of the type of surfactant. The photocatalytic activity of the various samples depended on the phase mixture, the specific surface area and the morphology [13]. This is of relevance because mixtures of crystalline phases in a material can be beneficial for some of its applications, such as in heterogeneous photocatalysis [10,14]. Therefore, it is obvious that the parameters used during the synthesis of TiO2 affect the morphology, texture, crystalline phases formed, optical and photocatalytic properties of TiO2.
For this reason, the present work aims to study the effect of pH, in the acid range between 6.8 and 2, on the morphology, texture, crystal structure and optical properties of TiO2 obtained by sol gel, using acetic acid as a catalyst agent of the IPTT hydrolysis reaction and using the anionic surfactant SDS as a template.
2. Materials and Methods
2.1. Reagents
Titanium isopropoxide (TTIP, 97% Sigma – Aldrich), sodium dodecyl sulfate (SDS, 99% Sigma – Aldrich), glacial acetic acid (99.95% purity, CTR Scientific, Mexico), anhydrous ethanol (CTR Scientific, Mexico), deionized water and methylene blue (MB, Sigma-Aldrich).
2.2. Synthesis of TiO2
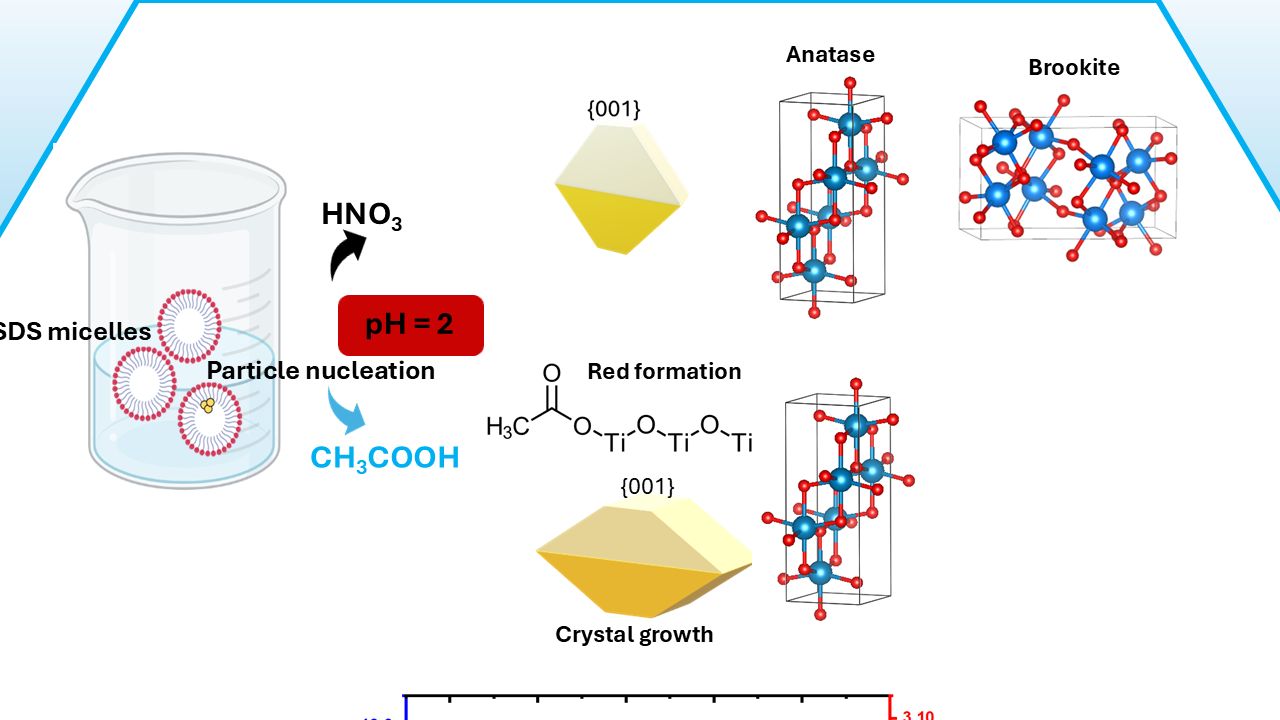
The sol-gel method was used to synthesize the different TiO2 samples from a solution of ethanol and water (1:1, v/v), the pH value of this solution was measured and was 6.8. The SDS surfactant was then added in sufficient quantity to obtain a concentration greater than its CMC and left to stir for 20 minutes. Subsequently, the TTIP was slowly added to the previous solution and left in constant agitation for 24 hours at a temperature of 25 ºC. At the end of this time, the temperature was raised to 60 ºC and the agitation continued for another 24 hours. Finally, the sample was collected by centrifugation and the recovered solid product was washed three times with a solution of ethanol and water (1:1, v/v), separating the solid from the liquid again by centrifugation. Subsequently, the white product obtained was dried in a vacuum oven for 24 hours. After drying, the sample was placed in an alumina crucible and heat-treated at 450 ºC for 4 hours. The product obtained was called T6 sample.
To evaluate the effect of using acetic acid as a catalyst and complexing agent on the morphology, structure and optical properties of TiO2 and subsequently to investigate the effect of these changes on its photocatalytic activity, the previous procedure was repeated, but this time adding different amounts of glacial acetic acid to adjust the pH value to 5, 3 and 2 (T5, T3 and T2 samples). Another TiO2 synthesis experiment was also performed using a concentrated solution of nitric acid (HNO3) as catalyst, adjusting the pH of the ethanol: water solution to a value of 2, this sample was named THNO3.
2.3. Characterization
The TiO2 samples were characterized by infrared spectroscopy using a Thermo Scientific Nicolet iS10 equipment with the attenuated total reflectance (ATR) accessory. To determine the crystal structure of the samples, an X-ray diffractometer, Rigaku Ultima IV (Cu kα, D/teX detector, angular pitch 0.02º and velocity of 2º/min) with Bragg-Brentano geometry was used. The morphology of the samples was studied with a JEOL JSM-7800F scanning electron microscope. Likewise, the absorbance and diffuse reflectance spectra were obtained using a Perkin Elmer spectrometer model Lambda 35, equipped with an integration sphere. The surface area of the TiO2 samples was determined by the BET technique (Brunauer-Emmett-Teller) and the pore size distribution was calculated from the desorption isotherm of the samples using the BJH (Barrett-Joyner-Halenda) theory.
2.4. Rietveld Refinement
The crystal structures of the TiO2 samples were refined using the Rietveld method using the FullProf software. The spatial group I41/amd was used for the anatase and the lattice parameters previously obtained by the Le Bail adjustment of the diffractograms with the FullProf software.
2.5. Photocatalytic activity
Photocatalytic activity of each of the synthesized TiO2 samples were studied using methylene blue as a model dye; 50 ml of a solution of 20 ppm MB were added in Erlenmeyer flasks, concentration of the photocatalysts was 1 g/L in each flask. The different systems were placed in an incubator at 25 °C in the dark for 30 minutes to ensure the adsorption of the dye on the photocatalysts, thence, they were placed under solar irradiation and the concentration of methylene blue in solution was monitored by UV-Vis spectroscopy (Jenway 7315 equipment) for 90 minutes. The average solar irradiance on October 28, 29, and 30, 2024 in Saltillo, Coahuila, Mexico was 435.39 W/m2.
3. Results and discussion
3.1. Role of acetic acid in the structure and morphology of TiO2
Figure 1 shows the infrared spectra of the T6 samples, S5, S3 and S2. The characteristic band of the Ti-O link is observed around 800 cm-1. The spectra also present a series of bands that indicate the presence of OH groups in the TiO2 samples [15,16]. In all spectra two small bands are observed at 3725 and 3696 cm-1 (see the spectra of the four samples in the figure inserted on the left), both bands correspond to the νO-H stretches of hydroxyl groups. The band in 3725 cm-1 corresponds to free Ti-OH groups and the band in 3696 is due to the presence of OH groups joined by hydrogen bonds, as they are in adjacent unit cells. Free OH groups commonly occur in the planes of higher electron density of the anatase, in this case (101) and are characteristic when there are oxygen vacancies on the surface of the material [17]. The bandwidth observed in the region from 3600 to 3000 cm-1 corresponds to the superposition of the symmetrical and asymmetrical vibration bands of the hydroxyl groups of coordinated water to Ti4+ centers [18]. Likewise, the band in 1640 cm-1 corroborates the presence of the hydroxyl group on the surface of TiO2 [15,16,19]. The presence of this group on the surface of the TiO2 samples can be of great help in the photocatalysis process because they act as hole (+) capture centers, preventing exciton recombination and producing hydroxyl radicals that act as strong oxidants [20].
In the spectrum of the T2 sample, which was synthesized with a greater amount of acetic acid to adjust the pH to 2 during the hydrolysis and consolidation reactions, it has two bands at 1449 and 1381 cm-1 which correspond to the acetate groups attached to the Ti centers (see the spectra of the four samples in the figure inserted on the right).
Figure 2A shows the diffractograms for the TiO2 samples synthesized at different pH values. The main crystalline phase in all samples is anatase (PDF #21-1272). In the diffractograms of the T2 and S3 samples a small peak is observed at 31º indicating the presence of the brookite crystalline phase (PDF #29-1360).
The average crystallite sizes of the TiO2 anatase in the samples were calculated using the Debye-Scherrer, Equation (1):
where D is the size of crystallite, K is a dimensionless shape factor (0.89), λ is the wavelength of Cu Kα radiation having a value of 1.5406 Å, β is the broadening of the peak of higher intensity (101) of anatase, and θ is the angle of X-ray diffraction. The results obtained were 16.536 nm and 18.288 nm, for the T2 and T3 samples, respectively; in this case, the size of crystallite increases as the pH of the synthesis increases, while from pH of 5 to 6.8 a slight decrease in the size of crystallite is observed (18.979 and 18.643 nm). An amplification was performed at the peak of the highest intensity of anatase (101) (Figure 2B), which allowed to observe that, as the amount of acetic acid used to adjust the pH value increases, a lower crystallinity took place. Although there is an aqueous environment that favors the rapid hydrolysis of the IPTT precursor, it is possible that the acetate groups can form chelation with the Ti centers, so that the hydrolysis of the alkoxide is slower and more controlled [21]. During the sol-gel synthesis process, the acetate groups of acetic acid react with titanium isopropoxide to stop or slow down the hydrolysis rate of the alkoxide, slowing condensation and coalescence and consequently crystal growth, this also because chelates such as the acetate group have thermal stability up to 300 °C, which enhances the formation of small crystal sizes and small particles [22].
D= Kλ/βcos θ
It has been previously reported that small crystallite sizes help decrease the energy gap of the material [23], so the synthesis of anatase at acidic pH values could be beneficial in the decrease of crystallite size and therefore in the decrease of the energy gap value of TiO2. On the other hand, the crystallite sizes of all TiO2 samples (anatase phase) synthesized here are smaller than that of commercial titanium oxide P25, which has a size of 25 nm according to what was reported in the work of Marinho et al. [24].
In the amplification of the diffractogram it can also be observed that in the sample in which acetic acid was not used (sample T6, pH = 6.8) the peak corresponding to the crystallographic plane (101) is shifted towards lower degrees, indicating the expansion of the single cell of the anatase, which may be due to the fact that the speed of crystal formation is faster than when acetic acid is used, which has the role of catalyzing the hydrolysis reaction, in addition to forming complexes with the titanium species in the solution.
The expansion of the anatase single cell was verified by performing structural refinement using the Rietveld method. The lattice parameters a, b, and c of the anatase are presented in Table 1; the results indicate that the lattice parameter a increases slightly as pH increases. The cell volumes are very similar for samples that were synthesized using acetic acid, however, the T6 sample synthesized without addition of catalyst has a higher volume. Likewise, the percentage of brookite present in TiO2 samples was determined, which increases as pH increases. Figure 3 shows the adjustments of X-ray diffraction patterns of the anatase samples.
Figure 4 shows the role of the pH in the synthesis medium on the formation of the brookite phase in the TiO2 samples, the amount of this phase increases with the increase in pH. At pH values of 2 and 3, only the anatase phase is formed (T2 and T3 samples), whereas at pH values 5 and 6.8 the T5 and T6 samples contain 11.4% and 15.61%, of the brookite phase, respectively.
Figure 5 shows the anatase single cell, constructed with VESTA software [25], using data obtained from the Rietveld refinement of X-ray diffraction patterns of the TiO2 samples. The anatase in all samples presents a tetragonal structure centered on the body, spatial group I41/amd.
To investigate the effect of using two different acid catalysts, the T2 sample was compared with the sample synthesized using HNO3 as the catalyst. The infrared spectra of both samples are similar (Figure 6A), except that the infrared spectrum of the T HNO3 sample it does not have those bands in 1449 and 1381 cm-1, characteristic of the C-O stretch of the acetate group, as expected. Figure 6B compares the diffractograms of the T2 sample and the THNO3 sample. Regarding the crystalline phases present, it is observed that both samples mainly contain the anatase phase, however, in the sample in which HNO3 is used as an acid catalyst, the formation of brookite is promoted, which does not occur when synthesizing TiO2 with acetic acid at the same pH value. Similar results were reported by Leyva-Porras et al., since they obtained a mixture of anatase and brookite when using HNO3 and pure anatase when using acetic acid [26] as catalysts. On the other hand, Khalil et al. reported the formation of only the anatase phase when using acetic acid and a mixture of anatase and rutile when nitric acid was used in TiO2 synthesis [22]. It has been proposed that the formation of brookite at low pH values is due to the fact that nitrate ions are less complex than the acetate ion from the dissociation of acetic acid, promoting the formation of this phase [14]. The crystallite sizes obtained were 16.536 and 19.13 nm for the T2 and THNO3 samples, respectively.
Figure 7 shows the micrographs of the TiO2 samples taken at 100,000X magnification. The morphology of the samples is porous agglomerates formed by small particles. In some of the samples, these agglomerates produce the formation of pores, as seen in the case of the T2 and T5 samples (Figure 7A and Figure 7D), which could help to increase the surface area. In the T3 sample (Figure 7B) high porosity occurs due to the fact that the spherical agglomerates are made up of very small particles, with an average size of 15.65 nm. These spheres have an average diameter size of 738.10 nm (Figure 7C). The T6 sample has small pores formed by the agglomeration of small particles and large pores formed between the agglomerates (Figure 7E). The porous morphology of the samples can help to increase the specific surface area, which is directly related to the adsorption capacity and the efficiency of some processes such as photocatalysis [12,27]. Likewise, the presence of interconnected pores can increase light scattering and promote energy absorption in the visible region of the electromagnetic spectrum.
Figure 8 shows the morphology of the T2 sample more clearly, in the image it is observed that there is a presence of crystals with the shape of a flattened octahedral bipyramid. It has been reported that under equilibrium conditions it is more common for thermodynamically stable faces such as {101} to grow larger, but when a capping agent such as acetic acid is used, high-energy faces such as {001} can stabilize and therefore grow larger, this form is present in the T2 sample, in which a greater amount of acetic acid was used to adjust the pH to 2 during synthesis [28]. Because of the above, it is possible that this sample is more reactive because the faces {001} have a greater number of active sites to react with the environment that surrounds them [29].
It has been reported that the use of acidic pH conditions during SDS anionic surfactant-assisted synthesis enhances the formation of stable micelles due to the protonation of the negative group of SDS, thus preventing large particles formation [13].
3.2. Role of acetic acid in the texture and optical properties of TiO2
The porosity observed in the micrographs presented in Figure 7 is characteristic of samples with a high specific surface area; to verify the above, the specific surface area analysis of the TiO2 samples was carried out using the N2 adsorption technique. The adsorption-desorption isotherms obtained are presented in Figure 9. The T3, T5 and T6 samples present a combination of type II and IV isotherms, with a combined hysteresis loop types H1 and H3, indicating the presence of macropores and mesopores. On the other hand, the T2 sample presents an isotherm of type IV, which is characteristic of mesoporous materials, and a hysteresis loop of type H2, this sample is the one with the largest specific surface area, as shown in Table 2. It can be said that all samples have a specific surface area value higher than that of TiO2 P25, which is between 50 and 58.2 m2g-1 [24,30-31]. The distribution and value of the average pore diameter was determined by the BJH theory (Barret – Joyner – Halenda) using the desorption isotherm data of each of the samples, the results are also presented in Table 2 and the distribution of pore size is presented in the figure inserted in Figure 9. The pores in the T2 sample have an average size of 3.18 nm, while the pores in the T6 sample have a size of 10.52 nm. The use of acetic acid as a catalyst favored the formation of mesopores with smaller size, and consequently a higher pore volume in the T2 sample (0.46 gcm-3), which is more than twice as high as the T6 sample (0.20 gcm-3).
Figure 10A shows the absorption spectra of the samples. It can be seen samples absorb light with great intensity in the UV region, mainly, The T2 sample absorbs a large amount of light in the visible region of the electromagnetic spectrum, while the other samples also absorb light in this region, but with less intensity, presenting the following order: T2 > T3 > T5, T6. To determine the value of the forbidden energy gap or band-gap (Eg) of the samples, the Tauc graph was used, taking into account n = 2 for allowed indirect transitions [32], the results are presented in Figure 10B. The values obtained were 3.05, 3.09, 2.95 and 2.77 eV, for T6, T5, T3 and T2 samples, respectively. The samples with the lowest Eg values are those synthesized at a pH of 2 and 3 (T2 and T3, respectively), this may be due to their morphology, the pure phase of anatase and mainly to their lower crystallite size value.
It has been reported that crystallite size can influence the value of the band-gap, the value of the band-gap decreases with the decrease of crystallite size and vice versa. This synergistic effect can be seen in Figure 11, which plots the effect of the pH used during synthesis on the crystallite size and band-gap value of the TiO2 samples obtained at pH 2, 3, 5 and 6.8 (T2, T3, T5 and T6 samples, respectively), increasing the pH increases the crystallite size, with the exception of the T6 sample in which no catalyst was used to adjust the pH. Qin et al., reported the P25 band-gap, which was 3.05 eV [33]. The Eg values of all the samples synthesized in this work were lower than that of this commercial titanium oxide. The T2 and T3 samples can be activated with visible light to achieve exciton formation and thus promote oxide-reduction reactions, so they could be useful in processes such as the degradation of organic compounds, reduction of heavy metals or the production of hydrogen (H2) among others.
3.3. Role of acetic acid in the photocatalytic activity of TiO2
To test the photocatalytic capacity of the samples, methylene blue photodegradation was performed using natural sunlight. Figure 12A presents the methylene blue removal kinetics. It can be seen the greatest removal is achieved by using the T3 sample. It should be noted that the T2 sample has a greater specific surface area than the T3 sample, however, its band-gap value decreases so much that it is possible to recombine the electron-hole pairs when photons are made to impinge on it, which prevents the photocatalysis process from continuing.
The second-order kinetic model (Equations (2)) was used to investigate the kinetics of MB photodegradation:
were C0 and Ct (mol/L) are the MB concentrations at times 0 and t (min), respectively; K2 (mg−1· L· min−1) is the second-order rate constant. The variation in 1/Ct as a function of irradiation time is shown in Figure 12B for second-order model, by which the rate constant (K2) was calculated and listed in Table 3. The values of the velocity constants are presented in Figure 12C as a function of the type of TiO2 sample. The T3 sample is the one with the highest removal velocity constant, with a value of 7.0x10⁻⁴ Lmin-1mg-1.
1/C t = K 2𝑡 + 1/C0
It is important to highlight that the band-gap values that all the TiO2 samples synthesized herein have are adequate for these photocatalysts to be activated with natural sunlight, compared to commercial TiO2 that needs ultraviolet light to be activated due to its band gap value greater than 3.00 eV.
4. Conclusions
The use of acetic acid as an acid catalyst and as a chelating agent during the synthesis of TiO2 by sol-gel assisted with the anionic surfactant SDS, allows to obtain greater control over the hydrolysis of IPTT. In the sample synthesized with a higher amount of acetic acid (T2 sample, pH=2) it was possible to identify the formation of complexes by the FTIR-ATR technique, these complexes facilitate the formation of crystals with the {001} faces exposed, which are of high energy and can facilitate oxide-reduction reactions for applications such as photocatalysis. The diffractograms of the T2 and T3 samples indicate that a higher amount of acetic acid used to adjust the pH to 3 and 2 promotes the formation of pure anatase and as the pH increases brookite is also obtained (T5 and T6 samples). The crystallite size of TiO2 decreases with decreasing pH, resulting in a reduction of the band- gap value. The T2 sample synthesized with a higher amount of acetic acid (pH=2) presented the best morphological and textural properties, with an SBET value of 232m2g-1, and optical properties with a band-gap value of 2.77 eV, however, the T3 sample (pH= 3) showed to have a better photocatalytic activity against the photodegradation of methylene blue under solar irradiation, with a velocity constant of 7x10⁻⁴ Lmin-1mg-1, which may be due to the fact that the photogenerated electron-hole pairs may recombine in the T2 sample (5x10⁻⁴ Lmin-1mg-1), reducing the generation of free radicals. The T6 sample (pH = 6.8) is the one with the lowest photocatalytic activity, with a rate constant of 3x10⁻⁴ Lmin-1mg-1.
Author Contributions
Conceptualization, Antonia Martínez-Luévanos; Data curation, Aurora Robledo-Cabrera; Formal analysis, Sofía Estrada-Flores, Tirso E. Flores-Guia and Luis A. García-Cerda; Investigation, Antonia Martínez-Luévanos; Methodology, Sofía Estrada-Flores; Project administration, Antonia Martínez-Luévanos; Resources, Tirso E. Flores-Guia, Luis A. García-Cerda, Aurora Robledo-Cabrera and Antonia Martínez-Luévanos; Supervision, Antonia Martínez-Luévanos; Validation, Catalina M. Pérez-Berumen; Visualization, Catalina M. Pérez-Berumen and Elsa N. Aguilera-González; Writing – original draft, Sofía Estrada-Flores; Writing – review & editing, Antonia Martínez-Luévanos.
Funding
This research received no external funding.
Data Availability Statement
The data presented in this study are available upon request from the corresponding author.
Acknowledgments
Antonia Martinez-Luevanos thanks Universidad Autonoma de Coahuila in Mexico for the financial support for this research.
Conflicts of Interest
The authors declare no conflicts of interest.
References
- Nam, S.H.; Boo, J.H. Fabrication of moth-eye patterned TiO2 active layers for high energy efficiency and current density of dye-sensitized solar cells. Energy Reports, 2022, 8, 98–105. [Google Scholar] [CrossRef]
- Liu, Y.; Chen, J.; Tian, Z.; Yao, J. Dye-Sensitized Solar Cell Based on TiO2 Anode Thin Film with Three-Dimensional Web-like Structure. Materials (Basel), 2022, 15, 5875. [Google Scholar] [CrossRef] [PubMed]
- Hejazi, S.; Killian, M.S.; Mazare, A.; Mohajernia, S. Single-Atom-Based Catalysts for Photocatalytic Water Splitting. Catalyst, 2022, 12, 905. [Google Scholar] [CrossRef]
- Soundarya, T.L.; Jayalakshmi, T.; Alsaiari, M.A.; Jalalah, M.; Abate, A.; Alharthi, F.A.; Ahmad, N.; Nagaraju, G. Ionic Liquid-Aided Synthesis of Anatase TiO2 Nanoparticles: Photocatalytic Water Splitting and Electrochemical Applications. Crystals 2022, 12, 1–13. [Google Scholar] [CrossRef]
- Chen, D.; Cheng, Y.; Zhou, N.; Chen, P.; Wang, Y.; Li, K.; Huo, S.; Cheng, P.; Peng, P.; Zhang, R.; Wang, L.; Liu, H.; Liu, Y.; Ruan, R. Photocatalytic degradation of organic pollutants using TiO2-based photocatalysts: A review. J. Clean. Prod. 2020, 268, 121725. [Google Scholar] [CrossRef]
- van Driel, B.A.; Kooyman, P.J.; van den Berg, K.J.; Schmidt-Ott, A.; Dik, J. A quick assessment of the photocatalytic activity of TiO2 pigments — From lab to conservation studio! Microchem. J. 2016, 126, 162–171. [Google Scholar] [CrossRef]
- Henderson, M.A. A surface science perspective on TiO2 photocatalysis. Surf. Sci. Rep. 2011, 66, 185–297. [Google Scholar] [CrossRef]
- Kim, W.; Tachikawa, T.; Moon, G.H.; Majima, T.; Choi, W. Molecular-level understanding of the photocatalytic activity difference between anatase and rutile nanoparticles. Angew. Chemie - Int. Ed. 2014, 53, 14036–14041. [Google Scholar] [CrossRef]
- Hu, J.; Li, H.; Muhammad, S.; Wu, Q.; Zhao, Y.; Jiao, Q. Surfactant-assisted hydrothermal synthesis of TiO2/reduced graphene oxide nanocomposites and their photocatalytic performances. J. Solid State Chem. 2017, 253, 113–120. [Google Scholar] [CrossRef]
- Payormhorm, J.; Chuangchote, S.; Laosiripojana, N. CTAB-assisted sol-microwave method for fast synthesis of mesoporous TiO2 photocatalysts for photocatalytic conversion of glucose to value-added sugars. Mater. Res. Bull. 2017, 95, 546–555. [Google Scholar] [CrossRef]
- Nagamine, S.; Sasaoka, E. Synthesis of nanostructured titania templated by anionic surfactant in acidic conditions. J. Porous Mater. 2002, 9, 167–173. [Google Scholar] [CrossRef]
- Estrada-Flores, S.; Martínez-Luévanos, A.; Perez-Berumen, C.M.; García-Cerda, L.A.; Flores-Guia, T.E. Relationship between morphology, porosity, and the photocatalytic activity of TiO2 obtained by sol–gel method assisted with ionic and nonionic surfactants. Bol. Soc. Esp. Ceram. and Vidr. 2020, 59, 209–218. [Google Scholar] [CrossRef]
- Yuenyongsuwan, J.; Nithiyakorn, N.; Sabkird, P.; O'Rear, E.A.; Pongprayoon, T. Surfactant effect on phase-controlled synthesis and photocatalyst property of TiO2 nanoparticles. Mater. Chem. Phys. 2018, 214, 330–336. [Google Scholar] [CrossRef]
- Cassaignon, S.; Koelsch, M.; Jolivet, J.P. Selective synthesis of brookite, anatase, and rutile nanoparticles: Thermolysis of TiCl4 in aqueous nitric acid. J. Mater. Sci. 2007, 42, 6689–6695. [Google Scholar] [CrossRef]
- Li, Z.; Zhu, Y.; Wang, L.; Wang, J.; Guo, Q.; Li, J. A facile method for the structure control of TiO2 particles at low temperature. Appl. Surf. Sci. 2015, 355, 1051–1056. [Google Scholar] [CrossRef]
- Li, Z.; Zhu, Y.; Wang, J.; Guo, Q.; Li, J. Size-controlled synthesis of dispersed equiaxed amorphous TiO2 nanoparticles. Ceram. Int. 2015, 41, 9057–9062. [Google Scholar] [CrossRef]
- Primet, M.; Pichat, P.; Mathieu, M.-V. Infrared study of the surface of titanium dioxides. J. Phys. Chem. 1971, 75, 1216–1220. [Google Scholar] [CrossRef]
- Martra, G. Lewis acid and base sites at the surface of microcrystalline anatase. Appl. Catal. A Gen. 2000, 200, 275–285. [Google Scholar] [CrossRef]
- Zhuang, W.; Zhang, Y.; He, L.; An, R.; Li, B. Facile synthesis of amino-functionalized mesoporous TiO2 microparticles for adenosine deaminase immobilization. Microporous Mesoporous Mater. 2017, 239, 158–166. [Google Scholar] [CrossRef]
- Ghorai, T.; Chakraborty, M.; Pramanik, P. Photocatalytic performance of nano-photocatalyst from TiO2 and Fe2O3 by mechanochemical synthesis. J. Alloys Compd. 2011, 509, 8158–8164. [Google Scholar] [CrossRef]
- Moussaoui, R.; Elghniji, K.; ben Mosbah, M.; Elaloui, E.; Moussaoui, Y. Sol–gel synthesis of highly TiO2 aerogel photocatalyst via high temperature supercritical drying. J. Saudi Chem. Soc.. 2017, 21, 751–760. [Google Scholar] [CrossRef]
- Khalil, K.M.S.; El-Khatib, R.M.; Ali, T.T.; Mahmoud, H.A.; Elsamahy, A.A. Titania nanoparticles by acidic peptization of xerogel formed by hydrolysis of titanium(IV) isopropoxide under atmospheric humidity conditions. Powder Technol. 2013, 245, 156–162. [Google Scholar] [CrossRef]
- Bellardita, M.; Di Paola, A.; Megna, B.; Palmisano, L. Absolute crystallinity and photocatalytic activity of brookite TiO2 samples. Appl. Catal. B Environ. Environ. 2016, 201, 150–158. [Google Scholar] [CrossRef]
- Marinho, B.A.; Cristóvão, R.O.; Djellabi, R.; Loureiro, J.M.; Boaventura, R.A.R.; Vilar, V.J.P. Photocatalytic reduction of Cr (VI) over TiO2 -coated cellulose acetate monolithic structures using solar light. Appl. Catal. B Environ. 2017, 203, 18–30. [Google Scholar] [CrossRef]
- Momma, K.; Izumi, F. VESTA 3 for three-dimensional visualization of crystal, volumetric and morphology data. J. Appl. Crystallogr. 2011, 44, 1272–1276. [Google Scholar] [CrossRef]
- Leyva-Porras, C.; Toxqui-Teran, A.; Vega-Becerra, O.; Miki-Yoshida, M.; Rojas-Villalobos, M.; García-Guaderrama, M.; Aguilar-Martínez, J.A. Low-temperature synthesis and characterization of anatase TiO2 nanoparticles by an acid assisted sol-gel method. J. Alloys Compd. 2015, 647, 627–636. [Google Scholar] [CrossRef]
- Bagheri, S.; Termehyousefi, A.; Do, T.O. Photocatalytic pathway toward degradation of environmental pharmaceutical pollutants: Structure, kinetics and mechanism approach. Catal. Sci. Technol. 2017, 7, 4548–4569. [Google Scholar] [CrossRef]
- Ong, W.-J.; Tan, L.-L.; Chai, S.-P.; Yonga, S.T.; Mohamed, A.R. Highly Reactive {001} Facets of TiO2-Based Composites: Synthesis, Formation Mechanism and Characterizations. Nanoscale. 2014, 6, 1946–2008. [Google Scholar] [CrossRef]
- Ajmal, A.; Majeed, I.; Malik, R.N.; Idriss, H.; Nadeem, M. A. Principles and mechanisms of photocatalytic dye degradation on TiO2 based photocatalysts: a comparative overview. RSC Adv. 2014, 4, 37003–37026. [Google Scholar] [CrossRef]
- Sood, S.; Mehta, S.K.; Umar, A.; Kansal, S.K. The visible light-driven photocatalytic degradation of Alizarin red S using Bi-doped TiO2 nanoparticles. New J. Chem. 2014, 38, 3127–3136. [Google Scholar] [CrossRef]
- Mutuma, B.K.; Shao, G.N.; Kim, W.D.; Kim, H.T. Sol-gel synthesis of mesoporous anatase-brookite and anatase-brookite-rutile TiO2 nanoparticles and their photocatalytic properties. J. Colloid Interface Sci. 2015, 442, 1–7. [Google Scholar] [CrossRef] [PubMed]
- López, R.; Gómez, R. Band-gap energy estimation from diffuse reflectance measurements on sol – gel and commercial TiO2 : a comparative study. J. Sol-Gel Sci. Technol. 2012, 61, 1–7. [Google Scholar] [CrossRef]
- Qin, J.; Zhao, R.; Xia, M. A facile approach to synthesis carbon quantum dots-doped P25 visible-light driven photocatalyst with improved NO removal performance. Atmos. Pollut. Beef. 2020, 11, 303–309. [Google Scholar] [CrossRef]
Figure 1.
FTIR-ATR spectra of the samples synthesized by sol-gel method using acetic acid as catalyst and complexing agent (T2, T3, and T5 samples) and without adding acetic acid (T6 sample).
Figure 1.
FTIR-ATR spectra of the samples synthesized by sol-gel method using acetic acid as catalyst and complexing agent (T2, T3, and T5 samples) and without adding acetic acid (T6 sample).
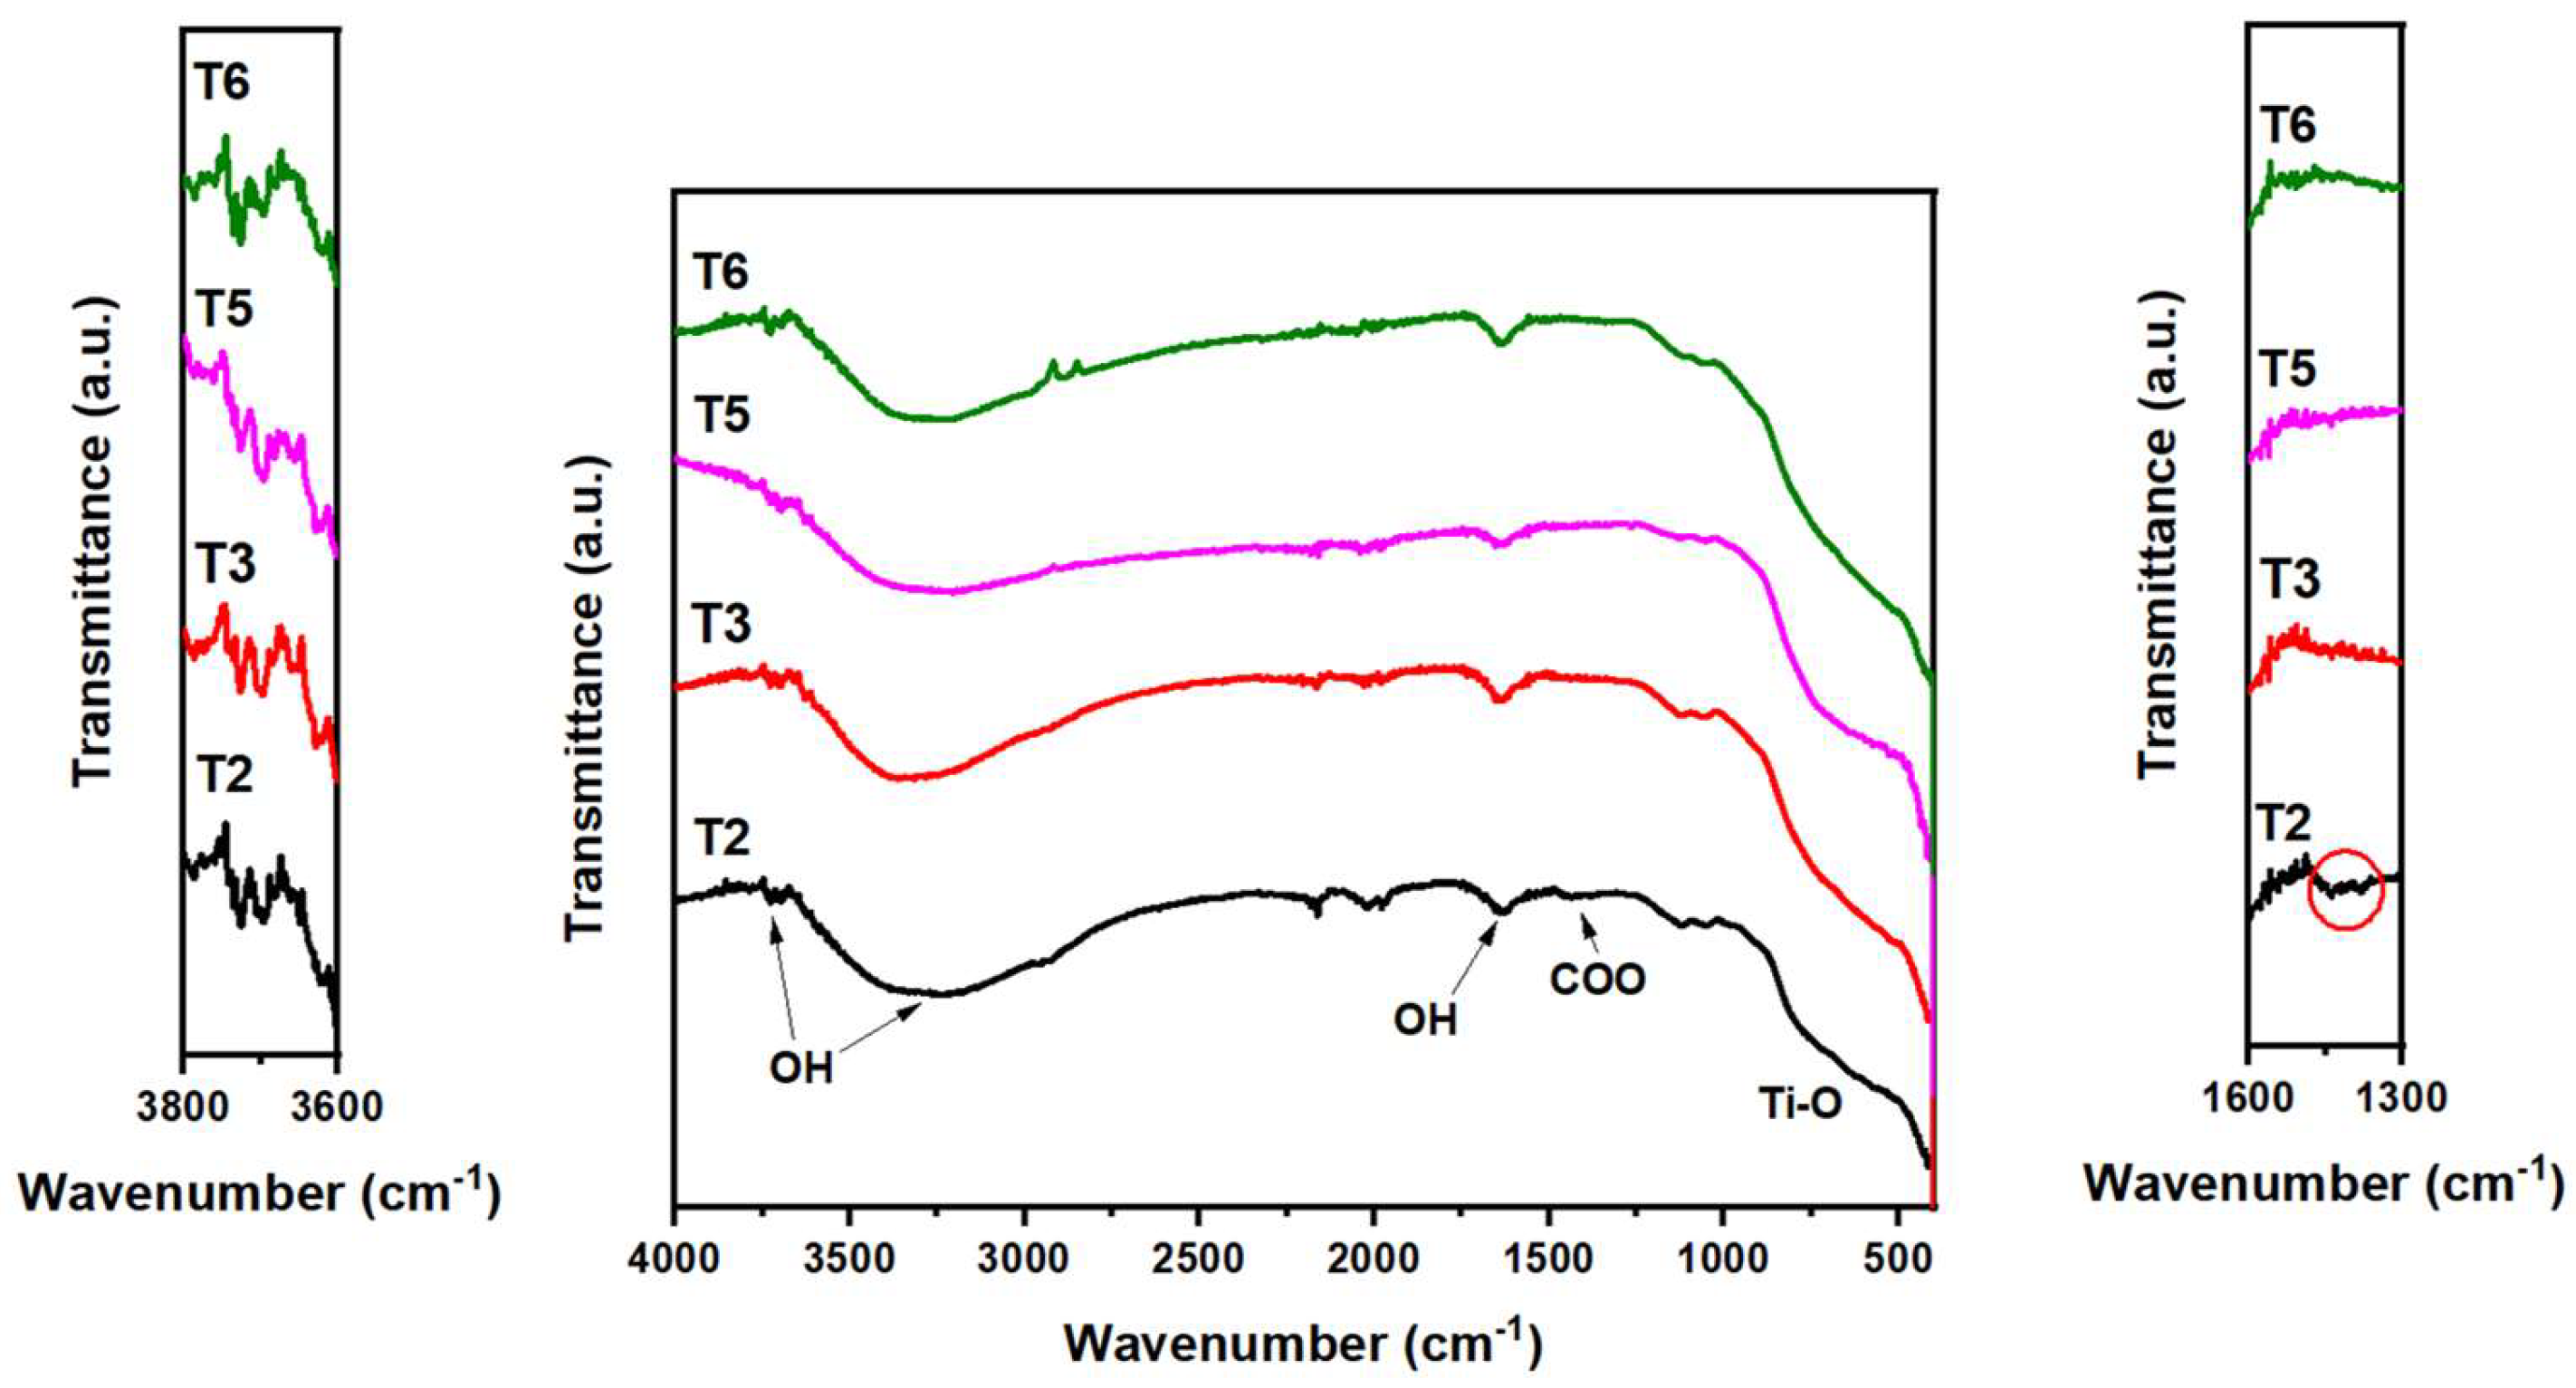
Figure 2.
XRD patterns of the samples (A); Amplification on the peak corresponding to the plane (101) of the anatase phase (B).
Figure 2.
XRD patterns of the samples (A); Amplification on the peak corresponding to the plane (101) of the anatase phase (B).
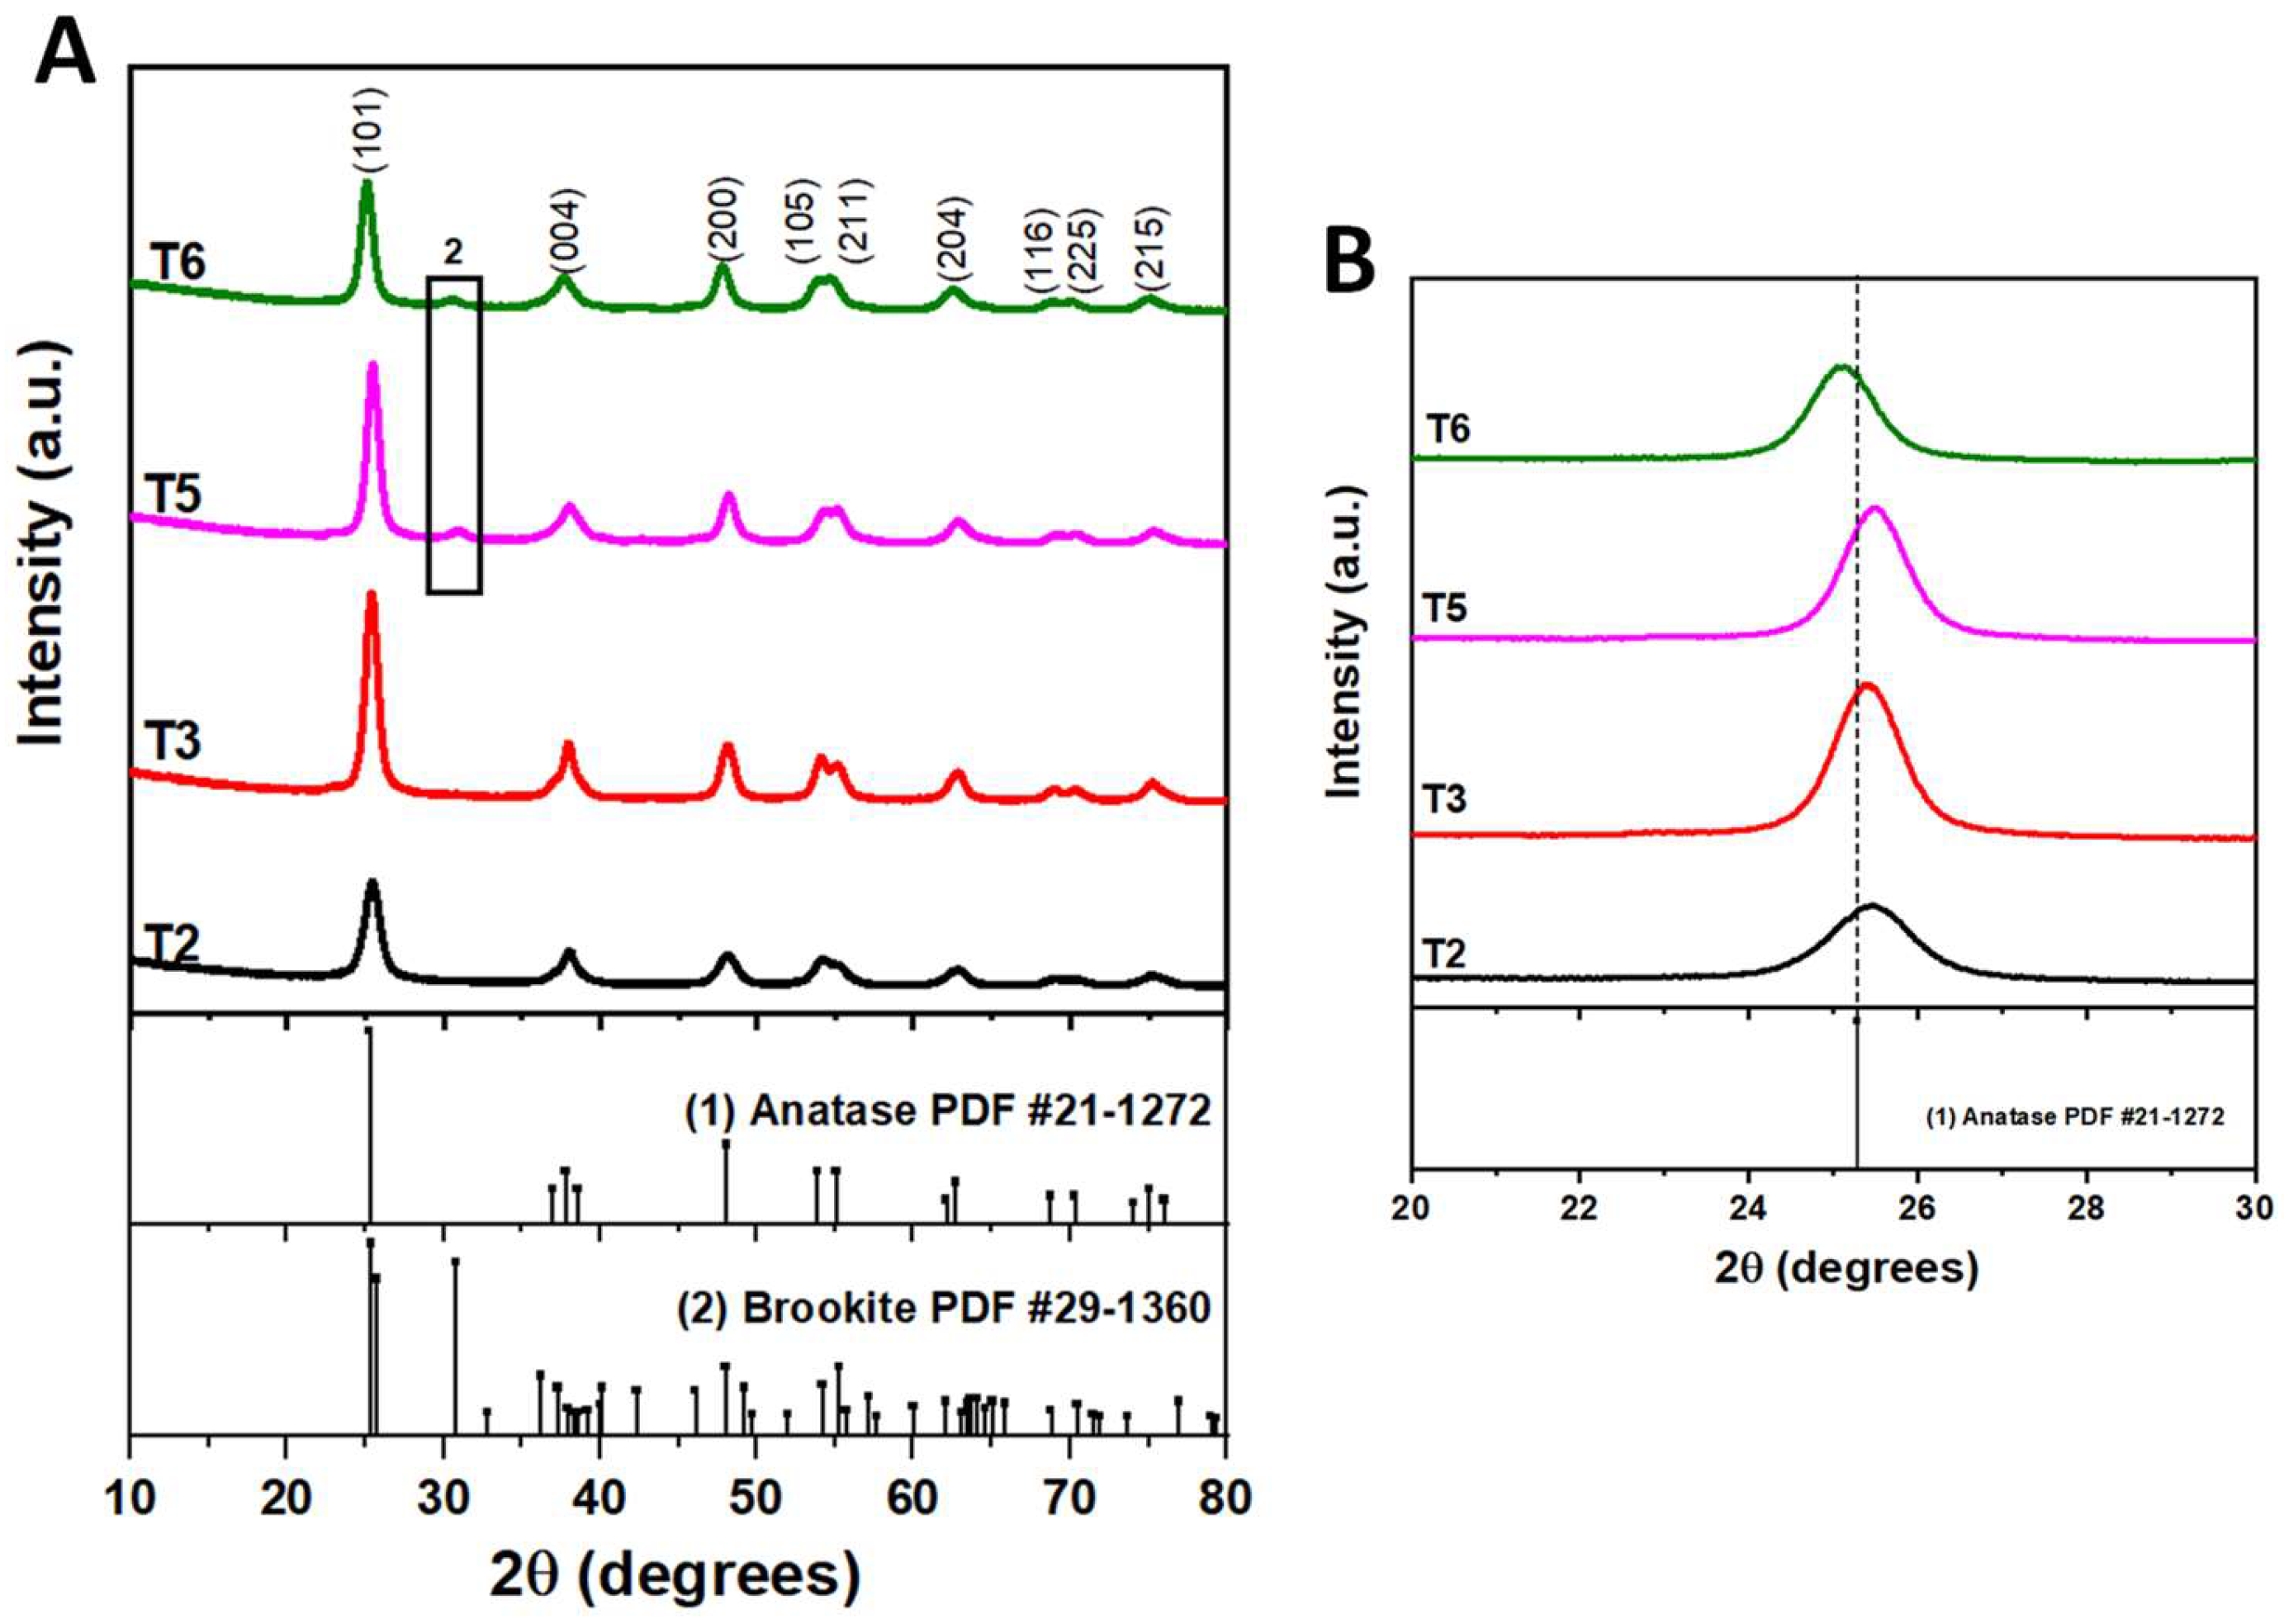
Figure 3.
XRD patterns adjustment.
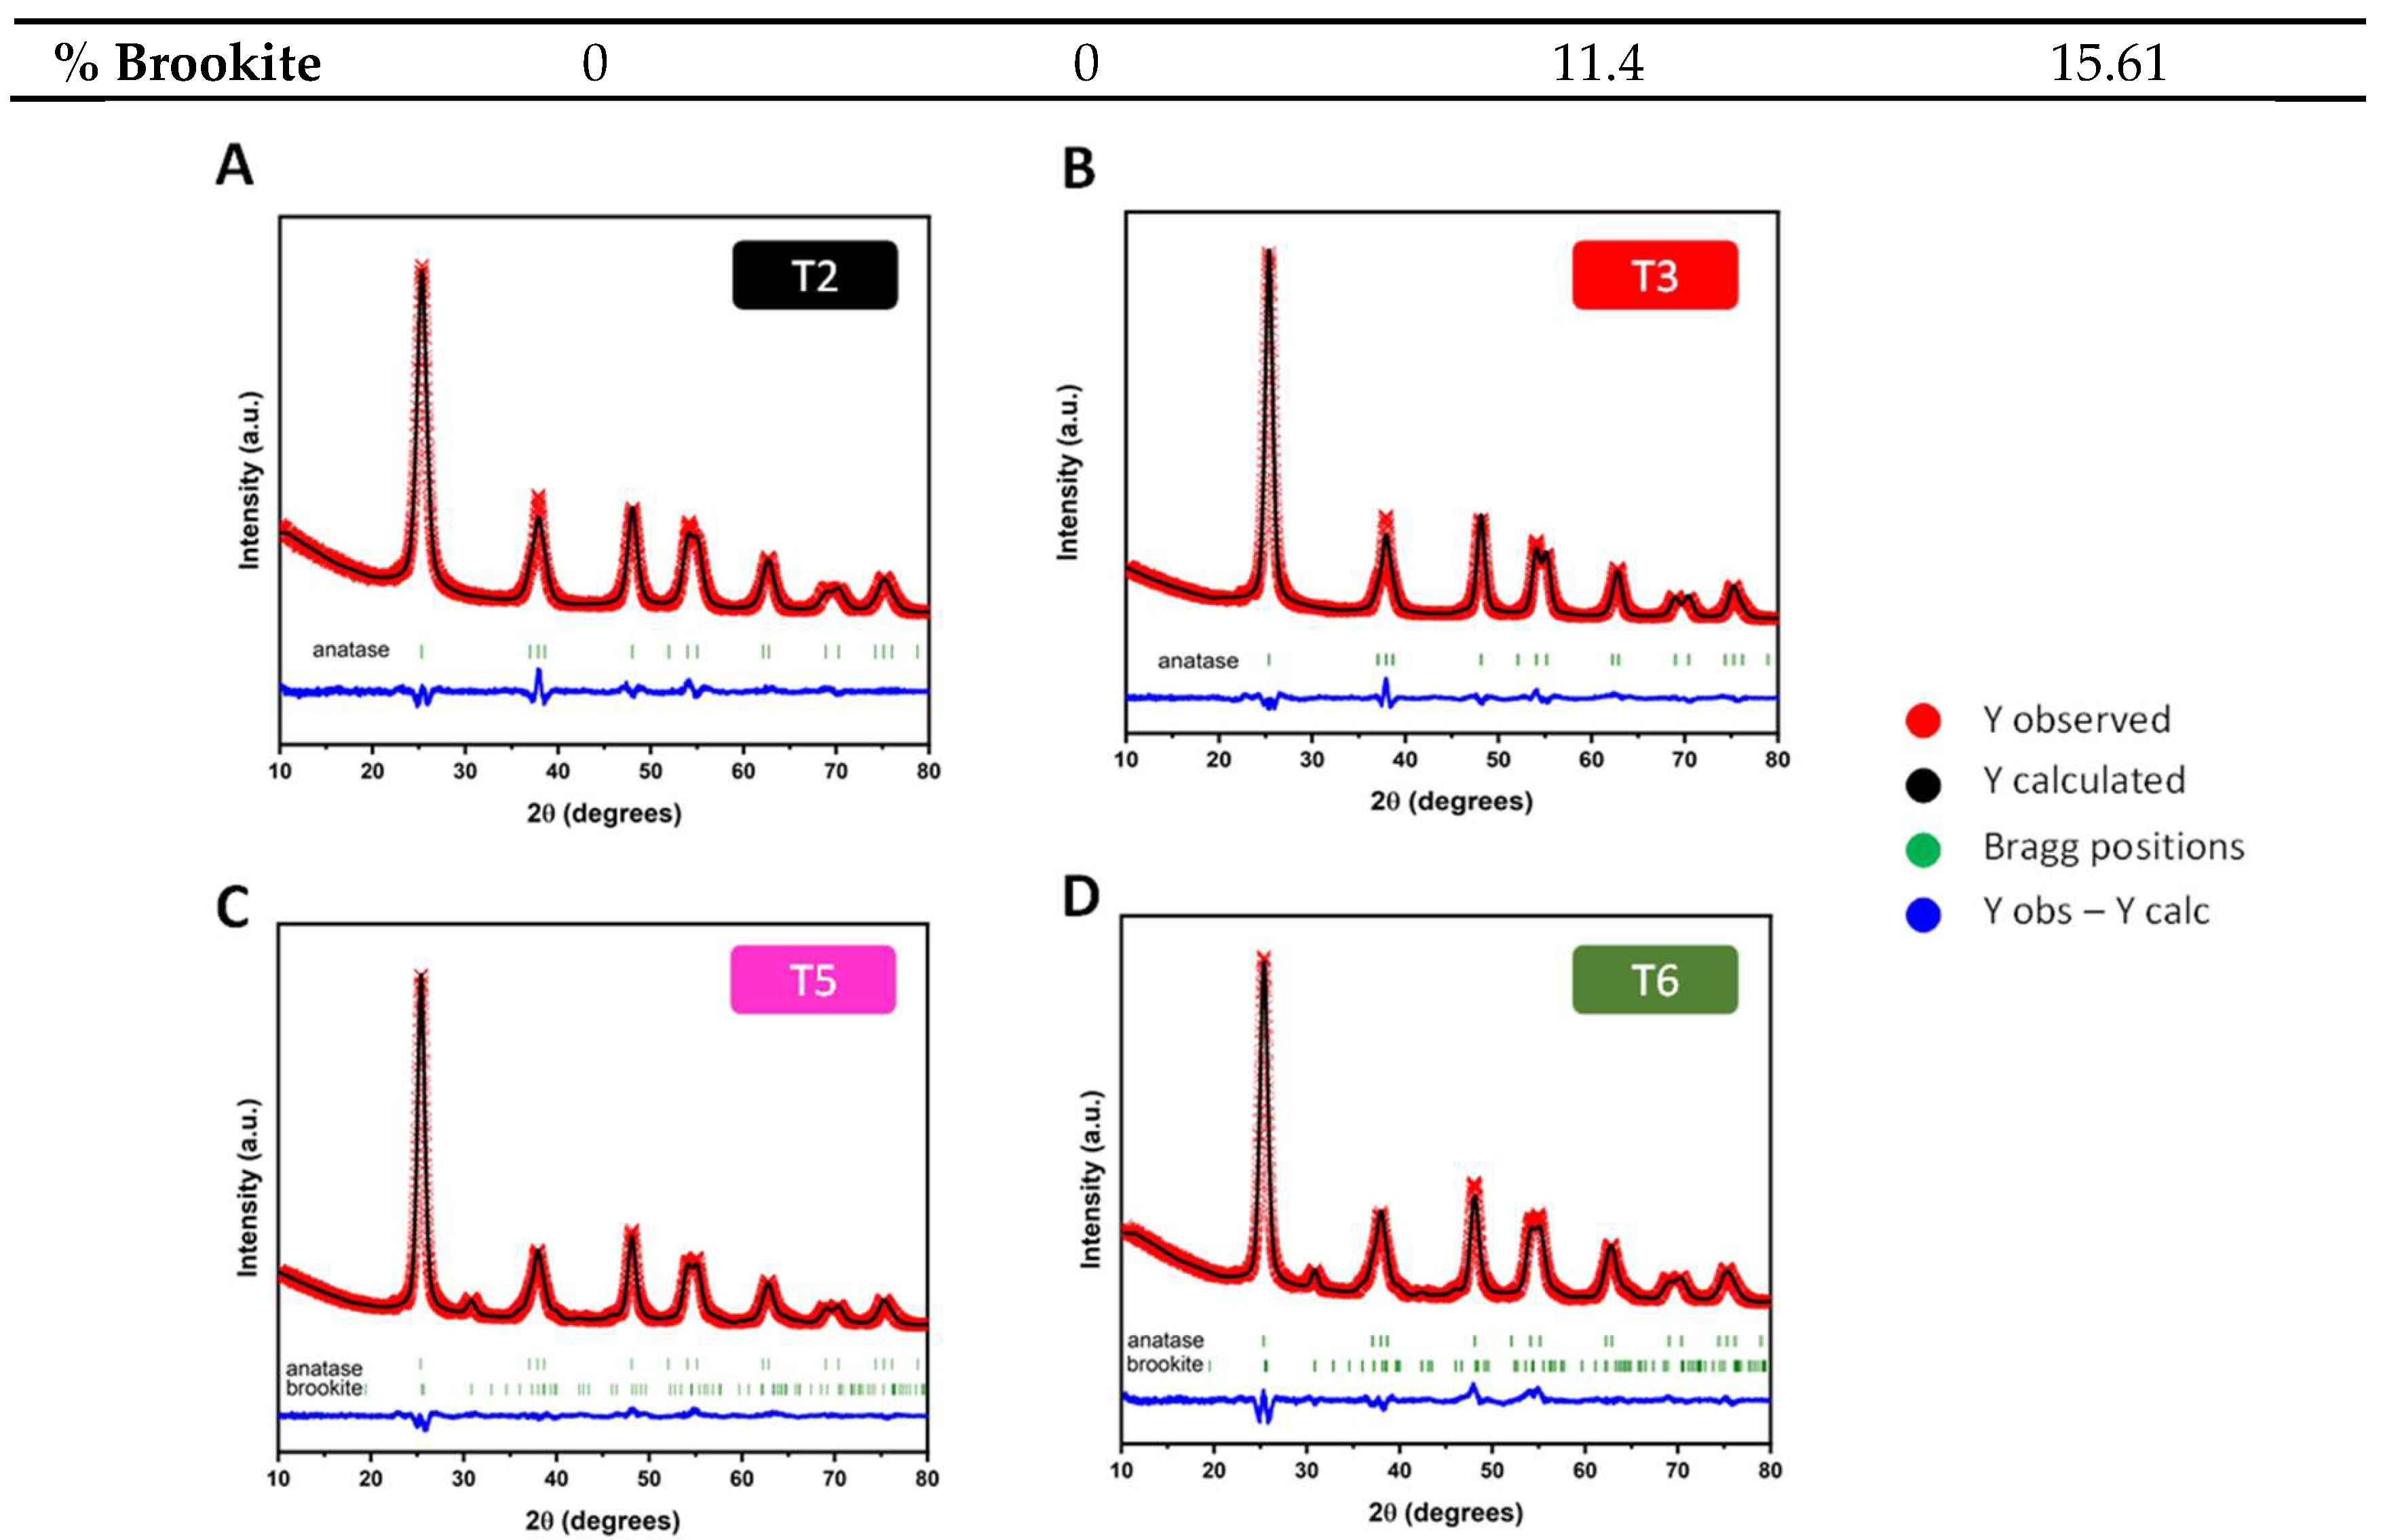
Figure 4.
Relationship between the amount of brookite present in the TiO2 samples and the pH of synthesis.
Figure 4.
Relationship between the amount of brookite present in the TiO2 samples and the pH of synthesis.
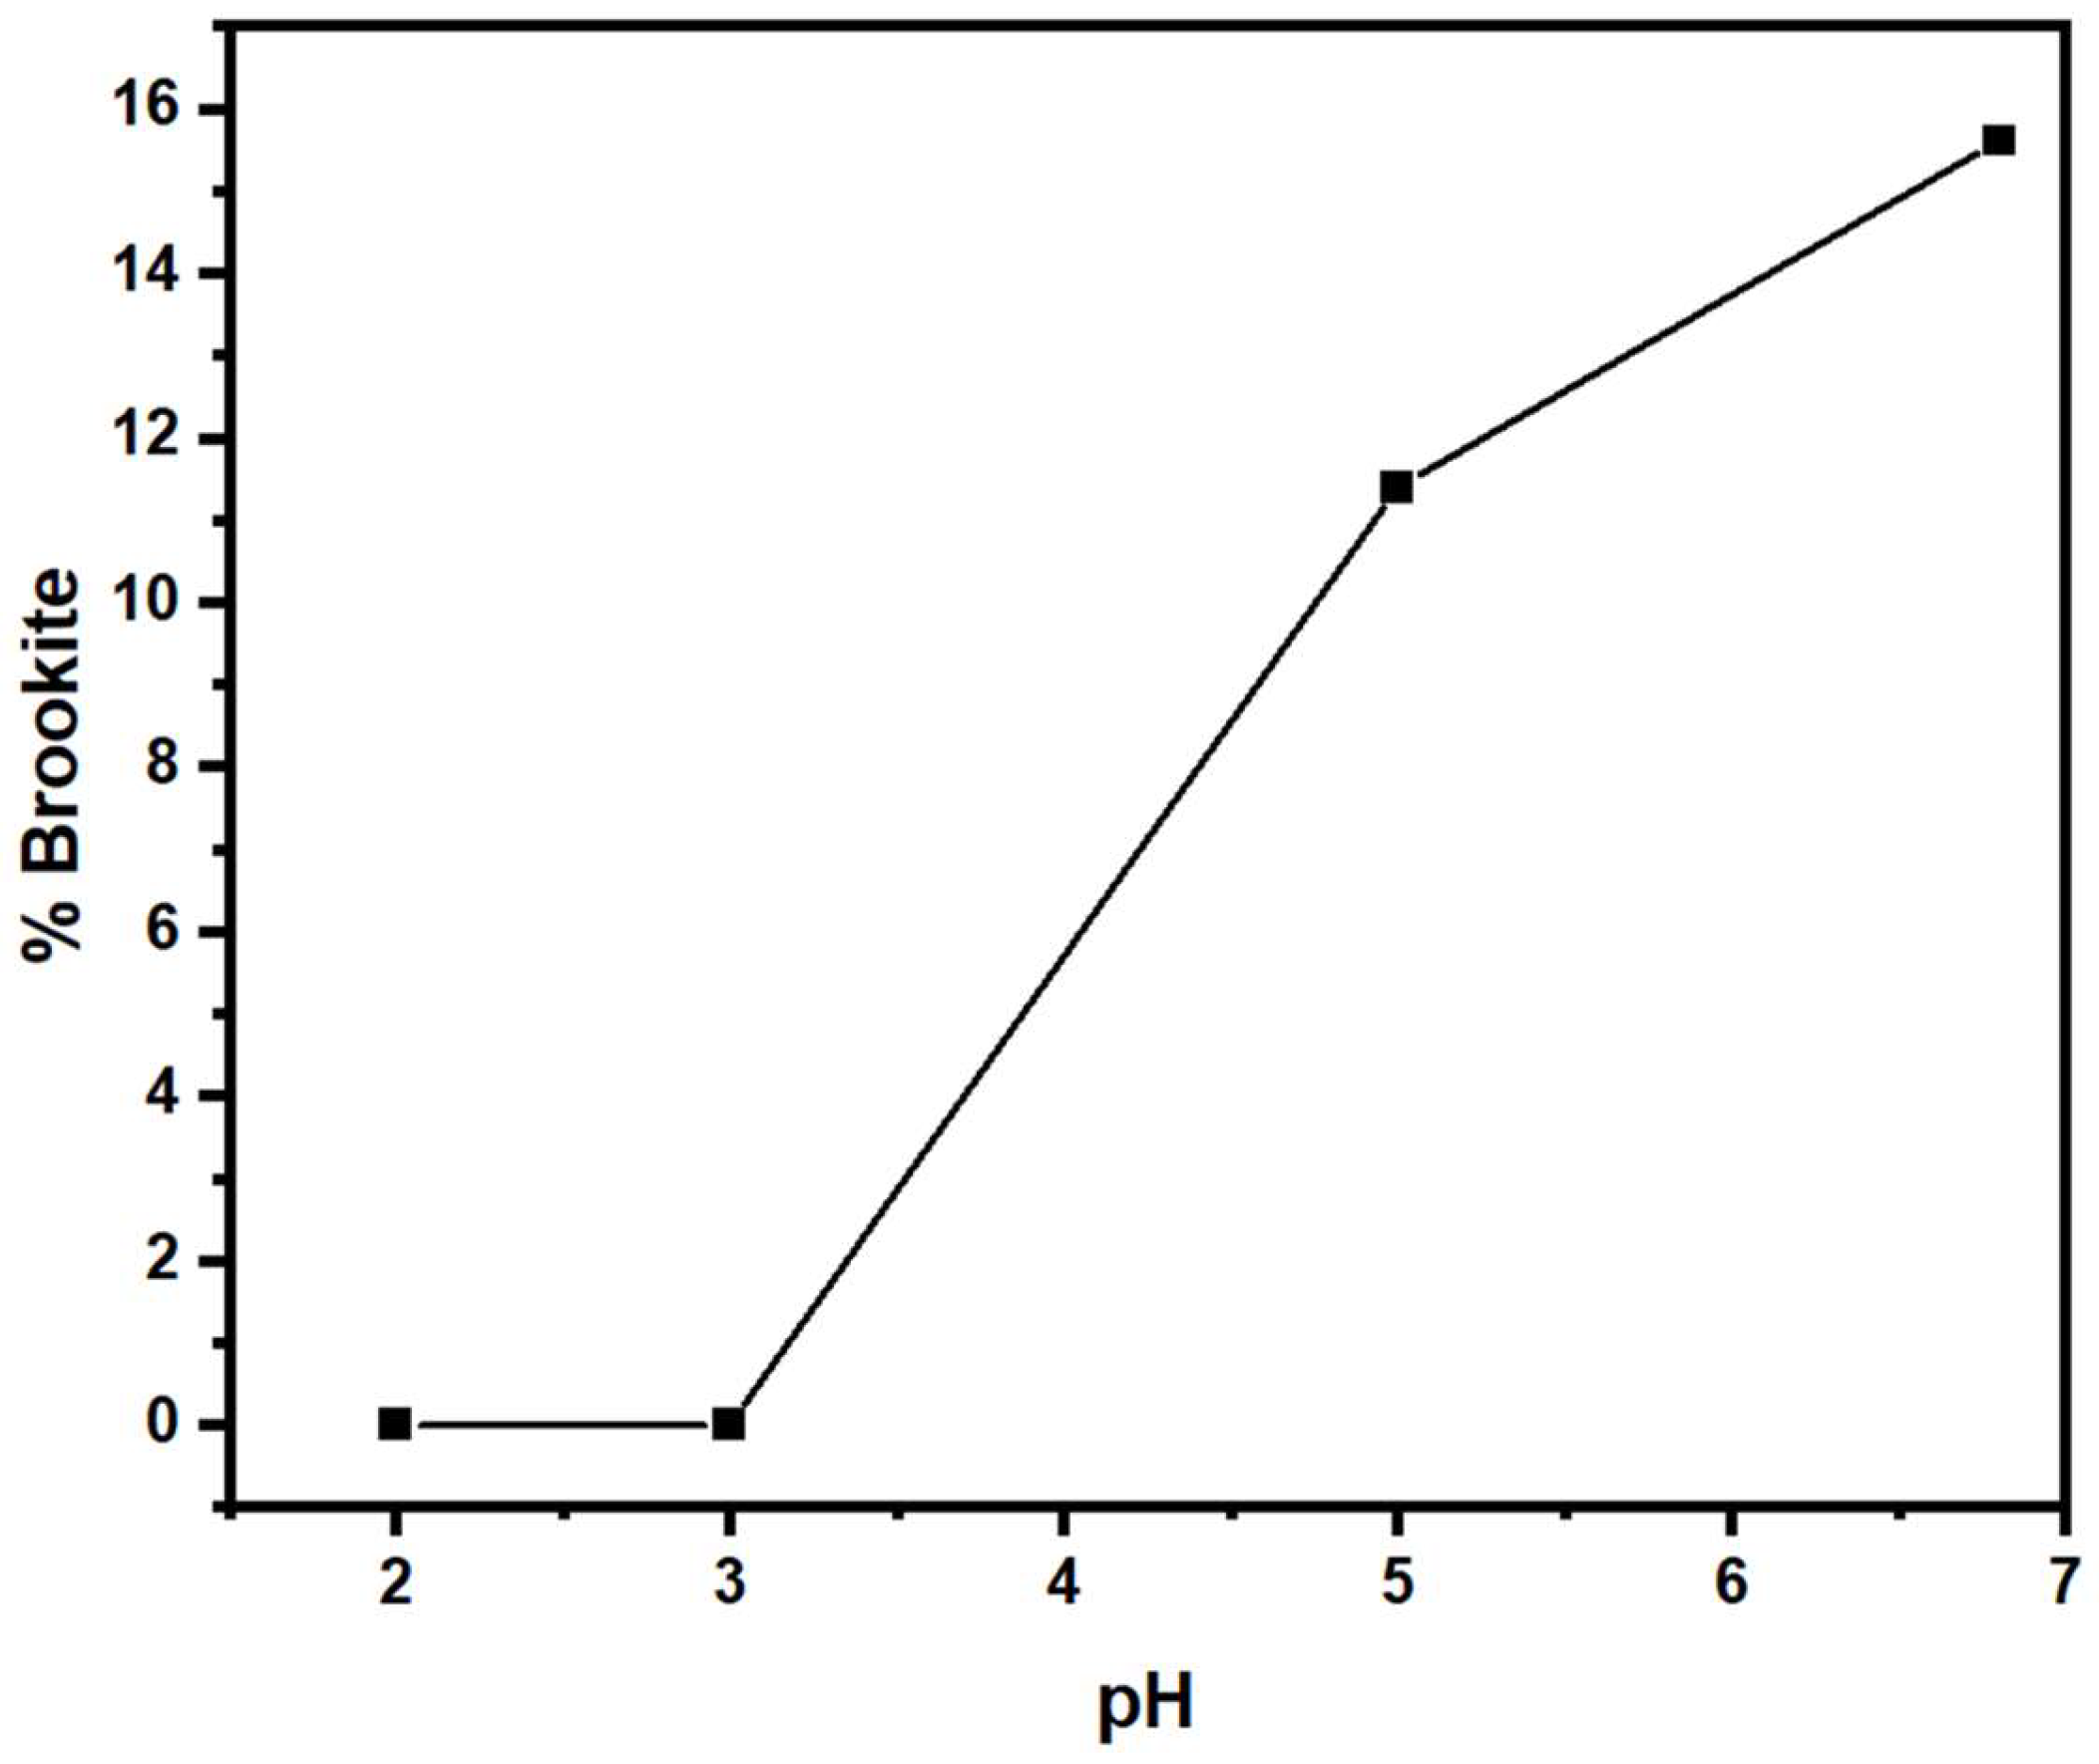
Figure 5.
Anatase single cell (body centered tetragonal cell.
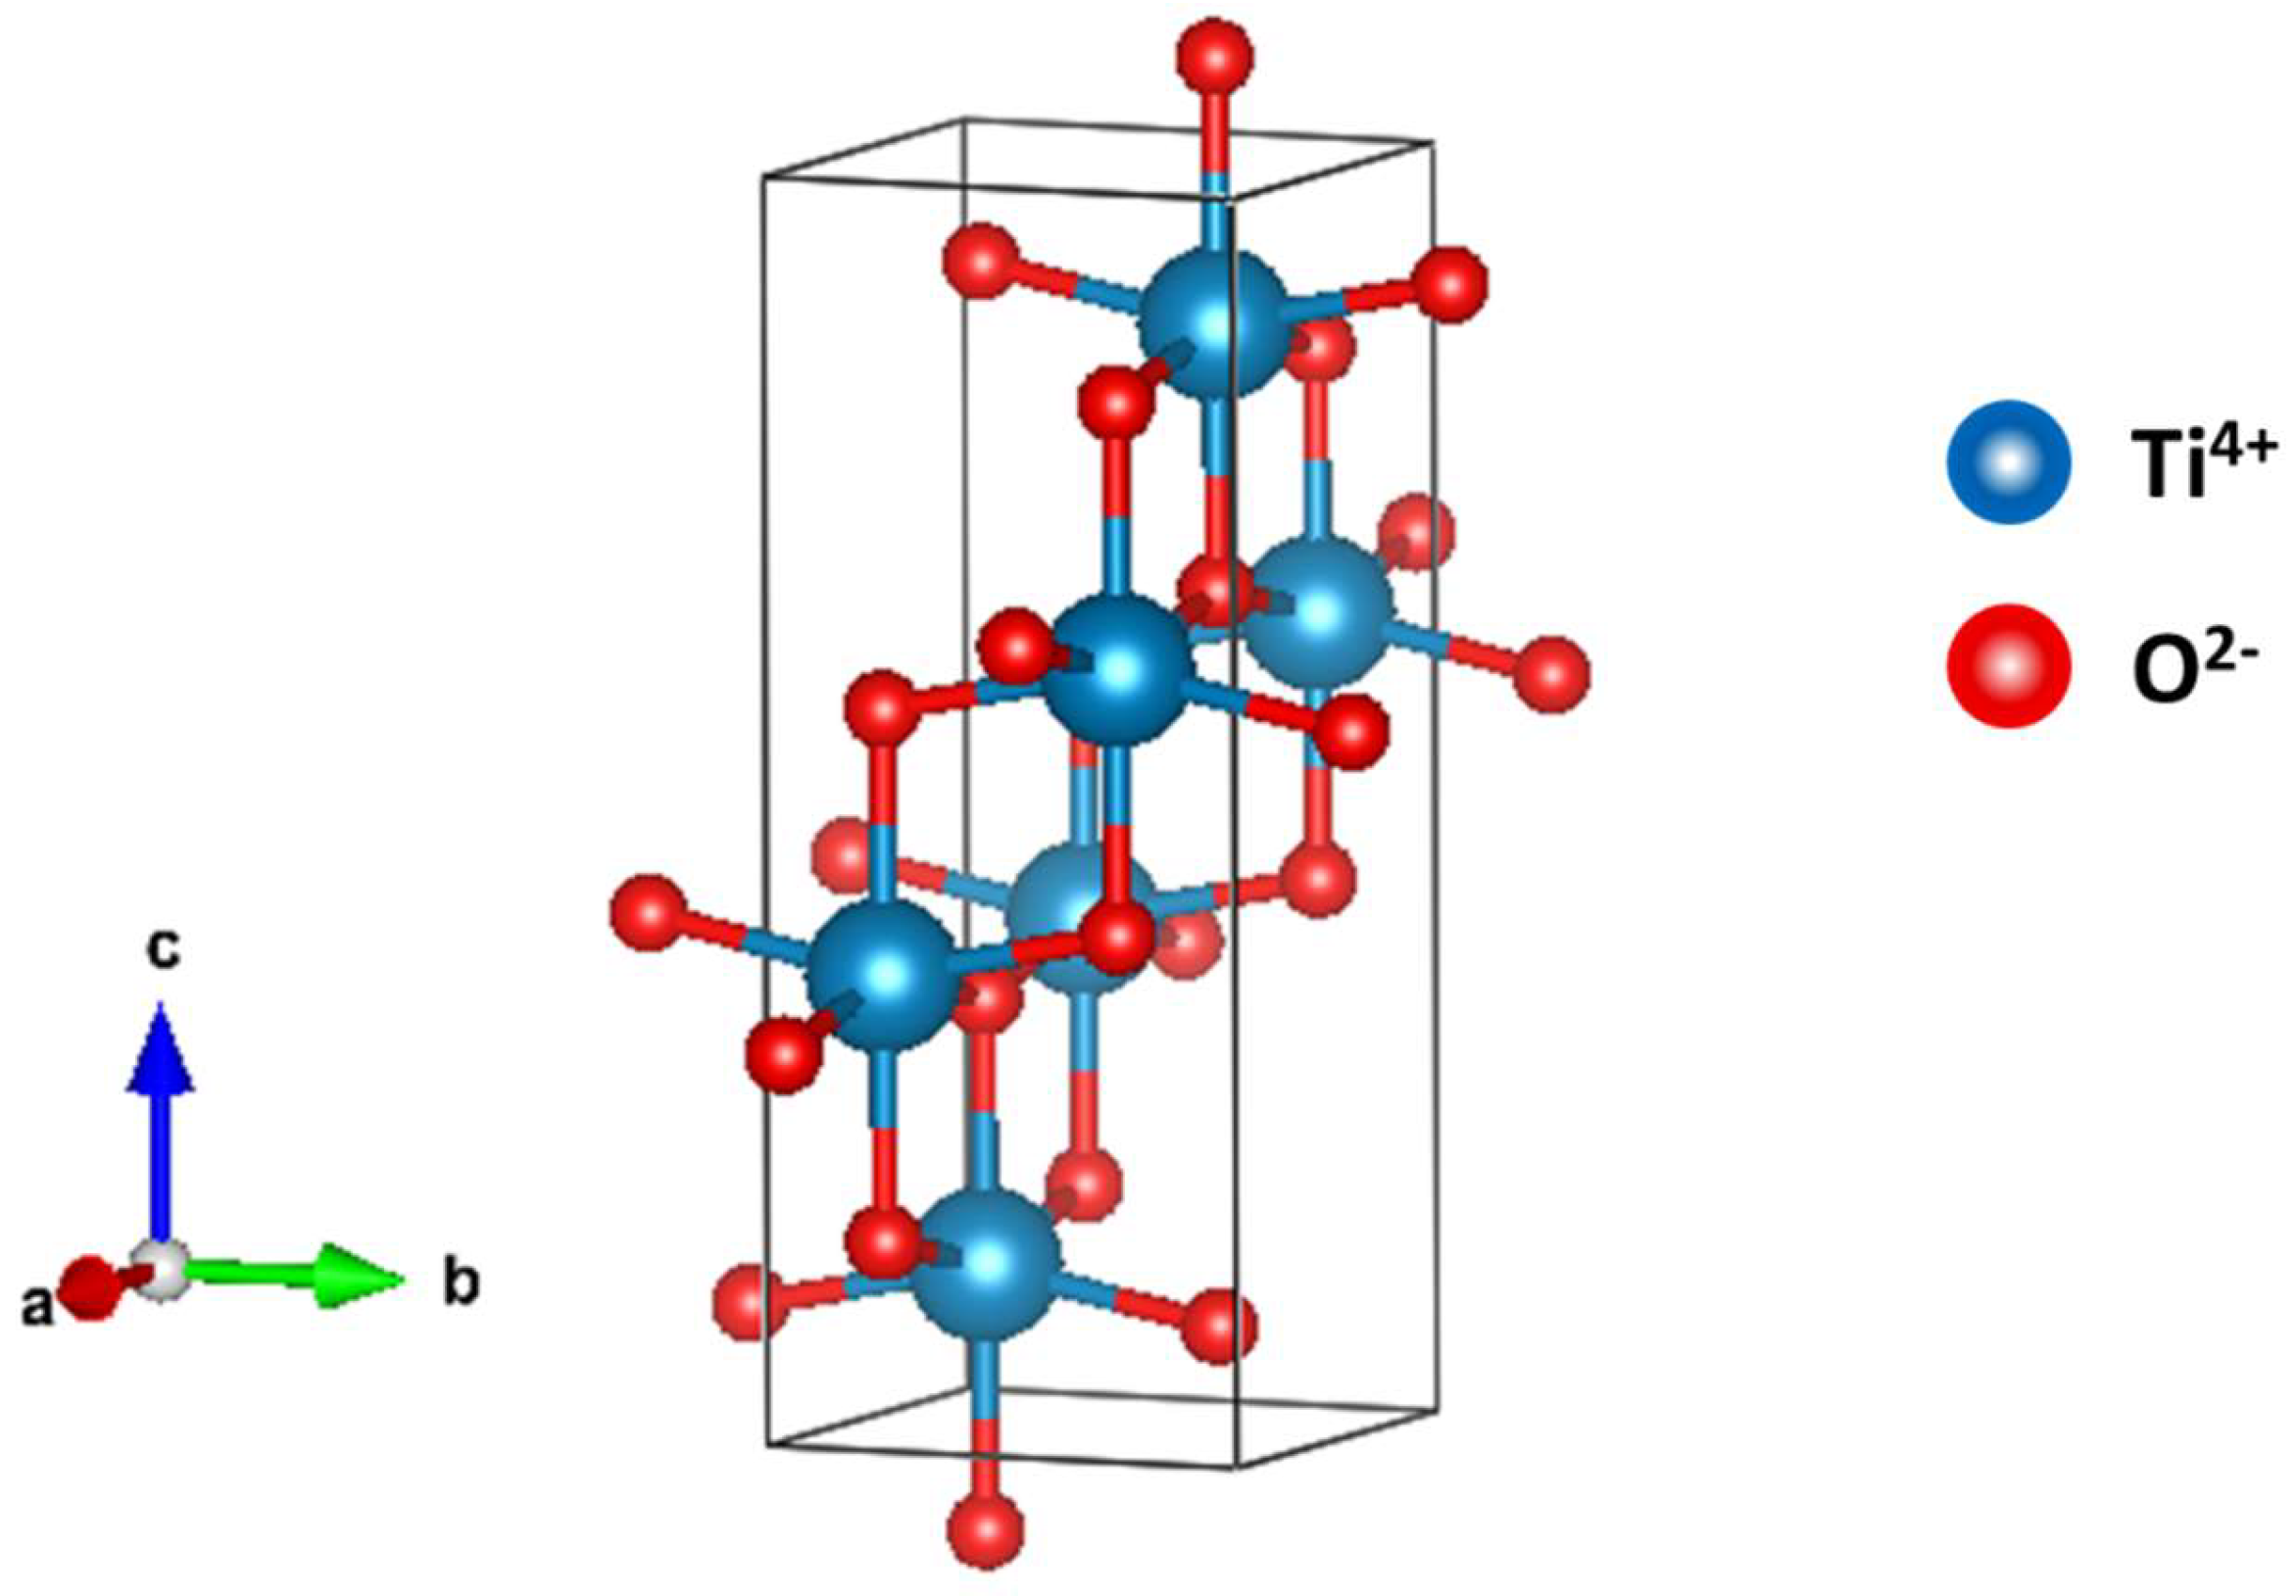
Figure 6.
FTIR-ATR spectra (A) and XRD patterns (B) of the T2 and the THNO3 samples.
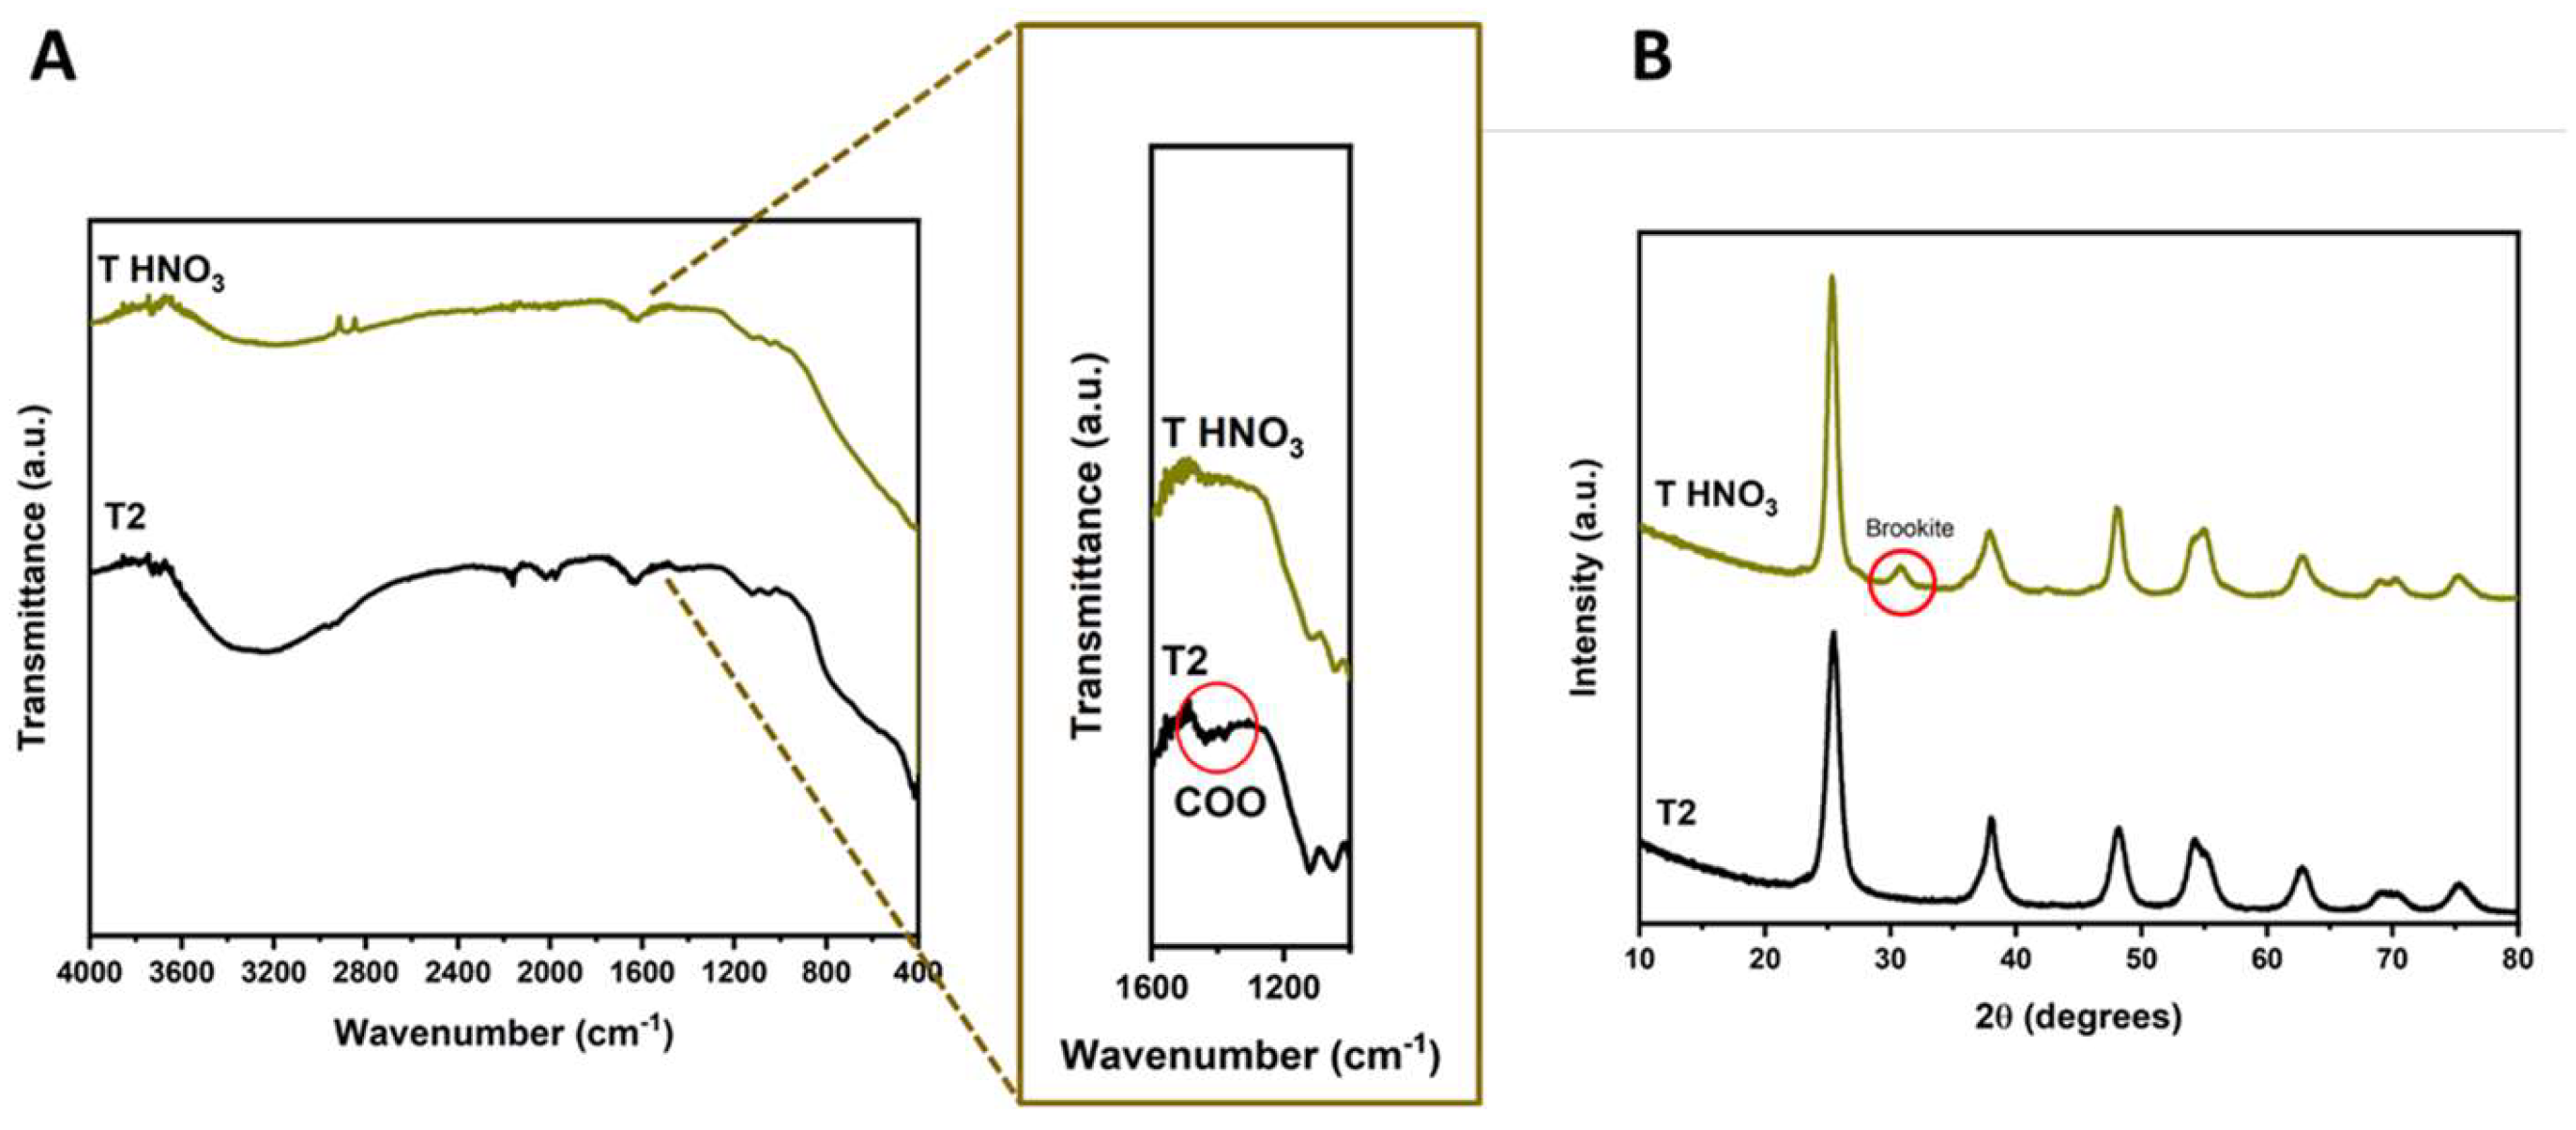
Figure 7.
SEM images at 100,000X of the T2 (A), T3 (B), T4 (D), T5 (E) and T6 (F) samples. SEM image at 10,000X of the T3 sample (C).
Figure 7.
SEM images at 100,000X of the T2 (A), T3 (B), T4 (D), T5 (E) and T6 (F) samples. SEM image at 10,000X of the T3 sample (C).
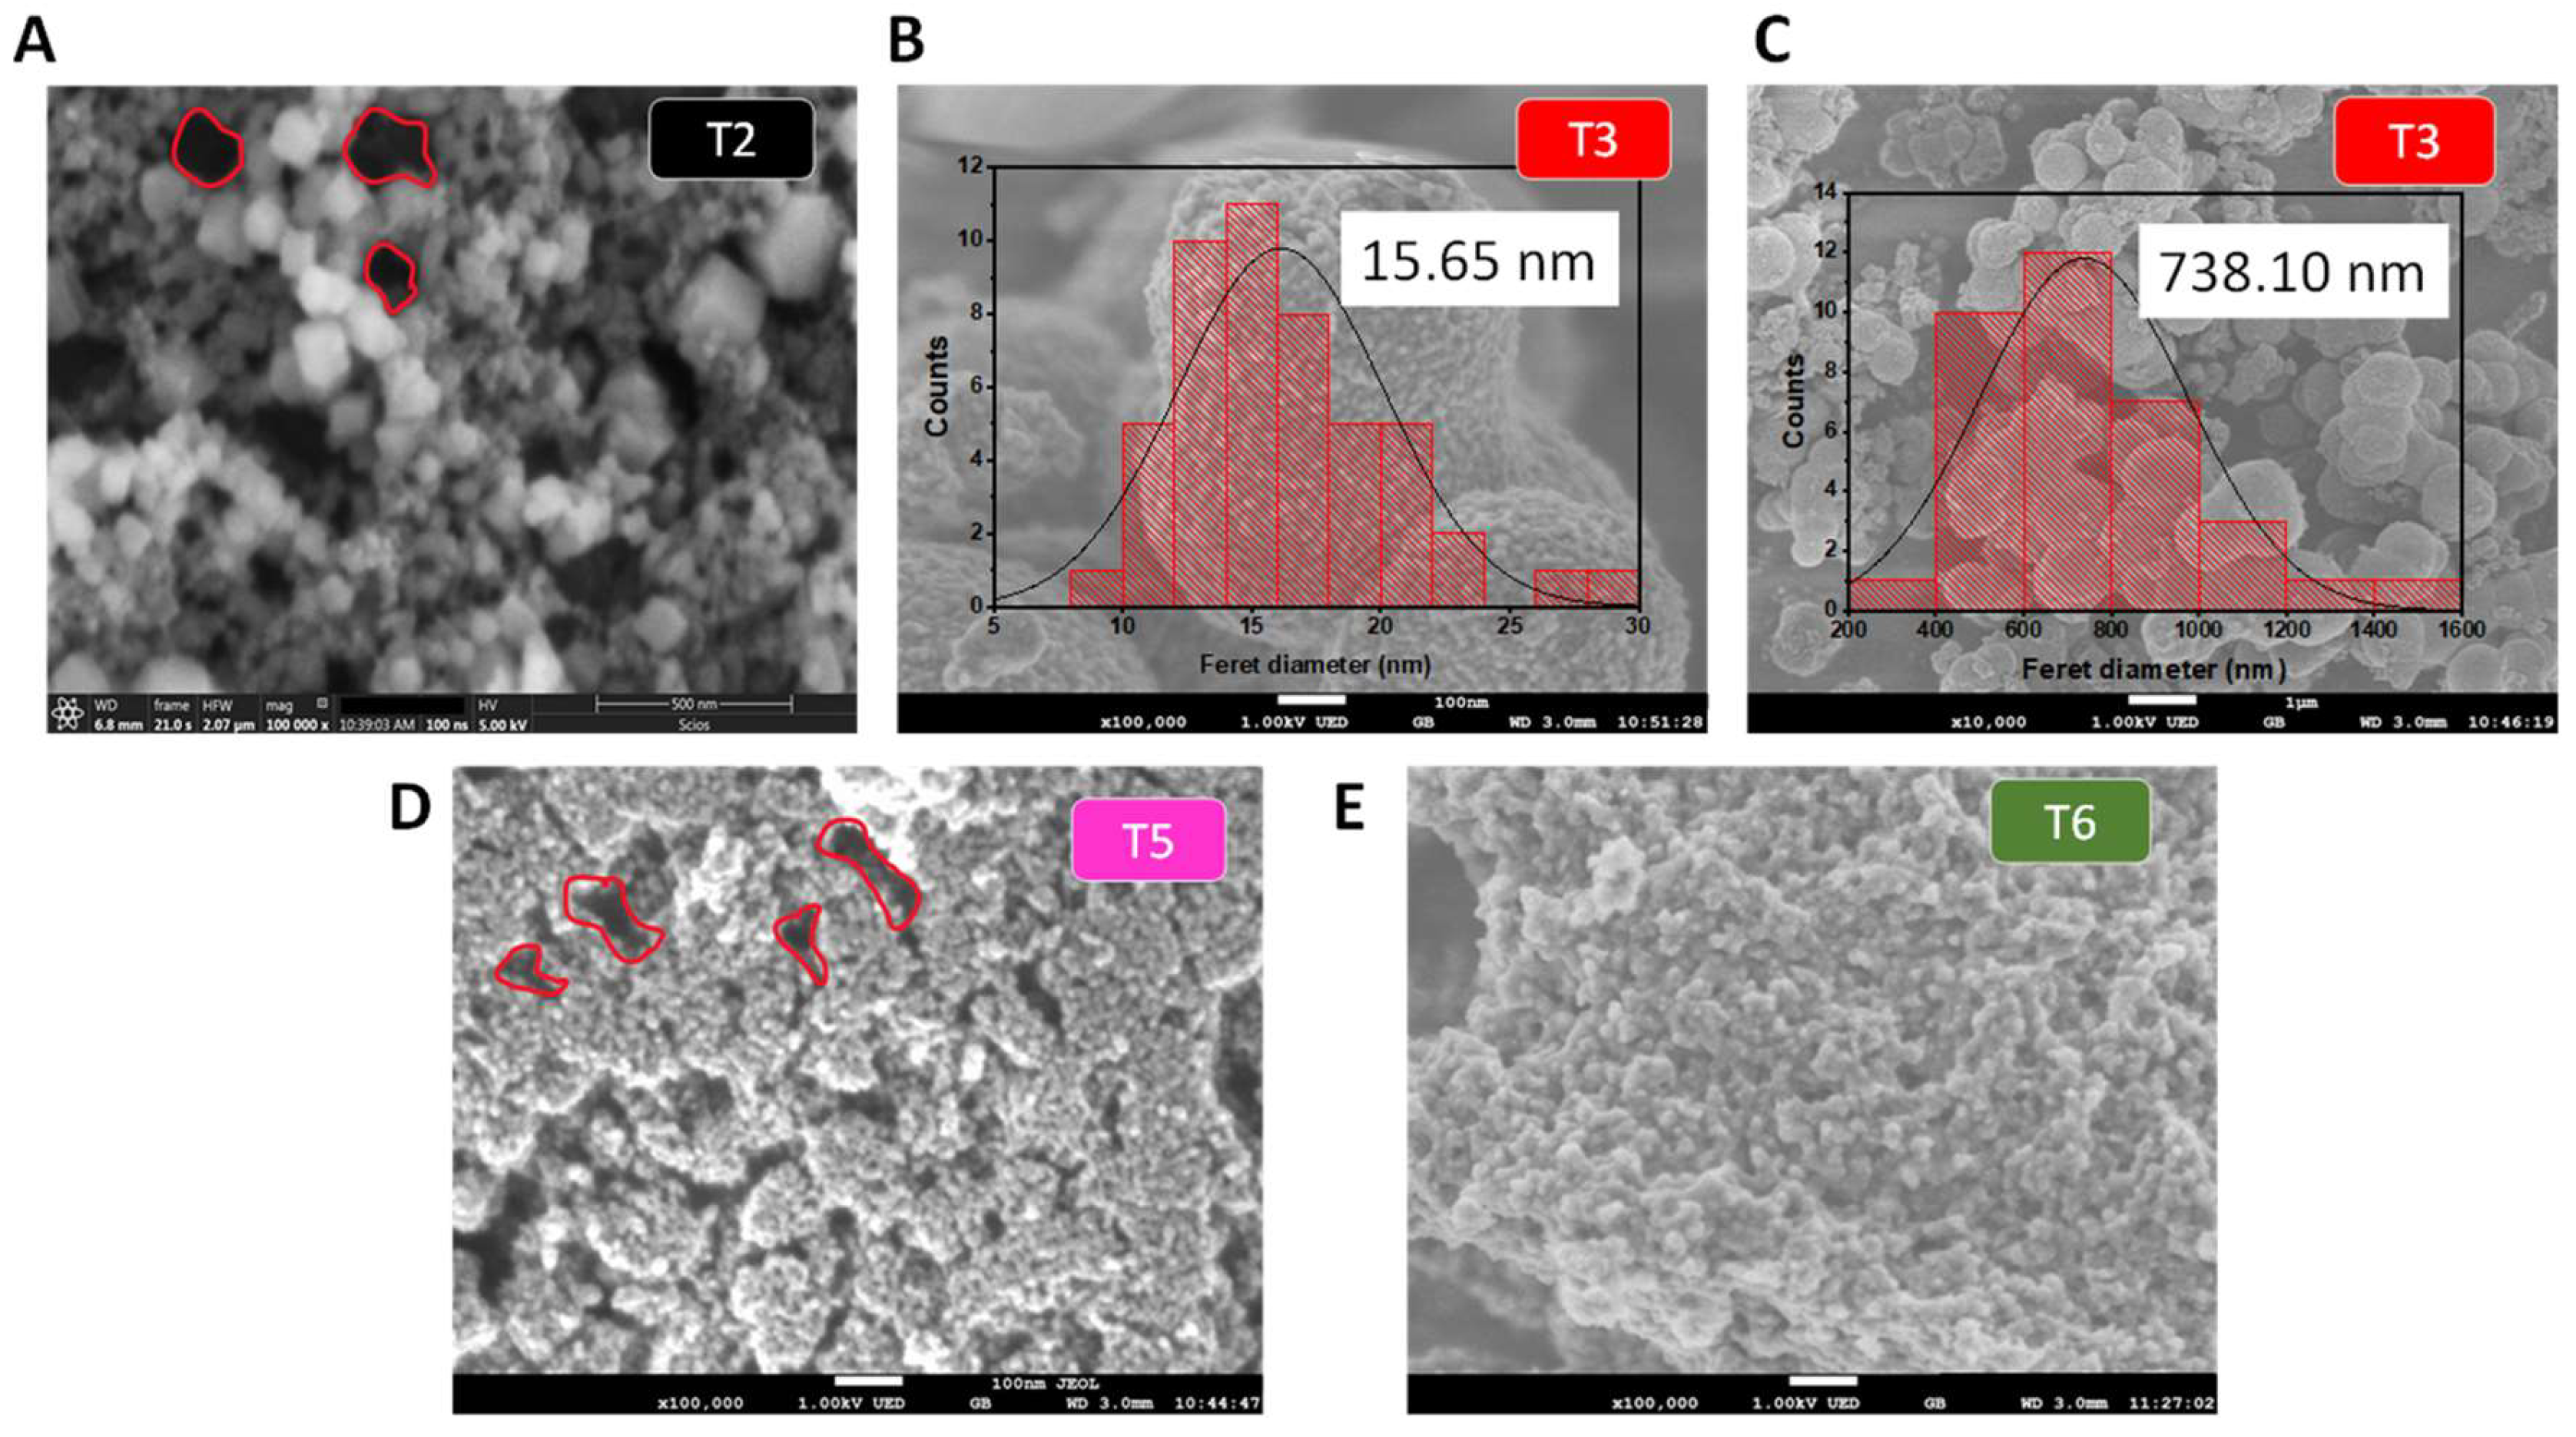
Figure 8.
SEM image at 50,000X of the T2 sample. The growth of the crystal is generally with the shape illustrated in (A), where the facets {101} have a higher surface. Using big amounts of acetic acid, the shape observed in (B) is reached, where the facets with higher energy like {001} are extended.
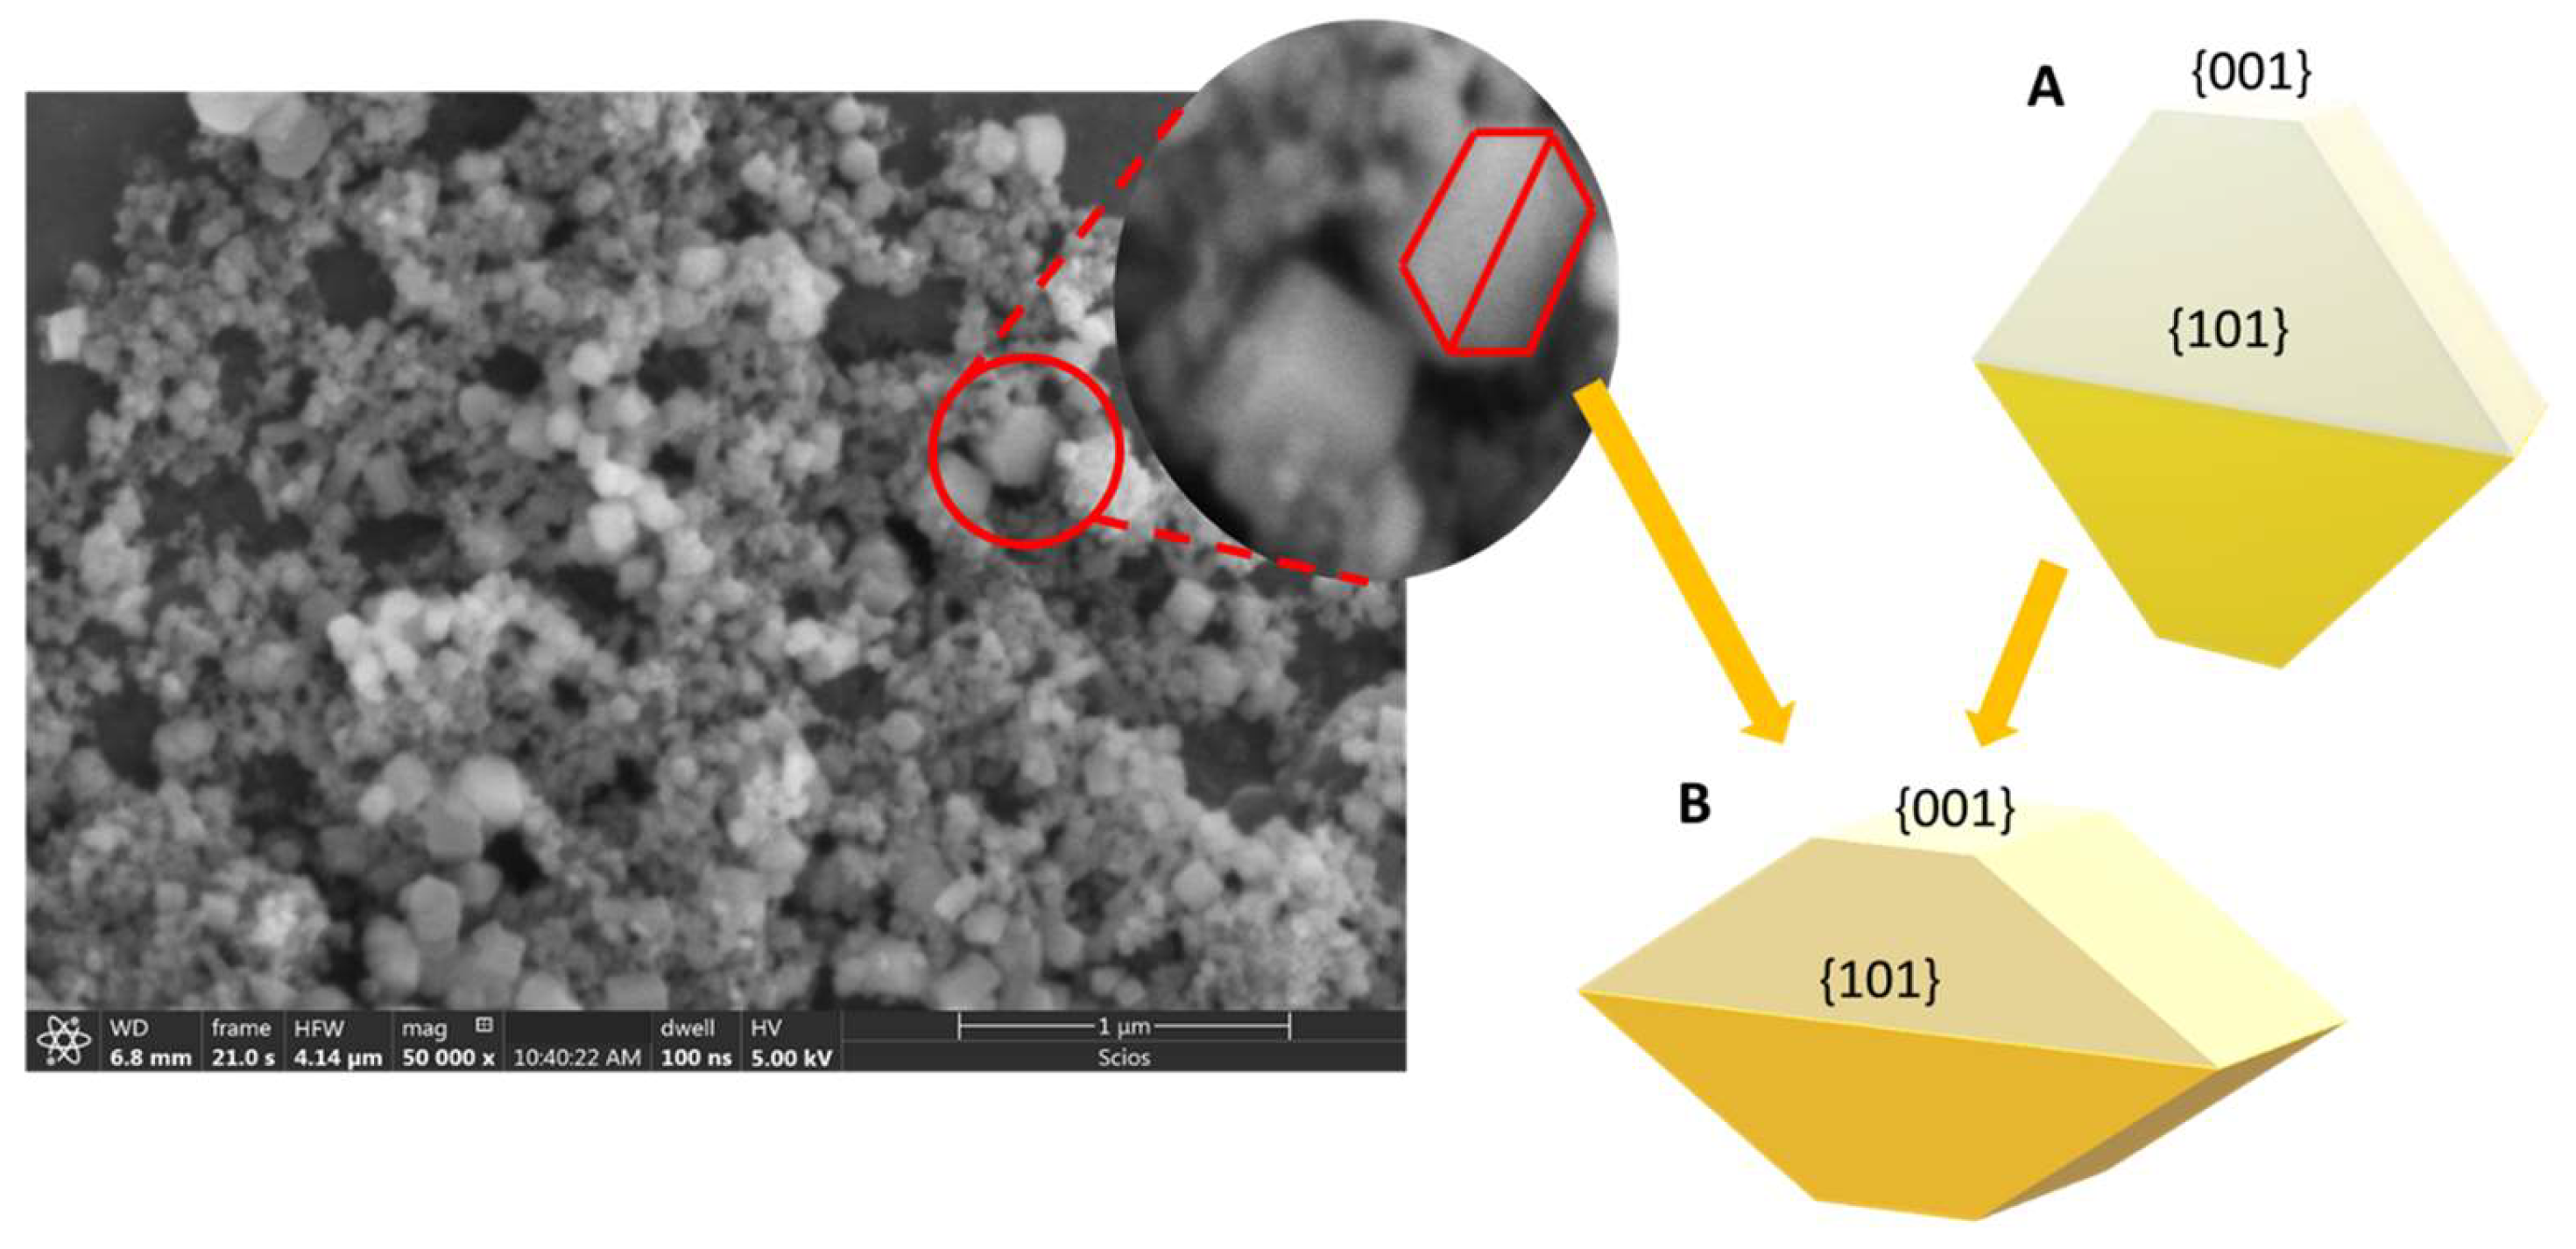
Figure 9.
N2 adsorption/desorption isotherms of the TiO2 samples. The inserted image corresponds to the pore size distribution.
Figure 9.
N2 adsorption/desorption isotherms of the TiO2 samples. The inserted image corresponds to the pore size distribution.
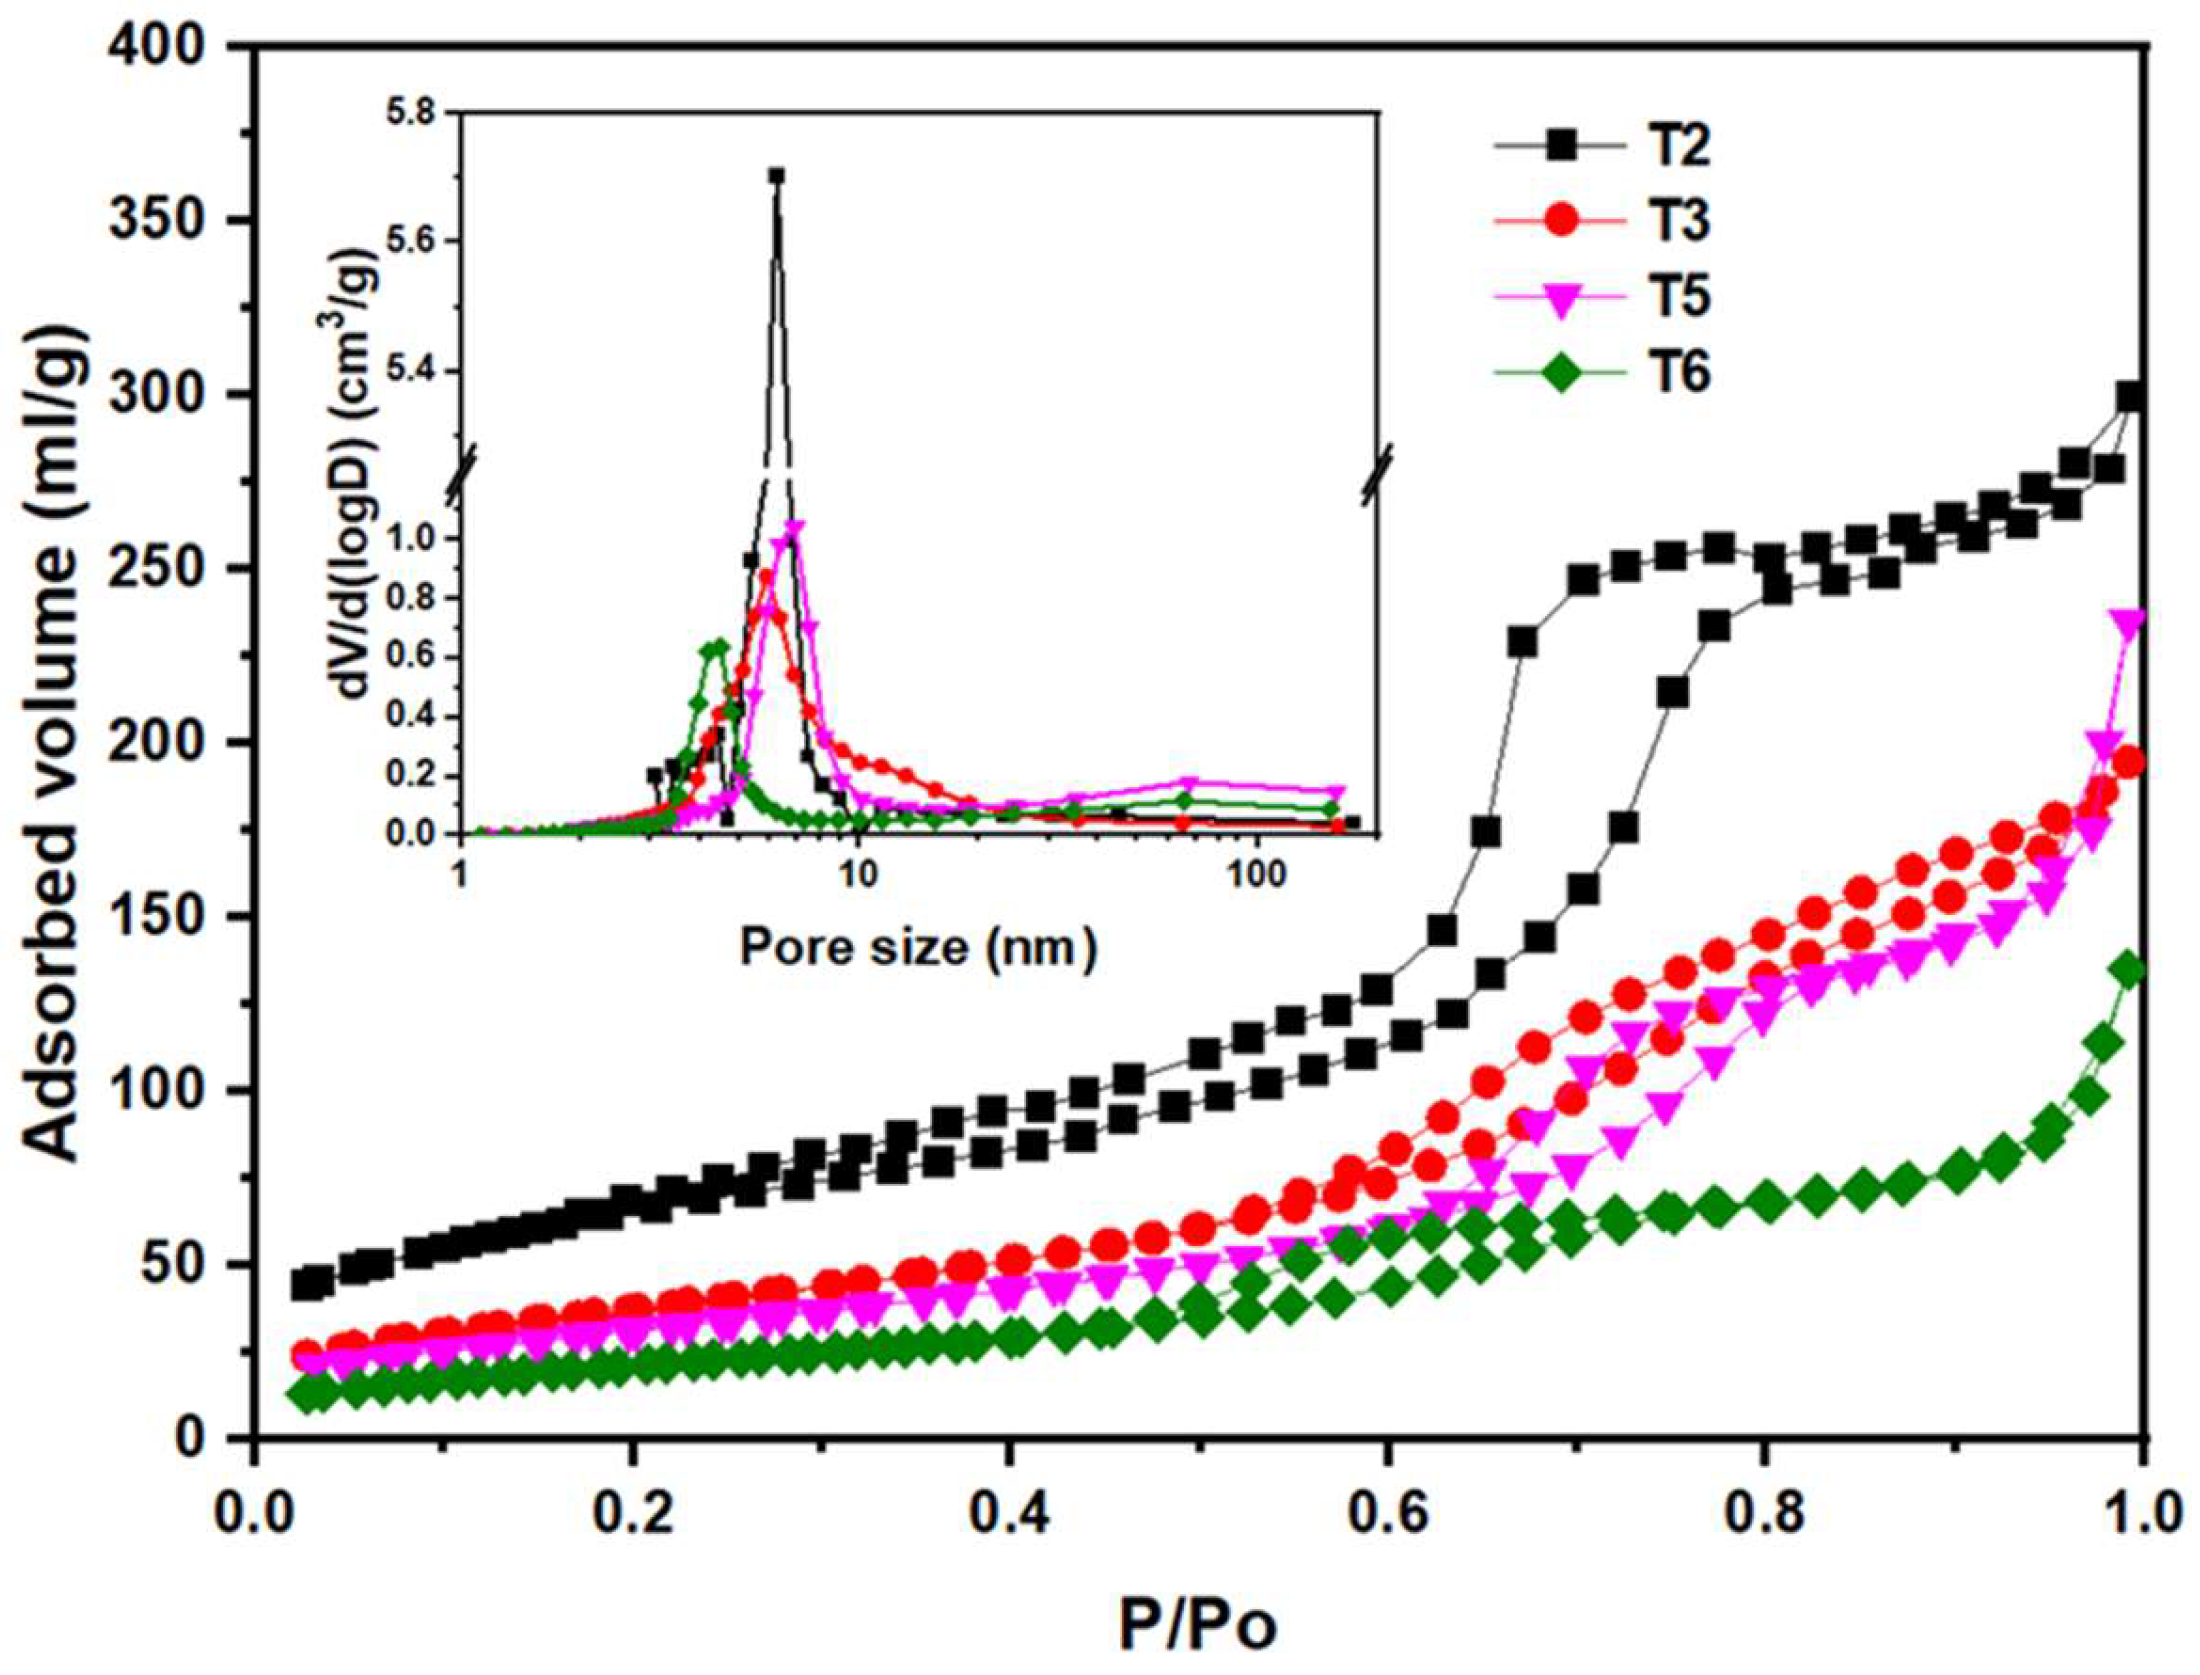
Figure 10.
Absorbance spectra (A) and Tauc plot (B) of the samples by sol-gel method and using acetic acid as catalyst.
Figure 10.
Absorbance spectra (A) and Tauc plot (B) of the samples by sol-gel method and using acetic acid as catalyst.
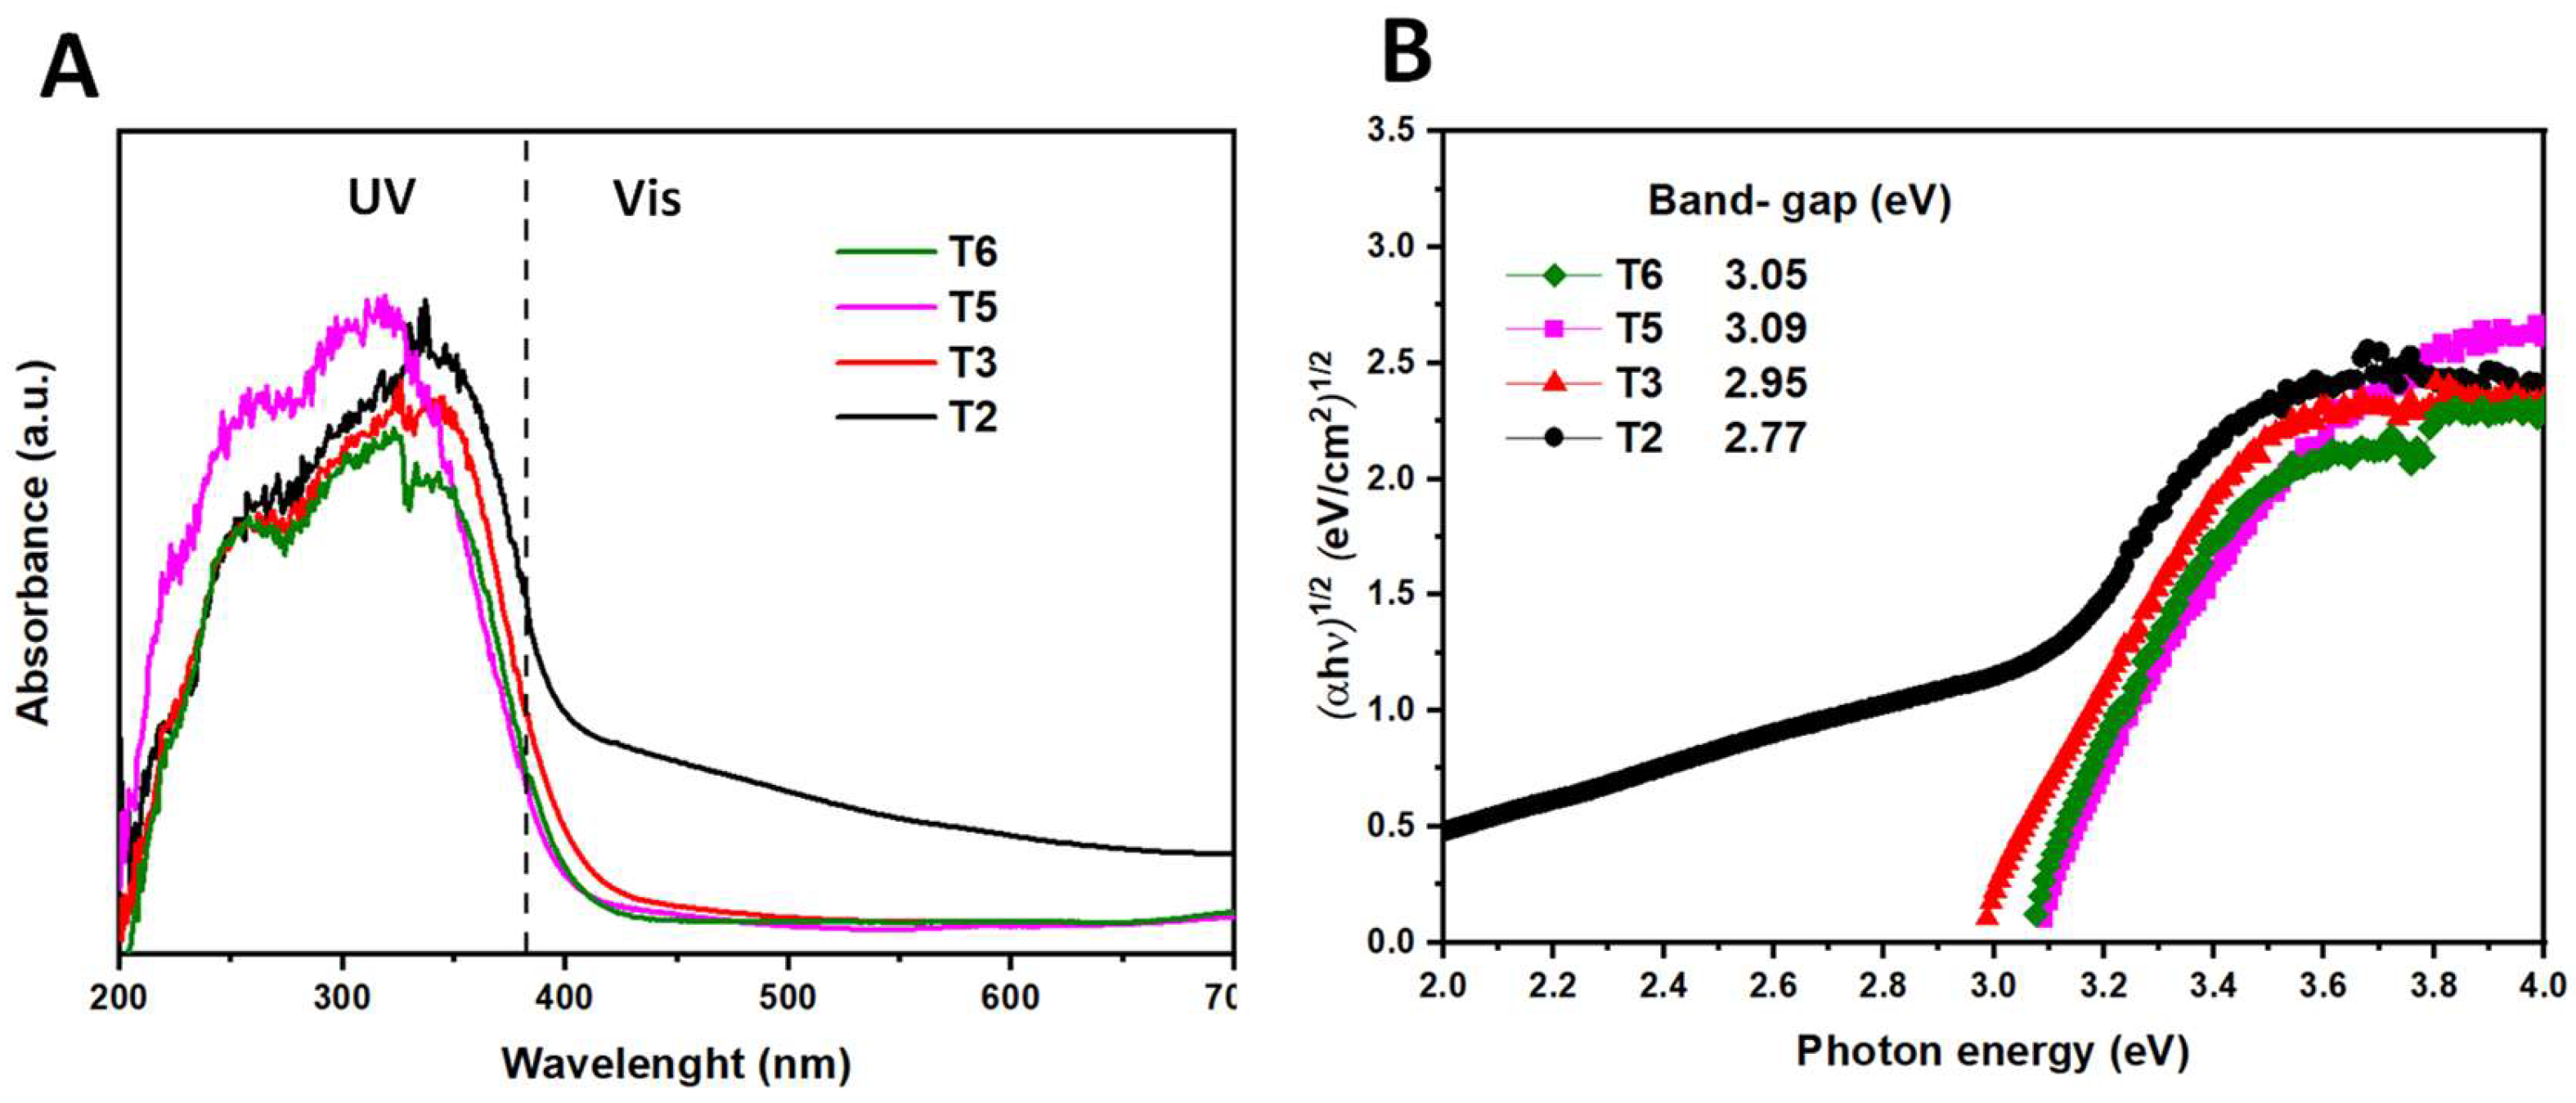
Figure 11.
Effect of the pH value on crystallite size and band-gap of the TiO2 samples.
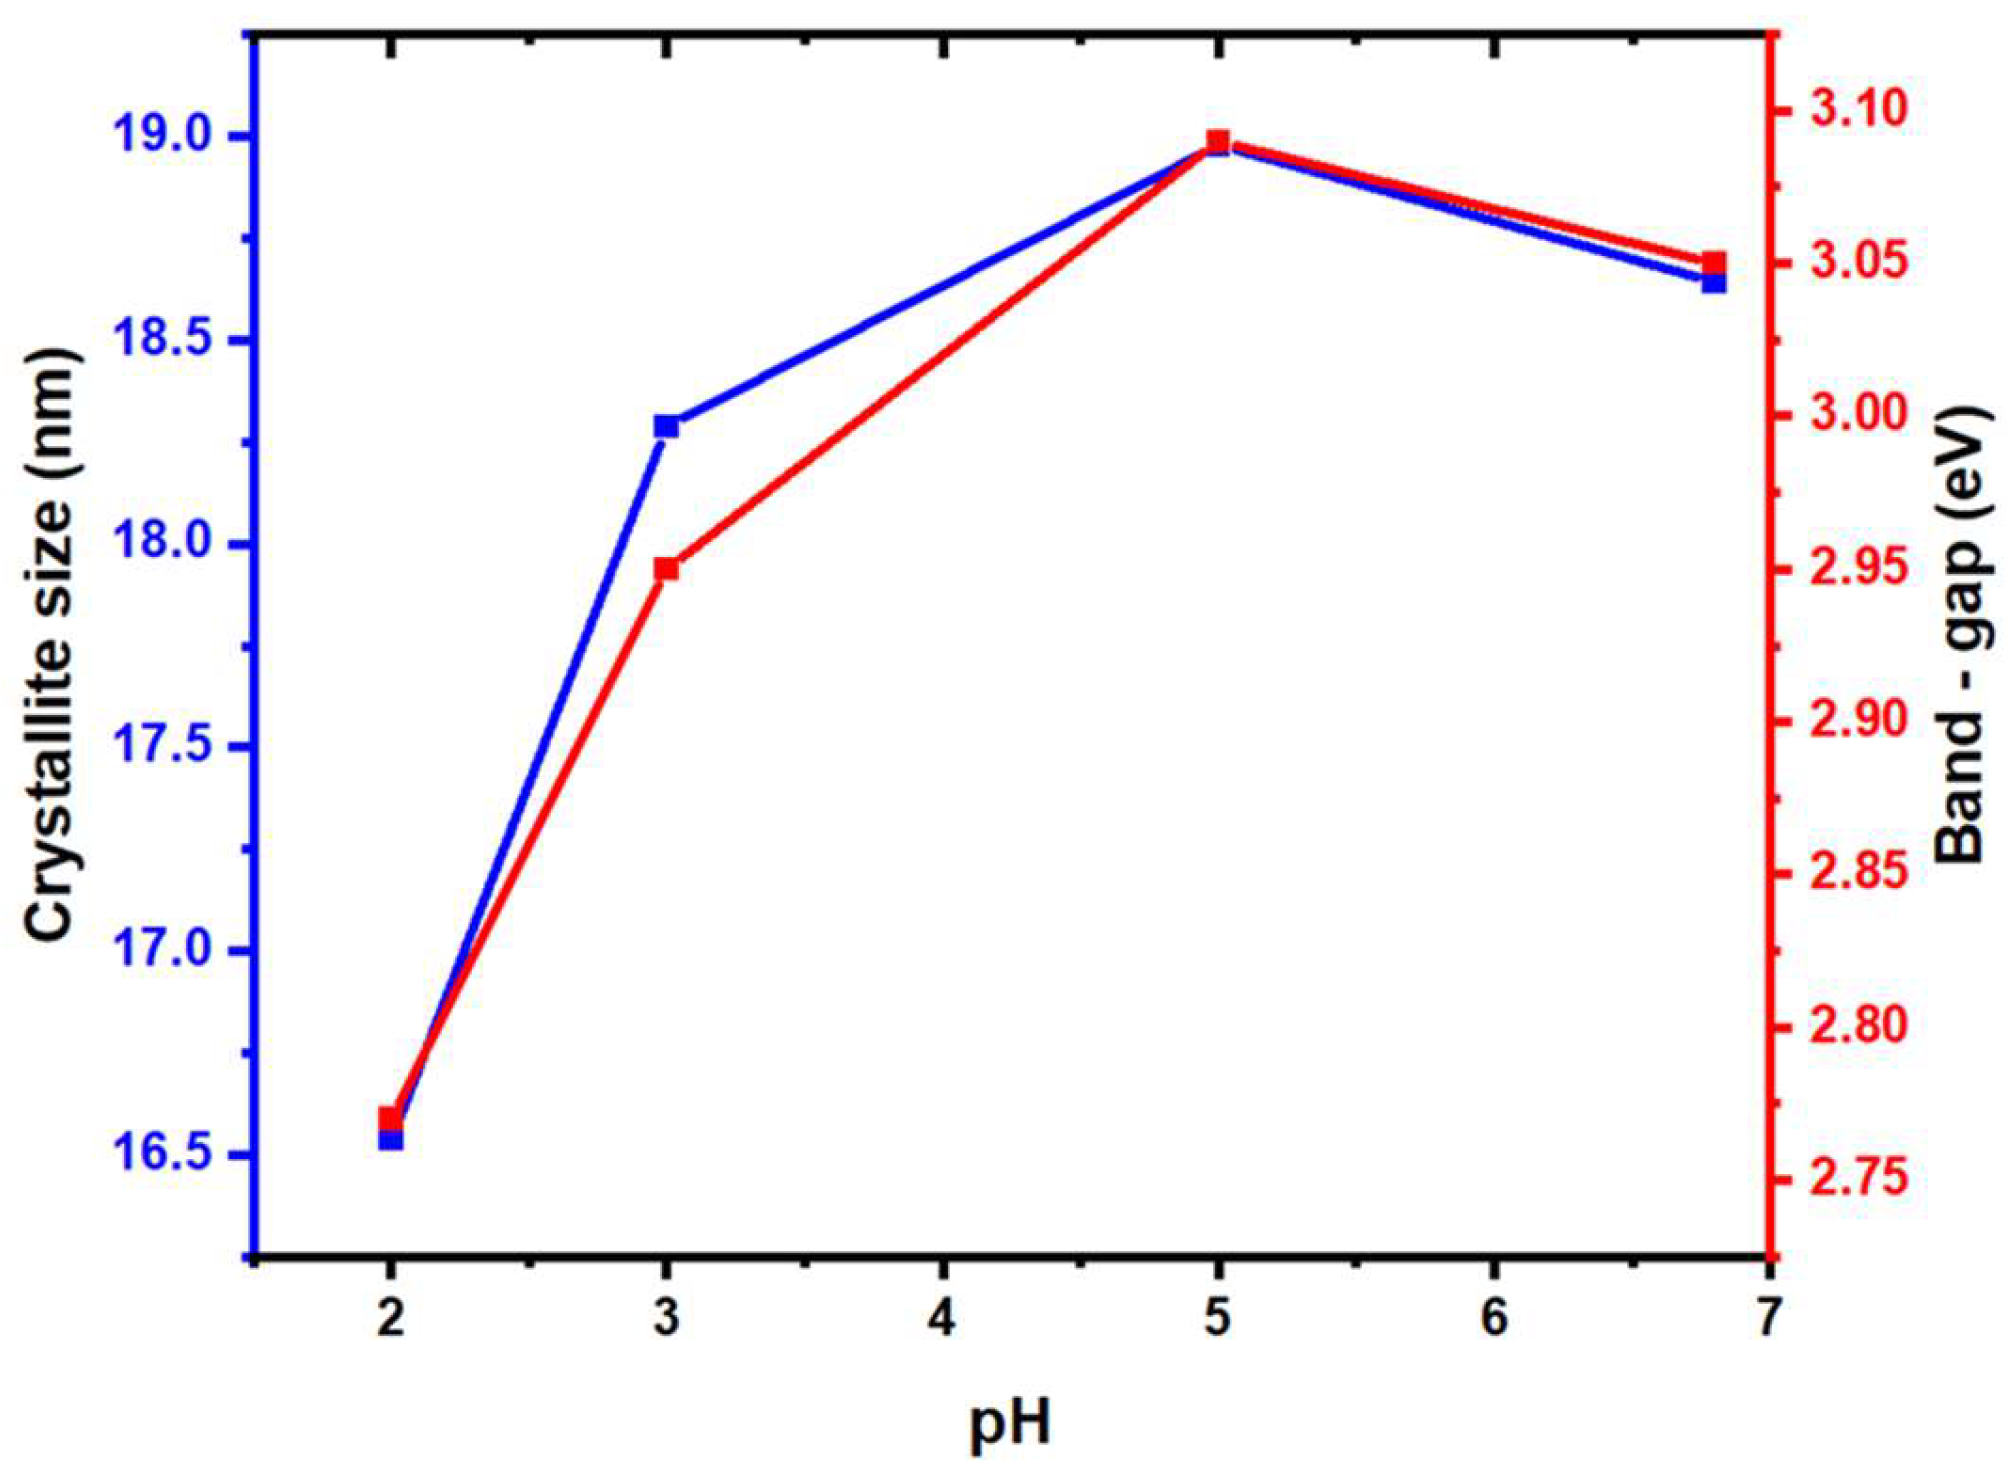
Figure 12.
Photocatalytic activity (A) of MB under natural solar irradiation by the TiO2 samples as a function of irradiation time. Fitting curves of the kinetics of second order (B) MB photodegradation and effect of sample type on the value of the MB photodegradation rate constant.
Figure 12.
Photocatalytic activity (A) of MB under natural solar irradiation by the TiO2 samples as a function of irradiation time. Fitting curves of the kinetics of second order (B) MB photodegradation and effect of sample type on the value of the MB photodegradation rate constant.
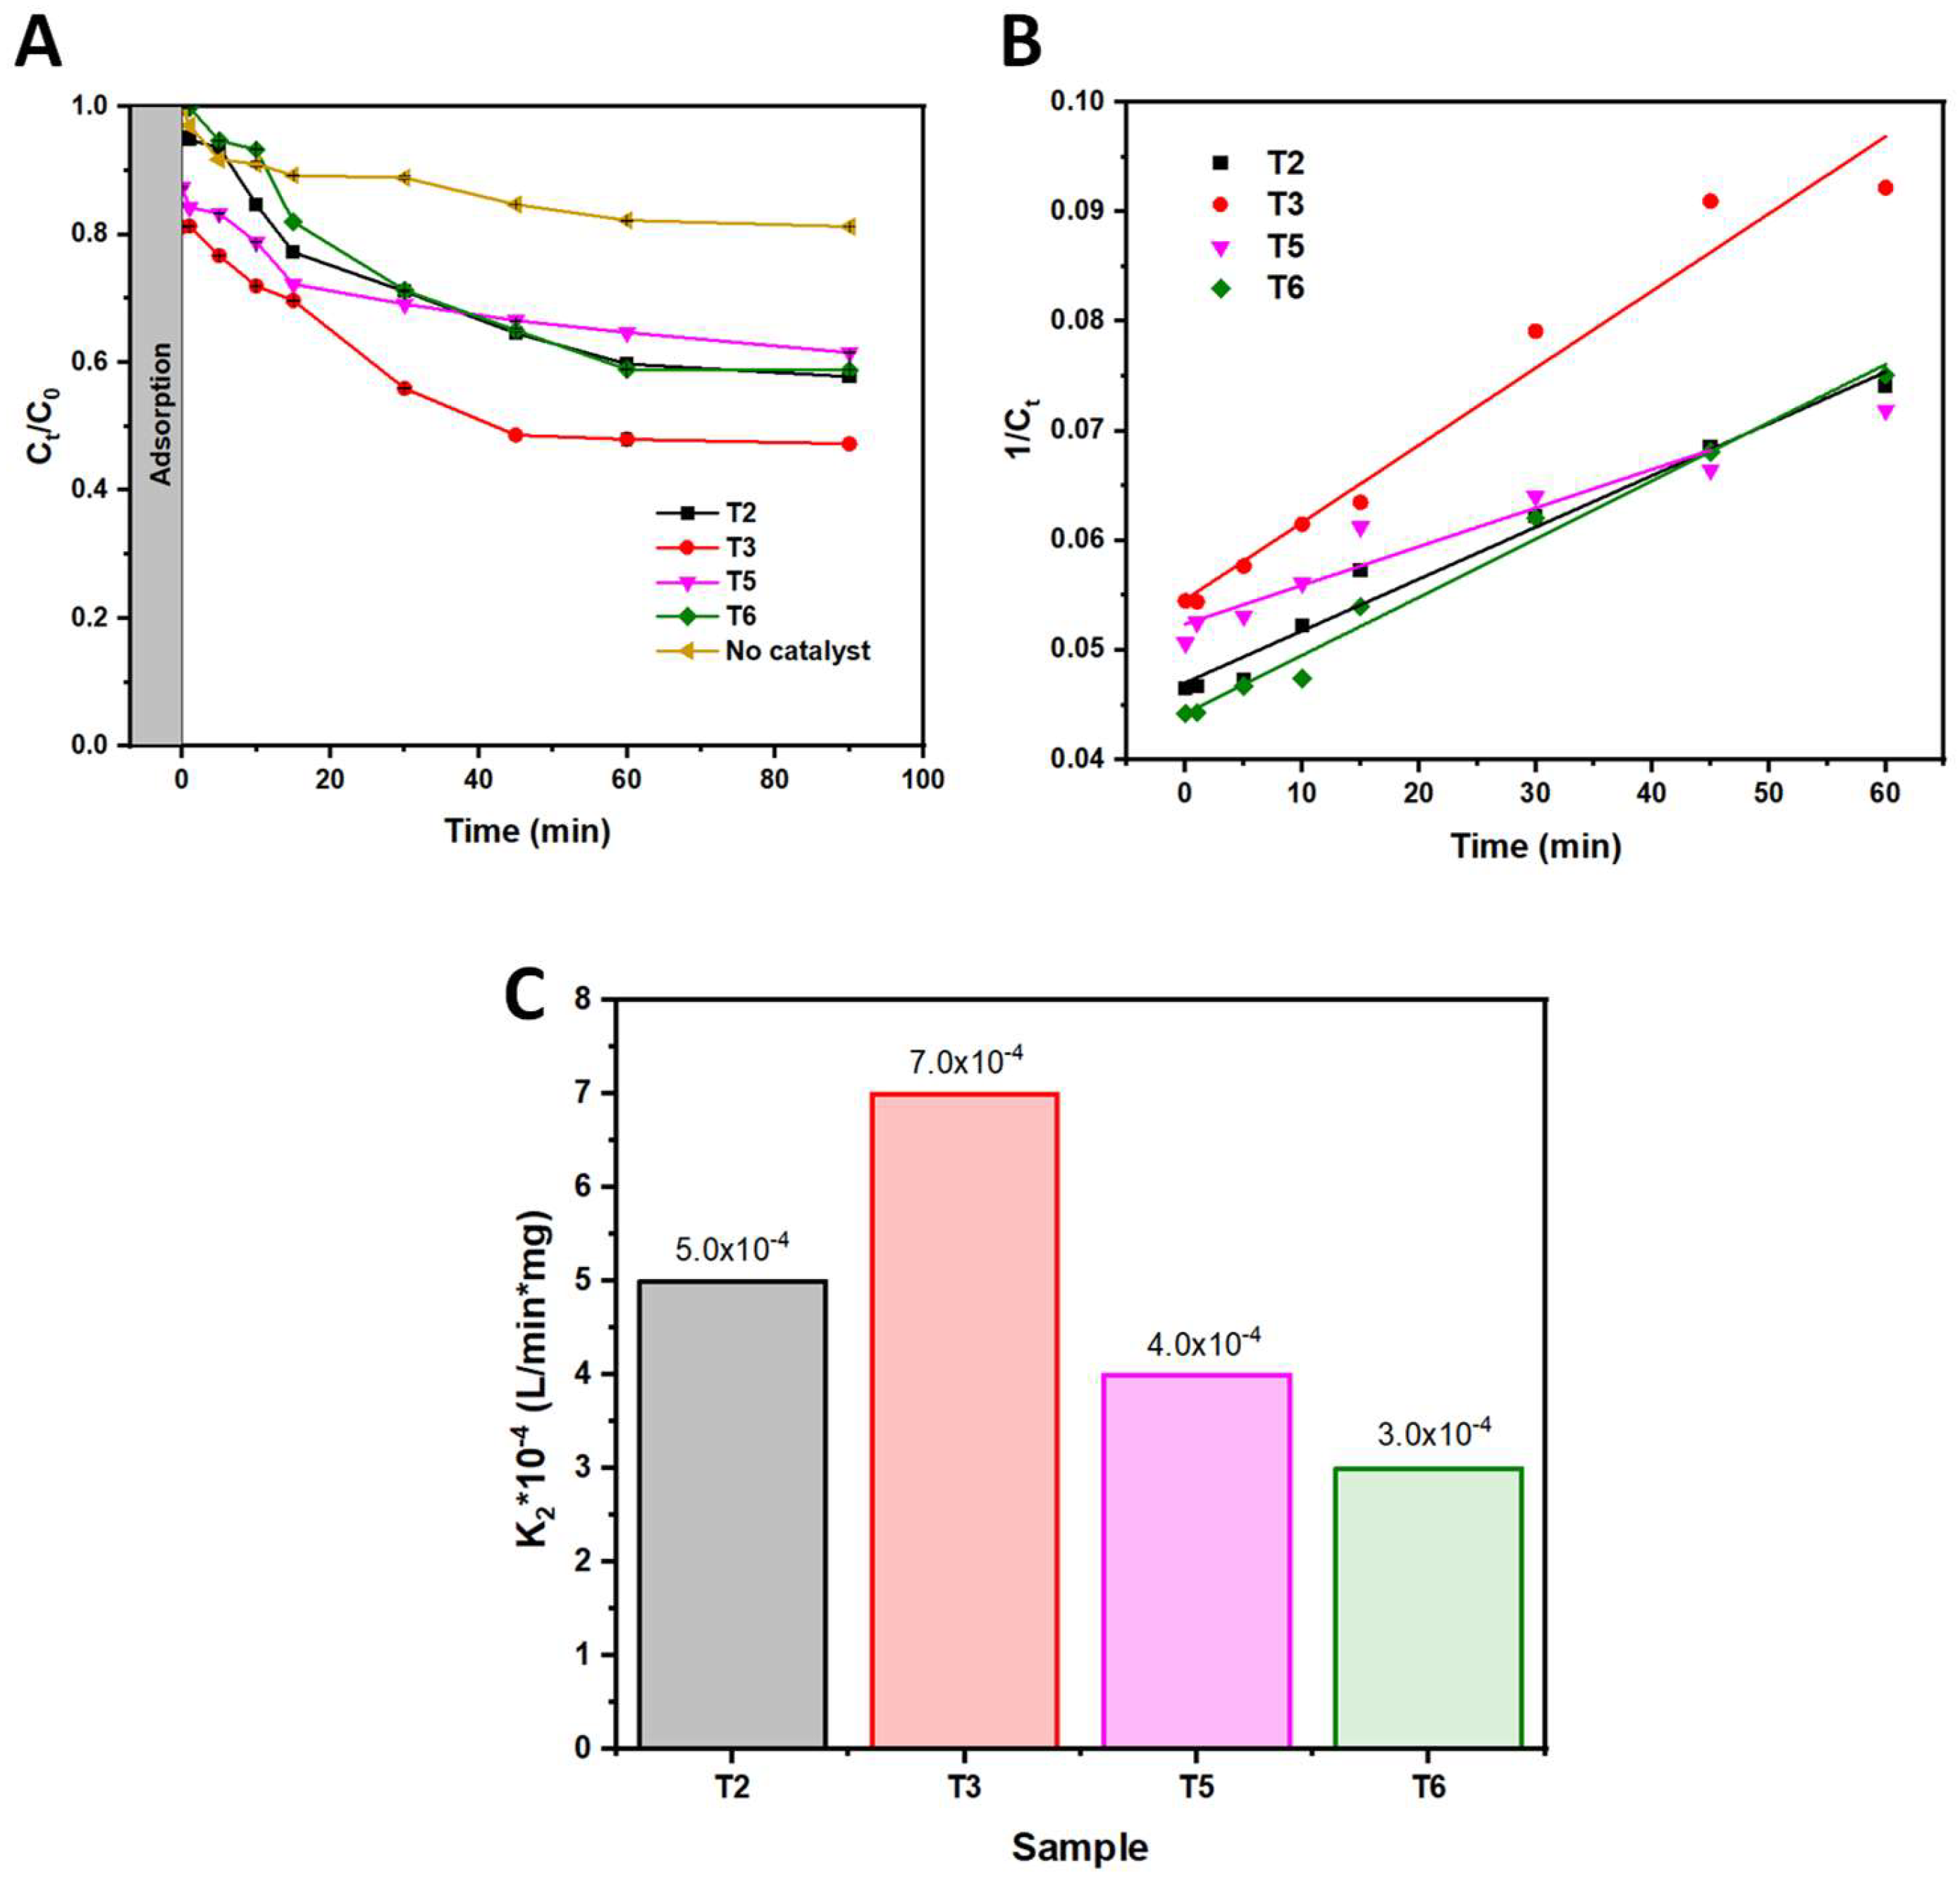

Table 1.
Red parameters of the synthesized samples at different pH values and boundary index of the structural analysis by Rietveld refinement method.
Table 1.
Red parameters of the synthesized samples at different pH values and boundary index of the structural analysis by Rietveld refinement method.
| T2 sample | T3 sample | T5 sample | T6 sample | |
| Space group | I41/AMD | I41/AMD | I41/AMD | I41/AMD |
| a (Å) | 3.7798(4) | 3.7829(3) | 3.7798(4) | 3.7850(2) |
| c (Å) | 9.474(1) | 9.4930(9) | 9.472(1) | 9.482(9) |
| V (Å3) | 135.353 | 135.847 | 135.325 | 136.207 |
| Z | 4 | 4 | 4 | 4 |
|
Ti (4b) Byssus, Oc |
(0, 1/4, 3/8) 0.2523, 1 |
(0, 1/4, 3/8) 0.177, 1 |
(0, 1/4, 3/8) 0.691, 1 |
(0, 1/4, 3/8) 0.465, 1 |
|
O (8e) Byssus, Oc |
(0, 1/4, 0.16508(15)) 0.623, 1 |
(0, 1/4, 0.1658(1)) 0.250, 1 |
(0, 1/4, 0.1658(1)) 0.193, 1 |
(0, 1/4, 0.1613(1)) 0.316, 1 |
| Rp, Rwp, Rexp | 8.26, 8.97, 5.43 | 8.30, 9.13, 4.34 | 3.67, 4.75, 2.80 | 9.86, 10.4, 5.19 |
| x2 | 2.73 | 4.43 | 2.88 | 4.06 |
| % Brookite | 0 | 0 | 11.4 | 15.61 |
Table 2.
Specific surface area (SBET), average pore size and average pore volume of the TiO2 samples synthesized using acetic acid as catalyst by sol-gel method.
Table 2.
Specific surface area (SBET), average pore size and average pore volume of the TiO2 samples synthesized using acetic acid as catalyst by sol-gel method.
| Sample | SBET (m2g-1) | Average pore size (nm) | Average pore volume (cm3g-1) |
| T2 | 232.02 | 3.18 | 0.46 |
| T3 | 138.70 | 5.86 | 0.30 |
| T5 | 118.90 | 12.72 | 0.36 |
| T6 | 79.50 | 10.52 | 0.20 |
Table 3.
Values of determination coefficient (R2) and the velocity constant of MB photodegradation using the TiO2 samples as photocatalysts under natural solar irradiation; 50 mL of MB solution of 20 mg/L; 1.0 g/L of catalyst.
Table 3.
Values of determination coefficient (R2) and the velocity constant of MB photodegradation using the TiO2 samples as photocatalysts under natural solar irradiation; 50 mL of MB solution of 20 mg/L; 1.0 g/L of catalyst.
| Sample | K2*10-4 (L/min*mg) | R2 |
| T2 | 5.0 | 0.9723 |
| T3 | 7.0 | 0.9609 |
| T5 | 4.0 | 0.9074 |
| T6 | 3.0 | 0.9851 |
Disclaimer/Publisher’s Note: The statements, opinions and data contained in all publications are solely those of the individual author(s) and contributor(s) and not of MDPI and/or the editor(s). MDPI and/or the editor(s) disclaim responsibility for any injury to people or property resulting from any ideas, methods, instructions or products referred to in the content. |
© 2025 by the authors. Licensee MDPI, Basel, Switzerland. This article is an open access article distributed under the terms and conditions of the Creative Commons Attribution (CC BY) license (http://creativecommons.org/licenses/by/4.0/).
Copyright: This open access article is published under a Creative Commons CC BY 4.0 license, which permit the free download, distribution, and reuse, provided that the author and preprint are cited in any reuse.


