1. Introduction
The steel industry continually faces challenges related to maintaining product quality amid a complex production process [
1,
2]. In rolling mills, defects may emerge at various stages, from the steel mill through logistics (storage of the billets), rolling, and ultimately sales (storage and transportation of the rolls). Traditionally, experts on the production line classify products using a range of quality labels. The aim of the project proposes an innovative solution: an intelligent assistant capable of replicating these expert decisions before defects occur. The AI tools are widespread along the industry nowadays [
3,
4], so why not using it in this frame?
Recent studies have shown that machine learning approaches can significantly enhance predictive maintenance and process optimization in manufacturing environments. For instance, in [
5] it is demonstrated the effectiveness of a multiple classifier approach, which not only improved failure prediction accuracy but also reduced unexpected downtime and associated costs. Moreover, the integration of cyber-physical systems, as highlighted in [
6], has further driven advancements in Industry 4.0-based manufacturing, enabling a seamless connection between physical processes and digital analytics that supports robust, data-driven maintenance strategies.
Preventing defects is crucial not only for improving profitability by reducing waste and rework but also for significantly lowering CO₂ emissions by minimizing unnecessary production and energy consumption, which is a main theme at the present time [
7,
8,
9]. Furthermore, early detection and prevention of defects help extend the operational life of rolling mills by reducing wear and tear caused by processing faulty materials. The project encompasses the entire pipeline from data acquisition to decision simulation with real data. The system’s main objective is to automate the decision-making process by integrating advanced neural network architectures with event detection and expert knowledge extraction modules. This paper outlines the technical approach and presents the evaluation of the system’s performance, emphasizing both departmental and interdepartmental decision-making, with consequent environmental and operational benefits.
2. Methodology
2.1. Data Acquisition and Preprocessing
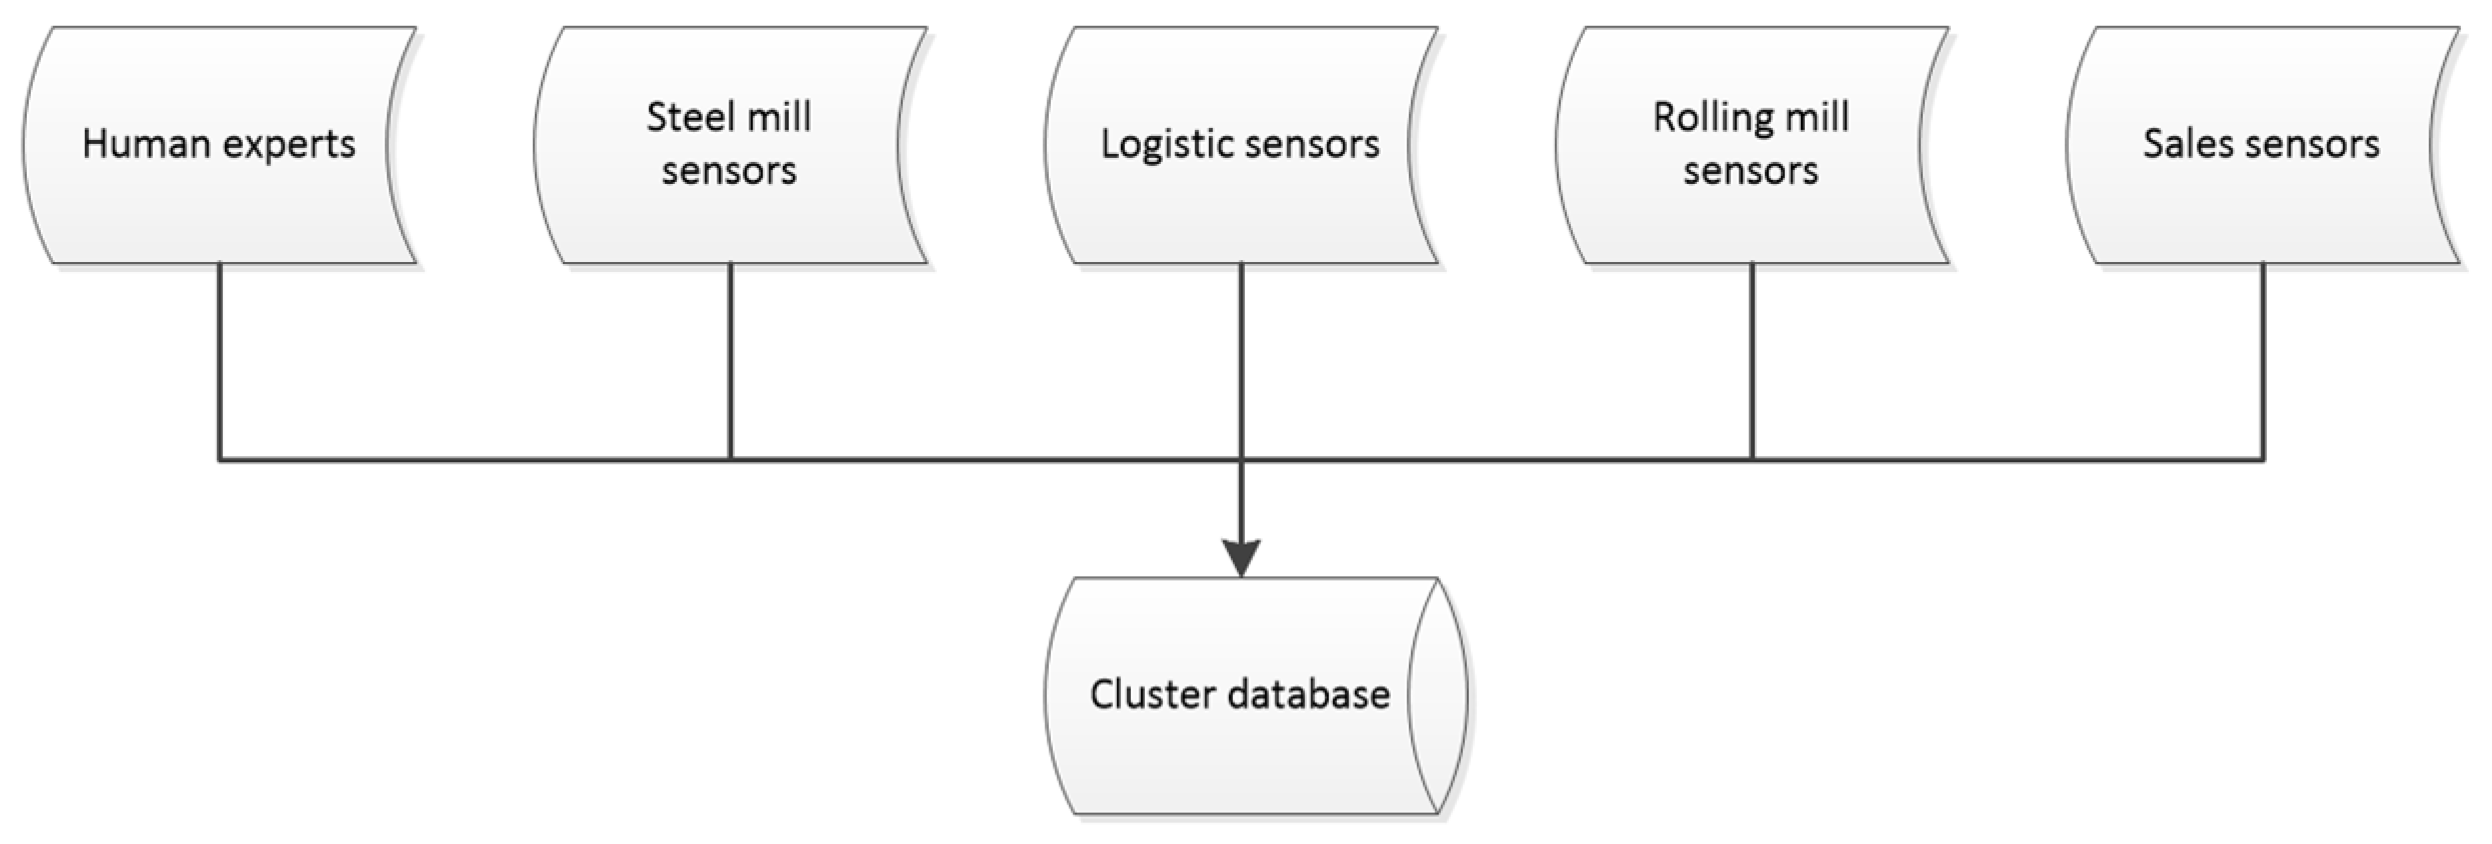
The system begins with the acquisition of heterogeneous sensor data and expert input provided by human experts from each department (steel mill, logistic, rolling mill and sales). Over a period of three years, these experts contributed their decisions and corresponding quality labels, which serve as the foundation for the system’s classification tasks. In parallel, the experts developed ontological rules based on the decisions they made throughout this period through the use of statistical software. These rules were formulated to codify their expert knowledge in some way and guide the automated decision-making process. All of this is submitted in the
Figure 1.
The data, provided by the manufacturer in anonymized form due to NDA contracts, consist of readings from multiple sensors placed along the production process; however, due to anonymization, it is not possible in this paper to identify the specific sensor corresponding to each variable. Certain production stages are equipped with a greater number of sensors and provide more extensive measurement data than others, for example it is obvious that there are more sensors in stages where the material is being transformed (like steel mill and rolling mill) than in stages where the product is being stored or transported.
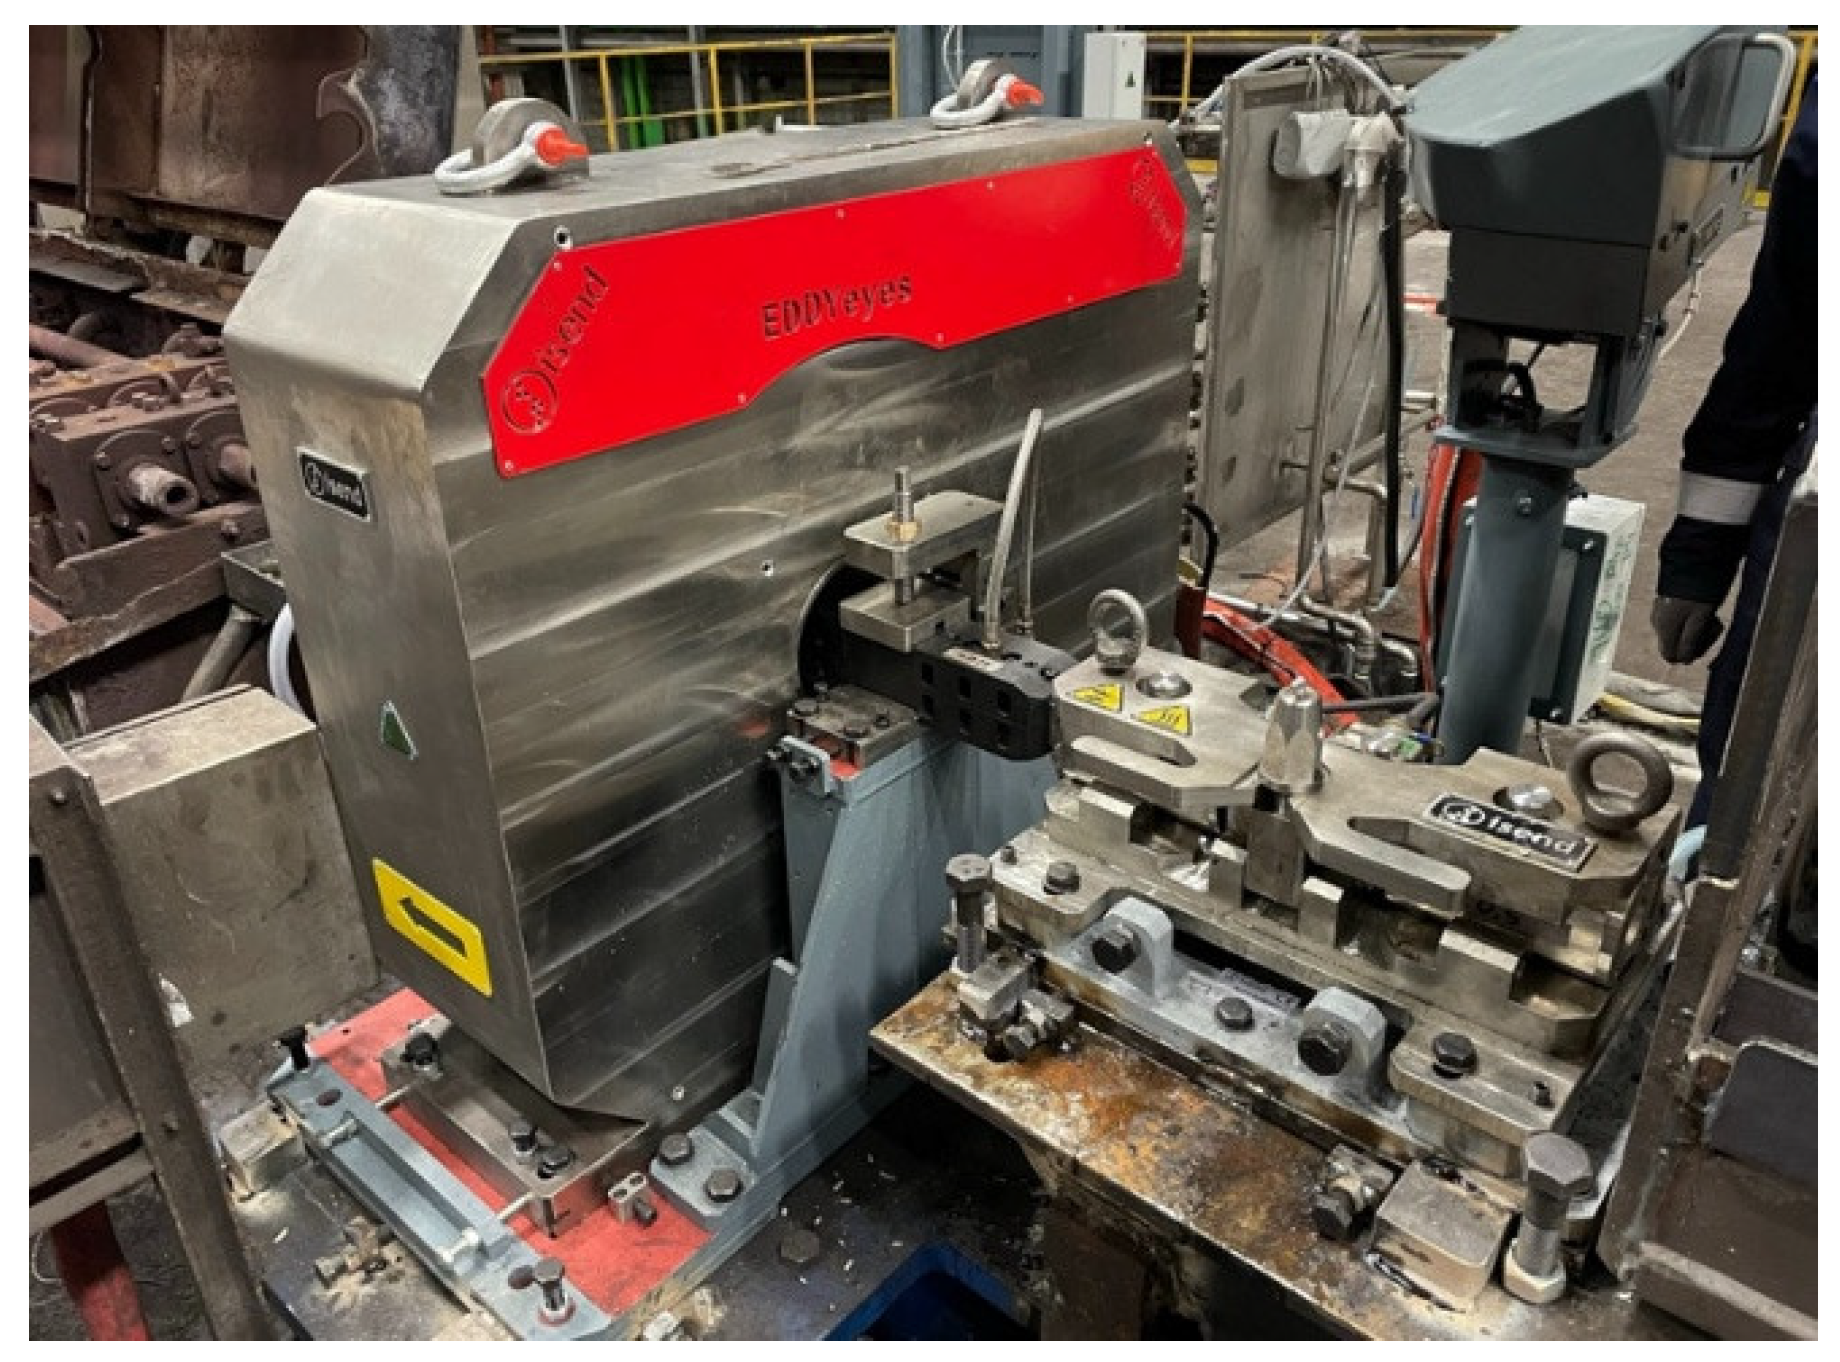
The raw sensor data have been collected in a single CSV file along the three years and segmented according to production stages, adding the defects information provided by the EDDYEyes system of ISEND S.A show in
Figure 2. This is an eddy current system that includes visual information about the defects and is capable of measure the severity of them, this type of technology is one of the most valuables in the steel industry in defect detection [
10,
11,
12]. In this “defectology dataset”, the Quality Indicator (QI) is a critical metric that quantifies the quantity and severity of defects for each billet/roll.
Regarding data preprocessing, outliers that were deemed too obvious have been eliminated. Moreover, the data have been processed to ensure that they are easily interpretable by any algorithm (through normalization of the dataset and encoding of some variables). Notably, only one value per variable is recorded for each product, as the values hardly vary during the manufacture of each billet or roll. This uniformity greatly facilitates both the analysis and subsequent processing of the data.
2.2. Event Filtering and Expert Knowledge Extraction Modules: Structure and Operation
To address the twin challenges of detecting sensor anomalies linked to quality degradation and extracting information from the labels chosen by the human experts, this part of the system was built using a two-module architecture. The design of these modules was driven by the need for flexibility, clarity, and scalability, leading to a final structure comprises two distinct but complementary pipelines.
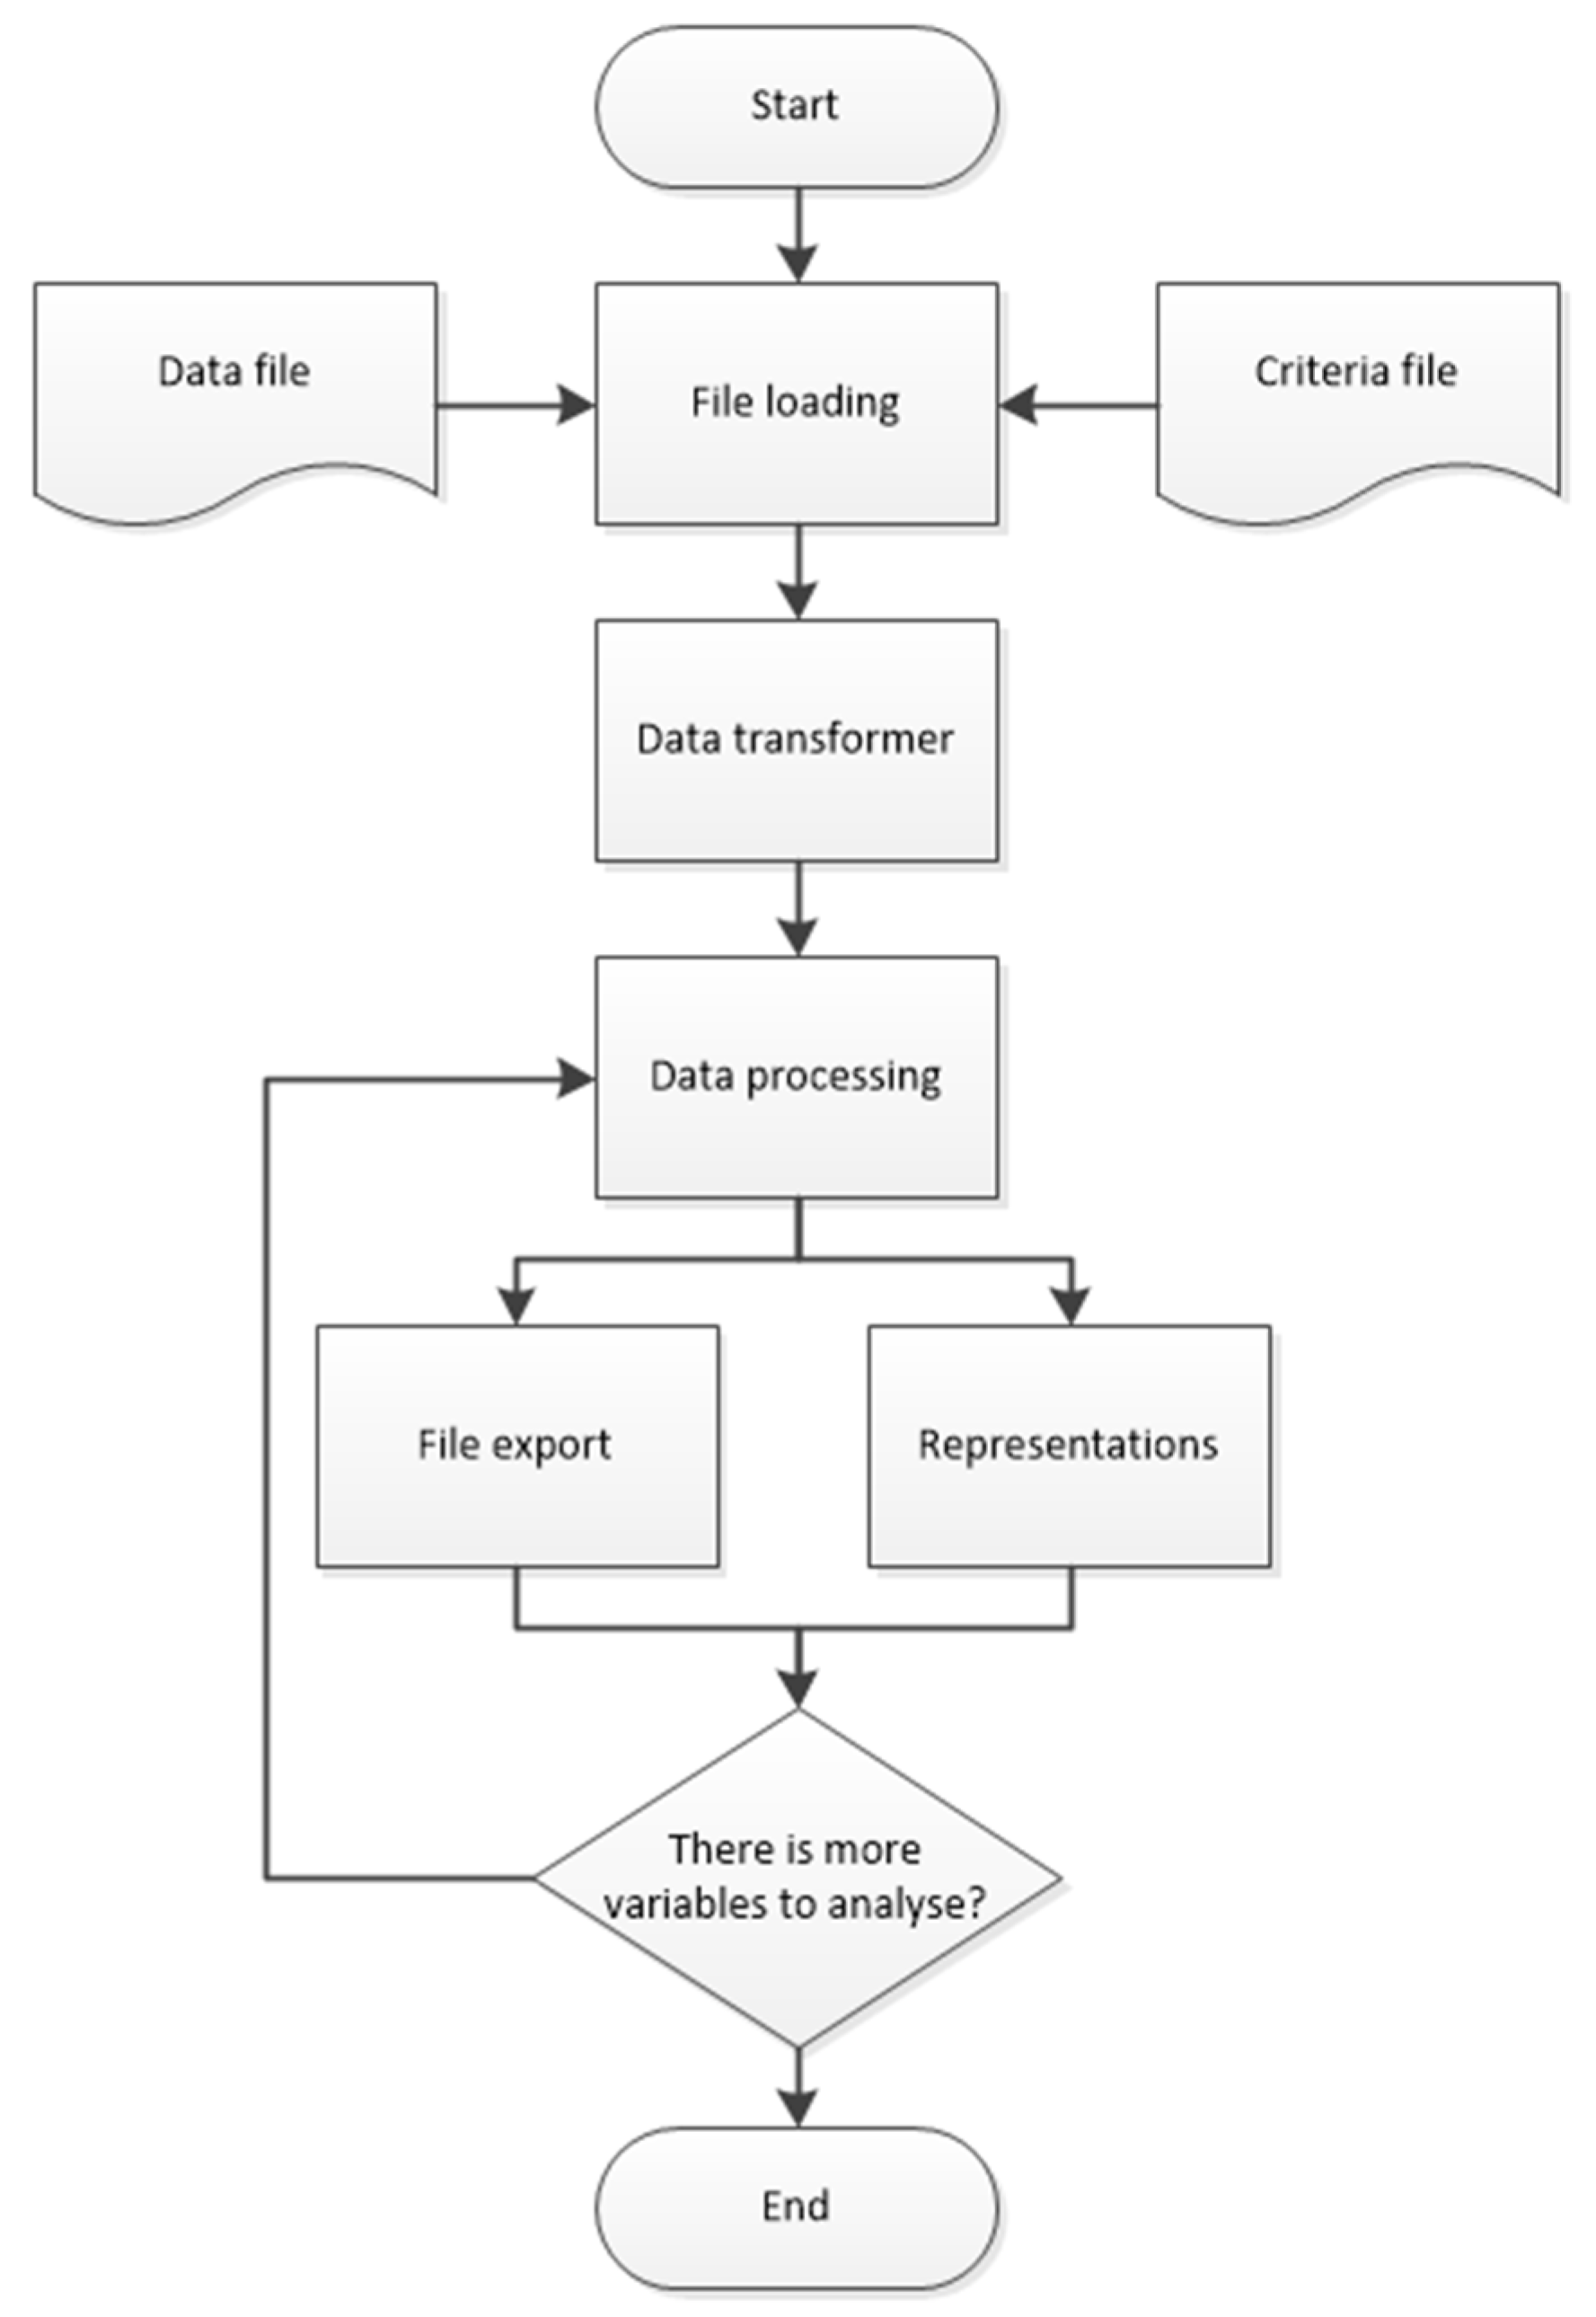
2.2.1. Event Filtering Module
The objective of this module is to process raw sensor data and identify significant deviations that may indicate a potential drop in product quality. This is critical because even slight deviations (when sustained) can signal underlying issues that affect the final quality of the steel product.
The module is architected as a multi-stage pipeline with clear separation of responsibilities.
Reads raw CSV data and a complementary criteria file (which defines the expected data types, valid ranges, and grouping intervals). This ensures that all incoming data meet predefined standards.
Corrects any formatting inconsistencies and applies basic corrections as needed. This step ensures the data’s integrity preserving the raw relationships for later processing.
The data is segmented into fixed time windows (typically 4-hour windows, limited to the most recent 100 points) to capture temporal behavior while smoothing out transient fluctuations.
Within each window, statistical metrics (e.g., minimum value, mean, and standard deviation) are computed. A logarithmic transformation is applied for smoothing, and an anomaly is flagged when the window’s value exceeds the mean plus three standard deviations (this is the criteria adopted to obtain satisfactory results). A threshold of at least 10 anomalous points is enforced to eliminate spurious spikes.
The final output is twofold: a CSV file that adds to the original dataset Boolean flags (indicating the presence of anomalies) and graphical representations for quick visual analysis.
This modular design, whose operation is illustrated in
Figure 3, was chosen to isolate each processing step, thereby increasing maintainability and allowing independent tuning or replacement of submodules. The clear delineation between file handling, transformation, windowing, and statistical detection ensures robustness and scalability. It also facilitates debugging and further enhancements as new types of sensor data or criteria emerge.
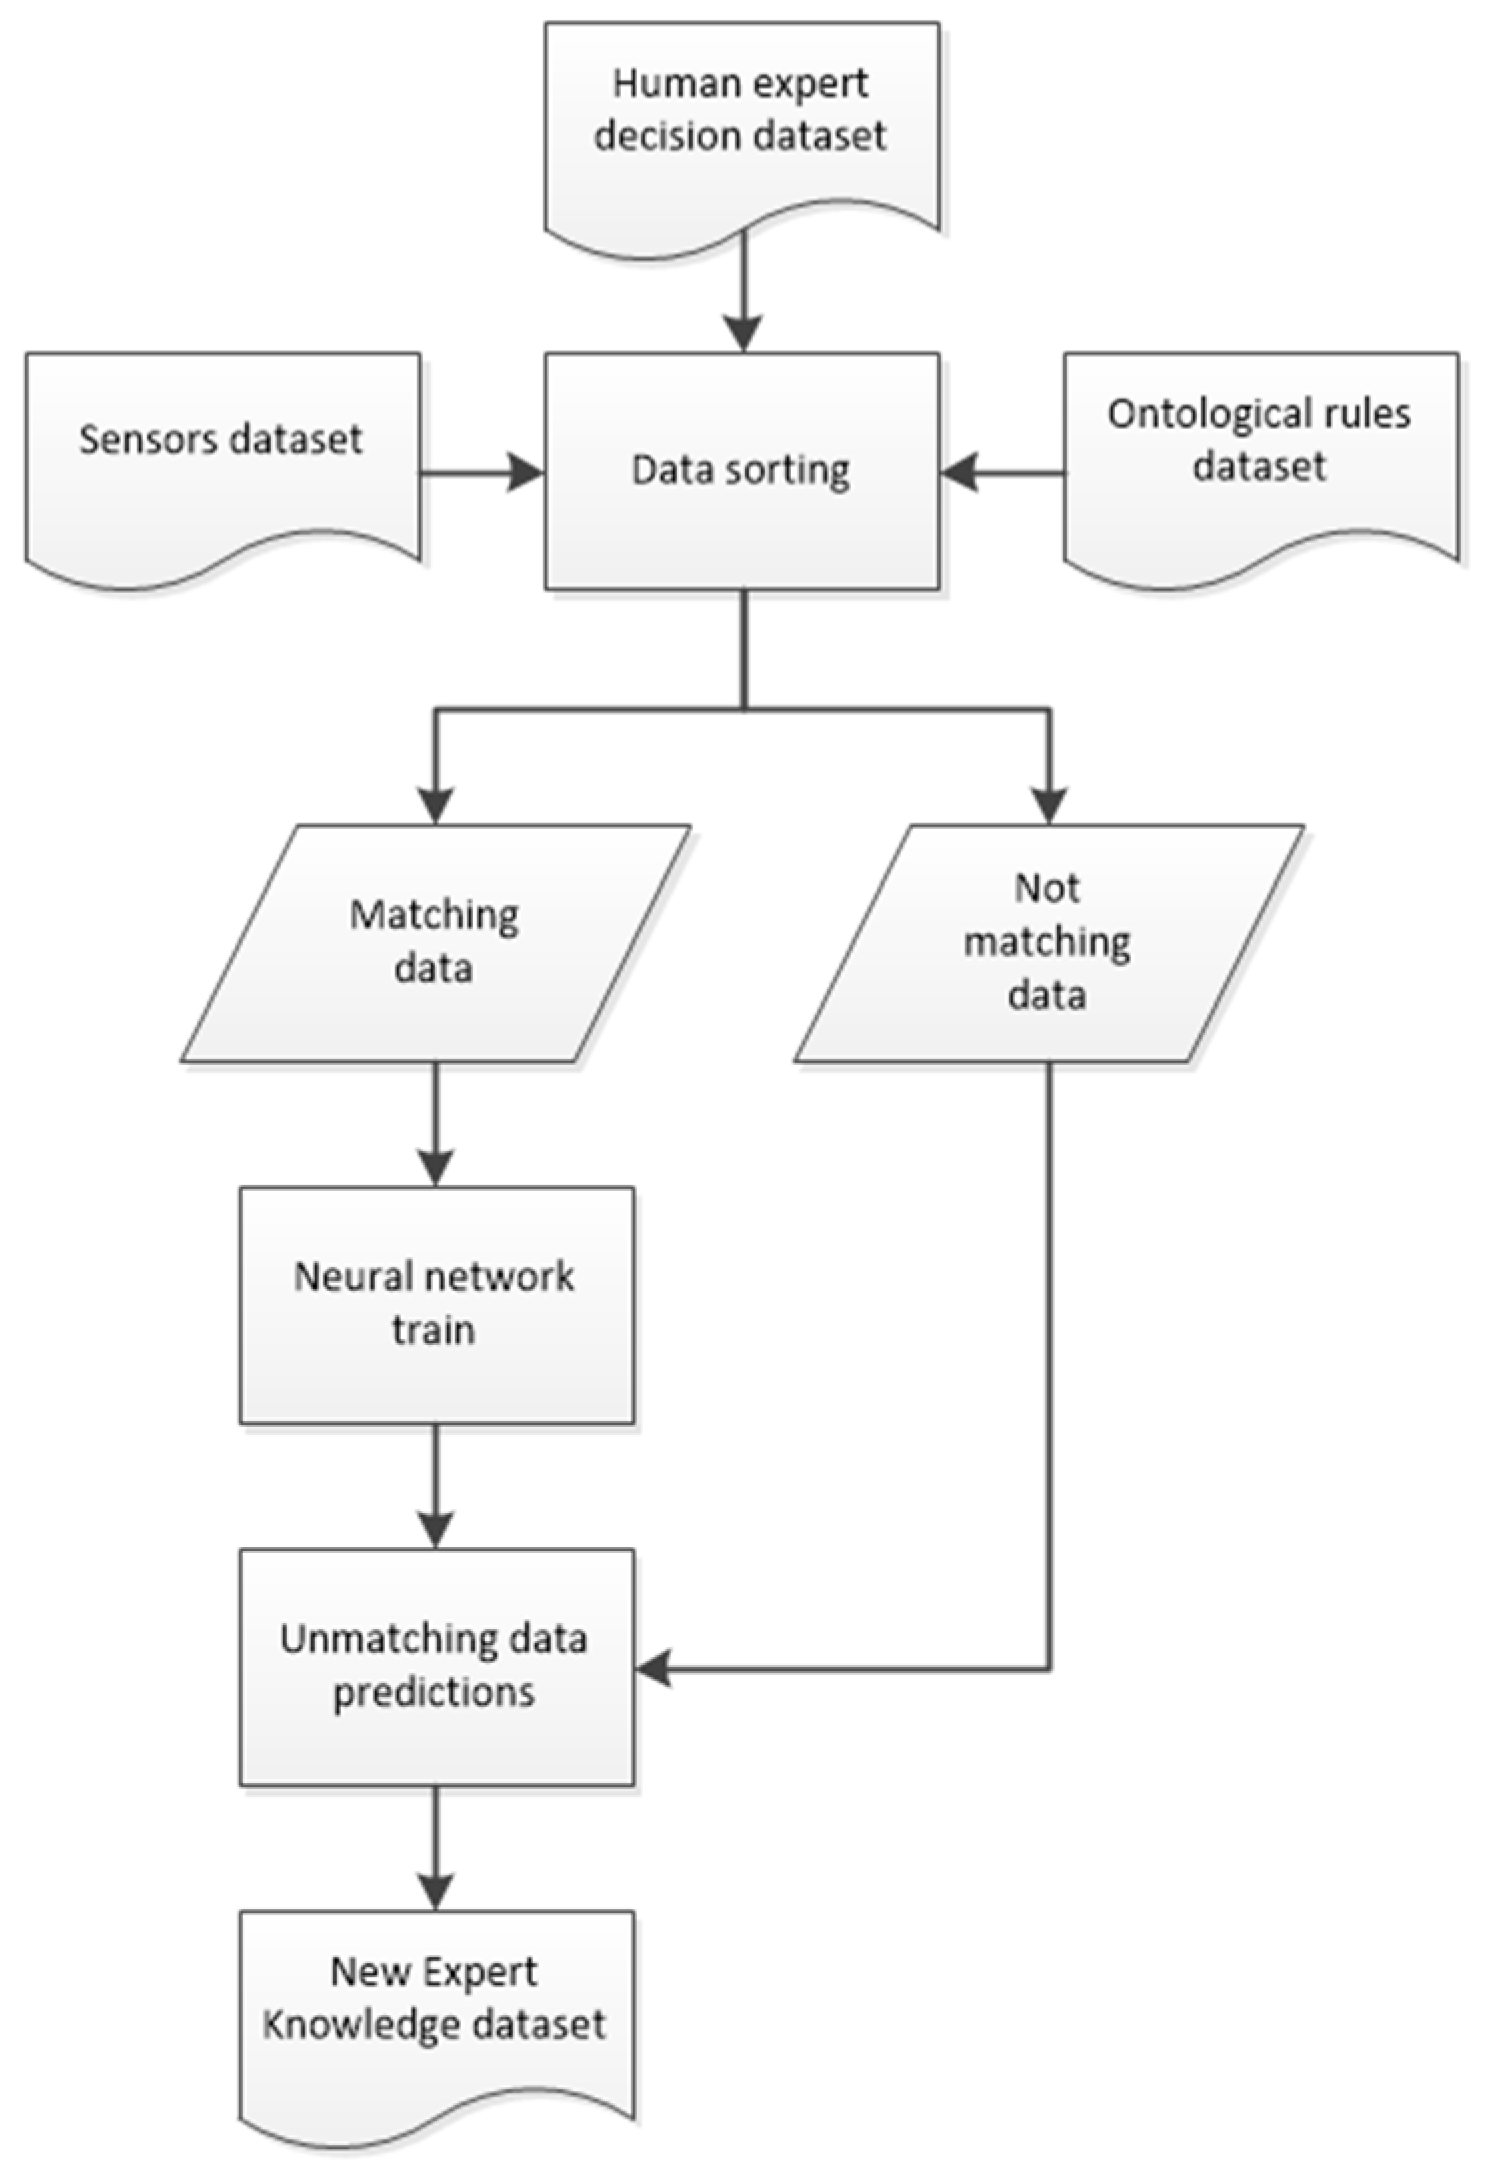
2.2.2. Automatic Expert Knowledge Extraction Module
Parallel to anomaly detection, it is necessary to extract and codify the decision-making process of human experts. Over three years, experts in each department have provided quality labels and developed ontological rules to guide their decisions. This module’s purpose is to analyze these expert decisions, compare them against the formal rules, and generate a refined knowledge database. This module is organized in a sequential pipeline.
Historical records of expert decisions are collected along with the ontological rules that were formulated concurrently. By combining these two sources, the module ensures that both practical decision outcomes and formalized expert knowledge (the rules) are represented.
The module compares the decisions made by experts with the outcomes predicted by the ontological rules (it is important to note that ontological rules are statistical representations of the choices taken, but their results don’t have to overlap with the decisions). Instances of coincidence, discrepancy, or missing rule output are identified.
In cases where the ontological rules do not generate a clear decision or when discrepancies arise the module applies techniques based on neural networks to refine the rule set, this approach has been widely used in industry for its ability to learn from complex data [
13]. This step is critical for trying to determine what the “ideal” decision would be given the complete set of sensor inputs. We must to take into account that we should not in any case contradict a bad quality label from the human experts, the aim of the module is being even more restrictive than the human experts learning from the knowledge of them.
The refined decisions, now aligned with both sensor data and expert insight, are compiled into a new CSV file that can be added easily to the knowledge extraction module database. This final database is then used to train the neural network inference modules (departmental and interdepartmental decision taking), ensuring that the system learns an accurate representation of expert decision-making.
This structure of the expert extraction module is represented in
Figure 4 and was chosen to address the inherent complexity of human decision-making. The human expert’s decisions are mostly influenced by the visual inspection of the product and the information given by the EDDYEyes system developed by ISEND S.A. so the decision is not influenced at all by the sensors information, making the extraction of expert information a complex task. By separating data collection, discrepancy analysis, and output generation, the module allows for a systematic and iterative improvement of the knowledge base. This design enhances transparency, making it easier to pinpoint where expert judgments diverge from formal rules, and supports continuous refinement. Ultimately, the refined database serves as the cornerstone for training our decision-making models, ensuring that they can replicate expert decisions or even improve them.
Together, these two modules form the backbone of the acquisition and treatment of the data recollected. Their carefully engineered modular architectures not only provide clear operational benefits but also ensure that each stage of processing whether filtering anomalies or extracting expert knowledge can be independently optimized and updated as needed in the future. This design was essential to handle the diversity of sensor data and the complexity of expert decision patterns in a robust, scalable manner.
2.3. Departmental and Interdepartmental Inference Modules: Architecture, Operation and Justification
The motivation behind these inference modules is twofold. At the departmental level, our goal is to replicate indeed, anticipate the decisions made by human experts. In each production stage, experts assign quality labels based on the apparent final quality of the material. By forecasting sensor data and processing event information, our system can predict these quality labels before the product is processed, avoiding the manufacturing of low-quality product that would be scrapped. On the other hand, the interdepartmental module will be in charge of integrating outputs from the different stages, allowing us to identify the root causes of quality degradation, facilitating targeted corrective actions and collecting new information that could be used to re-train the departmental modules in the future.
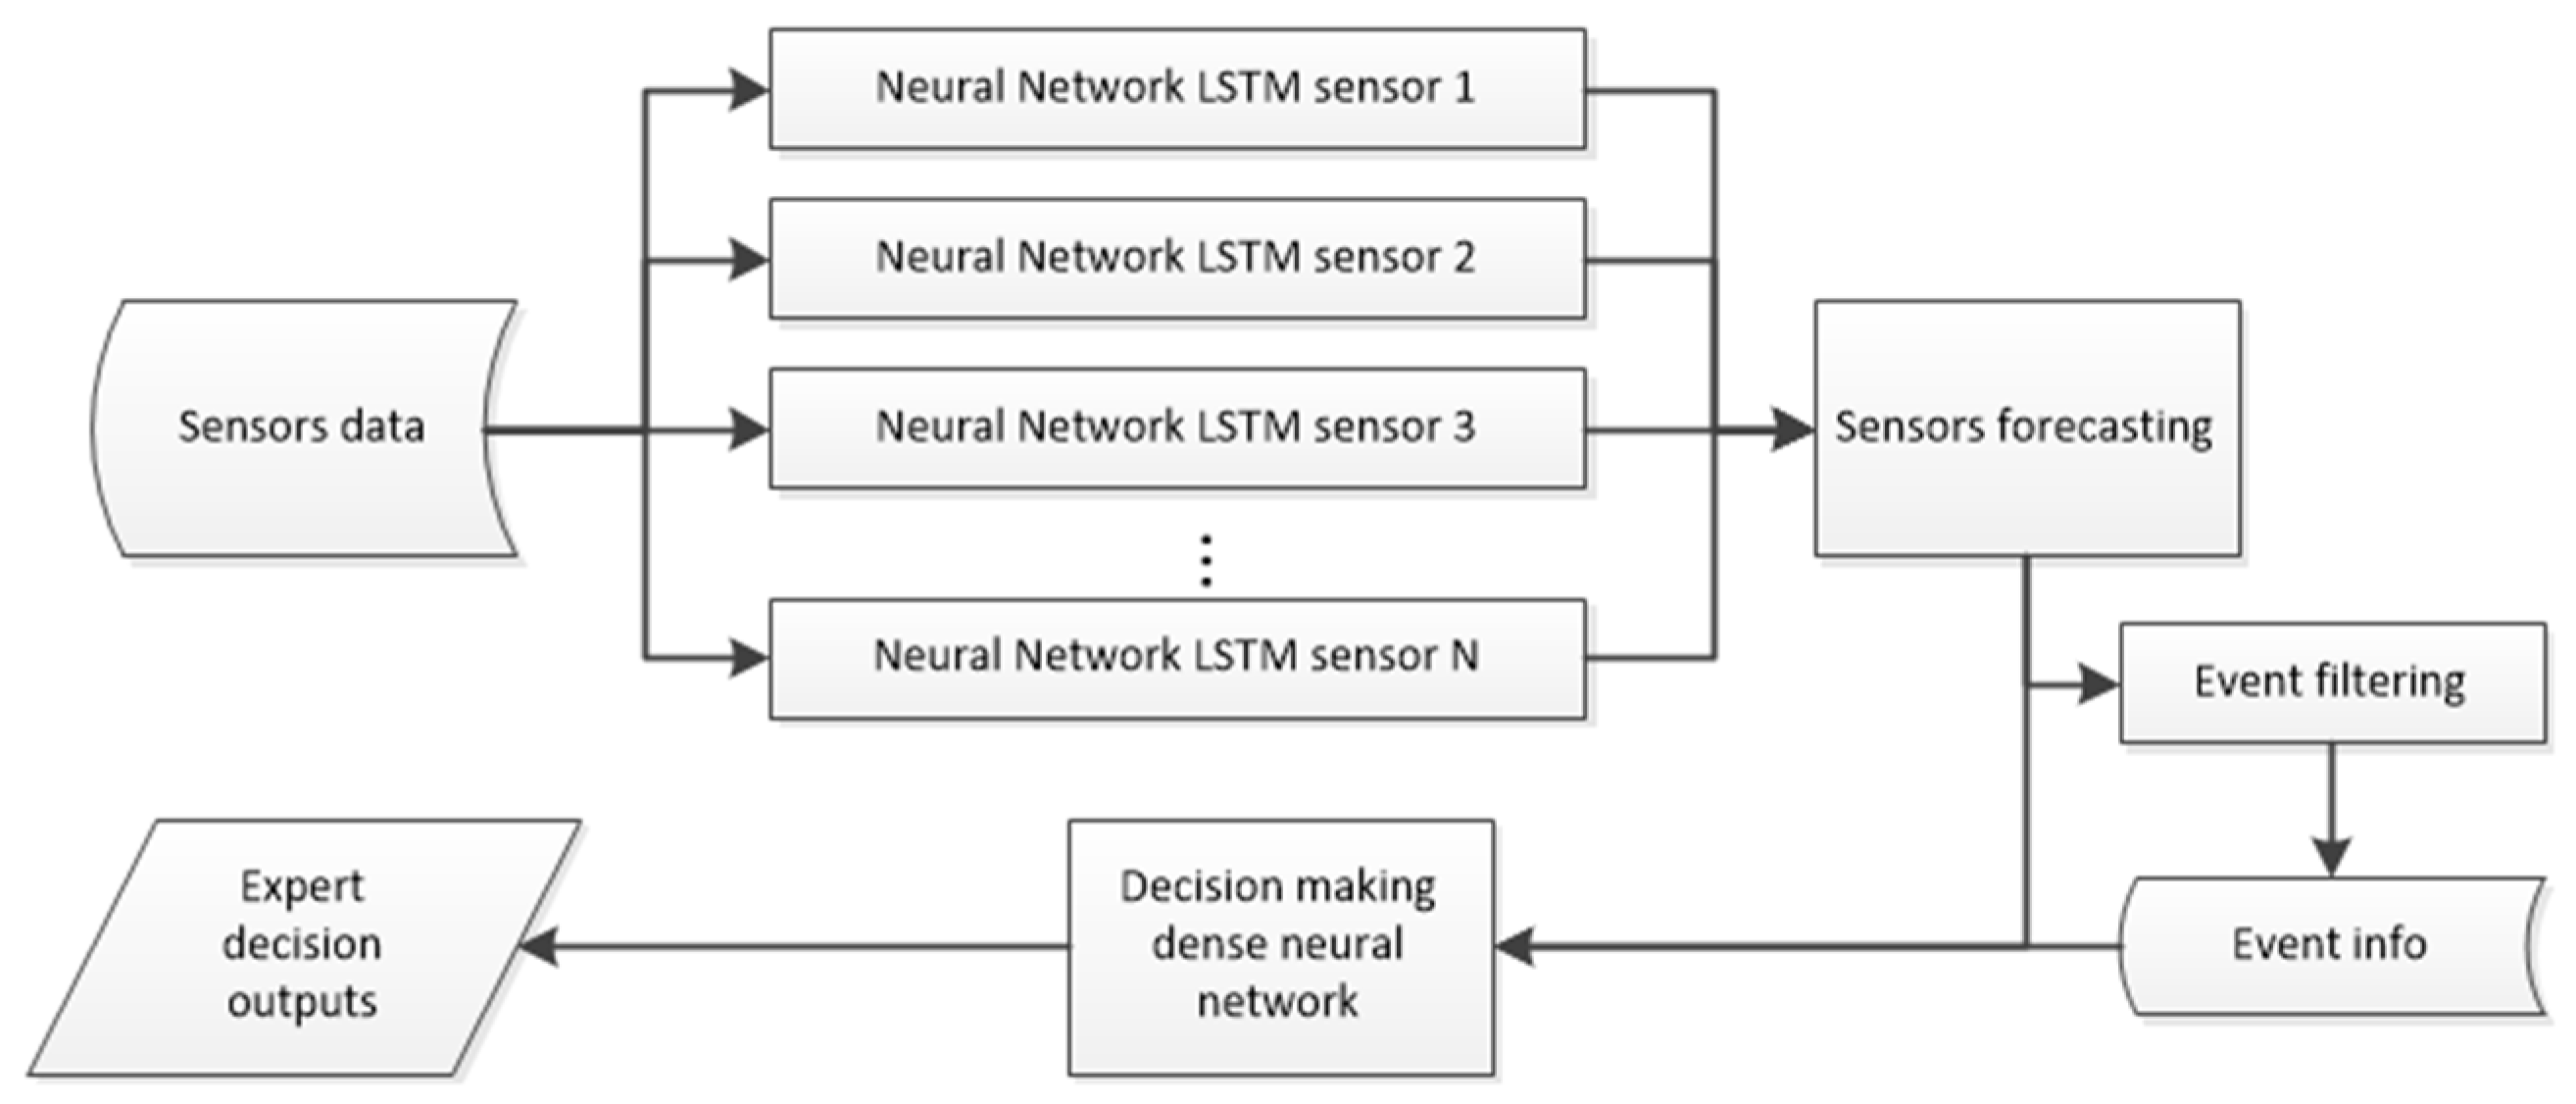
2.3.1. Departmental Inference Module
Each departmental module begins by processing pretreated sensor data using Long Short-Term Memory (LSTM) networks. The data, organized into fixed-length windows (for example, 50-time steps), are input to the LSTM network which forecasts future sensor readings and process characteristics.
LSTM networks were chosen for their proven ability to capture long-term dependencies and temporal patterns in sequential data, this is widely proven in the industry [
14,
15]. This property is critical in our context since sensor values remain nearly constant for each billet or roll; however, there exist fluctuations between products and if this fluctuation follows the same tendence for a while the deviation will be evident, and we have to take in account that even small deviations sustained over time may indicate an impending quality issue. The attention mechanisms help the network focus on the most relevant segments of the time window [
16], ensuring that subtle yet critical deviations are not overlooked.
The predictions from the LSTM component, along with Boolean flags generated by the event filtering module in these predictions, serve as input to a Multilayer Perceptron (MLP), this structure is explained in
Figure 5. The MLP is trained using as targets historical expert decisions and the ontological rules formulated by those experts through the outputs obtained in the expert knowledge extraction module. This network processes the multidimensional input through several dense layers with non-linear activation functions (e.g., ReLU) and ultimately outputs a categorical quality label (such as OK, BLOCK, ALARM, SCRAP, etc.).
The choice of an MLP for decision emulation stems from its capacity to model complex, non-linear relationships between sensor forecasts and expert-derived quality labels. By integrating the outputs from the LSTM network and the filtered anomaly events, the MLP captures the interactions between multiple sensor variables and decision criteria. This layered approach not only mirrors the human expert’s process but also provides the anticipatory power required to trigger early corrective actions.
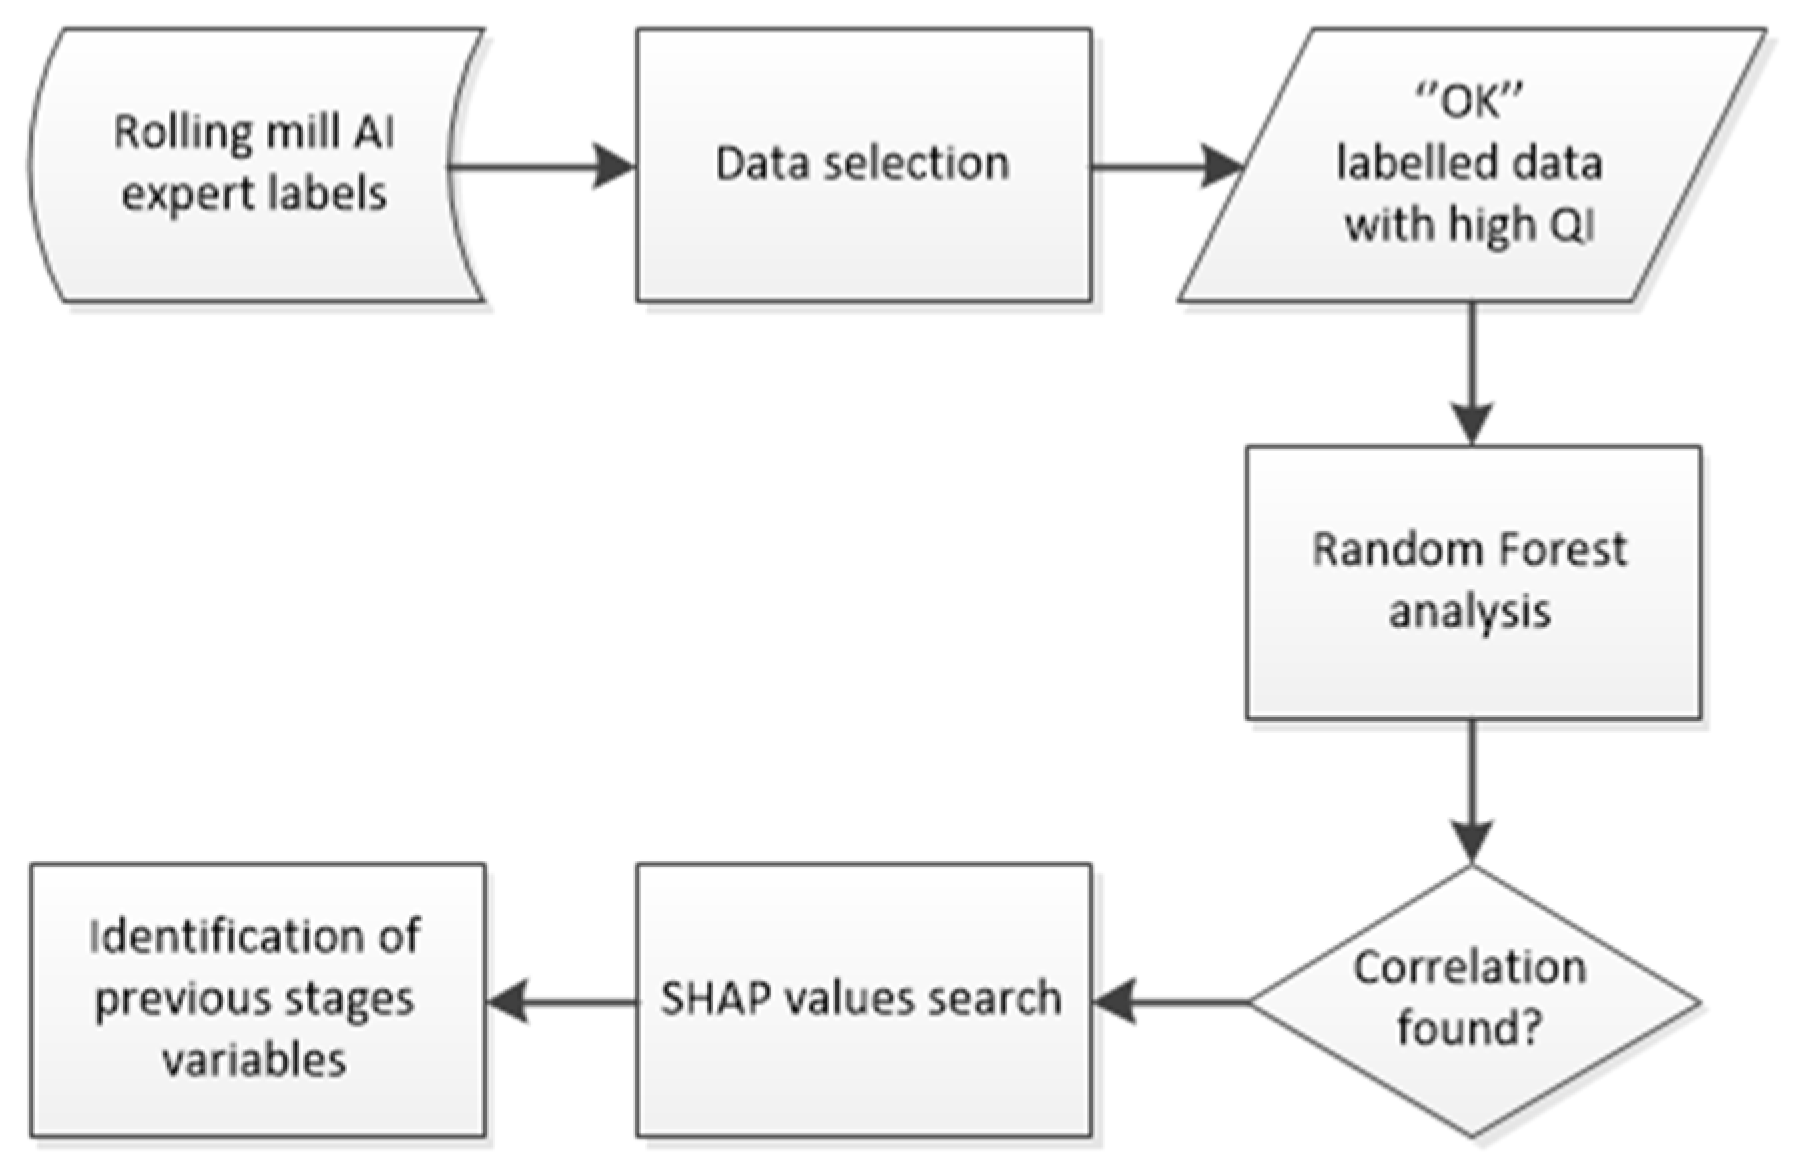
2.3.2. Departmental Inference Module
The interdepartmental module aggregates the outputs from the departmental modules. It employs a Random Forest algorithm to analyse the combined data specifically correlating predictions and quality labels from earlier stages (such as steel mill and logistic) with the final quality outcomes observed in later stages (like rolling mill). This module uses ensemble methods to compute the importance of various features and to determine which preceding factors most significantly contribute to defects at later stages in batches of the chosen size as shown in the
Figure 6. With the departmental module we have known the relevant features for the final label in each stage, but the aim of the interdepartmental module is refining the departmental module by differentiating the bad labels at every stage that have no reason with the variables of the stage itself. Applying techniques such as SHAP (SHapley Additive exPlanations) to render the decision process of the random forest interpretable allow us to determine if the most relevant variables for the bad labelling comes from the current stage or from a previous stage, thereby highlighting the key variables that drive quality outcomes.
Random Forests were selected for their robustness in handling heterogeneous and high-dimensional data, but the main reason of the choice was the facility to interpret the main features that drives the decision making [
17,
18]. The ensemble approach reduces overfitting and enhances generalization, which is essential when linking subtle sensor anomalies from early stages to downstream quality issues. Moreover, the interpretability of Random Forests through feature importance and SHAP values enables process engineers to understand the root causes of defects. This is crucial for not only verifying model predictions but also for supporting operational decision-making and continuous process improvement.
Each module’s architecture was deliberately chosen to address specific aspects of the problem.
For departmental inference, the combination of LSTM and MLP networks enables temporal forecasting and complex decision emulation, respectively. The LSTM component isolates and predicts trends in sensor data, while the MLP integrates these predictions with event signals to generate anticipated quality labels.
For interdepartmental inference, the Random Forest-based module synthesizes data across departments to reveal causal relationships between early-stage anomalies and final product quality. Its ensemble structure and interpretability ensure that the system’s diagnostic conclusions are both robust and actionable.
In essence, these architectures were selected because they provide a modular, scalable, and interpretable framework. They not only replicate human expert decisions but do so in a manner that anticipates potential quality issues thereby allowing proactive interventions that improve overall efficiency and product quality.
3. Results
The outcomes of extensive testing for both the departmental and interdepartmental decision-making modules are detailed below. This section focuses on the tests performed and presents the performance results clearly for each production department and for the integrated interdepartmental module.
3.1. Departmental Decision-Making Module
As we expose previously the departmental module is designed to replicate and anticipate the decisions made by human experts at each production stage. To evaluate its performance, a controlled set of tests were conducted, for this test a reserved subset of data (20% of the overall dataset) was used for testing. These tests employed confusion matrices to compare the system’s predicted quality labels against the experts’ actual decisions. Performance evaluation will be rated by three metrics: sensitivity, precision, and F1-score applied as follows.
3.1.1. Steel Mill
The module in the steel mill department was tested on decisions such as OK (when the product is valid to move on to the next phase), BLOCK (when the product is retained in the current phase for a more thorough inspection to take another decision), ALARM(there has been some alarm in the inspection systems of this stage during production, so it is suspected that the product may have some serious fault and has to be examined to make another decision), and SCRAP (the product has been classified as faulty, so it is going to be turned in to scrap). The results are exposed by the confusion matrix of the test in
Table 1 and by the resulting metrics in
Table 2.
The results demonstrated that the system achieved a score about 80%, this result is good enough to take this expert as a reliable source of information. Similar performance levels were observed in the “bad” labels, indicating strong consistency in replicating expert decisions.
3.1.2. Logistic
In the logistics department the quality decisions are limited to OK, ALARM, and SCRAP, and the meaning of every one of them is the same as the previous stage. The results at this stage are presented in the confusion matrix in
Table 3 and the metric scores in
Table 4.
The tests showed that the system achieved a score a little bit lower than the Steel mill AI expert, in this case is about 76%. For the ALARM and SCRAP labels, the sensitivity and precision were slightly lower (e.g., ALARM had a sensitivity of 68.15% and precision of 71.34%), yet the overall performance remained competitive with expert judgments.
3.1.3. Rolling Mill
The module for the rolling mill stage has to handle the following labels: OK, BLOCK, ALARM, DOWNGRADE, and SCRAP. The DOWNGRADE label is introduced in this stage, this label is assigned when the final quality of the product is not the one desired/pretended so the final product is degraded to a lower quality. The results of this stage are presented in the confusion matrix in
Table 5 and the metric scores in
Table 6.
The system obtained worse score in this stage than in the previous, but we have to highlight that in the most important labels (OK and SCRAP) we obtain a score above 80%. Although other decision categories (BLOCK, ALARM and DOWNGRADE) showed slightly varied performance.
3.1.4. Sales
For the sales department, where decisions include SOLD (the product can be sold), PENDING (the product has to be inspected better before being sold, similar to BLOCK label in previous stages), CLAIM (the product own to a batch of products where some have been claimed by the customers), ROLLBACK (claimed and returned to the factory), and SCRAP, the tests revealed that the module achieved variated results shown through the confusion matrix in
Table 7 and the metrics score in
Table 8.
We have achieved a high performance for the SOLD label (sensitivity of 94.36%, precision of 97.72%, and an F1-score of 96.01%). The other decision categories, while exhibiting moderate variations, demonstrated that the system consistently approximates the expert’s decision-making process.
3.2. Interdepartmental Decision-Making Module
The interdepartmental module was designed to integrate outputs from the departmental modules and analyse them collectively. Its primary purpose is to diagnose the root causes of quality issues by correlating data across production stages. Tests for this module were performed. These tests used a big piece of the datasets and applied the Random Forest algorithm to examine how well the module could identify which variables from earlier stages (e.g., from the steelworks or logistics) contributed to quality defects observed later.
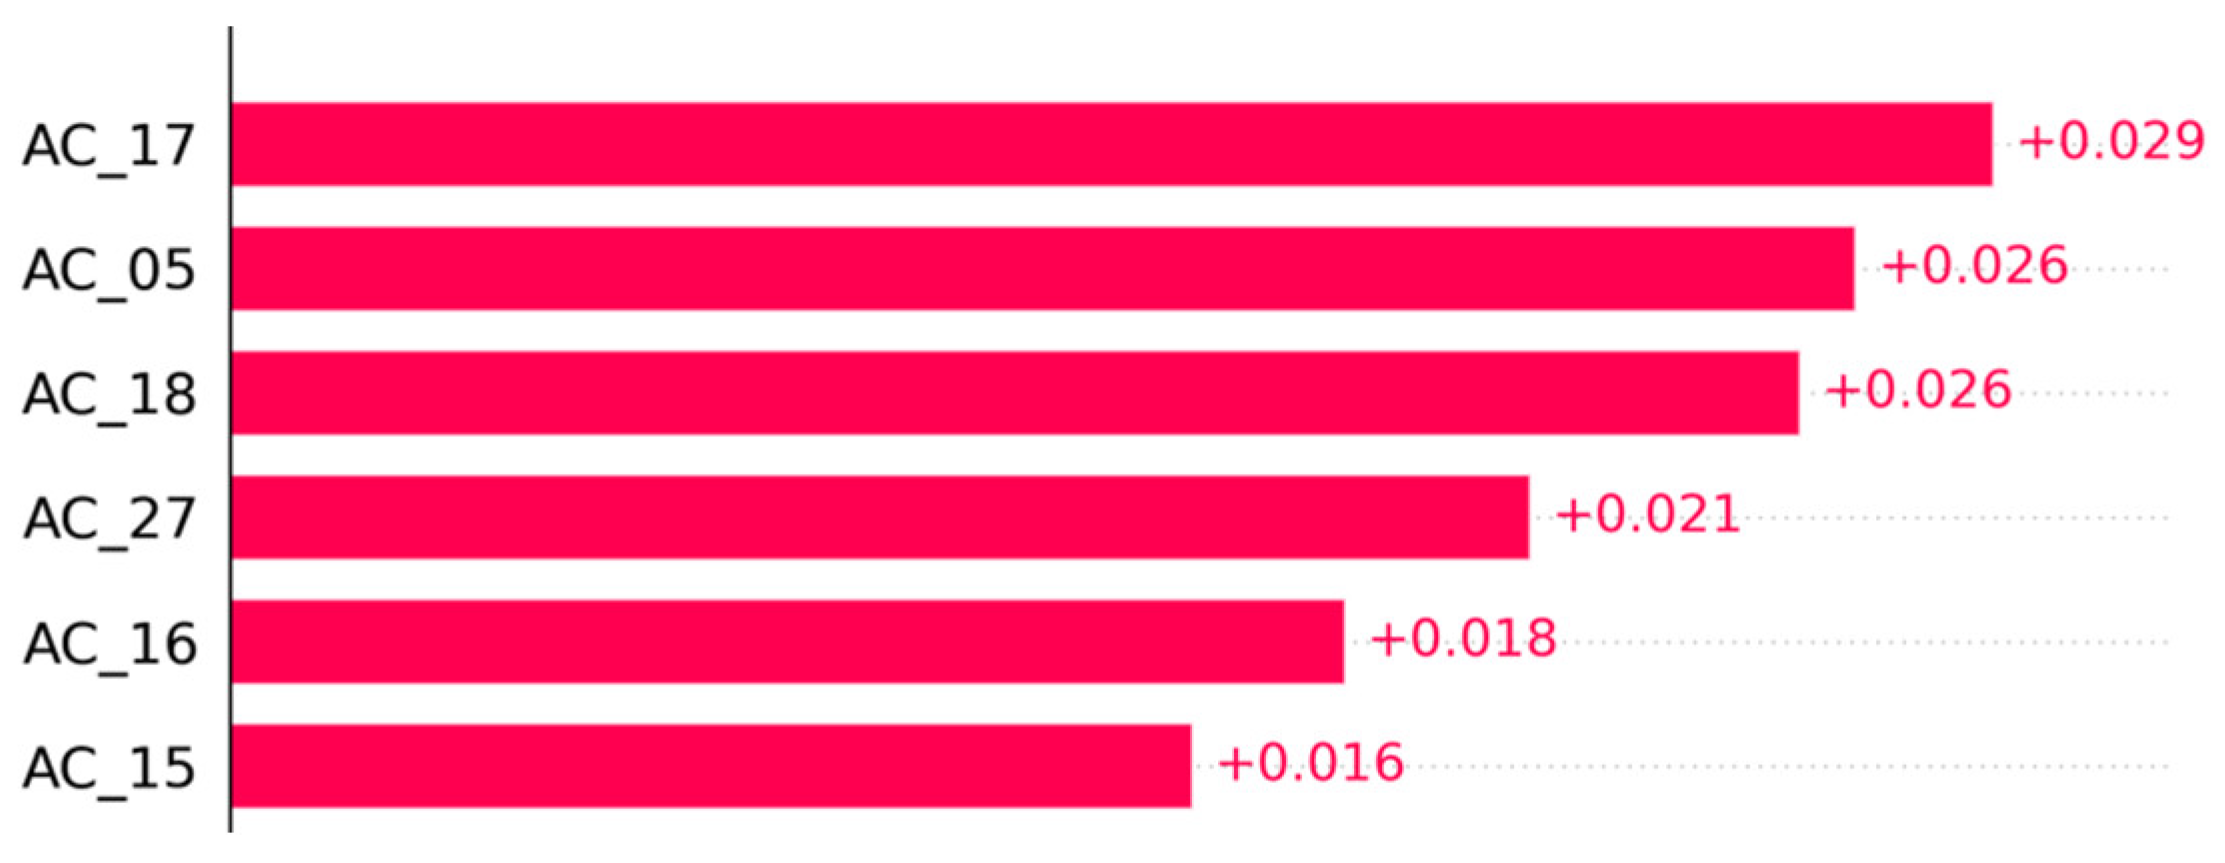
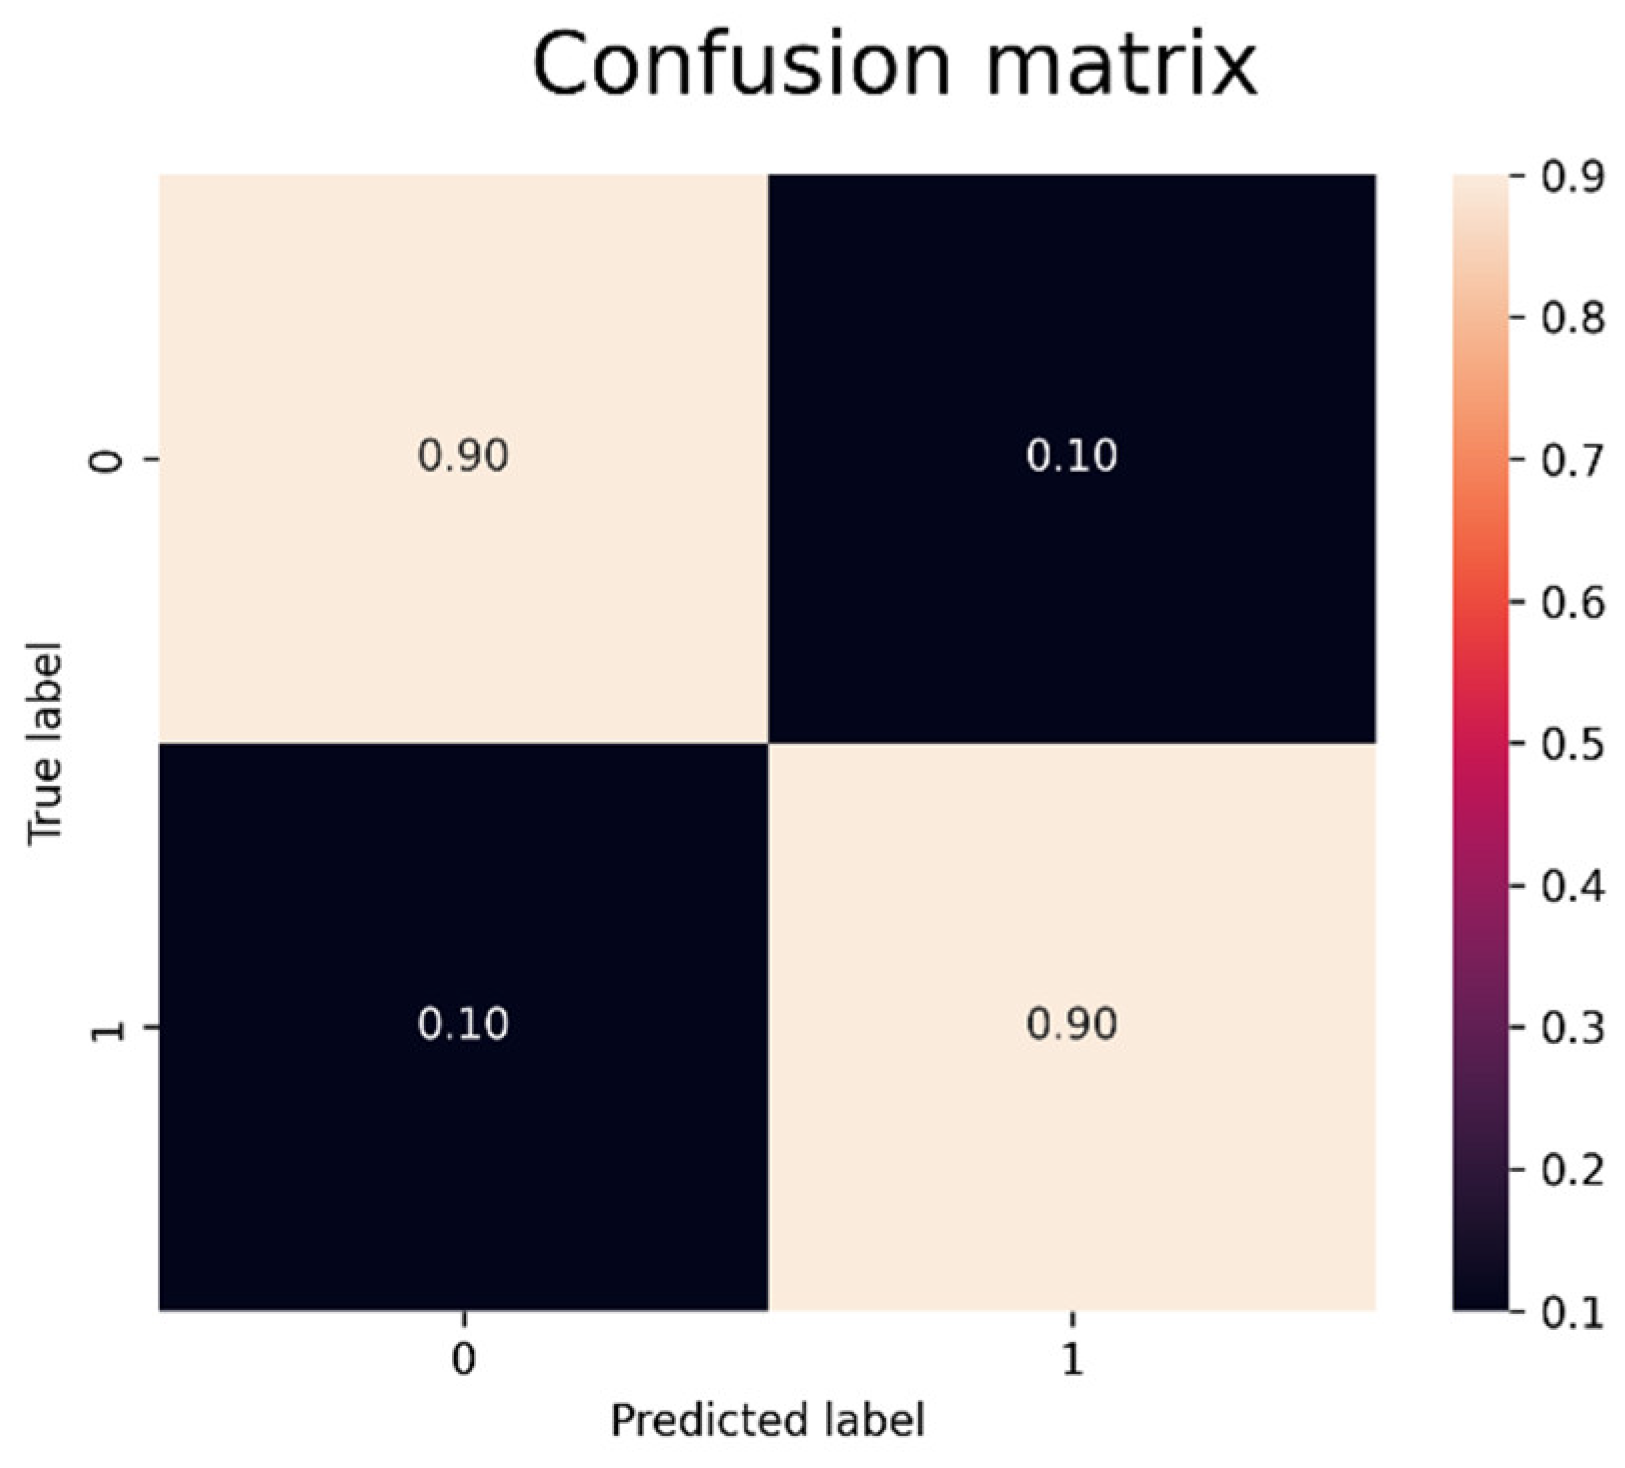
During testing, the interdepartmental module processed consecutive production sets where departmental decisions were predicted in advance. By applying ensemble methods and utilizing interpretability tools such as SHAP values, the module highlighted the importance of input features. The results clearly indicate that in multiple scenarios, sensor data from the steel mill stage were the primary drivers of defects in previous stages. We have chosen the rolling mill stage because we have a clear indicator of the quality of the product to use it as target (the QI factor provided by the EDDYEYES system). To make the analysis we will have a class “1” of “OK” products with too many defects (high QI), and we will have a class “0” which will be the rest of the product. In this analysis we found some batches of products where we observe correlation between the steel mill variables and the quality achieved in the rolling mill stage, let’s see some of them.
Taking batches of 1000 rolls we have used 70% for training and 30% for testing, these 1000 rolls are fed into the random forest algorithm (which is optimised to receive this data) obtaining the following results (
Figure 7,
Figure 8 and
Figure 9).
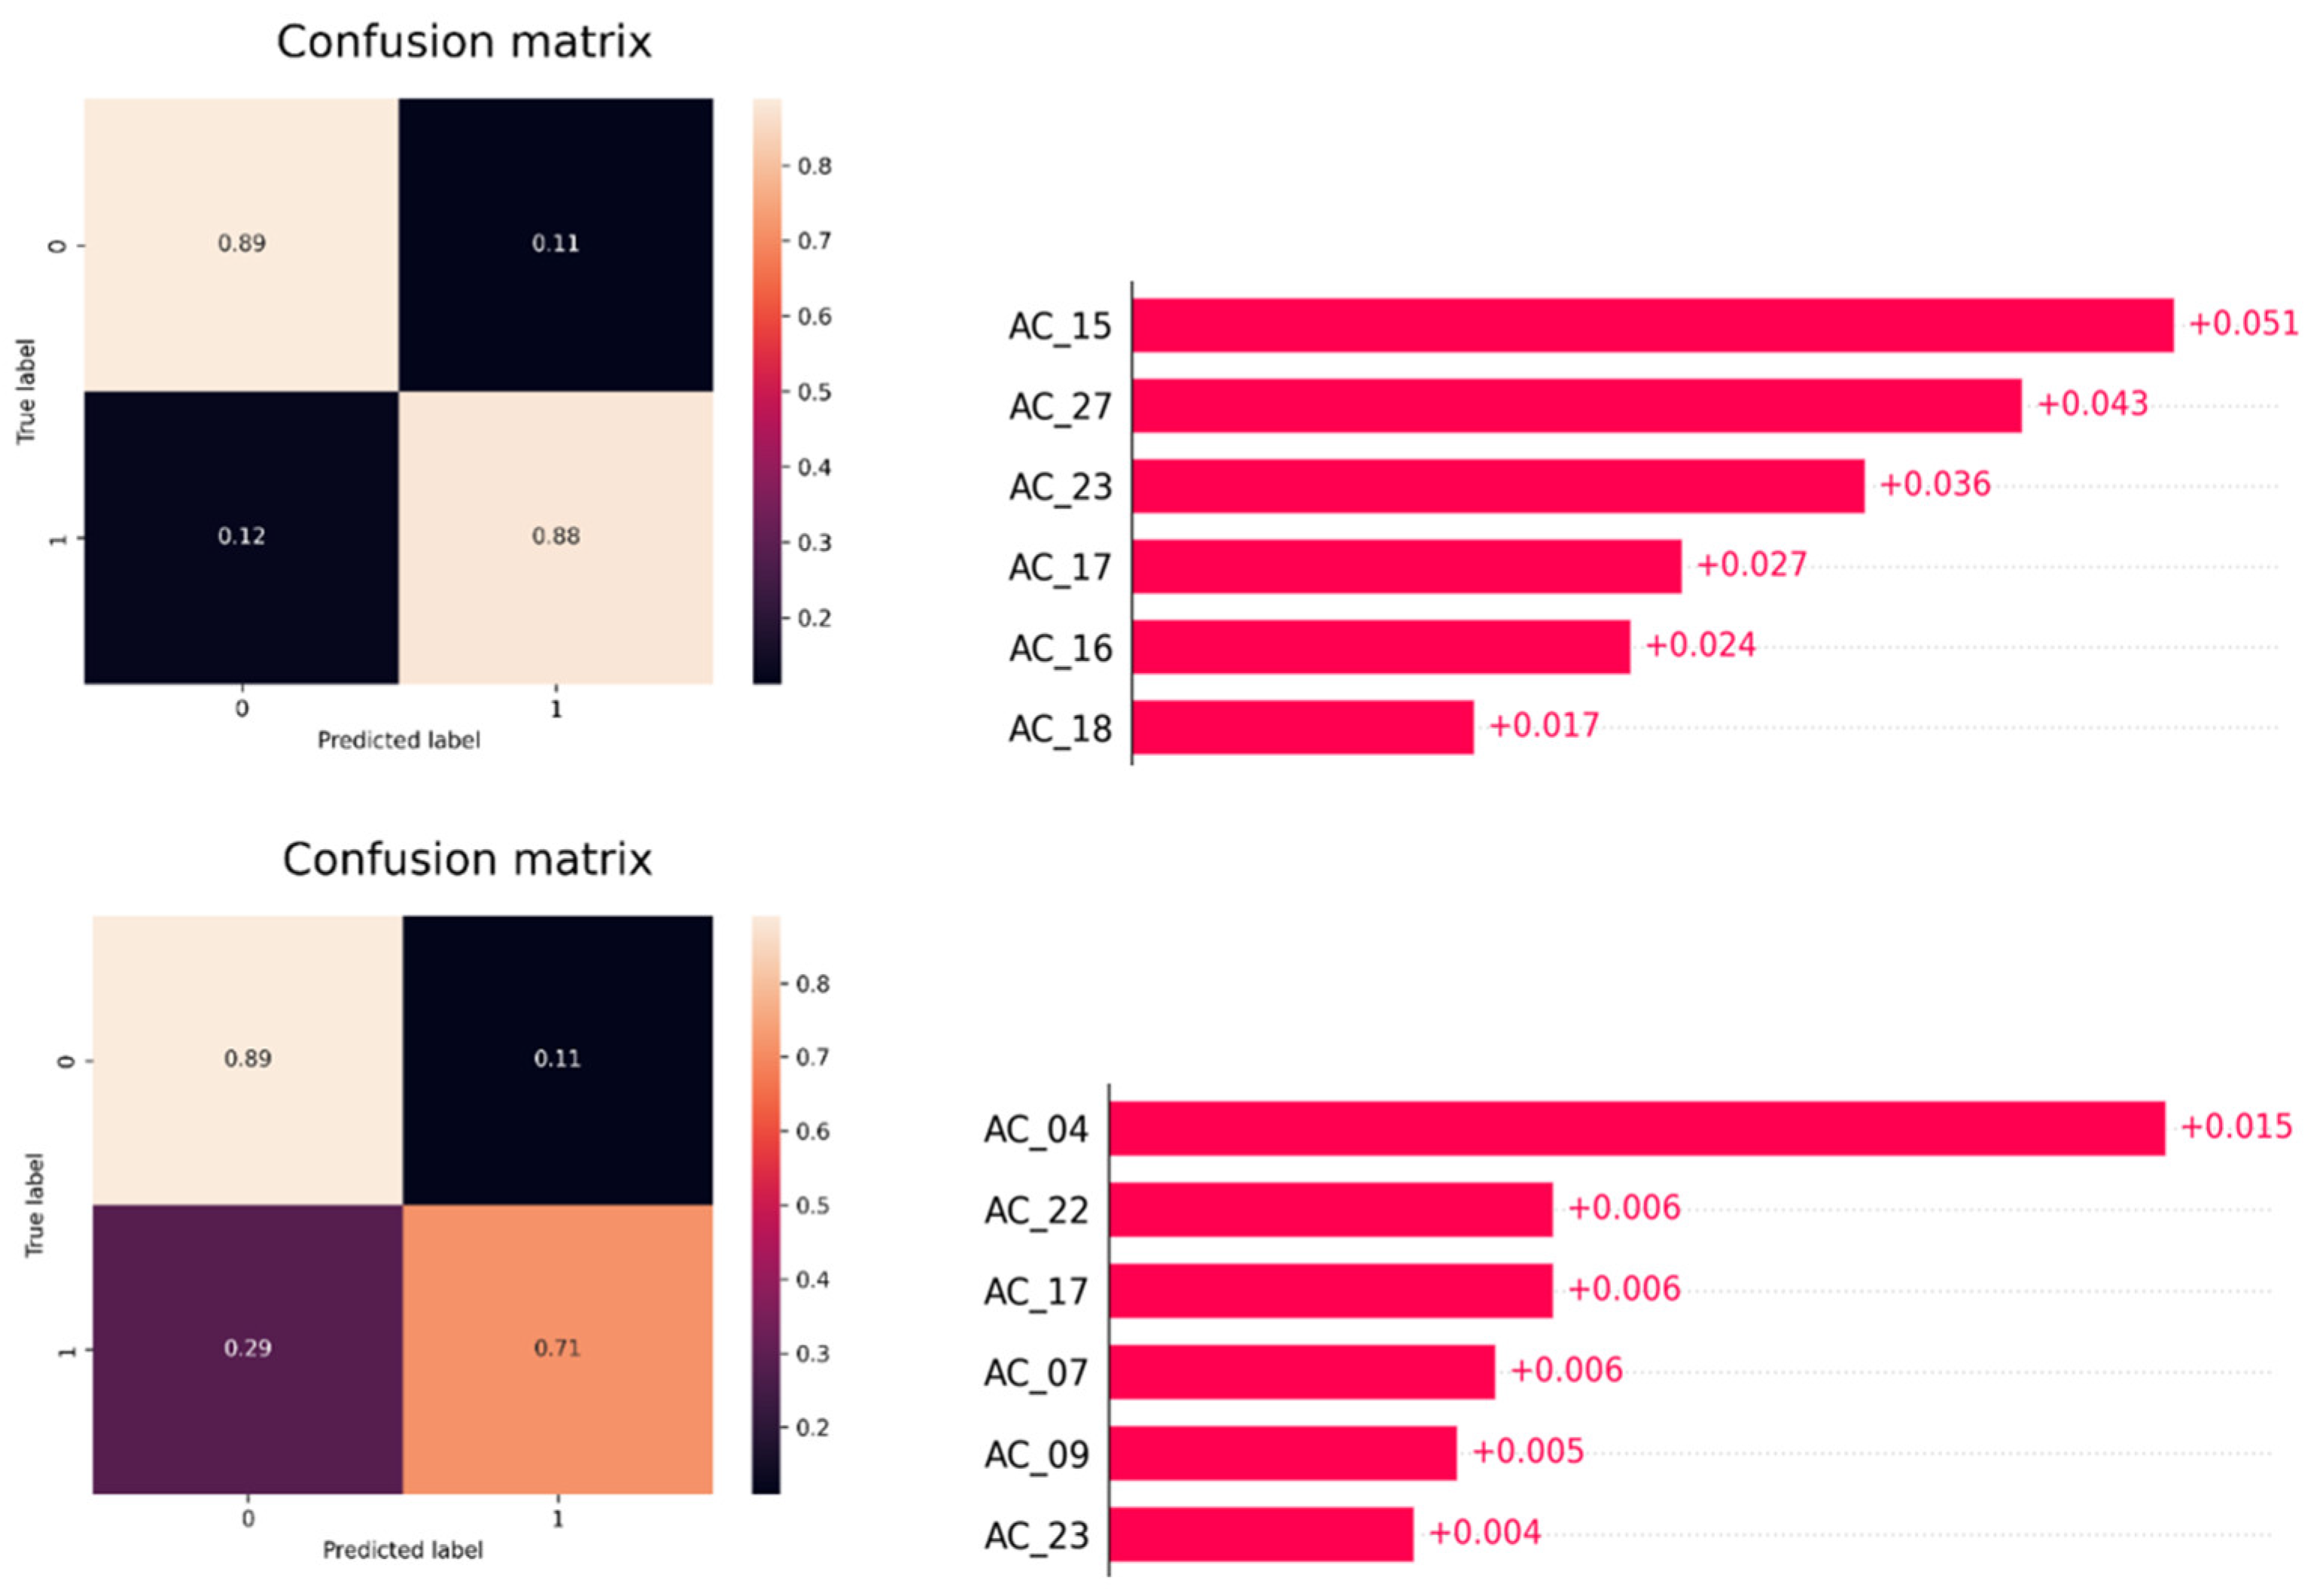
Once it was determined that the model had high reliability in discriminating the classes, the SHAP values for that batch of data were examined.
Figure 8.
SHAP values of the interdepartmental expert.
Figure 8.
SHAP values of the interdepartmental expert.
Figure 9.
More examples of confusion matrix and SHAP values of the interdepartmental expert.
Figure 9.
More examples of confusion matrix and SHAP values of the interdepartmental expert.
Here we can see that the variables coming from steel mill has the higher impact for this classification. Using the same method, we can find more cases that submit the same behavior.
The module’s confusion matrices and feature importance analyses demonstrated that it could reliably pinpoint problematic variables coming from the steel mill, providing actionable insights for process improvement. This information could be used in the future to train again the departmental modules and increase the reliability of them.
4. Discussion
Our AI system shows potential to help experts by predicting quality issues, even though accuracy varies by department. In the steel mill, the system had a 75% sensitivity for the SCRAP label. This means it would have flagged 75% of the billets that should be rejected before they were produced. When the system marked a billet as defective, it was right over 72% of the time. Out of 59,578 cases, the system would have stopped production for 403 billets and made 154 false alarms, with 97 of these being acceptable billets. In other words, it could have prevented 403 defective billets (0.67% of production and 75.75% of the billets that should be scrapped) at the cost of 97 false alarms (0.16% of production) and 57 warnings for lower quality. The system also shows very high confidence in correctly produced billets, with sensitivity over 94% and precision above 91%.
In the logistics stage, the system’s sensitivity was above 70% for detecting billets that should be scrapped. Here, 2,536 billets (4% of total production) were marked for rejection out of 3,595 expected. Although this resulted in 641 false alarms, the system still performed well for correctly processed billets, with sensitivity and precision both above 91%. This suggests that the system can save costs by helping logistics experts act early on quality issues while keeping false alarms low.
In the rolling mill, the “DOWNGRADE” label was the most difficult to classify. This label is used when the final quality is below expectations. The challenge may be due to limited data and difficulty in separating these cases from OK or SCRAP. Even human experts found this category hard to define. However, the system worked well for the OK category, which has much more data. For instance, about 1% of cables should be scrapped, and the AI achieved 79% sensitivity and 81% precision in this group. It correctly identified 598 out of 756 cases and only produced 56 false alarms.
The sales module is more complex. The AI achieved an F1-score of 72%, which is lower than in the other departments. This may be due to less varied input data and decision outcomes. The sales module might benefit from further integration with interdepartmental analysis. Despite this, the system still prevented the scrapping of 70 cables, though it did produce 34 false alarms.
Overall, our AI system can replicate and sometimes even predict expert decisions. It works best when there is a large amount of clear data. The challenges seen with the DOWNGRADE category and in the sales module suggest that more data and better integration could improve performance. Still, these results show that our AI approach can help prevent quality issues, reduce production losses, and support experts by giving early warnings. This paves the way for using such systems in industrial production to improve quality control.
5. Conclusions
The study demonstrates that an AI-based system, which integrates event filtering, expert knowledge extraction, and advanced inference modules, can effectively predict quality issues in the steel rolling process. With an overall accuracy around 80%, the system shows promise in replicating and anticipating expert decisions, leading to potential reductions in production losses and improved operational efficiency. Although certain categories—such as the “DOWNGRADE” label in the rolling mill and the complex decisions in the sales module—require further data enrichment and model integration, the system provides actionable insights for process improvement. Future research should focus on expanding the dataset, refining the model for challenging categories, and exploring tighter integration across departments to further enhance predictive accuracy and industrial applicability.
Author Contributions
Conceptualization, J.M.B.; methodology, J.I.D. and R.M.; software, J.B.; validation, J.I.D. and R.M.; formal analysis, J.M.B.; investigation, J.B. and R.M.; data curation, J.B.; writing—original draft preparation, J.B.; writing—review and editing, J.M.B., J.I.D. and R.M. ; visualization, J.B.; supervision, J.M.B.; project administration, J.M.B. All authors have read and agreed to the published version of the manuscript.
Funding
This research was funded by Ministerio para la Transformación Digital y de la Función Pública of Spain and European Union -NextGenerationEU- grant number C005/21-ED.
Data Availability Statement
Data available on request due to legal restrictions: The data presented in this study are available on request from the corresponding author due to NDA signed with the data owner.
Conflicts of Interest
The authors declare no conflicts of interest. The funders had no role in the design of the study; in the collection, analyses, or interpretation of data; in the writing of the manuscript; or in the decision to publish the results.
References
- Kano, M., & Nakagawa, Y. (2008). Data-based process monitoring, process control, and quality improvement: Recent developments and applications in steel industry. Comput. Chem. Eng., 32, 12-24. [CrossRef]
- Zhang, L., & Thomas, B. (2003). State of the Art in Evaluation and Control of Steel Cleanliness. Isij International, 43, 271-291. [CrossRef]
- Takalo-Mattila, J., Heiskanen, M., Kyllönen, V., Määttä, L., & Bogdanoff, A. (2022). Explainable Steel Quality Prediction System Based on Gradient Boosting Decision Trees. IEEE Access, 10, 68099-68110. [CrossRef]
- Liu, Z., Wu, L., Liu, Z., & Mo, Y. (2023). Quality control method of steel structure construction based on digital twin technology. Digital Twin. [CrossRef]
- Susto, G. A., Schirru, A., Pampuri, S., McLoone, S., & Beghi, A. (2015). Machine Learning for Predictive Maintenance: A Multiple Classifier Approach. IEEE Transactions on Industrial Informatics, 11(3), 812–820. [CrossRef]
- Lee, J., Bagheri, B., & Kao, H.-A. (2015). A Cyber-Physical Systems Architecture for Industry 4.0-based Manufacturing Systems. Manufacturing Letters, 3, 18–23. [CrossRef]
- Lin, L., & Zeng, J. (2021). Consideration of green intelligent steel processes and narrow window stability control technology on steel quality. International Journal of Minerals, Metallurgy and Materials, 28, 1264 - 1273. [CrossRef]
- Branca, T., Colla, V., Algermissen, D., Granbom, H., Martini, U., Morillon, A., Pietruck, R., & Rosendahl, S. (2020). Reuse and Recycling of By-Products in the Steel Sector: Recent Achievements Paving the Way to Circular Economy and Industrial Symbiosis in Europe. Metals. [CrossRef]
- Colla, V., & Branca, T. (2021). Sustainable Steel Industry: Energy and Resource Efficiency, Low-Emissions and Carbon-Lean Production. Metals. [CrossRef]
- Neogi, N., Mohanta, D., & Dutta, P. (2014). Review of vision-based steel surface inspection systems. EURASIP Journal on Image and Video Processing, 2014. [CrossRef]
- Sun, X., Gu, J., Tang, S., & Li, J. (2018). Research Progress of Visual Inspection Technology of Steel Products—A Review. Applied Sciences. [CrossRef]
- Ibrahim, A., & Tapamo, J. (2024). A Survey of Vision-Based Methods for Surface Defects’ Detection and Classification in Steel Products. Informatics. [CrossRef]
- Amzil, K., Yahia, E., Klement, N., & Roucoules, L. (2022). Automatic neural networks construction and causality ranking for faster and more consistent decision making. International Journal of Computer Integrated Manufacturing, 36, 735 - 755. [CrossRef]
- Ren, L., Wang, T., Laili, Y., & Zhang, L. (2022). A Data-Driven Self-Supervised LSTM-DeepFM Model for Industrial Soft Sensor. IEEE Transactions on Industrial Informatics, 18, 5859-5869. [CrossRef]
- L., Zhao, Y., Wang, B., & Shen, F. (2023). A Multistep Sequence-to-Sequence Model With Attention LSTM Neural Networks for Industrial Soft Sensor Application. IEEE Sensors Journal, 23, 10801-10813. [CrossRef]
- Yuan, X., Li, L., Shardt, Y., Wang, Y., & Yang, C. (2020). Deep Learning With Spatiotemporal Attention-Based LSTM for Industrial Soft Sensor Model Development. IEEE Transactions on Industrial Electronics, 68, 4404-4414. [CrossRef]
- Lundberg, S., Erion, G., Chen, H., DeGrave, A., Prutkin, J., Nair, B., Katz, R., Himmelfarb, J., Bansal, N., & Lee, S. (2020). From local explanations to global understanding with explainable AI for trees. Nature Machine Intelligence, 2, 56 - 67. [CrossRef]
- Amoukou, S., Salaün, T., & Brunel, N. (2021). Accurate Shapley Values for explaining tree-based models. ArXiv, abs/2106.03820. [CrossRef]
|
Disclaimer/Publisher’s Note: The statements, opinions and data contained in all publications are solely those of the individual author(s) and contributor(s) and not of MDPI and/or the editor(s). MDPI and/or the editor(s) disclaim responsibility for any injury to people or property resulting from any ideas, methods, instructions or products referred to in the content. |
© 2025 by the authors. Licensee MDPI, Basel, Switzerland. This article is an open access article distributed under the terms and conditions of the Creative Commons Attribution (CC BY) license (http://creativecommons.org/licenses/by/4.0/).