
Submitted:
25 February 2025
Posted:
26 February 2025
You are already at the latest version
Abstract
This study presents an ad hoc machine-learning approach to uncover dynamical correlations among production and injection wells in naturally fractured reservoirs. The method is an application of the Visibility Graph Analysis (VGA) technique introduced by Lacassa et al. (2008) to analyze the state of an oil field. Due to its statistical nature, this technique relies on the available field information and historical production logs, makes no assumptions, and does not require specific information about the reservoir’s properties. We assume that all inter-well’s dynamic details are fully encoded in the historical logs. Thus, all production-injection data is transformed into a set of complex multiplex networks that take advantage of the VGA technique at the method’s core. These sets of networks map the production rates onto a ‘state’ image of the well system at a particular time. One well’s influence on another is then established by assessing the time development of the respective states, thereby effectively capturing the long and short-term dependencies and revealing the evolution of the well’s ‘hidden’ interconnections. This methodology was applied to a dataset (whose logs span sixty years) belonging to an active oilfield in Mexico. Our results show that the transitions between the field’s states provide crucial insights into the flow pathways within the reservoir. Moreover, they give a clear picture of how the operation of certain wells influences the production of other wells (e.g., when the production of oil in a well increases, decreases, or when a well switches from a production to an injection operation).
Keywords:
oil production
; reservoir
; connectivity
; visibility graph
; deep learning
; complex networks
; multiplex networks
; interconnectivity
; inter-well connectivity
1. Introduction
Oil production in naturally fractured reservoirs involves complex interactions between geological, geophysical, and operational factors. Understanding inter-well connectivity is essential for optimizing recovery rates, enhancing well performance, and improving reservoir management strategies. However, uncovering these connections presents significant challenges due to incomplete data, evolving reservoir conditions, and the coupled dynamics of production and injection wells.
Traditionally, methods like the Capacitance-Resistance (CR) model have been widely used to estimate inter-well connectivity. Introduced by Bruce (1943), the CR model provided a simplified approach to analyze water drive problems and predict well performance based on injection and production rates [1]. Over time, variations of the CR model have emerged, such as those incorporating network flow simulations to improve prediction accuracy [2,3,4]. Other techniques include Interwell Numerical Simulation Models (INSIM), which utilize meshless points and conservation laws to simulate fluid flow at multiscale levels, offering insights into water flooding conditions [5,6]. While effective, these methods often require significant input data, such as geophysical properties and flow parameters, which may not always be available in practical settings.
Advances in data-driven methodologies have transformed the analysis of reservoir connectivity. Machine learning techniques, such as artificial neural networks (ANNs), support vector regression (SVR), and recurrent neural networks (RNNs), have shown success in predicting production rates and optimizing recovery strategies [7,8,9]. For instance, Ibrahim et al. (2021) demonstrated the use of hybrid models combining ANNs and SVR to predict flow rates in unconventional wells [8]. Furthermore, spatiotemporal models, including graph neural networks (GNNs) and hybrid frameworks like convolutional graph networks (CGNs) combined with LSTMs, have been employed to capture spatial and temporal dependencies in complex reservoir systems [10,11]. These approaches leverage production and injection data to uncover patterns that inform operational decisions, such as well placement and injection optimization.
The Visibility Graph Analysis (VGA) method has emerged as a powerful tool for transforming time-series production and injection data into complex networks, revealing hidden temporal and spatial relationships [12]. Unlike static approaches, VGA captures evolving states and flow pathways, making it particularly suitable for dynamic reservoir systems. To enhance this methodology, we employ a multiplex network representation, where multiple layers encode the evolution of well interconnections over time. This approach integrates information from different temporal states, capturing both short- and long-term dependencies. Metrics such as average edge overlap and interlayer mutual information provide insights into dynamic inter-well connectivity, uncovering patterns that evolve with the reservoir’s operational history [13,14].
Other methods, such as Grey Relational Analysis (GRA), have also been applied to evaluate inter-well connectivity, particularly in systems with sparse or uncertain data [15]. GRA quantifies static relationships using Grey relational coefficients, providing valuable insights into production-injection dependencies. However, its reliance on static snapshots limits its ability to capture temporal evolution, underscoring the need for dynamic approaches like VGA combined with multiplex networks.
This study introduces a methodology that leverages multiplex visibility graph analysis to uncover evolving inter-well connectivity patterns in a naturally fractured hydrocarbon reservoir. By representing production data as complex networks and multiplex layers, the proposed methodology captures the reservoir’s dynamic behavior without relying on predefined assumptions about connectivity. The inferred interconnections provide actionable insights into the influence of injection and production wells, guiding decisions such as optimizing injection schedules, identifying potential drilling locations, and understanding the reservoir’s long-term evolution.
Beyond its immediate applications, the inferred connectivity data holds potential for training machine learning models to forecast production trends based on historical management decisions. By integrating the adjacency matrices generated from the multiplex network analysis into frameworks such as message-passing neural networks (MPNNs) or recurrent neural networks (RNNs), stakeholders can simulate various operational scenarios. This predictive capability can assist in planning field development strategies, optimizing resource allocation, and mitigating risks associated with reservoir management.
The proposed methodology builds on and complements existing research in reservoir engineering. Recent advances, such as GNNs for qualitative classification of hydrocarbon zones [16], hybrid graph simulators for subsurface flow optimization [17], and GeoDIN frameworks for predicting reservoir performance [18], highlight the utility of graph-based approaches. By extending these methodologies with multiplex VG network representations, this work offers a novel framework for analyzing complex adaptive systems and refining connectivity predictions, with implications for both practical applications and future research.
2. Methodology
Hydrodynamic interactions in the reservoir are determined using historical data concerning oil production and injection flow rates, spanning 62 years (1958–2020). Within the scope of this work, other data, such as the bottom-hole pressures, fluid properties, and rock properties, are not considered. This dataset includes oil and gas production rates and water injection rates, which are key to constructing an abstract representation of inter-well relationships as a network of interlinked nodes. The edges and weights in this network are defined by fluid flow rates and well types while accounting for the fraction of time each well remained operational. Importantly, this approach relies exclusively on production and injection logs, minimizing the need for additional data and thereby optimizing production costs. Despite inherent challenges, such as missing records and non-continuous datasets, preprocessing ensures reliable mapping of inter-well connectivity. This data-driven method indirectly reflects the underlying geophysical conditions governing reservoir behavior, and the data log issue regarding discontinuity in the data collected as suggested in recent studies on dynamic production data management [19]. Figure 1 shows how the production and injection data looked over the years after the aggregation process.
2.1. From Non-Periodic Time Series to Event Framework
Consider a set of wells , where each well possesses a time series of nonperiodic flow measurements with total observations. Since the wells started operating at different times, the series were preprocessed to align and standardize the data into equal-sized sets. The resultant time series were treated as indexed sequences of events to develop the proposed methodology. Finally, the dataset is conveniently represented as a matrix of labeled sequences of size , which facilitates the computational procedures.
2.2. Event to Network Representation Transformation
Various methodologies can be applied to transform time series into networks (e.g. [20,21]). However, to capture long-term dependencies, we adopt the Visibility Graph (VG) algorithm introduced by Lacasa et. al [12]. This parameter-free algorithm transforms a time series into a network, preserving key features such as periodicity, self-similarity, and invariance under translations or linear trends. Compared to Recursive Networks (RN), Transfer Networks (TN), and similar methods, VG is scale-free and does not require parameter optimization, enhancing its robustness for this application. Figure 2 illustrates the transformation process from the time series to the complex graph representation of the network.
For a given sequence of events , the VG algorithm yields a graph with k nodes. Any pair of nodes i and j in the graph are connected if they satisfy the so-called visibility-criterion
This means that node i can ‘see’ node j whenever any other node (k) located between them has a lower relative value. If the condition is met, the respective nodes are connected by an edge (as shown in Figure 2(a)). These connections can be remapped onto the network’s graph (Figure 2 (b)). The resulting graph (Figure 2 (b)) simplifies the identification of connections and dependencies among events, providing a robust framework for analyzing complex temporal patterns.
2.2.1. Multivariate Times Series to Multiplex Visibility Graph Transformation
During the productive lifespan of an oil field, well interactions evolve, resulting in multiple sequences of events. These are effectively represented as a multivariate network using a Multiplex Visibility Graph (MVG), as illustrated in Figure 3. The MVG retains the essential characteristics of the simpler VG method, such as its ability to capture long-term dependencies and topological features [13]. Multivariate event sequences can be expressed as , with the corresponding graph set represented as .
To simplify numerical implementation, these layered networks are recast as vectors of adjacency matrices , where for each MVG layer . Here, denotes the presence or absence of connectivity between nodes i and j [14].
Special events with long-term dependencies, referred to as ’states,’ are identified by analyzing edge overlaps across layers. The average edge overlap metric quantifies these overlaps, highlighting persistent patterns over time [13]:
Applying this metric to the original event set yields a subset of states, capturing key connectivity patterns across the reservoir’s operational timeline.
2.3. State Graphs Based on Fluid Behavior
States can be defined to identify relevant relationships in oil production rates. Using the VG technique, graphs are constructed with a modified visibility criterion focused on flow records. Here, a well i can ’see’ well k based on the flow rate of well k during its steady-state operation S. The condition for establishing an edge between wells i and k is given by:
where i, j, and k denote different wells. An initial state , derived from historical records, serves as the baseline reference for this criterion.
Under this framework first, second and third-order interactions can be defined, indicating the connectivity relevance among the states. This interactions are represented in an S-dimensional (multilayered) network, denoted as . The adjacency matrices for these layers are , with each , where reflects connections based on production rates captured by the VG approach (Figure 3).
To evaluate connectivity across states, the interlayer mutual information metric is employed. For two layers and , the metric is defined as [13]:
Here, represents the degree distribution across layers and , while and are their respective probability distributions. denotes the joint probability distribution, providing insights into the correlation of nodes across layers.
3. Results and Discussion
The spatial distribution of the wells analyzed in this study is shown in Figure 6. Some wells functioned alternately as production wells (black dots) and injection wells (blue arrows) over the years.
The initial graph representation was constructed using productivity and flow rates from the initial events, applying the Visibility Graph (VG) methodology.
This data-driven approach identifies temporal and functional dependencies rather than relying solely on spatial proximity. Given the dataset spans six decades, it captures the reservoir’s evolving operational strategies. Observed connectivity reflects the interplay between long-term production behaviors, operational planning, and reservoir dynamics, offering insights into functional rather than geographic topological relationships.
Using the proposed VG methodology, the results of the evolving dynamic interactions among the wells were revealed. Figure 7 highlights three representative steady states during the year 2020. In the first state, well I16 exhibited the highest interactivity (weight , the weight of a steady state is defined in function of the prevalence over the time of that given state), followed by well P12 with moderate interconnectivity. Over time, the system transitioned to a second steady state dominated by P5, which displayed the highest production rate and significant interaction with I16. The last steady state, observed in 2020, featured a basal configuration with significant interconnectivity between P5 and I13 .
Key transition periods in the reservoir’s evolution are summarized in Figure 8. To establish the robustness of the methodology, the first transition periods were used as training periods to develop and validate this methodology, leaving the last year 2020 as the test period of the methodology which keeps the information of the previous behavior and evolution of the system to establish the interconnections of the wells that will remain over the entire life of the reservoir.
During 1958–1979, only wells P1 and P2 were active, alternating in activity with P2 ultimately dominating. Limited connectivity insights are available due to the small number of active wells (see Figure A1 in the Appendix section). Between 1980 and 1984, P3 became operational, exhibiting moderate connectivity with P1 and P2 (see Figure A2 in the Appendix section). From 1985 to 2004, new wells such as P4 and P6 were introduced, with P6 showing increasing activity and connectivity with P3 (Figure A3 and Figure A4 ).
In the period 2005–2009, multiple wells, including P1 through P8, were active, remarking that the activity of well P5 started after P8 in 2010 (Figure A5). P3 demonstrated a consistent triggering effect on P7, indicating a strong functional relationship. Between 2010 and 2014, wells P1–P12 were active, with P9 and P12 displaying an alternating activity pattern, suggesting their interconnection (Figure A6). For a complete overview of the evolution during the years 1958 - 2009 with their respective states transition see Figure 9.
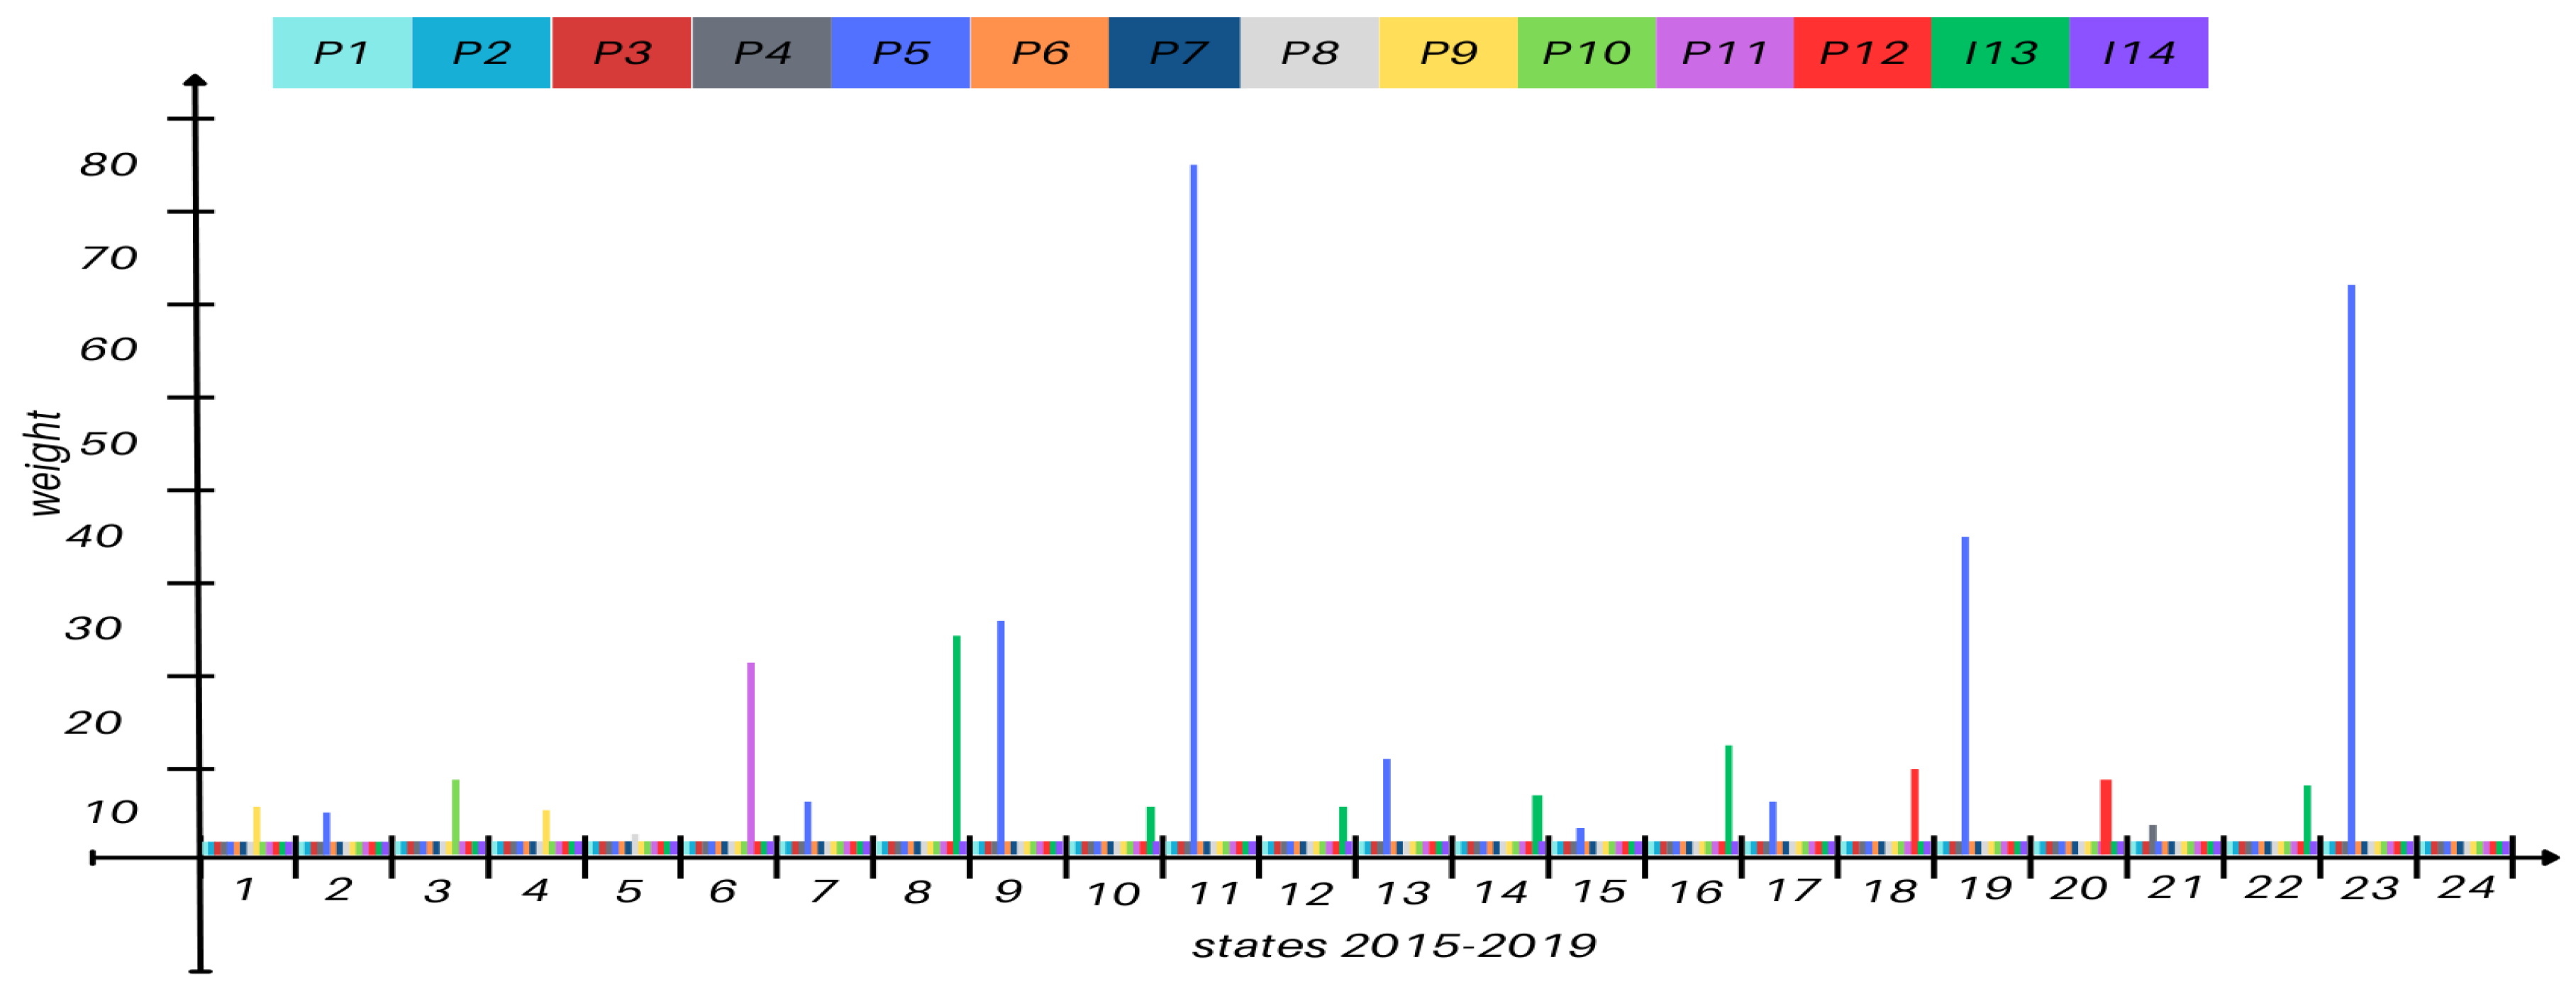
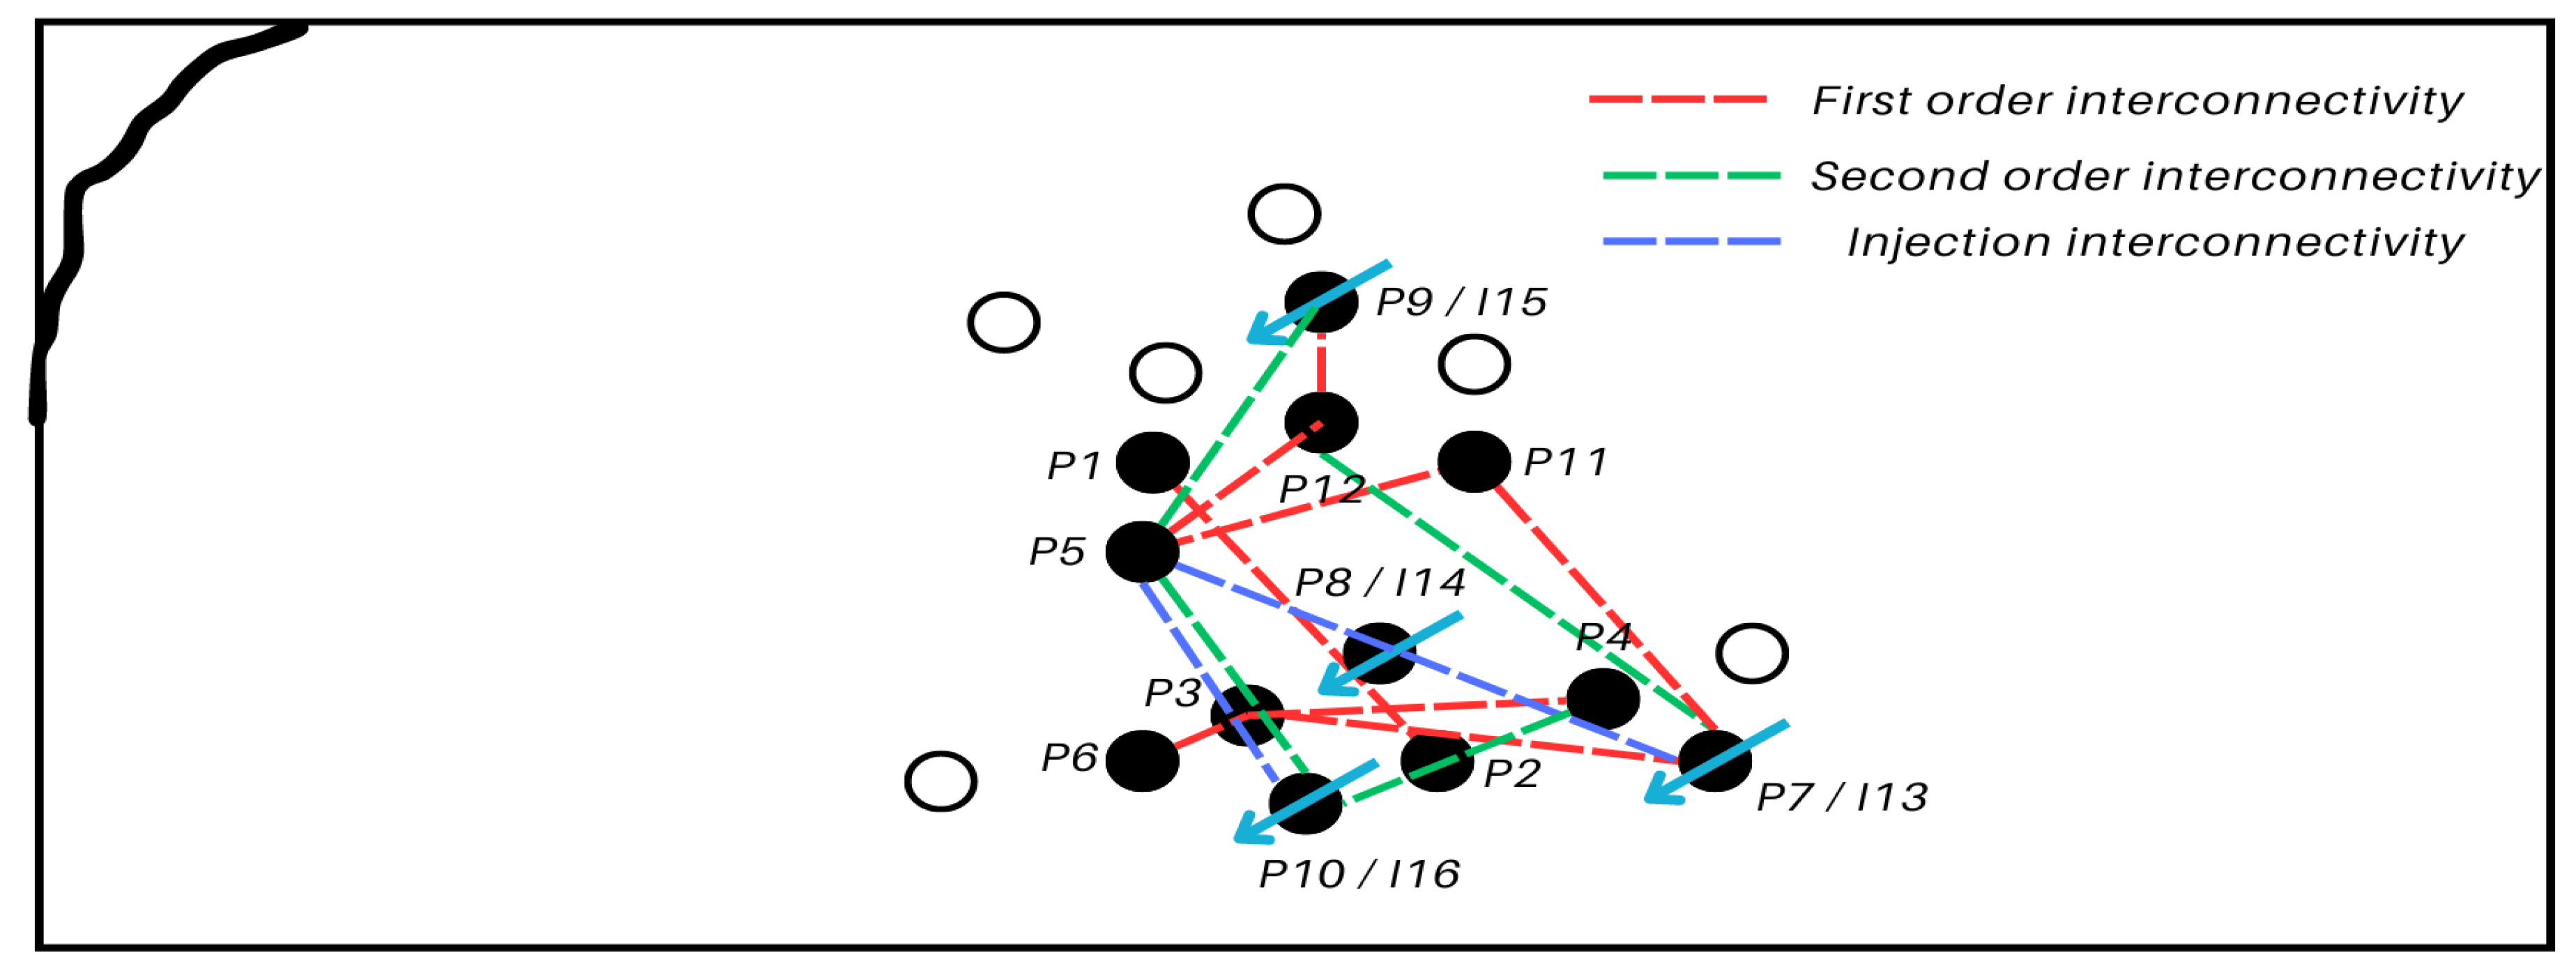
From 2015 to 2019, the addition of injection wells I13 and I14 introduced new dynamics. P5 exhibited strong connectivity with I13 and P12, while emerging second-order connections between P4 and P10 became evident (Figure A7). The global evolution for the years 2010 to 2019 together with the state’s transition, can be appreciated in Figure 10.
Considering all the preceding years, different persistent patterns of interconnectivity were found. This same methodology was applied to the data of the year 2020. Notably, in 2020, well P10 transitioned from production to injection as I16. This transformation reinforced its functional interconnection with P5, corroborating earlier findings (Figure 7).
3.1. Validation of Results and Robustness Assessment
The inferred connectivity patterns were validated using operational data and field expert input. The VG approach effectively captures complex interdependencies, transforming time-series data into network representations that reveal dynamic relationships among wells.
3.1.1. Verification Metrics:
- Alignment with Historical Operational Data: Connectivity patterns correspond to documented operational changes, such as well conversions and periods of high activity. For instance, the identified link between P5 and I16 aligns with historical injection-driven responses see Figure 11 and 12 for more detail.
- Temporal Consistency: Connectivity patterns persisted across different time intervals, reflecting stable reservoir dynamics and reinforcing reliability.
In addition to these practical validations, the results demonstrate key characteristics of complex adaptive systems:
- Emergence: The interconnections revealed are emergent properties of the reservoir’s evolution, naturally arising from the interplay of historical production and injection activities.
- Self-Similarity: The recurring patterns of connectivity across temporal intervals reflect self-similarity, a feature that underscores the robustness of the VG methodology in capturing consistent and meaningful relationships within an evolving system.
- Reduction of Information Entropy: By transforming disorganized time-series data into structured network representations, the VG methodology reduces uncertainty, enabling stakeholders to uncover hidden patterns and dependencies critical for informed decision-making.
The dynamic nature of the reservoir adds complexity, as evolving flow pathways and occlusions are shaped by pressure depletion, erosion, and injection activities. These factors challenge static validation methods like cross-validation. Instead, metrics like temporal consistency, alignment with operational data, and the application of concepts from complex systems provide more meaningful evaluations of robustness.
3.1.2. Consideration of Reservoir’s Evolving Nature
The reservoir’s dynamic evolution over decades highlights the need for methodologies that capture temporal changes. The VG methodology excels in adapting to these dynamics, uncovering both short- and long-term dependencies and emerging patterns. By leveraging insights from complex adaptive systems, this approach provides stakeholders with a powerful tool to understand and manage reservoir behavior in real-time (see Figure 11 and Figure 12).
4. Conclusions
A novel methodology was developed to investigate the degree of interconnection between oil-producing and injection wells based on historical production logs spanning six decades. By applying the visibility graph (VG) algorithm, the time-series data were transformed into a multiplex network, enabling the identification of dynamic inter-well connectivity patterns. As the literature indicates, this approach is unprecedented and provides a fresh perspective on analyzing complex adaptive systems like naturally fractured reservoirs. This study reveals key insights into the evolution of inter-well connectivity, offering valuable information for reservoir management. The observed connectivity patterns highlight emergent relationships shaped by production and injection activities, independent of spatial proximity. These findings underscore the methodology’s ability to adapt to the system’s dynamic and evolving nature, revealing hidden connections critical for optimizing recovery rates and improving operational efficiency. The methodology was validated through alignment with historical operational data and the temporal consistency of connectivity patterns. These validations, combined with the theoretical foundation of the VG approach, confirm the robustness of the methodology and its relevance to real-world reservoir management. While this study does not aim to forecast future connectivity, it provides a foundational understanding of the reservoir’s dynamic behavior, which can guide stakeholders in adaptive decision-making. Looking ahead, this methodology can be extended to integrate advanced machine learning models, such as Message Passing Neural Networks (MPNNs), to analyze adjacency matrices derived from the identified steady states. This integration could enable forecasting of inter-well connectivity changes and simulation of production scenarios, enhancing its utility as a predictive tool. Furthermore, the VG-based approach holds potential for broader applications, including groundwater modeling, thermal-reservoir engineering, and water networks, where similar complex interactions are present. In conclusion, the VG methodology captures both long-term and short-term interactions in evolving reservoir systems, offering a unique quantitative approach to understanding interconnectivity. Its ability to uncover hidden patterns and adapt to system changes makes it a powerful tool for managing complex systems. This work lays the groundwork for future studies and the development of predictive models, supporting stakeholders in making informed decisions for sustainable reservoir management.
Acknowledgments
This research was conducted in the framework of the ENERXICO Project (B-S-69926). The authors wish to thank Instituto de Ingeniería IUNAM and the staff of the Multiphase Flow Laboratory for their technical support.
Appendix A
Here we show the figures in which we can appreciate the frequencies of interconnectivity for the relevant periods of the life of the reservoir. These figures show the data and analysis foundations to state the state transitions for this specific reservoir.
Figure A1.
First temporal window. States interlayer mutual information I weight for the window time 1958 to 1979.
Figure A1.
First temporal window. States interlayer mutual information I weight for the window time 1958 to 1979.
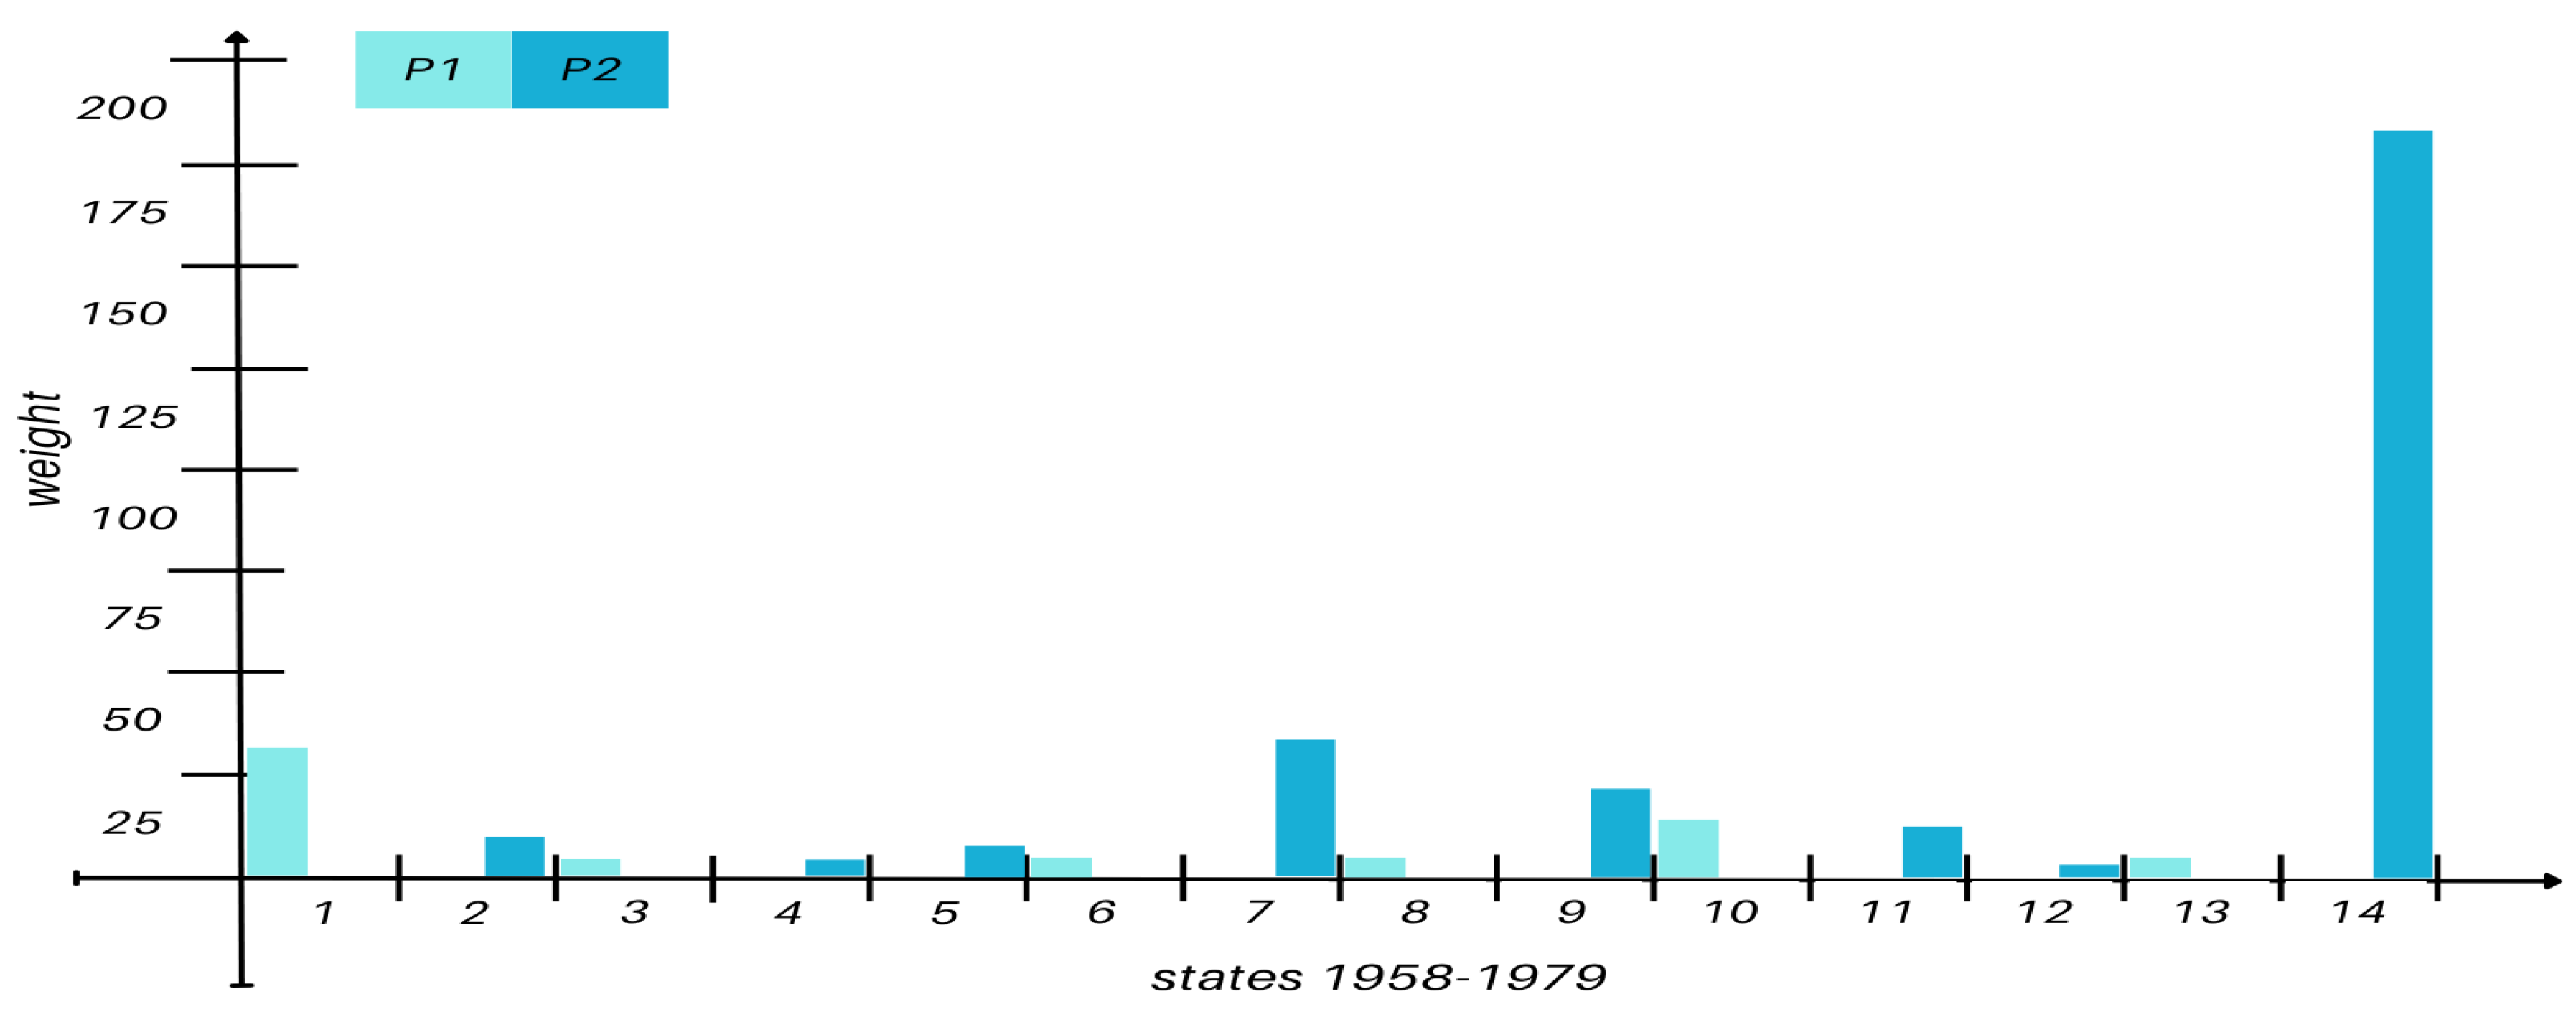
Figure A2.
Steady states weight for the window time corresponding to 1980-1984.
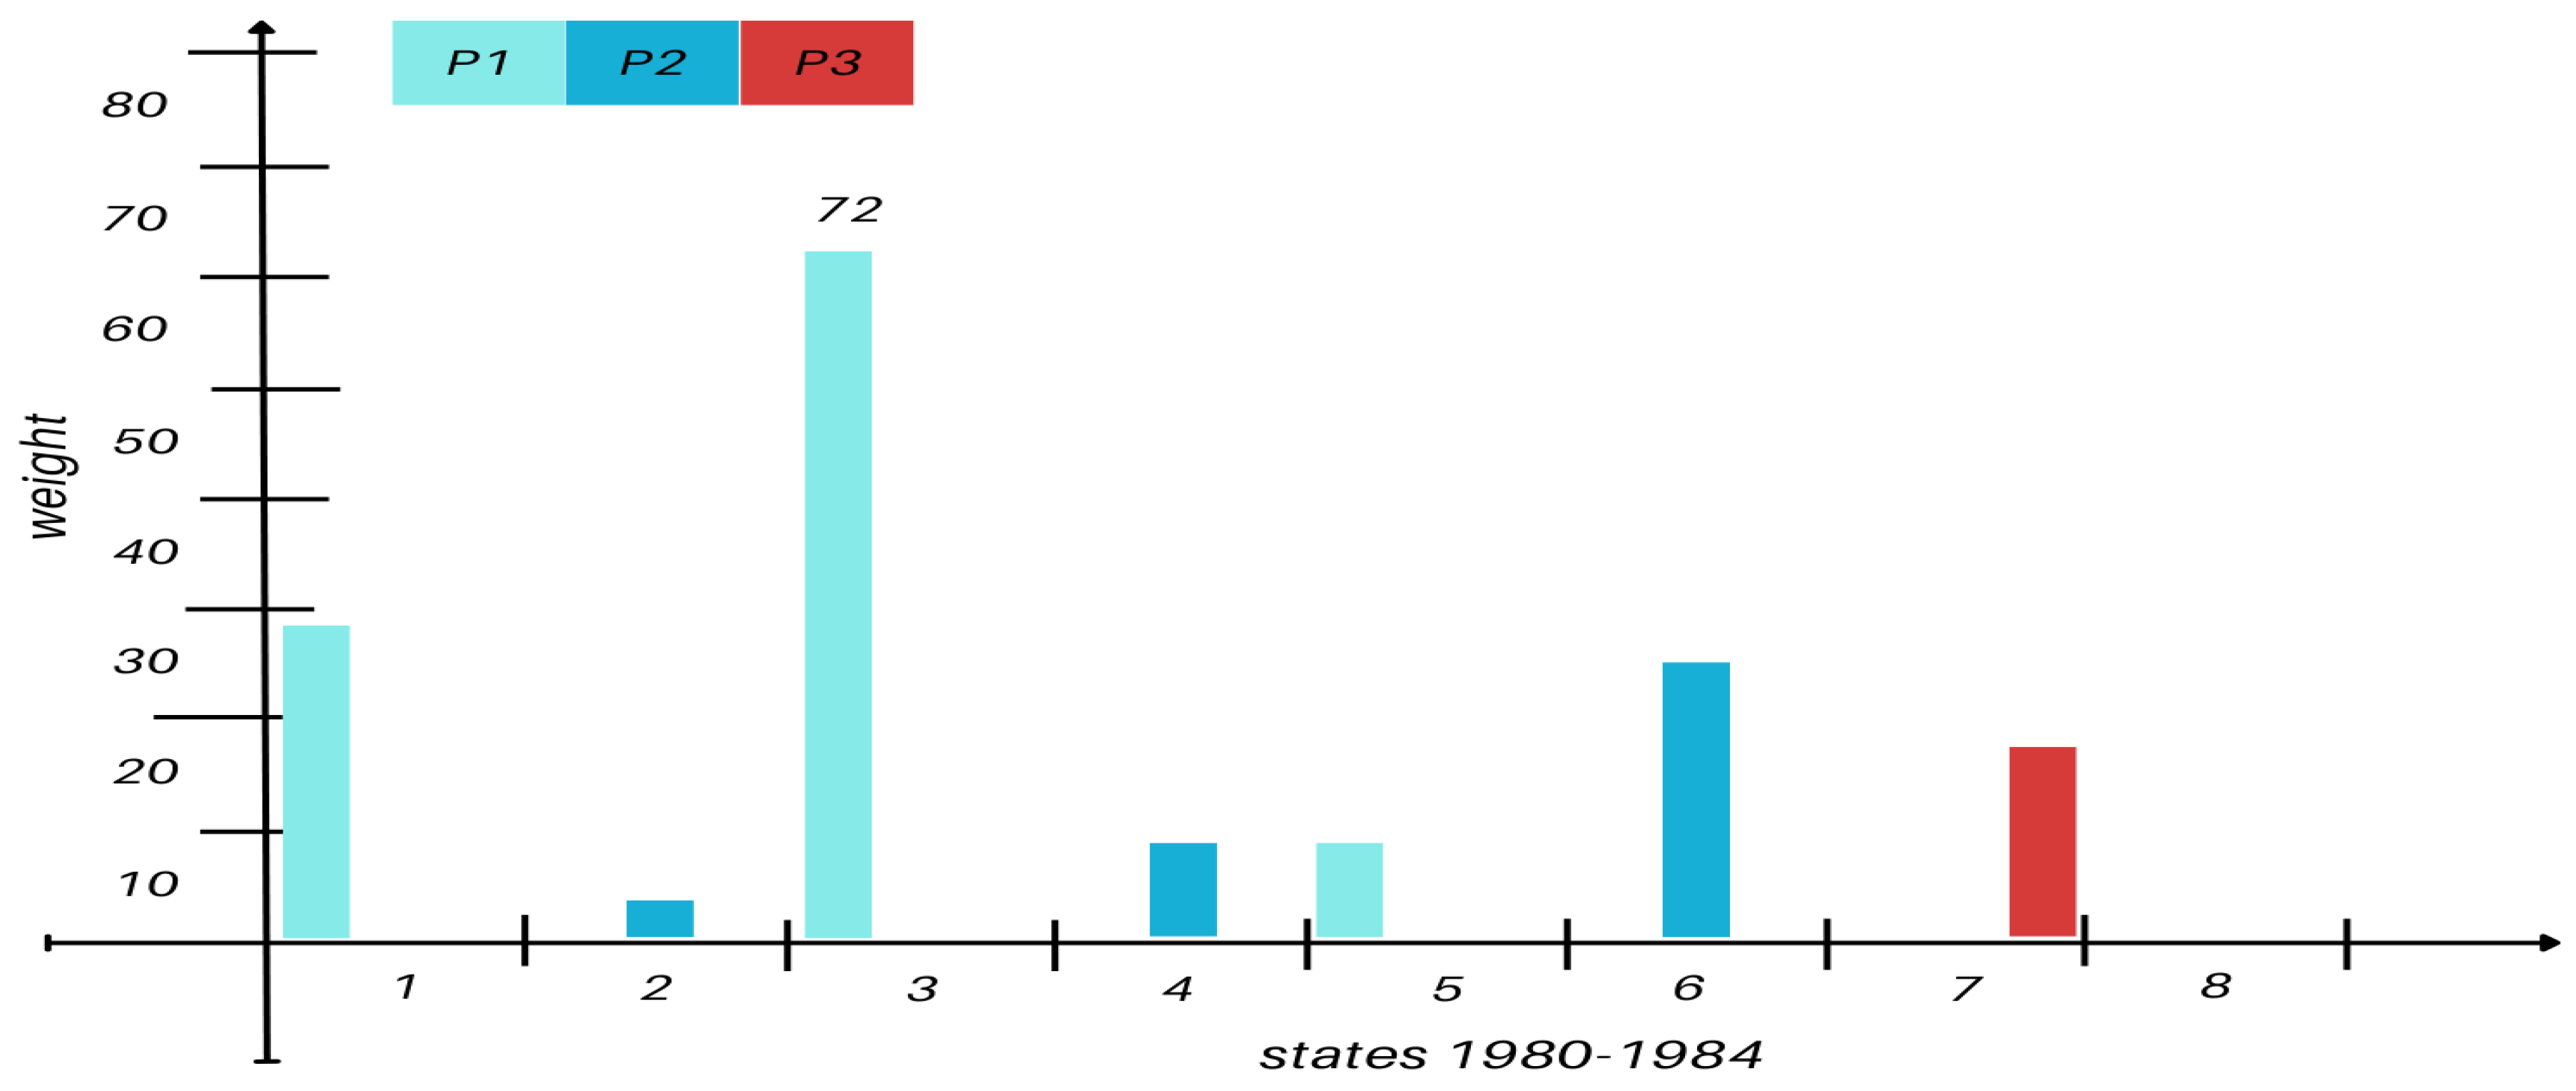
Figure A3.
Steady states transition weight for the years 1985-1989.
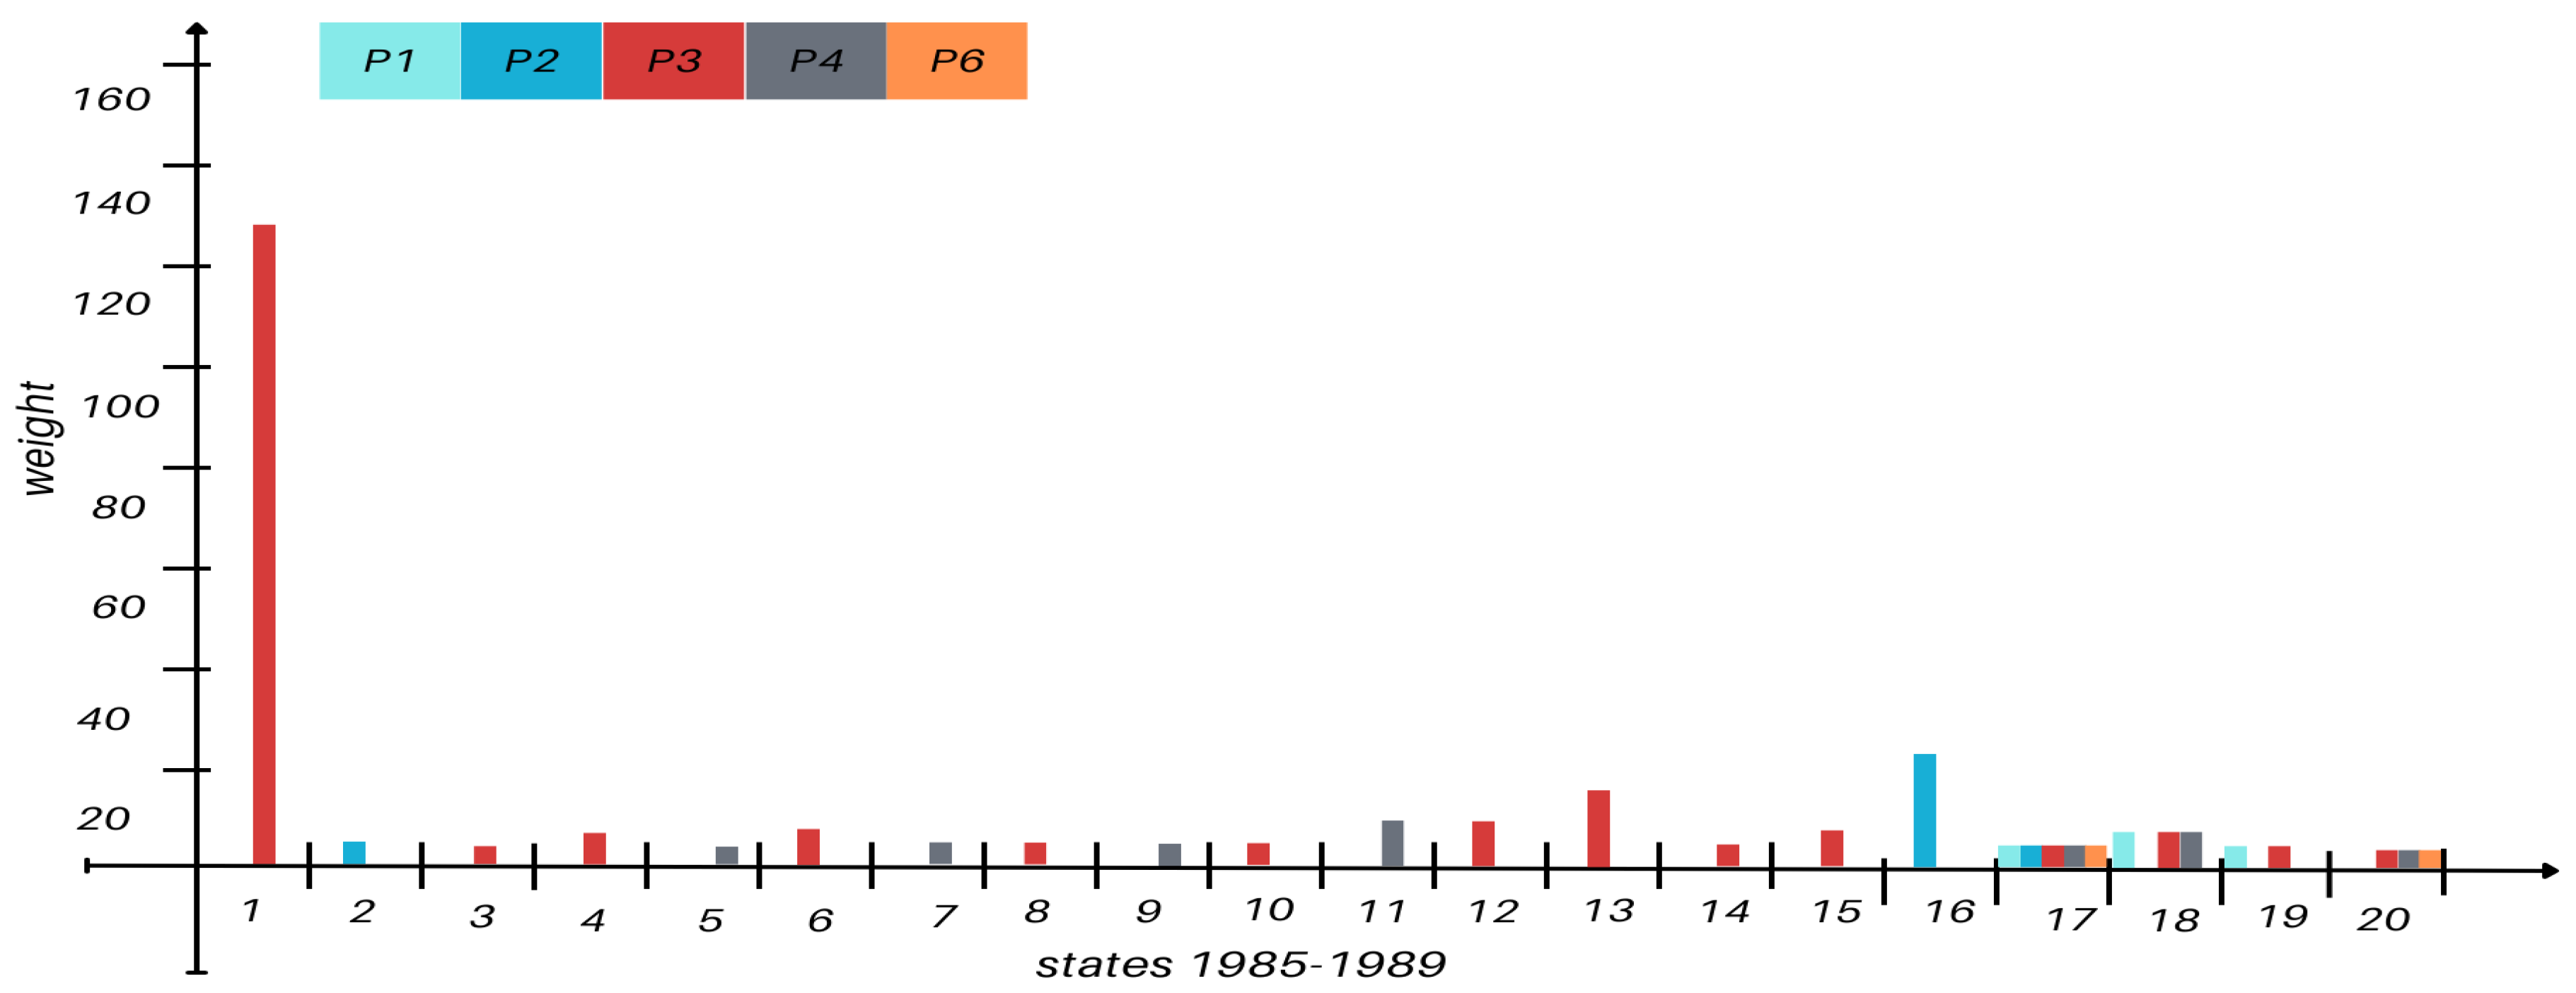
Figure A4.
Steady states transition weight for the years 1990-2004.
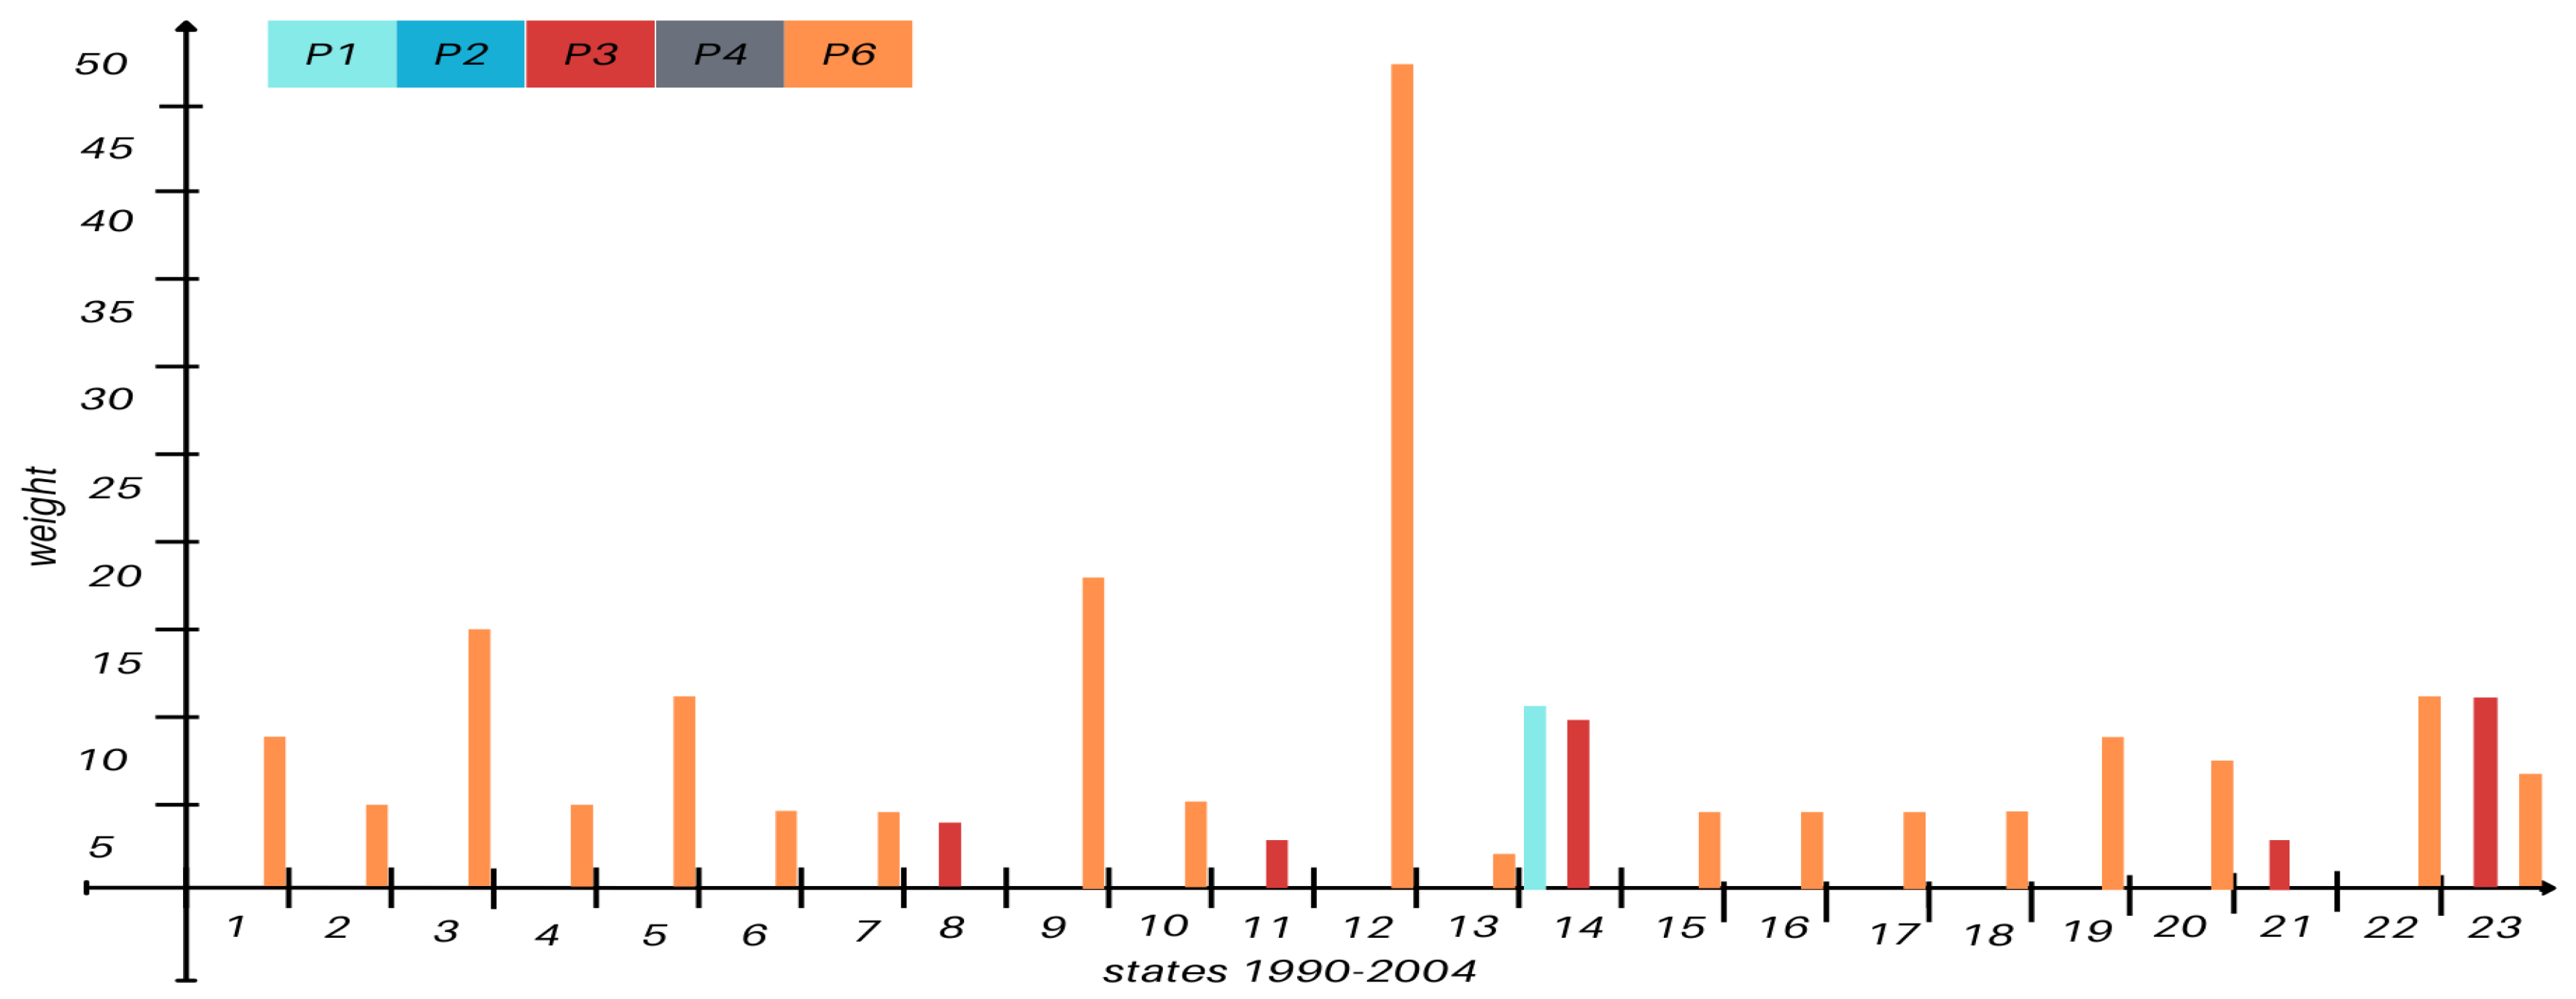
Figure A5.
States interconnection degree in the period of 2005-2009.
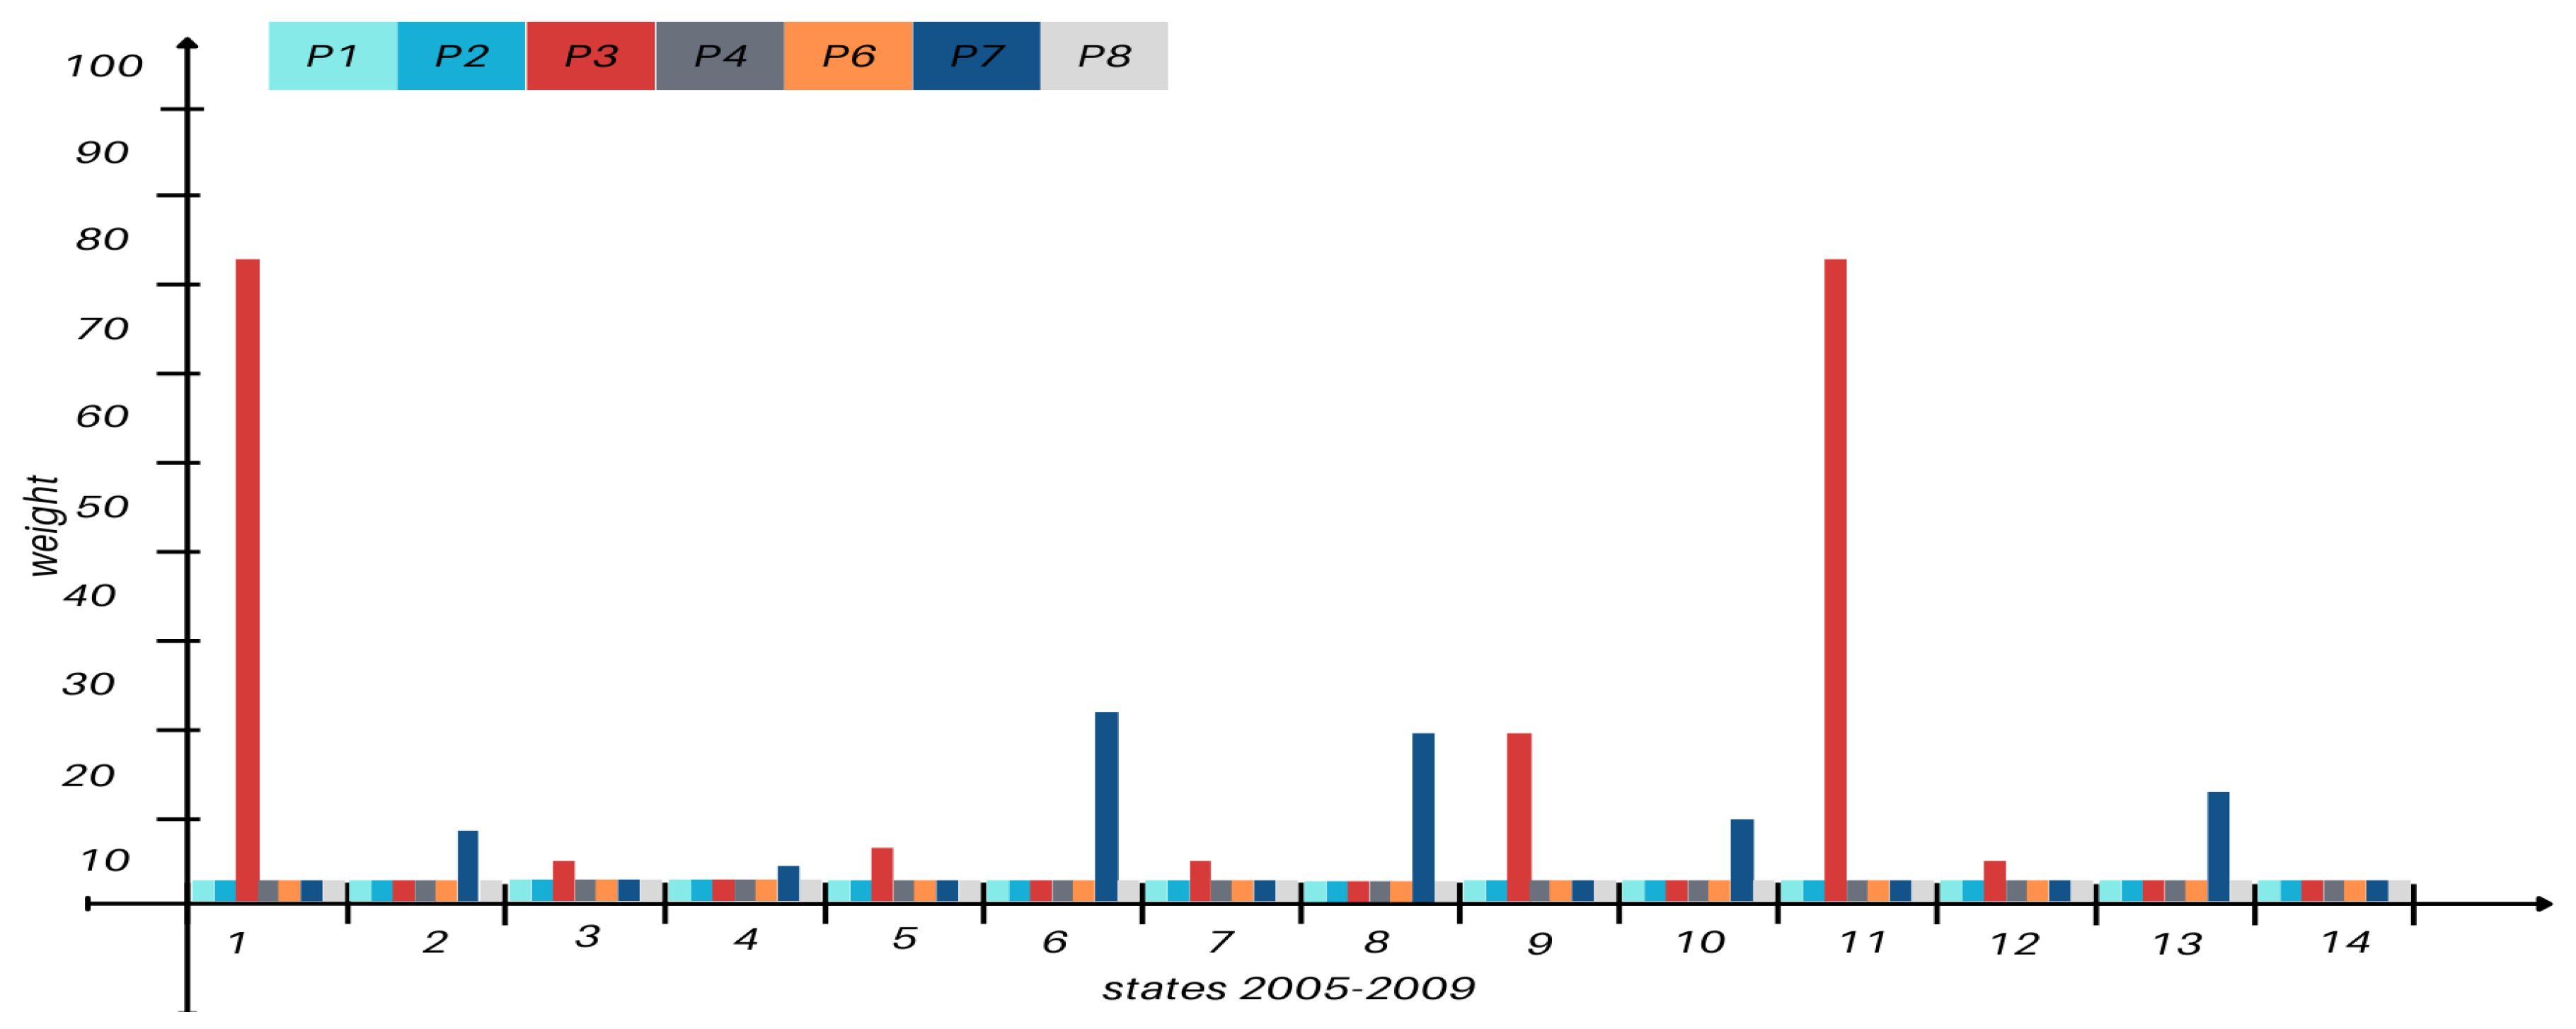
Figure A6.
Preliminary inter-connectivity results for the years 2010-2014.
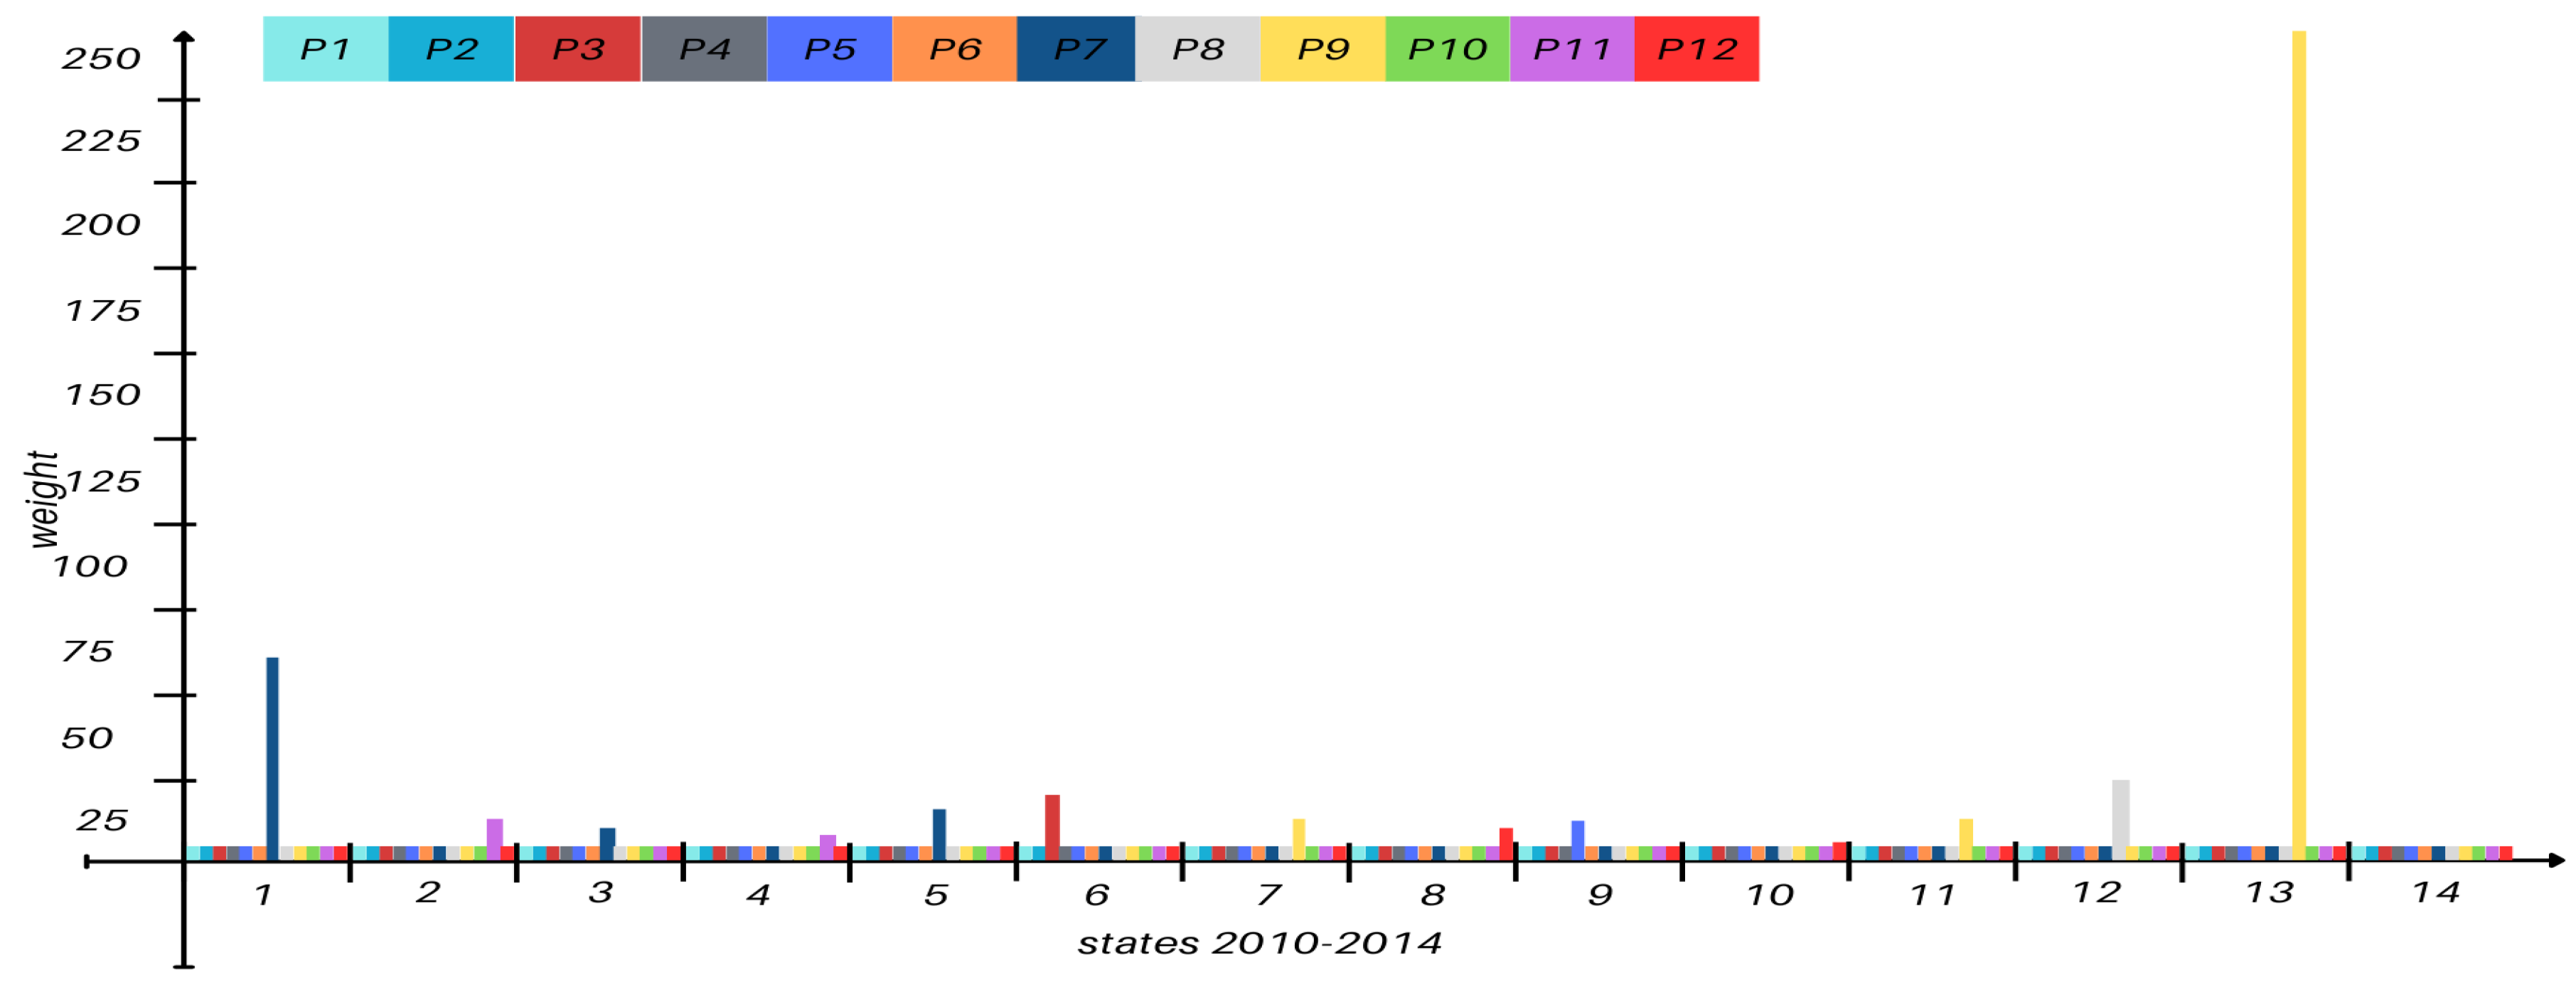
Figure A7.
States interconnection degree in the period of 2015-2019.
References
- Bruce, W. A.. An Electrical Device for Analyzing Oil-reservoir Behavior. SPE Trans. 1943, 151 (01), 112–124. [CrossRef]
- Moreno, G.A.. Multilayer capacitance–resistance model with dynamic connectivities. Journal of Petroleum Science and Engineering 2013, 109, 298–307.
- De-Holanda, R.W., Gildin, E., Jensen, J.L., Lake, L.W., and Kabir, C.S.. A State-of-the-Art Literature Review on Capacitance Resistance Models for Reservoir Characterization and Performance Forecasting. Energies 2018, 11, 3368. [CrossRef]
- Zhang, J., Hu Ch., Deng, B., Li, X., He D., Li, H., Chang, J.. The Application of Computational Geometry Algorithms in Discriminating Direct Injection-Production Connections. International Conference on Materials Engineering and Information Technology Applications 2015, 22 (14).
- Zhao, H; Kang, Z; Zhang, X; Sun, H; Cao, L; Reynolds, A. C.. A Physics-Based Data-Driven Numerical Model for Reservoir History Matching and Prediction With a Field Application. SPE Journal 2016, pp. 2175–2194.
- Guo, Z; Reynolds, A. C.; Zhao, H.. A Physics-Based Data-Driven Model for History Matching, Prediction, and Characterization of Waterflooding Performance. SPE Journal 2018, pp. 367–395.
- Deng, B., Zhang, J., Chang, J., Li, X., Li, H., and Li, X.,. A New Production Splitting Method Based On Discrimination Of Injection-Production Relation. ANZIIS 2019, 22 (14), 5326. [CrossRef]
- Ibrahim, A. F., Al-Dhaif, R., Elkatatny, S., Al-Shehri, D.. Applications of Artificial Intelligence to Predict Oil Rate for High Gas–Oil Ratio and Water-Cut Wells. ACS Omega 2021, 6 (30), 19484–19493.
- Voskresenskiy, A., Bukhanov, N., Katterbauer, K., Alshehri, A.. Well Connectivity Evaluation Based on Additive Explanations. European Association of Geoscientists and Engineers 2022, 2022, 1–3. [CrossRef]
- Du, L.; Liu, Y.; Xue, L.; You, G.. A Deep Learning Framework Using Graph Convolutional Networks for Adaptive Correction of Interwell Connectivity and Gated Recurrent Unit for Performance Prediction. SPE Reservoir Evaluation and Engineering 2022.
- Gao, M.; Wei, C.; Zhao, X.; Huang, R.; Yang, J.; Li. B.. Production Forecasting Based on Attribute-Augmented Spatiotemporal Graph Convolutional Network for a Typical Carbonate Reservoir in the Middle East. Energies 2023, 16(407), 1–21.
- Lacasa, L.; Luque, B.; Ballesteros, F.; Luque, J.; Nuño, J.C.. From time series to complex networks: The visibility graph. Proc. Natl. Acad. Sci. USA 2008, 105, 4972–4975.
- Lacasa, L., Nicosia, V., Latora, V. Network structure of multivariate time series. Sci. Rep. 2015, 5(1), 1–9. [CrossRef]
- Nicosia, V., Bianconi, G., Latora, V., Barthelemy, M.. Growing multiplex networks. Phys. Rev. Lett. 2013, 111(5), 058701. [CrossRef]
- Deng, J. L. Introduction to Grey System. The Journal of Grey System(UK) 1989, 1(1), 1–24.
- Venkateshwaran, B.; Ramkumar, M.; Siddiqui, N. A.; Haque, AKM. E.; Sugavanam, G.; Manobalaji, A.. A Graph Convolutional Network Approach to Qualitative Classification of Hydrocarbon Zones Using Petrophysical Properties in Well Logs. Natural Resources Research, 2024, 33(2). [CrossRef]
- Wu, T.; Wang, Q.; Zhang, Y.; Ying, R.; Cao, K.; Sosic, R.; Jalali, R.; Hamam, H.; Maucec, M.; Leskovec, J.. Learning Large-scale Subsurface Simulations with a Hybrid Graph Network Simulator. KDD 2022.
- Maucec, M.; Jalali, R.. GeoDIN - Geoscience-Based Deep Interaction Networks for Predicting Flow Dynamics in Reservoir Simulation Models. SPE Journal 2022.
- WANG, H.; MU, L.; SHI, F.; LIU, K.; QIAN, Y.. Management and instant query of distributed oil and gas production dynamic data. PETROLEUM EXPLORATION AND DEVELOPMENT 2019, 46, 1014–1021. [CrossRef]
- Xu, X., Zhang, J., Small, M.. Superfamily phenomena and motifs of networks induced from time series. Proc. Natl. Acad. Sci. 2008, 105(50), 19601–19605.
- Packard, N.H., Crutchfield, J.P., Farmer, J.D. & Shaw, R.S.. Geometry from a Time Series. Physical Review Letters 1980, 45(9), 712–716.
Figure 1.
The aggregation of the data yields a transformed data set that contains the information over the years for each one of the wells, as well as we can observe the time span in which the different wells were starting to be active. In the figure, the time was already transformed in a sequence of events to facilitate the modeling.
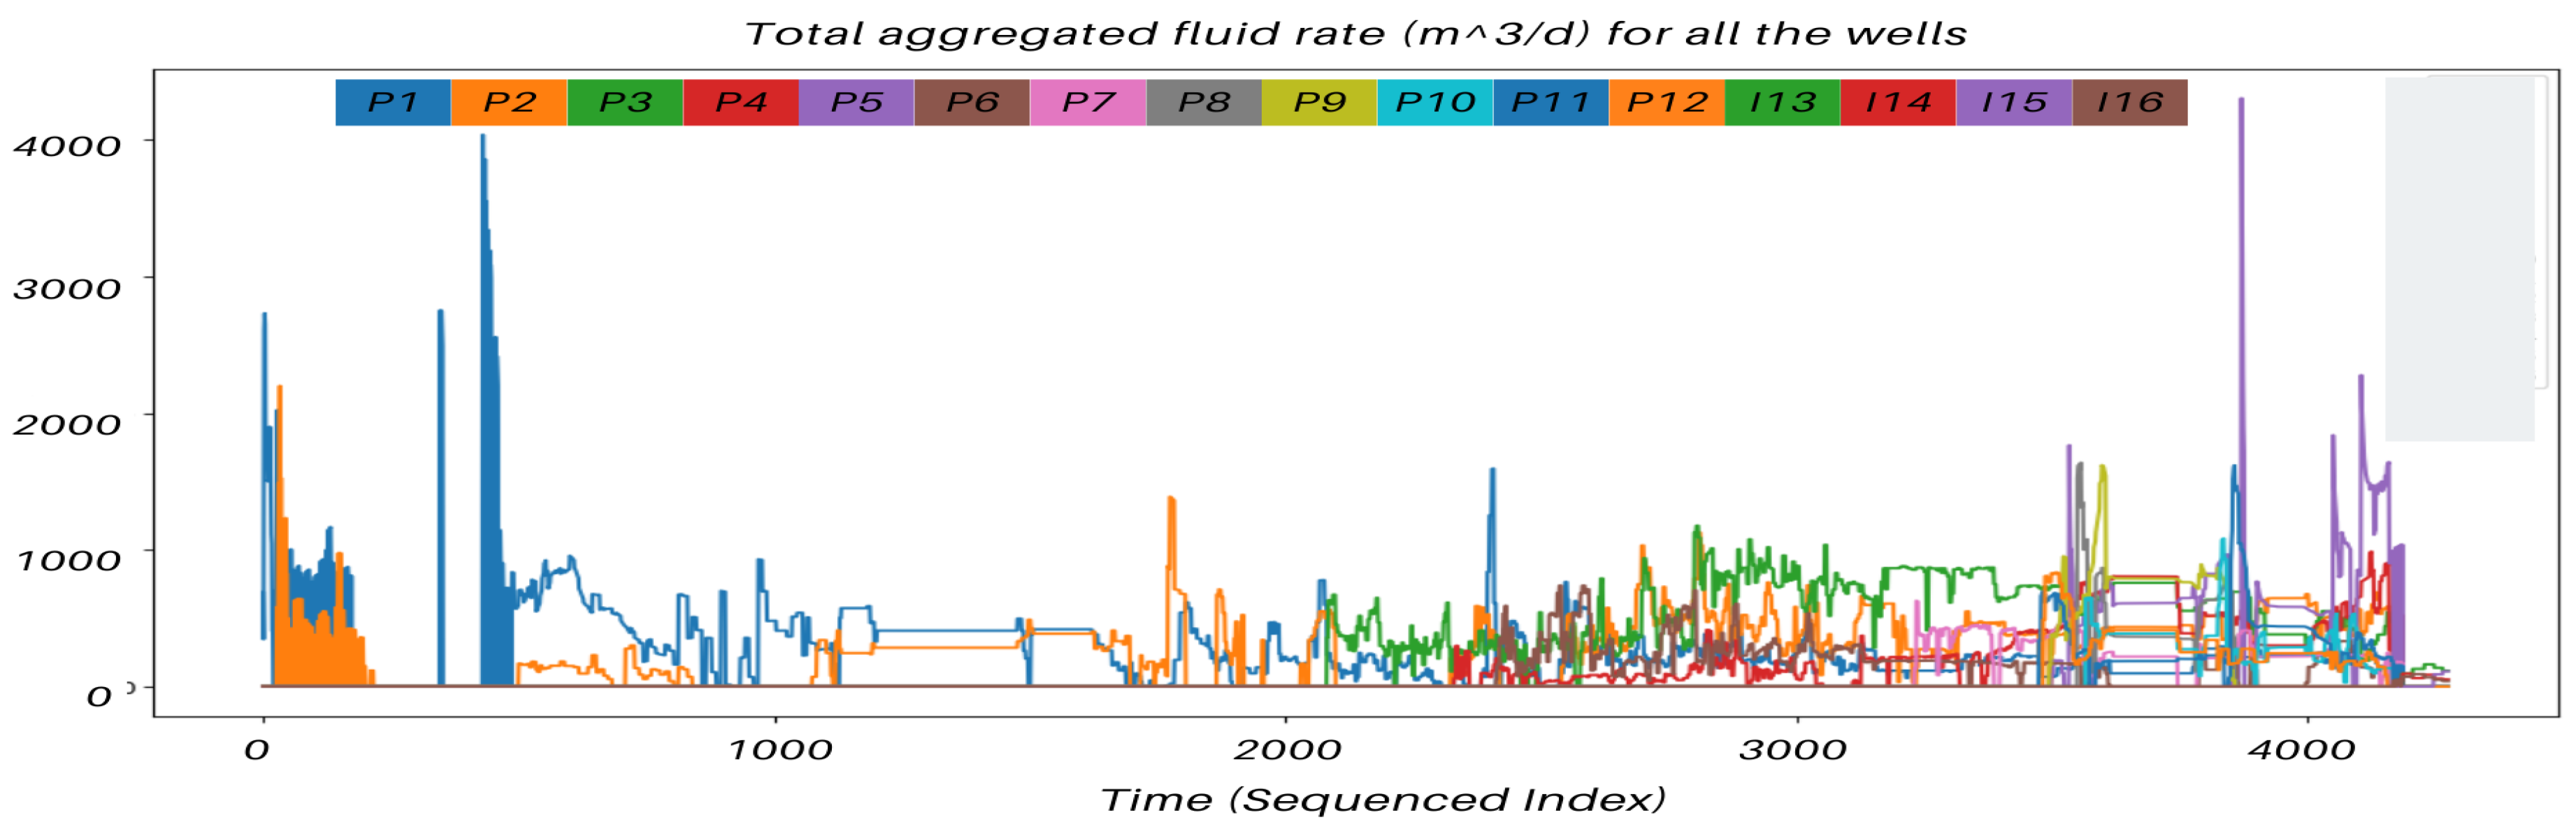
Figure 2.
(a) VG mapping of the time series into a network representation. (b) Complex graph representation of the network.
Figure 2.
(a) VG mapping of the time series into a network representation. (b) Complex graph representation of the network.
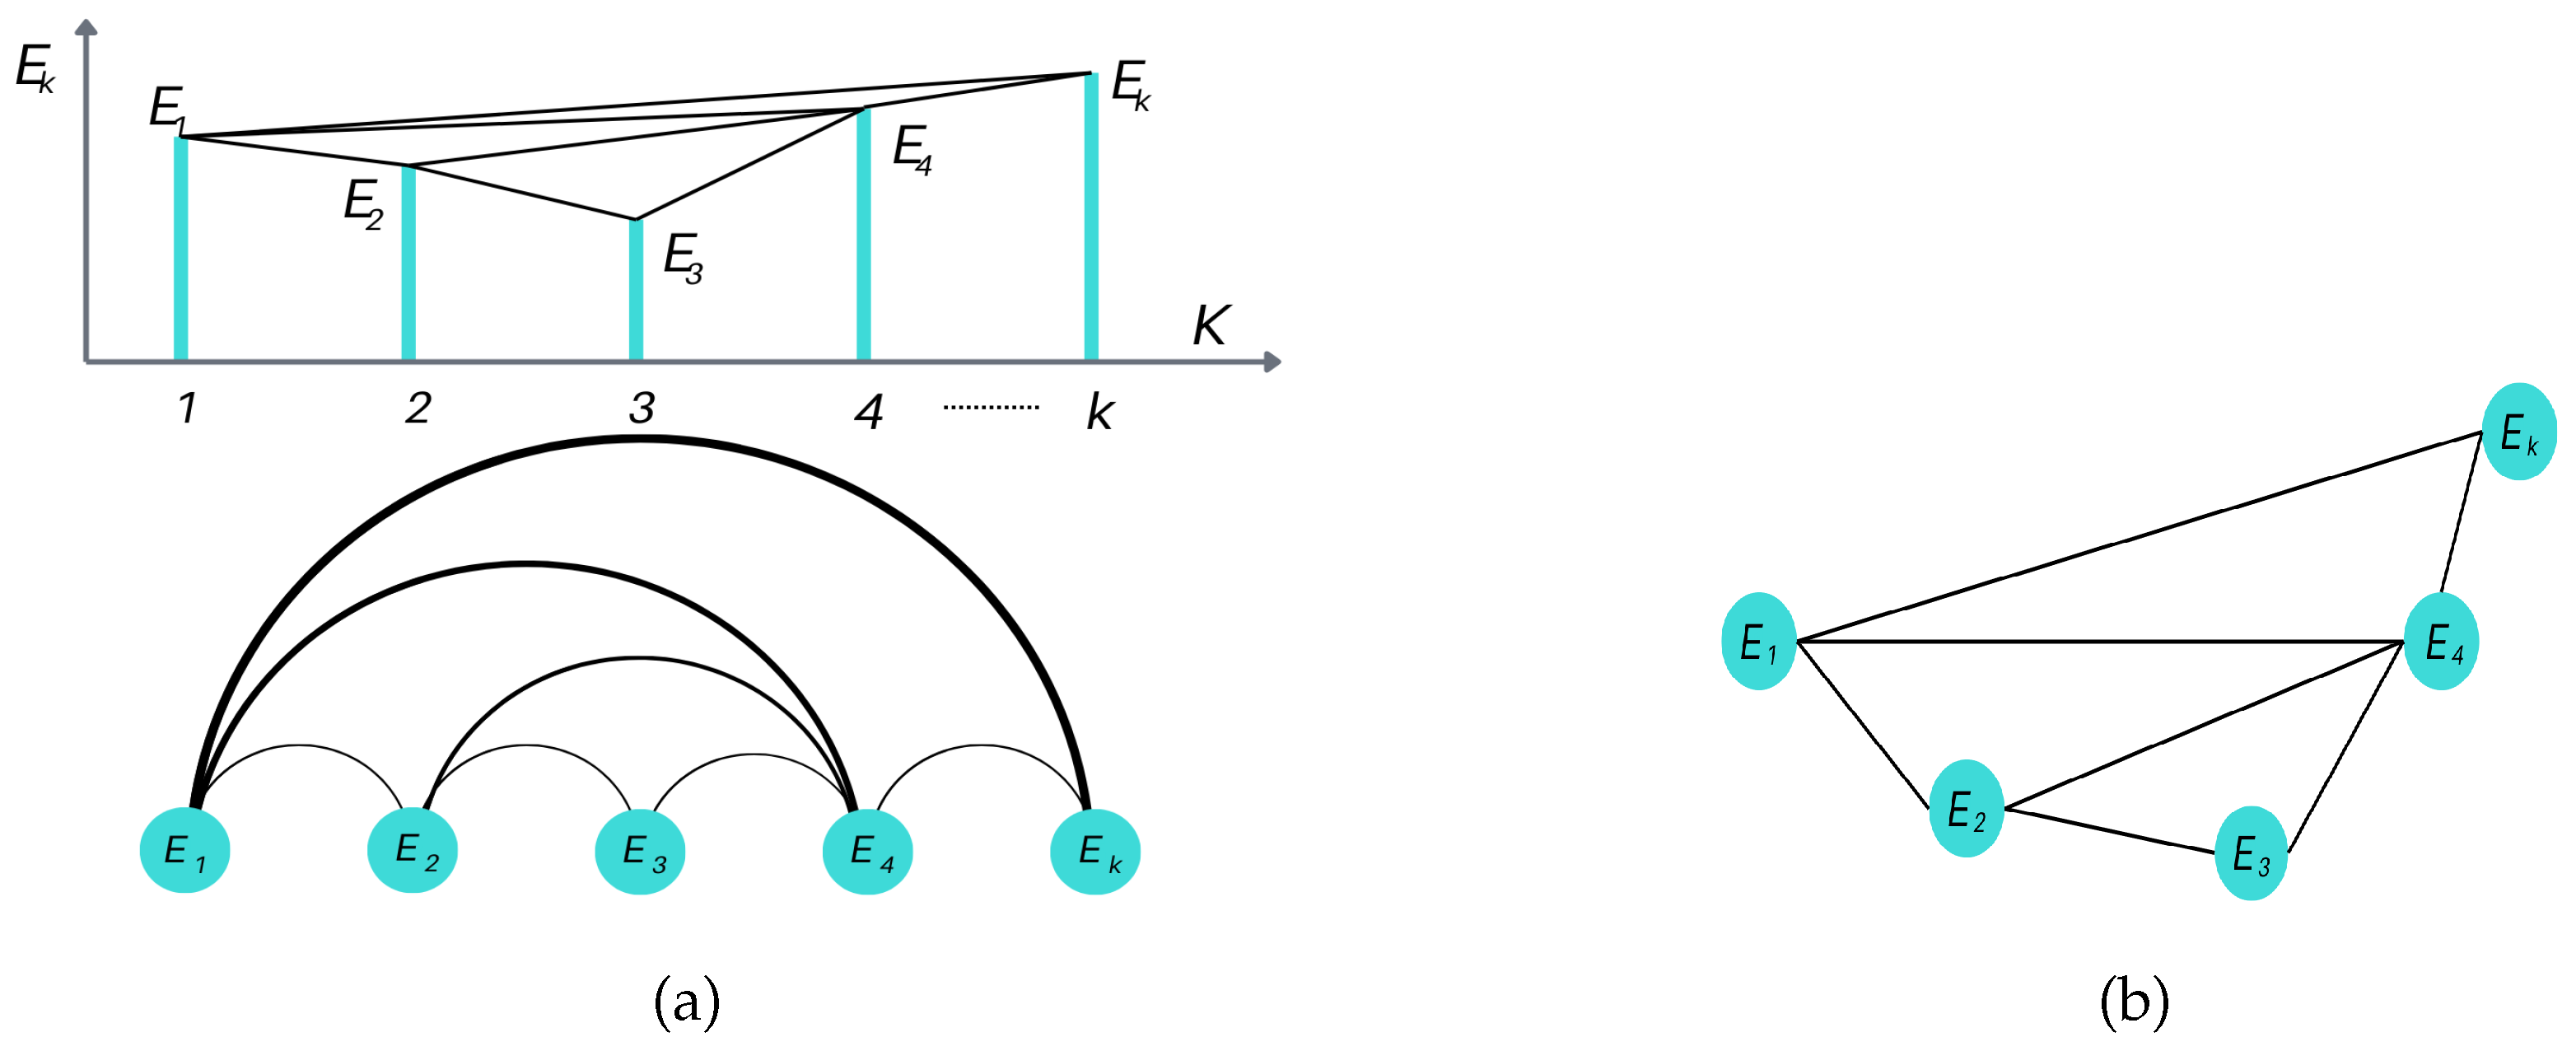
Figure 3.
Multiplex Visibility Graph (MVG). The layered stack of VGs allows understanding all wells’ causal connections among events.
Figure 3.
Multiplex Visibility Graph (MVG). The layered stack of VGs allows understanding all wells’ causal connections among events.
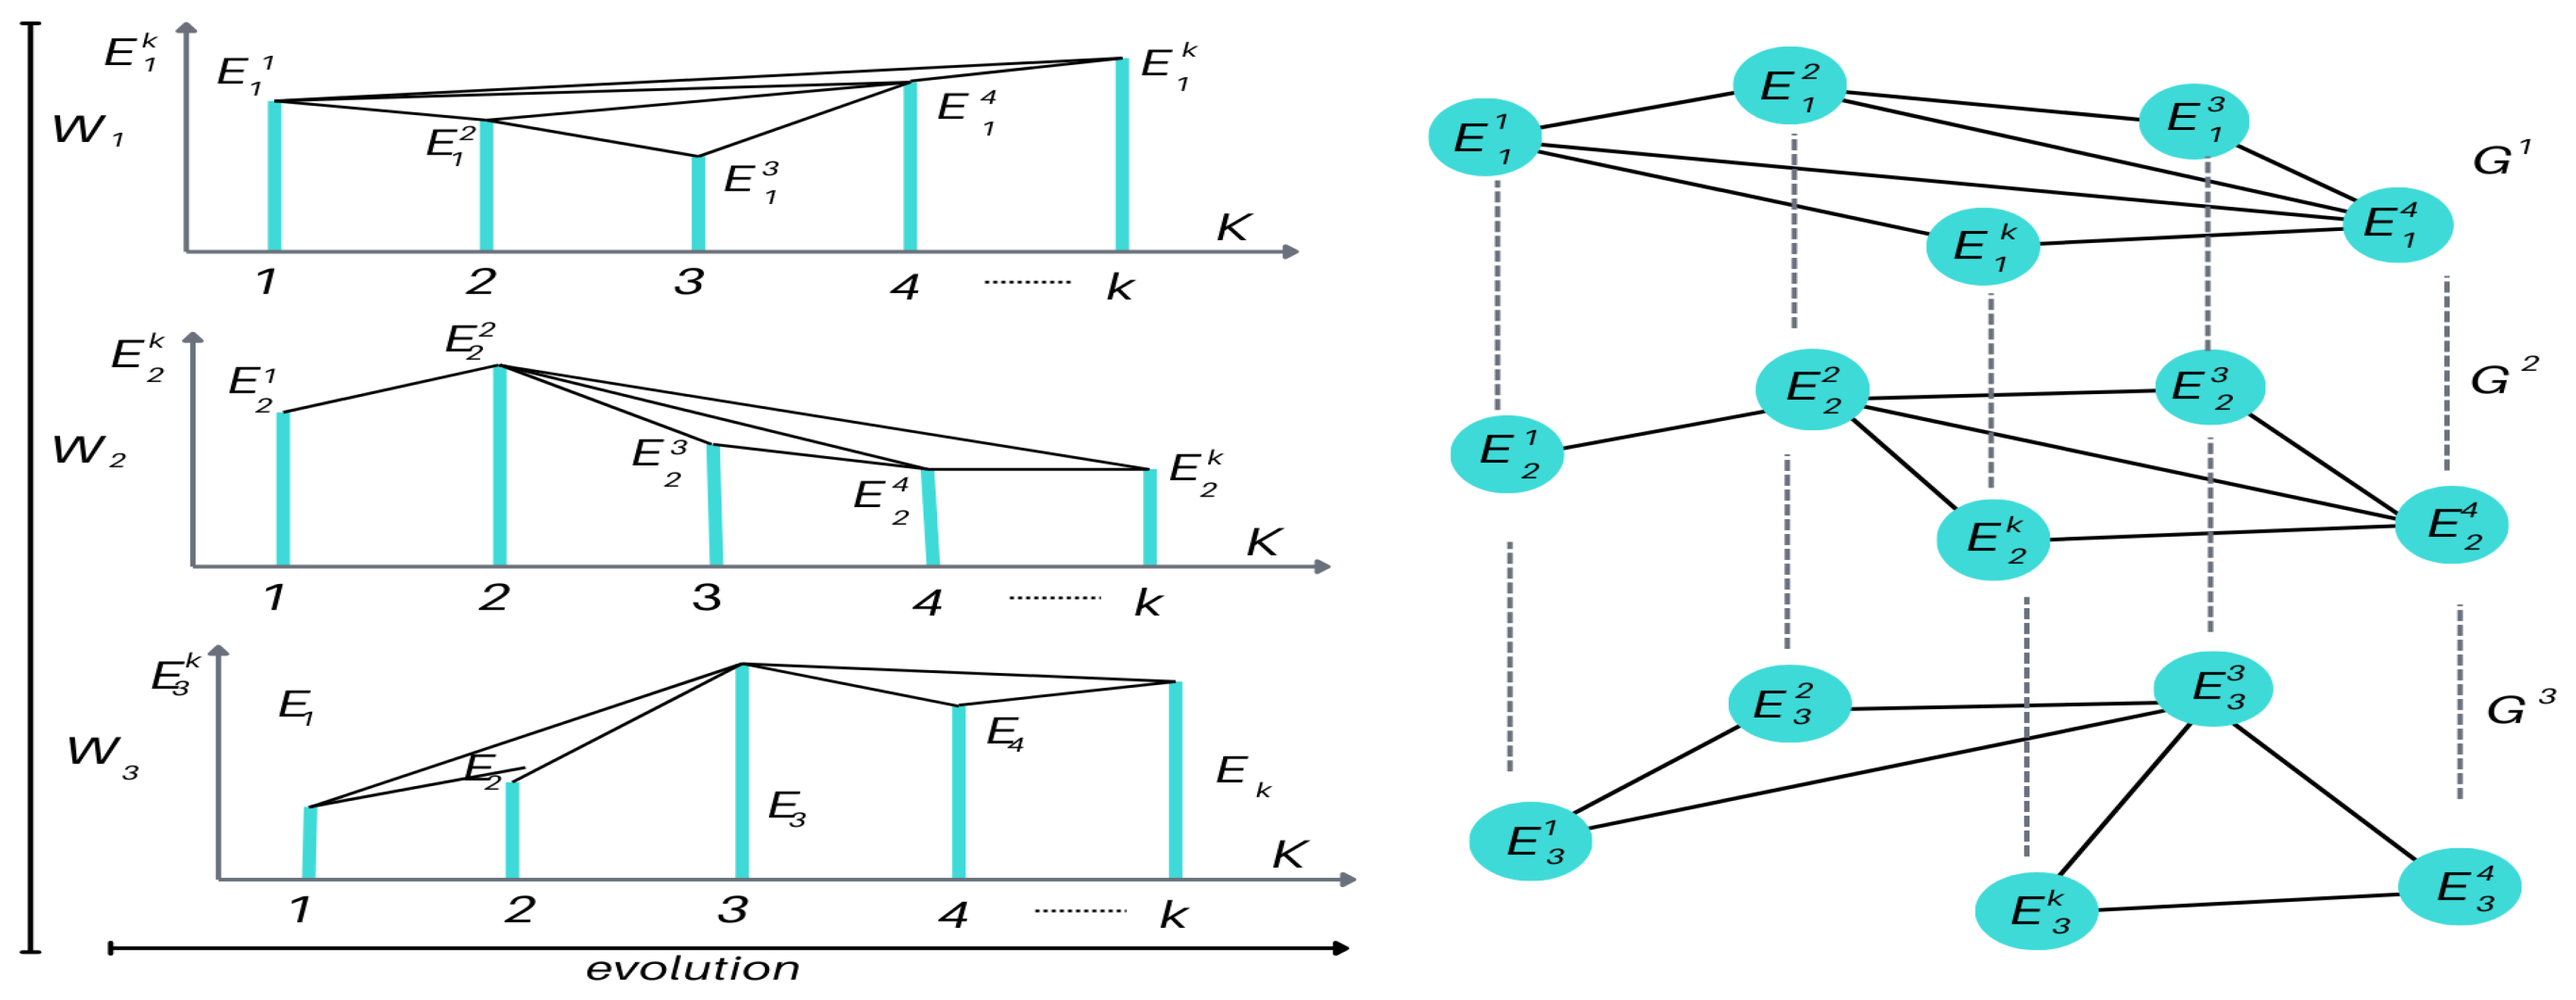
Figure 4.
More important states for a system having 16 production and injection wells. The figure shows the importance of each state configuration in color, with the last one being the basal state or more stable state configuration. The interconnections found at that level are highlighted in red.
Figure 4.
More important states for a system having 16 production and injection wells. The figure shows the importance of each state configuration in color, with the last one being the basal state or more stable state configuration. The interconnections found at that level are highlighted in red.
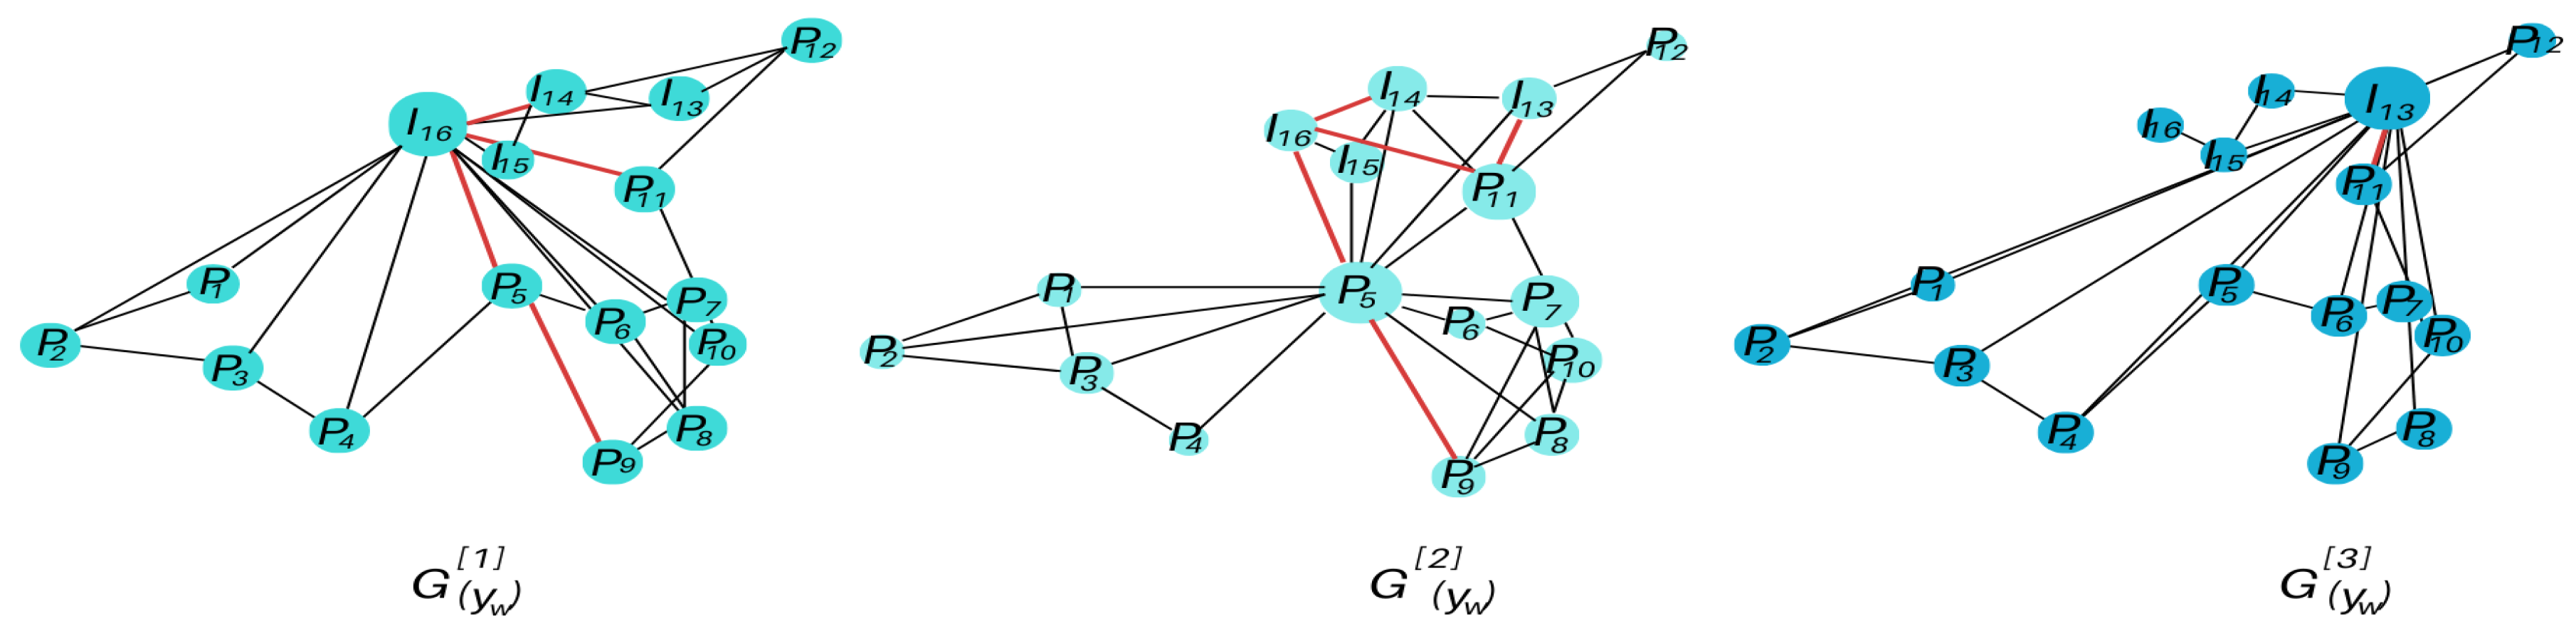
Figure 5.
Method’s sequence of steps.
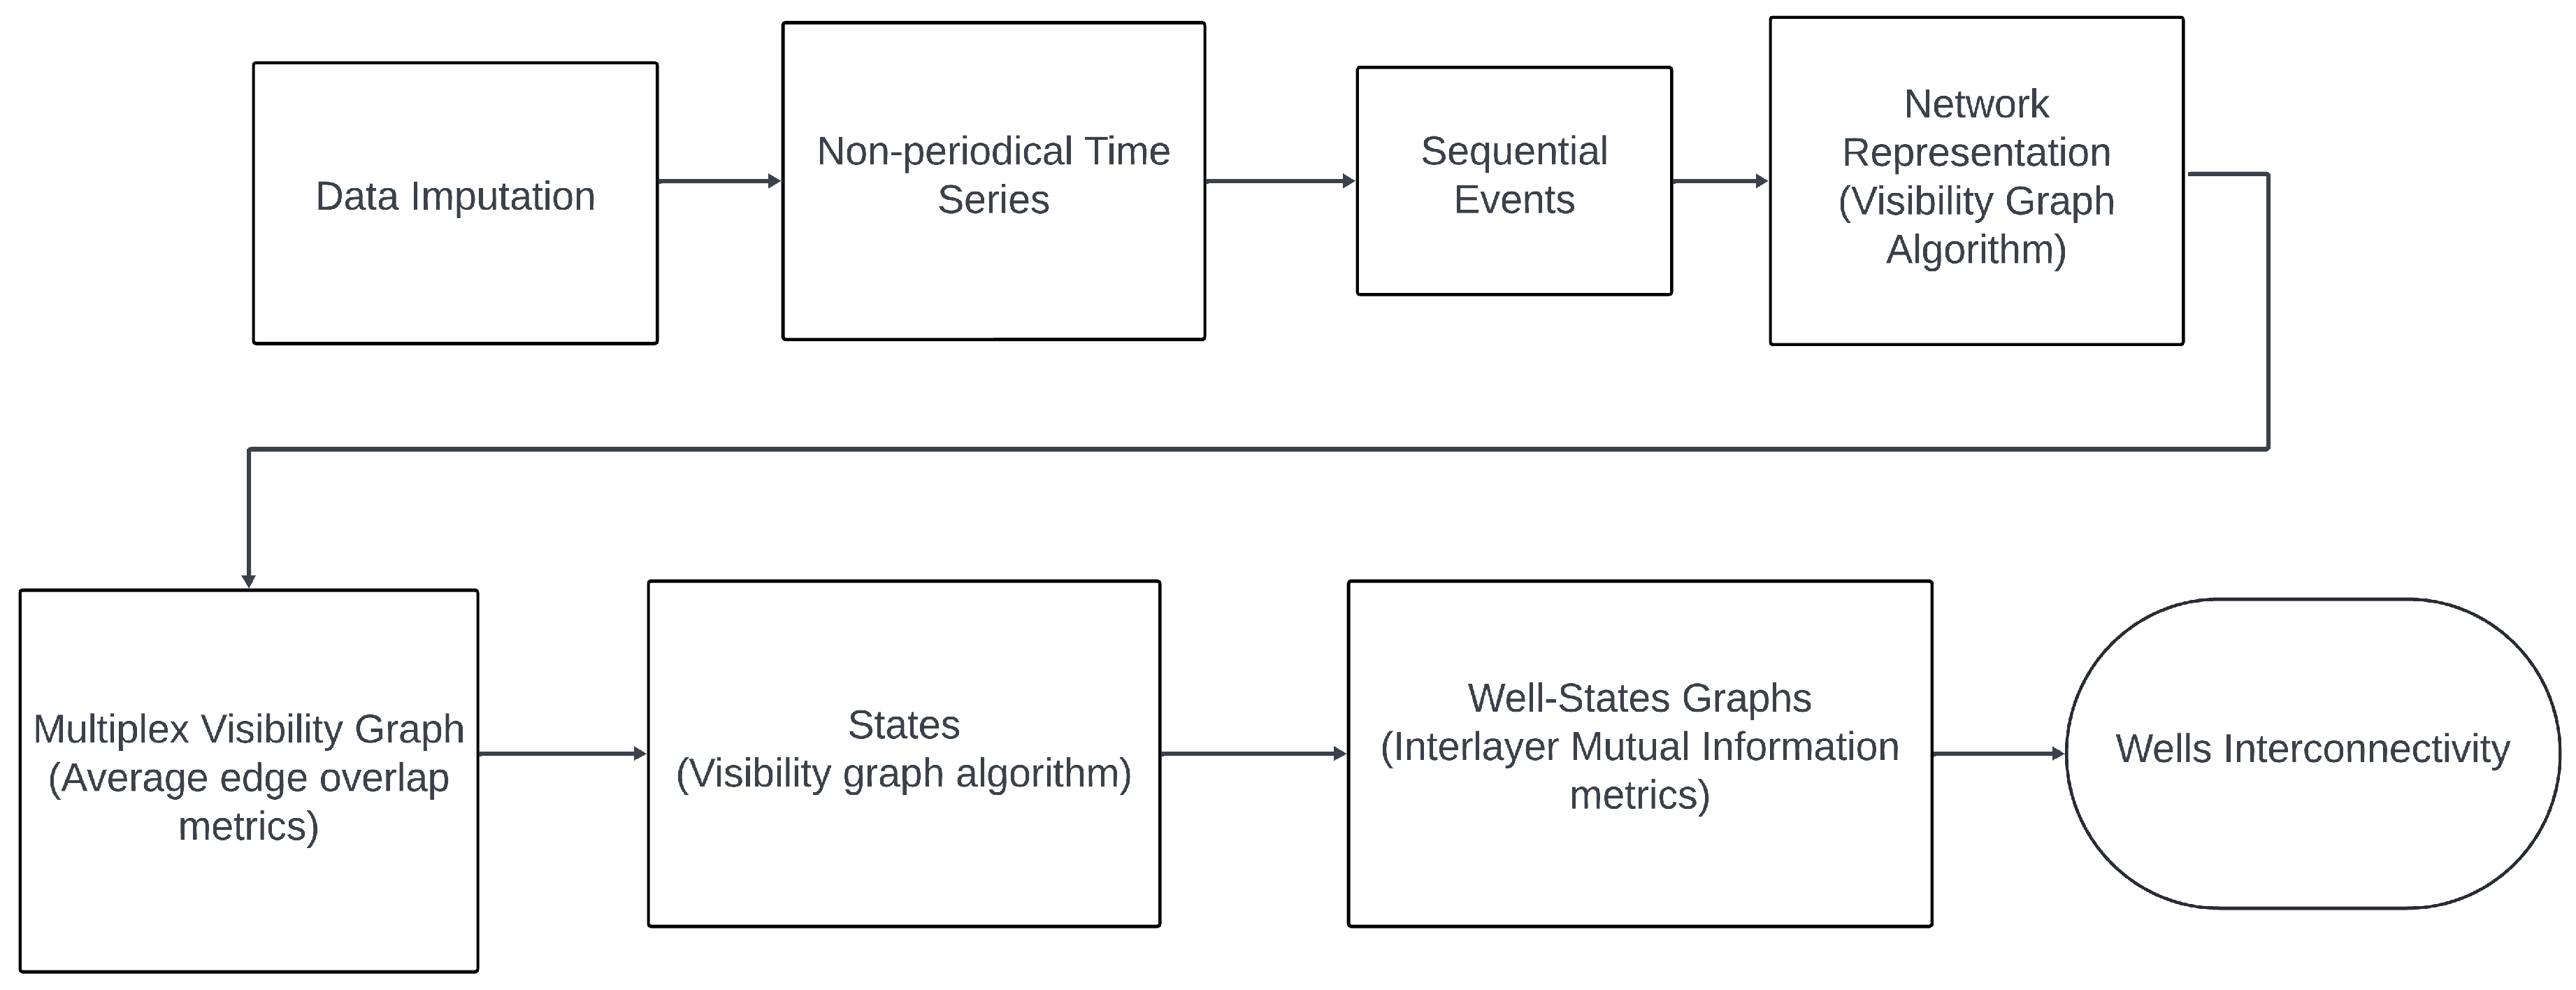
Figure 6.
Schematic localization of the analyzed wells. Sixteen wells, denoted by , are analyzed within the period from 1958 to 2020.
Figure 6.
Schematic localization of the analyzed wells. Sixteen wells, denoted by , are analyzed within the period from 1958 to 2020.
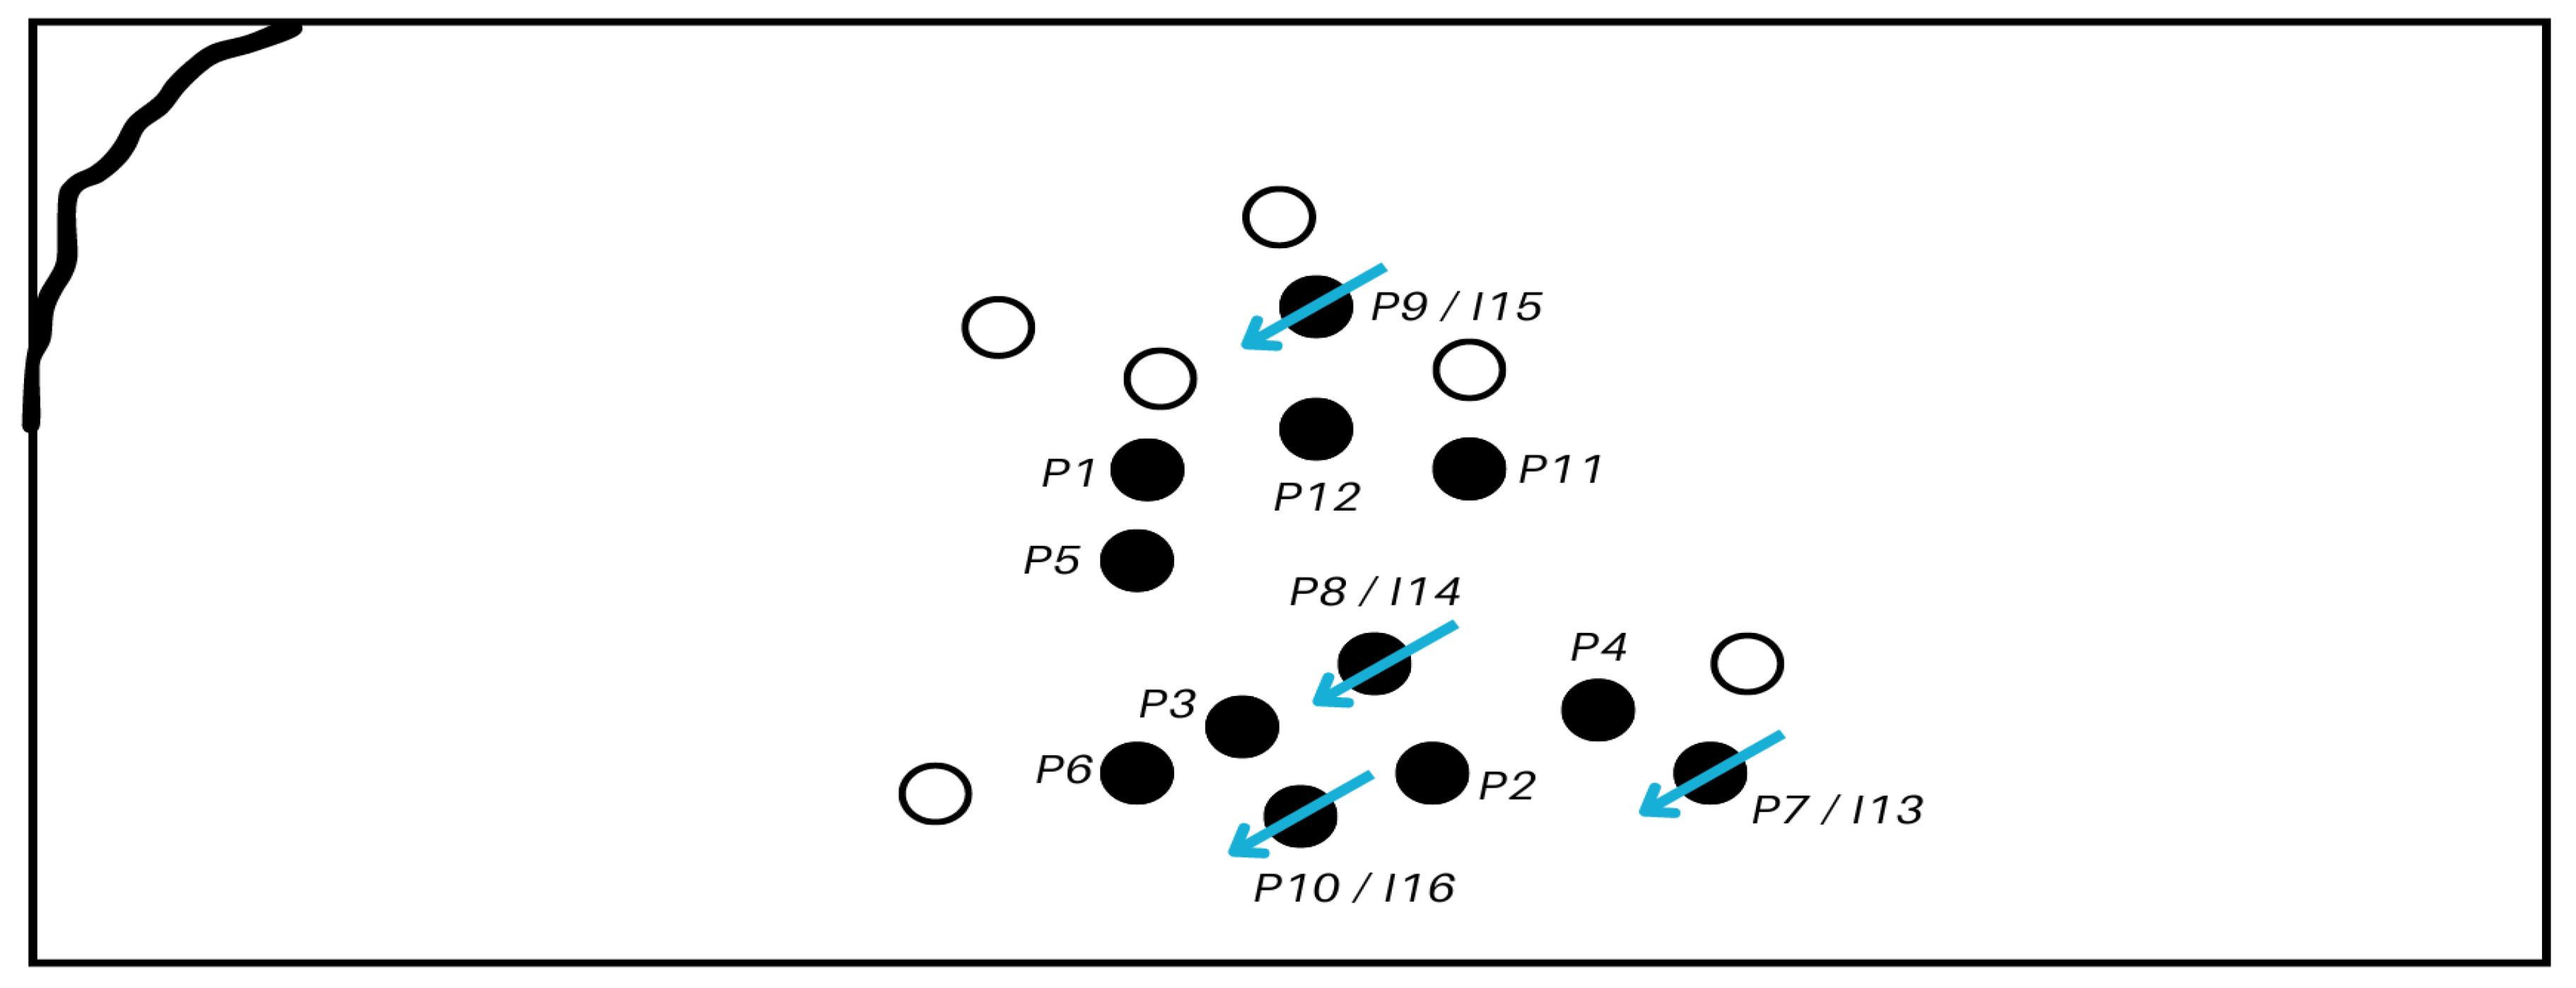
Figure 7.
Main wells-state graphs for the transition states observed during the evolution of the year 2020.
Figure 7.
Main wells-state graphs for the transition states observed during the evolution of the year 2020.
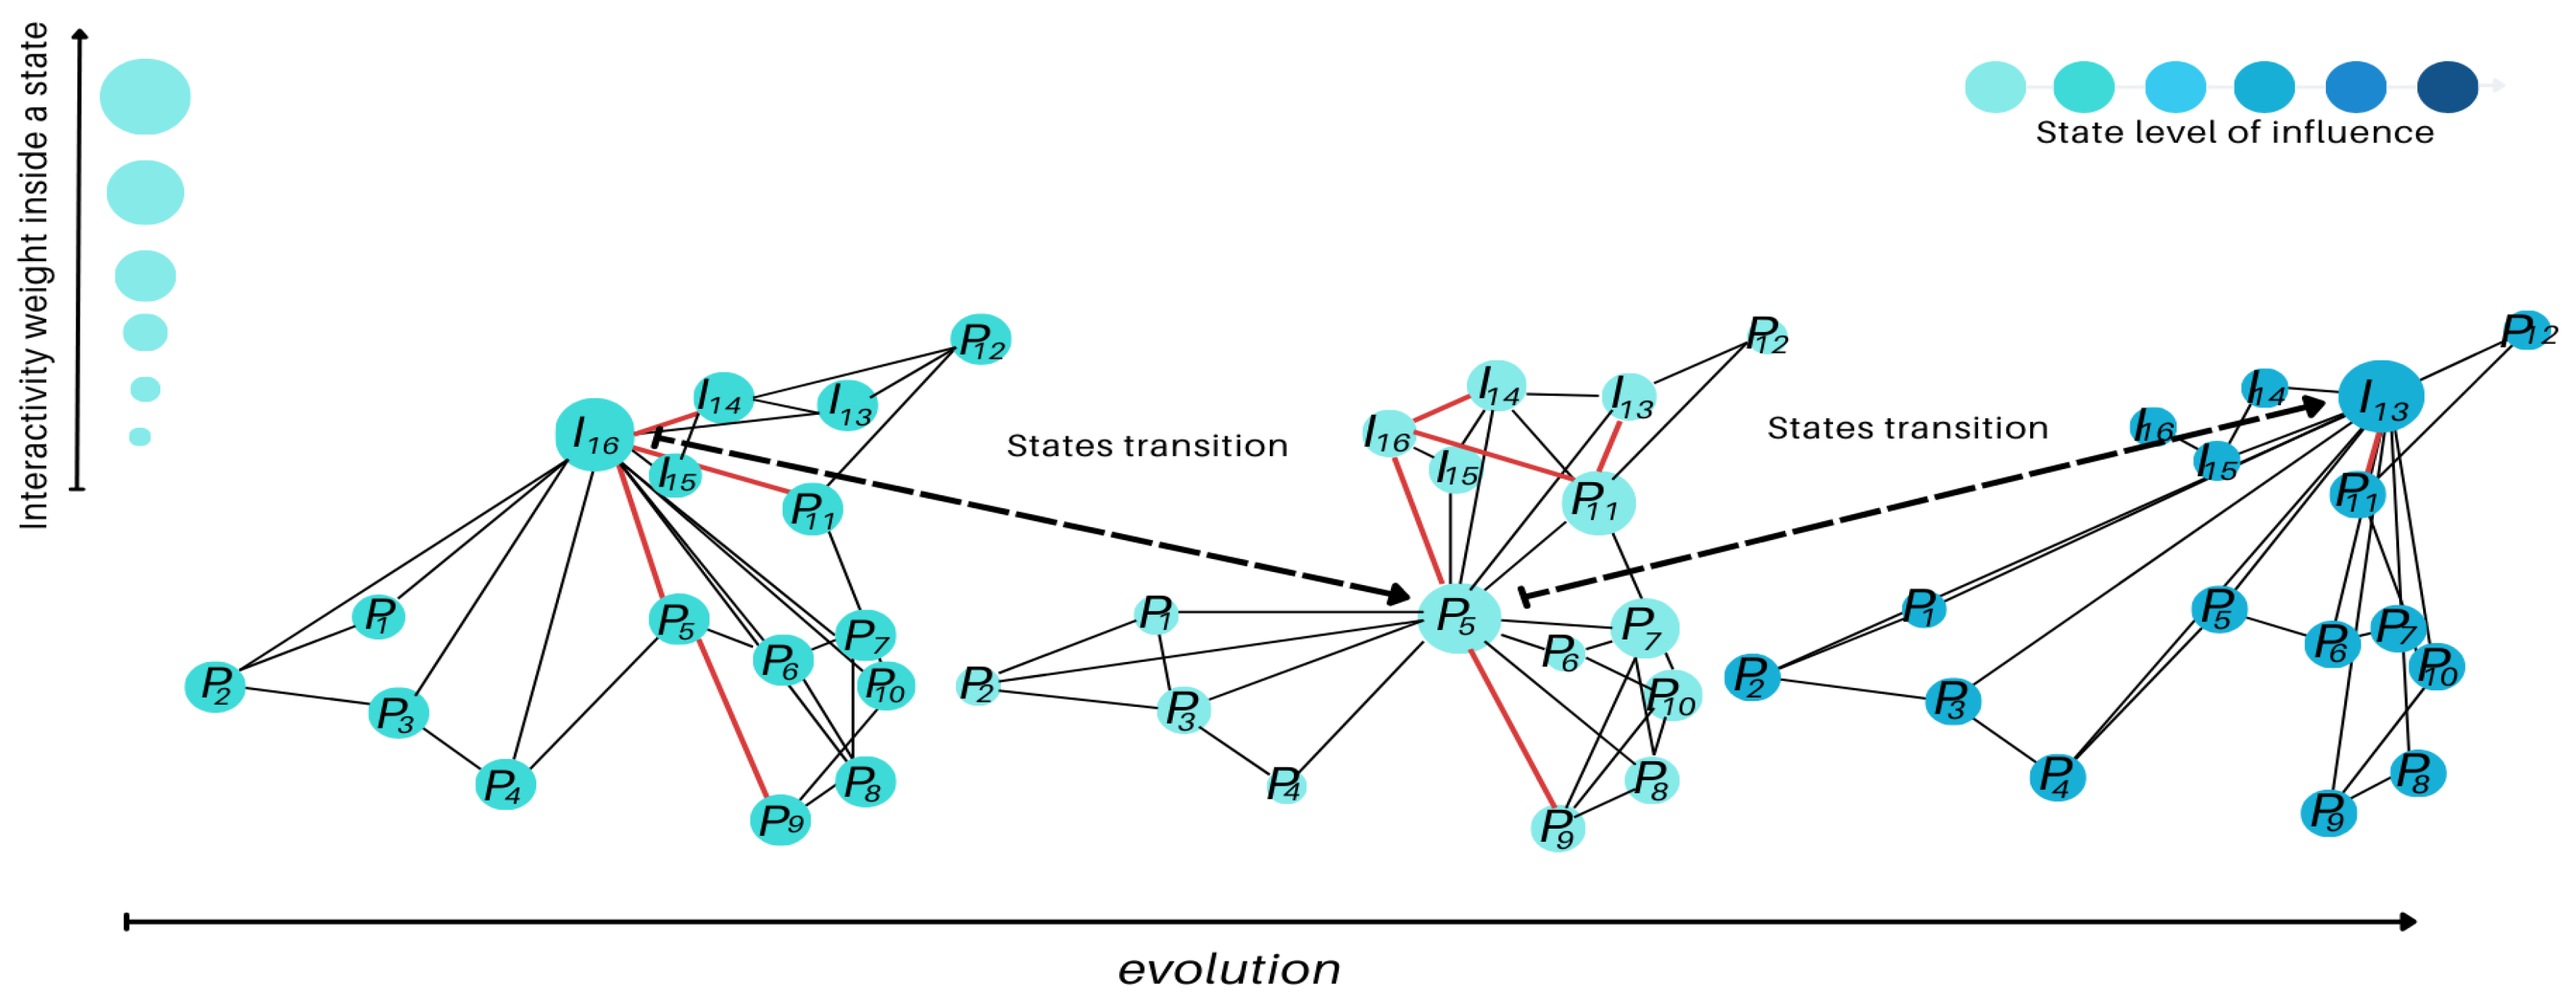
Figure 8.
Historically important periods based on wells activity.
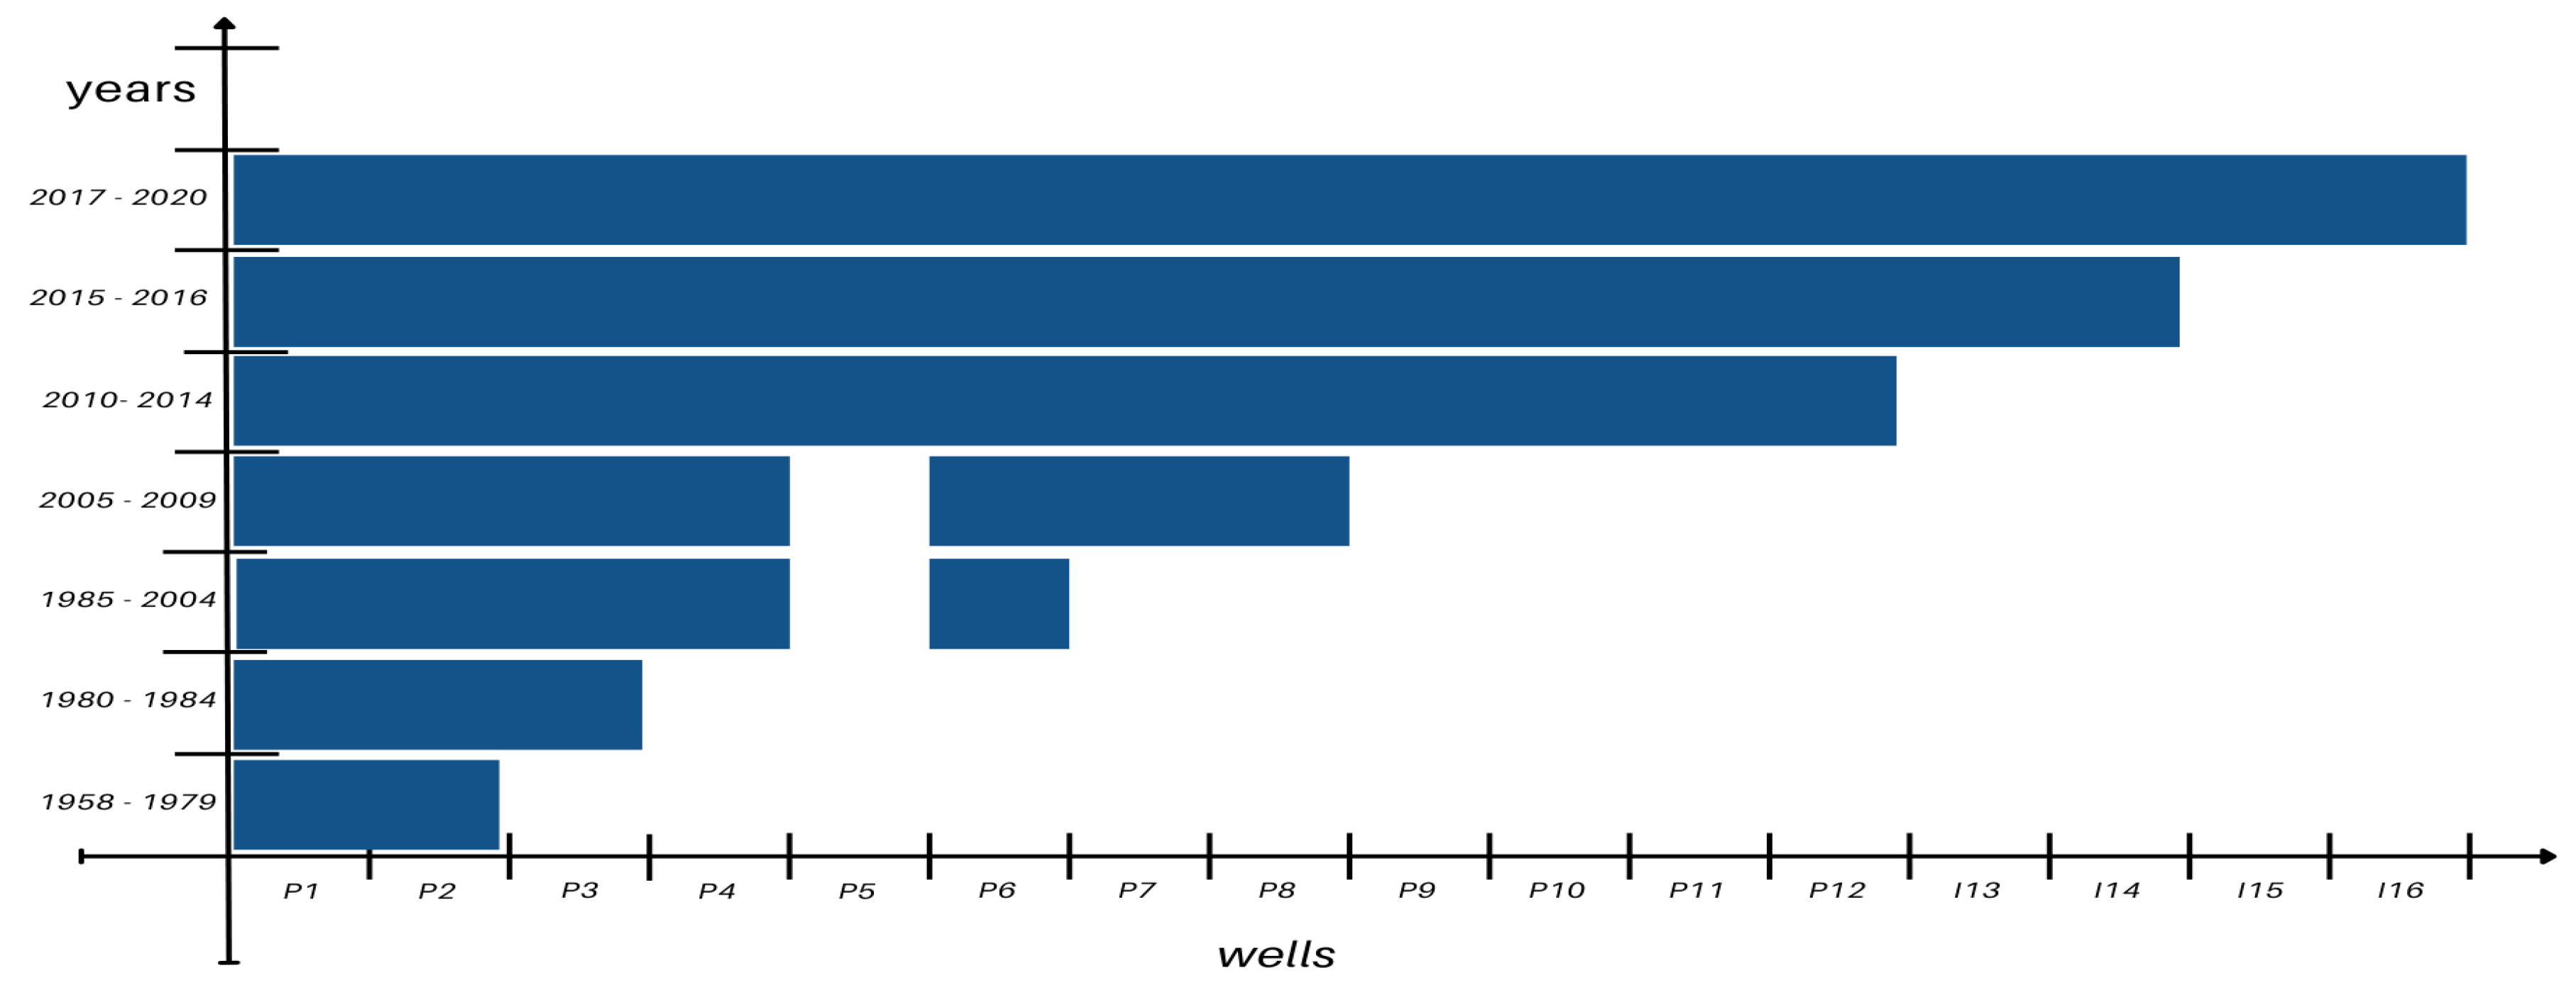
Figure 9.
Evolution and states transition over the years 1958 - 2009.
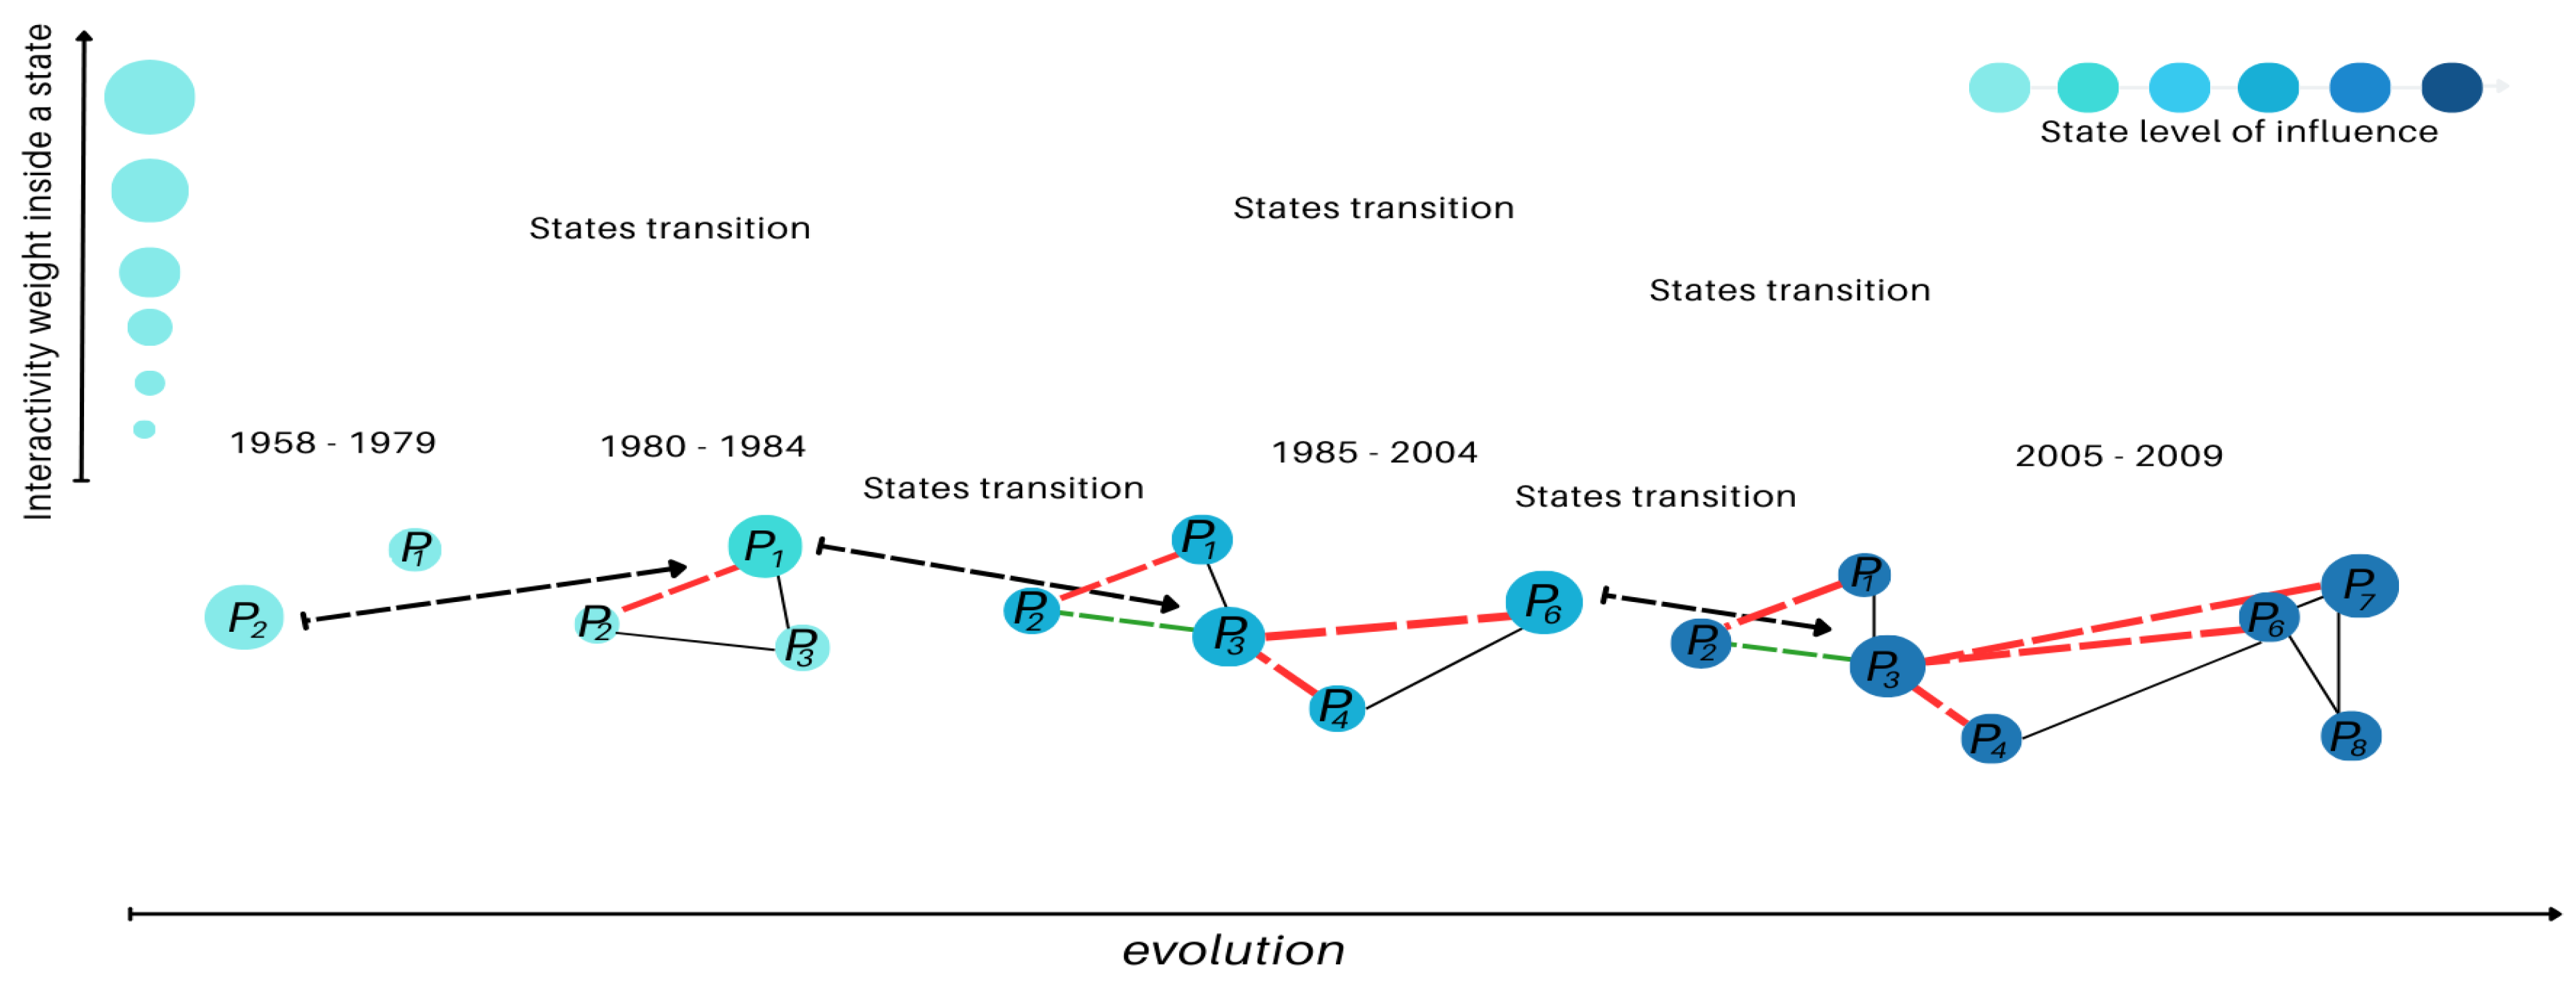
Figure 10.
Evolution and states transition over the years 2010 - 2019.
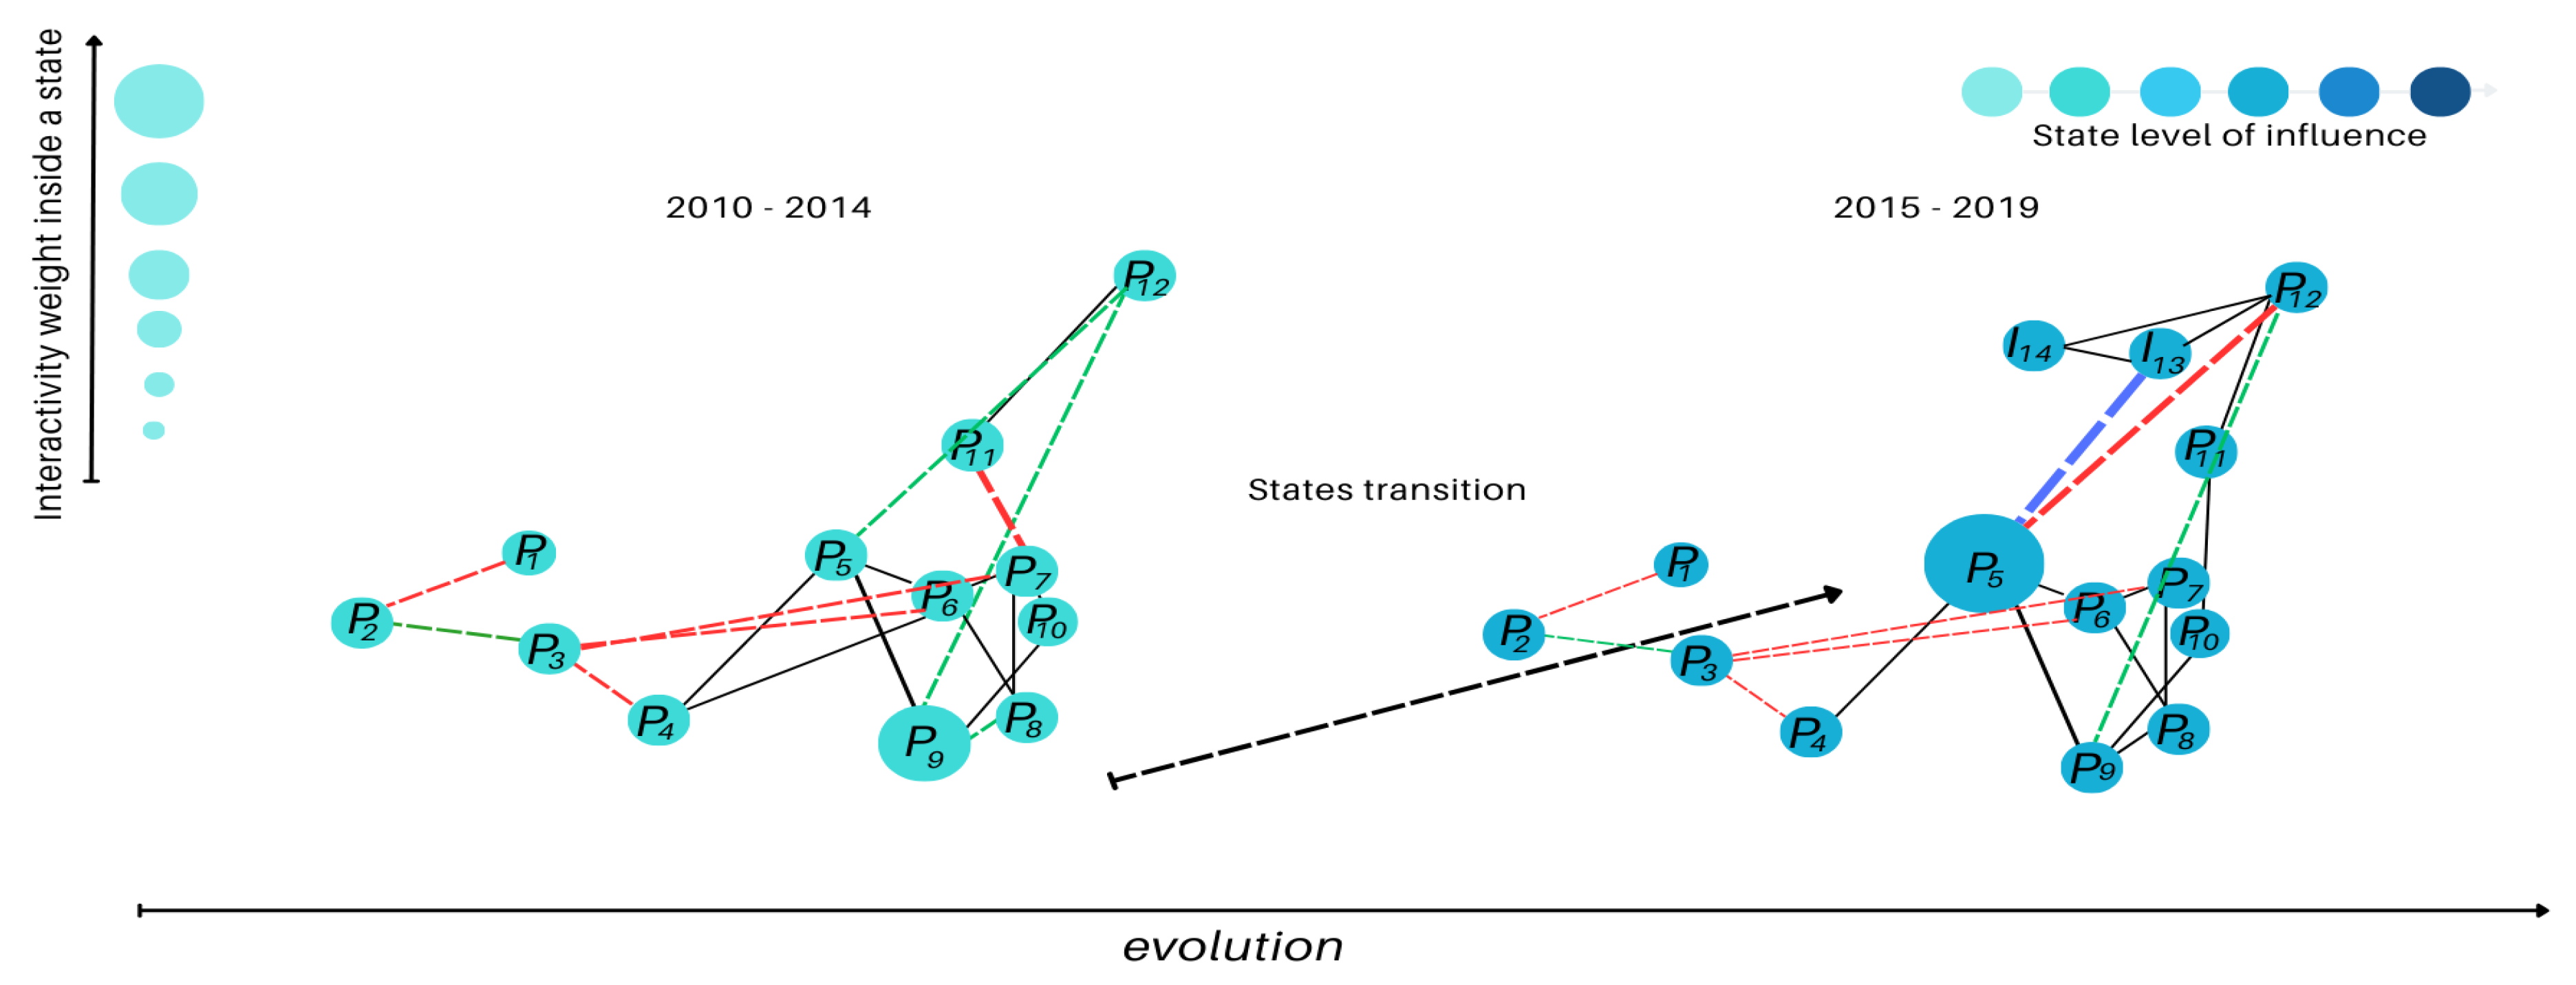
Figure 11.
Topological results mapping of uncovered wells interconnectivity along the years 1958 - 2019. The evolution and adaptation of the system under the different changes and decisions making from the stakeholders are shown. Emergence patterns and self-similarity over the years are unveiled.
Figure 11.
Topological results mapping of uncovered wells interconnectivity along the years 1958 - 2019. The evolution and adaptation of the system under the different changes and decisions making from the stakeholders are shown. Emergence patterns and self-similarity over the years are unveiled.
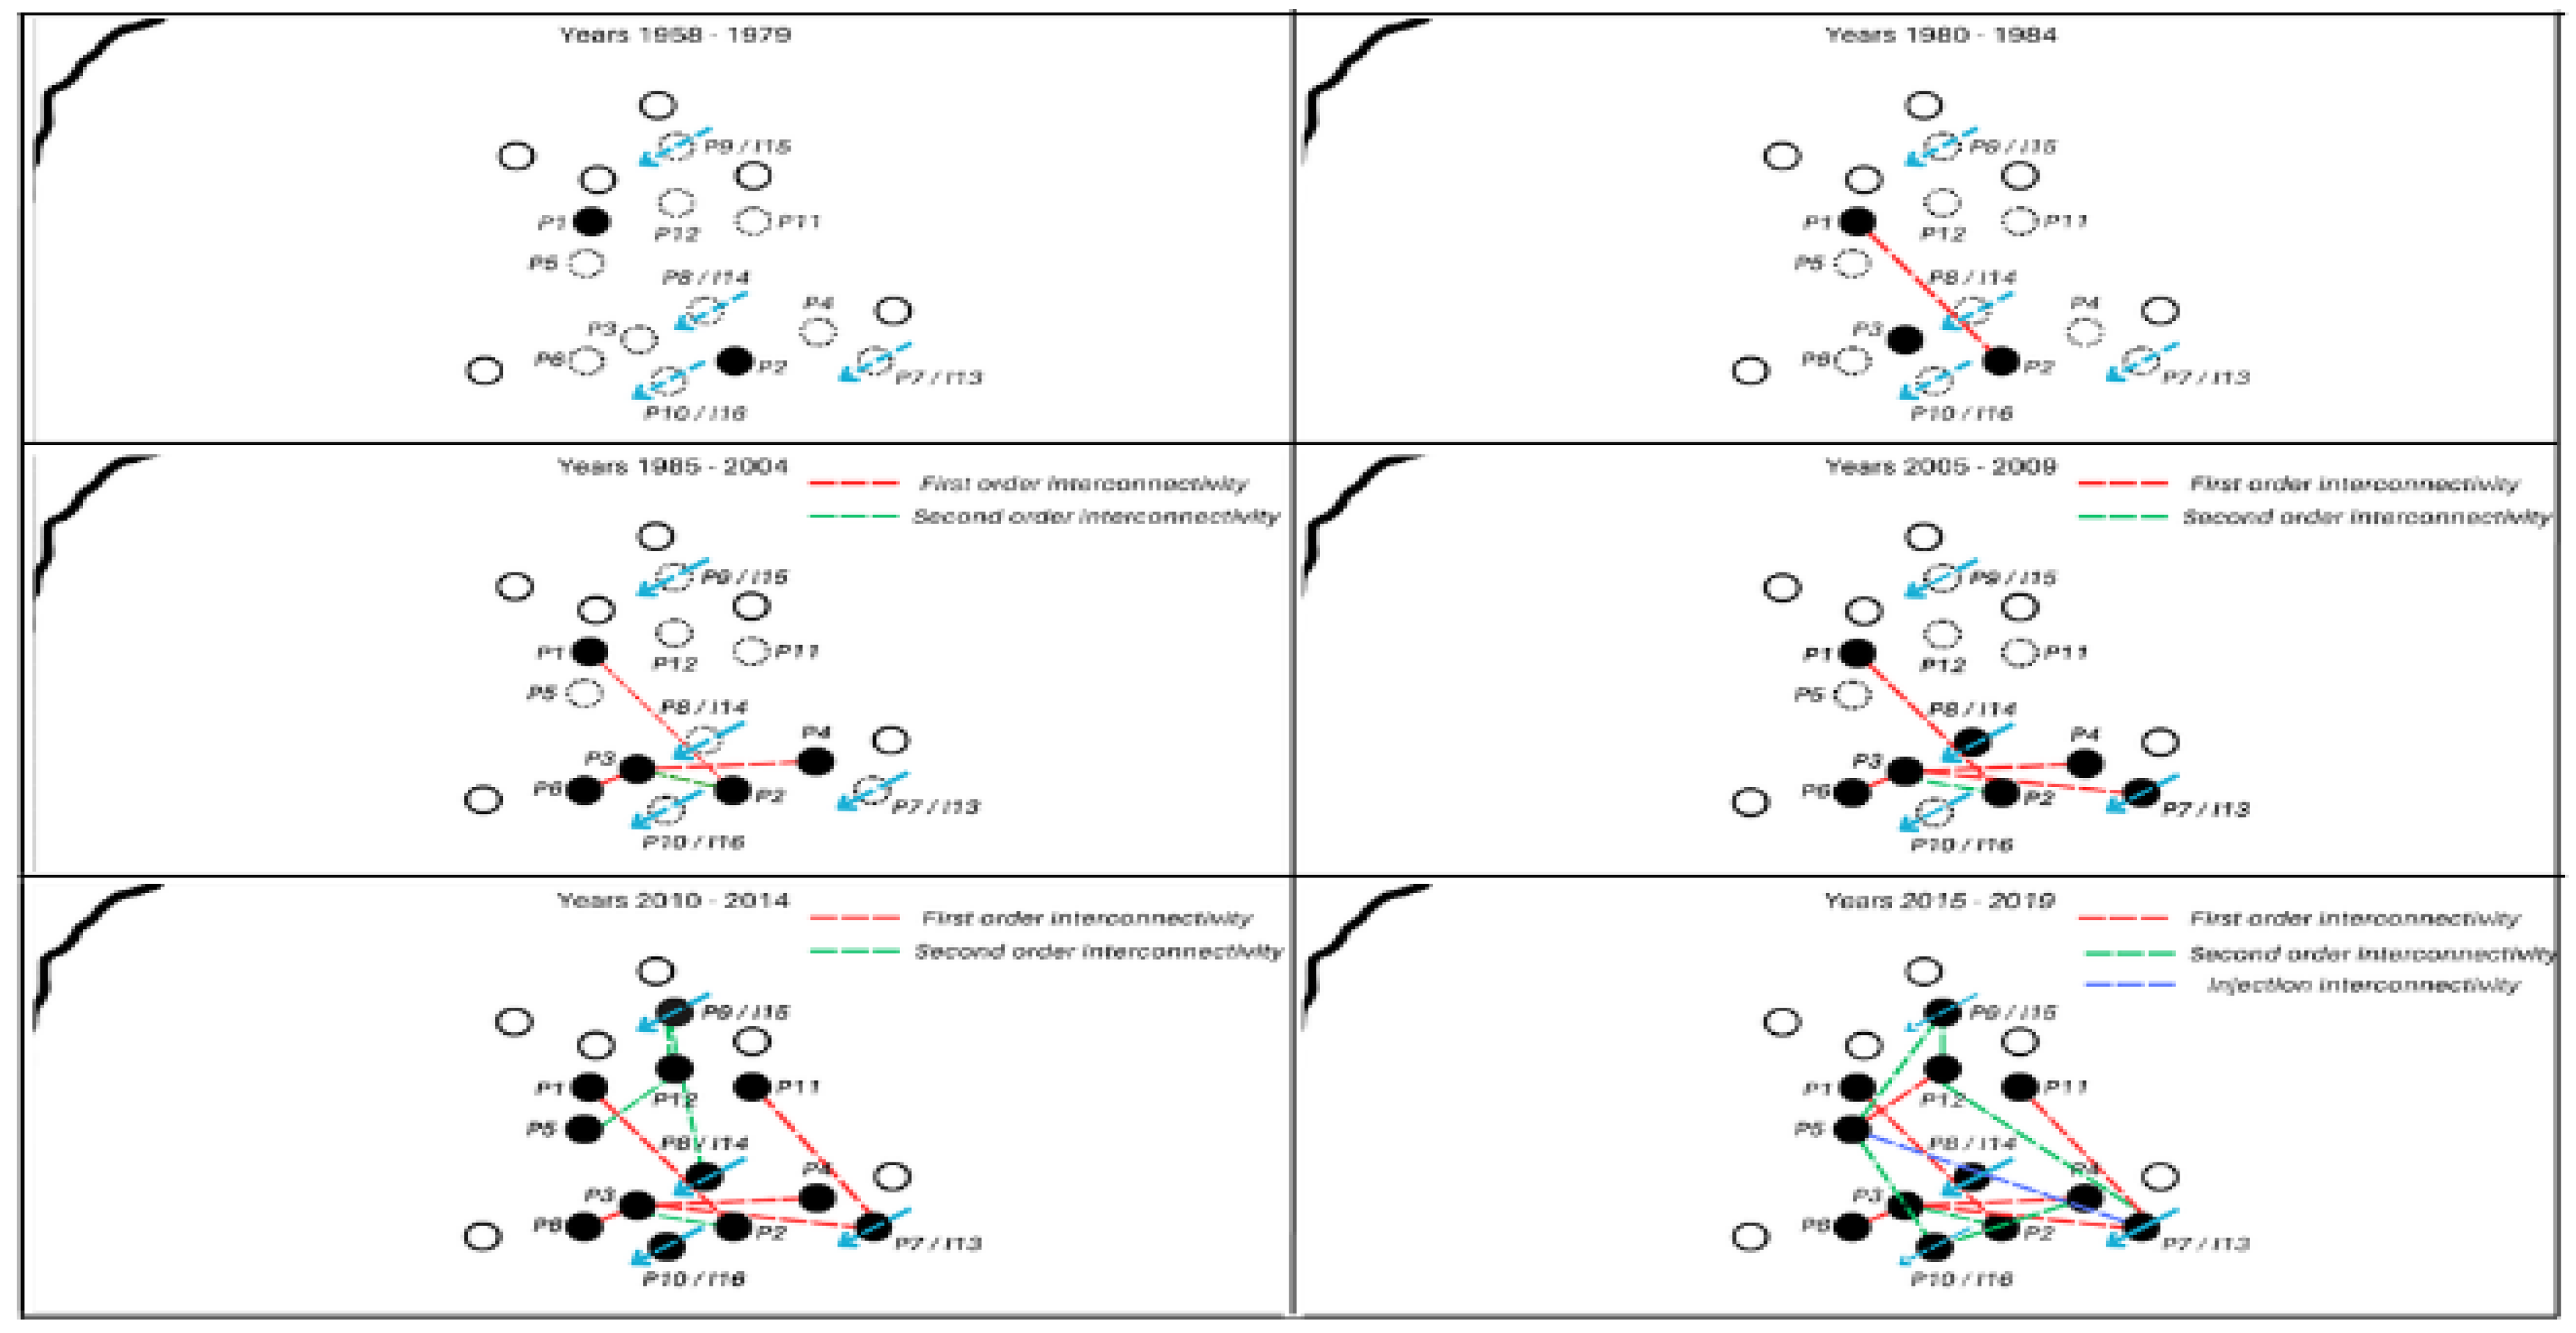
Figure 12.
Results for the year 2020. In the figure the interconnections that have been unveiled with our methodology are shown. These interconnections preserve the emerging patterns of interconnectivity founded along all the years of data that have been used to obtain the assessment.
Figure 12.
Results for the year 2020. In the figure the interconnections that have been unveiled with our methodology are shown. These interconnections preserve the emerging patterns of interconnectivity founded along all the years of data that have been used to obtain the assessment.
Disclaimer/Publisher’s Note: The statements, opinions and data contained in all publications are solely those of the individual author(s) and contributor(s) and not of MDPI and/or the editor(s). MDPI and/or the editor(s) disclaim responsibility for any injury to people or property resulting from any ideas, methods, instructions or products referred to in the content. |
© 2025 by the authors. Licensee MDPI, Basel, Switzerland. This article is an open access article distributed under the terms and conditions of the Creative Commons Attribution (CC BY) license (https://creativecommons.org/licenses/by/4.0/).
Copyright: This open access article is published under a Creative Commons CC BY 4.0 license, which permit the free download, distribution, and reuse, provided that the author and preprint are cited in any reuse.


