Submitted:
25 February 2025
Posted:
26 February 2025
You are already at the latest version
Abstract
Phosphorus (P) is an essential element for plant growth and development. Studies show that up to 90% of phosphorus applied via inorganic fertilizer is adsorbed or precipitated into colloids and not made available to plants. In this context, the use of microorganisms as promoters of P availability in the soil solution is essential. The objectives of this work were to delimit management zones (MZ) based on the spatial variability of P content in the soil and to investigate the effects of P supply, from different sources (mineral and biological) applied in each ZM, on the soybean crop and on the soil after applications. The results indicate that P management, both via mineral sources and the use of solubilizers, is effective in increasing soybean productivity, grain weight, and P content in soil and grains, especially in management zones with lower initial P content. The use of management zones based on the spatial variability of P content in the soil proved to be an efficient tool for optimizing phosphorus application, contributing to greater productivity and better use of resources, especially in areas with low fertility. This reinforces the importance of precision management strategies in the use of fertilizers, adapted to specific soil conditions, to maximize yield and improve nutrient use efficiency.
Keywords:
Precision agriculture
; Glycine max
; Bacillus megaterium
; Bacillus subtilis
1. Introduction
Phosphorus (P) is an essential element for plant growth and development [1]. It takes part in several metabolic processes, such as energy transfer, nucleic acid synthesis, glucose, respiration, nitrogen (N) fixation, and carbohydrate metabolism. Despite being abundant in the Earth's crust, soluble levels of this element in highly weathered soils are often suboptimal for crop growth [2]. In the Earth's crust, in highly weathered soils, such as many Brazilian soils, phosphorus (P) tends to form strong ionic interactions with metal cations, such as Al³⁺, Ca²⁺, and Fe³⁺, which are found in the soil. These interactions result in the formation of insoluble phosphorus mineral complexes [3]. To maintain the P content in the soil and meet the demand of plants, inorganic phosphate fertilizers are applied, as in the soil solution, they form orthophosphate anions, which are electronegatively charged, and therefore have a high affinity for the cationic adsorption sites in the soil.
After application, up to 90% of the phosphorus applied using inorganic fertilizer is adsorbed or precipitated to the colloids and is not made available to plants. Nevertheless, the remaining P in the soil solution continues to compete widely between the plant and the surface of the minerals. Thus, phosphate fertilization occurs annually in order to regulate the maintenance of P levels in the soil. However, this practice results in a contribution to the increase in production costs, which encourages scientific research to investigate agricultural strategies capable of improving the efficiency of phosphate fertilization and its availability to crops [4].
One of the lines of research is the use of microorganisms as promoters of P availability in the soil solution, aiming to use not only chemistry but also biology to promote the maintenance of adequate levels of the nutrient for the crop of interest. Some studies [1,5] have demonstrated that there is a range of microorganisms, such as fungi and bacteria, that act in biological processes capable of modifying insoluble P into soluble P in the soil through the solubilization of insoluble mineral P and the mineralization of organic P. Several works that report the efficiency of microorganisms in solubilizing P can be found in the literature.
Bononi et al. [6] investigated strains of the fungus Trichoderma, isolated from the Amazon Rainforest, and 19.5% of the strains were able to solubilize phosphate. Siqueira et al. [7] reported that bacteria from the genera Bacillus, Pseudomonas, and Agrobacterium can release P from the soil. The same genera cited by Mahdi et al. [8] also include the genera Micrococcus, Burkholderia, Rhizobium, Azotobacter, and Erwinia, with this potential. Wang et al. [9], in China, isolated from the rhizosphere of soybeans, genera of Bacillus and Pseudomonas bacteria that were able to solubilize P through the secretion of organic acids and production of siderophores.
In Brazil, Sorghum and Maize Embrapa have recently isolated two strains of bacteria, Bacillus subtilis (CNPMS B2084) and Bacillus megaterium (CNPMS B119), capable of solubilizing Ca3(PO4)2, AlPO4 and FePO4 from the parent rock through the production of organic acid, in addition to the mineralization of organic P, through the production of enzymes such as phosphatase and phytases, respectively [10,11].
It is already known that P levels are not homogeneous in cropped areas, as is the case with other soil attributes that interact with P availability for plants, such as Fe, Al, Ca, hydrogen potential (pH), and clay. This heterogeneity determines the spatial variability of P in the soil solution. Currently, with the use of geoprocessing, it is possible to carry out a complete survey of the soil P content for each fraction of the plot, where precision agriculture (PA) technologies use the spatialization of nutritional conditions to create specific zones of availability, denominated management zones (MZ).
Once the variability of P content in the soil is mapped, it is possible to determine the MZ. These MZ can assist in decision-making regarding actions aimed at P managing that seek to optimize its availability for plants, such as the use of phosphorus-solubilizing microorganisms (PSM). However, the literature still lacks works on the use of MSP based on ZM with different P contents in the soil.
Considering that the P content in the soil is heterogeneous and that mapping its variability can serve as a basis for planning the supply of P to plants, and that there are mineral and biological solutions on the market that seek to meet the need for P by the plants, the objective of this work was to set management zones (MZ) based on the spatial variability of the P content in the soil and to investigate the effects of the supply of P, from different sources (mineral and biological) applied in each MZ, on the soybean crop and the soil after applications.
2. Materials and Methods
2.1. Experimental area characterization
This work was carried out in the 2021/2022 summer harvest, in the municipality of Dom Pedrito, State of Rio Grande do Sul, in a direct seeding system, under a central pivot, with 35 hectares. The experimental area occupied 5.7 hectares and has central coordinates 30°56'18.54" South latitude and 54°45'29.96" West longitude. Figure 1 represents the location of the experimental area.
The soil of the region is classified as Eutrophic Haplic Planosol [12] with a silty loam texture [13]. The analysis of the average contents of the soil attributes, in the 0-20 cm layer, presented the following results: 25% clay, 21% sand, and 54% silt; pH-H20: 5.8; phosphorus: 15.54 mg dm–3; potassium: 118 mg dm–3; organic matter: 2.1%; exchangeable aluminum: 0.00 cmolc dm–3; calcium: 5.9 cmolc dm–3; magnesium: 1.7 cmolc dm–3; H+Al: 3.9 cmolc dm–3; CEC pH7: 11.8 cmolc dm–3; base saturation: 67%. The predominant climate in the region is classified as humid subtropical [14].
2.2. Mapping of the spatial variability of P content and management zones setting
Mapping the spatial variability of soil phosphorus content used a sampling grid composed of 40 georeferenced points (Fig. 1). Composite soil samples were collected at each of the 40 points. A cutting shovel was used to collect soil representative of the 0-20 cm layer [15]. Each sample consisted of 05 (five) subsamples, collected within a radius of 10 meters from each sampling point. The samples were placed in plastic bags, identified, and sent to the soil analysis laboratory of the Federal University of Santa Maria, for quantification of soil phosphorus content.
The results of the laboratory analysis comprised the database used to map the spatial variability of soil P content and subsequent delimitation of the management zones. First, descriptive statistical analysis was performed, identifying the minimum and maximum values and calculating the mean, standard deviation, and coefficient of variation. Next, spatial dependence modeling was performed by adjusting variograms, assuming the stationarity of the intrinsic hypothesis, defined by Equation 1.
 = Semivariance as a function of the separation distance (h) between pairs of points;
h = Separation distance between pairs of points, m;
N(h) = Number of experimental Z(xi) and Z (xi + h) pairs of observations separated by an h distance.
The models tested in this work were the Gaussian, linear with plateau, spherical, and exponential. The model that presented the lowest residual sum of squares (RMSE) and the highest coefficient of determination (R2) was selected. After the model was adjusted and validated, the prediction of values in non-sampled locations was performed. The validation method used in the experiment was the cross-validation and the interpolation of values was performed by ordinary kriging which provides the best linear predictions without bias [16].
The mapping of the spatial variability of P content in the soil was performed in the Quantum GIS Geographic Information System (QGIS), version 3.28 Firenze, using the Smart-Map plugin [17]. Smart-Map allows the prediction of values in non-sampled locations and the mapping of soil attributes, based on the interpolation of data using ordinary kriging, as well as the delimitation of management zones. From the spatial variability map of soil P content, the management zone map (MZ) was created. In this process, the Fuzzy k-means classification algorithm was used to group the data. The data were grouped into two classes, seeking to divide the area into regions with high and low soil P content.
2.3. Experimental setting up and conduction
Once the ZM map was achieved, the assessed treatments were Applied. Initially, soybean was sown in a no-tillage system throughout the experimental area. Sowing was carried out in late October 2021, using a precision seeder-fertilizer with 17 rows spaced 50 centimeters apart. The cultivar used was BMX Zeus Ipro at a density of 18 seeds m–1 linear (360,000 seeds ha–1), inoculated for biological nitrogen fixation with 2g per kilogram of Bradyrhizobium japonicum seeds via peat laid directly into the seeder's seed reservoir.
The inoculant used as a biological phosphorus solubilizer was composed of B119 (Bacillus megaterium) and B2084 (Bacillus subtilis) strains with 4x10⁹ viable cells per milliliter of product, which was applied via a directed jet in the sowing furrow. The commercial product dose used was 200 ml ha–1 at a spray rate of 20 L ha–1. The soluble mineral source was applied to the seeding furrow at a dose of 80 kg of P2O5, using triple superphosphate. The P2O5 dose used in this work aimed to increase the average initial P content in the soil by 5 mg dm–3 [18].
There was no experimental unit with a mixture between biological solubilizer and mineral fertilizer. Also, in the plots where the biological solubilizer was applied, the mineral fertilizer dosing mechanism was blocked, and in the plots where the mineral fertilizer was used, the directed jet of biological solubilizer was turned off.
In the crop phytosanitary management, two fungicide applications were carried out, consisting of 300 ml ha–1 of a commercial product with active ingredients fluxapyroxad + pyraclostrobin and 800 ml ha–1 of epoxiconazole + fluxapyroxad + pyraclostrobin, in addition to an insecticide application, consisting of 30 ml ha–1 of a commercial product with the active ingredient bifenthrin.
2.4. Experimental design, evaluations, and statistical analyses
The experimental design adopted was randomized blocks, in a 2 x 3 factorial scheme, with four replications. Factor A was composed of the management zones categorized into zones with higher and lower P content in the soil. Factor B was composed of the P sources (control, biological solubilizer, and mineral fertilizer), totaling 24 experimental plots. Each experimental plot was formed by 68 seeding lines (34 m) with 50 meters in length, totaling 1700 m2 in each replicate.
The following evaluations were performed: P content in leaves, P content in grains, weight of one thousand grains, productivity, and P content in the soil after crop harvesting. To quantify the P content in the leaves, 50 trifoliates with petioles were randomly collected in each replicate, corresponding to the third or fourth leaf from the apex of the main stem, when the crop was in the reproductive stage R1 (beginning of flowering) [19]. The leaves were placed in identified paper bags and sent for laboratory analysis to quantify the P content in g kg–1 of dry matter. The P content in the grains was quantified in the laboratory, from the sending of samples of 100 grams of seeds collected in each replicate.
The thousand-grain weight was obtained by calculating the mean of the weighing of 10 thousand-grain samples. The weighing was performed on a 0.01 g accuracy digital scale. The moisture content of the grains of each sample was measured in order to correct the thousand-grain weight for a storage moisture content of 13% [20]. Productivity was estimated by harvesting an area of 30 x 30 meters (900 m2), representative of the central portion of each experimental plot. The harvest was performed using a combined grain harvester, with a 32-foot cutting platform. The harvested grains were unloaded into bags with a capacity of 500 kg and weighed using a suspended digital scale, Premier brand, with a capacity of 1000 kg. Grain samples were taken from each bag to quantify the mass of impurities and measure moisture. The productivity obtained in kilograms per square meter (kg m–2) was corrected by subtracting the mass of impurities and standardizing the moisture content of the grains to 13%; the values were subsequently converted to kilograms per hectare (kg ha–1).
After harvesting the experimental area, soil samples representative of the 0-20 cm layer was collected using a cutting shovel. At soil collection, the soil was superficially cleaned to remove the soybean plant residue present on the soil. Five simple subsamples were collected in each replicate, resulting in a composite sample. From this sample, 500 g of soil was removed, which was packaged, identified, and sent for analysis in the laboratory in order to quantify the P content in the soil.
Once the results were available, statistical analyses were performed using the Sisvar software [21]. First, the Shapiro-Wilk normality test (W; p<0.05) was performed to verify data normality. Data that presented a normal distribution were then subjected to the Tukey mean test (p<0.05). The graphs used to present the results of the Tukey mean test were created using the Statistica software, version 7.
3. Results
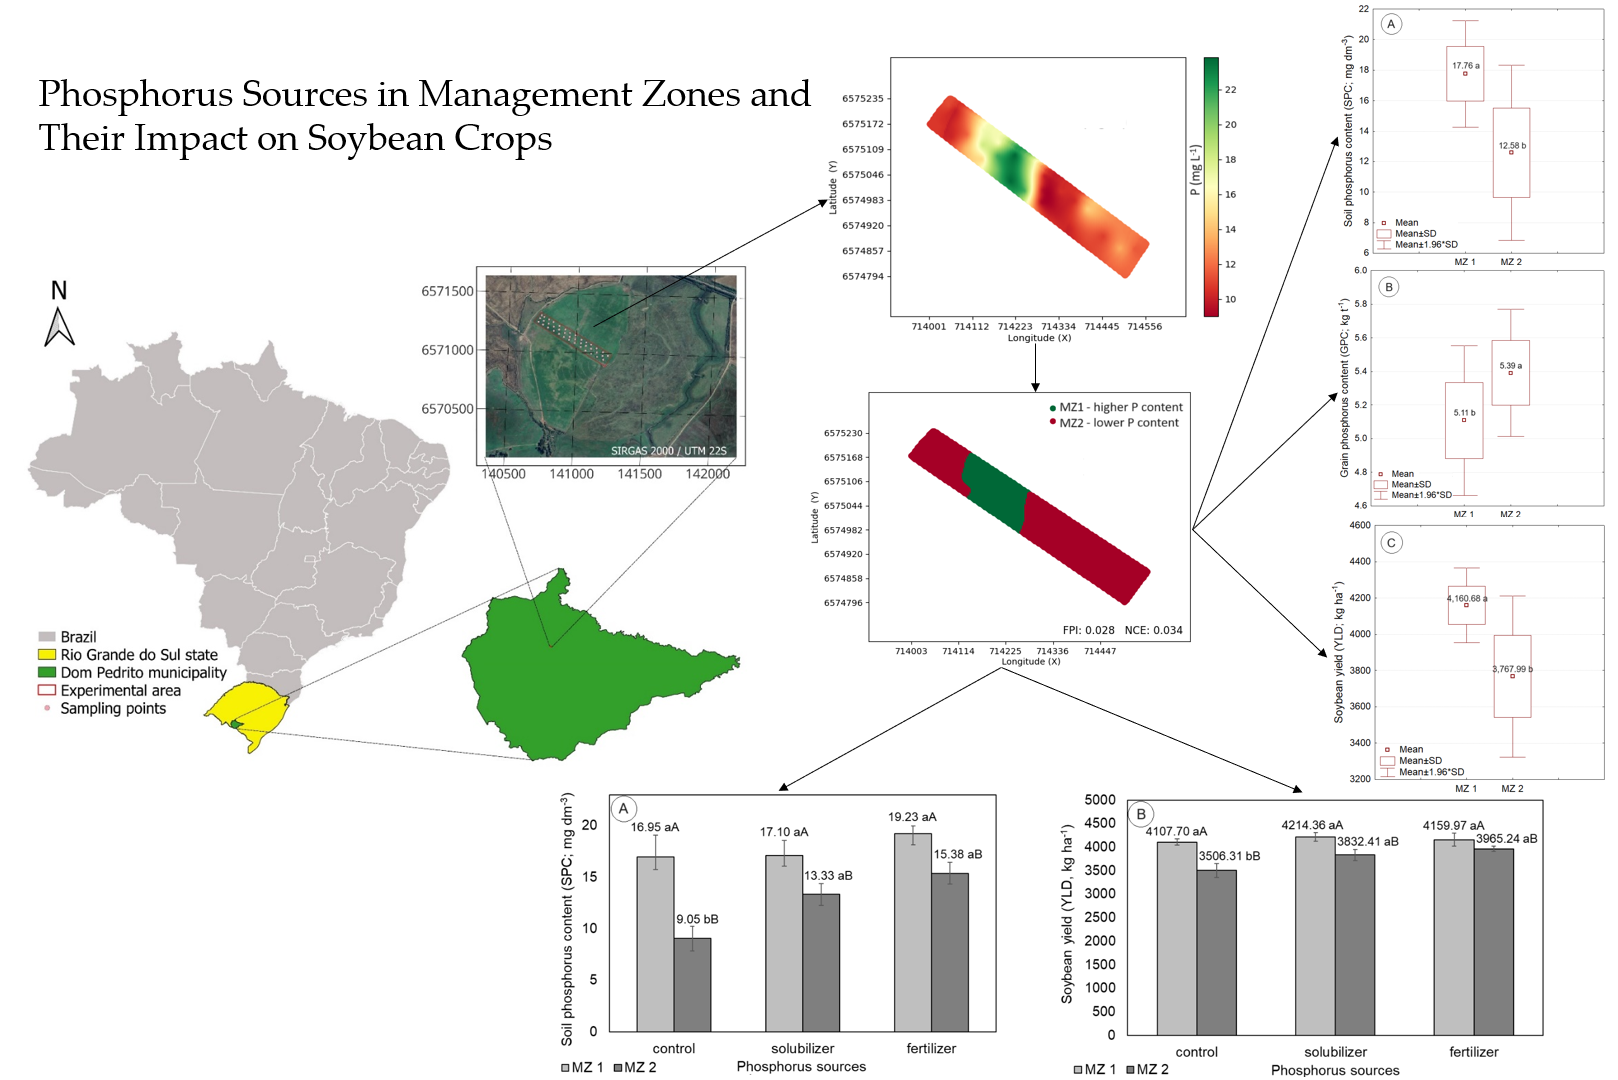
Figure 2 shows the results of the modeling of spatial dependence on soil P content (Fig. 2A and 2B), the spatial variability map (Fig. 2C), and the management zone map divided into two classes (Fig. 2D), one with high and the other with low soil P content. Soil P content showed spatial variability, described by the linear model with a plateau (R2 = 0.99; RMSE = 12.40). The adjusted model showed reliability in the estimates of values in non-sampled locations, evidenced by the cross-validation analysis (R2 = 0.812; RMSE = 1.923).
Table 1 shows the results of the descriptive statistical analysis for the phosphorus content in the total area and each class of the management zone map (MZ1 and MZ2). With the division of the productive field into two classes, a large variation in the average phosphorus content was observed.
The average phosphorus content in MZ1 was 9.03 mg dm–3 higher than that observed in MZ2, representing an increase of 44.35%. This result demonstrates the importance of considering the spatial variability of phosphorus content in management actions to supply sources of this element, as the high variation observed directly impacts the amount of fertilizer to be applied. Another factor to be highlighted is that the supply of P, considering the average content observed for the field, from the application at a fixed rate, could cause an increase in the observed spatial variability, with overdosages being applied in some locations and underdosage in others.
It can be seen in Table 2 the statistical summary of the analysis of variance of the thousand-grain weight (TGW; g), soil phosphorus content (SPC; mg dm–3), leaf phosphorus content (LPC; g kg–1), grain phosphorus content (GPC; mg dm–3) and soybean crop yield (YLD; kg ha–1), as a function of the management zone and phosphorus supply source. The variation factor management zones significantly influenced the mean values of soil phosphorus content, grain phosphorus content, and soybean yield. The variation factor phosphorus source significantly influenced the mean values of thousand-grain weight, soil phosphorus content, grain phosphorus content, and soybean yield. The mean values of soil phosphorus content and soybean yield were influenced by the interaction among the variation factors.
Figure 3 presents the box-plot graphs with respective average values of soil phosphorus content, grain phosphorus content, and soybean yield, influenced by the management zone variation factor. For MZ1 (higher P content), higher soil P content (17.76 mg dm–3), lower grain phosphorus content (0.51 mg dm–3), and higher soybean productivity (4,160.68 kg ha–1) were observed when compared to the values observed for soybean cultivation in MZ 2 (lower P content).
Figure 4 shows the box-plot graphs with respective mean values of the weight of a thousand grains, phosphorus content in the soil, phosphorus content in the grains, and soybean productivity, influenced by the variation factor phosphorus source. The supply of phosphorus, either via solubilizer or fertilizer, significantly increased the values of the weight of a thousand grains, phosphorus content in the grains, and soybean productivity. The highest phosphorus content in the soil was observed for the supply of phosphorus via fertilizer. The lowest values, for the variables that presented statistically significant differences, were observed for the control treatment (without phosphorus supply).
Figure 5 shows the bar graphs with the average values of soil phosphorus content and soybean productivity, which differed statistically because of the interaction of the variation factors MZ and phosphorus source.
Considering the effect of the MZ variation factor, the highest values for soil phosphorus content and soybean productivity were observed for MZ1, which was expected, as this MZ represents the one with high soil P content before soybean sowing. When P was supplied, either via solubilizer or fertilizer, no effect of MZ was observed on the variables, and the averages were considered statistically equal, although, numerically, MZ1 presented the highest average values for soil phosphorus content and soybean productivity.
Considering the phosphorus source variation factor, it was observed that neither soil phosphorus content nor soybean productivity presented statistically significant differences between the means when observed for MZ1. Thus, the supply of P in MZ with high soil P content before planting the crop did not present any effects on soil P content after harvest or on soybean productivity. Comparing the averages of soil phosphorus content and soybean productivity, between MZ, for the same source of phosphorus supply, showed that when P was supplied, the average values of the variables in MZ1 increased significantly when compared to the average values of MZ2.
4. Discussion
Higher P content was observed in soybean grains when the crop was grown in the zone with the lowest P content in the soil. An experiment conducted by Strock et al. [22] demonstrated that, due to the limited availability and slow movement of P in the soil, one of the strategies used by the plant is to increase the root system and thus the volume of soil explored, which may have influenced a greater search for P by plants in zones of lower availability and consequently greater translocation to the grain. Chu et al. [23] observed a higher root:shoot ratio in soybean as a way to increase P uptake
According to Thuynsma et al. [24], under nutrient deficiency, plants allocate greater amounts of sugars to the organs involved in their obtention, such as the roots, increasing their volume and mass. Chu et al. [23] report a modification in the leaf anatomy of soybean plants under P deficit, generally smaller and thicker. This fact leads to less water loss to the outside, influencing the redistribution of metabolites in the plant.
Thus, based on the P content found in the soil of the different management zones, it is clear the importance of precision agriculture (PA) in defining these zones based on the variability of P content in the soil, therefore optimizing the use of inputs with this technique. Barbieri et al. [25] described that P proposes management strategies for the localized application of inputs, correcting only specific points of abnormality. Ferguson et al. [26] also stated that treating plots as uniform results in applying too many nutrients where the levels are high and insufficient nutrients where the levels are low.
According to Santos et al. [27], the P dynamics in the soil are associated with the environment that controls microbial activity and the physical-chemical and mineralogical properties of the soil. The authors also mention that in soils where the weathering process is lower, P is still found in fractions of primary minerals, in organic and mineral form, with weaker binding energy for adsorption. The soil in the experimental area meets this statement because it is a Planosol and explains why soluble P via mineral source meets the needs of the soybean crop.
Although the remaining P in the soil after harvest is higher in the treatment with chemical fertilizer supply, the solubilizer was able to differ from the control by 14.53%, which demonstrates the potential of bacteria to solubilize P and is promising in reducing the costs of phosphate fertilization. Furthermore, considering the mean P content in the experimental area before the experiment (15.54 mg dm–3), it is observed that even though the crop exports the nutrient, soybeans incorporate around 20 kg ha–1 into the biomass, the chemical source was able to increase the P content in the soil and the solubilizer maintained the initial content, thus being two ways of making P available to the soybean crop [28]. In this context, the cost-benefit ratio tends to promote the inoculant due to the costs of the soluble phosphate source.
In their work with B. subtilis, one of the assessed solubilizer bacteria, Araújo et al. [29], reported that its application modified the partitioning of assimilates in soybeans, leading to an increase in root surface and root biomass. This increase in the volume of the root system contributes to a greater increase in the absorption of water and other nutrients in addition to P, thus contributing to higher soybean yields when the solubilizer is applied.
Another advantage of using the solubilizer is the ability to make phosphorus adsorbed with Ca, Fe, and Al available in the soil by releasing organic acids [30], in addition to mineralizing organic phosphorus from crop residues by releasing enzymes [31]. Oliveira-Paiva et al. [11] using the same bacteria used in this work, B119 (Bacillus megaterium) and B2084 (Bacillus subtilis), conducted an experiment with soybean crops in 415 different locations, in the 2020/2021 harvest, and in all of them, grain productivity was higher in areas inoculated via seed compared to the control, corroborating the results observed in this work.
The higher soybean yield as a function of the supply of P via chemical fertilizer was expected because of the complementation of the P requirement, via fertilization. According to Santos et al. [27], the addition of soluble P causes the accumulation of inorganic P with high availability in the soil, which reflects improved crop nutrition. Consequently, a better-nourished plant will present better productive performance, as observed.
Regarding the effect of the management zone variation factor (factor A) on soybean yield (Fig. 3C), the zone with the highest P content showed an increase of 9.44%. The lack of P available to the plants inhibits their growth, leading to irreversible damage to their functioning [32]. In this work, both the chemical source and the solubilizer were placed in the sowing furrow and this procedure may have maximized the absorption of P by the soybean plants. One is the result of the lower adsorption of P to the soil by the soluble mineral source and also the greater proximity of bacteria to the roots of soybean plants, acting mutually with the crop.
5. Conclusions
The thousand-grain weight of soybeans was increased by 5.84% with the use of solubilizer and by 4.79% with the supply of P via mineral source.
The P content in the grains was 5.55% higher after supplying P via mineral source, when compared to the control, not differing from the levels observed with solubilizer.
P supply via mineral source resulted in higher P content in the soil after soybean harvest.
Productivity was increased by the supply of P by 6.29% via mineral source and 5.38% via solubilizer, compared to the control without the use of P.
The management zone (MZ) with the highest P content in the soil presented 9.44% higher productivity when compared to the MZ with the lowest content.
The P content in the grains increased in the MZ with the lowest P content in the soil.
The final soil P content (mg dm-3) increased by 18.92% compared to the initial average content in the MZ with the lowest P content.
No difference was observed in soybean yield and soil P content in the MZ with the highest P content, regardless of the treatment in the experiment.
Productivity was responsive to P addition in zones with lower P content in the soil, with an increase of 8.51% when P was supplied via solubilizer and 11.57% via mineral source, compared to the control.
The MZ setting, based on mapping the spatial variability of P content in the soil, was found to be a promising tool in decision-making regarding P management for soybean crops, providing an increase in productivity and P content in grains and soil.
The results point out that P management, both via mineral source and with the use of solubilizers, is effective in increasing soybean productivity, grain weight, and P content in soil and grains, especially in management zones with lower initial P content. The use of management zones based on the spatial variability of P content in the soil was an efficient tool for optimizing phosphorus application, contributing to greater yield and better use of resources, especially in areas with low fertility. This reinforces the importance of precision fertilizer management strategies, adapted to specific soil conditions, to maximize yield and improve nutrient use efficiency.
Author Contributions
Conceptualization, V.P.G. and E.L.B.; methodology, E.L.B. and Z.B.O.; software, V.P.G. and E.L.B.; validation, V.P.G. and E.L.B.; formal analysis, V.P.G. and E.L.B.; investigation, V.P.G; resources, V.P.G.; data curation, V.P.G. and E.L.B.; writing—original draft preparation, E.L.B.; writing—review and editing, P.A.A.F., A.E.K., Z.B.O. and L.Z.P.; visualization, P.A.A.F., A.E.K., Z.B.O. and L.Z.P.; supervision, E.L.B.; project administration, E.L.B. All authors have read and agreed to the published version of the manuscript.
Data Availability Statement
The data presented in this study are available upon request to the corresponding author, as they constitute the dataset used in the first author's master's thesis, which can be accessed at https://repositorio.ufsm.br/handle/1/26219. The provided dataset requires justification from the requester.
Acknowledgments
We thank the Postgraduate Program in Precision Agriculture at the Polytechnic School of the Federal University of Santa Maria for educational support, and the company Tecno Pampa Agroprecision LTDA for technical assistance, logistical support and study financing.
Conflicts of Interest
The authors declare no conflicts of interest.
References
- Alori, E.T.; Glick, B.R.; Babalola, O.O. Microbial phosphorus solubilization and its potential for use in sustainable agriculture. Front. Microbiol. 2017, v. 8, 1–8. [CrossRef]
- Dissanayaka, D.M.S.B.; Ghahramani, M.; Siebers, M.; Wasaki, J.; Plaxton, W.C. Recent insights into the metabolic adaptations of phosphorus-deprived plants. J. Exp. Bot. 2021, v. 72, 199–223. [CrossRef]
- Chen, Z.C.; Liao, H. Organic acid anions: an effective defensive weapon for plants against aluminum toxicity and phosphorus deficiency in acidic soils. J. Genet. Genomics 2016, v. 43, 631–638. [CrossRef]
- Sharma, S.B.; Sayyed, R.Z.; Trivedi, M.H.; Gobi, T.A. Phosphate solubilizing microbes: sustainable approach for managing phosphorus deficiency in agricultural soils. SpringerPlus 2013, v. 2, 1–14. [CrossRef]
- Babalola, O.O.; Glick, B.R. Indigenous African agriculture and plant associated microbes: current practice and future transgenic prospects. Sci. Res. Essays 2012, v. 7, 2431–2439. [CrossRef]
- Bononi, L.; Chiaramonte, J.B.; Pansa, C.C.; Moitinho, M.A.; Melo, I.S. Phosphorus-solubilizing Trichoderma spp. from Amazon soils improve soybean plant growth. Sci. Rep. 2020, v. 10, 2858, 1–13. [CrossRef]
- Siqueira, J.O.; Andrade, A.T.; Faquim, V. O papel dos microrganismos na disponibilização e aquisição de fósforo pelas plantas. In Proceedings of Simpósio Sobre Fósforo na Agricultura Brasileira, São Pedro, SP, Brazil, 15/05/2003.
- Mahdi, S.S.; Hassan, G.I.; Hussain, A.; Faisul-ur-Rasool. Phosphorus availability issue- its fixation and role of phosphate solubilizing bacteria in phosphate solubilization. Res. J. Agric. Sci. 2011, v. 2, 174–179.
- Wang, W.; Sarpong, C.K.; Song, C.; Zhang, X.; Gan, Y.; Wang, X.; Yong, T.; Chang, X.; Wang, Y.; Yang, W. Screening, identification and growth promotion ability of phosphate solubilizing bacteria from soybean rhizosphere under maize-soybean intercropping systems. bioRxiv 2020. [CrossRef]
- Abreu, C.S.; Figueiredo, J.E.; Oliveira, C.A.; Santos, V.L.; Gomes, E.A.; Ribeiro, V.P.; Barros, B.A.; Lana, U.G.; Marriel, I.E. Maize endophytic bacteria as mineral phosphate solubilizers. Genet. Mo.l Res. 2017, v. 16, 1–13. [CrossRef]
- Oliveira-Paiva, C.A.; Cota, L.V.; Marriel, I.E.; Alves, V.M.C.; Gomes, E.A.; Sousa, S.M.; Santos, F.C.; Souza, F.F.; Landau, E.C.; Pinto Junior, A.S.; Lana, U.G.P. Validação da recomendação para o uso do inoculante BiomaPhos® (Bacillus subtilis CNPMS B2084 e Bacillus megaterium CNPMS B119) na cultura de soja. Circular Técnica 279, Embrapa Milho e Sorgo: Sete Lagoas, MG, Brazil, 2021; 18p.
- Santos, H.G.; Carvalho Junior, W.; Dart, R.O.; Aglio, M.L.D.; Souza, J.S.; Pares, J.G.; Fontana, A.; Martins, A.L.S.; Oliveira, A.P. O novo mapa de solos do Brasil: legenda atualizada. Documentos 130, Embrapa Solos: Rio de janeiro, RJ, Brazil, 2011; 67p.
- Lamb, C.R. Statistical briefing: the normal distribution. Vet. Radiol. Ultrasound. 2008, v. 49, 492–493. [CrossRef]
- Alvares, C.A.; Stape, J.L.; Sentelhas, P.C.; Goncalves, J.L.M.; Sparovek, G. Köppen’s climate classification map for Brazil. Meteorol. Z. 2013, v. 22, 711–728. [CrossRef]
- COMISSÃO DE QUÍMICA E FERTILIDADE DO SOLO - CQFS-RS/SC - Comissão de Química e Fertilidade do Solo - RS/SC. Manual de calagem e adubação para os Estados do Rio Grande do Sul e de Santa Catarina. Sociedade Brasileira de Ciência do Solo: Viçosa, MG, Brazil, 2016; 376p.
- Oliver, M.A.; Webster, R. A tutorial guide to geostatistics: Computing and modelling variograms and kriging. Catena 2014, v. 113, 56–69. [CrossRef]
- Pereira, G.W.; Valente, D.S.M.; Queiroz, D.M.d.; Coelho, A.L.d.F.; Costa, M.M.; Grift, T. Smart-Map: An open-source QGIS plugin for digital mapping using machine learning techniques and ordinary kriging. Agronomy 2022, v.12, 1350. [CrossRef]
- Mumbach, G.L.; Gatiboni, L.C.; Dall’Orsoletta, D.J.; Schmitt, D.E.; Grando, D.L.; Souza Junior, A.A.; Brignoli, F.M.; Iochims, D.A. Refining phosphorus fertilizer recommendations based on buffering capacity of soils from southern Brazil. Rev. Bras. Cienc. Solo 2021, v. 45, e0200113. [CrossRef]
- EMBRAPA. Empresa Brasileira de Pesquisa Agropecuária. Manual de análises químicas de solos, plantas e fertilizantes, 2. ed.; Silva, F.C.; Embrapa Informação Tecnológica: Brasília, DF, Brazil, 2009; 627p.
- Krzyzanowski, F.C.; Oliveira, M.A.; Lorini, I.; França-Neto, J.B.; Henning, F.A. Armazenamento do grão de soja com qualidade: princípios importantes a serem observados. Embrapa Soja: Londrina, PR, Brazil, 2023. 24p.
- Ferreira, D.F. Sisvar: A computer analysis system to fixed effects split plot type designs. Rev. Bras. Biom. 2019, v. 37, 529–535. [CrossRef]
- Strock, C.F.; Riva, L.M. de la; Lynch, J.P. Reduction in root secondary growth as a strategy for phosphorus acquisition. Plant Physiol. 2018, v. 176, 691–703. [CrossRef]
- Chu, S.; Li, H.; Zhang, X.; Yu, K.; Chao, M.; Han, S.; Zhang, D. Physiological and proteomics analyses reveal low-phosphorus stress affected the regulation of photosynthesis in soybean. Int J Mol Sci. 2018, v.19, 1688. [CrossRef]
- Thuynsma, R.; Kleinert, A.; Kossmann, J.; Valentine, A.J.; Hills, P.N. The effects of limiting phosphate on photosynthesis and growth of Lotus japonicus. S. Afr. J. Bot. 2016, v. 104, 244–248. [CrossRef]
- Barbieri, R.S.; Unda, S.A.B.; Carrillo, J.E.C.; González, A.P.; Montanari, R. Distribuição espacial de atributos do solo na região de El Oro, Equador. Colloq. Agrariae 2020, v. 16, 46–60. [CrossRef]
- Ferguson, R.B.; Hergert, G.W.; Schepers, J.S.; Gotway, C.A.; Cahoon, J.E.; Peterson, T.A. Site-specific nitrogen management of irrigated maize: Yield and soil residual nitrate effects. Soil Fert. Plant Nutr. 2002, v. 66, 544–553. [CrossRef]
- Santos, D.R.; Gatiboni, L.; Kaminski, J. Fatores que afetam a disponibilidade do fósforo e o manejo da adubação fosfatada em solos sob sistema plantio direto. Cienc. Rural 2008, v. 38, 576–586. [CrossRef]
- Novais, R.F.; Smyth, T.J.; Nunes, F.N. Fósforo. In Fertilidade do solo, Novais, R.F., Alvarez V., V.H., et al. Eds.; Sociedade Brasileira de Ciência do Solo: Viçosa, MG, Brazil, 2007; pp. 471–537.
- Araujo, F.F.; Bonifacio, A.; Bavaresco, L.G.; Mendes, L.W.; Araujo, A.S.F. Bacillus subtilis changes the root architecture of soybean grown on nutrient-poor substrate. Rhizosphere 2021, v. 18. [CrossRef]
- Oliveira, C.A.; Alves, V.M.C.; Marriel, I.E.; Gomes, E.A.; Scotti, M.R.; Carneiro, N.P.; Guimarães, C.T.; Schaffert, R.E.; Sá, N.M.H. Phosphate solubilizing microorganisms isolated from rhizosphere of maize cultivated in an oxisol of the Brazilian Cerrado biome. Soil Biol. Biochem. 2009, v. 25, 1782–1787. [CrossRef]
- Mander, C.; Wakelin, S.; Young, S.; Condron, L.; O’Callaghan, M. Incidence and diversity of phosphate solubilizing bacteria are linked to phosphorus status in grassland soils. Soil Biol. Biochem. 2012, v. 44, 93–101. [CrossRef]
- Veneklaas, E.J.; Lambers, H.; Bragg, J. Finnegan, P.M.; Lovelock, C.E.; Plaxton, W.C.; Price, C.A.; Scheible, W.R.; Shane, M.W.; White, P.J.; Raven, J.A. Opportunities for improving phosphorus-use efficiency in crop plants. New Phytol. 2012, v. 195, 306–320. [CrossRef]
Figure 1.
Experimental area location.
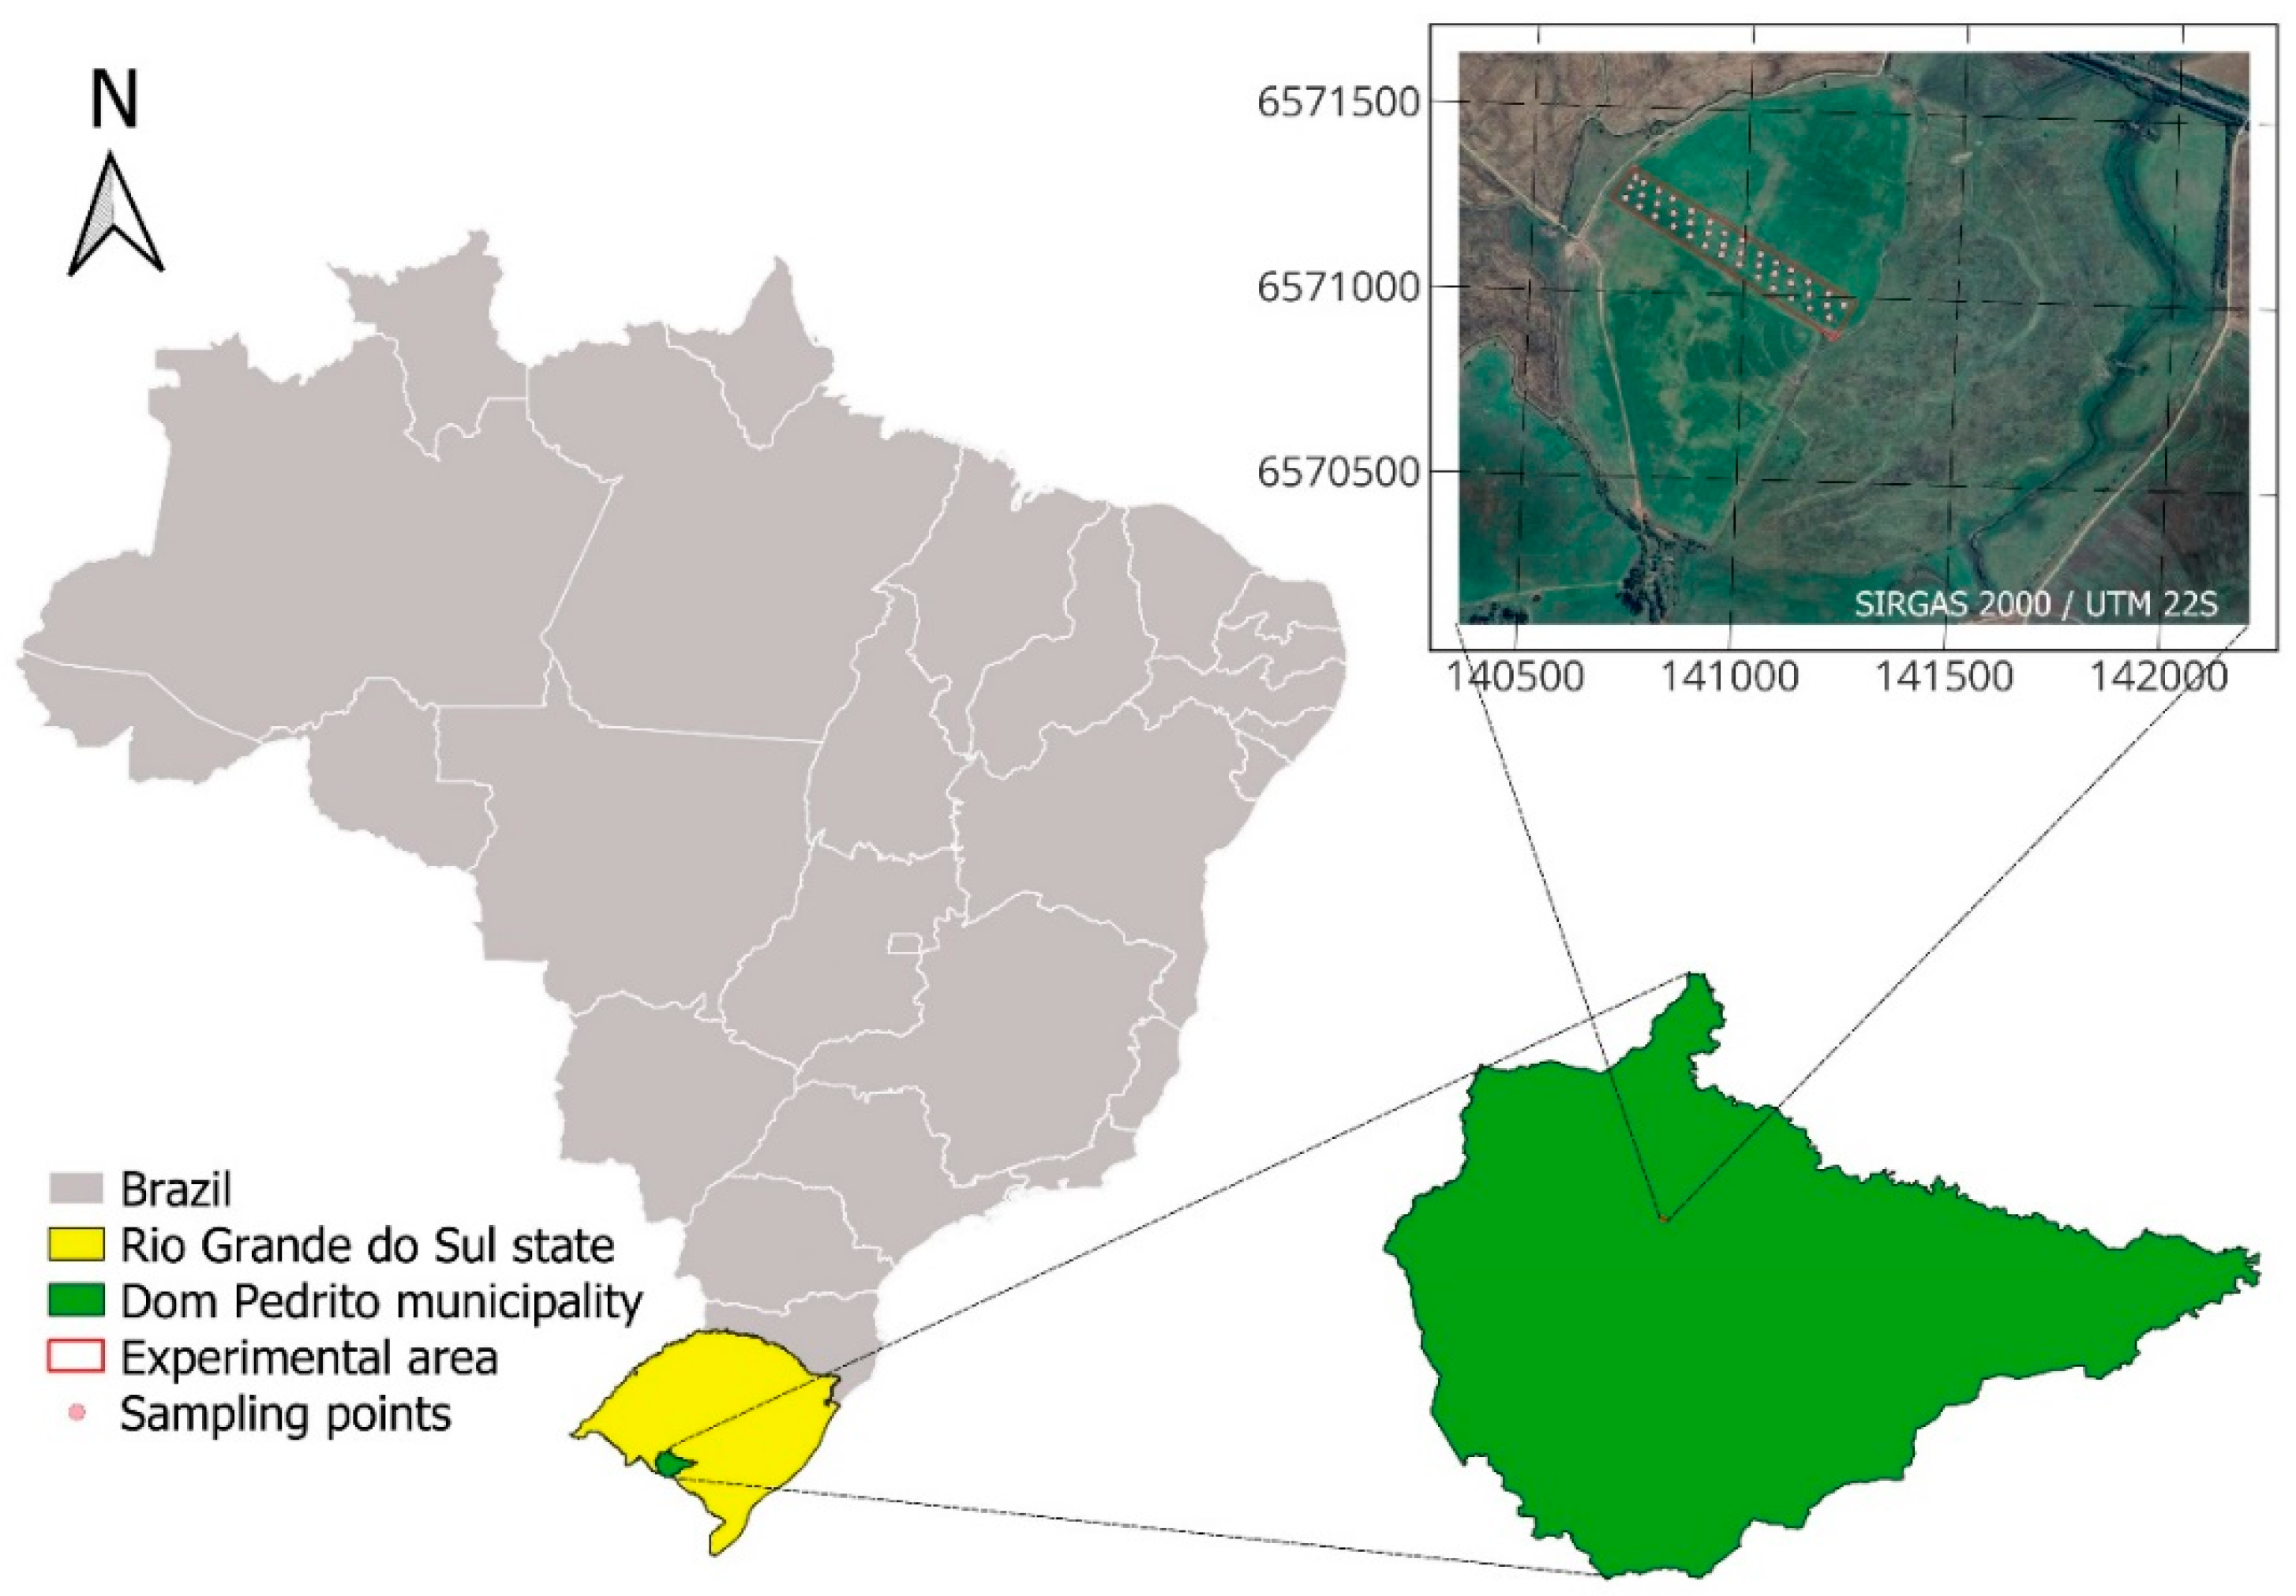
Figure 2.
Variogram (A), cross-validation graph (B), phosphorus spatial variability thematic map (C), and phosphorus management zone map (D).
Figure 2.
Variogram (A), cross-validation graph (B), phosphorus spatial variability thematic map (C), and phosphorus management zone map (D).
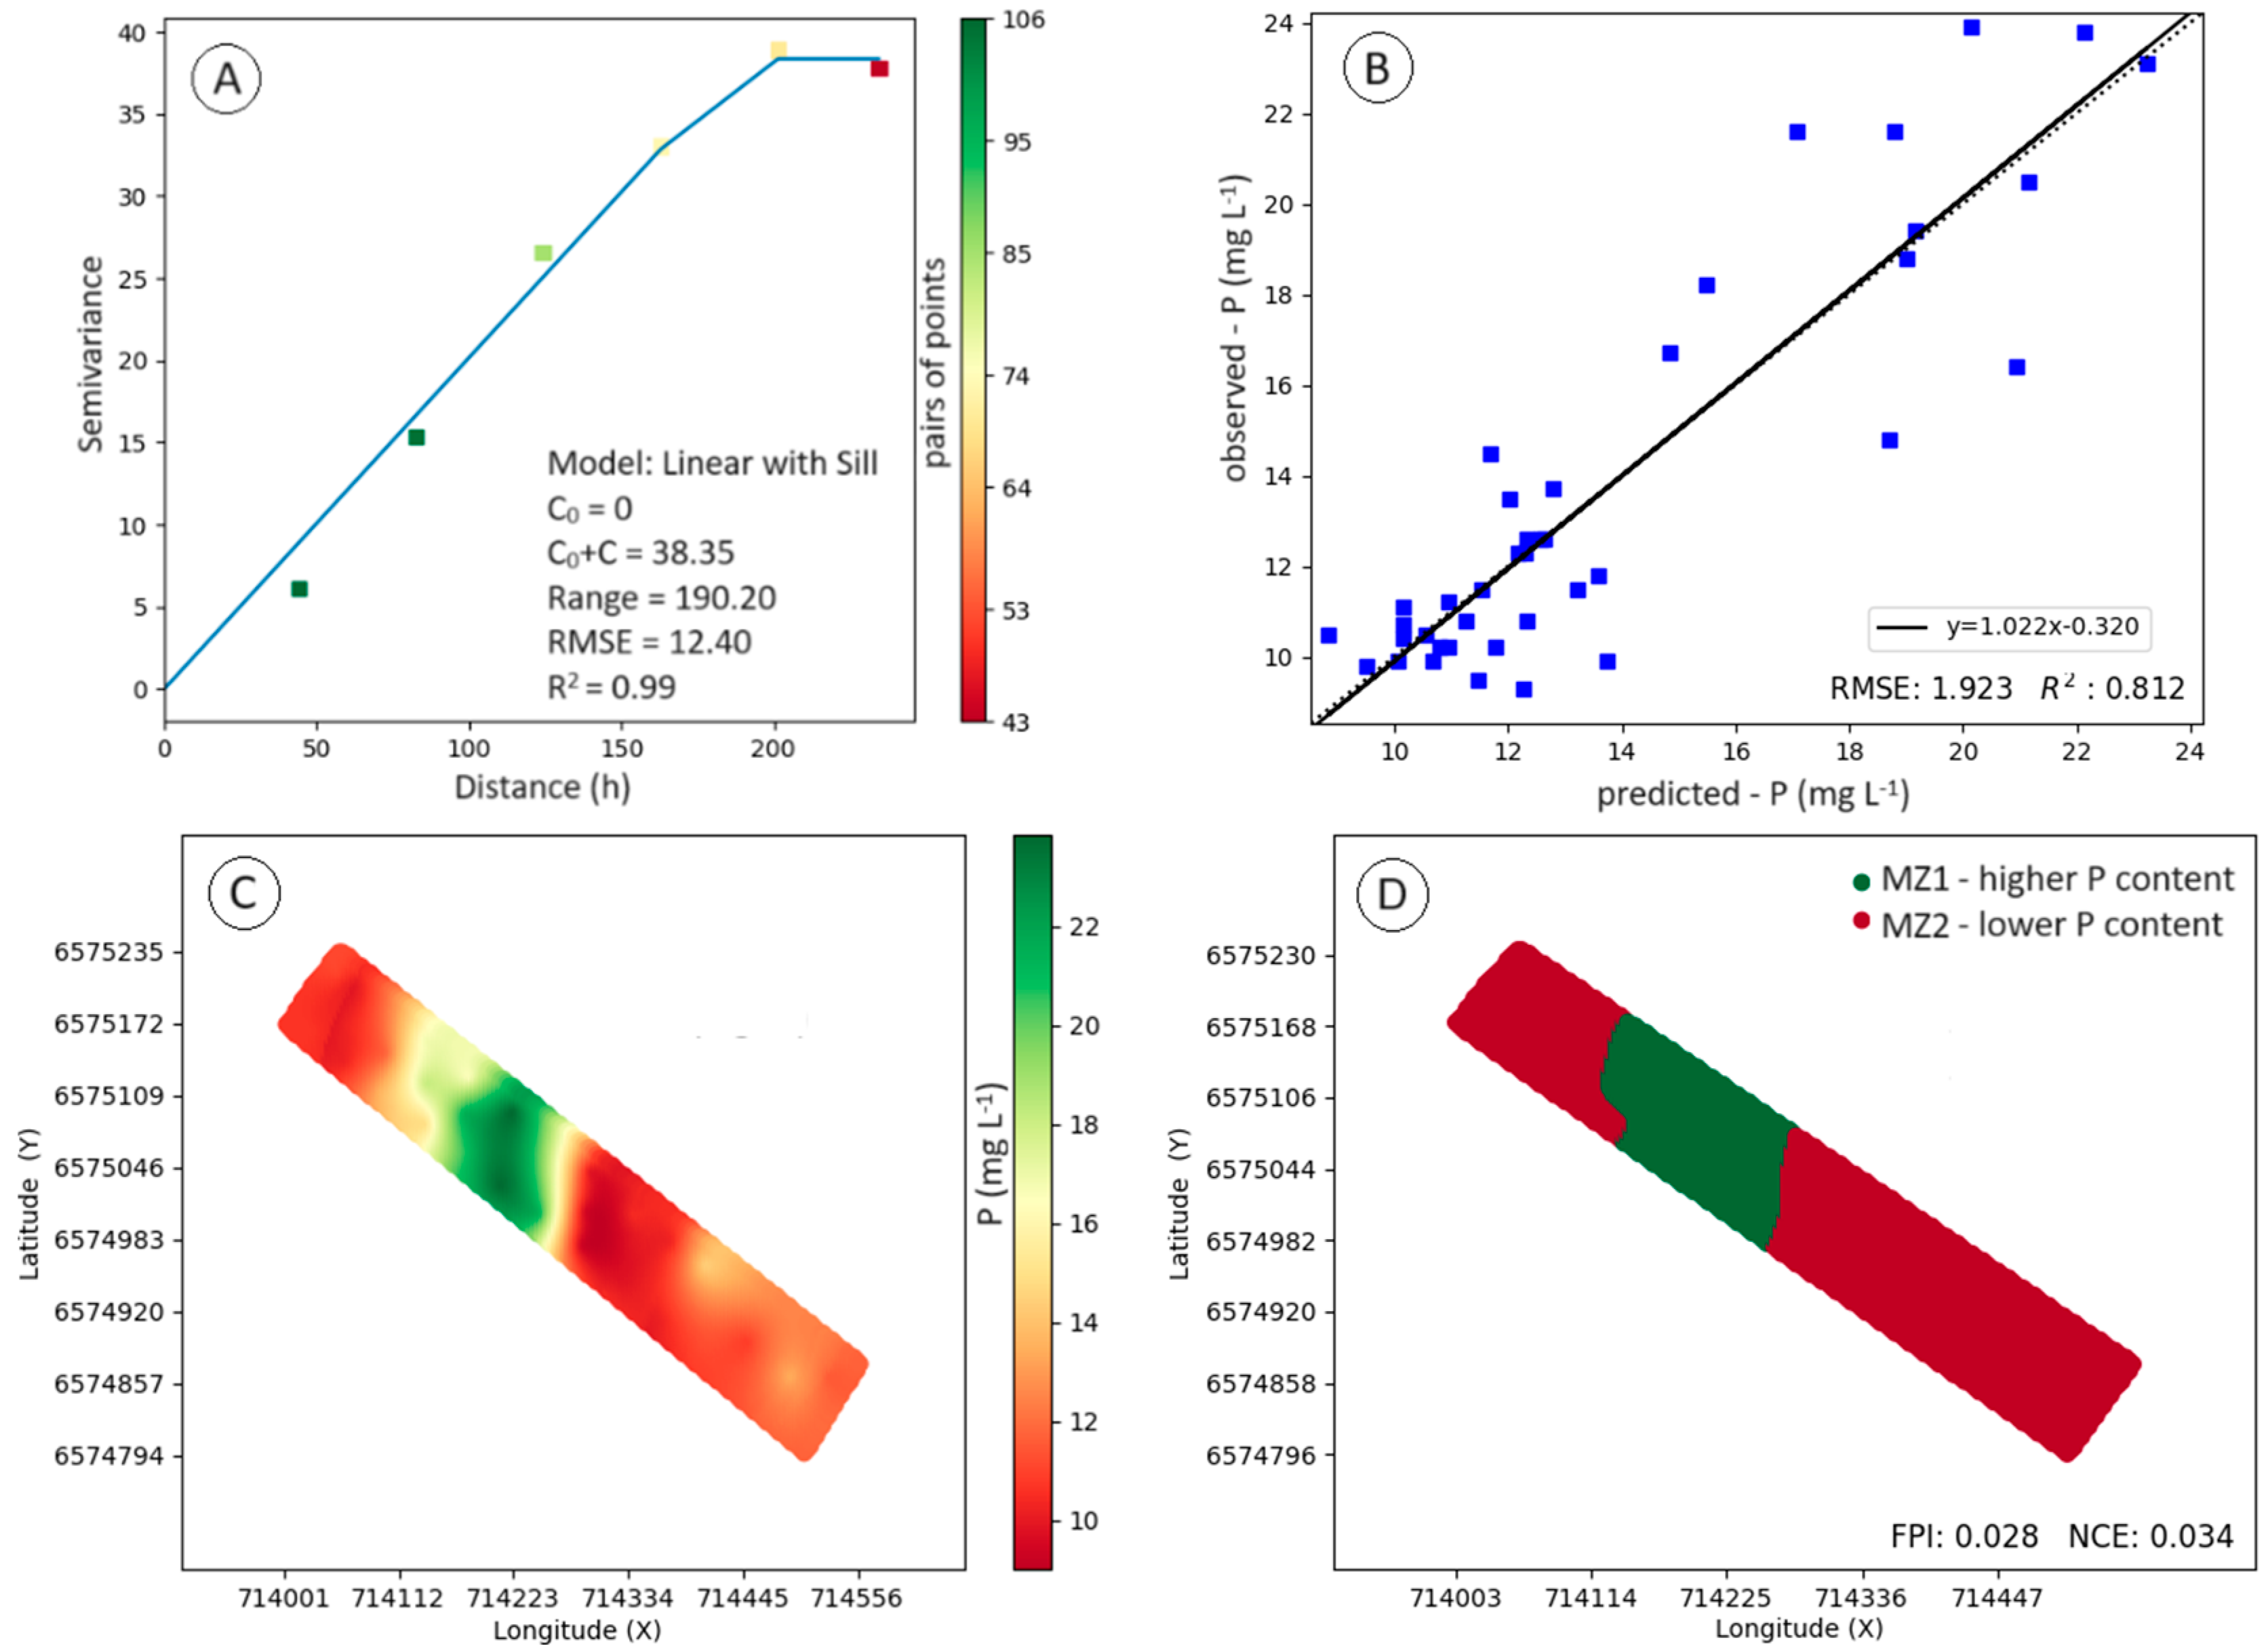
Figure 3.
Soil phosphorus content (A), grain phosphorus content (B), and soybean yield (C) in management zones with high (MZ 1) and low (MZ 2) phosphorus content. Means values followed by the same letters do not present statistical differences.
Figure 3.
Soil phosphorus content (A), grain phosphorus content (B), and soybean yield (C) in management zones with high (MZ 1) and low (MZ 2) phosphorus content. Means values followed by the same letters do not present statistical differences.
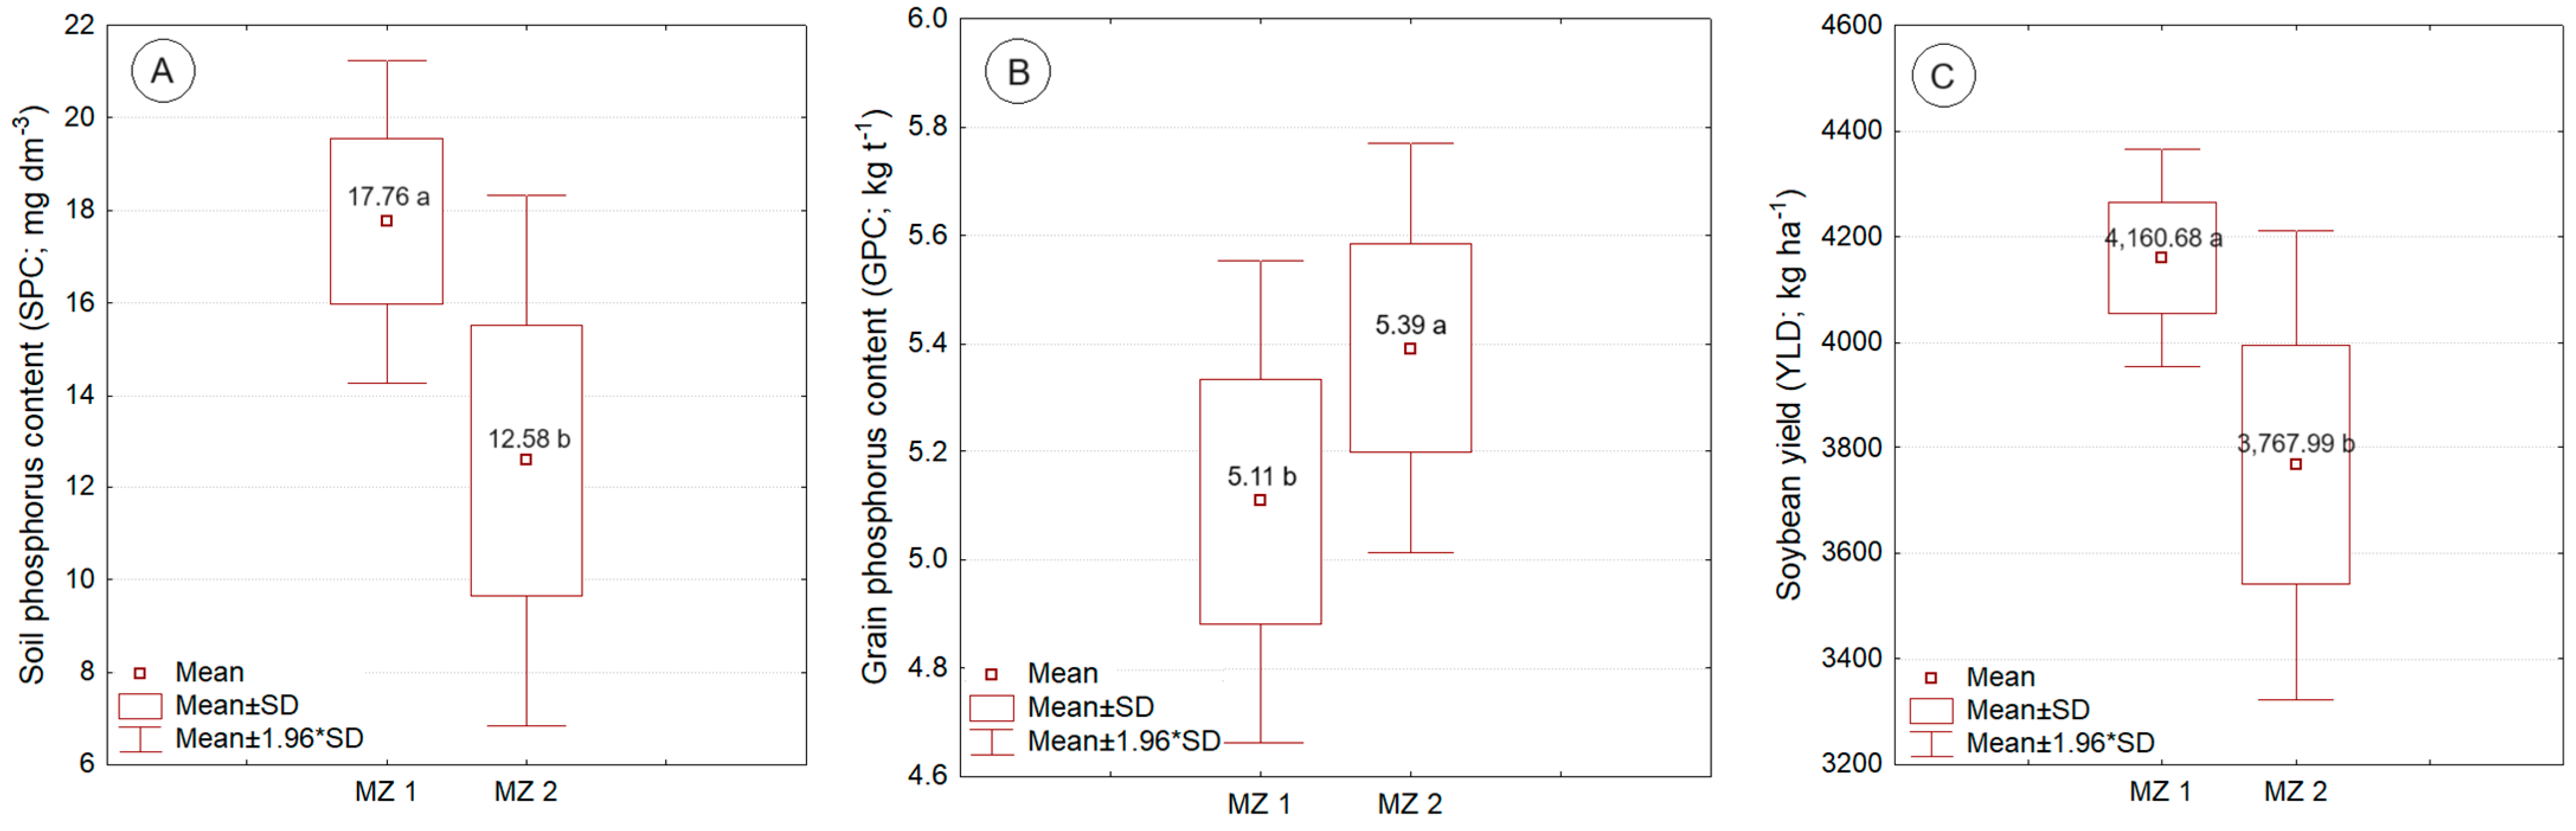
Figure 4.
Effect of phosphorus supply sources (control, C; solubilizer, S and fertilizer, F) on the thousand grains weight (A), soil phosphorus content (B), grains phosphorus content (C), and soybean yield (D). Means values followed by the same letters do not present statistical differences.
Figure 4.
Effect of phosphorus supply sources (control, C; solubilizer, S and fertilizer, F) on the thousand grains weight (A), soil phosphorus content (B), grains phosphorus content (C), and soybean yield (D). Means values followed by the same letters do not present statistical differences.
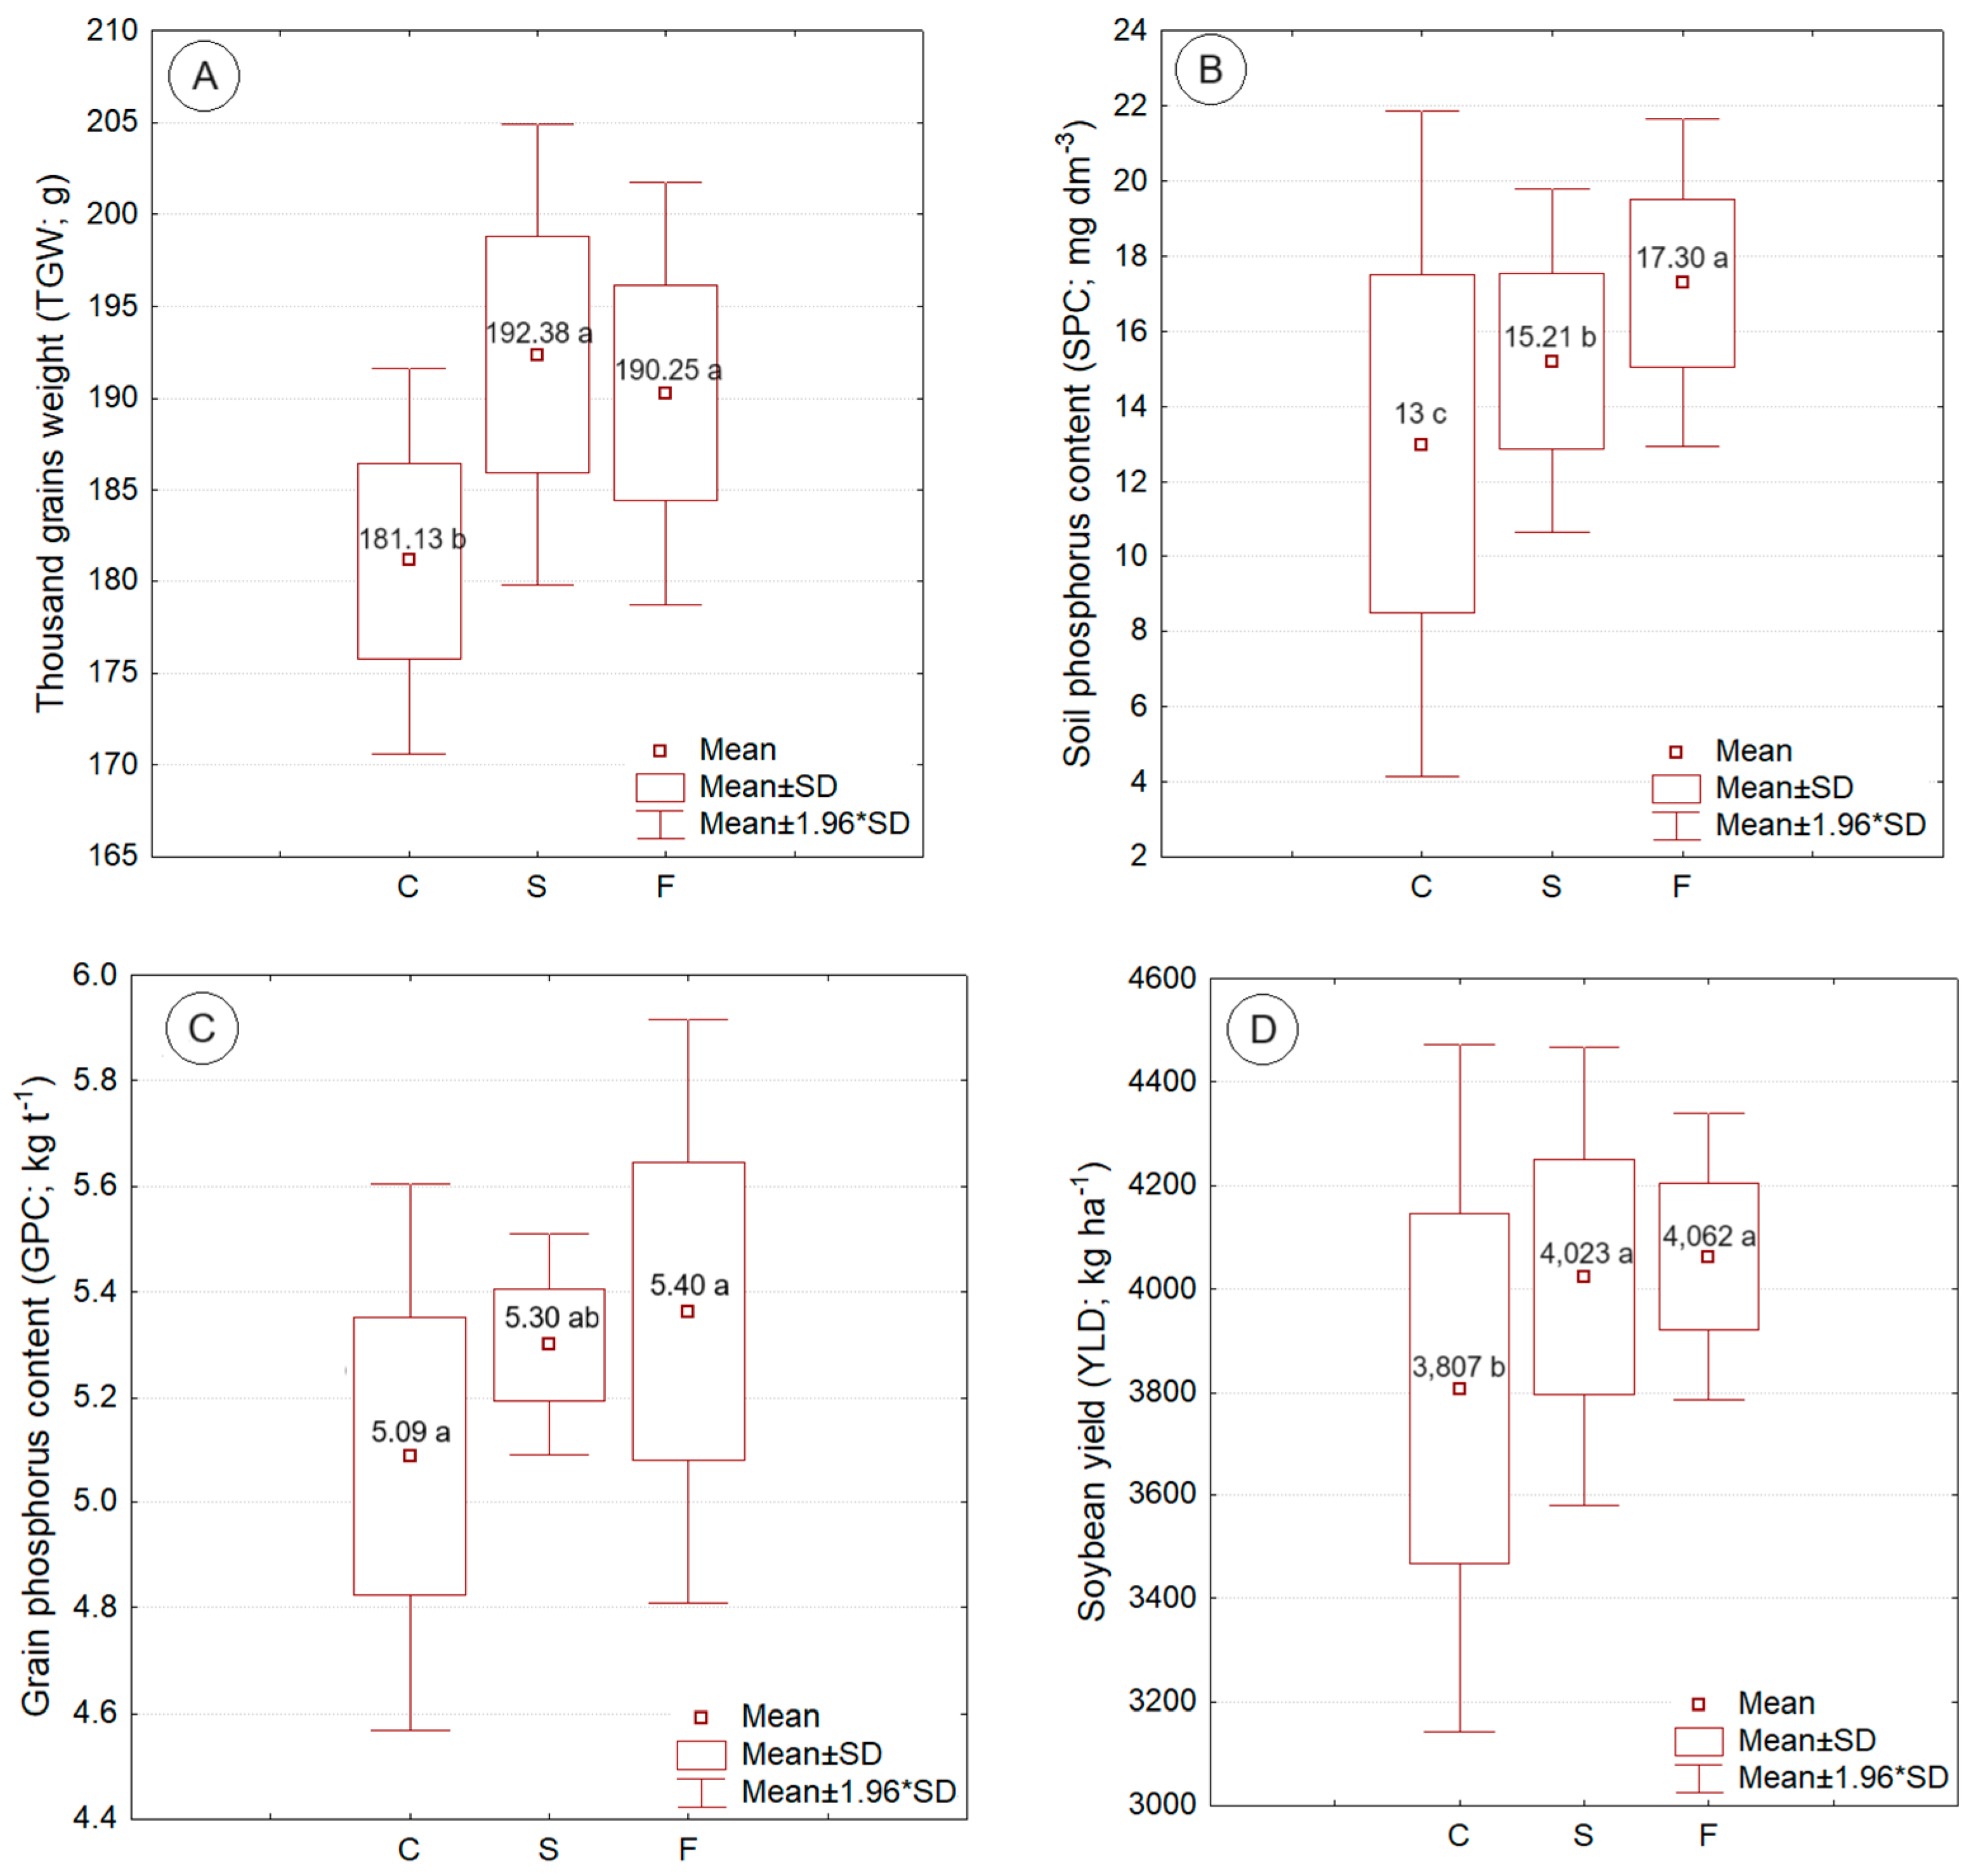
Figure 5.
Interaction effect between phosphorus sources in different management zones (MZ 1 and MZ 2) on soil phosphorus content (A) and soybean yield (B). Means values followed by the same letters do not present statistical differences, lowercase letters between MZ and uppercase letters between phosphorus sources.
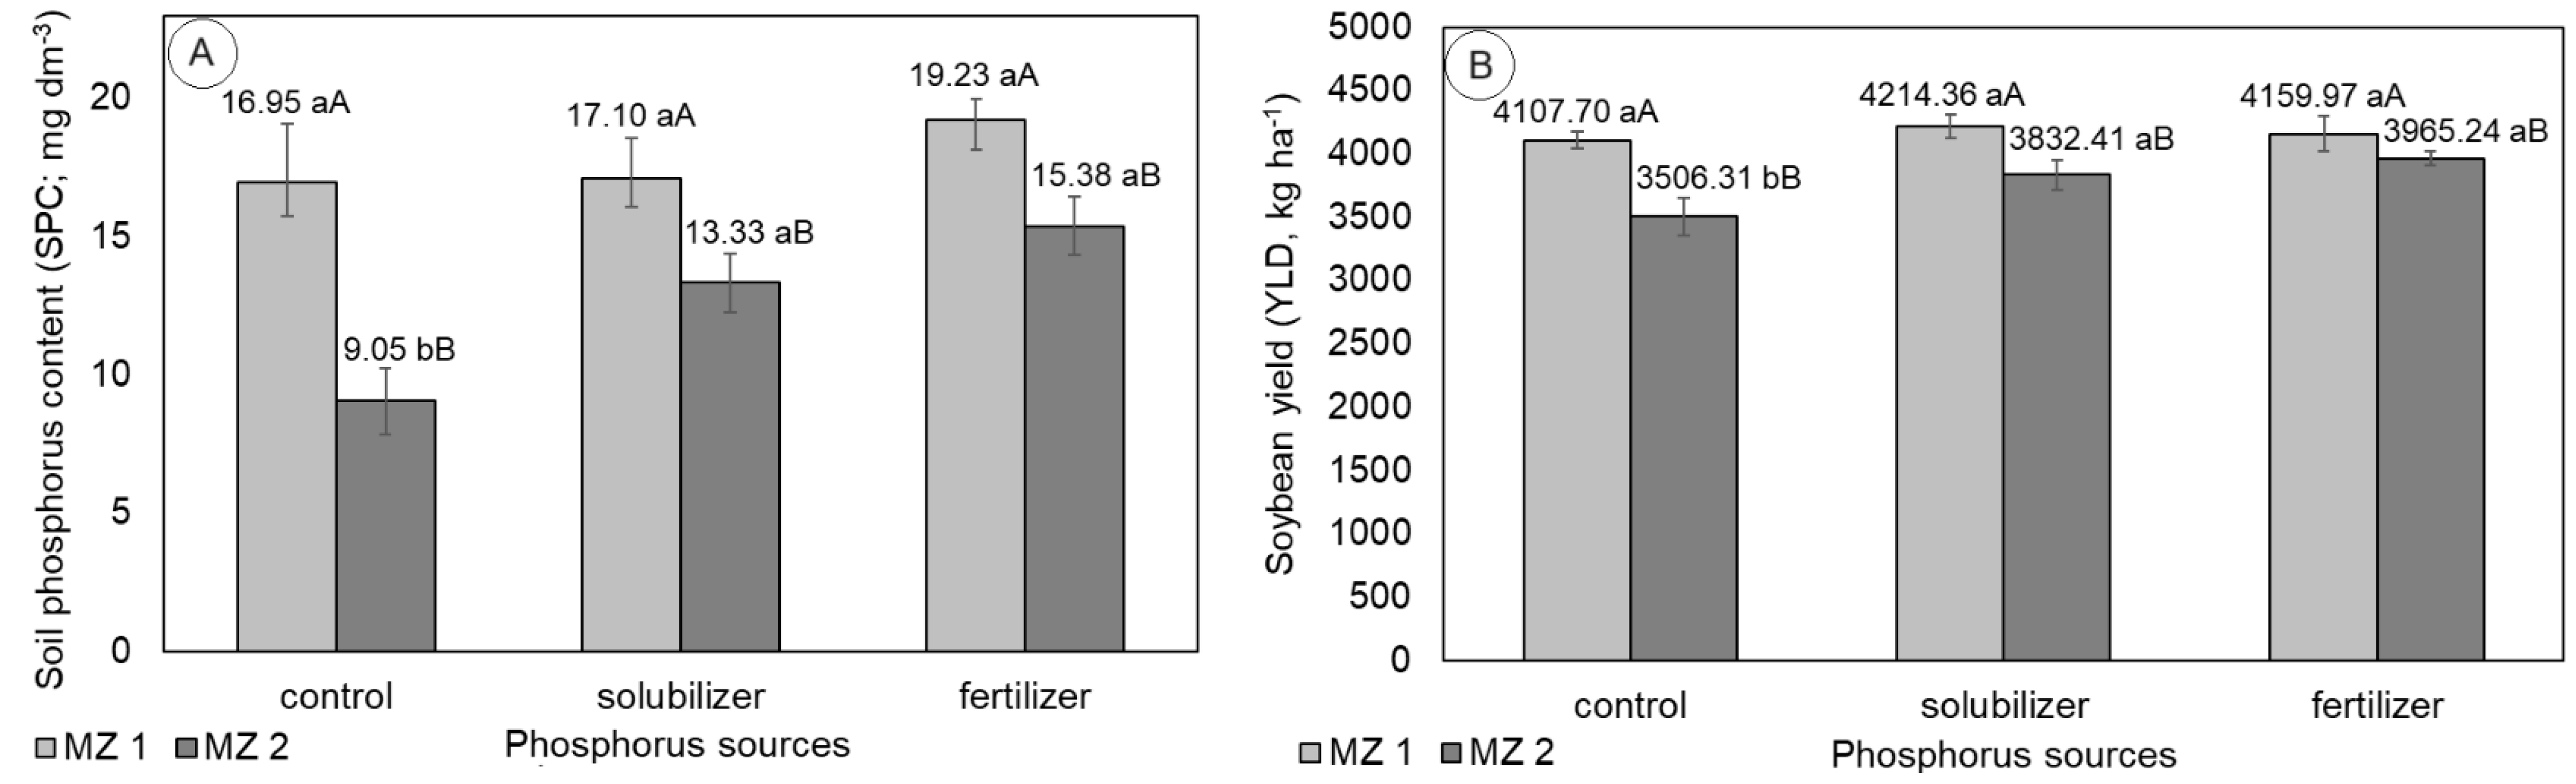

Table 1.
Descriptive statistics of soil phosphorus content (mg dm–3) in the field and each management zone (MZ).
Table 1.
Descriptive statistics of soil phosphorus content (mg dm–3) in the field and each management zone (MZ).
| Soil attribute | N | Minimum | Mean | Maximum | σ | VC (%) | |
| P (mg dm-3) | Field | 40 | 9.30 | 13.82 | 23.90 | 4.49 | 32.48 |
| MZ 1 | 11 | 16.40 | 20.36 | 23.90 | 2.68 | 13.18 | |
| MZ 2 | 29 | 9.30 | 11.33 | 14.80 | 1.49 | 13.18 | |
N: number of sampling points; σ: standard deviation; VC: variation coefficient.
Table 2.
Variance analysis summary with mean squares for the variables thousand grains weight (TGW; g), soil phosphorus content (SPC; mg dm–3), leaf phosphorus content (LPC; g kg–1), grain phosphorus content (GPC; mg dm–3) and soybean yield (YLD; kg ha–1).
Table 2.
Variance analysis summary with mean squares for the variables thousand grains weight (TGW; g), soil phosphorus content (SPC; mg dm–3), leaf phosphorus content (LPC; g kg–1), grain phosphorus content (GPC; mg dm–3) and soybean yield (YLD; kg ha–1).
| Variation source | DF | TGW | SPC | LPC | GPC | YLD |
| Factor A (MZ) | 1 | 37.5ns | 160.68* | 0.0009 ns | 0.0048* | 92,5228.69* |
| Factor B (phosphorus source) | 2 | 285.79* | 36.99* | 0.018 ns | 0.0017* | 15,1591.6* |
| A x B | 2 | 5.38 ns | 11.14* | 0.0034 ns | 0.0008 ns | 82,861.29* |
| Block | 3 | 15.28 ns | 0.03 ns | 0.014 ns | 0.00012 ns | 5,978.38 ns |
| Error | 15 | 42.41 ns | 2.19 ns | 0.039 ns | 0.0003 ns | 13,248.49 ns |
| VC (%) | - | 3.47 | 9.75 | 7.96 | 3.27 | 2.90 |
| Mean | - | 187.92 | 15.17 | 2.47 | 0.52 | 3,964.33 |
| Shapiro Wilk test (p<0.05) | - | 0.64 ns | 0.14 ns | 0.57 ns | 0.23 ns | 0.065 ns |
*means show statistical difference (Tukey test; p <0.05). ns not significant.
Disclaimer/Publisher’s Note: The statements, opinions and data contained in all publications are solely those of the individual author(s) and contributor(s) and not of MDPI and/or the editor(s). MDPI and/or the editor(s) disclaim responsibility for any injury to people or property resulting from any ideas, methods, instructions or products referred to in the content. |
© 2025 by the authors. Licensee MDPI, Basel, Switzerland. This article is an open access article distributed under the terms and conditions of the Creative Commons Attribution (CC BY) license (http://creativecommons.org/licenses/by/4.0/).
Copyright: This open access article is published under a Creative Commons CC BY 4.0 license, which permit the free download, distribution, and reuse, provided that the author and preprint are cited in any reuse.


