
Submitted:
24 February 2025
Posted:
25 February 2025
You are already at the latest version
Abstract
CuCrO₂ (mcconnellite) was synthesized using both the solid-state method and microwave dielectric firing. It was characterized as a novel black ceramic pigment for use in various industrial glazes. For the first time, the application of mcconnellite (CuCrO₂) and its coloured glazes as selective solar absorbers (SSA) for integral ceramic solar collectors has been reported. The addition of quartz or anatase was investigated as colour modifiers to prevent the bluing of the pigment in Zn-containing glazes, a phenomenon associated with the exsolution of copper. Furthermore, doping with lanthanide oxides was explored to address two key challenges: controlling the formation of pinhole defects in porcelain glazes, which are linked to the destabilization of Cu⁺, and adjusting the IR cut-off wavelength to improve its performance as SSA.
Keywords:
ceramic pigment
; mcconnellite
; microwaves
; selective solar absorber
; ceramic glaze
1. Introduction
Mcconnellite CuCrO2 belongs to the ternary oxides ABO2 (A+ of Cu, Pt, Ag, and B+3 of Fe, Cr, Al, Ga) of delafossite class of minerals which show a laminar structure formed by sheets of BO6-9 octahedrons linked by O-A+-O dumbbells. Two polymorphs of delafossite are described in literature: the hexagonal delafossite (S.G. P63/mmc) first reported by Kohler and Jansen in 1983 and the trigonal delafossite (S.G. R-3m) described by Pabst in 1939 [1,2]. Cu delafossite families, CuMIIIAO2 (MIIIA=Al, Ga, In) and CuMIIIBO2 (MIIIB=Sc, Y, La) stabilize in rhombohedral and hexagonal l structures, respectively (2). The prepared mcconnellite has been indexed as hexagonal delafossite CuCrO2 which is an oxide p-semiconductor with excellent electrical, magnetic, and optical properties [3,4].
The efficient use of thermal energy derived from solar radiation using FPSC (flat-plate solar collector) requires efficient and low-cost selective solar absorber (SSA) [5]. Yang et al. [6] reported an integral ceramic solar collector made entirely of ceramics based on a low-porosity ceramics body, through which the heat transfer liquid circulates, and coated with a with a slurry of a black ceramic pigment as selective solar absorber surface; the ceramic assembly was fired at 1210 °C. The selective solar absorber is a critical component of solar collector, designed to maximise solar absorbance within the solar spectrum range (300–2500 nm) while allowing thermal emission in the infrared range, beyond the solar spectrum limit of approximately 2000 nm [7]: an ideal SSA shows a very sharp spectral transition between the region of high absorbance and low emittance (cut-off wavelength) to the region of low absorbance and high emittance. For energy applications, the cut-off wavelength should be around 2000 nm, which is the limit of the solar spectrum [7]. In a previous paper, Monrós et al. [8] reported the synthesis and characterization of coloured glazes with tetragonal CuCr2O4 as selective solar absorbers for Integral ceramic solar collectors. The prepared tetragonal CuCr2O4 shows the presence of Macconellite CuCrO2 as residual phase in all cases showing its high stability [8].
In this communication, mcconnellite CuCrO2 is synthetised using both solid-state method and by dielectric calcination using microwaves. It is characterized as a new black ceramic pigment in different industrial glazes. The pigment and its coloured glazes are evaluated as selective solar absorber SSA. To address specific challenges, the addition of colour modifiers such as quartz or anatase is explored to mitigate the bluing effect of the pigment in zinc-containing glazes [9], which is associated to copper exsolution. Furthermore, doping with lanthanide oxides is investigated to control pinhole defects in porcelain glazes caused by the destabilization of Cu⁺ ions [10,11]. Studies also examine the cut-off wavelength to enhance the infrared (IR) emittance of the SSA. To the best of our knowledge, the application of mcconnellite (CuCrO₂) as a ceramic pigment and its use in coloured glazes for selective solar absorption in integral ceramic solar collectors has not been previously documented.
2. Materials and Methods
Solid-state or ceramic method of mcconnellite CuCrO2 samples were carried out from tenorite CuO and eskolaite Cr2O3 oxides as precursors, with a particle size ranging from 0.3 to 5 µm. Likewise, for the mcconellite modified samples, additional precursors were used, including quartz (supplied by QUIMIALMEL SA, 99.5 wt.% purity) and Ln2O3 (Ln=La, Ce, Pr, 99.9% purity supplied by ALDRCH SA). The precursors were mechanically homogenized in an electric grinder (20,000 rpm) for 5 min and then fired at 1000-1100 °C for 3 hours in electric kiln.
Likewise, the mixture underwent dielectric firing using microwave-assisted heat treatment. Microwave-assisted dielectric firing is a considered “fast firing” for the synthesis of solids [12,13,14]. The response of materials to microwaves primarily depends on their complex permittivity ε which describes the combined effects of permittivity and conductivity. Conductivity is represented as the imaginary component of the permittivity. Therefore, the complex dielectric constant ε has a real component (ε’) and an imaginary component (ε’’), also known as the dielectric loss factor (ε= ε’+i ε’’). The heat generated in the material-microwaves interaction is directly related to the “loss tangent” (tanδ=tan(ε’’/ε’)).
Transparent or microwaves-inactive materials, such as ceramics, have a low loss tangent (tanδ<0.01) and penetration depth of the order of meters). On thew other hand, susceptors, absorbents or active materials, such as SiC, graphite or water, exhibit a medium loss tangent (tanδ> 0.1) and penetration depth of the order of centimetres. Finally, microwaves-reflective materials, such as metals and conductive materials, exhibit high loss tangent (tanδ>100) and penetration depth of the order of micrometres.
However, the dielectric loss of transparent materials increases gradually with temperature in some cases such as silica or alumina. In contrast, in others materials like titania or zirconia, the tanδ increases significantly at a critical temperature (around 600 °C for titania and 750 for alumina). Therefore, a hybrid microwave-assisted heat treatment of the mixture of solid reactants it is possible. This can be achieved by pre-heating in an electric kiln (Blossi et al. [13]), adding a susceptor (SiC, C, Si3N4) to the mixture to act as an internal auxiliary heater during initial microwave irradiation, or using a closed kiln with its inner surface coated with a susceptor that acts as an external heater during initial irradiation [14]: the susceptor increases in temperature under microwave irradiation and heats the reactant mixture via radiation and/or conduction. Once the mixture reaches the critical temperature, it continues to heat autonomously.
In this study, a hybrid dielectric firing was carried out using microwave-assisted heat treatment in a conventional microwave equipment operating at 800 W and 2.45 GHz. The equipment included a cylindrical kiln for the pre-heating of the mixture (inner dimensions: high 4.5 cm, diameter 13.5 cm) made of aluminosilicate fibreboard (0.3 g/cm3, transparent to microwaves; penetration depth of 0.007 m at room temperature and 0.0025 m at 1300 °C). The kiln’s interior was coated with SiC as susceptor (α-SiC hexagonal, density: 3.2 g/cm3, penetration depth of 12 m at room temperature and 1.2 m at 1300 °C) (Glass Fusing & Cutting Tools, Tianjin, China, 1282151) (Figure 1).
The temperature was estimated using Process Temperature Control Rings (PTCR). Based on PTCR shrinkage measurements after firing (ETH type, 850–1100 °C) with a micrometer, the temperature reached approximately 850 °C at 20 minutes, 950 °C at 30 minutes, and 1050 °C at 60 minutes.
The samples were characterised by the following techniques:
X-ray Diffraction (XRD) was performed on a Siemens D5000 diffractometer using Cu Kα radiation (10–70°2θ range, scan rate 0.03°2θ, 5 s per step and 40 kV and 20 mA conditions).
Optical microscopy using an Olympus IXplore IX85 microscope and Scanning electron microscopy with energy-dispersive spectroscopy (SEM–EDS) analysis of X-ray studies using a JEOL 7001 instruments were used to analyse the microstructure of the powders.
The L*a*b* and C*h* colour parameters of the glazed samples were measured according the CIE-L*a*b* (Commission Internationale de l’Éclairage) [15], using an X-Rite SP60 spectrometer with standard lighting D65 and a 10° observer. In this method L* measures the lightness (100=white, 0=black) and a* and b* chromatic components (-a*=green, +a*=red, -b*=blue, +b*=yellow). The CIEL*C*h colour space is highly correlated with colour perception by the human eye; C* represents chroma [12], and h* is the hue angle, which can be estimated from parameters a* and b* using Equations 1 and 2, respectively.
C*=(a2+b2)1/2
h* = arctan (b*/a*)
The tolerance ΔE* (based on the L*a*b* parameters), is evaluated using Equation (3):
UV-Vis-NIR spectra of both the fired powder and glazed samples were collected using a Jasco V670 spectrometer with the diffuse reflectance technique, which provides data in absorbance or reflectance units (R (%)). The band gaps of the samples were estimated using the Tauc method [16]. The total solar reflectance was evaluated from the UV-Vis-NIR spectra using the diffuse reflectance technique, while both absorbance and emittance are estimated using Equations (4) and (5):
where r(λ) is the spectral reflectance (Wm−2) measured by UV-Vis-NIR spectroscopy and i(λ) is the standard solar irradiation (Wm−2 nm−1) according to the American Society for Testing and Materials (ASTM) Standard G173-03.
where ε is the emittance that measures the ability to release heat that it has absorbed for a material, and therefore, its temperature is moderated [17], r(λ) is the spectral reflectance (Wm−2) measured by UV-Vis-NIR spectroscopy and E(λ,T) is the blackbody radiation spectrum at the considered temperature (Wm−2 nm−1) [18]. The emittance index of solids is high (e.g., ceramics 0.9, asphalt 0.88) except in the case of conductive metals (e.g., Ag 0.02, Al 0.03, Cu 0.04) [8].
The pigmenting capacity of the corresponding pigment was studied by glazing the pigment in three types of glazes (see composition in Table 1): (a) a double firing frit with maturation point at 1000 °C, (b) a double firing frit at 1050 °C, and (c) a porcelain single firing frit at 1190 °C. The glazed samples were prepared using white stoneware tile substrates coated with glaze. The glazed sample was prepared by manual mixing of frit, pigment and water in a weight ratio of 97:5:40 in an agate mortar, and applying it to a thickness of approximately 1500 μm using the Doctor Blade technique.
Molten glazes attack pigment particles by dissolving or reacting with them, leading to potential degradation or alteration of color. The aggressiveness of the glaze increases with the maturation temperature and chemical composition, following the sequence a-c. An efficient ceramic pigment should retain its pigmentation capacity even in aggressive glazes.
3. Results and Discussion
Table 1 shows the estimated compositions by EDS of employed frits above described. All frits were milled to a particle size between 1-15 µm. The alumina increases consistently with the maturation temperature of the glaze. On the other hand, the glaze at 1000 °C is ZnO free, and the porcelain single firing frit (1190 °C) shows a low amount of ZnO (6 wt.%) compared with the double firing glaze at 1050 °C (9 wt.%).
3.1. Characterization of Powders: Effect of Microwaves Firing
Figure 2 and Table 2 show the characteristics of black powders K (fired with microwaves for 60 min at 800 W), KM (fired with microwaves followed by firing at 1000 °C for 3 h in an electric kiln) and KCE (fired in electric kiln at successively 1000, 1100 and 1200 °C for 3 h).
The microwaves-assisted sample (K) fired for 60 minutes at 800 W (~1050 °C), the corresponding KCE (fired at 1000 °C for 3 hours), and KM powders exhibit an intense black colour. However, both KM and K shows a lower deviation ΔE* from carbon black used as reference (ΔE*= 15.7 and 17.0 and RVis=9.7% and 9.9 %, respectively), as shown in Table 1 compared to the fired with an electric kiln (ΔE*= 23.1 and RVis=13.8%). Additionally, the extra electric firing of the KM sample does not increase significatively the black shade of powder (RVis decreases only 0.2%). The band gap of samples measured by Tauc procedure (see Figure 3 and Table 2) slightly decreases from K (1.30 eV) to KM (1.28) and KCE (1.26 eV), in agreement with the decrease in the black shade (increase in RVis). Figure 2 shows the XRD diffractograms of the powders: in all samples, mcconnellite CuCrO2 (JCPDS 039-0247) is the only crystalline phase detected.
Figure 3a shows the corresponding UV-Vis-NIR reflectance spectra of powders: absorbance bands (minima in the figure) at 430, 620, 680, and 1200 nm can be observed associated to Cr3+ (d3) absorptions in octahedral environments: (4A2g(4F) → 4T1g(4F)) at 430 nm, 4A2g(4F) → 4T2g(4F)) detected at 680 nm, and (4A2g(4F) → 2Eg(2G)) at 1000-1300 nm. The low coordinated Cu+ in the O-Cu+-O dumbbells of mcconnellite can produce the absorption at 625 nm [19,20]. However, the intensity of these d-d transitions does not explain the anomalously high optical density detected. Therefore, as in the case Mn-Melilite and the Egyptian Blue pigments, spin-exchange interactions of Cr3+ with adjacent Cu2+ by a Paired spin exchange transition (PET), should be considered [19,20,21].
Figure 4 shows the optical images of these CuCrO2 samples, a low particle size is observed for microwave fired powder (sample K). The SEM images (Figure 5) of KCE 1000 °C/3h show platelet-shaped particles forming aggregates, with intercalation between them in the range of 5-15 µm. The microwave-fired sample (K) exhibits similar characteristics but with more rounded and finer particles. The small particle size and microstructure of the microwave-fired powder can be associated to its highest black intensity of colour (lowest ΔE* and RVis).
The increase in firing temperature for KCE powder does not significantly affect the black shade: although both RVis and chroma C decrease, the lightness (L) of the powders at 1100 and 1200 °C remains above 42, and ΔE greater than 22 (Table 2). The UV-Vis-NIR diffuse reflectance spectra of KCE at different firing temperatures, along with the corresponding XRD results, are very similar, and mcconnellite is the only phase detected (Figure 2 and Figure 3).
The NIR reflectance is low for all powders: ranging between 8.2 and 14.6 % for KCE fired at 1100 °C and 1200 °C, respectively. Similarly, the absorbance and emittance of all these samples are high (Table 2). The cut-off wavelength between the regions of high absorbance and high reflectance is unsharpened, with a soft bandgap ranging from 1.26 eV for KCE fired at 1000 °C and 1.30 eV for dielectric-fired K sample, which is a limitation for its application as an SSA.
3.2. Characterization of Glazed Samples in Double Firing Glaze at 1000 °C: Effect of Microwave Glazing
Figure 6 and Table 2 show the characteristics of 5wt.% glazed powders of K (microwave firing), KM (microwave firing followed by electric firing 1000 °C for 3 h) and KCE (electric firing 1000 °C for 3 h) in the double firing glaze at 1000 °C. Likewise, K powder was glazed in the same glaze but using microwave firing (20 min, 800 W, around 850 °C). Microwave glazing produces a black shade closer to carbon black than conventional glazing with electric kiln (ΔE*=3.7 versus 9.5). However, conventional glazing with an electric kiln shows both lower lightness than carbon black (L*=11.3 versus 20.2 for carbon powder) and visible reflectance (RVis=1.4 versus 3.0 for carbon black). Therefore, glazing with a conventional electric kiln, the sample calcined with microwaves produces better black colour than the observed for the carbon black powder used as reference, absorbing a 98.6% of visible light. The glazed sample of the KM powder (subjected to 60 min of dielectric firing and then fired in the electric kiln) shows a black shade behavior very similar to that of the KCE sample (RVis=1.4 and ΔE*=8.8). Therefore, the electric firing following microwave treatment does not significantly improve the final result.
Figure 7 shows the UV-Vis-NIR diffuse reflectance spectra of the glazed samples in double firing frit 1000 °C. All samples exhibit similar spectra, with bands located at similar positions as those in the powder samples: bands at 450, 720 and 1340 nm are detected, associated with Cr3+ (d3) absorptions in octahedral environments as previously described, although they shift to higher wavelength. The low-coordinated Cu+ in O-Cu+-O dumbbells of macconellite can produce an absorption at 620 nm which overlaps with the bands of Cr3+ (d3) at 450 and 720 nm. Consistent with their similar optical spectra, the bandgap measured from the Tauc plots shown in Figure 6 are very similar: 0.92, 0.93, 0,95, and 1.00 eV for K (microwave firing and glazing), K (microwaves glazed with electric kiln), KM and KCE glazed samples, respectively.
As observed in the powders, the NIR reflectance is low in these glazed samples, with values ranging 1.9 to 5.0% for K glazed with electric kiln and KCE fired at 1100 °C, respectively. Likewise, their absorbance and emittance are high (Table 2), and the cut-off wavelength is not sharply defined, with a soft bandgap between 0.87 eV for K fired only with microwaves and 1.00 eV for KCE fired at 1000 °C, which represents a deficiency for its application as SSA.
3.4. Characterization of Glazed Samples in Double Firing Glaze at 1000 °C: Effect of Microwave Glazing
Figure 6 and Table 2 show the results obtained for the KCE sample fired in electric kiln at 1000 °C for 3 hours, with 5 wt.% of the pigment incorporated into the glazes described in section 3.1. As previously discussed, glazing the KCE in the double firing frit at 1000 °C results in an intense black colour that reflects 98.6% of visible light. However, in the 5wt.% glazed in double firing glaze at 1050 °C the colour presents a blueish hue (L*a*b*=44.2/-4.8/-8.9), suggesting a partial exsolution of copper from the pigment. It is well-established in the literature that Cu2+ solved in glazes can produce either a green colour, associated with octahedrally coordinated Cu2+ in the glassy matrix, or a blue colour, linked to square planar coordinated Cu2+ ions surrounded by oxygens of the glass [16]. Therefore, in this case, the Cu2+ exsolved in the glaze predominantly exhibit square planar coordination.
This instability of the pigment, which is partially dissolved by the molten glaze, is a phenomenon well-documented in the literature [22]. Specifically, the glaze reacts with the CuCrO₂ pigment to form highly stable spinels, including zincochromite spinel (ZnCr₂O₄), which crystallizes through a reaction between the pigment and Zn²⁺ ions of the glaze:
Zn2+(glaze) + 2CuCrO2 → ZnCr2O4 + 2Cu2+(glaze, blue/green shade)
The absence of Al3+ and Zn2+ in the double firing glaze at 1000 °C inhibits the production of spinel, ensuring the pigment remains stable in this glaze. Similarly, the low amount of Zn in porcelain glaze at 1190 °C prevents the perception of blue, even though the green parameter (b* = -2.5) is relatively high. Additionally, some pinhole defects are observed, which are likely associated with the partial reduction of exsolved Cu²⁺ to Cu⁺. This reduction releases oxygen, causing the formation of the observed pinholes:
2CuO(glaze/green shade) → Cu2O(glaze, red shade)+ ½ O2
Figure 8 shows the UV-Vis-NIR diffuse reflectance spectra of KCE powder fired at 1100 °C and the glazed samples in frits at 1000, 1050 and 1190 °C. A sharp contrast can be observed between (1) the powder and the sample glazed with double-fired frit at 1000 °C, which exhibit high absorbance across the entire wavelength range, and (2) the samples glazed with frit fired at 1050 °C and porcelain frit at 1190 °C, both of which display a sharp reflectance cut-off wavelength. This cut-off wavelength has an inflection point at 1725 nm, with a low bandgap of 0.59 and 0.63 eV, respectively, indicating a promising and excellent potential for application as SSA [23].
To address pigment instability in ZnO-containing glazes, a composite effect based on dry powder coating (DPC) was considered. This method uses reflective particles (1–500 µm) as ’hosts’, which are mechanically coated with chromophore-bearing particles (0.1–50 µm) as ’guests’ to enhance properties such as wettability, solubility, and reactivity of the guest particles [24,25,26].
Figure 9 shows the results of the characterization of the composite of mcconnellite as the pigment guest (KCE fired at 1100 °C for 3h) and quartz (Q) or Anatase (Anat) as the hosts supporting particles. For this process, 10 g of mcconnellite was mechanically mixed with the corresponding amounts of quartz or anatase using an electric grinder at 20,000 rpm for 5 minutes. The resulting mixtures were 5wt.% glazed in the double firing glaze at 1050 °C.
Figure 9a shows the UV-Vis-NIR reflectance of quartz and anatase (supplied by QUIMIALMEL SL), both exhibiting high reflectance in the Vis and NIR ranges, around 80% in both cases. Figure 9b shows the CIEL*a*b* and reflectance values of 5wt.% composites glazed in the double firing glaze at 1050 °C compared with undoped pigment. Table 3 summarises the colour and reflectance characteristics of composites.
The addition of quartz inhibits the blueish shade of the glaze, resulting in lower L*, lower C and lower RVis compared to the unmodified sample (Mcconnellite KCE fired at 1100 °C), thereby producing a better black colour. In contrast, the addition of anatase leads to higher lightness (L*) and higher RVis. Although C is lower than the unmodified sample, the shade of the glaze remains similar to that of the unmodified sample. In effect, the deviation of colour of samples with quartz addition from the carbon black powder shade is smaller than of the unmodified sample (ΔE=21.2 and 21.6 for 5%Q and 10%Q, respectively, compared to 26 for the unmodified sample). Conversely, the colour deviation of samples with anatase addition is equal to or greater than that of the unmodified sample (ΔE=24.5 and 26.2 for 5%Anat and 10%Anat respectively) (Table 3).
Figure 9c shows UV-Vis-NIR diffuse reflectance spectra of glazed samples. In accordance with colour analysis, all modified samples exhibit lower reflectance in the visible range (indicating better black colour) and higher reflectance in the NIR range, as indicated by the RNIR values in Table 3. As with the unmodified parent sample, all glazed samples display a sharp cut-off wavelength between high absorptance and high reflectance (and relatively low emittance), with inflection point around 1725 nm. The bandgap for these samples ranges between 0.59 and 0.62 eV (Figure 10), highlighting their potential for excellent performance as selective solar absorbers (SSA).
3.4. Doping Effect with Lanthanide Oxides (CuCr0,9Ln0,1O2, Ln=La, Ce, Pr)
To address the instability of the pigment associated to a partial reduction of exsolved Cu2+ to Cu+, which releases oxygen and results in the formation of pinholes in the porcelain glaze at 1190 °C, the doping effect with lanthanide cations substituting chromium in the mcconnellite structure has been studied [30–32]. The required amount of each lanthanide oxide was used to prepare 10 g of CuCr0,9Ln0,1O2 (Ln = La, Ce, Pr) compositions, using copper oxide, eskolaite, and the corresponding lanthanide oxides as described in the experimental section. The precursor mixture was mechanically homogenized in an electric grinder at 20,000 rpm for 5 minutes. The resulting mixtures were fired in an electric kiln at 1100 °C for 3 hours. The resulting powders were 5wt.% glazed in the porcelain single firing glaze at 1190 °C.
Figure 11a shows the UV-Vis-NIR reflectance of rare earth oxides used (supplied by ALDRICH SA). White oxides such as La2O3 and CeO2 exhibit high reflectance across the entire light spectrum, with a total reflectance above 70%. In contrast, black Pr6O11 demonstrates low reflectance in the visible range (RVis ≈ 5%) and around 30% reflectance in the NIR region (RNIR), highlighting its solar selective absorber (SSA) properties.
Figure 11b and Table 4 present the CIEL*a*b* and reflectance data for CuCr0,9Ln0,1O2 fired powders, compared with undoped pigment. The results show that the doped samples exhibit lower (C) and reduced visible reflectance (RVis) compared to the unmodified sample (mcconnellite KCE fired at 1100 °C). However, the lightness (L*) and the deviation (ΔE) from carbon black values increase, indicating that the doped pigments produce a similar (in the case of Ce) or slightly improved black coloration (in the case of La and Pr) compared to the undoped black powder (Table 4). In effect, the UV-Vis-NIR reflectance spectra of CuCr0,9Ln0,1O2 fired powders (Figure 9c) confirm these findings. The Ce-doped sample exhibits a visible reflectance (RVis) similar to the undoped sample (8.0% and 8.1%, respectively, as shown in Table 4). In contrast, the La- and Pr-doped samples display lower visible reflectance values (RVis = 5.6% and 5.2%, respectively, as detailed in Table 4). The band gap of the doped samples ranges between 0.95 and 1.0 eV (Figure 12), lower than the corresponding undoped samples (e.g., 1.31 eV, KCE sample fired at 1100 °C for 3 hours, Table 2) indicating the effect of lanthanide addition.
Figure 11d shows the XRD diffractograms of doped samples compared to the undoped sample. In all cases, diffraction peaks corresponding to non-reacted lanthanide phases can be detected (La2O3 and CeO2 for La and Ce doped samples and PrCrO3 for the Pr-doped sample). These phases act as composite modifiers.
The synthesized mcconnellite has been indexed as hexagonal delafossite phase. The cell parameters and the volume (V) of the hexagonal unit cell were calculated using the 2θ positions of the diffraction peaks, applying Equations (6) and (7) [34]:
where d is the interplanar distance of the respective (hkl) lattice plane, obtained from °2θ using Bragg’s law, and a=b and c represent the hexagonal unit cell edges. The results are summarised in Table 5, showing a slight increase in cell dimensions, likely due to the incorporation as solid solution of the lanthanide ions with higher ion size (1.172, 1.150 and 1.130 Å for La3+, Ce3+ and Pr3+ ions, respectively, compared to 0.755 Å for Cr3+ in octahedral coordination) [33]. Both the solid solution and the composite effect may contribute to the enhanced visible light absorbance observed in the lanthanide modified-samples compared to the undoped pigment.
Figure 11e and Table 4 show the CIEL*a*b* values and reflectance data of 5 wt.% glazed CuCr0,9Ln0,1O2 powders in the single firing porcelain glaze at 1190 °C, compared with undoped pigment. The results indicate that doped samples exhibit lower lightness (L*), lower chroma (C) and reduced visible reflectance (RVis) compared to the unmodified sample (mcconnellite KCE fired at 1100 °C). Additionally, the deviation from carbon black (ΔE) decreases, resulting in a better black coloration than the undoped black powder (Table 4).
Furthermore, the UV-Vis-NIR reflectance spectra of CuCr0,9Ln0,1O2 fired powders (Figure 11f) reveal that the reflectance across the entire light range is lower for the modified samples than for the undoped pigment. Specifically, the RVis values are 2.9, 4.9 and 3.3% for La, Ce and Pr doped samples, respectively, compared to 6.3% for glazed undoped pigment (Table 4). The band gap of the glazed doped samples in the frit of 1190 °C ranges between 0.62 and 0.63 eV (Figure 12), similar than the corresponding undoped samples (e.g., 1.63 eV, KCE sample in the frit of 1190 °C, Table 2).
On the other hand, La and Pr effectively inhibit the pin-hole defects observed in the undoped pigment. However, in Ce-modified sample still shows the presence of pinhole defects. Therefore, some stabilization of copper can be detected on La and Pr modified samples. This suggests some stabilization of copper in the La- and Pr-modified samples.
5. Conclusions
Mcconnellite CuCrO2 was synthetised using both the solid-state and dielectric calcination using microwaves and has been characterized as a novel black ceramic pigment in different industrial glazes. The pigment prepared with microwave assistance (60 min at 800 W) exhibits a deeper black colour compared to the pigment obtained through electric firing at 1000 °C for 3 h. This is demonstrated by its lower deviation (ΔE*) from carbon black, which was used as a reference, and its lower visible reflectance (RVis: 15.7% and 9.7% versus 23.1% and 13.8%, respectively), correlating with its smaller particle size and optimized microstructure. When microwave-assisted pigment is glazed in a double firing glaze at 1000 °C using an electric kiln, it produces a black shade closer to carbon black (ΔE*=3.7) compared to conventional glazing with an electric kiln (ΔE* = 9.5). This result surpasses the performance of the reference carbon black powder, absorbing 98.6% of visible light.
Both powders and glazed samples in the double firing glaze at 1000 °C show low NIR reflectance values ranging from 1.9 (for K glazed with an electric kiln) to 5.0 (for KCE fired with electric kiln at 1100 °C). Their absorbance and emittance are high, with an unsharpened cut-off wavelength, which presents a limitation for their application as solar selective absorbers (SSA).
Using higher maturation glazes, the newly developed mcconnellite pigments exhibit a bluish hue in double firing at 1050 °C, which is associated with the presence of zinc. Furthermore, pinhole defects are observed in the porcelain single-firing glaze at 1190 °C, associated with the destabilization of copper (I). For glazed samples with a double-firing glaze at 1050 °C and a porcelain glaze at 1190 °C, a sharp cut-off wavelength is observed between high absorptance and high reflectance, along with low emittance. This cut-off, with an inflection point at 1725 nm, highlights their excellent potential for application as SSAs.
Composites of the fired pigment with quartz suppress the blueish shade, producing a better black colour when glazed in the double firing glaze at 1050 °C. In contrast, composites with anatase exhibit a glazing behaviour similar to the unmodified sample.
Doped samples with formal stoichiometry CuCr0,9Ln0,1O2 (Ln= La, Ce or Pr) show improved black colour compared to the undoped black powder (RVis=2.9, 4.9 and 3.3%, respectively, versus 6.3% for unmodified pigment). Furthermore, La and Pr inhibits the pin-hole defects observed in the undoped pigment. However, pinhole defects persist in the Ce-modified sample. This suggests that La and Pr modifications contribute to the stabilization of copper in the samples.
Author Contributions
For research articles with several authors, a short paragraph specifying their individual contributions must be provided. The following statements should be used “Conceptualization, G.M., G.M-A and M.L.; methodology, G.M. and C.D.; software, G.M-A; validation, G.M., C.D. and J.B.; formal analysis, G.M-A; investigation, C.D, J.B; resources, G.M; data curation, C.D.; writing—original draft preparation, C.D, G.M. and G.M-A; writing—review and editing, G.M., C.D.; visualization, J.B.; supervision, G.M. and M.L.; project administration, G.M. and M.L.; funding acquisition, G.M, J.B and M.L. All authors have read and agreed to the published version of the manuscript.
Funding
This research was funded by Jaume I University (UJI) and Valencian Comunity Governement (GV) by UJI-B2021-73 and CIAICO/2022/155 projects, respectively.
Data Availability Statement
This study was carried out throughout the year 2024.
Acknowledgments
The authors aknowledge Jaume I University (UJI) and Valencian Comunity Governement (GV) its financial support (UJI-B2021-73 and CIAICO/2022/155 projects, respectively), and the technical support of the Servei Central d’Instrumentació Científica (SCIC) (UJI)
Conflicts of Interest
The authors declare no conflicts of interest.
Abbreviations
The following abbreviations are used in this manuscript:
| SSA | selective solar absorber |
| FPSC | flat-plate solar collector |
| IR | infrared |
| XRD | X-ray Diffraction |
| SEM–EDS | Scanning electron microscopy with energy-dispersive spectroscopy |
| JCPDS | Joint Committee on Powder Diffraction Standards |
| UV-Vis-NIR | Ultraviolet-visible-near infrared |
References
- Kohler, B.U; Jansen, M. Synthesis and crystal structure of 2H-CuAlO2, Zeitschrift fur Kristallographie 165, 1983, 313-314. [CrossRef]
- Huda, M. N. ; Yan, Y.; Walsh, A.; Wei, S.; Al-Jassim, M. M. Group-IIIA versus IIIB delafossites: Electronic structure study, Physical review b 80, 2009, 035205. [CrossRef]
- Viegas, M. C.; de Figueredo, G. P.; Rodrigues, S. F.; Cabral, A. A.; Castro, M. A. M.; Oliveira, M. M. Synthesis of delafossite CuCrO2 via solution combustion method and its acid functionalization for biodiesel production, Cerâmica 69, 2023, 1-5.
- Wang, J.; Zheng, P.; Li, D.; Deng, Z.; Dong, W.; Tao, R.; Fang, X. Preparation of delafossite-type CuCrO2 films by sol–gel method, Journal of Alloys and Compounds 509, 2011, 5715–5719. [CrossRef]
- Yang, H.; Wang, Q.; Huang, Y.; Feng, J.; Ao, X.; Hu, M.; Pei, G.; Spectral optimization of solar selective absorbing coating for parabolic trough receiver, Energy 183, 2019, 639–650. [CrossRef]
- Yang, Y.; Cao, S.; Xu, J.; Cai, B.; All-ceramic solar collectors, Ceramics International, 39, 2013, 6009–6012. [CrossRef]
- Roberts, D.E.; Forbes, A. An analytical expression for the instantaneous efficiency of a flat plate solar water heater and the influence of absorber plate absorptance and emittance, Solar Energy 86, 2012, 1416–1427. [CrossRef]
- Monrós, G.; Delgado, C.; Monrós-Andreu, G.; Badenes, J.; Llusar, M. Black Coloured Glazes with Tetragonal CuCr2O4 Ceramic Pigment as Selective Solar Absorbers for Integral Ceramic Solar Collectors. Journal of Solar Energy Research Updates, 11, 2024, 78–92. [CrossRef]
- Dziubak, C. Colour modifiers of zirconium-vanadium pigments on a ZrO2 basis, Materials Science-Poland, 30,4, 2012, 398-405 . [CrossRef]
- Saez Puche, R.; Norton, M.; White, T.R.; Glaunsinger, W.S. Magnetic properties of the semiconducting lanthanide cuprates Ln2CuO4 and their interpretation: Evidence for a new series of planar copper antiferromagnets, Journal of Solid State Chemistry 50,3, 1983, 281-293 . [CrossRef]
- Mukovozov, I.E.; Ezerets, A. M.; Vishniakov, A. V.; Mendeleev, D. I.; Forni, L.; Oliva, C. Structural effects of interaction between lanthanum cuprate and cerium dioxide, Journal of Materials Science 32, 1997, 4991-4997 . [CrossRef]
- Calbo, J.; Gargori, C.; Sorlí, S.; Badenes, J.; Tena, M.A.; Monrós G. Síntesis de pigmentos cerámicos mediante radiación microondas. Bol. Soc. Esp. Ceram. Vidr. 46, 2007, 14–20. [CrossRef]
- Blosi, M.; Dondi, M.; Albonetti, S.; Baldi, G.; Barzanti, A.; Zanelli, C. Microwave-assisted synthesis of Pr–ZrSiO4, V–ZrSiO4 and Cr–YAlO3 ceramic pigments. J. Eur. Cer. Soc. 29, 2009, 2951–2957. [CrossRef]
- Bhattacharya, M.; Basak, T. A review on the susceptor assisted microwave processing of materials. Energy 97, 2016, 306-338. [CrossRef]
- CIE Comission International de l’Eclairage, Recommendations on Uniform Color Spaces, Colour Difference Equations, Psychometrics Colour Terms. Suplement nº2 of CIE Pub. Nº15 (E1-1.31), 1971, Bureau Central de la CIE, Paris (1978).
- Tauc, J.; Grigorovici, R.; Vancu, A. Optical Properties and Electronic Structure of Amorphous Germanium. Phys Status Solidi, 15,2, 1966, 627–637. [CrossRef]
- Kennedy, C.E. Review of Mid- to High-Temperature Solar Selective Absorber Materials, 2002, http://www.osti.gov/bridge.
- Kuhn, T.S. Black–Body Theory and the Quantum Discontinuity. Oxford University Press. Oxford, 1978, ISBN 0-19-502383-8.
- Monrós, G. Scheelite and Zircon: Brightness, Color and NIR Reflectance in Ceramics, Nova Scienc Publishers, New York, 2021, ISBN: 978-1-53619-332-9.
- Staines, M.P.; Bittar, A.; Presland, M.R. Diffuse reflectance of oriented polycrystalline YBa2Cu3O7-δ, Solid State Communications, 72,7, 1989, 677-679 . [CrossRef]
- Kendrick, E.; Kirk, C.J.; Dann, S.E. Structure and colour properties in the Egyptian Blue Family, M1-xM’xCuSi4O10, as a function of M, M’ where M, M’=Ca, Sr and Ba. Dyes and Pigments 73, 2007, 13-18. [CrossRef]
- Verger, L.; Olivier, D.; Rousse, G.; Cotte, M.; Cormier, M. L. The Stability of Gahnite Doped with Chromium Pigments in Glazes from the French Manufacture of Sèvres. Journal of the American Ceramic Society, 100, 2016, 86-95. [CrossRef]
- Pfeffer, R.; Dave, R.N.; Dongguang, W.; Ramlakhan, M. Synthesis of engineered particulates with tailored properties using dry particle coating. Powder Technol. 117, 2001, 40–67. [CrossRef]
- Monrós, G.; Badenes, J. A.; Llusar, M.I. Ecofriendly High NIR Reflectance Ceramic Pigments Based on Rare Earths Compared with Classical Chromophores Prepared by DPC Method, Ceramics, 4, 5, 2022, 614-641. [CrossRef]
- Sultan, S.; Kareem, K.; He, L. Synthesis, characterization and resistant performance of α-Fe2O3@SiO2 composite as pigment protective coatings, Surface and Coatings Technology, 300, 2016, 42-49. [CrossRef]
- Kachhap, S.; Singh, S.; Singh, A. K.; Singh, S. K. Lanthanide-doped inorganic halide perovskites (CsPbX3): novel properties and emerging applications, J. Mater. Chem. C, 10, 2022, 3647-3676. [CrossRef]
- Bogachev, N.A.; Betina, A.A.; Bulatova, T.S.; Nosov, V.G.; Kolesnik, S.S.; Tumkin, I.I.; Ryazantsev, M.N.; Skripkin, M.Y.; Mereshchenko, A.S. Lanthanide-Ion-Doping Effect on the Morphology and the Structure of NaYF4:Ln3+ Nanoparticles. Nanomaterials (Basel), 27,12, 2022, 2972. [CrossRef]
- Teixeira, V.; Sousa, E.; Costa, M.F.; Nunes, C.; Rosa, L.; Carvalho, M.J.; Collares-Pereira, M.; Roman, E.; Gago, J. Spectrally selective composite coatings of Cr–Cr2O3 and Mo–Al2O3 for solar energy applications, Thin Solid Films, 392, 2, 30, 2001, 320-326. [CrossRef]
- Monrós, G.; Delgado, C.; Llusar, M.; Badenes, J. Effect of silica addition on the photocatalytic activity of MO2@SiO2 (M=Ti, Zr, Sn,Ce) nanocomposites prepared by sol-gel. Journal of Sol-Gel Science and Technology, published on line, 2024. [CrossRef]
- Kohler, B.U.; Jansen, M. Synthesis and crystal structure of 2H-CuAlO2, Zeitschrift fur Kristallographie 165,1983, 313-314. [CrossRef]
- Abdelwahab, H.M.; Ratep, A.; Elsoud, A.M.A.; Boshta, M.; Osman, M.B.S. Influences of annealing temperature on sprayed CuFeO2 thin films, Results in Physics, 9, 2018, 1112–1115. [CrossRef]
- De Graef, M.; McHenry, M.E. Structure of Materials: An Introduction to Crystallography, Diffraction and Symmetry, Cambridge University Press, 2nd ed. 2012 ISBN 978-1-107-00587-7.
- Shannon, R.D. Revised effective ionic radii and systematic studies of interatomic distances in halides and chalcogenides, Acta Cryst., A32, 1976, 751-767. [CrossRef]
Figure 1.
Microwaves pre-heating kiln with the coating of the susceptor.
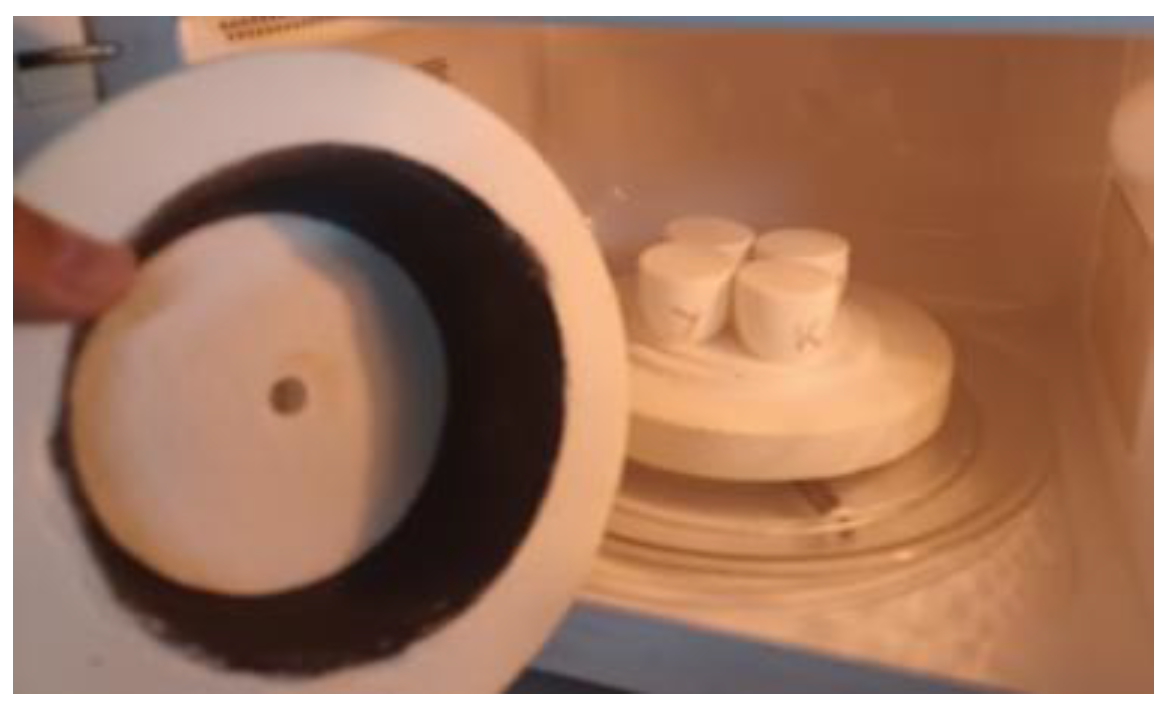
Figure 2.
Characteristics of CuCrO2 powders: reference commercial carbon black (L*a*b*=20,2/0,1/0,1, RVis/RNIR/R= 3/3/3, C*=0,14, h=45).
Figure 2.
Characteristics of CuCrO2 powders: reference commercial carbon black (L*a*b*=20,2/0,1/0,1, RVis/RNIR/R= 3/3/3, C*=0,14, h=45).
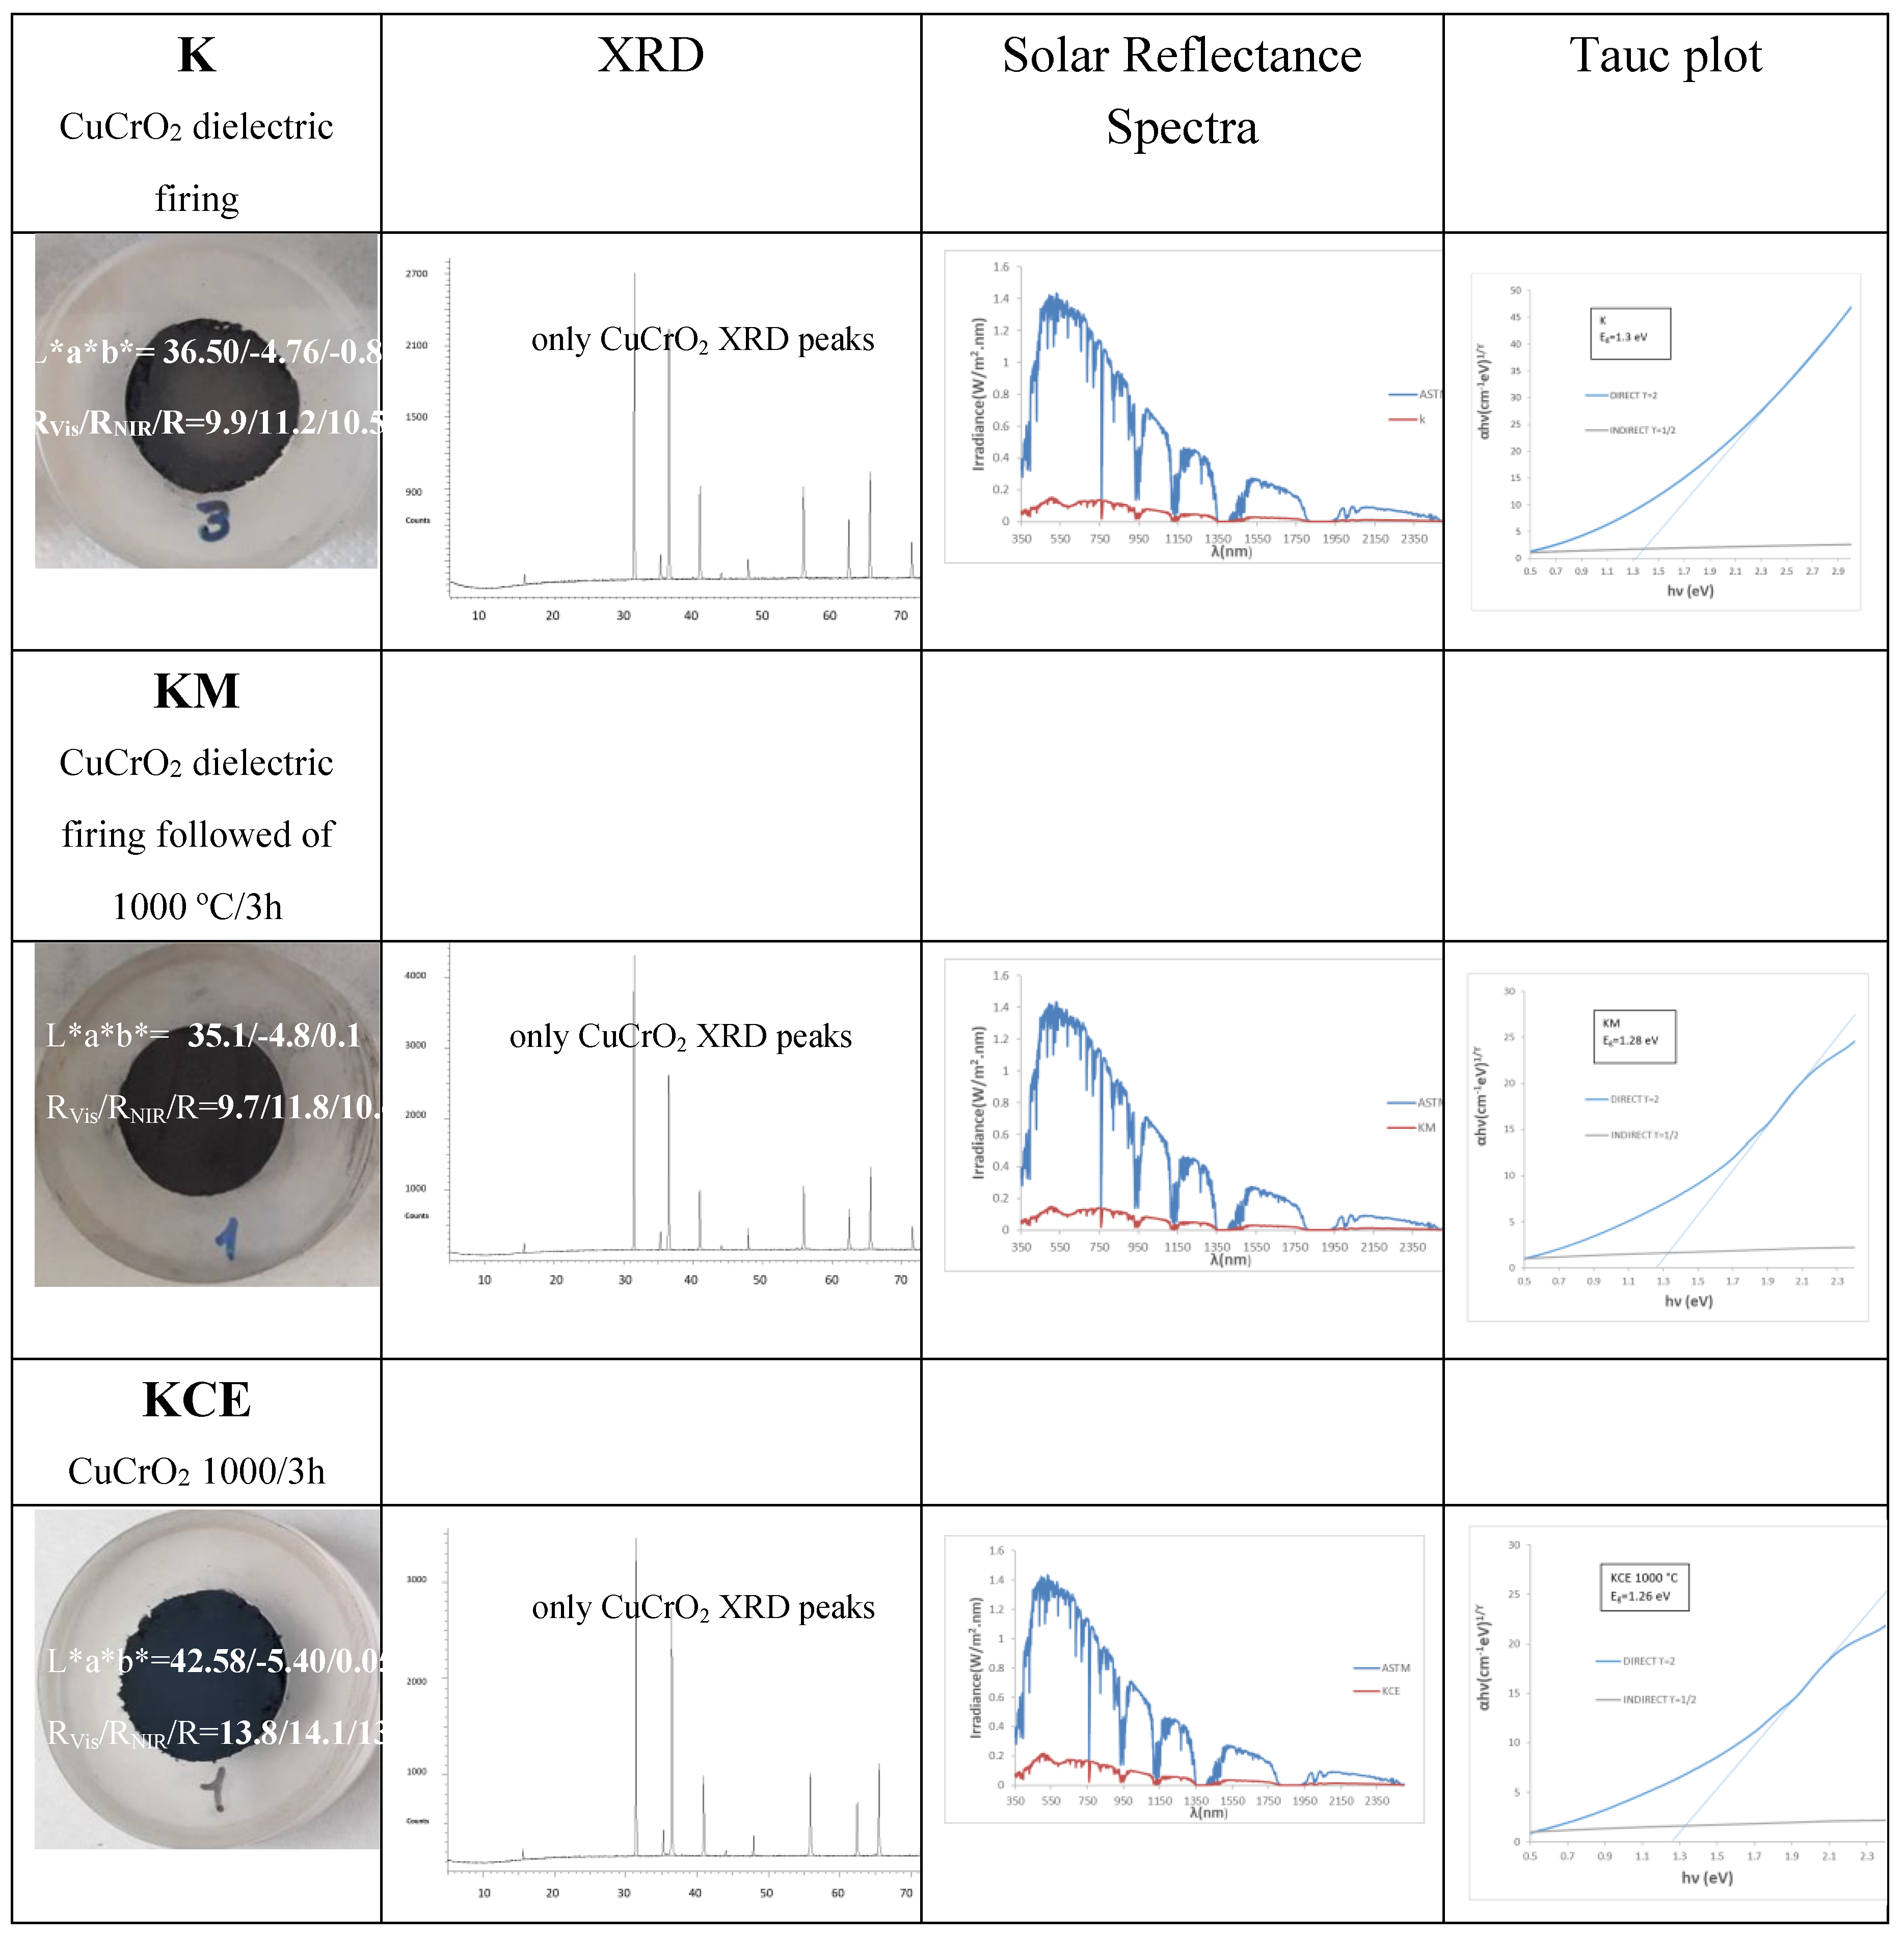
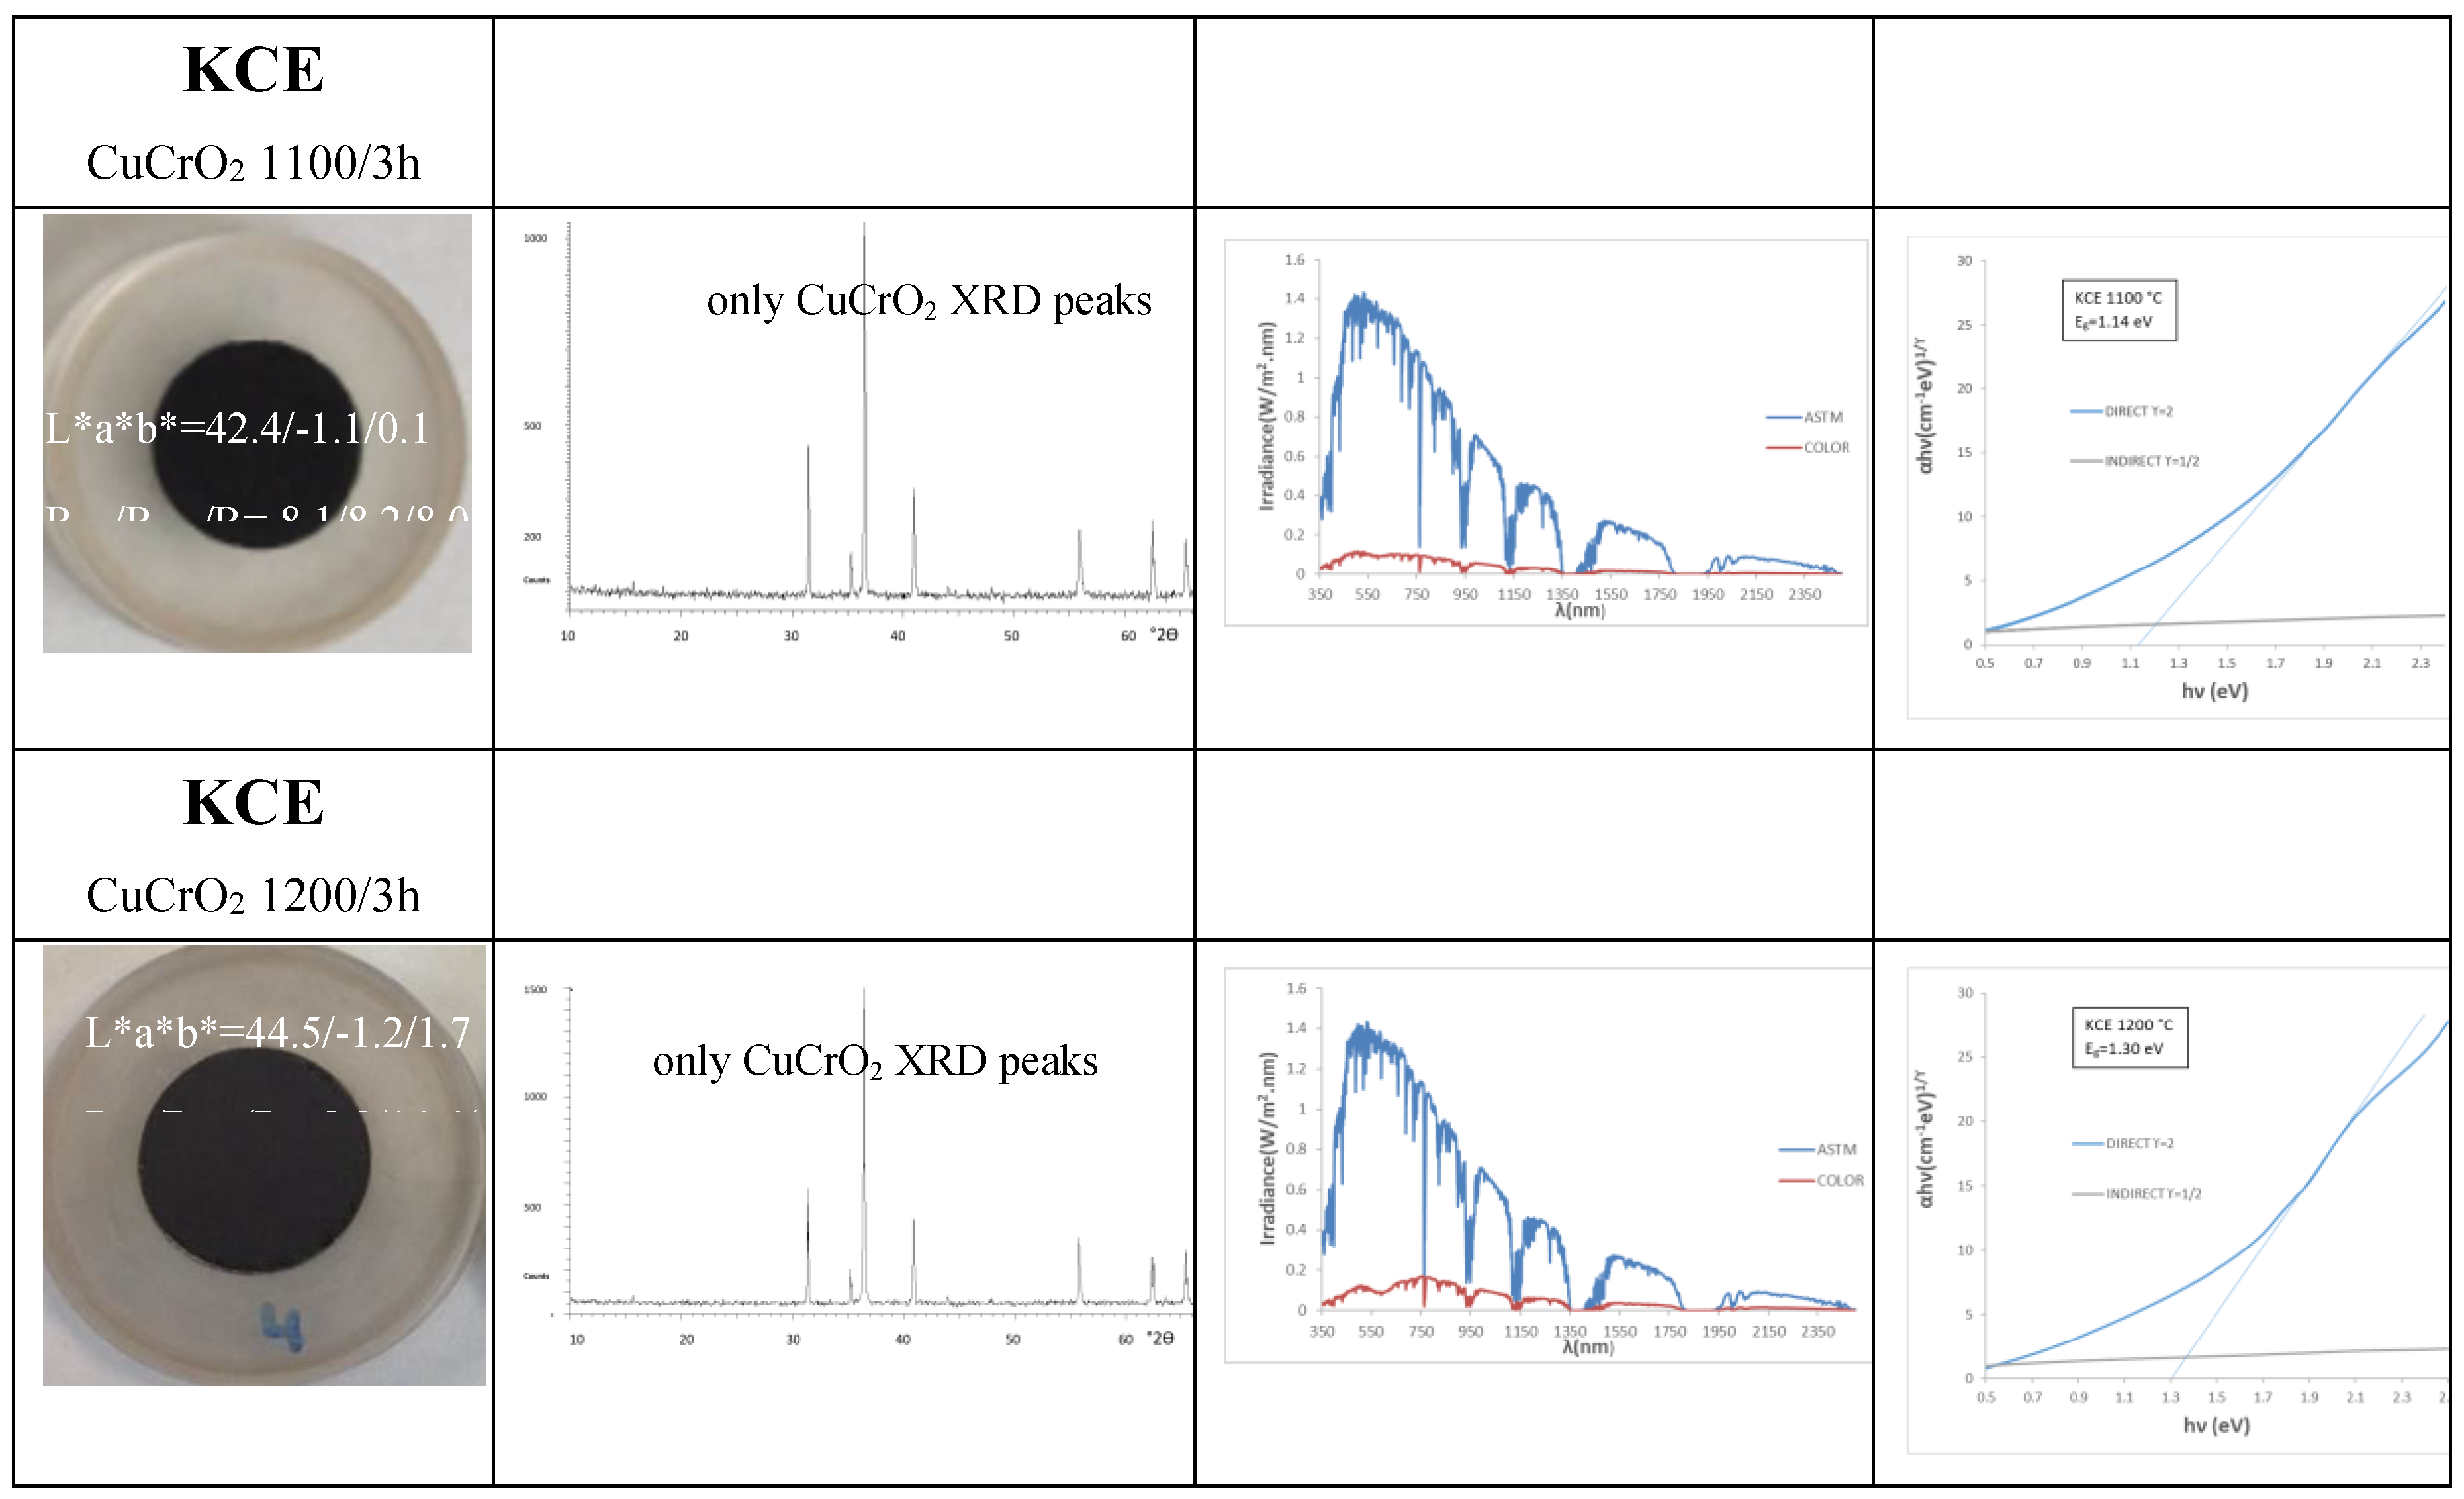
Figure 3.
UV-Vis-NIR diffuse reflectance spectra of powders: (a) K, KM and KCE (at 1000 °C/3h), (b) KCE fired at indicated temperature.
Figure 3.
UV-Vis-NIR diffuse reflectance spectra of powders: (a) K, KM and KCE (at 1000 °C/3h), (b) KCE fired at indicated temperature.
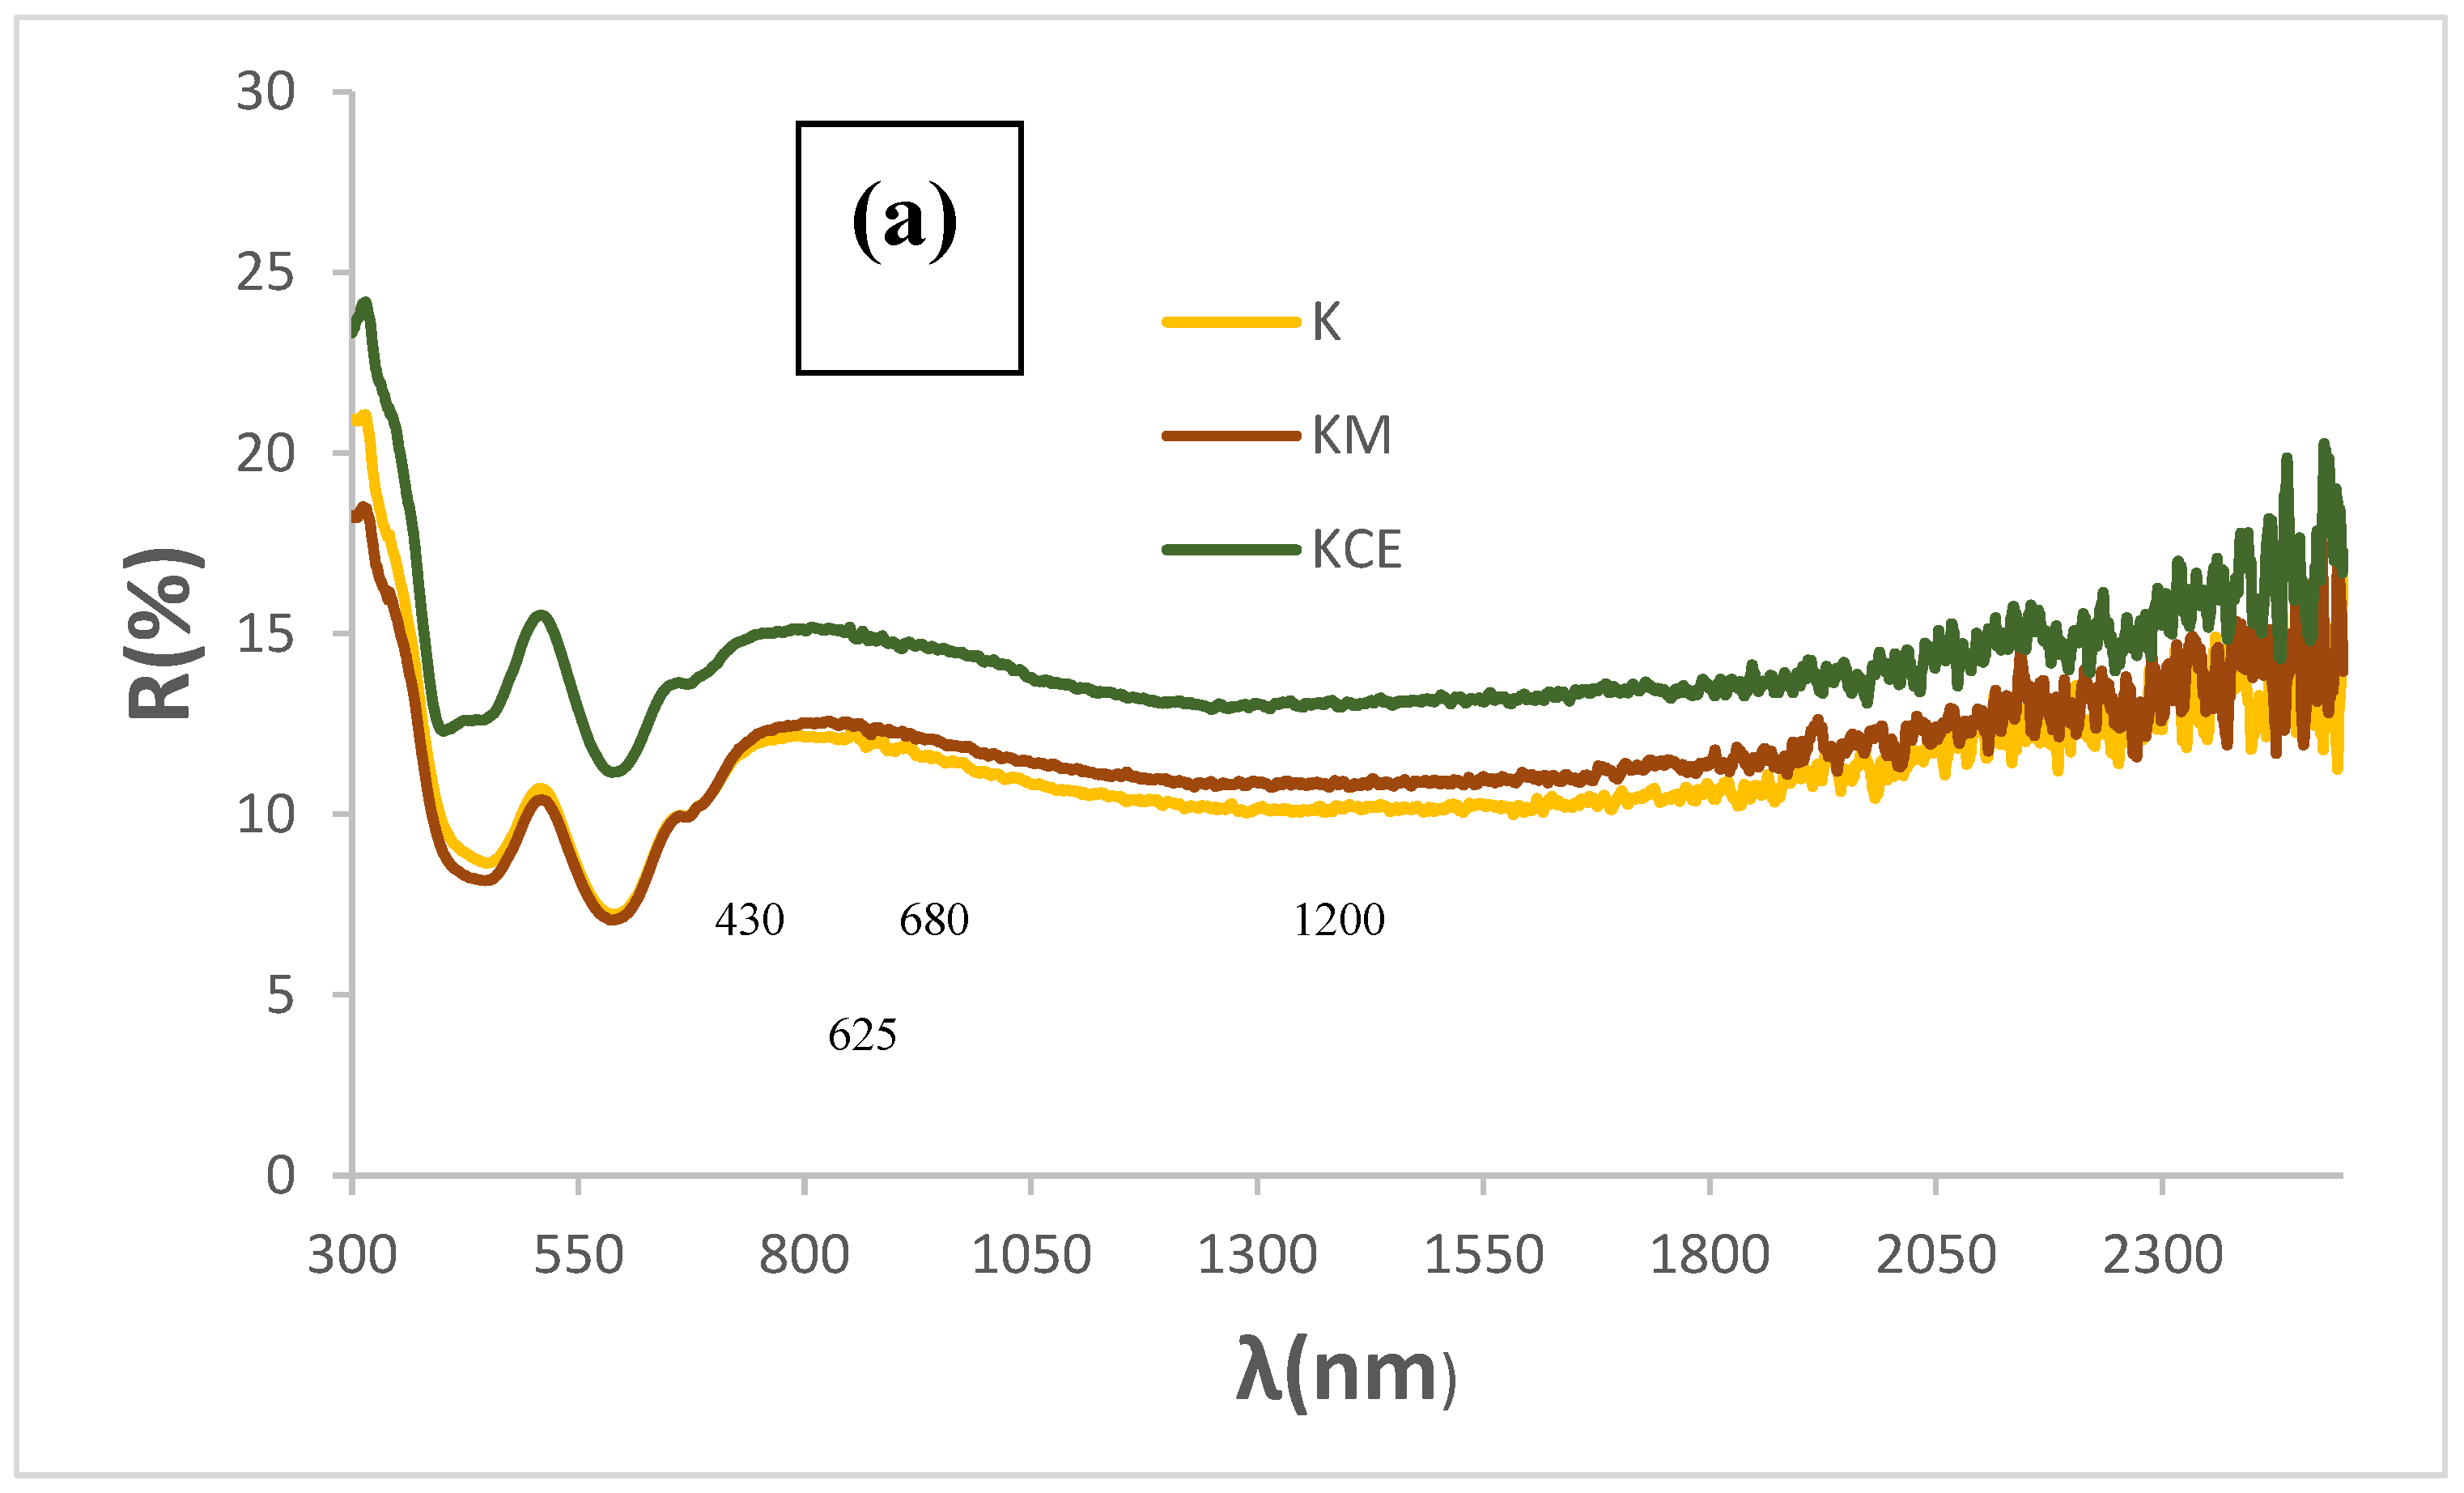
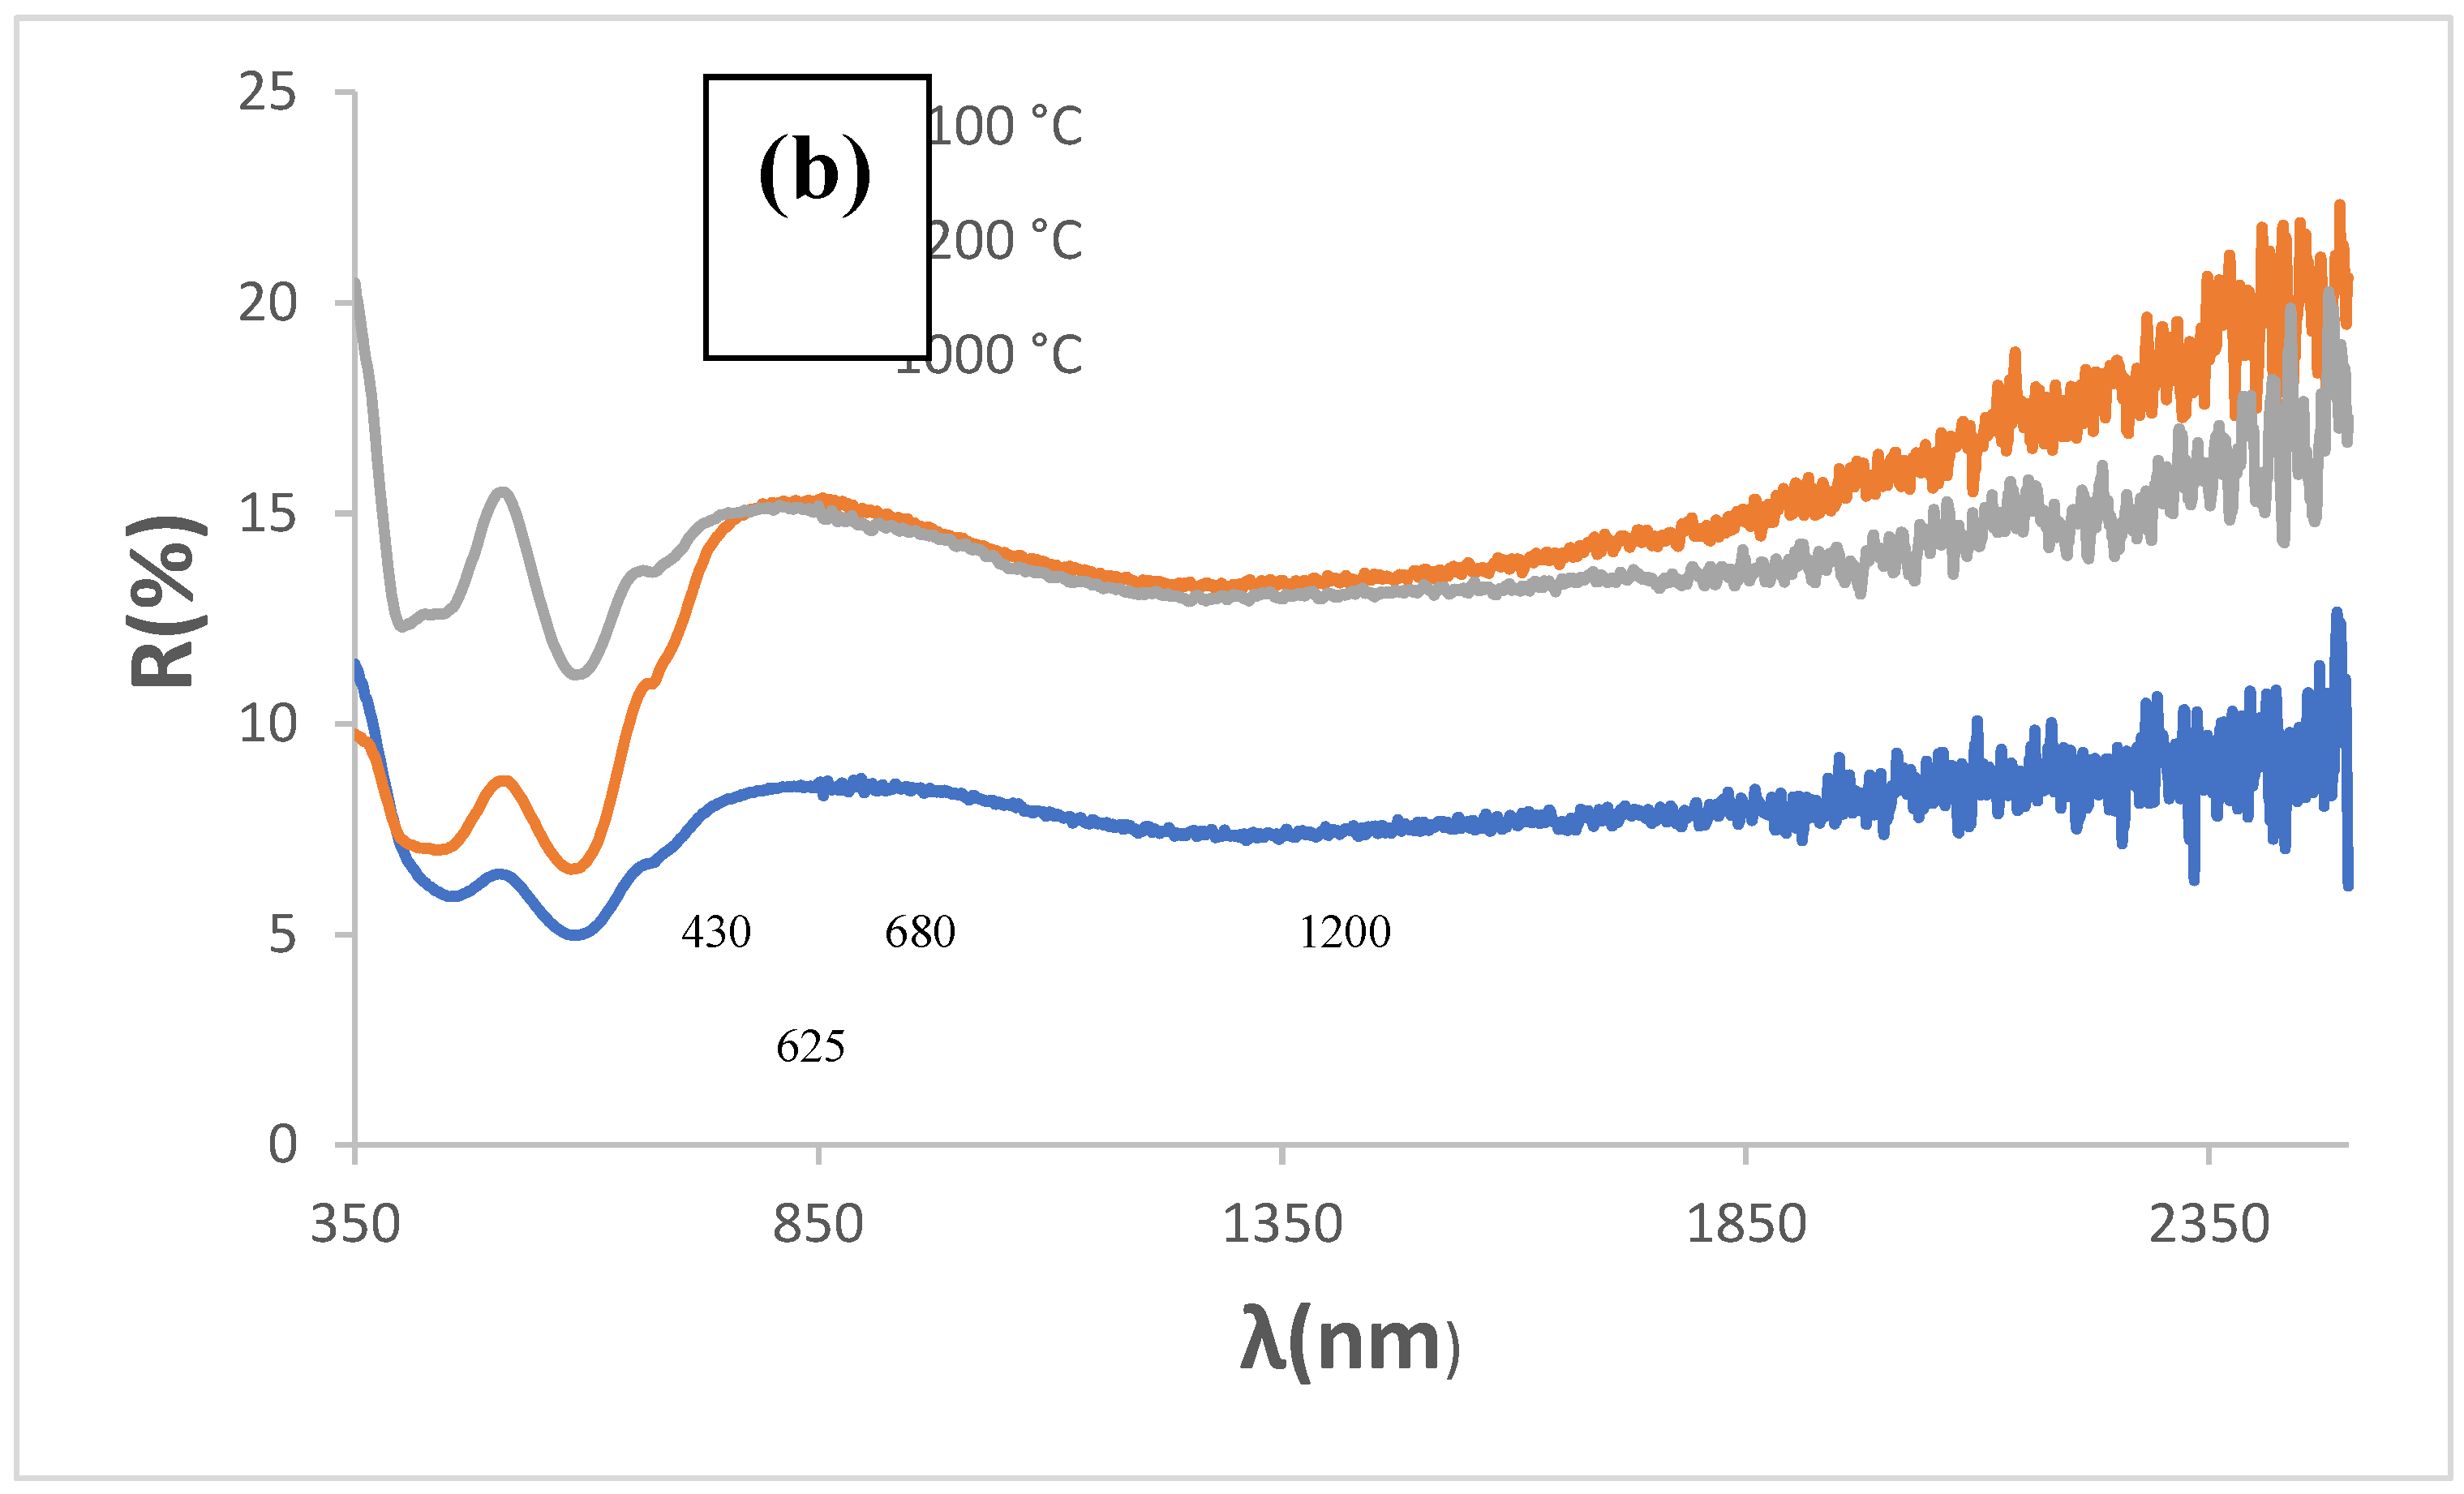
Figure 4.
Optical images of CuCrO2 samples indicating the estimated particle size at a magnification x500.
Figure 4.
Optical images of CuCrO2 samples indicating the estimated particle size at a magnification x500.
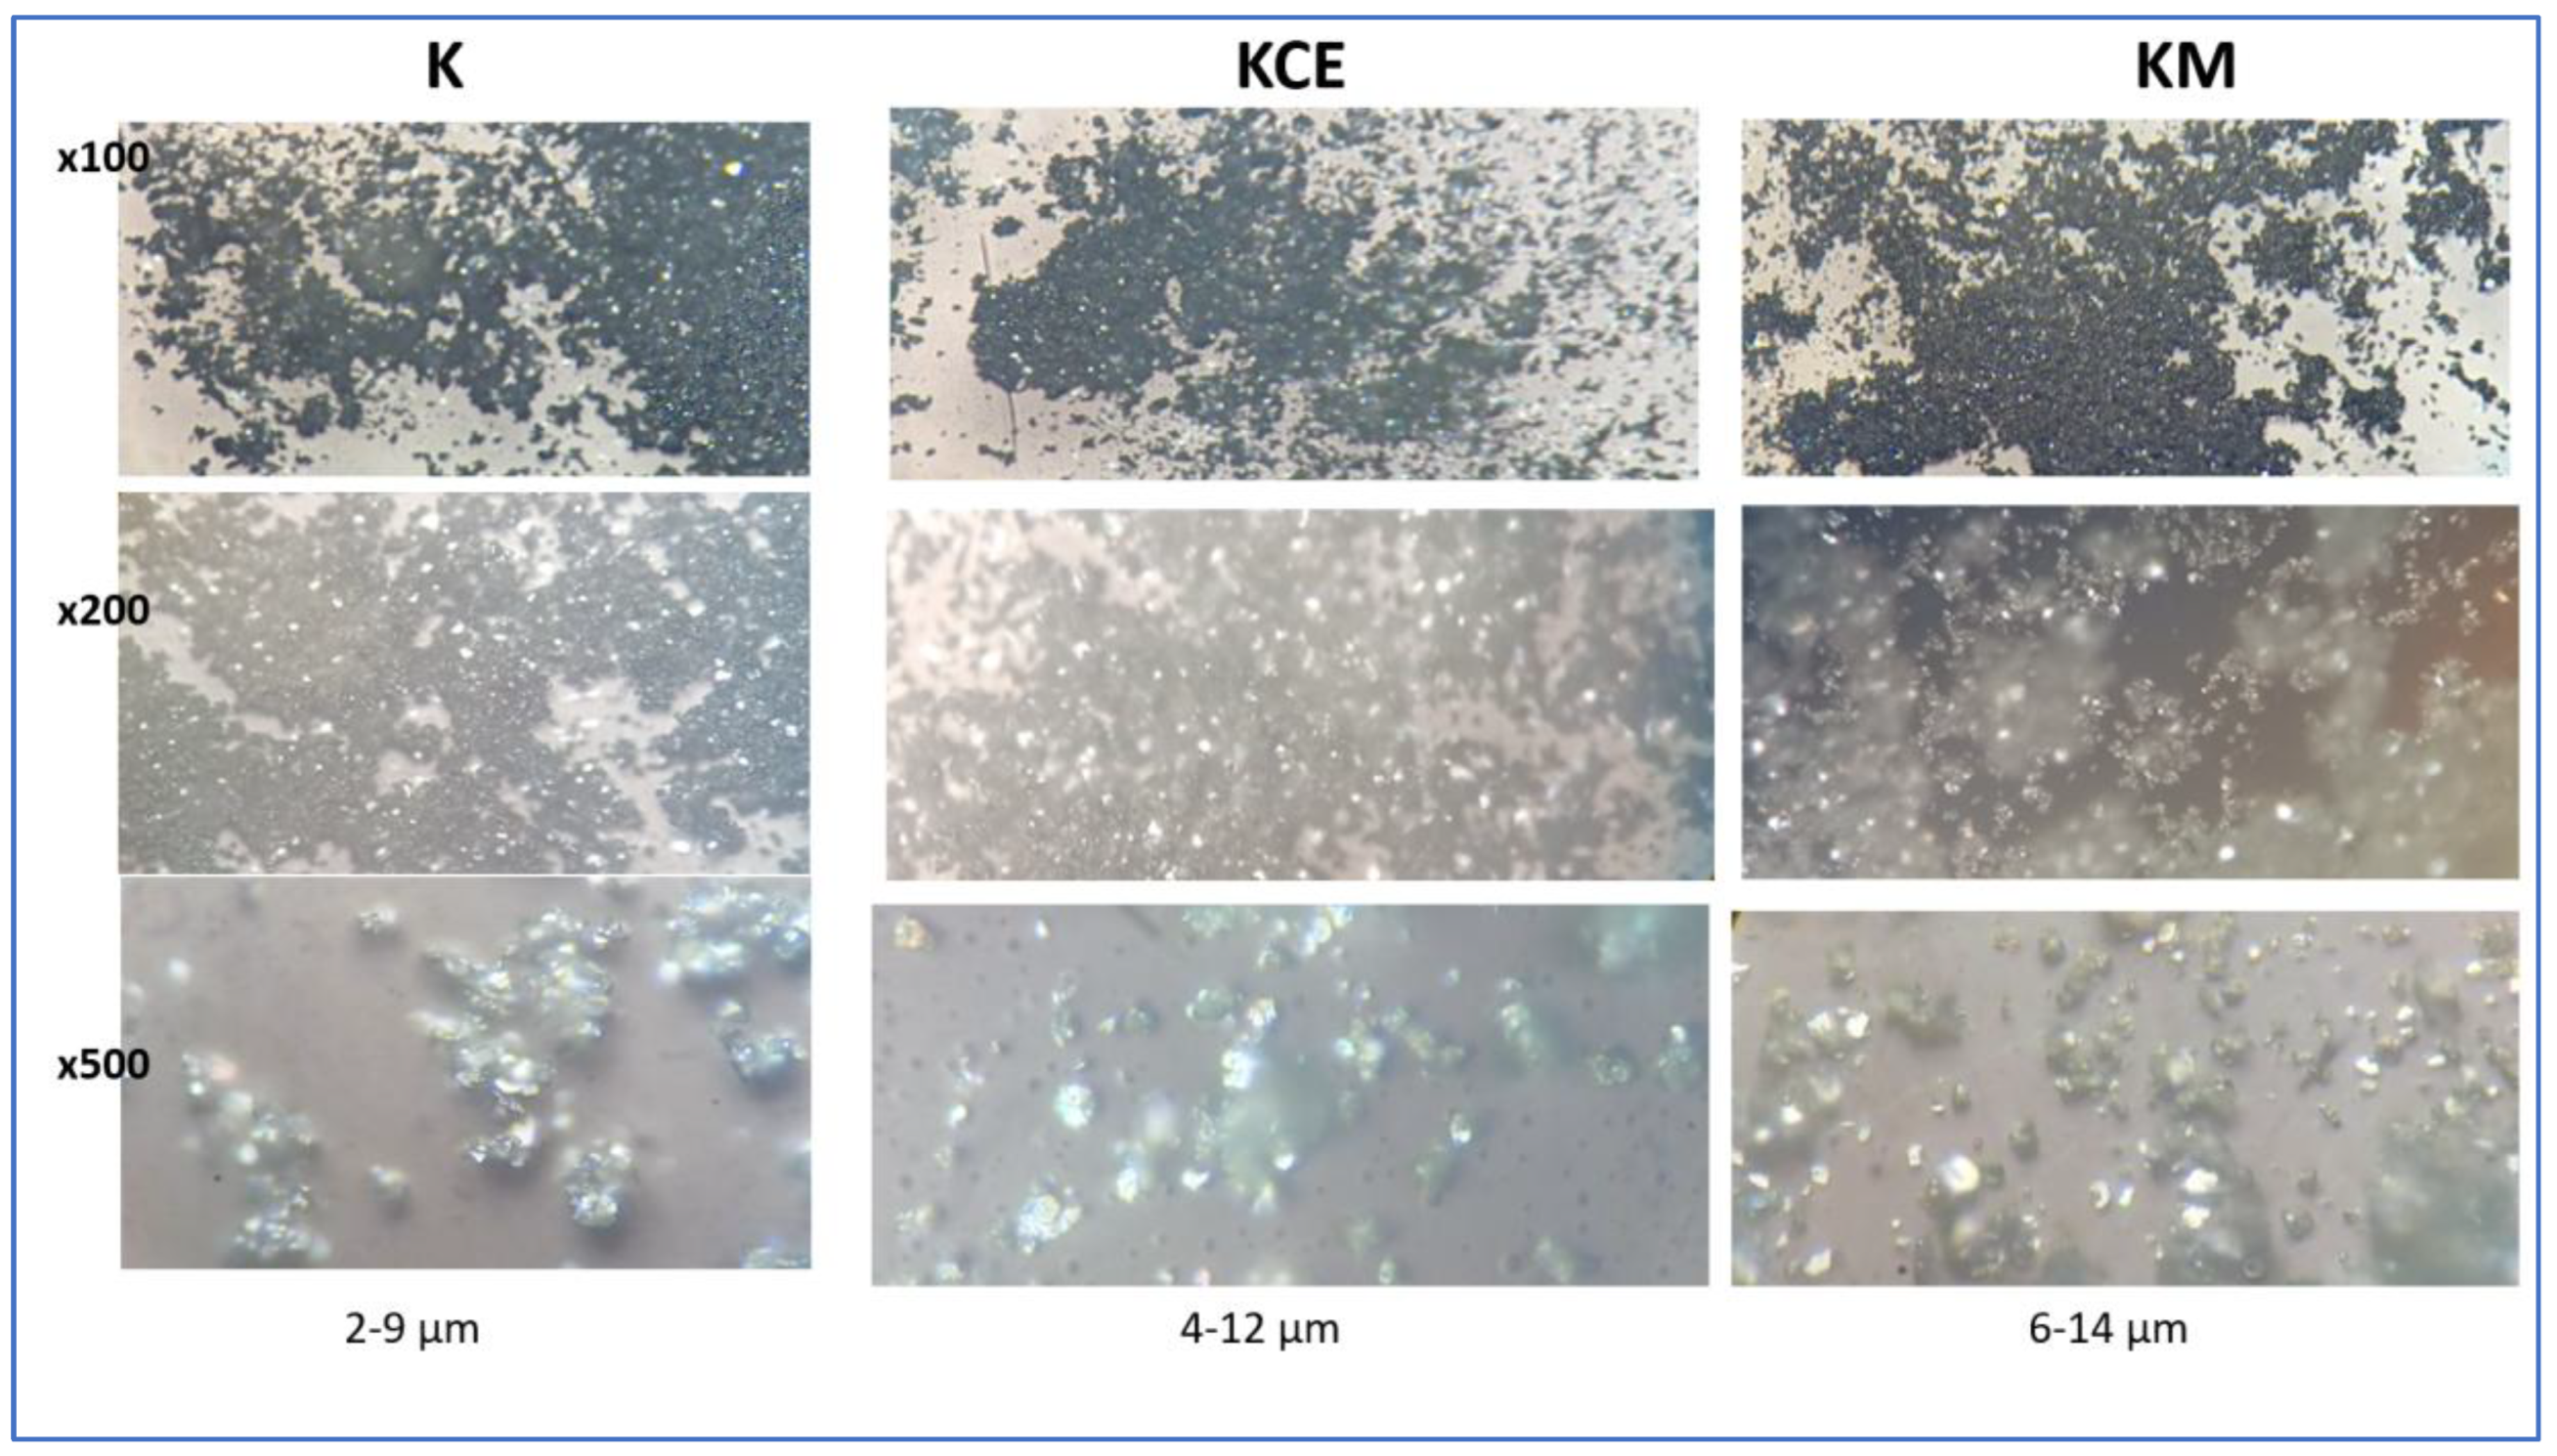
Figure 5.
SEM images of CuCrO2 fired by microwaves (K) and by electric kiln 1000 ºC for 3 h (KCE).
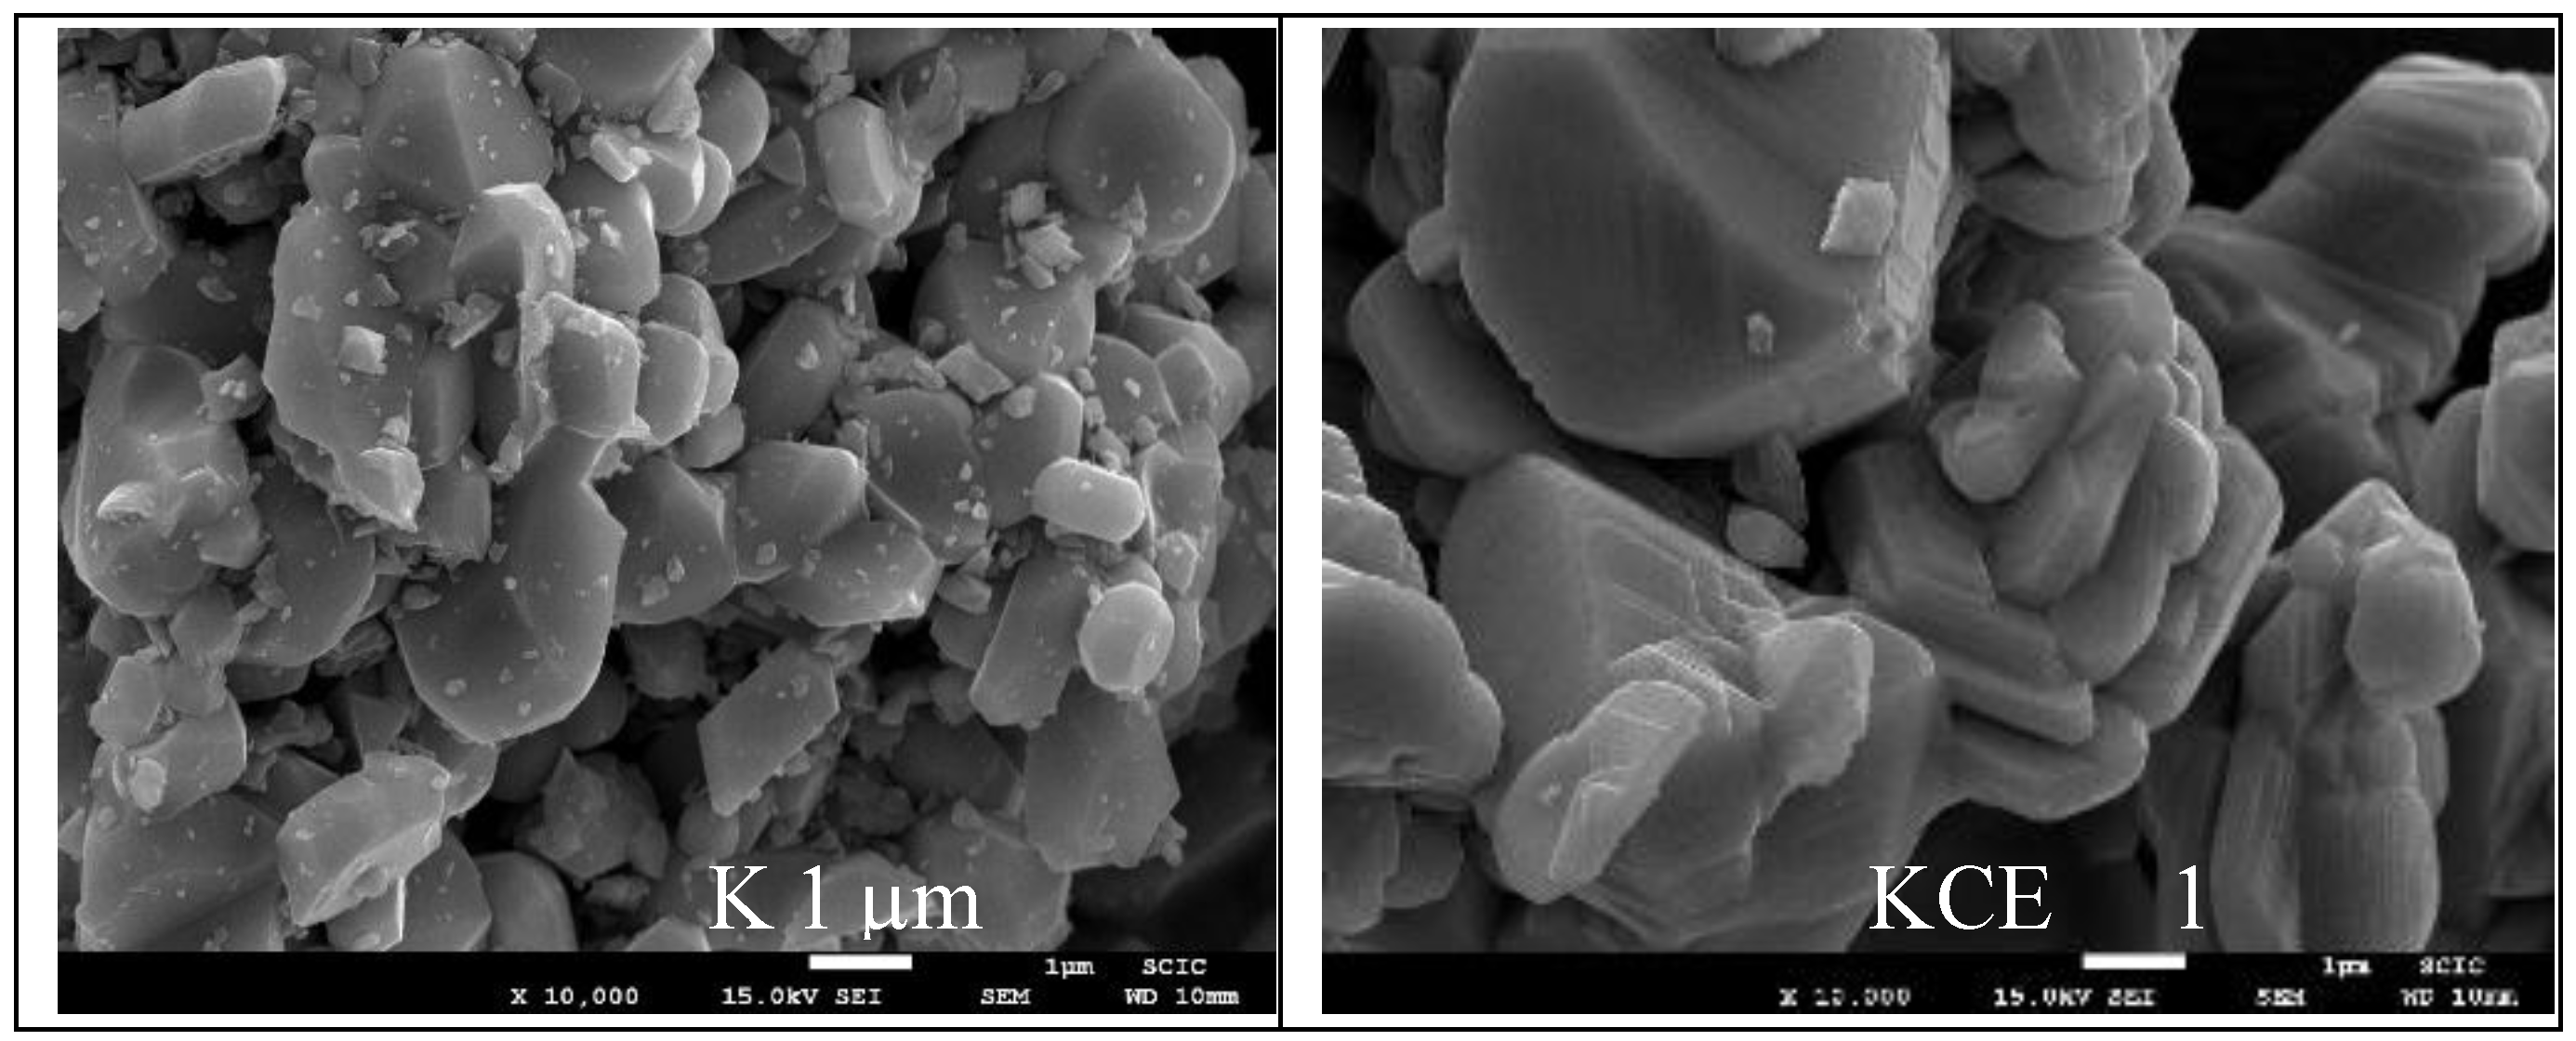
Figure 6.
Glazed samples.
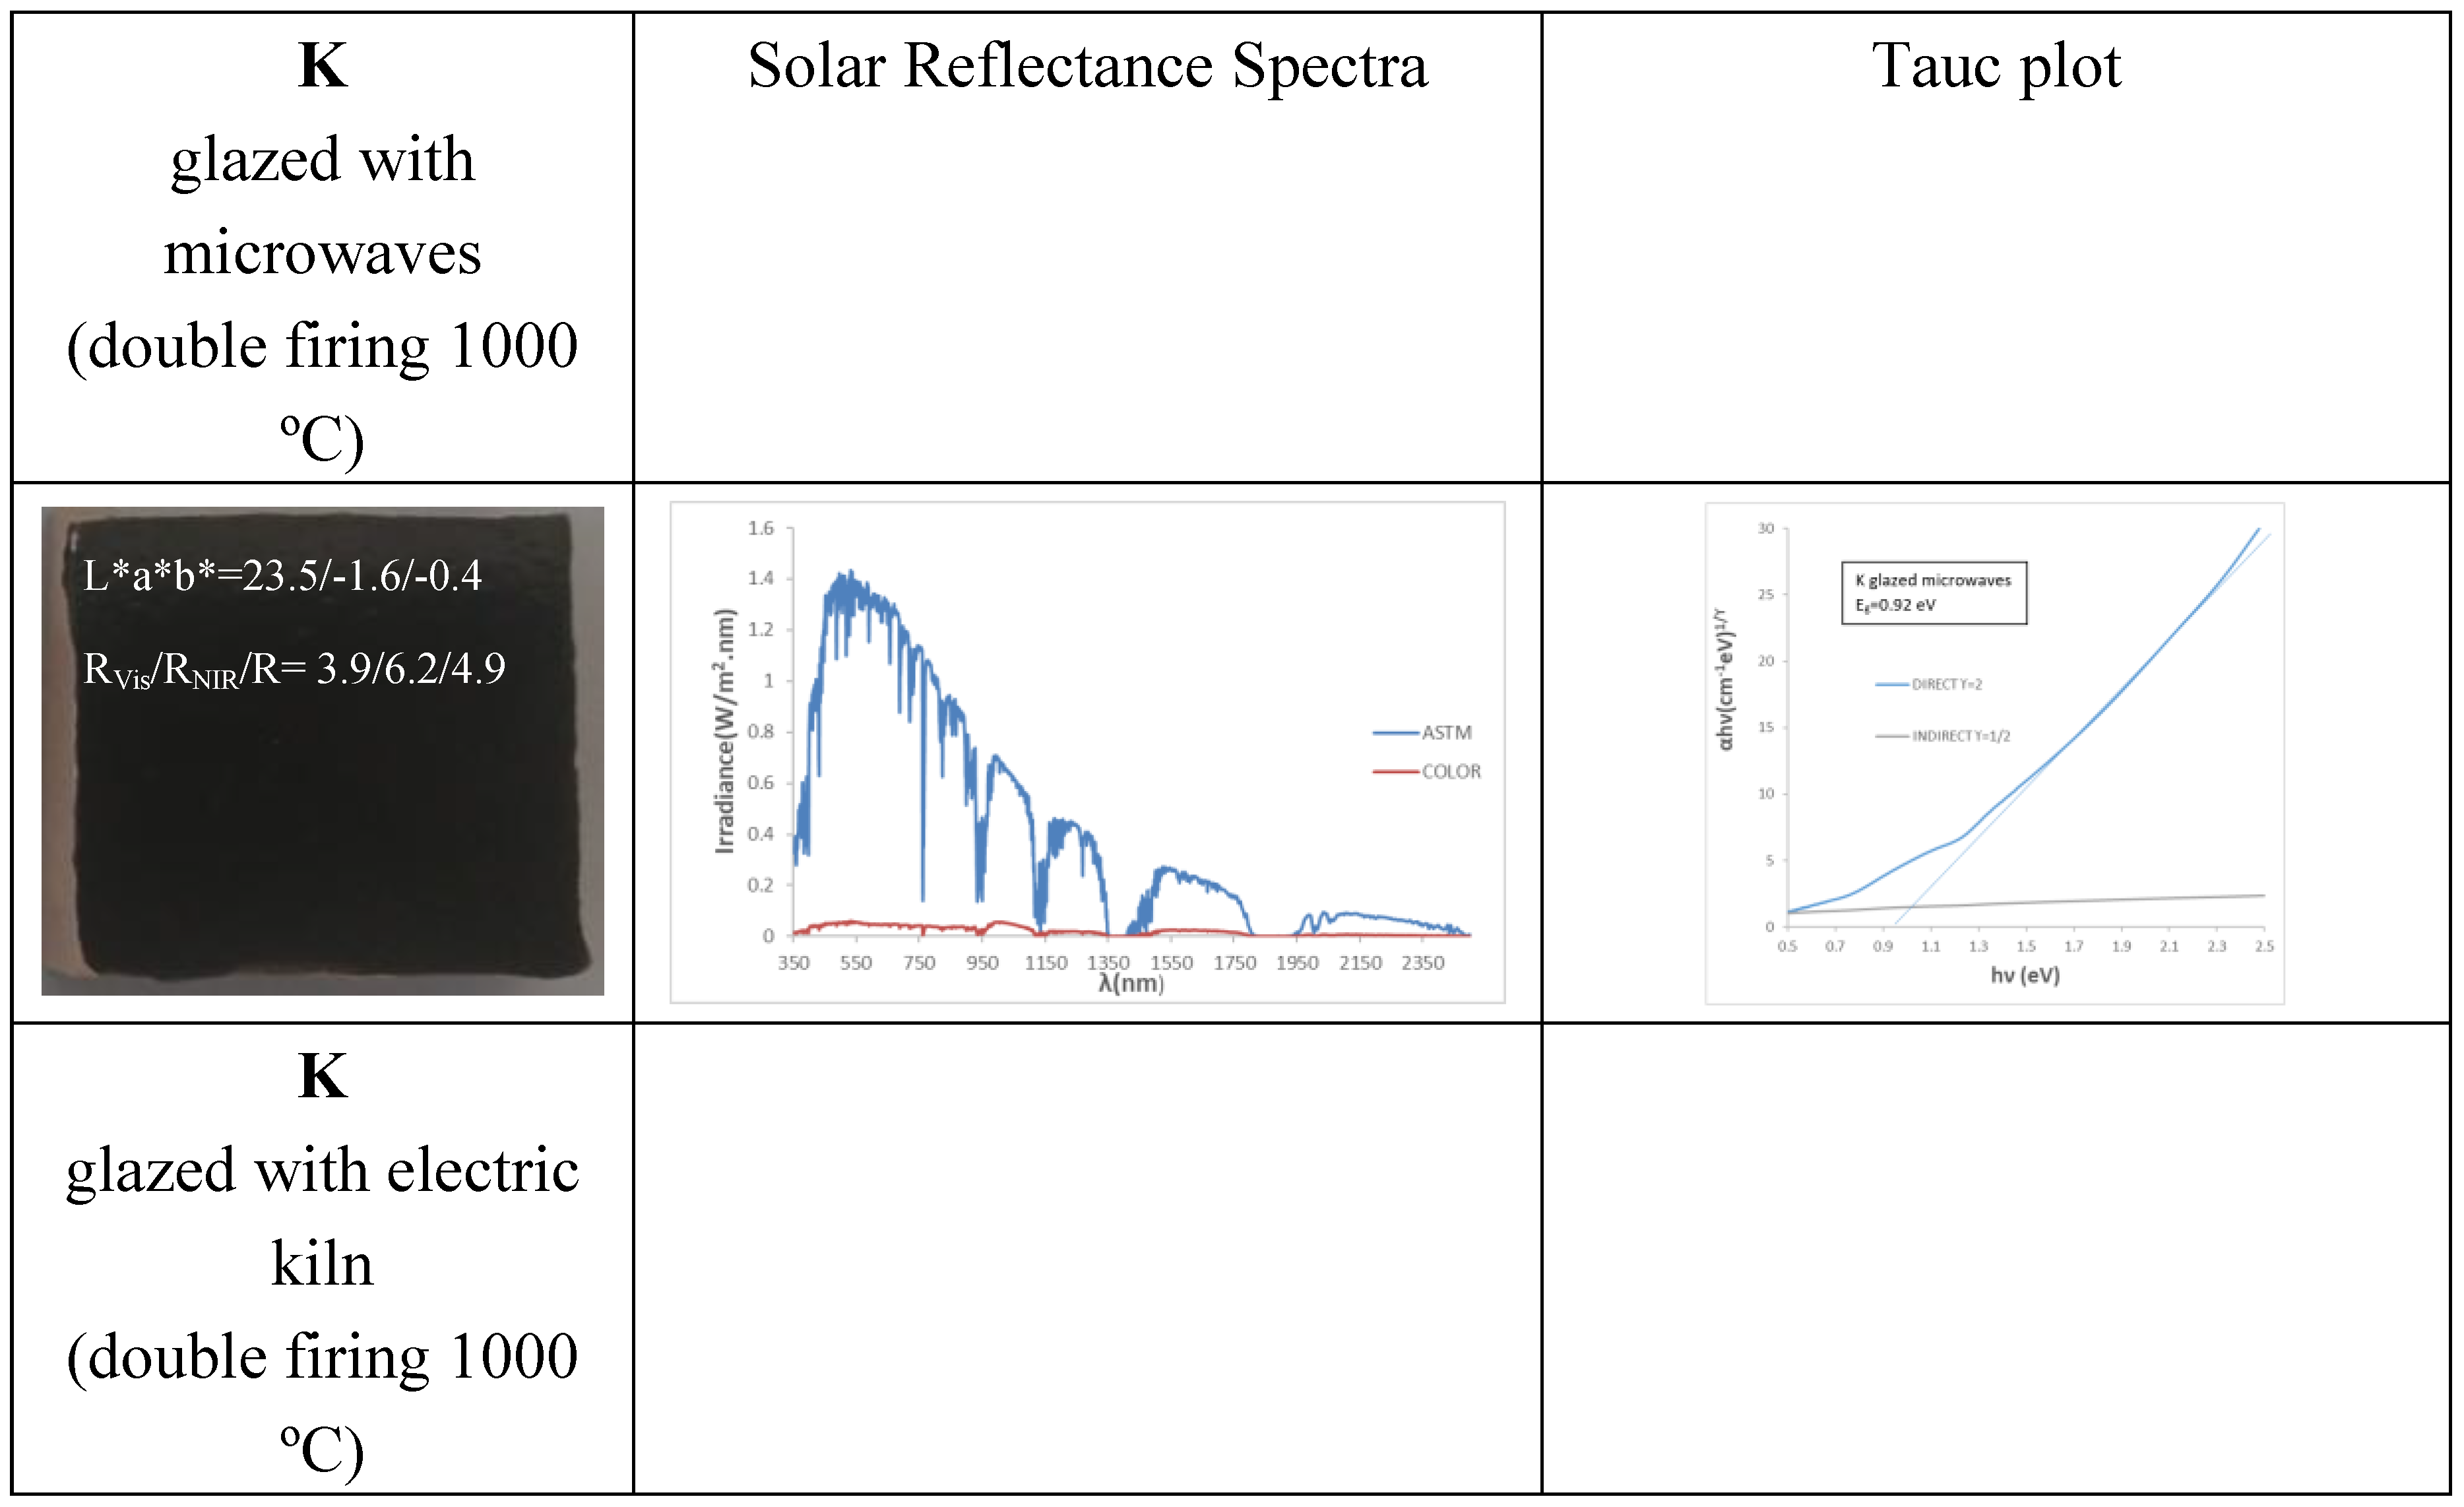
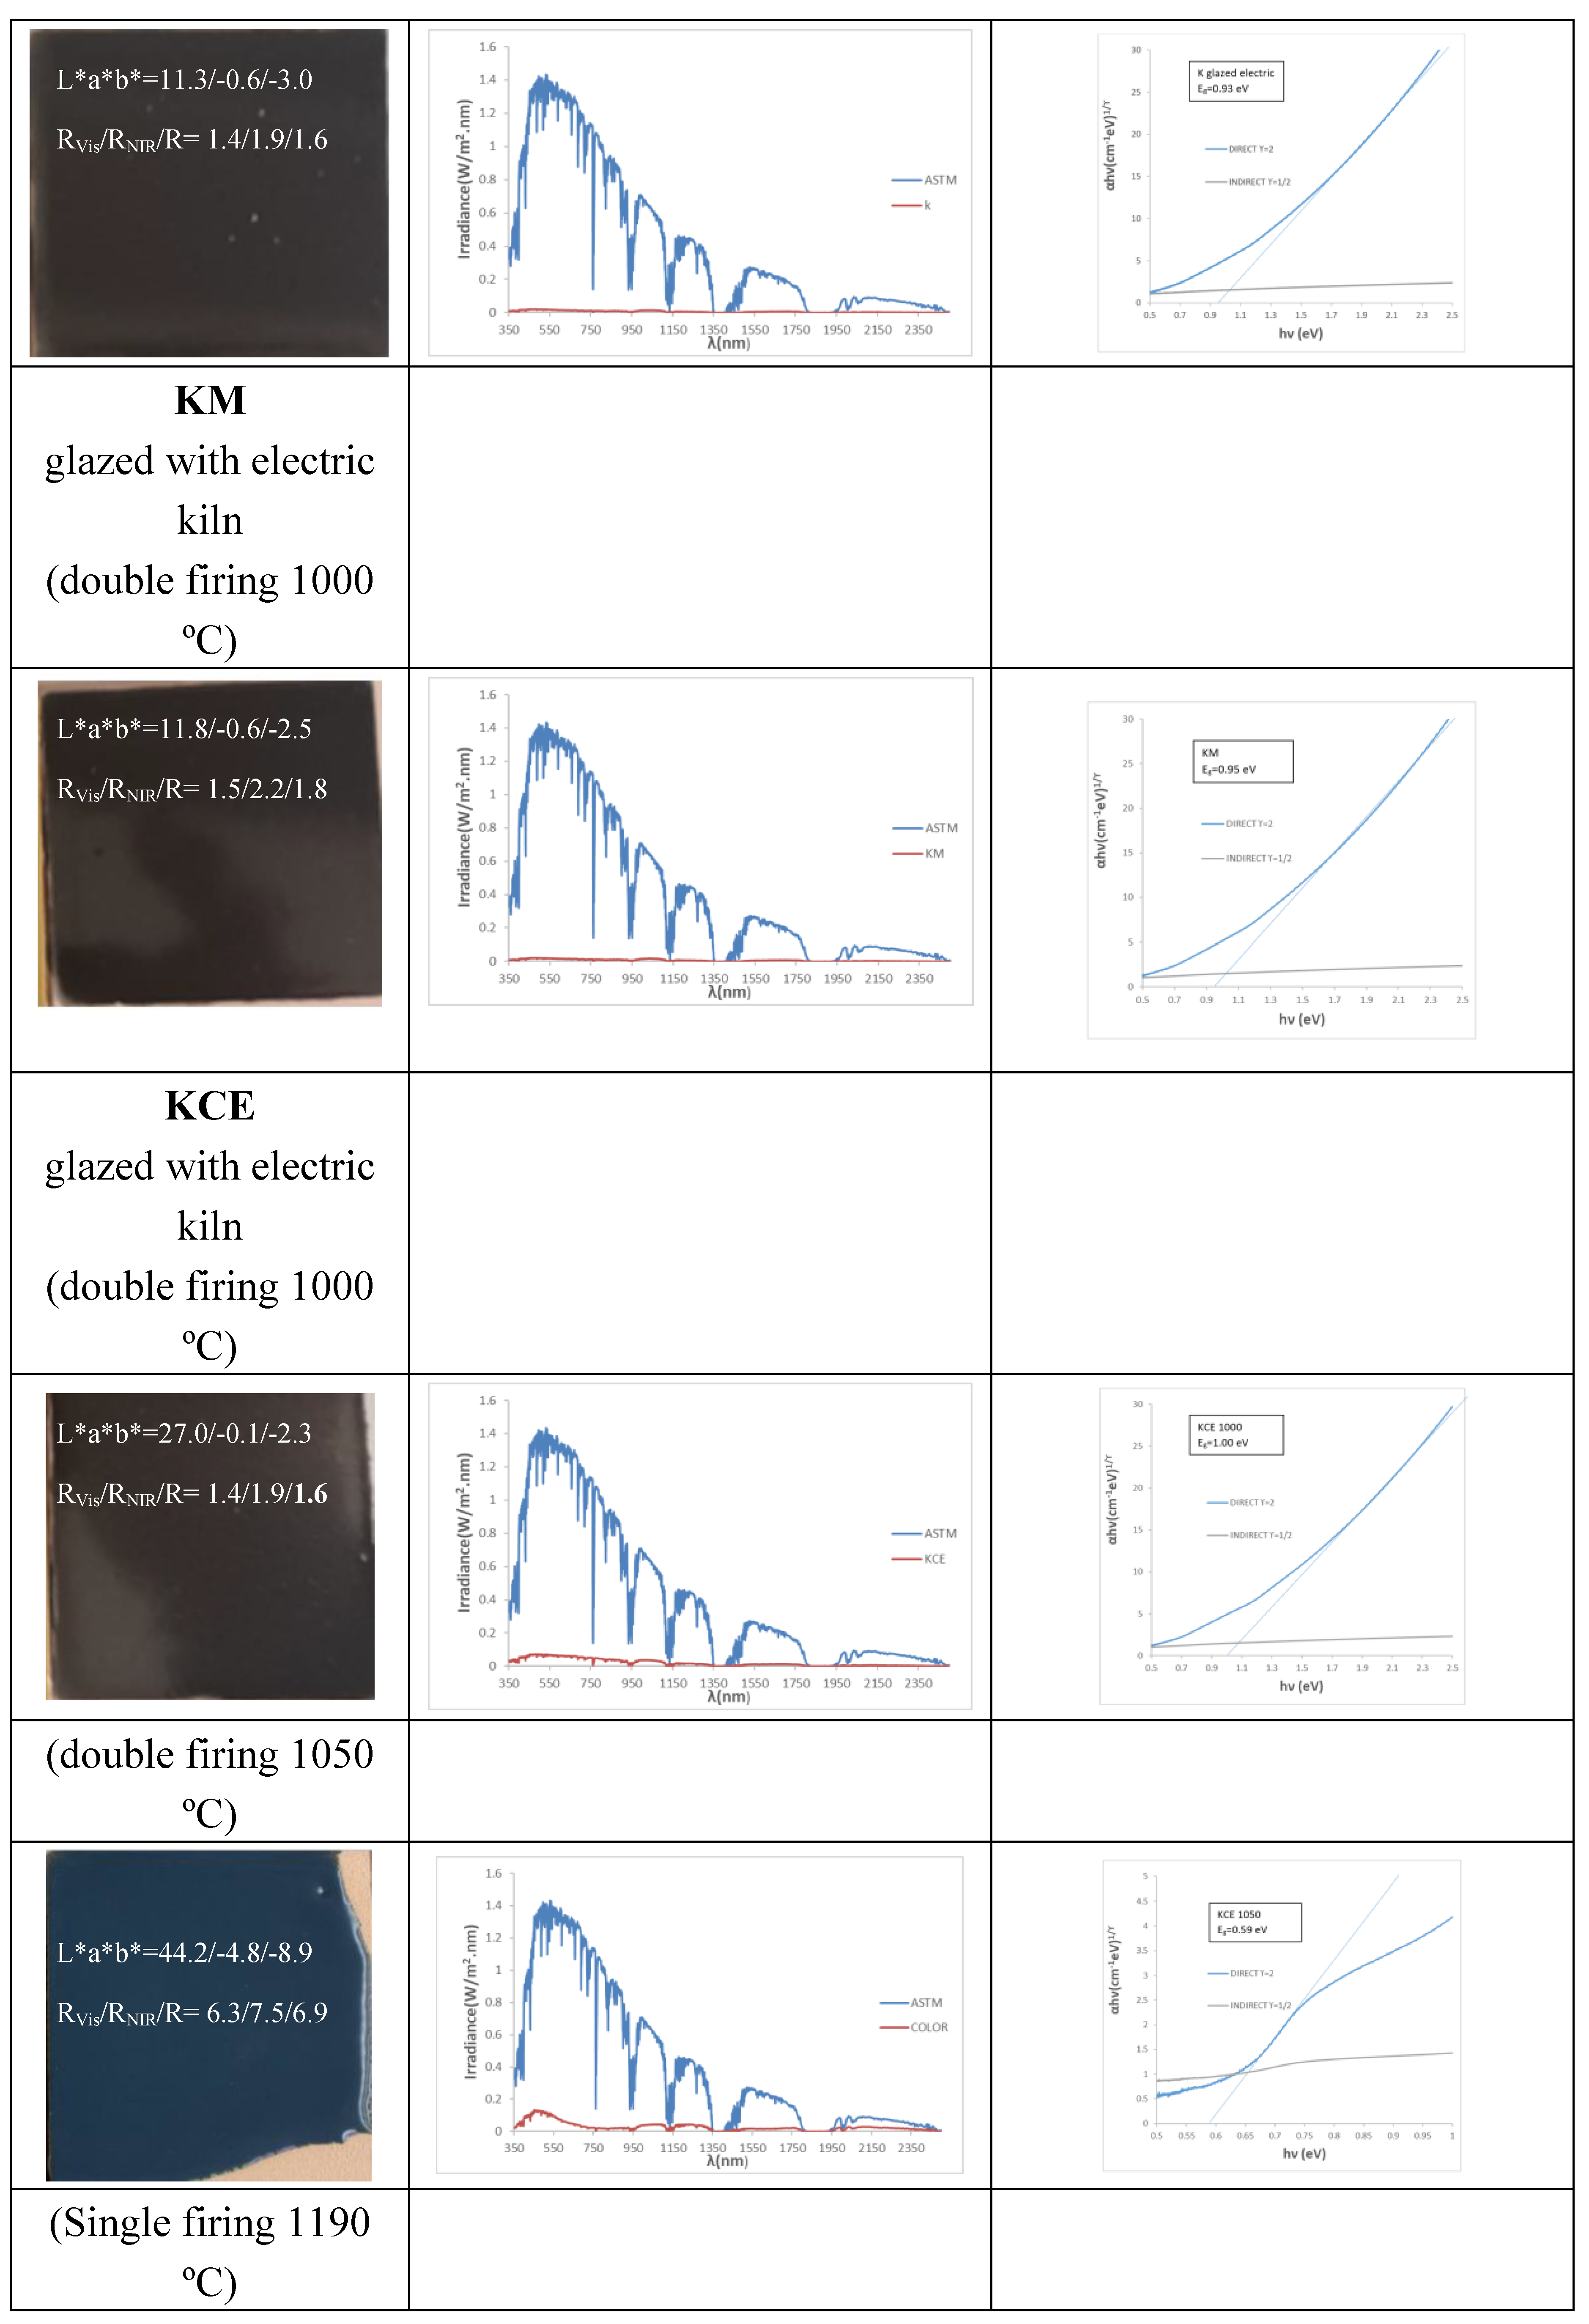

Figure 7.
UV-Vis-NIR diffuse reflectance spectra of glazed samples in double firing frit 1000 °C.
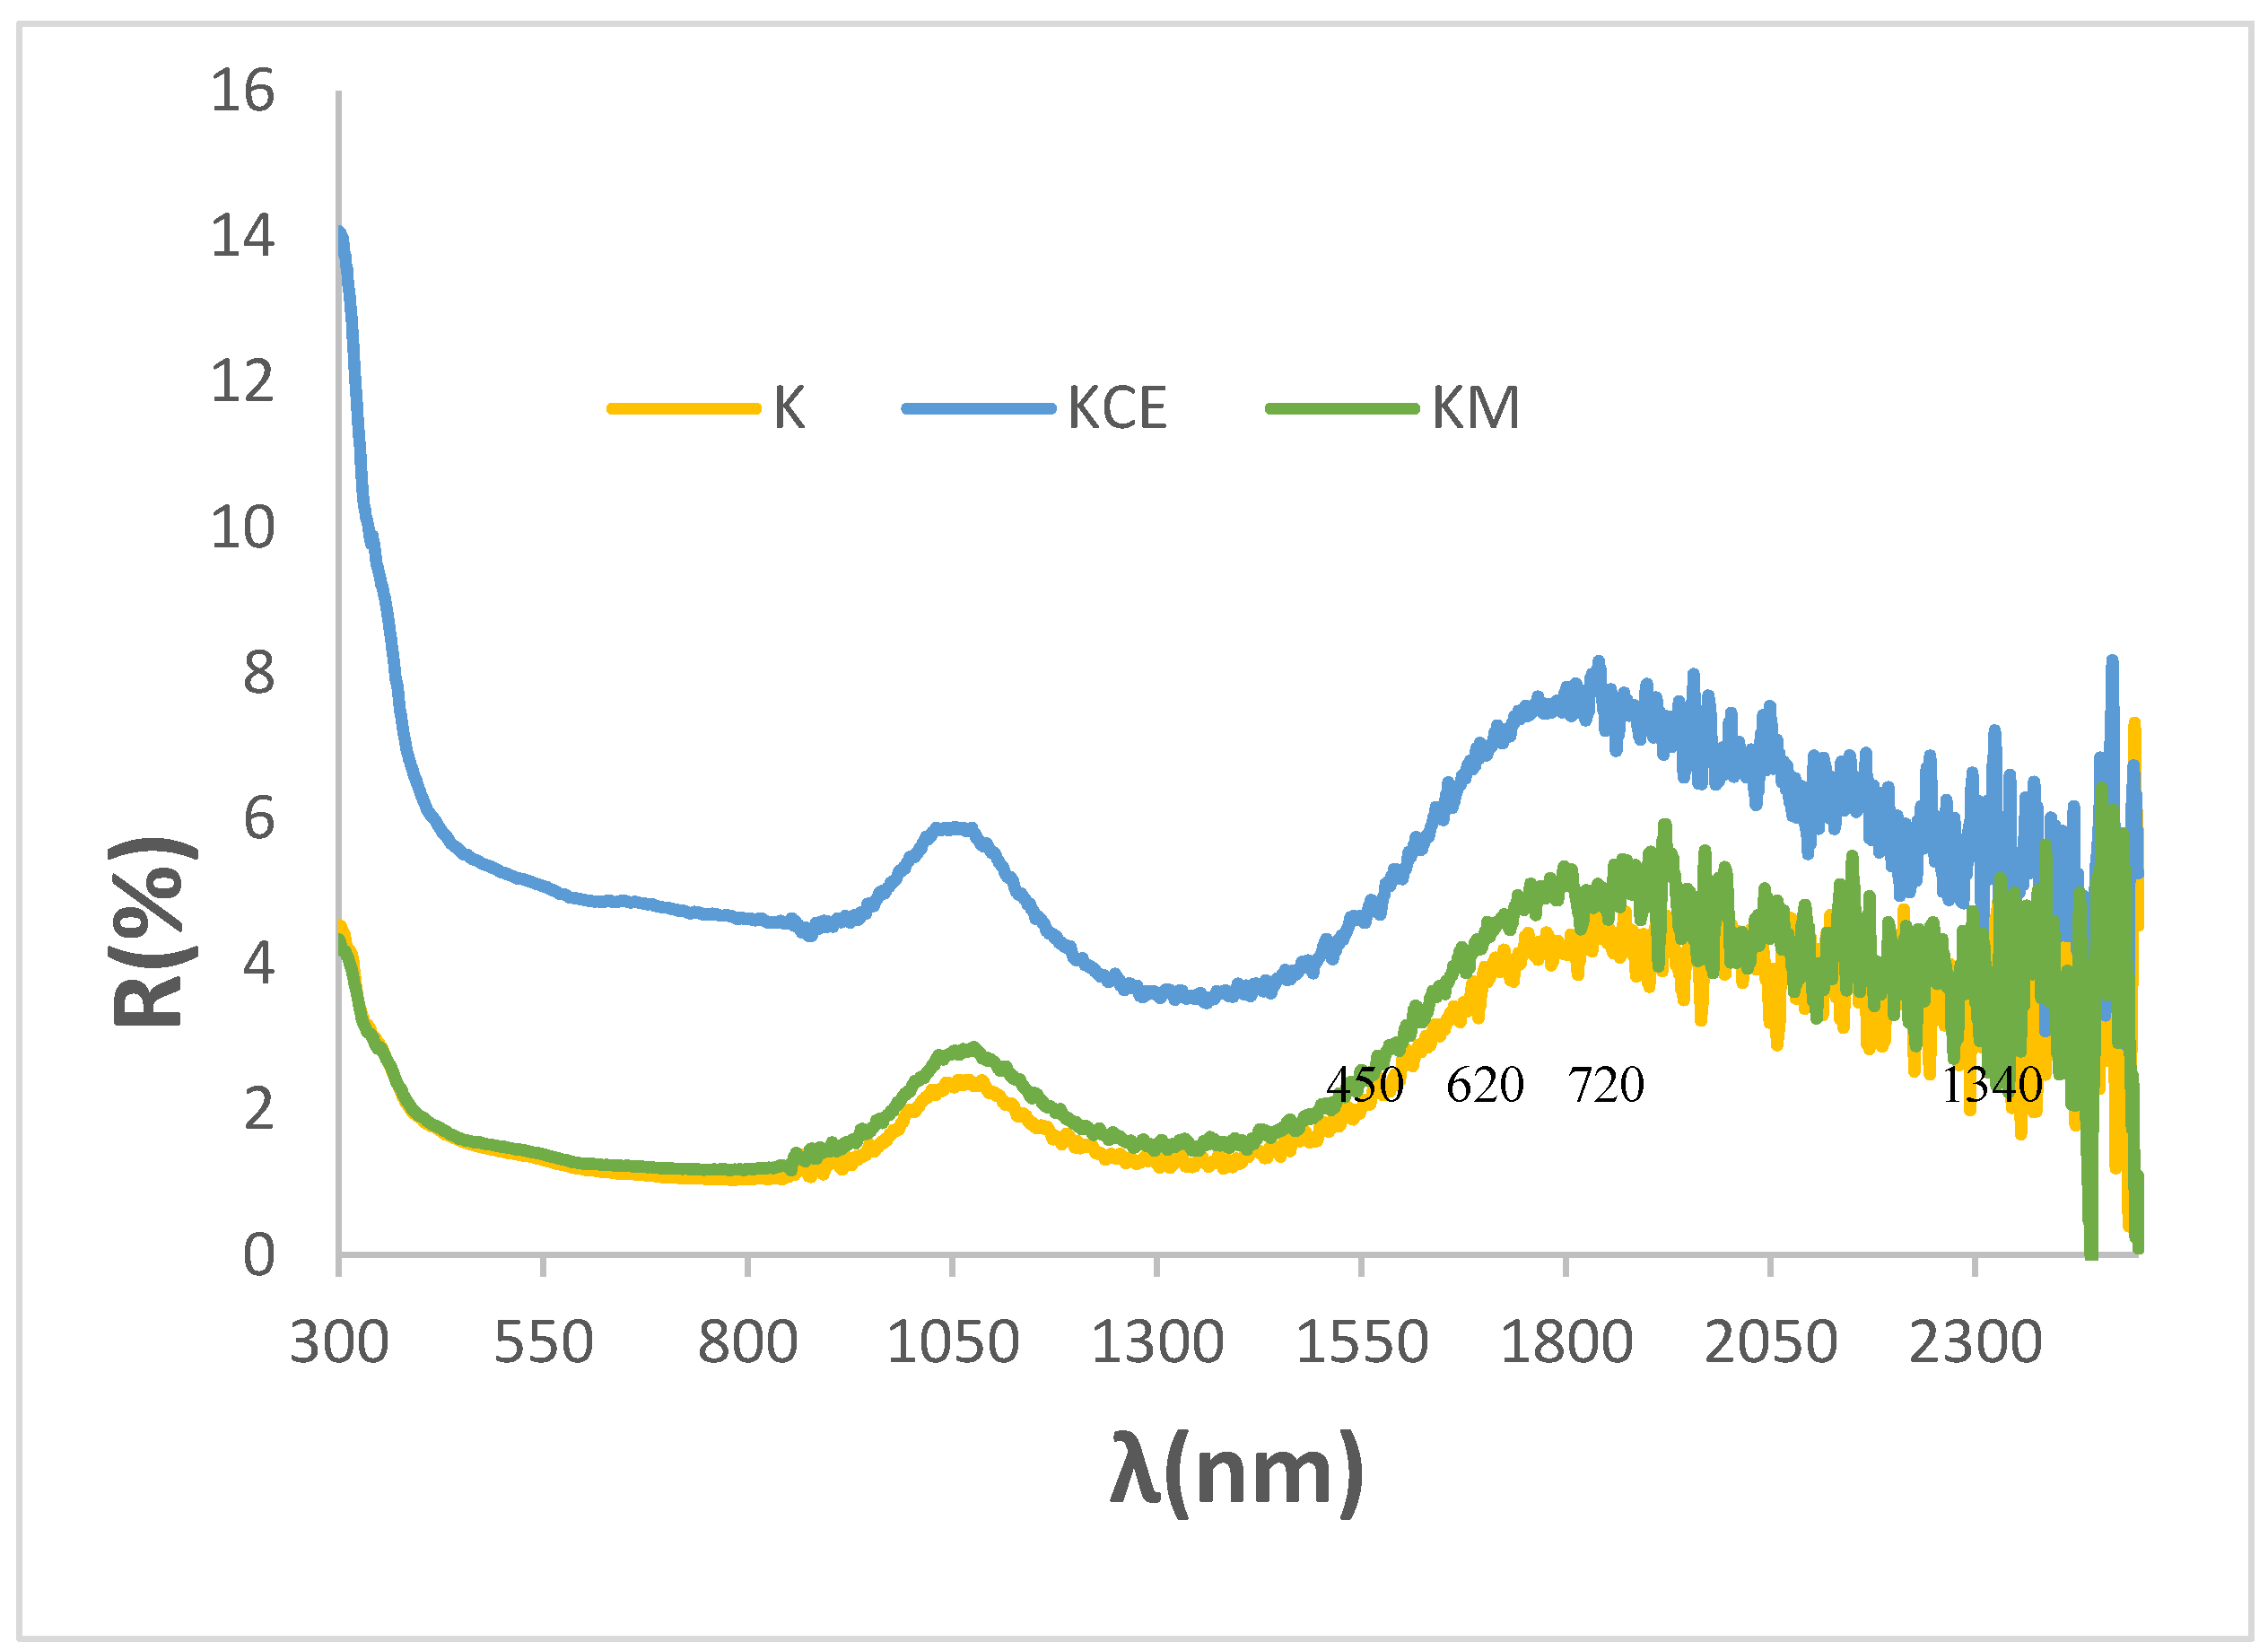
Figure 8.
UV-Vis-NIR diffuse reflectance spectra of KC powder fired at 1100 ºC and its glazed samples in 1000, 1050 and 1190 ºC frits.
Figure 8.
UV-Vis-NIR diffuse reflectance spectra of KC powder fired at 1100 ºC and its glazed samples in 1000, 1050 and 1190 ºC frits.
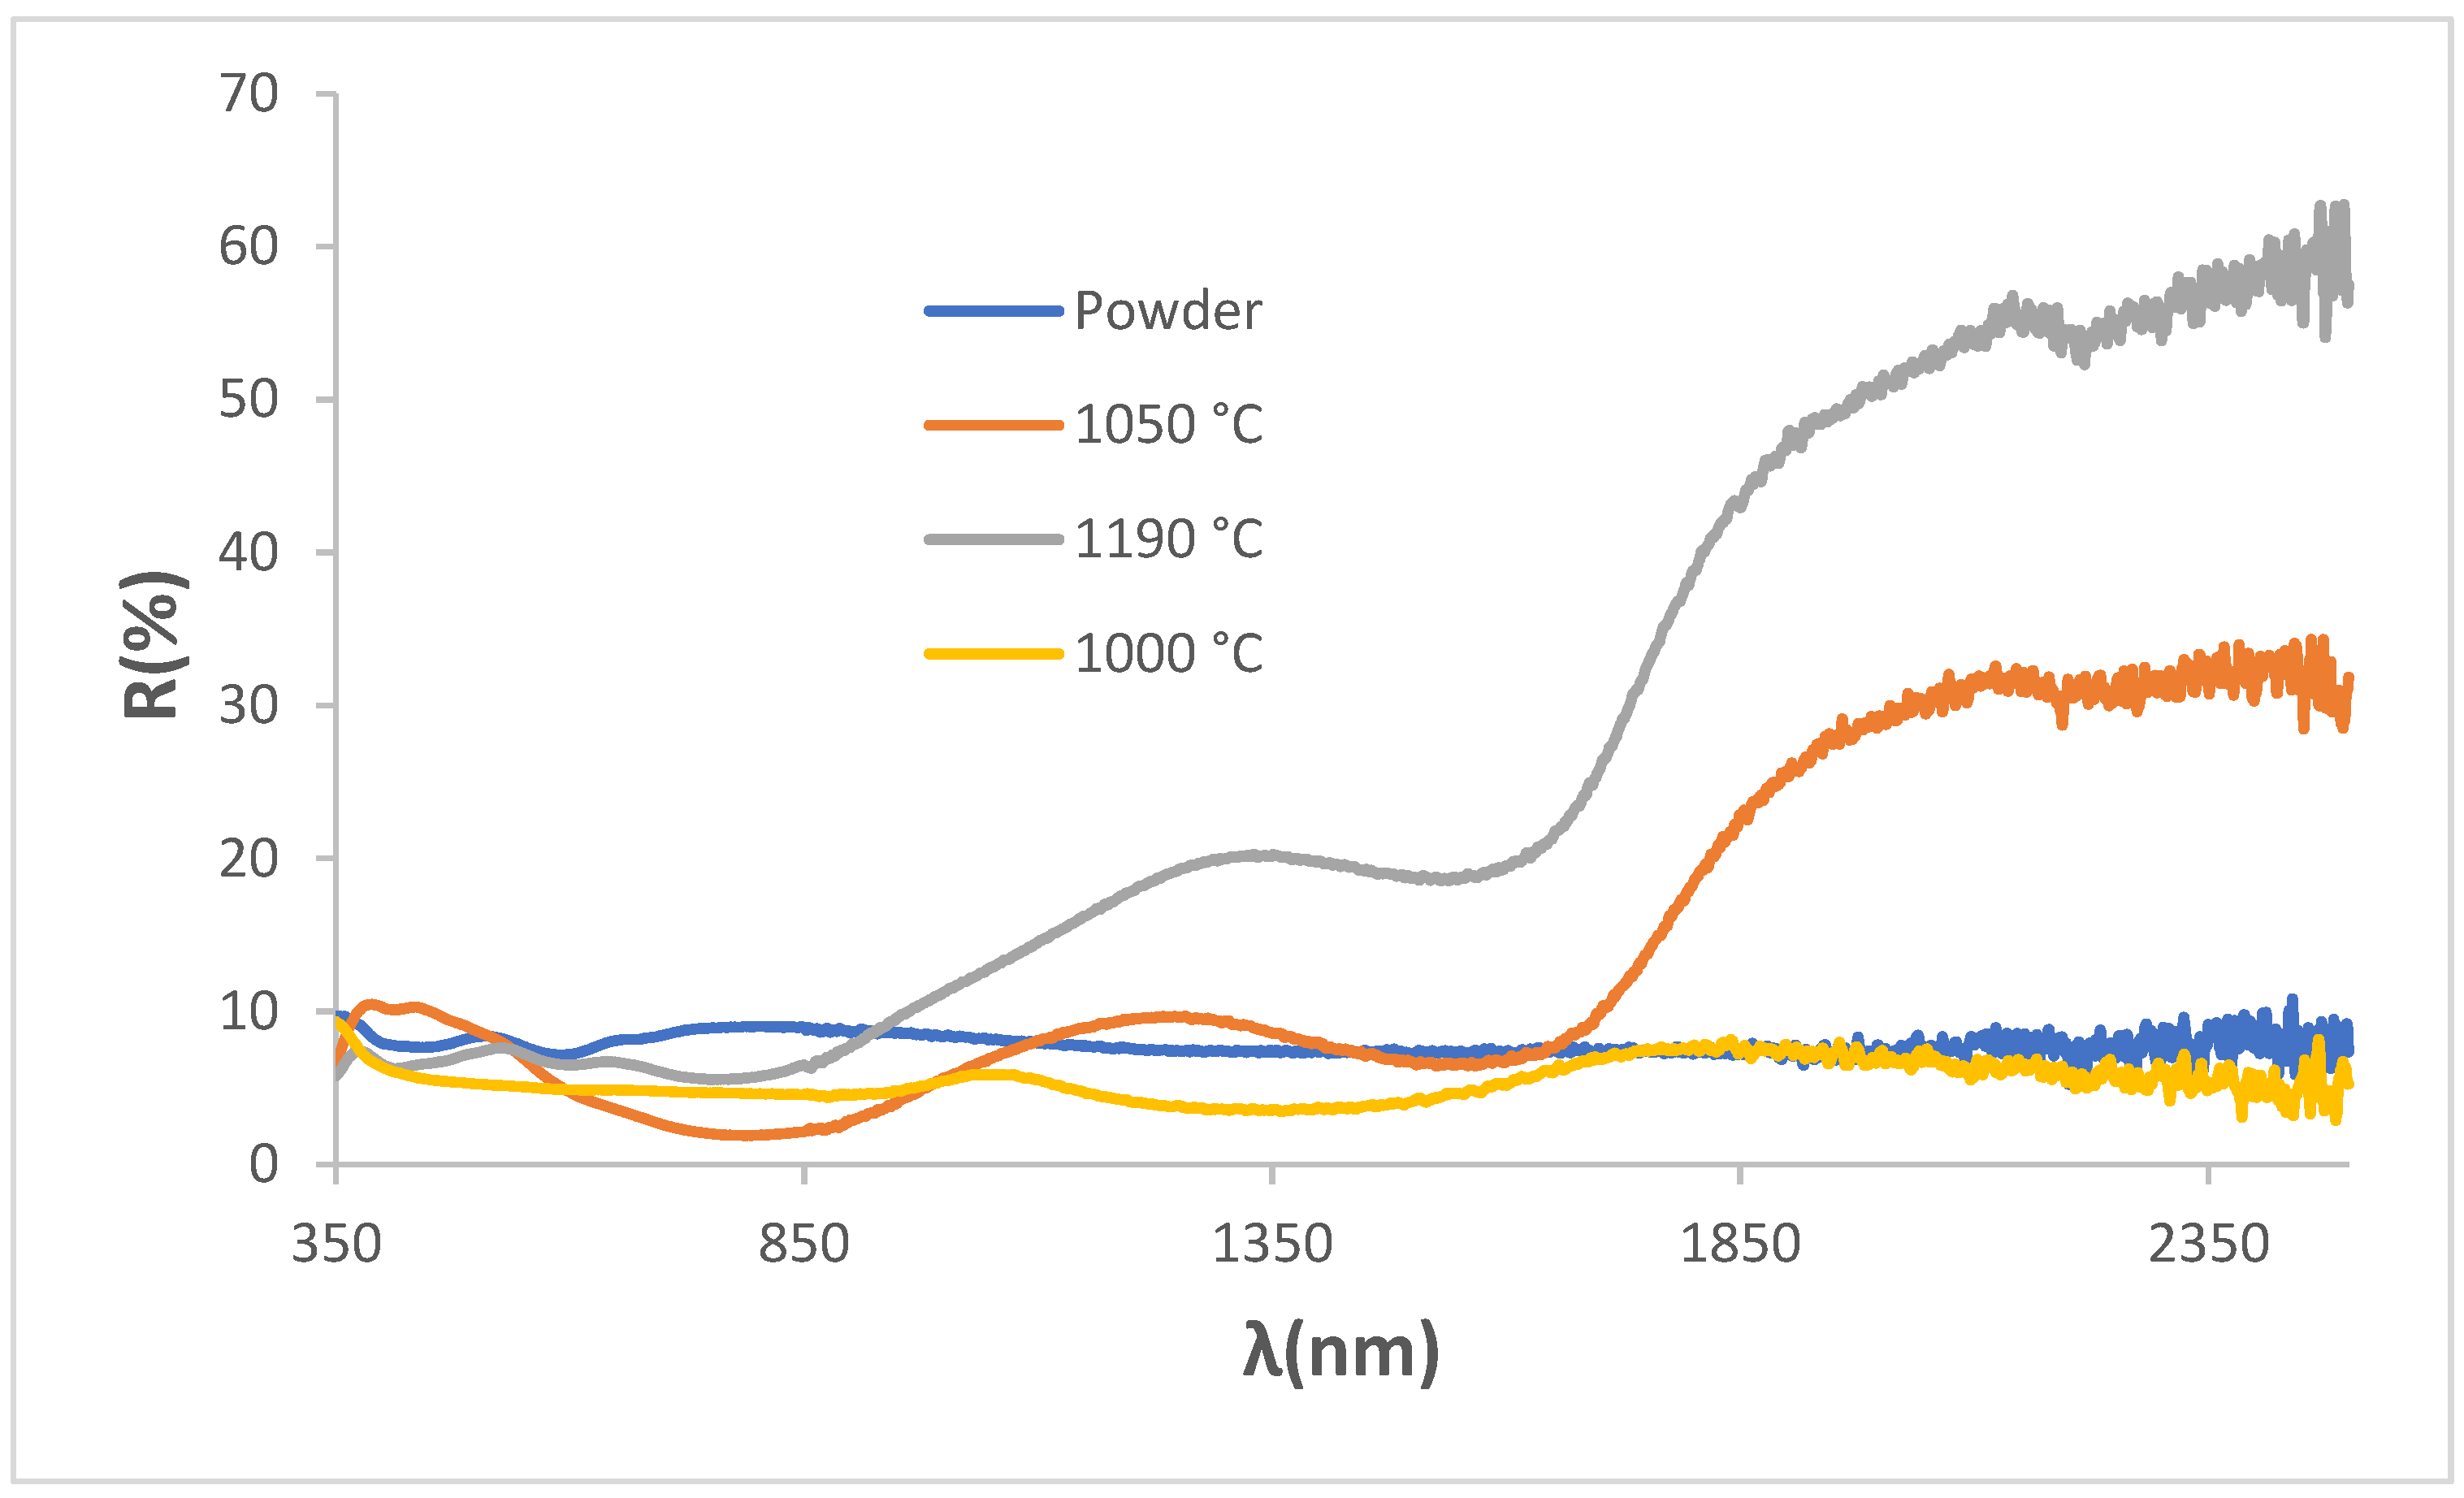
Figure 9.
Effect of composite of Quartz (Q) and Anatase (Anat) with CuCrO2 1100 °C/3h: (a) UV-Vis-NIR reflectance of quartz and anatase employed (supplied by QUIMIALMEL SL), (b) CIEL*a*b* and reflectance values of 5wt.% of mixture glazed in the double firing glaze at 1050 °C compared with undoped pigment, (c) UV-Vis-NIR diffuse reflectance spectra of glazed samples.
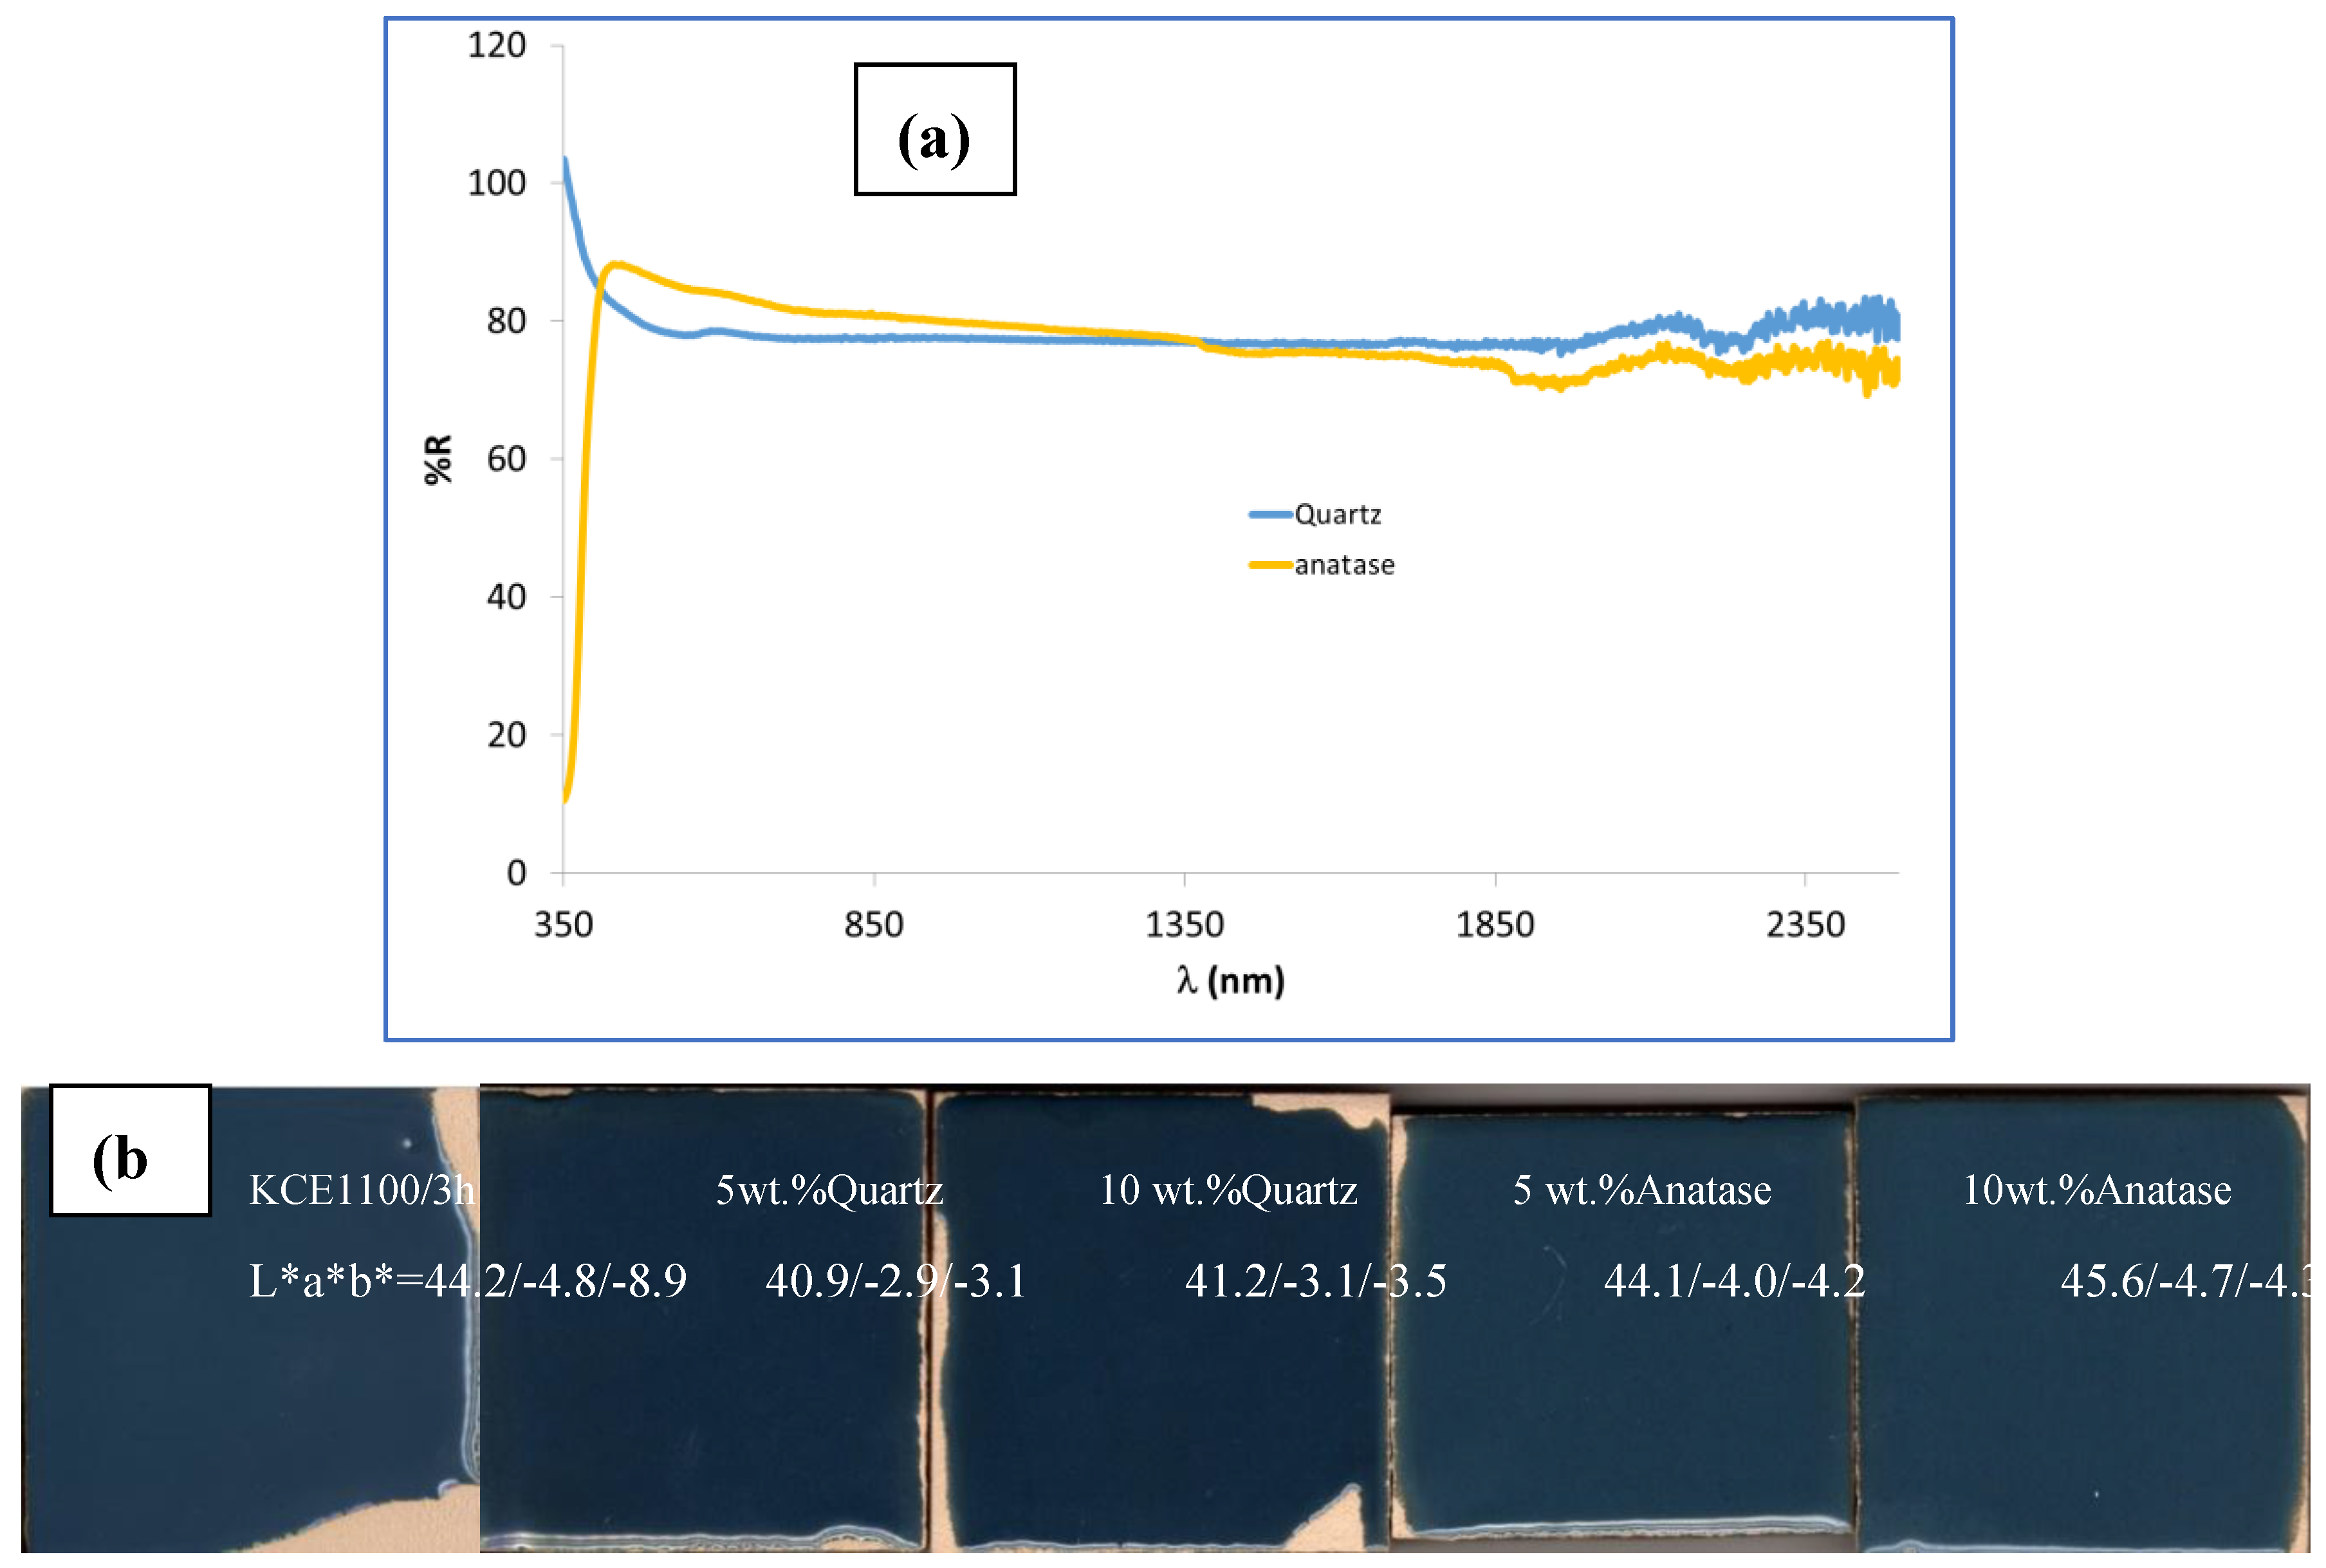
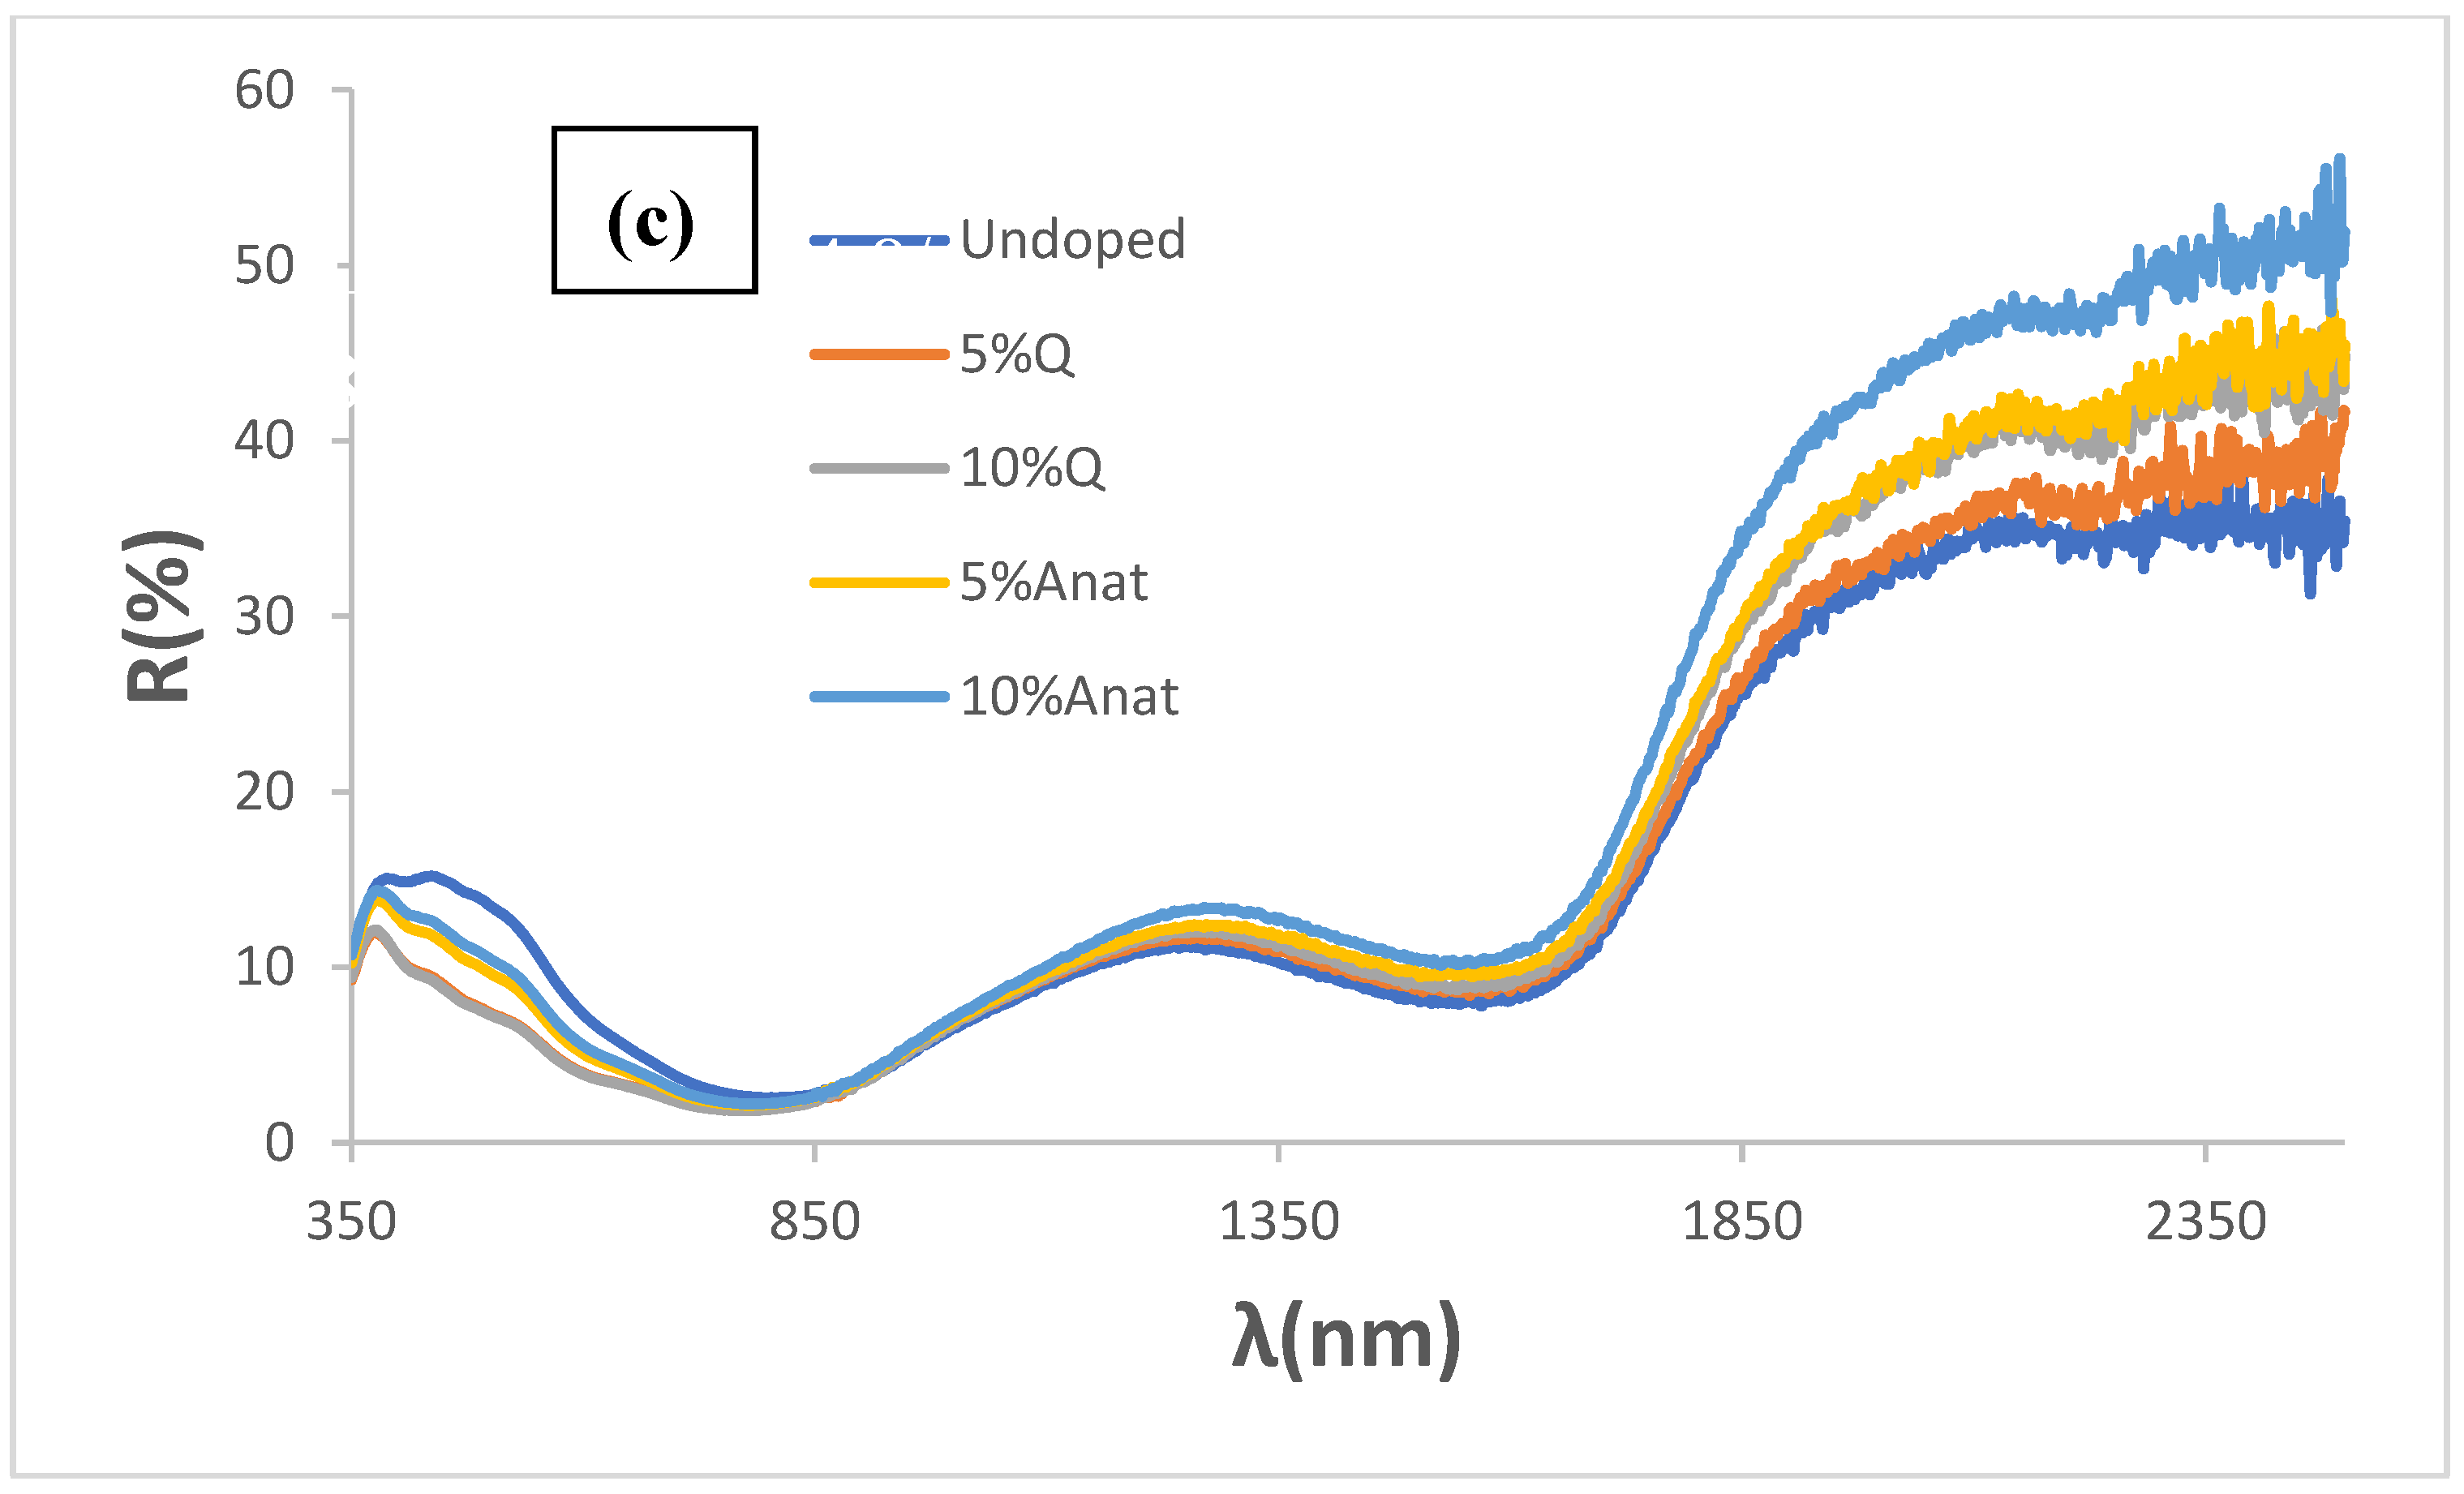
Figure 10.
Bandgap evaluation by Tauc’s method of composites with Quartz (Q) and Anatase (Anat) with CuCrO2 1100 °C for 3h.
Figure 10.
Bandgap evaluation by Tauc’s method of composites with Quartz (Q) and Anatase (Anat) with CuCrO2 1100 °C for 3h.
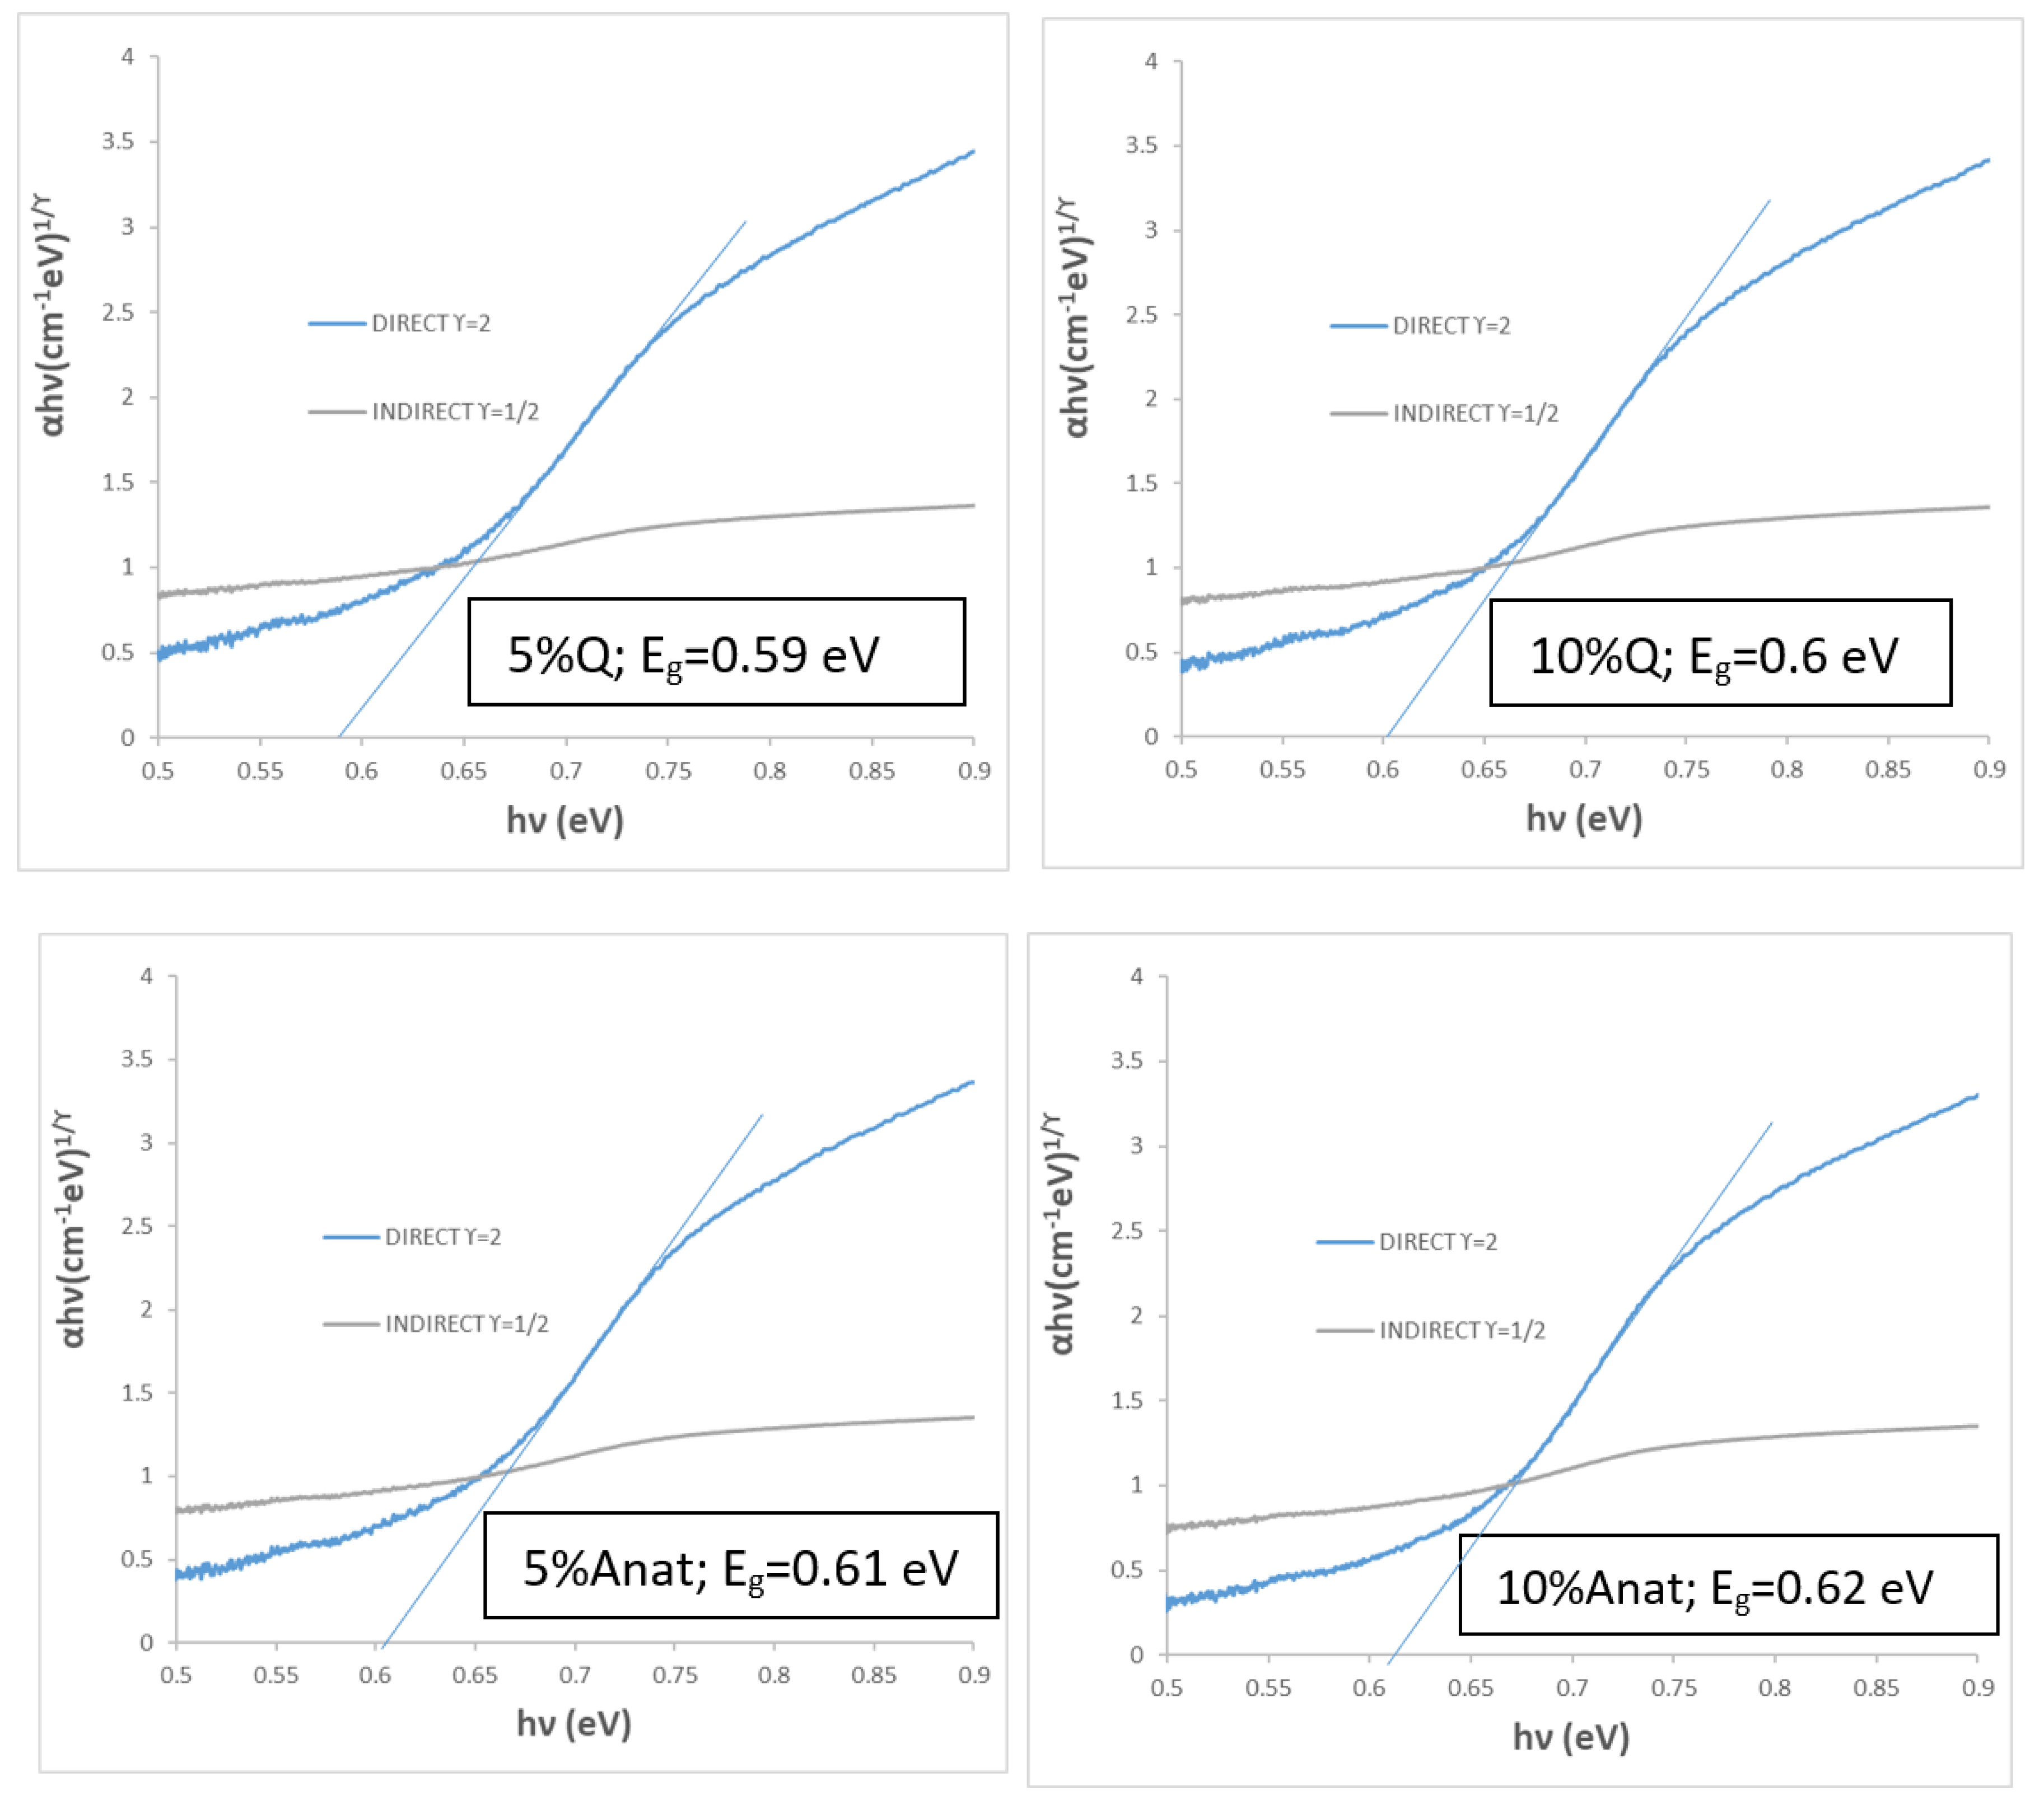
Figure 11.
Doping effect with lanthanides CuCr0,9Ln0.1O2, 1100 °C for 3h: (a) UV-Vis-NIR reflectance spectra of rare earth oxides used (supplied by ALDRICH SA), (b) image and CIEL*a*b* of CuCr0,9Ln0.1O2 fired powders, (c) UV-Vis-NIR reflectance spectra of CuCr0,9Ln0.1O2 fired powders, (d) XRD diffractograms of doped samples compared with the undoped sample (B) and of CuCr0,9Ln0.1O2 fired powders, € CIEL*a*b* and reflectance values of 5wt.% glazed samples in the double firing glaze at 1050 °C, (f) UV-Vis-NIR diffuse reflectance spectra of glazed samples.
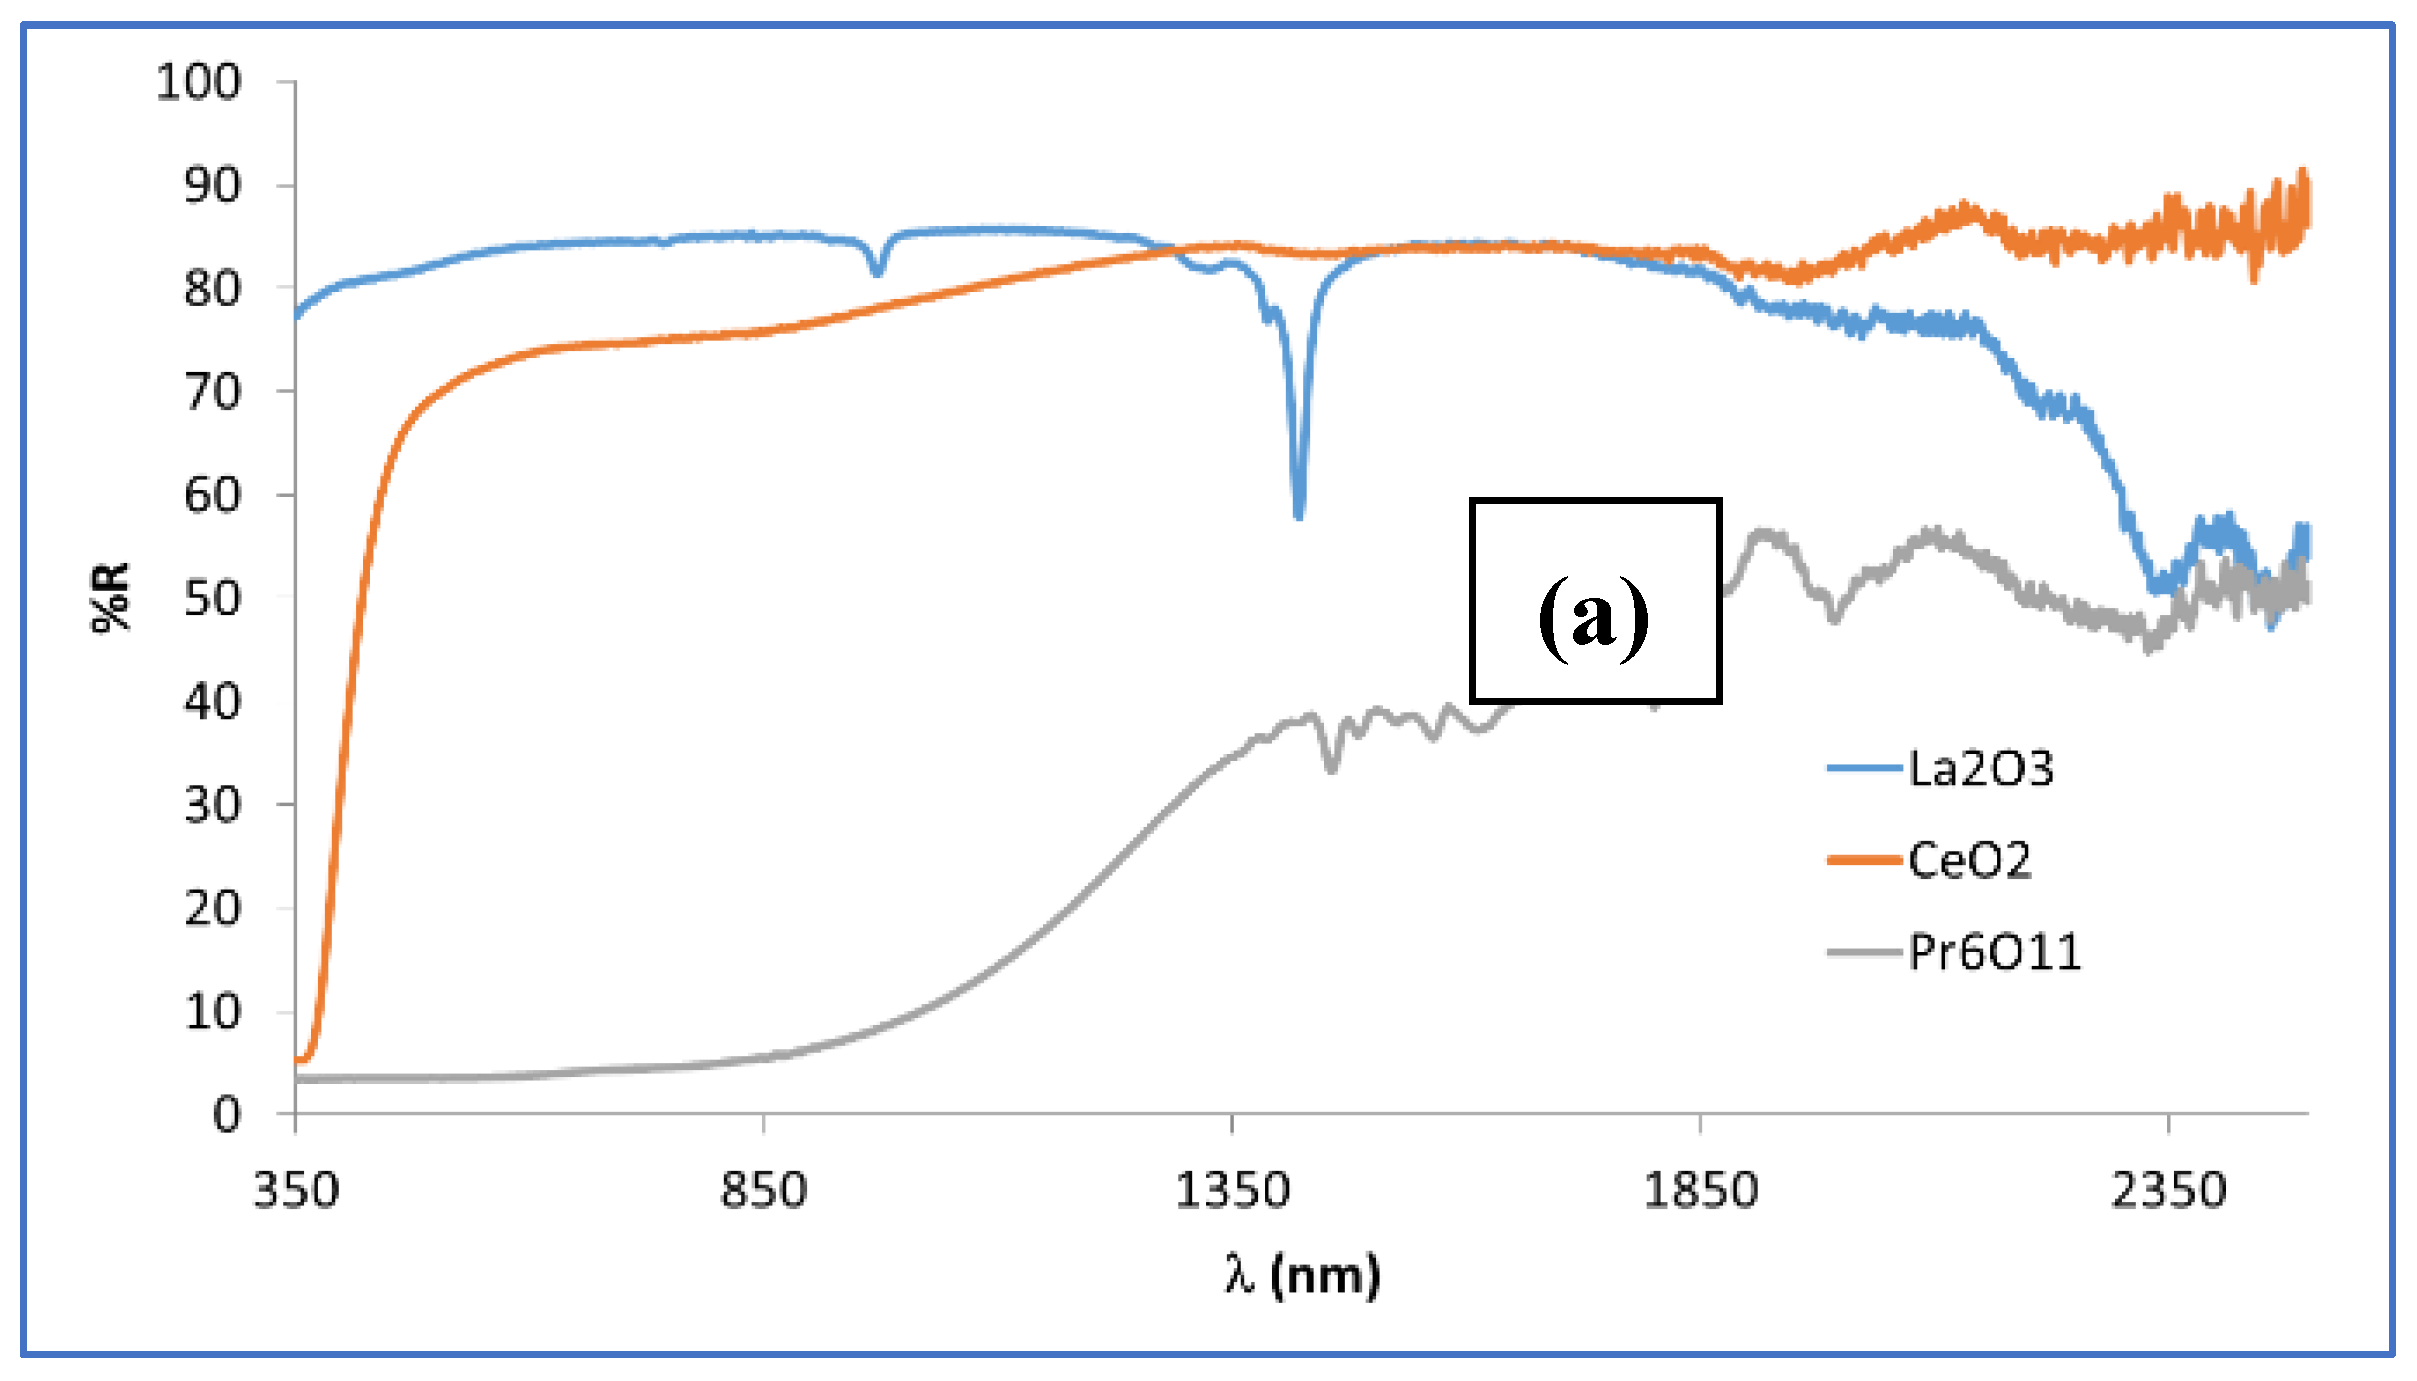
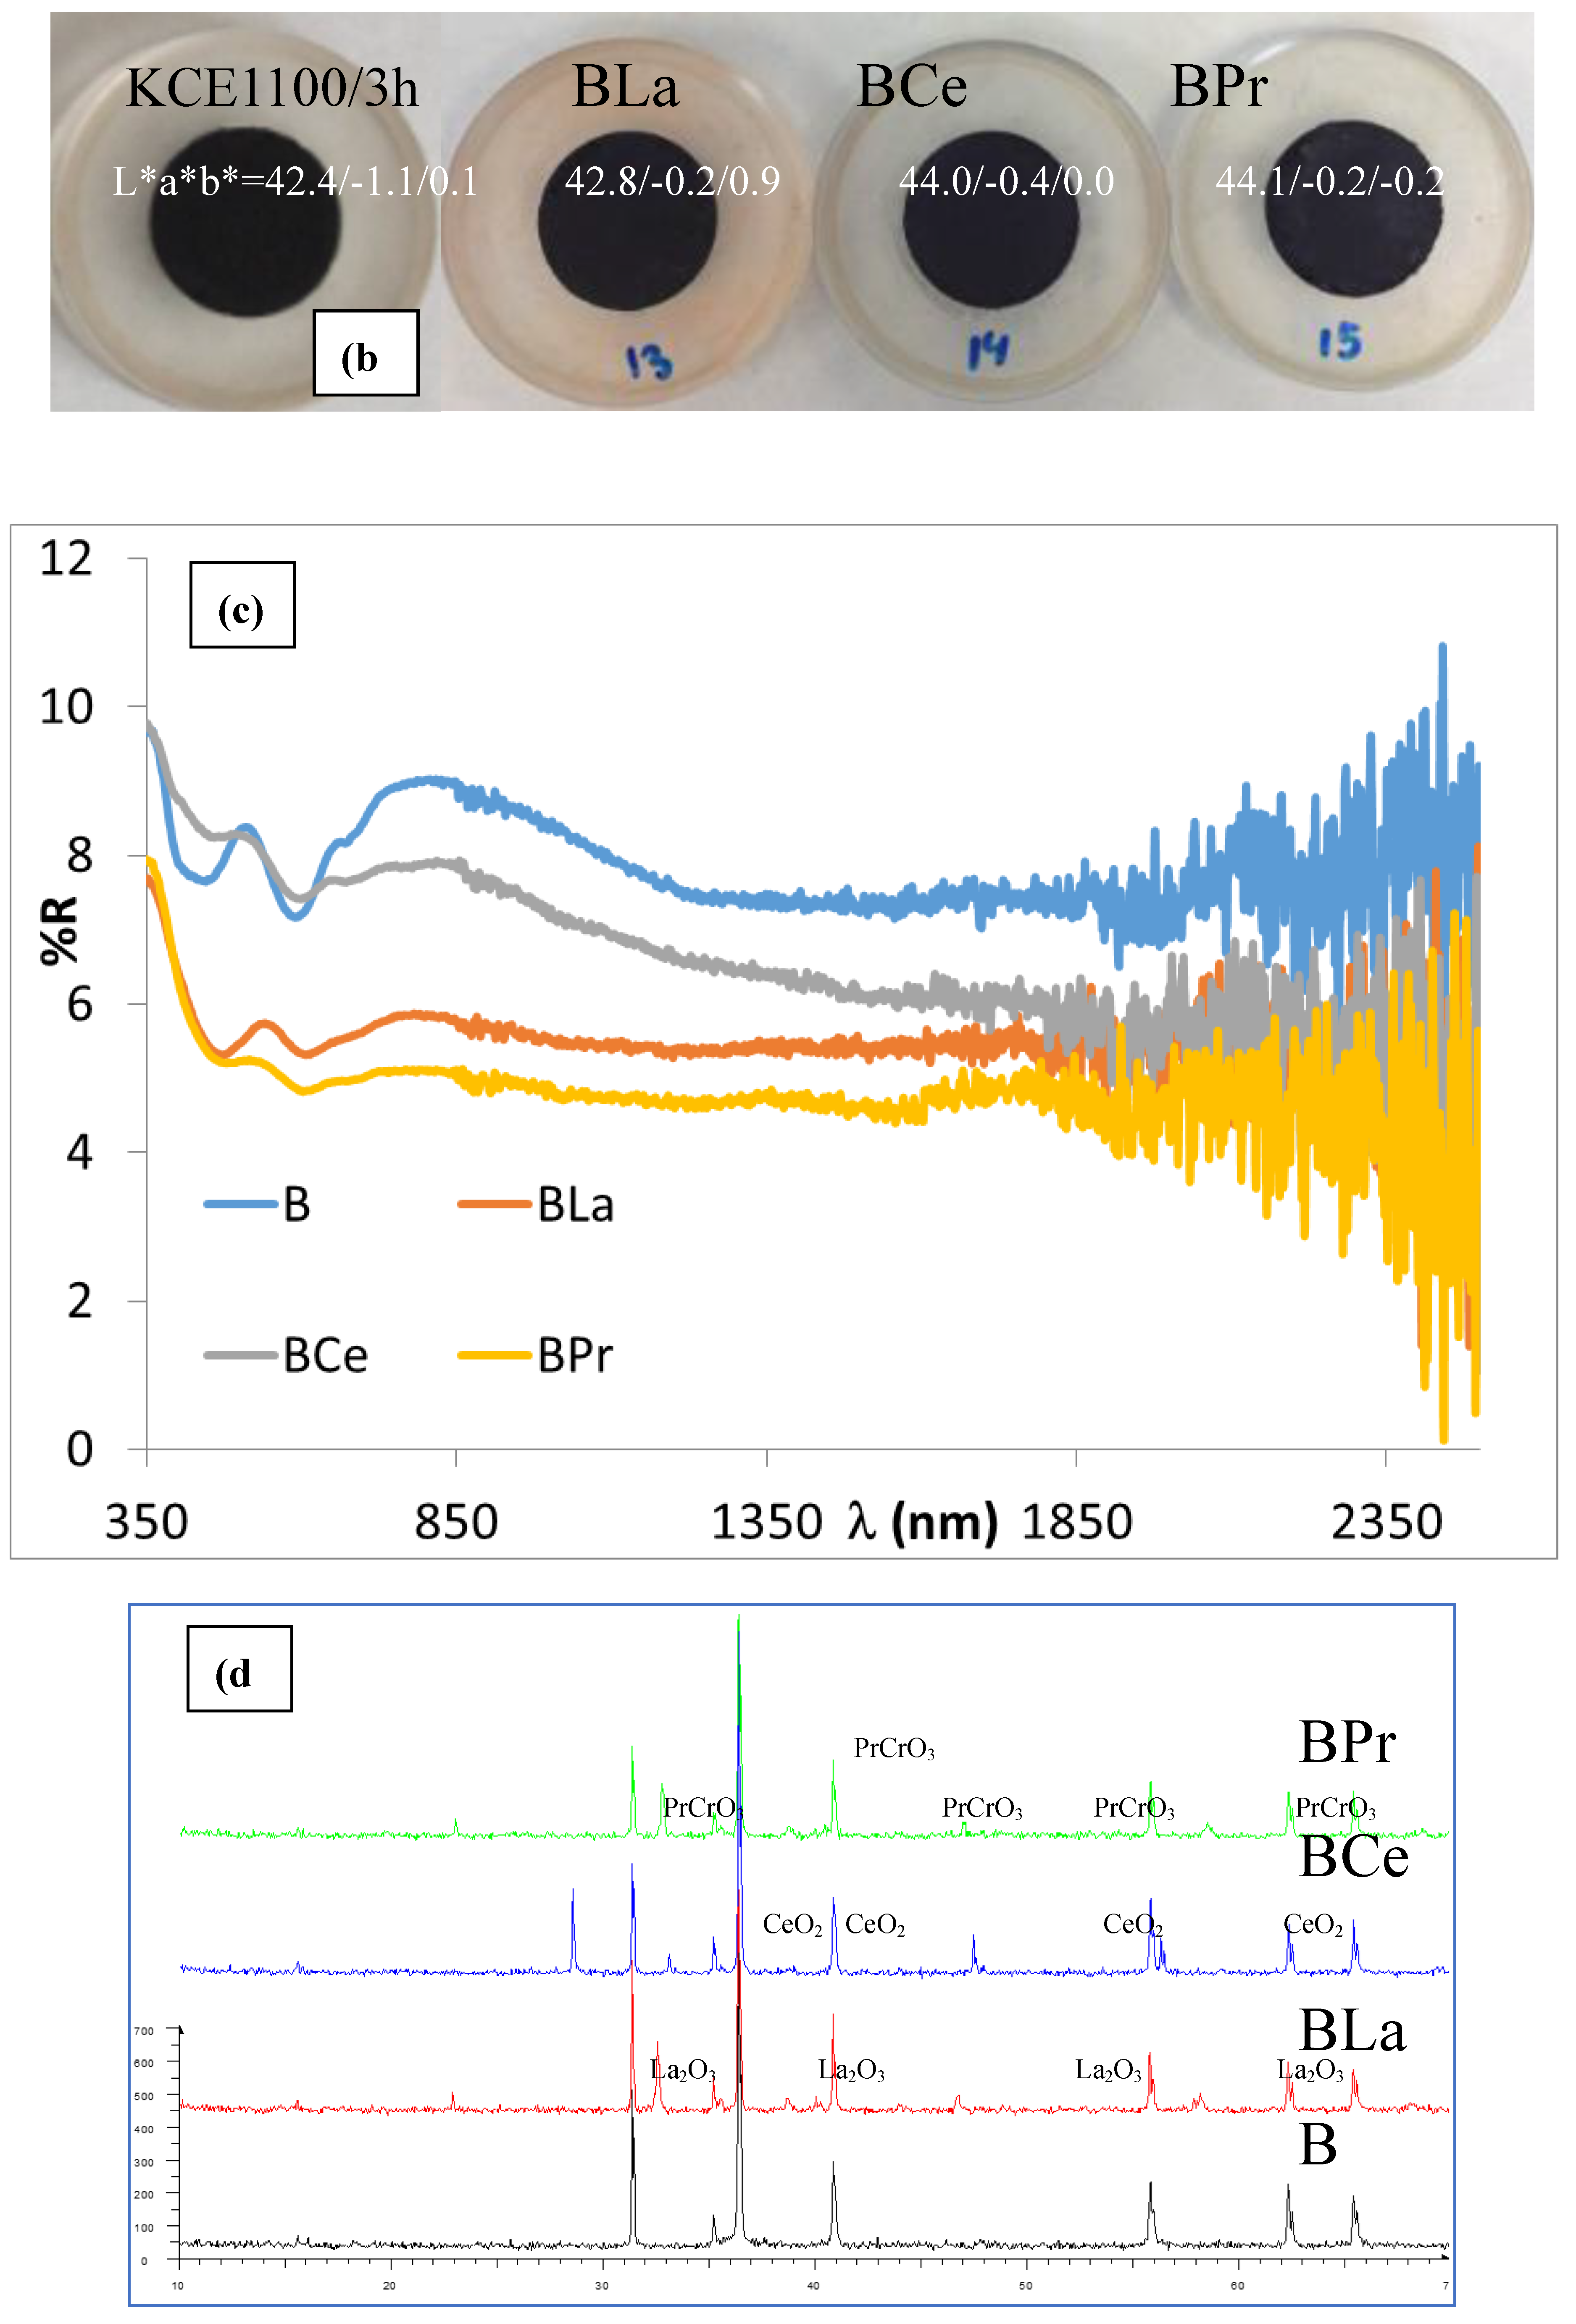
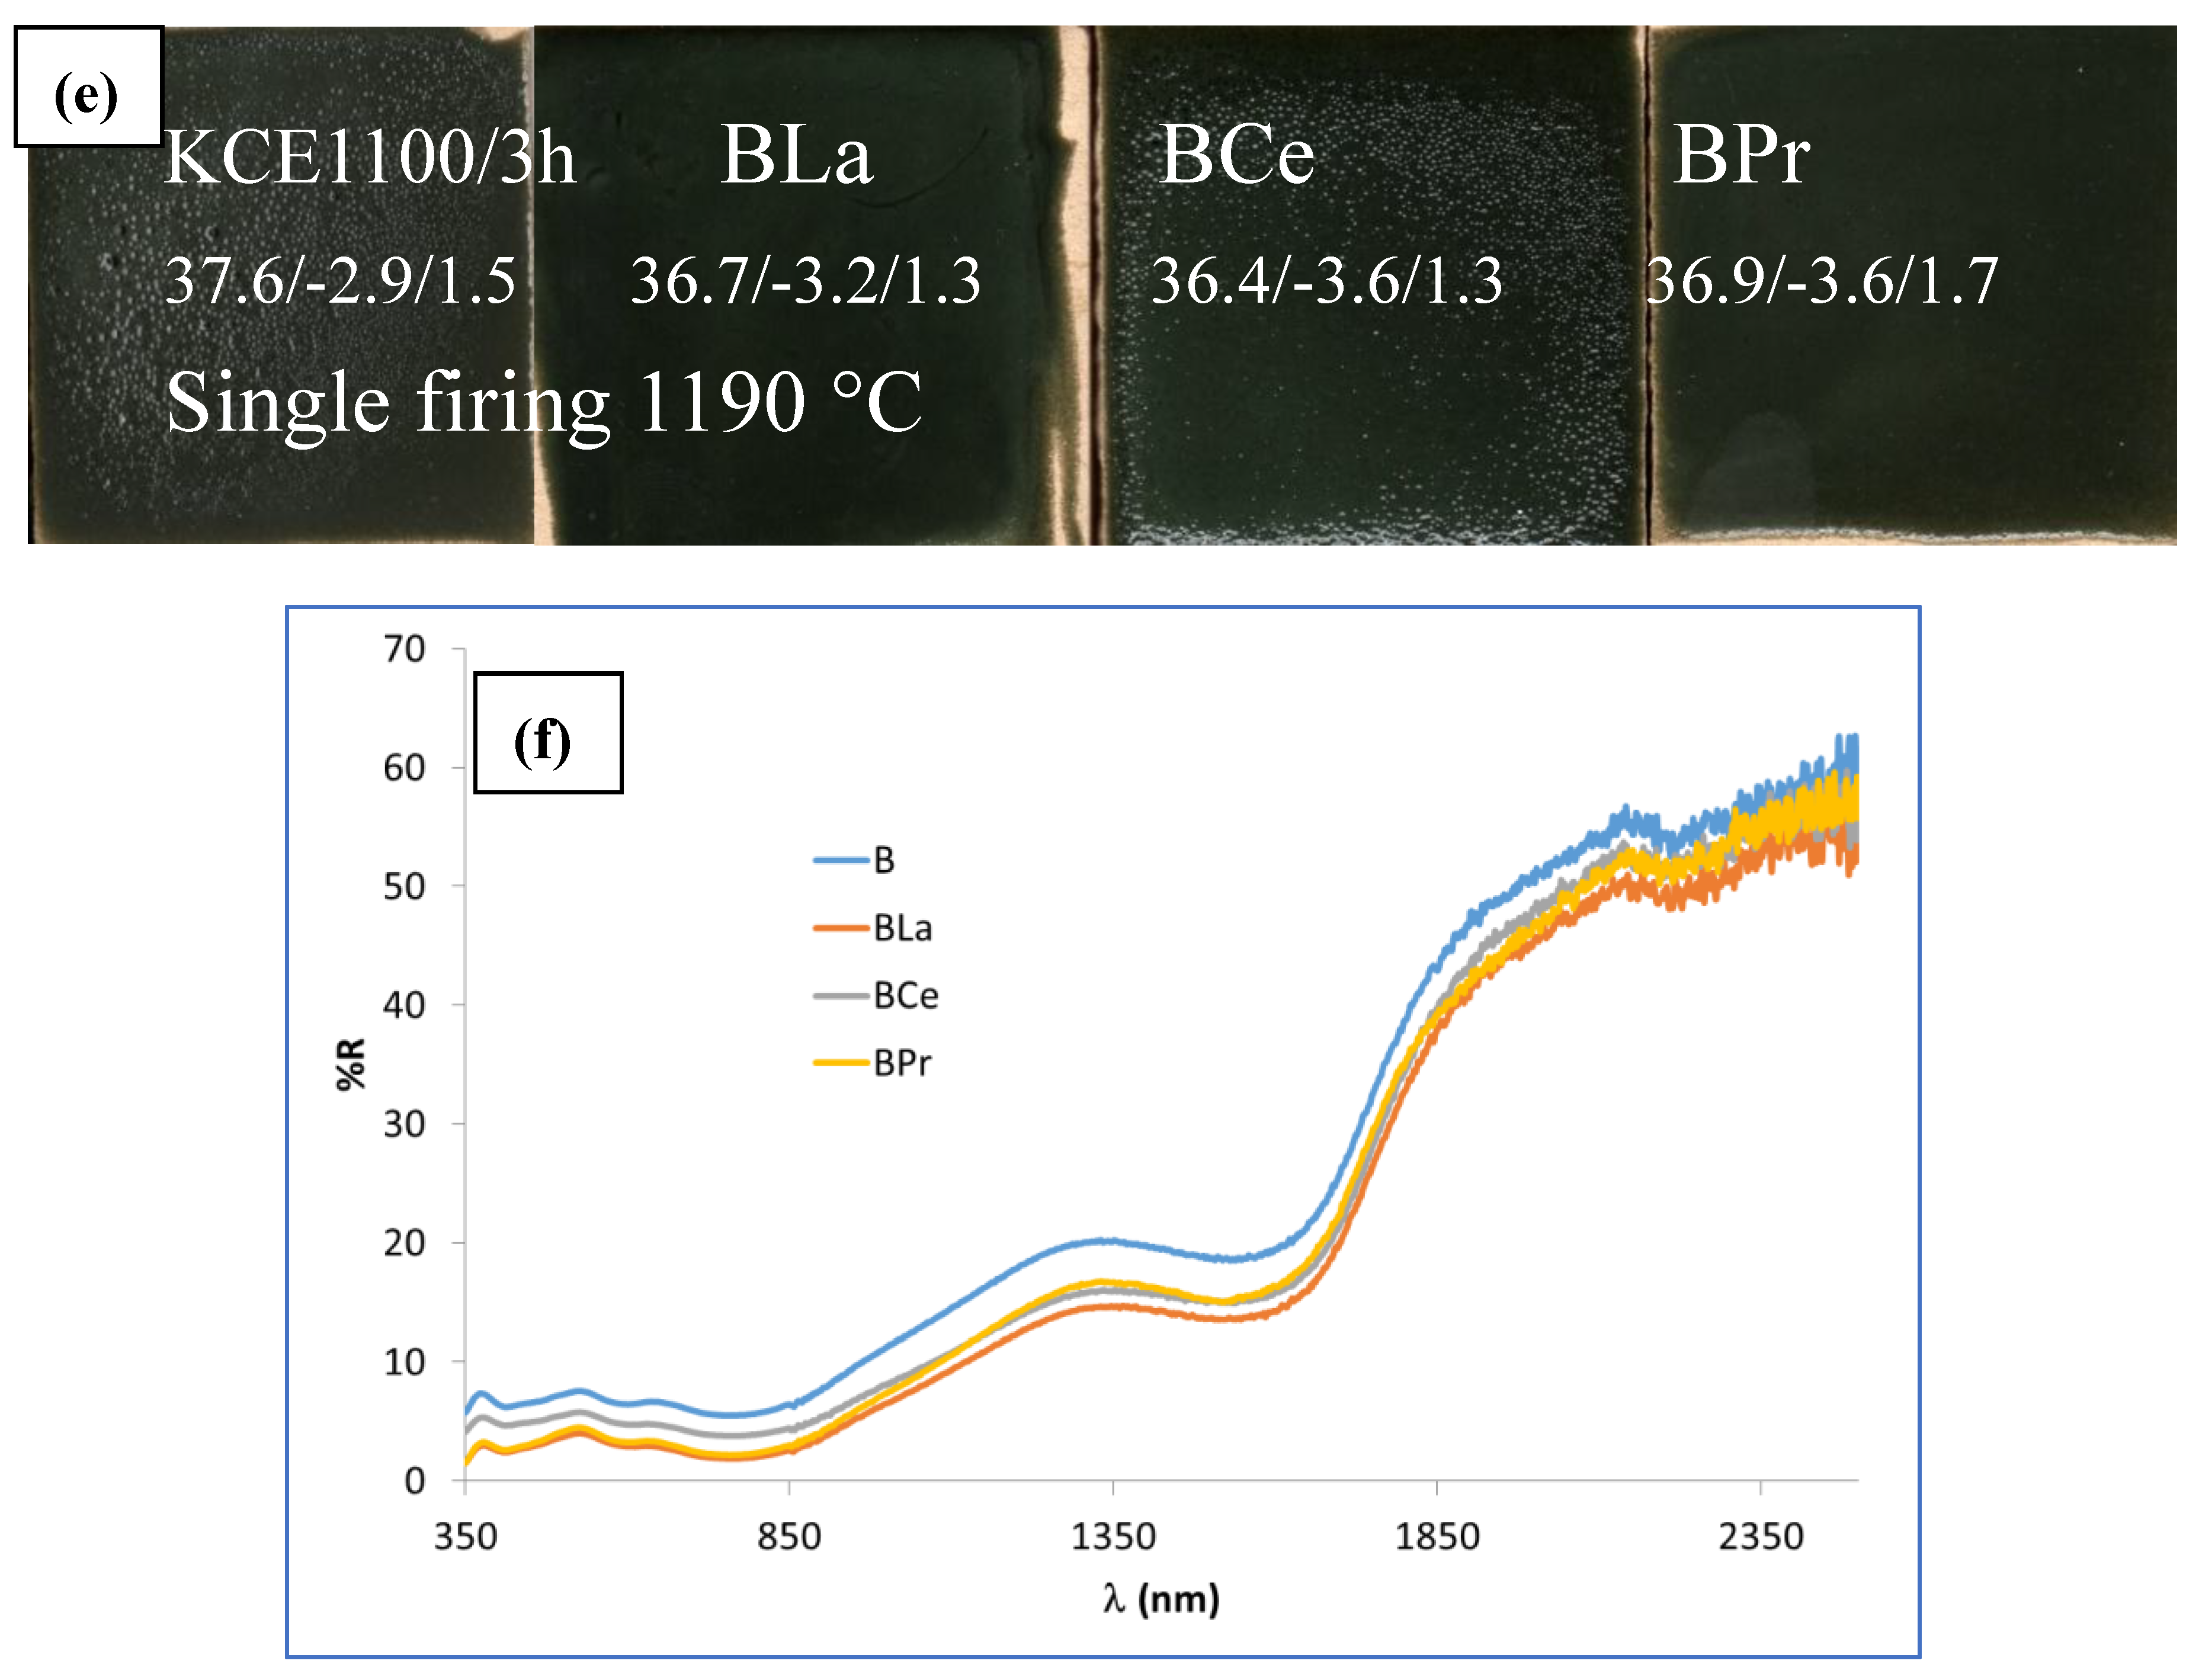
Figure 12.
Tauc plots for doped lanthanides samples CuCrfe solid solution and the co
0,9Ln0,1O2, 1100 ºC for 3h.
Figure 12.
Tauc plots for doped lanthanides samples CuCrfe solid solution and the co
0,9Ln0,1O2, 1100 ºC for 3h.
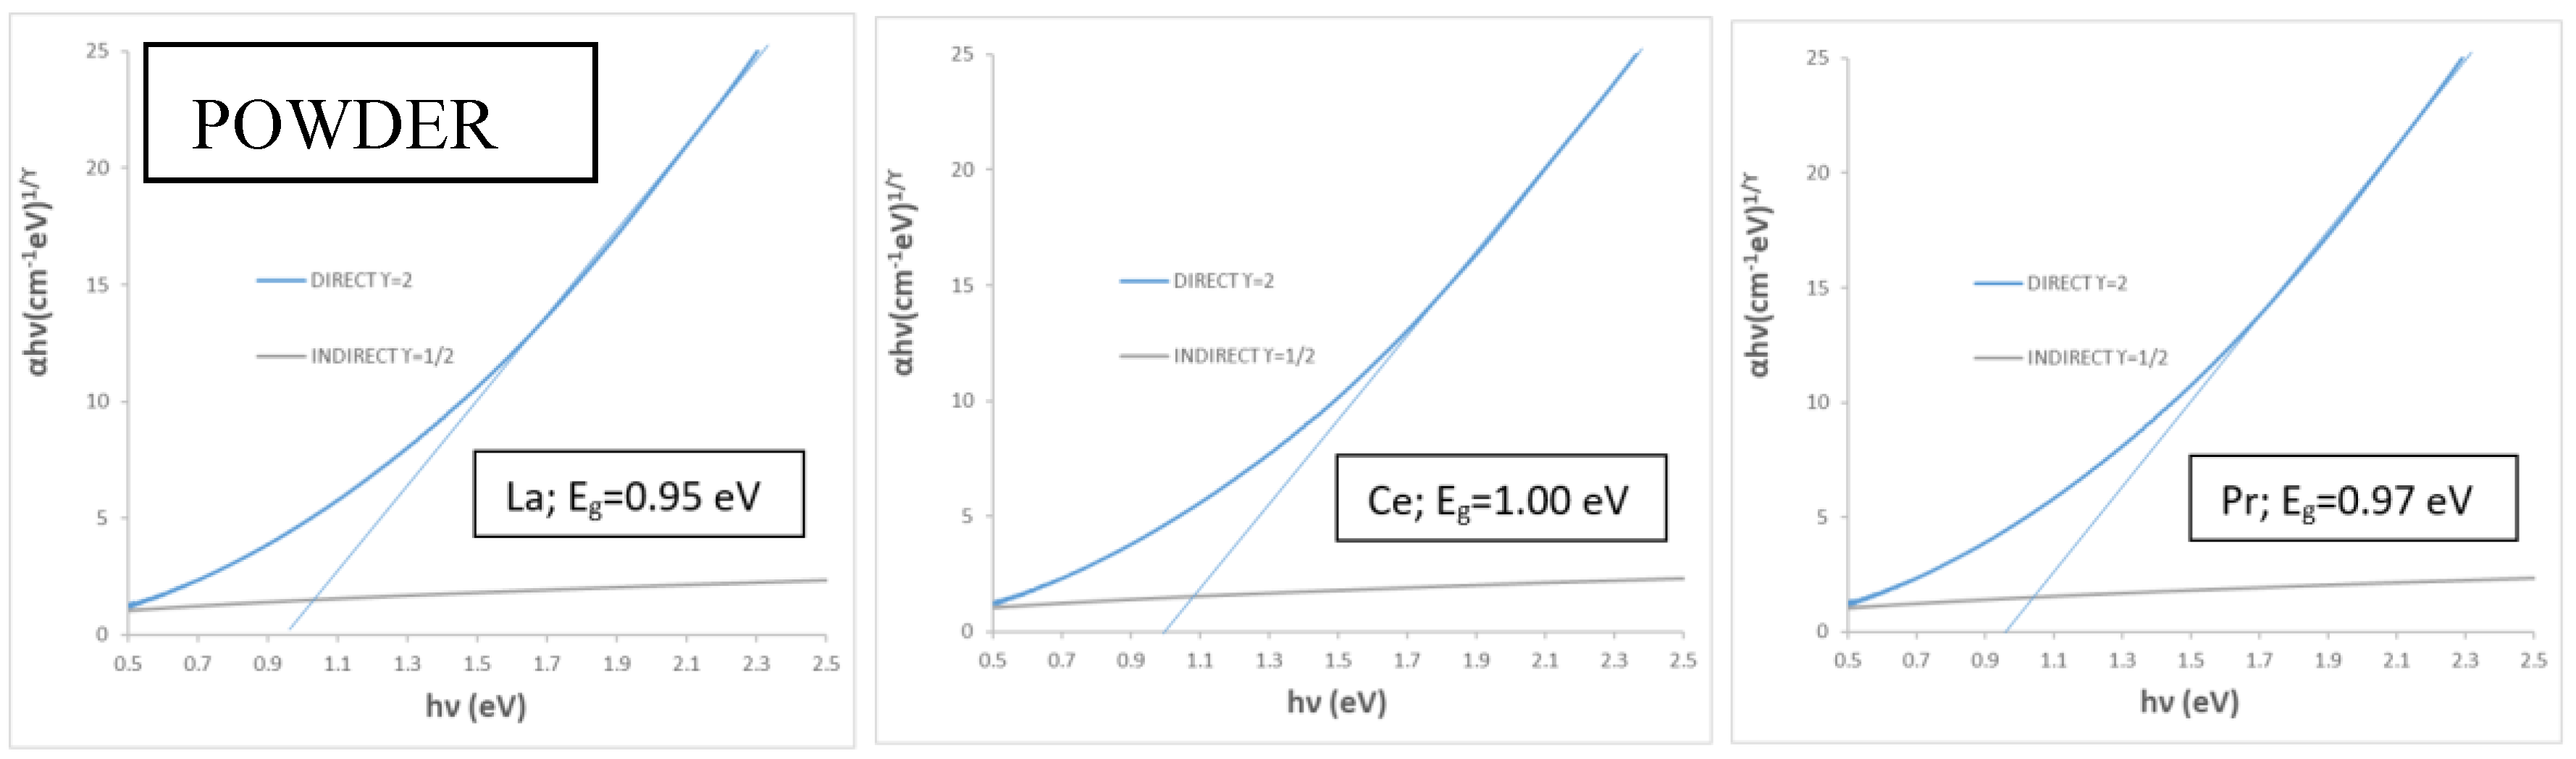
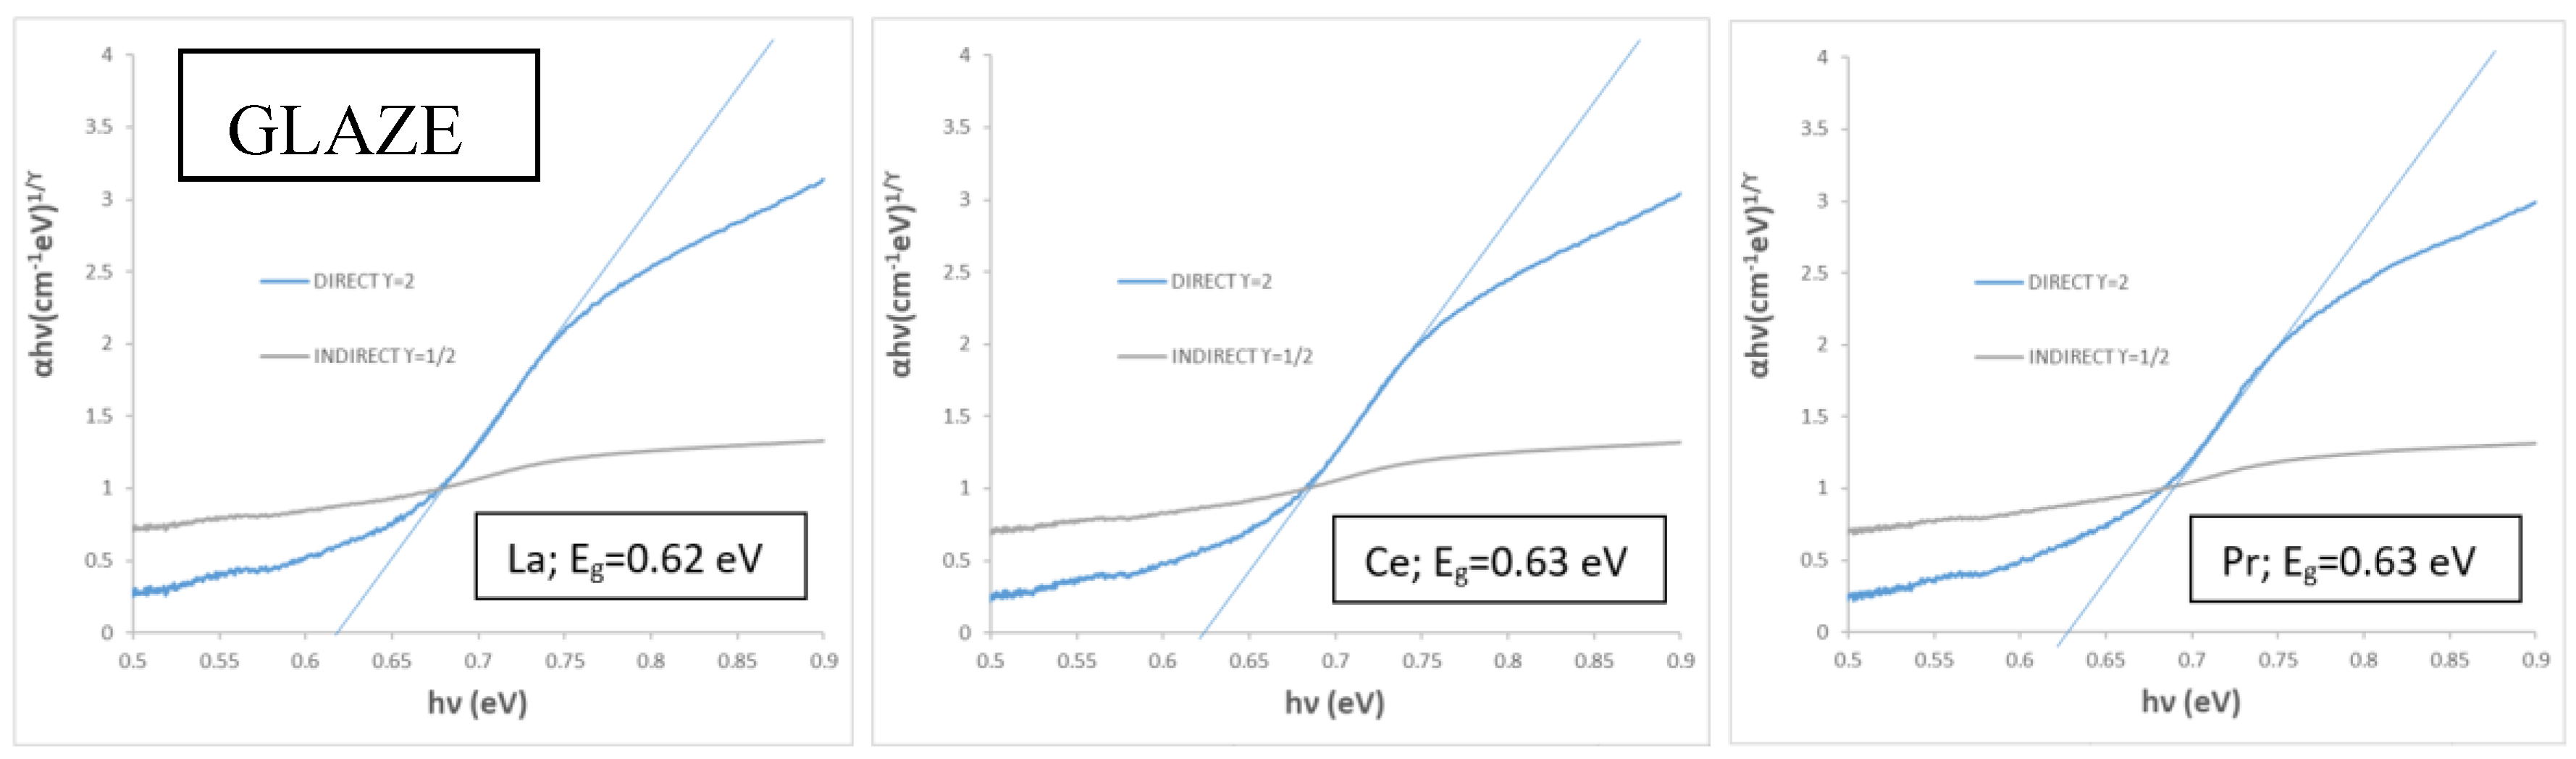

Table 1.
Compositions by EDS estimation of used frits (supplied by Torrecid SA).
| Double Firing 1000 °C |
Double Firing 1050 °C |
Single Firing 1190 °C |
|
|---|---|---|---|
| Oxide | |||
| SiO2 | 72 | 59 | 67 |
| Na2O | 14 | 4 | - |
| K2O | 1.5 | 5 | 3 |
| CaO | 9 | 15 | 12.5 |
| MgO | - | - | 1.5 |
| ZnO | - | 9 | 6 |
| Al2O3 | 2.3 | 8 | 10 |
| PbO | - | - | - |
Table 2.
Colour and reflectance characteristics of samples (values are displayed with the last safe significant digit; e.g., 2.8 is 2.8 ± 0.1 or 99 is 99 ± 1).
Table 2.
Colour and reflectance characteristics of samples (values are displayed with the last safe significant digit; e.g., 2.8 is 2.8 ± 0.1 or 99 is 99 ± 1).
| Sample | L*a*b* | RVis/RNIR/R (%) | ΔE* | C* | h | α | ε100 | Eg(eV) |
|---|---|---|---|---|---|---|---|---|
| Powders | ||||||||
|
K microwaves firing |
36.5/-4.8/-0.8 | 9.9/11.2/10.5 | 17.0 | 4.9 | 189.5 | 0.90 | 0.88 | 1.30 |
|
KM microwaves firing plus 1000 °C/3h |
35.1/-4.8/0.1 | 9.7/11.8/10.6 | 15.7 | 4.8 | 178.8 | 0.89 | 0.87 | 1.28 |
|
KCE electric kiln T(°C)/3h |
||||||||
| 1000/3h | 42.6/-5.4/0.1 | 13.8/14.1/13.9 | 23.1 | 5.4 | 178.9 | 0.86 | 0.85 | 1.26 |
| 1100/3h | 42.4/-1.1/0.1 | 8.1/8.2/8.0 | 22.2 | 1.1 | 175.0 | 0.93 | 0.91 | 1.31 |
| 1200/3h | 44.5/-1.2/1.7 | 8.9/14.6/11.7 | 24.4 | 2.1 | 125.2 | 0.88 | 0.82 | 1.30 |
| Glazed | ||||||||
|
K glazed with microwaves (Glaze 1000) |
23.5/-1.6/-0.4 | 3.9/6.2/4.9 | 3.7 | 1.7 | 166.0 | 0.95 | 0.92 | 0.87 |
|
K glazed with electric kiln (Glaze 1000) |
11.3/-0.6/-3.0 | 1.4/1.9/1.6 | 9.5 | 3.1 | 78.7 | 0.98 | 0.96 | 0.93 |
|
KM (Glaze 1000) |
11.8/-0.6/-2.5 | 1.5/2.2/1.8 | 8.8 | 2.6 | 76.5 | 0.98 | 0.96 | 0.95 |
| KCE | ||||||||
| Glaze 1000 | 26.9/-0.1/-2.3 | 5.3/5.0/5.2 | 7.2 | 2.3 | 87.5 | 0.95 | 0.94 | 1.00 |
| Glaze 1050 | 44.2/-4.8/-8.91 | 6.3/7.5/6.9 | 26.0 | 10.1 | 118 | 0.91 | 0.69 | 0.59 |
| Glaze 1190 | 37.6/-2.9/1.5 | 6.7/15.9/11.2 | 17.7 | 3.3 | 27.4 | 0.89 | 0.49 | 0.63 |
| CuO | 25.8/0.3/-2.4 | 5.1/21.2/12.2 | 6.3 | 2.41 | 83.1 | 0.89 | 0.69 | 1.40 |
|
Carbon Black (powder) |
20.2/0.1/0.1 | 3/3/3 | 0.14 | 45 | 0.99 | 0.96 | 1.40 |
Table 3.
Colour and reflectance characteristics of composites of KCE 1100 °C for 3 h with quartz (Q) or anatase (Anat) glazed in double firing glaze at 1050 °C (values are displayed with the last safe significant digit, for example, 2.8 is 2.8 ± 0.1 or 99 is 99 ± 1).
Table 3.
Colour and reflectance characteristics of composites of KCE 1100 °C for 3 h with quartz (Q) or anatase (Anat) glazed in double firing glaze at 1050 °C (values are displayed with the last safe significant digit, for example, 2.8 is 2.8 ± 0.1 or 99 is 99 ± 1).
| Sample | L*a*b* | RVis/RNIR/R (%) | ΔE* | C* | h | α | ε100 | Eg(eV) |
|---|---|---|---|---|---|---|---|---|
| Glazed 1050 | 44.2/-4.8/-8.91 | 6.3/7.5/6.9 | 26.0 | 10.1 | 118 | 0.91 | 0.69 | 0.59 |
| 5wt.%Q | 40.9/-2.9/-3.1 | 5.7/9.0/7.3 | 21.2 | 4.2 | 46.0 | 0.92 | 0.66 | 0.59 |
| 10wt.%Q | 41.2/-3.1/-3.5 | 5.6/9.4/7.5 | 21.6 | 4.7 | 48.5 | 0.92 | 0.63 | 0.60 |
| 5wt.%Anat | 44.1/-4.0/-4.2 | 7.1/9.8/8.4 | 24.5 | 5.8 | 46.4 | 0.92 | 0.62 | 0.61 |
| 10wt.%Anat | 45.6/-4.7/-4.3 | 7.6/10.6/9.1 | 26.2 | 6.4 | 42.5 | 0.91 | 0.56 | 0.62 |
Table 4.
Colour and reflectance characteristics of composite effect of lanthanide stoichiometric addition CuCr0,9Ln0.1O2, 1100 ºC for 3h (values are displayed with the last safe significant digit, for example, 2.8 is 2.8 ± 0.1 or 99 is 99 ± 1).
Table 4.
Colour and reflectance characteristics of composite effect of lanthanide stoichiometric addition CuCr0,9Ln0.1O2, 1100 ºC for 3h (values are displayed with the last safe significant digit, for example, 2.8 is 2.8 ± 0.1 or 99 is 99 ± 1).
| Sample | L*a*b* | RVis/RNIR/R (%) | ΔE* | C* | h | α | ε100 | Eg(eV) |
|---|---|---|---|---|---|---|---|---|
| Undoped powder | 42.4/-1.1/0.1 | 8.1/8.2/8.0 | 22.2 | 1.1 | 175.0 | 0.93 | 0.91 | 1.31 |
| La | 42.8/-0.2/0.9 | 5.6/5.5/5.6 | 22.6 | 0.9 | 102.5 | 0.94 | 0.95 | 0.95 |
| Ce | 44.0/-0.4/0.0 | 8.0/7.0/7.5 | 23.8 | 0.4 | 180.0 | 0.93 | 0.95 | 1.00 |
| Pr | 44.1/-0.2/-0.2 | 5.2/4.8/5.0 | 23.9 | 0.3 | 135.0 | 0.95 | 0.96 | 0.97 |
| Glazed 1050 | 44.2/-4.8/-8.91 | 6.3/7.5/6.9 | 26.0 | 10.1 | 118.0 | 0.91 | 0.69 | 0.59 |
| La | 36.7/-3.2/1.3 | 2.9/11.2/7.0 | 13.9 | 3.5 | 158.0 | 0.93 | 0.54 | 0.62 |
| Ce | 36.4/-3.6/1.3 | 4.9/12.9/8.8 | 16.7 | 3.8 | 160.1 | 0.91 | 0.51 | 0.63 |
| Pr | 36.9/-3.6/1.7 | 3.3/12.4/7.7 | 17.2 | 4.0 | 154.7 | 0.92 | 0.52 | 0.63 |
Table 5.
Cell parameters and the volume V of the hexagonal cell of lanthanide stoichiometric addition CuCr0,9Ln0.1O2, 1100 ºC for 3h (values are displayed with the last safe significant digit, for example, 2.8 is 2.8 ± 0.1 or 99 is 99 ± 1).
Table 5.
Cell parameters and the volume V of the hexagonal cell of lanthanide stoichiometric addition CuCr0,9Ln0.1O2, 1100 ºC for 3h (values are displayed with the last safe significant digit, for example, 2.8 is 2.8 ± 0.1 or 99 is 99 ± 1).
| Sample | a=b (Å) | c (Å) | V (Å3) |
|---|---|---|---|
| Undoped powder | 2.8506 | 24.0122 | 168.978 |
| La | 2.8486 | 24.3472 | 171.102 |
| Ce | 2.8467 | 24.1231 | 169.298 |
| Pr | 2.8448 | 24.0864 | 168.810 |
Disclaimer/Publisher’s Note: The statements, opinions and data contained in all publications are solely those of the individual author(s) and contributor(s) and not of MDPI and/or the editor(s). MDPI and/or the editor(s) disclaim responsibility for any injury to people or property resulting from any ideas, methods, instructions or products referred to in the content. |
© 2025 by the authors. Licensee MDPI, Basel, Switzerland. This article is an open access article distributed under the terms and conditions of the Creative Commons Attribution (CC BY) license (http://creativecommons.org/licenses/by/4.0/).
Copyright: This open access article is published under a Creative Commons CC BY 4.0 license, which permit the free download, distribution, and reuse, provided that the author and preprint are cited in any reuse.


