Submitted:
23 February 2025
Posted:
24 February 2025
You are already at the latest version
Abstract
(1) Terrestrial ecosystems are critical carbon sinks, and accurate assessment of their carbon storage is vital for understanding global carbon cycles and formulating climate change mitigation strategies.; (2)This study integrated vegetation indices, meteorological factors, land use data, soil/vegetation types, field sampling, and a convolutional neural network (CNN) model to estimate the carbon storage of terrestrial ecosystems in Guangdong Province; (3) Total carbon storage increased by 0.11 Pg from 2000 to 2021, with vegetation carbon gains (+0.19 Pg) offsetting soil carbon losses (-0.08 Pg), the latter primarily driven by reduced soil carbon in forest ecosystems; (4) Northern and eastern Guangdong exhibit high potential for enhancing carbon storage capacity, which is crucial for achieving regional carbon peaking and neutrality targets. Dataset: DOI number or link to the deposited dataset in cases where the dataset is published or set to be published separately. If the dataset is submitted and will be published as a supplement to this paper in the journal Data, this field will be filled by the editors of the journal. In this case, please make sure to submit the dataset as a supplement when entering your manuscript into our manuscript editorial system. Dataset License: license under which the dataset is made available (CC0, CC-BY, CC-BY-SA, CC-BY-NC, etc.)
Keywords:
1. Summary
- Dataset DOI: 10.5281/zenodo.14835471
- Temporal Coverage: 2000, 2005, 2010, 2015, 2018, 2021
- Geographic Coverage: Guangdong Province, China (20.13°–25.31°N, 109.68°–117.20°E)
- Data Format: GeoTIFF (raster), CSV (tabular), Shapefile (vector)
2. Data Description

| Data Type | Temporal Coverage | Spatial Resolution |
Source |
|---|---|---|---|
| Field data | 2018,2021 | -- | Field sampling and surveys |
| LUC | 2000-2021 | 30 m | GLC_FS30, doi:10.12237/casearth.64d094d1819aec27a589a856 |
| VEG | -- | 1 km | Resource and Environment Science Data Center (www.resdc.cn) |
| SOIL | -- | 1 km | HWSD2.0, doi:10.4060/cc3823en |
| TEMP/PRE | 2000-2021 | 1 km | Resource and Environment Science Data Center (doi:10.12078/2022082501) |
| RESI, NPP, NDVI, EVI | 2000-2021 | MODIS data processed via Google Earth Engine (GEE) | |
| DEM | 30m | ASTER GDEM V3 (www.gscloud.cn) |
2.1. Land Use/Cover Data
- Source: GLC_FS30 (Global Land Cover Fine Classification Product)
- Resolution: 30 m
- Temporal Span: 2000–2020 (extended to 2021 via temporal interpolation)
- Processing Steps:
2.2. Remote Sensing Indices
- Variables: NDVI, EVI, RESI (Remote Sensing Ecological Index), NPP (Net Primary Productivity)
- Source: MODIS products (MOD13Q1, MOD17A3H) via Google Earth Engine (GEE)
- Resolution: 250 m (NDVI/EVI), 500 m (NPP)
- Processing:
2.3. Meteorological Data
- Variables: Mean annual temperature (TEMP), total annual precipitation (PRE)
- Source: Resource and Environment Science Data Center (RESDC)
- Method: Thin-plate spline interpolation with elevation correction.
- Access: DOI:10.12078/2022082501
2.4. Soil and Vegetation Data
- Soil Type: HWSD2.0 (Harmonized World Soil Database v2.0)
- Resolution: 1 km
- Key Parameters: Organic carbon density (0–30 cm depth).
- Vegetation Type: RESDC Vegetation Atlas of China
- Classification: 12 vegetation subtypes (e.g., subtropical evergreen broadleaf forest).
- Access: FAO HWSD | RESDC
2.5. Field Sampling Data
- Soil Samples: 2,316 sites (0–30 cm depth, organic carbon measured via dry combustion).
- Vegetation Samples: 1,264 sites (aboveground biomass measured by destructive sampling).
- Quality Control:
- Outliers removed using ±3σ threshold.
- Spatial representativeness validated via Thiessen polygon analysis.
- Access: Restricted (available upon request for academic use).
- Numbered lists can be added as follows:
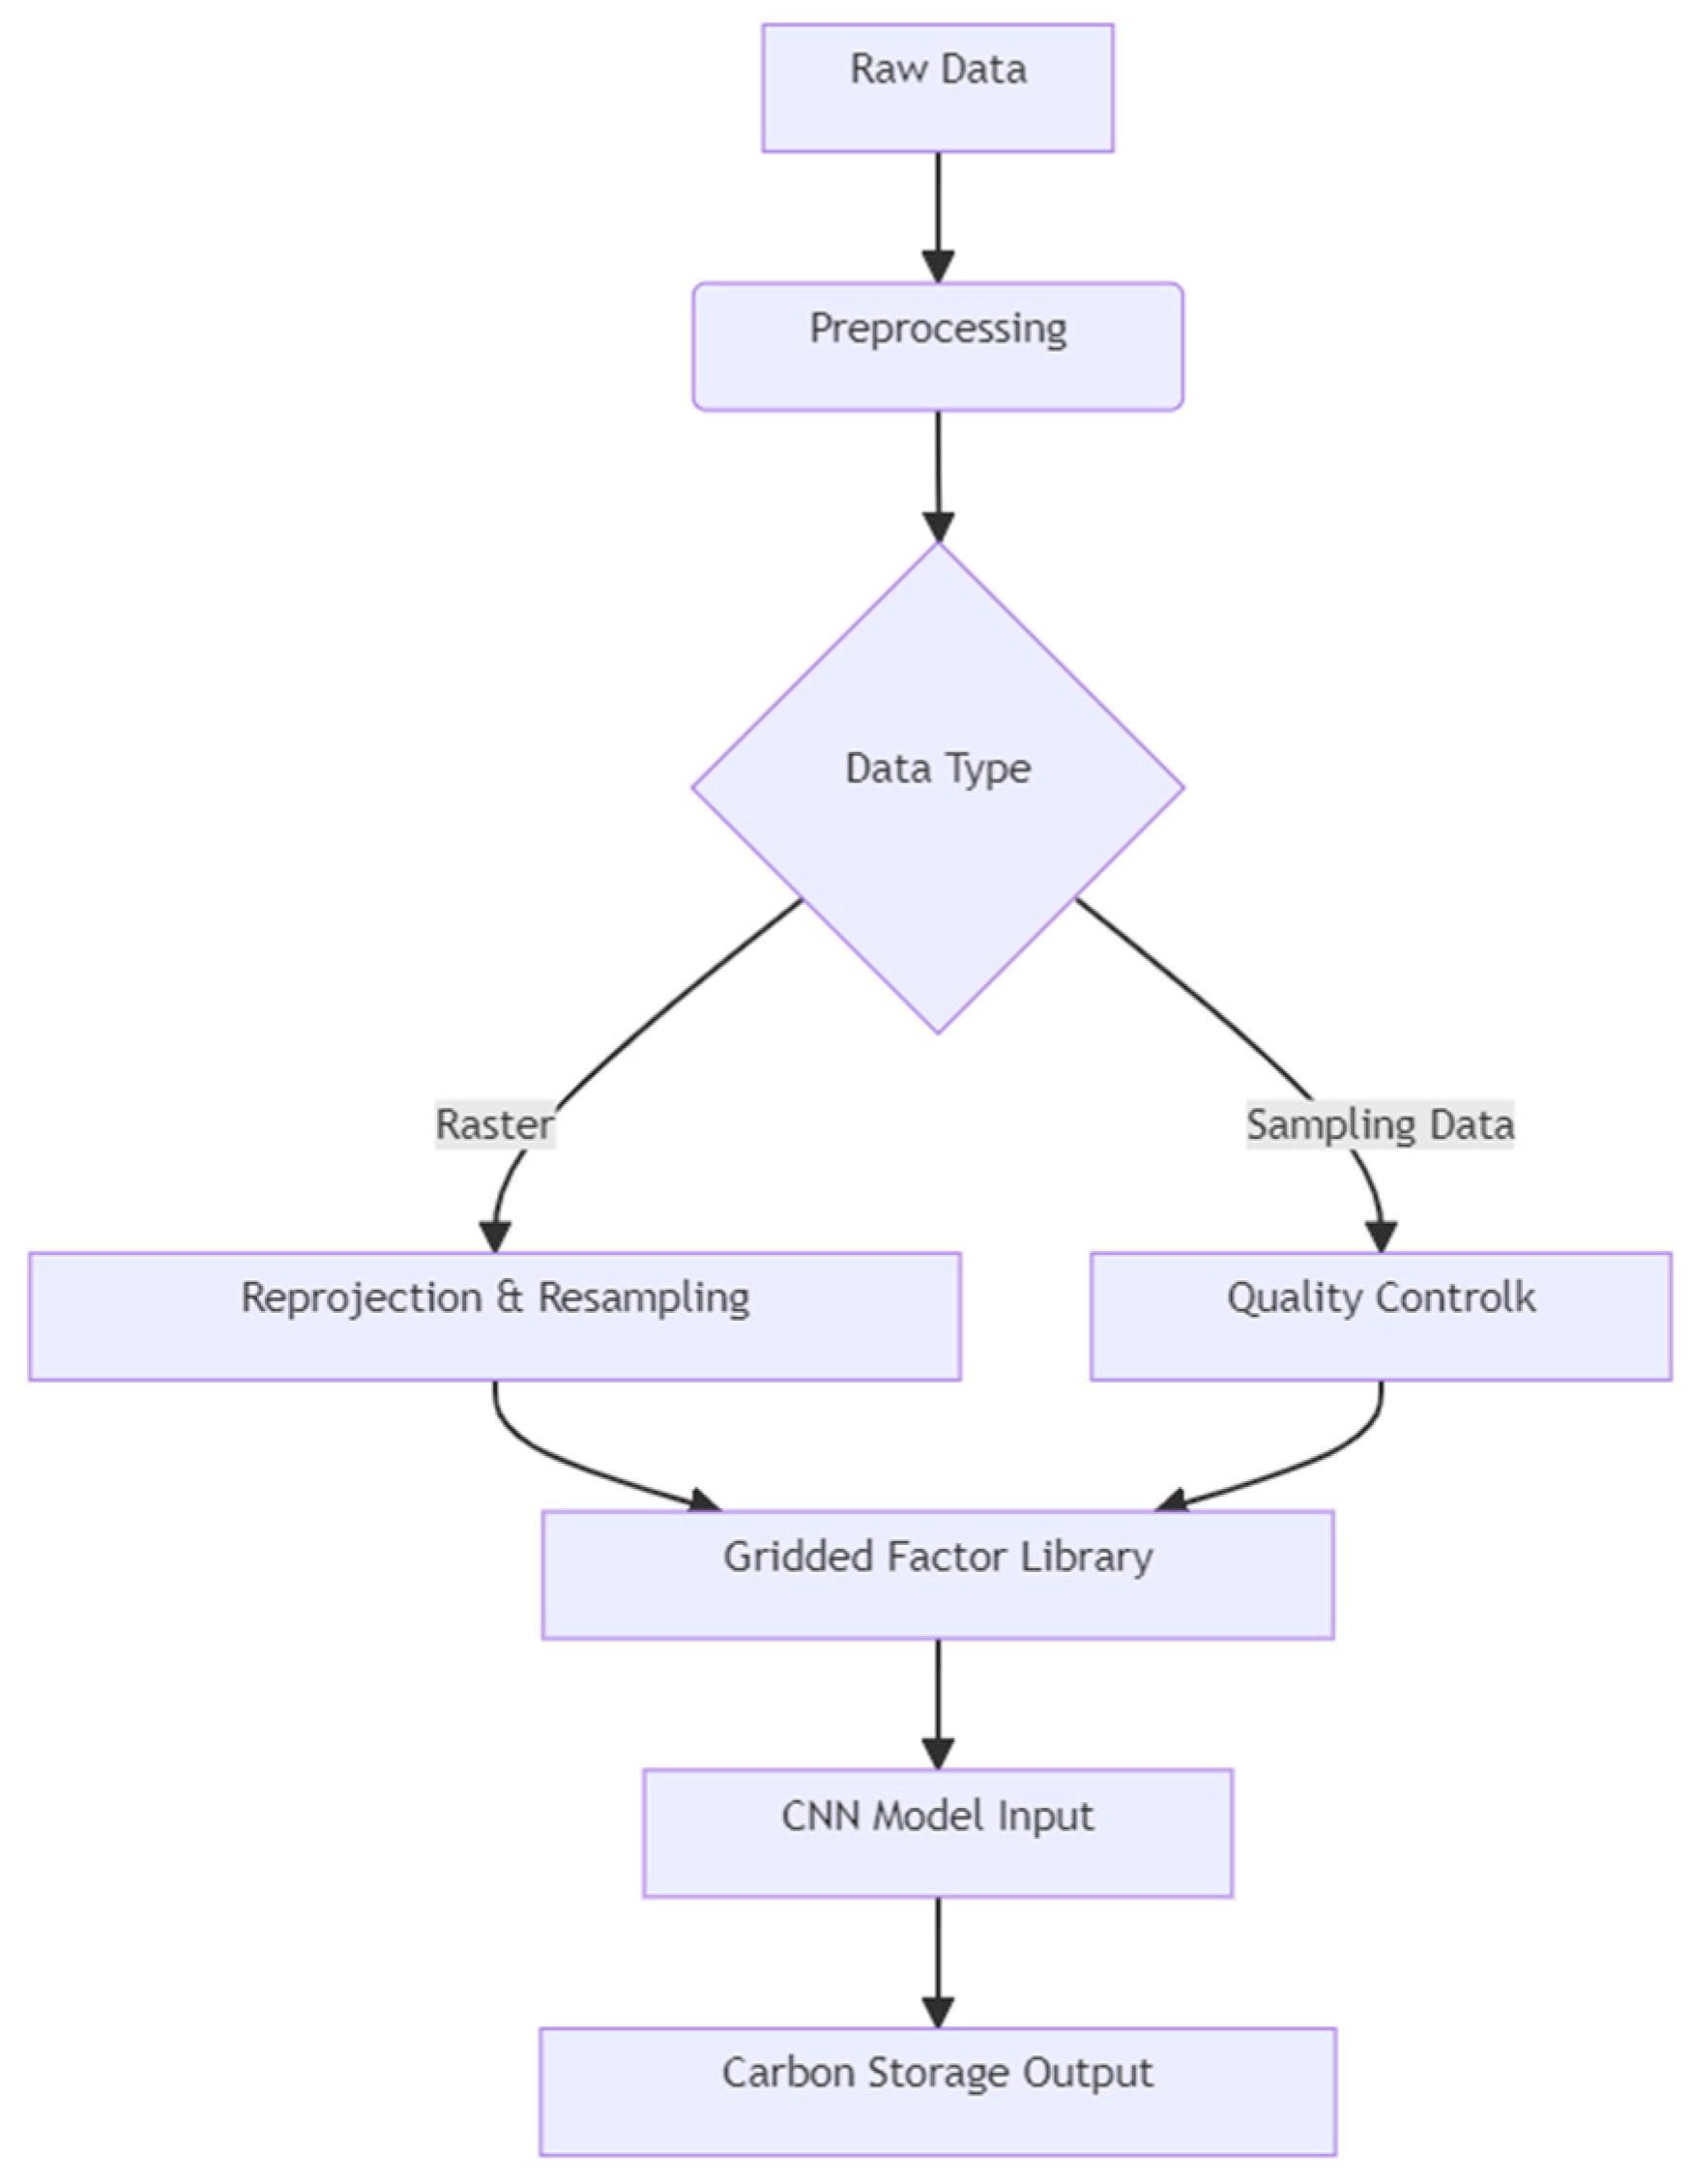
2.6. Data Processing Workflow
2.7. File Structure:
3. Methods
- Input layer: 500m-resolution multisource data grids.
- Convolutional layers: 3 layers with 32–64 filters to capture spatial patterns.
- Pooling layers: Max-pooling for dimensionality reduction.
- Fully connected layers: 2 layers mapping features to carbon storage values.
- Output layer: Predicted vegetation/soil carbon densities.
Author Contributions
Funding
Data Availability Statement
Acknowledgments
Conflicts of Interest
Abbreviations
| MDPI | Multidisciplinary Digital Publishing Institute |
| DOAJ | Directory of open access journals |
| TLA | Three letter acronym |
| LD | Linear dichroism |
References
- Lei L, Xu B Q, Gao Q J, et al. Extended-range forecasting method of summer daily maximum temperature in the Yangtze River Basin based on convolutional neural network. Transactions of Atmospheric Sciences, 2022,45(06):835-849. [CrossRef]
- Zhou L T, Yan Z Y, Gu X F, et al. Global Sensitivity Analysis for CNN Based Deformation Prediction of A Cohesive Structure of A Sluice and Pumping Station. Water Resources and Power,2024,42(08):119-122. [CrossRef]
- GGong A, Zhang H. Reservoir Fluid Identification Model Based on Wavelet Transform and CNN-Transformer. Journal of Xi'an Shiyou University (Natural Science Edition) ,2024,39(04):108-116. [CrossRef]
Disclaimer/Publisher’s Note: The statements, opinions and data contained in all publications are solely those of the individual author(s) and contributor(s) and not of MDPI and/or the editor(s). MDPI and/or the editor(s) disclaim responsibility for any injury to people or property resulting from any ideas, methods, instructions or products referred to in the content. |
© 2025 by the authors. Licensee MDPI, Basel, Switzerland. This article is an open access article distributed under the terms and conditions of the Creative Commons Attribution (CC BY) license (https://creativecommons.org/licenses/by/4.0/).


