
Submitted:
21 February 2025
Posted:
24 February 2025
You are already at the latest version
Abstract
Some of the largest uranium deposits in Mexico are located in Chihuahua. The most important is in Sierra Peña Blanca, northwest of the capital, which was explored and partially exploited in the 1980s. After the closure of activities, the mining projects were left exposed to weathering. To characterize the drift of uranium minerals towards the neighboring Laguna del Cuervo, sediment samples were collected in the main streams in the drainage pattern of the largest deposits. The uranium mineral fragments from the fine sand portion were extracted using fluorescence at 365 nm light. These particles' morphology and elemental composition were analyzed by focused ion beam microscopy (FIB) and scanning transmission electron microscopy (STEM). The particle density in samples close to the uranium sources was quantified using gamma spectrometry. The highest density was 2500 part./g, and the lowest was 124 part./g. X-ray absorption spectrometry (XAFS) allowed to establish the speciation of U in the urani-um particles, confirming U(VI) through the XANES spectrum. Theoretical fitting of the EXAFS spectrum confirmed the presence of uranophane. Finally, the Fe, Sr, and U dis-tribution in the particle and its matrix was obtained by X-ray fluorescence microto-mography (CT-µXRF). It was concluded that the particle is composed of uranophane, imbricated with quartz and other oxides.
Keywords:
Uranium
; Sierra Peña Blanca
; mineral particles
; isotopes
; gamma spectrometry
; XANES
; EXAFS
; CT-µ-XRF
1. Introduction
The state of Chihuahua, Mexico, has significant uranium deposits. Among them, the Sierra Peña Blanca (SPB) site, located approximately 50 km northeast of the state capital (Figure 1) [1], stands out for its economic importance. As it contains about 40% of the country’s uranium, important uranium exploration and mining activities were undertaken there. The main deposits were exploited until the early 1980s when mining activities in the region were closed. The extracted and unprocessed uranium ore, confined in a repository, and the ore in open-pit mines were left exposed to the area's climatic conditions, with subsequent weathering, erosion, and deposition phenomena.
SPB is located in the Basin and Range physiographic province [2]. The origin of the province is the folding of Mesozoic marine sequences, developed on a Paleozoic and Precambrian basement, as well as the filling of tectonic trenches with continental sediments and igneous spills. The SPB topography is characterized by internally drained basins surrounded by steep mountain ranges that rise 500 to 1000 m above the plains and 2000 to 3000 m above sea level [3]. Hydrologically, the province is part of the Northern Closed Basins sub-region and the Laguna del Cuervo (Laguna de Hormigas) sub-basin [4].
Tectonically, SPB belongs to a larger fragmented block, Sierra del Nido [5]. In the southern part of the Sierra, the oldest rocks are Paleozoic sedimentary outcrops, while in the north, the rock consists mainly of reef limestone from the El Abra formation outcrop. Different geological units stand out in the area; however, the main ones presenting uranium mineralization are those of the Escuadra and Nopal formations [6].
The SPB mining district contains three main U deposits: Nopal I, Margaritas, and Puerto 3, which are composed of volcanic rocks of felsic composition, such as rhyolitic tuffs [7]. Their most representative uraniferous minerals are uranophane, which is predominant, and carnotite-margaritasite, weeksite, and schoepite, with minor amounts of primary uraninite [8]. Faudoa, in a recent study [9], identified and characterized the following minerals in the Nopal 1 mine: α-uranophane [Ca(UO2)2(SiO3OH)2 ·5H2O], accompanied by parauranophane (earlier named β-uranophane) and weeksite in veins, as well as quartz, feldspars, and iron oxides, such as hematite. In [9], parauranophane crystals were extracted from the Nopal 1 mine in what is described as “cavities in the rock” in a hematite-goethite matrix. The uranyl sulfates natrozippeite and uranopilite were also reported [9].
The origin of uranium mineralization in the SPB deposits has been the subject of many publications. Reyes-Cortés [6] indicated that the uranium-molybdenum deposits in the SPB are distributed at 55 - 100 m depth in rocks of the Escuadra geological formation. Goodell [5] explained that uranium has migrated there following the weathering and erosion processes of peralkaline rocks with uranium content that outcrops in the Sierra del Nido. This was accompanied by a hydrological transport (underground-surface) of the sediments containing U and some interaction with hot solutions. Then, the geological gradient and the structures with a southeast tendency allowed these solutions to flow toward the Peña Blanca block. Finally, the geochemistry of the formations in Peña Blanca and the faults and fractures present enabled the formation of a reducing environment where uranium could be deposited in the mineralized zones. George-Aniel et al. [10] established that mineralization occurs mainly in the lower units of a Cenozoic volcanic package (the rhyolites of the Escuadra and Nopal formations) under three genetic types. First, a hydrothermal type, where the primary mineralization and the associated kaolinization of the rock are the results of the circulation of hydrothermal fluids in the breccia and fault systems; the uranyl minerals being produced there at later stages with oxidizing conditions. Second, a mixed-exhalative genetic type, common in geothermal environments or in sedimentary basins with active hot springs, in which the U-Mo minerals were precipitated due to the mixing of oxidizing and uranium-rich groundwater with reduced and H₂S-rich fluids in a tectonic valley. Third, a supergene type, in which the uranophane mineralization is performed between two impermeable layers. The precipitation of this uranyl silicate, together with kaolinite and quartz, is due to an enrichment of SiO₂ in low-temperature solutions.
The area of SPB is located in the Chihuahuan Desert, where the average annual temperature and precipitation are about 18 °C and 235 mm, respectively [11]. The weather is characterized by periods of torrential rain followed by long periods of drought [12]. When the geological formations are physically weathered, their rocks begin their sedimentary cycle. The decomposition and fragmentation of the rock-forming minerals allow for its subsequent erosion and displacement [13]. This later can be caused by natural agents such as water, wind, and mass flows. In this work, we focus on the transport of U minerals through surface water. Being an endorheic basin, the area's hydrology favors the mechanical transport of the material exposed in the mines through the main streams - Peña Blanca, Boca la Colorada, and El Tigre - to Laguna del Cuervo. Evaluating the potential environmental contamination from acid drainages generated by mining processes is important. In the case of the Peña Blanca mining activities, the presence of elements such as As, Cd, Co, Cr, Cu, Mo, Ni, Pb, Sb, V, and Zn was reported in granulometric fractions with d < 2 mm sampled from the streams of the area, but U was not [14].
Schindler et al. [15] studied amorphous silica glazes at the Nopal 1 mine in SPB. They determined the oxidation states of uranium and the concentration of U and Ca in green and yellow opals. These are 0.08-0.15% in the opal and are in a 1:1 ratio. They observed silica coatings in fractures and/or cracks on uranium minerals, mainly uranophane, weeksite, and becquerelite (filling small fissures). It is concluded that microparticles of weeksite and uraninite have been incorporated into the glazes during the gelation and hardening of silicic acid to form opal. A more recent study by Schindler et al. [16] suggests that microcrystalline quartz-opal can retain uranium for millions of years under standard pressure and temperature conditions and low fluid activities.
In nature, three isotopes of uranium are found: 234U, 235U, and 238U. The last two isotopes are parents of two radioactive decay series. The radioactive decay series of 238U generates alpha, beta, and gamma radiation with daughter radionuclides [17]. Uranium is a lithophile element that may present the oxidation states +3, +4, +5, and +6. The valence +6 sometimes indicates that uranium is present as the uranyl ion UO2+2, which is highly soluble [18]. The presence of this soluble ion is linked to uranium's exposure to physical and chemical weathering processes. Hence, its characterization provides information about the transport mechanism(s) to which it was subjected. In geological environments, the radioactive activities of the isotope members of the uranium series are usually all equal in “radioactive equilibrium.” For the 238U series, the Activity Ratio AR=A(234U)/A(238U) is generally calculated. It is affected by the solubility of 234U due to the α-recoil phenomenon, which extracts the U+4 ion from the crystalline bond. Variations in AR have been related to the mobility of surface waters and the intensity of weathering in sediment production [16]. More recently, however, Bosia et al. [19] suggested that the high concentration of refractory minerals in the sediment composition modifies the dissolution of U and Th. They proposed that isotope activity concentrations in surface waters are mainly controlled by variations in the sediment mineralogical and grain-size compositions rather than by variations in their degree of weathering during transport. In this study, we focus on analyzing the concentration and distribution of uranium mineral fragments from the deposits in sediments and the isotopes produced by the 238U series.
The exploration of uranium isotopes in rocks by radioactive methods has been reported since the 1950s [20,21,22,23]. In the 1960s, the characterization of uranium and/or thorium minerals by such methods was well established, as described by J.L. Mero [24]. In Chihuahua, the first application of gamma spectrometry was performed in 1984 during the investigation and mitigation activities following the "Radiation accident of 60Co contamination" in 1983 [25]. Then, dismantling a radiotherapy unit led to the deposition of 16.65 GBq of cobalt-60 in a junkyard, from where it dispersed in the environment [25]. Gamma spectrometry was used to determine the background levels of uranium activity in soils sampled from the principal localities of the state [26].
Rodríguez-Guerra [27] and Hernández-Hernández [28] studied the transport of uranium series isotopes from Peña Blanca to Laguna del Cuervo through the El Tigre and Boca la Colorada streams, respectively. They characterized sediments in the area and found the following mineral phases: quartz, calcite, clays, potassium feldspars, and iron oxides. They provided evidence that the uranium ore from the Nopal I mine moves in a particulate manner in sands that are in secular equilibrium. Pérez-Reyes et al. [29], studied the activity ratio of the isotopes 234U/238U and the sediment-water distribution coefficient of these isotopes. He found activity concentrations of the isotopes up to 35 times higher than those determined for other samples in the same study. He attributed this to a contribution of uranium from the water to the sediment through a reduction zone due to the affinity of this element as a ligand to organic matter. Under these redox conditions, uranium in solution can precipitate. Pérez-Reyes et al. [30] simulated the transport of uranium minerals by surface water through columns with sediments that reproduced granulometrically the channel and alluvial fan of the Boca la Colorada stream, Sierra Peña Blanca. The experiments confirmed the difficulty of dissolving uranophane and uranyl's adsorption capacity by the area's clays. These results suggested the natural mechanism of uranium transport by surface water in SPB is through fragmented uranium mineral particles.
Since 1945, as a result of the production of uranium, nuclear fuel, tests of nuclear weapons, and nuclear accidents of various kinds, radioactive particles into the environment has been released. In the case of nuclear accidents, these radioactive particles are called "hot particles." According to IAEA-TECDOC-1663 in 2011, radioactive particles are “localized aggregation of radioactive atoms with an inhomogeneous distribution of radionuclides significantly different from that of the matrix background.” Particles are considered grains of aerosols, soil, or sediments with 0.45 µm < d < 2 mm, and fragments have d > 2 mm [31]. The study of these hot particles shows a gruesome example: the accident involving USAF B-52 bombers with nuclear bombs in 1966 in the Palomares area, Spain. The work of Lind et al. [32] demonstrates the characteristics of the radioactive particles containing uranium (U) and plutonium (Pu) dispersed on the ground by the accident. Hot particles from the Palomares accident have then been subjected to destructive and non-destructive analysis [32,33,34,35,36]. Pollanen et al. [33], through gamma spectrometry, imaging plates, and scanning electron microscopy, identified the presence of U, Pu, Pb, and Fe in particles of ~10 μm in diameter in soil samples from Palomares, demonstrated that single particle analysis provides information that cannot be obtained from bulk samples. ICP-MS studies on Palomares hot particles have demonstrated the isotopic composition of U and Pu, which allows the identification of the type of nuclear fuel [32,33]. Raiwa et al.[37], employing resonant laser secondary neutral mass spectrometry performed multi-element measurements (uranium, plutonium, and americium) on hot ten-micrometer particles from the Chernobyl exclusion zone. Recent reviews on hot particle identification and analysis techniques have been produced in the 2020s. Salbu et al. [31] have presented among the non-destructive ones there is a wide range: SEM with EDX, TEM/STEM with EDX, nano- or micro-XRF, XAFS, XRD, all with and without mapping, micro-X-ray tomography without or with XRF (CT-micro-XRF), and scanning transmission X-ray microscopy (STXM). Zhao et al. [38] included the physical character of hot particles, localization techniques, screening, and extraction, focusing on mass spectrometry technology for hot particle analysis.
X-ray beams provided by synchrotron facilities are ideal for measuring samples with low elemental concentrations and are widely used to study geological and environmental materials. Spectroscopic techniques such as X-ray fluorescence (XRF) or X-ray absorption spectroscopy (XAS) provide information about the elemental composition and distribution, as well as the oxidation state of the element of interest in the sample [39,40]. Hernández-Herrera et al. and Pérez-Reyes et al. [12,30] using XAS confirmed the presence of U+6 in fine sediments (d ≤ 0.037 mm) from SPB.
Micro-X-ray fluorescence computed tomography (CT-µXRF) provides non-destructive information on the composition and structure of geological materials [41]. Recently, the composition and structure of uranium and plutonium particles in silicon matrices, products of nuclear tests or nuclear power plant accidents, have been obtained [42,43].
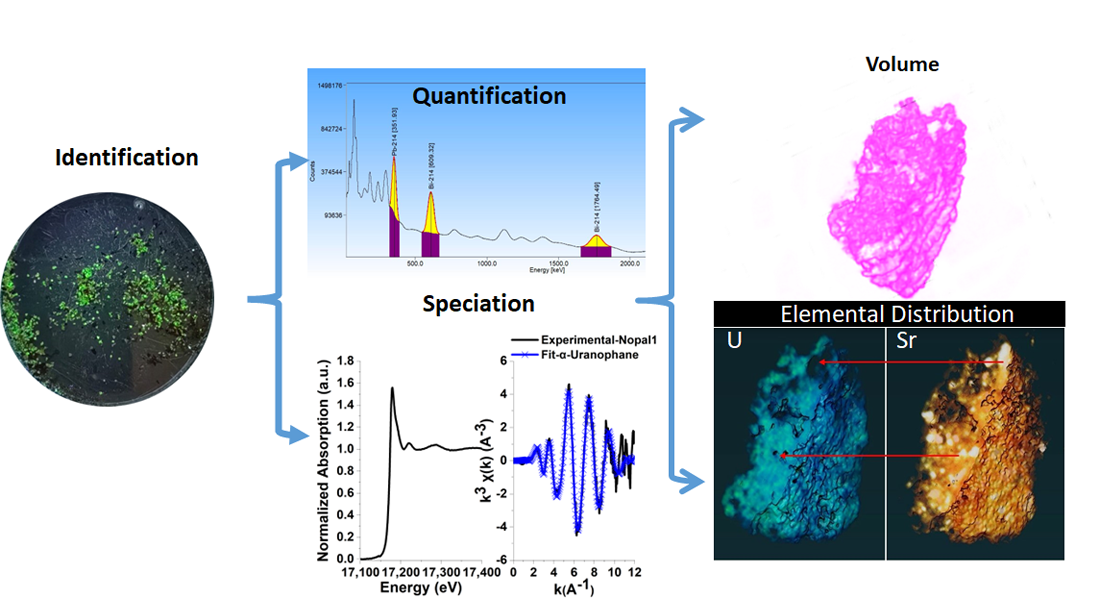
This work investigates the transport of uranium by surface water through the three main streams from the deposits in SPB to Laguna del Cuervo. The activity concentration of the 238U series of the different granulometries of the sediments extracted from the three streams was determined or compiled from previous works [12,27,28]. The particles produced by the fragmentation of the uranium mineral were extracted, by optical fluorescence, from the fine sand fraction of samples from the area. The particles' morphology and elemental composition were analyzed using Focused Ion Beam (FIB) electron microscopy and Scanning Transmission Electron Microscopy (STEM). The particle density in samples close to the uranium sources was quantified by gamma spectrometry. Finally, the mineral phases present in the fluorescent particles were characterized by XAFS and the U distribution in the particle and its matrix was unraveled using CT-µ-XRF.
2. Materials and Methods
2.1. Sampling and Conditioning of Sediments
Forty-eight sediment samples were collected from the tributaries and alluvial fans of the main streams as identified in the study area (Figure 2) and from the drainage pattern of the mining projects. Among those, 27 were sampled from the Peña Blanca stream, the longest on the site, originates from the upper area of SPB, and is part of the drainage pattern of the Peñón Blanco mine. Further, 9 samples were taken from the El Tigre stream, which directly drains the Nopal 3 mine. Another 9 samples were selected from the Boca la Colorada stream, originating near the repository. Finally, two samples were taken from the drainage of the Nopal 1 mine and the last one from the drainage of the Puerto 3 mine.
Sampling was conducted using the guidelines as reported in the ISO standard 18400-102: 2017 [44] for taking samples so that these can subsequently be examined to provide information on soil quality. The sampling frame was 50 cm square, large stones were avoided, and about 5 kg per sample were collected and placed in labeled polypropylene bags. Figure 2 shows the location of the samples in the area of study.
The sediments were classified by their grain sizes, using the subdivision based on the Udden-Wentworth scale [45,46,47], which differentiates four major classes of sediments: coarse sand (CS), fine sand (FSD), coarse silt (CSC), and fine silt + clay (FSC). Vibrational meshing was used at 15-minute intervals, with mesh sizes of 16 (1.19 mm), 50 (0.279 mm), 100 (0.149 mm), 200 (0.074 mm), and 400 (0.037 mm), respectively.
2.1. Characterization of Sediment Samples
2.2.1. X-Ray Diffraction (XRD)
The mineralogical phases of the sediments were determined by X-ray diffraction employing a PANalytical® X’Pert-Pro diffractometer, The Netherlands, at a current of 40 mA and voltage of 40 kV, and using a Cu Kα radiation (λ=1.540560 Å). The 2θ interval was set to 4.9 – 90° with Δ2θ = 0.013°. The obtained patterns were analyzed using the Data Collector® software version 7.2b. For the quantification of the mineral phases, the Rietveld method, as available in the Fullprof suite software [48], was applied.
2.2.2. High-Resolution Gamma Spectrometry on Granulometric Fractions of Sediments
Scintillation and solid-state detectors in gamma spectrometry are used to study environmental radioactivity and radioactive materials in general. The major advantages of gamma spectroscopy are the following: high intrinsic efficiency, non-destructive testing, multi-isotopic analysis, no chemical process for samples, and allowing for the analysis of various types of samples [49].
In the high-resolution spectra of the present work, the following radioisotopes were identified: 238U, 226Ra, 214Pb, 214Bi, and 234Th series in equilibrium with 238U. The activity of 226Ra in equilibrium with its daughters was determined to estimate the activity of 238U via the relative method. Teflon vials (d = 7 cm) sealed with parafilm were used. To ensure secular equilibrium, the vials were left still for 30 days before undergoing measurement, and the spectrum measurement time was set to a minimum of 7 days. To secure good geometry to the detector for samples and the reference materials, 1 cm of sedimentary material was filled into each vial; all samples met this condition.
The following certified reference materials (CRMs) were employed: IAEA-RGU-1 and a mixture of IAEA-RGU-1, IAEA-RGTh-1, and IAEA-RGK-1 in known proportions. The matrix of the CRMs is silicon oxide, and their contents in uranium, thorium and potassium are certified. The details of the calculation procedure for determining the isotopes’ concentrations using the relative method is presented in Appendix A.
High-resolution gamma spectrometry measurements were performed on coaxial germanium detectors HPGe Canberra GC2020 and XtRa Canberra GX1020 with a carbon window. The measurements were carried out using a Canberra Multiport II analyzer and the Genie 2000 software version 3.2.1 to record the spectra. Gamma spectra analysis was performed using bGamma software, version 1.6.2, 2024, BrightSpec N.C., Niel, Belgium. Figure 3 shows the details of a typical spectrum of a sediment sample.
2.3. Selection of Uranium Mineral Particles
The granulometric fraction of 0.279 mm > d > 0.149 mm was examined using a 365 nm ultraviolet light to identify the uranium particles in the samples collected from points near mineralized zones (Figure 4). The identified particles were extracted from the sediment with tweezers.
2.4. Quantification of Uranium Particle Density in Fine Sand by Gamma Spectrometry with a Scintillation Detector
NaI(Tl) detectors for gamma-spectrometry, with lower resolution than HPGe detectors but greater portability and high intrinsic efficiency, are used for measurements where isotopes are present in predominant quantities in the samples. The analysis can be performed using the relative method described in Appendix A.
The density of uranium particles was calculated from the activity concentration of the isotope 214Bi (238U series) obtained with a NaI(Tl) detector and using the relative method. The activity concentration attributable to the mineral particles of the sample under study was compared with a known uranium particle density in a reference sample acquired in the same geometry of the setup. A characteristic spectrum of the samples is presented in Figure 5. A blank and two samples of reference were prepared as follows:
- A fine sand sample was selected from a remote position outside the mine drainage pattern, which displayed the lowest uranium activity concentration in the study area obtained separately by γ-ray spectrometry. This sample is a sediment “blank” with the inherent uranium content of igneous rocks, of activity concentration (1.79 ± 0.02) Bq/g.
- From the fraction with grain size 0.279 mm > d > 1.19 mm of sample APB-11, 3336 particles were identified and extracted according to the procedure mentioned in section 2.3, and the resulting total mass was 0.3764 g. The extracted particles were added to an aliquot of the blank matrix. The mixture was homogenized, placed in a vial, and measured in the same geometry. The added activity due to the particles was 0.26 ± 0.02 Bq. The estimated mass per particle was 0.112 ± 0.001 mg, and the assessed 238U activity per particle was Acteach particle = (0.77 ± 0.06) x 10-4 Bq/part.
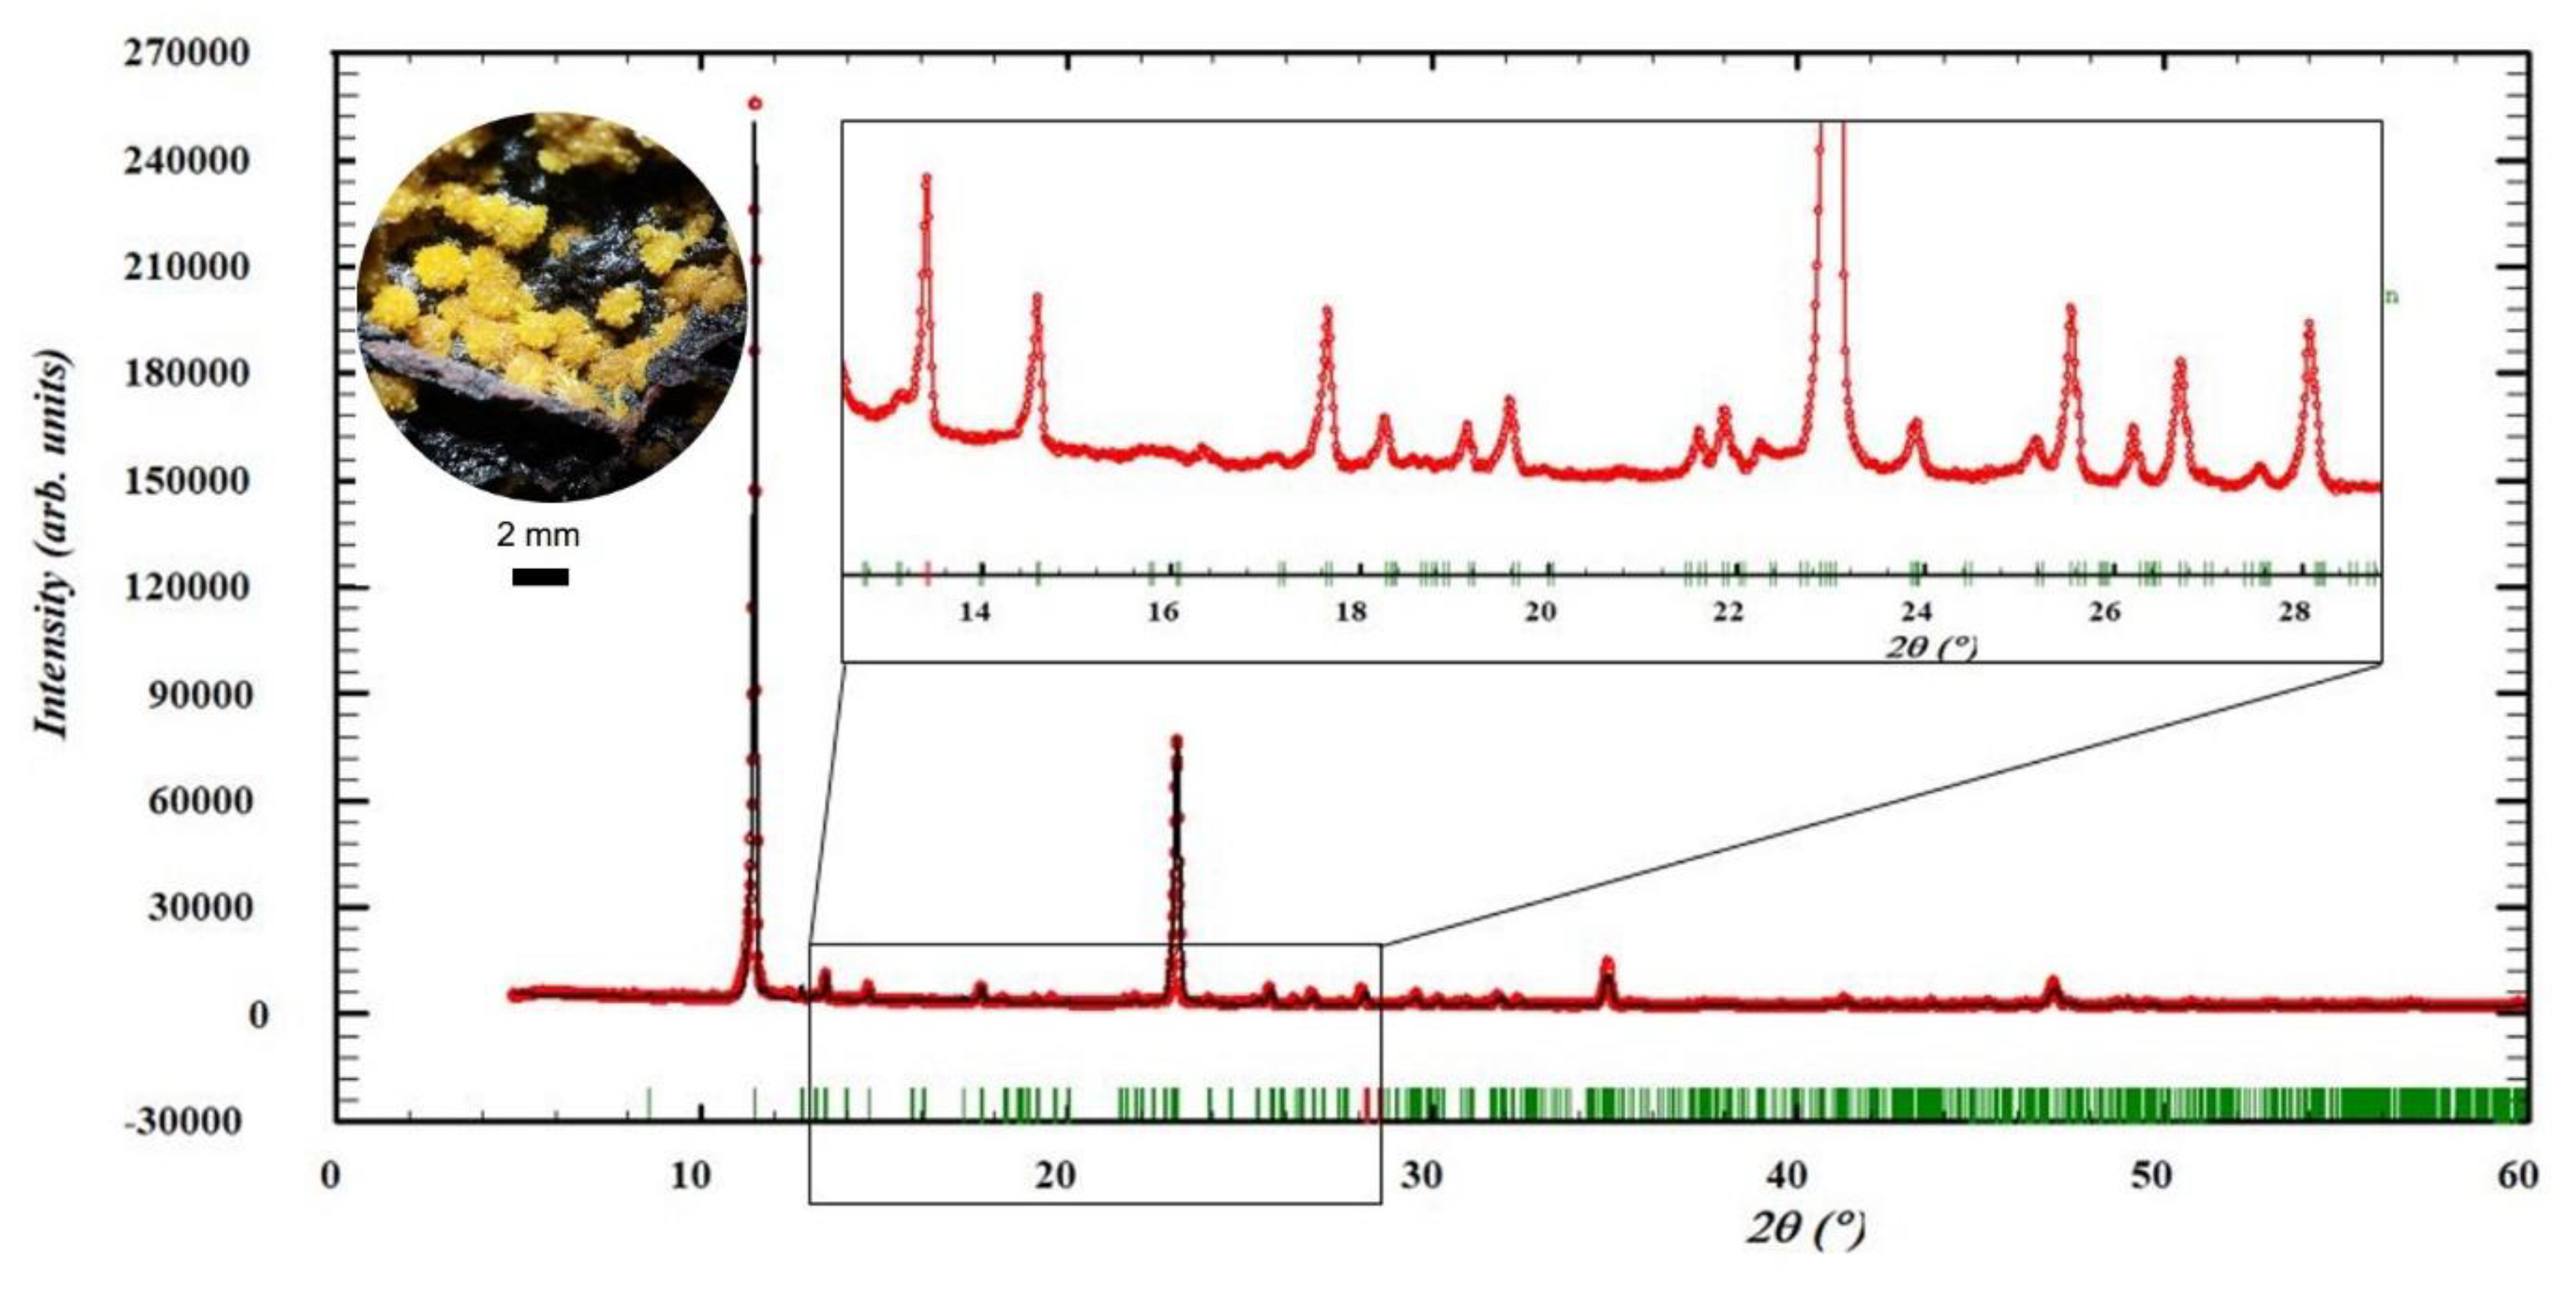
- An activity concentration reference sample was prepared with the same matrix used for the blank. In this case, a mass of 0.9554 g of pure parauranophane crystals extracted from Peña Blanca was added, and its purity was determined by XRD. The diffraction pattern of parauranophane (URP) reference material analyzed by the Rietveld method is presented in Appendix A, Figure A1. The activity of the added 238U was ActURP = 6565 ± 65 Bq.
The reference and blank samples were encapsulated and sealed in polypropylene vials, ensuring a height of 1 cm of material. The particle densities were determined in Tigre 5, APB-11, APB 12, Puerto 3, and Nopal 1-d samples. The sediment samples were also hermetically sealed in vials and measured under the same geometry used to investigate the reference materials. The masses of each sample and the reference materials were documented. To ensure secular equilibrium, the vials were left still for 30 days before undergoing measurement with a Bicron 3M3/3 NaI(Tl) Gamma Detector and a 6 cm of (Pb + inner Cu) shield. The acquisition was accomplished using an Accuspec Canberra card and the Canberra Genie 2000 basic software model S502C. Gamma spectral analysis was performed using the bGamma software, version 1.6.2, 2024, BrightSpec N.C., Niel, Belgium.
The count rate of all measurements was obtained with a relative standard deviation of less than 0.5 %. Appendix A presents the calculation procedure for particle density in the samples.
2.5. Morphology and Composition of Individual Particles
2.5.1. Focused Ion Beam and Scanning-Transmission Electron Microscopes
The analysis followed approximately the procedure reported in Cook et al. [42]. Morphological analysis and elemental composition were obtained on selected particles of the APB-11 sand sample (0.279 mm > d > 1.19 mm) following the method presented in section 2.3. The selected particles were placed in Eppendorf vials and encapsulated in a Mbed-812 resin. The content of the vials was solidified at 60°C for 24 hours. Sections of an individual particle were obtained by cutting the blocks in a JEOL JEM-9320 Focused Ion Beam microscope. Selected sections were then transferred into a JEOL JEM 2200FS+CS TEM instrument operated under the scanning-transmission electron microscope (STEM) mode to determine their morphology and elemental content.
2.5.2. X-Ray Absorption Fine Structure Spectroscopy (XAFS)
X-ray absorption spectroscopy (XAFS) measurements were performed at the I20-scanning beamline of the Diamond Light Source. Particles from the sediment samples taken at Nopal 1, with d < 100 µm, were extracted from the fine sand fraction according to the procedure reported in section 2.3. These particles were assumed to be composed of uranophane to calculate the proper attenuation length, λ = 97 µm, at the energy 17166 eV of the U-LIII absorption edge. The particles were grounded to a powder of grain size < λ, and approximately 50 mg of it was pressed onto a 6 mm diameter pellet with cellulose as a binder. The pellet was placed in a sealed Nalgene® cryovial. At the I20-scanning beamline, it was fixed to a sample holder, and the vial was placed in a cryostat with liquid nitrogen. X-ray absorption spectroscopy measurements were accomplished employing a Si(111) four-bounce monochromator in fluorescence mode, with single scans obtained on each of the 64 elements of the germanium (Ge) detector. The energy interval for each point was ∆E = 0.3 eV from the pre-edge zone to the EXAFS region. Those scans were averaged to get the final spectrum [50]. The normalized absorption signal was obtained using the data reduction analysis available in the IFEFFIT.22 program. XANES (X-ray Absorption Near Edge Structure) and EXAFS (Extended X-ray Absorption Fine Structure) spectra were processed using the Demeter toolkit (ATHENA and ARTEMIS) developed by B. Ravel and M. Newville [51]. In addition, the ARTEMIS FEFF6.0 theoretical modeling code was used to calculate the backscattering phases and amplitudes from neighboring atoms, allowing the fitting of the experimental data to the corresponding theoretical curves.
2.5.3. CT-µXRF at Diamond Synchrotron
2.5.3.1. Sample Preparation
A fluorescent particle was separated from the sand of sample APB-11 and placed on the Kapton® tip of a needle-shaped sample holder. The particle was then covered with EMbed-812 resin and kept at 60°C for 24 hours to solidify. Figure 6 shows the sample holder with the particle.
2.5.3.2. Data Collection at I18 Beamline, Diamond Light Source
The chemical composition of the particle was characterized using µXRF tomography. The data were collected at the I18 beamline at the Diamond Light Source in Oxfordshire, UK. I18 is an undulator beamline with a Si(111) double crystal monochromator, providing an energy resolution of ΔE/E = 1.4 x10⁻⁴ at 10 keV. Kirkpatrick-Baez mirrors focused the beam on the sample to a spot size of 2 x 2 µm². µXRF tomography data were collected using a four-element Si-Drift detector with a 130 eV energy resolution. µXRF tomography was obtained at an incident photon energy of 17.5 keV with an incident photon flux on the sample of roughly 2 x 10¹² photons per second. Each CT slice was collected with 5 µm translation steps and 1° rotation step. After each slice, the sample was translated 5 µm in the vertical direction, and the slice data collection was repeated until most of the particle volume CT dataset was measured. The obtained XRF spectra were processed using PyMCA 5.4.1 [52]. The tomography reconstructions were automatically processed using a Jupyter© Notebook Python script with the TomoPy plugin [53].The data were further processed with Fiji [54] and visualized with the Dawn software [55] and Avizo [56].
3. Results
3.1. X-Ray Diffraction
The crystalline phases of the samples issued from the fine silt + clay fraction of the Peña Blanca stream were identified. Those include quartz, calcite, potassium feldspars (sanidine, albite, anorthite), magnetite, and clays such as montmorillonite and kaolinite. The concentration of minerals in the samples varies along the stream. Table 1 shows some representative examples of the phases identified in the fine silt + clay fractions of sediments from the SPB streams. Figure 7 presents a characteristic XRD pattern modeled with FullProf by the Rietveld method.
The most abundant mineral in the area is quartz, which represents more than 20% of the present phases in most cases. Feldspars such as albite, sanidine, and anorthite are also observed. As these feldspars form solid solutions, their composition may vary slightly, complicating their identification and modeling using the Rietveld method.
The identified phases are consistent with those described by Hernández-Hernández and Pérez-Reyes et al. [28,29] in the Boca la Colorada stream and Rodríguez-Guerra [27] in the El Tigre stream. The mineral phases identified in the streams' sediments agree with those described by Reyes-Cortés and Cárdenas-Flores [6,7].
The site's extrusive igneous rocks contain minerals such as quartz, feldspars argillitized to kaolinite, and alunite. Quartz veinlets and clay minerals of the Montmorillonite and the Kaolin groups are also observed in the Escuadra formation. The Nopal formation contains quartz and sanidine crystals, hematite, calcite (in veinlets), biotite, and pyrite [6].
3.2. High-Resolution Gamma-Ray Spectrometry
The activity concentrations (AConc) were determined by gamma spectrometry for the different particle sizes of the sediment samples studied. The highest and lowest AConc for the Peña Blanca, El Tigre [27], and Boca la Colorada [28] streams are shown in Table 2.
The AConc values obtained show that the concentrations of the isotope 214Pb, in equilibrium with 226Ra, are related to the distance between the sampling point and the mining projects and/or mineralized geological formations. In the Peña Blanca stream, this is most clearly observed in the AConc of fine silt + clay: the highest AConc corresponds to those close to mining projects in their drainage patterns, and the lowest AConc is found in the alluvial fan of the stream, close to Laguna del Cuervo. These results are consistent with what was reported in the other SPB streams [27,28] and as described above, where the AConc is higher at points close to the mines and lower at the end of the alluvial fans.
Examination of the activity concentration results concerning the location of sampling points with respect to uranium sources and the results of Pérez-Reyes et al. [29] and Pérez-Reyes et al [30] suggested the importance of studying fragmented material produced by the weathering of uranium ore. This study is presented in the following sections.
3.3. Quantification of Uranium Particle Density
The density of uranium particles was assessed for five selected samples from the study area. Figure 8 shows the location of samples relative to the streams and the sources of uranium minerals. The particle density results are presented in Table 3.
Sample Puerto 3 is located in the drainage pattern of the Margaritas mine (open pit) and the Puerto 3 underground mine. Sample Nopal 1-d was extracted from a tributary with water and sediment input from the Nopal 1 deposit, one of the most important in SPB. Sample Tigre 5, the one with the lowest particle density, belongs to the El Tigre stream bed and is not directly influenced by any mining project. Samples APB-11 and APB-12 are located on the Peña Blanca stream, approximately 100 m and 1 km from the Peñón Blanco mining project. In these last three samples, it was observed that the proximity of the samples to the mining projects scales with the particle density.
3.4. Morphology and Composition of Individual Particles
Weathered U mineral particles from the fine sand collected at APB-11 were chosen for morphological and elemental analyses, which also allowed for probing the particle’s matrix. Several particles were extracted by the procedure described in section 2.3 and prepared for each high-resolution experiment by the procedures described in sections 2.5.1, 2.5.2, and 2.5.3.1.
3.4.1. Microscopic Characterization of Fragmented Mineral Particles by FIB-STEM
Figure 9(a) shows the cut made in the particle using the FIB technique. STEM analysis (Figure 9(b)) confirmed the elemental content, which was similar to that of the sediments. Figure 10 presents the elemental spectrum obtained by STEM.
The elemental analysis of the sample revealed the presence of elements such as O and Si, which suggests that the particle matrix is primarily composed of quartz (SiO2) (Figure 9b). Additionally, elements such as Ga, Au, and Fe were detected. Because of the spatial distribution found for Ga and Au, it is most likely that these elements are contaminations produced by the FIB cutting process and sample preparation artifacts. Iron (Fe) is concentrated in some regions of the sample and may be part of the matrix, potentially as hematite (Fe2O3) or magnetite (Fe3O4) (Figure 9b).
Quartz was previously reported in the sediments of the region by Hernández-Hernández and Pérez-Reyes et al. [28,29]in the Boca la Colorada stream and by Rodríguez-Guerra [27] in the El Tigre stream. Magnetite was documented in the Boca la Colorada stream by Pérez-Reyes et al. [29]. Both phases were identified in this study through X-ray diffraction (XRD) (Table 1). The analyzed sample section did not reveal any presence of U or Th; however, this does not imply that these elements are not present in these minerals, as the cut was made in the selected particle envelope.
3.4.2. X-Ray Absorption Fine Structure Spectroscopy (XAFS)
X-ray Absorption Spectroscopy (XAS) measurements were undertaken to unravel the environment and speciation of U in fragmented mineral particles from the Nopal 1 sample at the U-LIII edge. Extended X-ray Absorption Fine Structure (EXAFS) was used to identify the mineralogical phase. At the same time, X-ray Absorption Near Edge Structure (XANES) was employed to distinguish between U(IV) and U(VI) species.
Figure 11 (a) shows the normalized absorption spectrum of the particles from sample Nopal 1. The XANES spectrum exhibits a key feature: the white line is positioned at 17177.7 eV, with the inflection point E0 at 17174.2 eV. A minor peak appears 2 eV after the white line, along with an oscillation at 17218 eV. These spectral features are characteristic of the U(VI) oxidation state, as reported by Bes et al. and Catalano et al. [57,58].
The determination of U(VI) in the particles provides insight into the transport mechanism to which uranium is subjected. Lloyd et al. [59] mention that the U(IV) species is of low solubility, less bioaccessible, and less mobile than the U(VI) species, which exhibit higher solubility.
The uranophane structural model [60] was applied to fit the EXAFS experimental spectrum of the particulate mineral sample. Figure 11c,d present the Fourier transforms, k³-weighted EXAFS spectra, and corresponding fits for the Nopal 1 sediment sample. The peaks around 1.3 - 1.8 Å are typically attributed to backscattering from the oxygen atoms closest to uranium (U_Oax), while the peaks at a bond distance around 2.3 - 1.8 Å correspond to the five equatorial oxygen atoms (5U-Oeq). A peak at 3.1 Å is assigned to backscattering from the nearest silicon neighbor. The best-fit parameters are summarized in Table 4. The parameters represent the usual "path" [58] corresponding to the interatomic distances in the crystal structure of uranophane. Pérez-Reyes et al. [30] identified the uranophane phase in typical regional sediments. Figure 11 (d) shows the main undulations in the k-space from 2 to 10 k(A⁻¹). These features align with previous results reported by Catalano et al., Kelly, and Brown et al. [58,61,62] for uranophane.
3.4.3. X-Ray Fluorescence MicroTomography (CT-µ-XRF)
The fluorescent particle separated from sample APB-11 was analyzed by CT-µ-XRF at beamline I18 at the Diamond Light Source. The fluorescence spectra obtained at each rotation were examined and fitted, allowing for the identification of the sample's elemental composition as obtained for an excitation energy of 17.5 keV.
The following main elements were found in the selected particle, as visible in Figure 12: Cl, K, Ca, Ti, Cr, Mn, Fe, Co, Cu, Zn, Ga, As, Br, Rb, Sr, Y, Pb, and U. As the analysis was performed under ambient conditions, and that Ar is a component of air, the detection of lower Z elements, such as Si, was impaired as strongly absorbed by the air present between the sample and the detector. Finding Si was expected as part of the matrix of the particle, but even though Si lines were detected in the spectrum, these are not reliable as the XRF detector itself is also made of silicon. The elements that were of particular geological significance and which presented the most intense X-ray lines in the spectrum, i.e., Fe-Kα, Sr-Kα, and U-Lα were selected, their volume reconstructed, and some representative slices of this volume extracted.
The spatial distribution of strontium in the particle is essential in this research. As an alkaline earth element, Sr may replace Ca in natural matrices, suggesting the presence of Ca and Sr crystalline phases in the samples. According to Thompson and Chow [63], Sr contents in marine organisms have been investigated since the 19th century. Turekian and Kulp [64] presented the geochemistry of Sr in 1956. Montero et al. [65] determined the Sr/Ca mass ratio in quaternary paleoclimate geological samples and related these ratios to the temperature at which the samples were precipitated and formed.
Figure 13 displays different virtual cross-sections extracted from the particle's reconstructed volume and illustrates the spatial distribution of uranium within these slices. Iron (Fe) appears to encapsulate uranium (U), suggesting its integration into the particle matrix. This observation is consistent with the STEM results (see Figure 9b).
The Supplementary Information contains three videos of the uranium content in the particle volume. The file "U_Sr_slices.mpg" presents each slice successively, one by one. The file "U_Sr_particle_slicing.mpg" successfully presents the slices' superposition until the volume is formed. The file "U_Sr_particle_rotation.mpg" presents the volume of the particle rotating on a vertical axis. In the last two videos, the blue color corresponds to U, and the orange color represents Sr. Figure 14 compares two rotations of the reconstructed volumes.
Considering that Sr replaces Ca in natural compounds, the Sr detected in the same positions in the reconstructed volume as U in Figure 13 and Figure 14 suggests that Sr is incorporated into uranophane (Ca(UO2)2(SiO3OH)2·5H2O) within the particle. The areas of greater Sr intensity suggest the presence of calcite (CaCO₃) in the matrix that surrounds or is entangled in the particle.
The fluorescent particle selected from the APB-11 sample exhibits results consistent with EXAFS data (Figure 12) obtained for particles from the Nopal 1 sample, where the primary uranium-bearing phase was identified as uranophane. Faudoa [9] previously reported the presence of uranophane, accompanied by parauranophane and weeksite, in the Nopal 1 mine.
4. Discussion
This study raises the importance of characterizing the uranium mineral particles found in the fine sand fraction originating from the main streams near the mining projects of the Peña Blanca mining district. These characteristics impact the environmental implications of the uranium particles, depending on the climatic conditions to which they are exposed.
The characterization of the finest fraction of fine silt + clay by XRD (section 3.1) confirmed that quartz and potassium feldspars are the most abundant mineral phases [27,28,29]. This agrees with the geology reported by [6,7]: the area mainly presents volcanic rocks (tuffs) of felsic composition, with minerals such as quartz, feldspars, and iron oxides. Clay minerals such as kaolinite and montmorillonite were also found. These clays are important due to their capacity to adsorb uranium in their structure. [30] reports an equilibrium value of 44.8 mgU/g as the upper limit for sediments' uranyl ion adsorption capacity in the study area. Furthermore, [30] indicates that uranyl ions precipitate under neutral to alkaline conditions. In the case of the fragmented mineral under study, it can be argued that, in the case of dissolution of these particles, uranium could be transported in solution and eventually adsorbed on clay minerals in the area under reducing conditions.
The estimation of particle density per gram in fine sand (0.279 mm > d > 1.19 mm), through the concentration of activity of the 238U – 226Ra disintegration chain (section 3.3), showed that they have a direct relationship with the distance of the sampling point in the drainage pattern to the mining projects. The analysis of the activity concentration of 214Pb in the Peña Blanca stream (section 3.2) suggests that the fine silt + clay particle size fraction is consistent with the concentration in fine sand. The relationship between each sample and its location in relation to the mining projects is observed again. The sample with the highest particle concentration is Puerto 3 (2500±250 part./g). This sample is located in the drainage pattern of the Margaritas mines (open pit) and Puerto 3 (underground). The results found for both particle sizes agree with the authors' activity concentrations reported in the El Tigre and Boca la Colorada streams [27,28].
The presence of uranium-containing particles in the environment, resulting from accidents, nuclear tests, or natural processes like those studied here, is relatively common. A morphological analysis of these particles reveals differences depending on their origin. In the case of natural particles, irregular shapes are observed, as noted in section 3.4.3. Particles originating from nuclear accidents, such as those from Fukushima [38,43,66] and Chernobyl [67], exhibit a morphology similar to the ones presented in this study. However, particles from nuclear tests display a semi-spherical shape [68].
The uranium mineral in the form of fine particles corresponds to the uranophane phase (Ca(UO2)2(SiO3OH)2·5H2O) with oxidation state U(VI). Schindler et al. [16] report that uranium can be retained for millions of years within opal and microcrystalline quartz assemblages, so the presence of this mineral in a silicon matrix accompanied by elements such as Sr and Fe explains why there are no high concentrations of activity in samples far from uranium sources. This matrix type does not present a high dissolution because uranium is unavailable for transport in solution or very little available. The environmental implications of having uranium in this type of natural matrix are described by Byrnes et al. and Johansen et al. [68,69]. The possible release of uranium from this type of particle into the environment, although not a cause for concern in the short term, could be, especially if reducing conditions for the precipitation and concentration of this element are given in places where it is available for living organisms.
5. Conclusions
In this work, uranium mineral particles were extracted, quantified, and characterized in morphology and speciation from the fine sand in the drainages of the main uranium deposits of SPB. The concentration of 238U activity decreases as the sampling point moves away from the main streams towards Laguna del Cuervo.
Using gamma spectrometry, the density of particles in the sediments of that fraction was estimated, and it was shown that the concentration of mineral particles is higher in the areas close to the mining projects.
The analysis of the composition and morphology of the uranium particles by FIB+STEM showed the predominance of Si in the matrix that surrounds or is imbricated with the uranium. The analysis by XANES and EXAFS clarified the U(VI) oxidation state in the form of uranophane. By CT-µ-XRF, it was observed that Sr is part of the matrix of the sample and of the fragmented uranium mineral. The presence of Sr in the same volume as U suggests that this element replaces Ca in the uranophane structure (Ca(UO2)2(SiO3OH)2·5H2O). The mineral is covered by a matrix with abundant Si, Ca, and some Fe. The morphology and composition of the particles are in agreement with the geology and characterization of the uranium minerals in SPB, described by various authors, who mention uranophane as the most abundant uranium mineral in the deposit and the silicates and aluminosilicates of the igneous rocks in the sediments.
The fragmented uranophane in the particle surrounded by a matrix of Si, Ca, Sr, and Fe explains why the concentration of 238U activity in the sediments of the areas near the mines is high and decreases as they approach the flood plain. This provides the reason for the low dissolution of the uranium mineral. On the other hand, it is known that if the water encounters structural barriers and reducing conditions, such as the organic matter of the floodplain, U can be adsorbed or precipitated eventually at isolated points. In conclusion, the transport of uranium minerals through the drainage pattern of the area is fragmented in the form of particles, and the water does not carry high concentrations of activity. Uranium in stagnant rainwater under special conditions can be adsorbed or precipitated.
Supplementary Materials
The following supporting information can be downloaded at: Preprints.Org, Uranium mineral particles SPB.rar: Video S1: U_Sr_slices.mpg; Video S2: U_Sr_particle_slicing.mpg; Video S1: U_Sr_particle_rotation.mpg.
Author Contributions
Conceptualization, C.H.-H. and M.E.M.-C.; methodology, C.H.-H., Y.R.-G., V.P.-R., F.G.F.-G., and R.M.C.-L; validation, C.H.-H., M.E.M.-C., and J.G.C.-T..; formal analysis, C.H.-H., Y.R.-G., V.P.-R., F.G.F.-G. and J.G.C.-T.; investigation, C.H.-H., Y.R.-G., V.P.-R., F.G.F.-G., H.E.E.-P., R.M.C.-L and K. I.; writing—original draft preparation, C.H.-H., F.G.F.-G., D. M. E., J.G.C.-T. and M.E.M.-C.; writing—review and editing, C.H.-H., K. I., D. M. E., H.E.E.-P., J.G.C.-T. and M.E.M.-C. .; project administration M.E.M.-C.; funding acquisition, M.E.M.-C. All authors have read and agreed to the published version of the manuscript.
Funding
This research was funded by the CONAHCYT research project CF/2019 10853.
Data Availability Statement
Data are contained within the article, and the associated materials are in the Appendix and Supporting Information.
Acknowledgments
The authors thank CONAHCYT for funding the CF/2019 10853 project. This work was published with the support of the Institute of Innovation and Competitiveness of the Ministry of Innovation and Economic Development of the State of Chihuahua. We extend our thanks to Jorge Carrillo Flores, Oscar Omar Solís Canto, César Cutberto Leyva Porras, Marco A. Ruíz Esparza Rodríguez, Rene Emmanuel Parada Barrios, Roal Torres Sánchez and Andrés Isaak González Jáquez from CIMAV, to Ignacio A. Reyes Cortés from Universidad Autónoma de Chihuahua, as well as to J.F.W. Mosselmans from Diamond Light Source for their technical and scientific support. The XAFS and CT-µ-XRF measurements were conducted as part of proposals SP31873 and SP38007 at beamlines I20-scanning and I18 of Diamond Light Source, UK. We sincerely appreciate their assistance.
Conflicts of Interest
The authors declare that the research was conducted in the absence of any commercial or financial relationships that could be construed as a potential conflict of interest.
Abbreviations
The following abbreviations are used in this manuscript:
| SPB | Sierra Peña Blanca |
| XRD | X-ray diffraction |
| ICP-OES | Inductively coupled plasma atomic emission spectroscopy |
| FIB | Focused ion beam microscopy |
| STEM | Scanning transmission electron microscopy |
| XAFS | X-ray absorption spectrometry |
| XANES | X-ray Absorption Near Edge Structure |
| EXAFS | Extended X-ray Absorption Fine Structure |
| CT-µ-XRF | X-ray fluorescence microtomography |
| CIMAV | Centro de Investigación en Materiales Avanzados |
| SEM | Scanning electron microscopy |
| EDS | Energy dispersive X-ray spectroscopy |
| RM | Rietveld method |
| Ab | Albite |
| An | Anorthite |
| Cal | Calcite |
| Hly | Halloysite |
| Kln | Kaolinite |
| Mag | Magnetite |
| Mnt | Montmorillonite |
| Ms | Muscovite |
| Or | Orthoclase |
| Qz | Quartz |
| Sa | Sanidine |
| DL | Detection Limit |
Appendix A. Details of the Mineral Particles Characterization
Appendix A.1. XRD Pattern of Parauranophane.
Figure A1.
Diffraction pattern of pure parauranophane, with a Rietveld method fitting. Observe the counting statistics. The high-intensity peaks correspond to the (020), (040), (060) and (080) family planes. The inset stereomicroscopy image shows the druses of parauranophane crystals (Microscope ME Zeiss Stemi DV4). The diffraction inset shows a zoom of the weaker peaks in the magnified range.
Appendix A.2. Calculation of Activities of the Isotopes 214Pb and 214Bi by the Relative Method in the HPGe and XtRa Spectrometers
The lines of 214Pb (351.93 keV) and 214Bi (609.51 and 1764.49 keV) were used. The calculation by the relative method is based on the following expressions [49]
R0 is the net count rate of a line in the gamma spectrum of the given sample or a reference one. When the laboratory background rate is subtracted, Rsample and RBG are the sample and background rates, respectively.
Appendix A.3. Calculation of Particle Concentration in Sediment Samples in the NaI(Tl) Detector
R0 is the net count rate of the line in the gamma spectrum from any given sample. Rsample is the count rate of the sample, and Rblank is the count rate of the igneous matrix. The blank represents the activity of the sediments of igneous origin, which, being part of the sample, must be proportionally subtracted from their contribution to obtain the contribution in each case of the “pure uranophane” (URP, from the reference sample) or of the “pure particles” (unknown). To do this, the blank count rate corrected by the mass of the sample is subtracted.
URP activity of the unknown sample:
Number of particles in an unknown sample =
Appendix B. Additional XRD Results

Table B1.
Mineral phase concentrations in different fractions of sediments and mud. Generic identification of each stream in the area: Peña Blanca stream (APB), El Tigre stream (AET), and Boca la Colorada stream (ABLC). Generic identification of each granulometry of sediments: Fine sand (FSD), Coarse silt + clay (CSC), Fine silt + clay (FSC).
| Location | Total number of samples | Type | Mineral Phase (%) | |||||||
|---|---|---|---|---|---|---|---|---|---|---|
| Qz | Cal | Mnt | Mag | Ab | Sa | Kln | An | |||
| APB This work |
19 | FSC | X | X | X | X | X | X | X | X |
| AET Rodríguez- Guerra [27] |
9 | FSD | ||||||||
| CSC | ||||||||||
| FSC | X | X | X | X | X | X | X | X | ||
| ABLC Hernández- Hernández [28] |
7 | FSD | X | X | X | X | X | |||
| CSC | X | X | X | X | X | |||||
| FSC | X | X | X | X | X | X | ||||
| ABLC Pérez- Reyes [29] |
4 | Mud | X | X | X | X | X | X | ||
References
- Angiboust, S.; Fayek, M.; Power, I.M.; Camacho, A.; Calas, G.; Southam, G. Structural and Biological Control of the Cenozoic Epithermal Uranium Concentrations from the Sierra Peña Blanca, Mexico. Miner. Deposita 2012, 47, 859–874. [CrossRef]
- Alvarez, M. PROVINCIAS FISIOGRAFICAS DE LA REPUBLICA MEXICANA. Bol. Soc. Geológica Mex. 1961, 3–20.
- INEGI Síntesis de Información geográfica del estado de Chihuahua. 2003.
- CONAGUA Actualización de La Disponibilidad Media Anual de Agua En El Acuífero Laguna de Hormigas (0824), Estado de Chihuahua 2020.
- Goodell, P.C. Chihuahua City Uranium Province, Chihuahua, Mexico. Uranium Depos. Volcan. Rocks Proc. Tech. Comm. Meet. Uranium Depos. Volcan. Rockss El Paso TX USA 1984, 97–124.
- Reyes-Cortés, M. Chihuahua City Uranium Province, Chihuahua, Mexico. Deposito Molibdeno Asoc. Con Uranio En Peña Blanca México 1984, 161–174.
- Cárdenas-Flores, D. Volcanic Stratigraphy and U-Mo Mineralization of the Sierra de Peña Blanca District, Chihuahua, México. IAEA 1985.
- Dobson, P.F.; Fayek, M.; Goodell, P.C.; Ghezzehei, T.A.; Melchor, F.; Murrel, M.T.; Oliver, R.; Reyes-Cortés, I.A.; De La Garza, R.; Simmons, A. Stratigraphy of the PB-1 Well, Nopal I Uranium Deposit, Sierra Peña Blanca, Chihuahua, Mexico. Int. Geol. Rev. 2008, 50, 959–974.
- Faudoa, F.G. Modelo de La Evolución de Las Especies Minerales Superficiales de Uranio de La Sierra Peña Blanca, Chihuahua, México. Master´s Thesis, Centro de investigación en Materiales Avanzados: Chihuahua, Chihuahua, 2023.
- George-Aniel, B.; Leroy, J.L.; Poty, B. Volcanogenic Uranium Mineralizations in the Sierra Pena Blanca District, Chihuahua, Mexico; Three Genetic Models. Econ. Geol. 1991, 86, 233–248. [CrossRef]
- Schmidt, R.H. A Climatic Delineation of the ‘Real’ Chihuahuan Desert. J. Arid Environ. 1979, 2, 243–250. [CrossRef]
- Hernandez Herrera, C.; Canche Tello, J.G.; Cabral Lares, R.M.; Rodriguez Guerra, Y.; Perez Reyes, V.; Faudoa Gomez, F.G.; Esparza Ponce, H.E.; Reyes Cortez, I.A.; Hernandez Cruz, D.; Loredo Portales, R.; et al. Interpretation of X-ray Absorption Spectra by Synchrotron Radiation of the Uranium Mineral Species Transported by the Main Stream “El Tigre”, in Peña Blanca, Chihuahua, Mexico. Supl. Rev. Mex. Física 2024, 5. [CrossRef]
- Nichols, G. Sedimentology and Stratigraphy; 2. ed., [Nachdr.].; Wiley-Blackwell: Chichester, 2010; ISBN 978-1-4051-3592-4.
- Guzmán-Martínez, F.; Arranz-González, J.-C.; Tapia-Téllez, A.; Prazeres, C.; García-Martínez, M.-J.; Jiménez-Oyola, S. Assessment of Potential Contamination and Acid Drainage Generation in Uranium Mining Zones of Peña Blanca, Chihuahua, Mexico. Environ. Monit. Assess. 2023, 195, 386. [CrossRef]
- Schindler, M.; Fayek, M.; Hawthorne, F.C. Uranium-Rich Opal from the Nopal I Uranium Deposit, Peña Blanca, Mexico: Evidence for the Uptake and Retardation of Radionuclides. Geochim. Cosmochim. Acta 2010, 74, 187–202. [CrossRef]
- Schindler, M.; Fayek, M.; Courchesne, B.; Kyser, K.; Hawthorne, F.C. Uranium-Bearing Opals: Products of U-Mobilization, Diffusion, and Transformation Processes. Am. Mineral. 2017, 102, 1154–1164. [CrossRef]
- Dawood, Y. Factors Controlling Uranium and Thorium Isotopic Composition of the Streambed Sediments of the River Nile, Egypt. J. King Abdulaziz Univ.-Earth Sci. 2010, 21, 77–103. [CrossRef]
- Chabaux, F.; Bourdon, B.; Riotte, J. Chapter 3 U-Series Geochemistry in Weathering Profiles, River Waters and Lakes. In Radioactivity in the Environment; Elsevier, 2008; Vol. 13, pp. 49–104 ISBN 978-0-08-045012-4.
- Bosia, C.; Chabaux, F.; Pelt, E.; France-Lanord, C.; Morin, G.; Lavé, J.; Stille, P. U–Th–Ra Variations in Himalayan River Sediments (Gandak River, India): Weathering Fractionation and/or Grain-Size Sorting? Geochim. Cosmochim. Acta 2016, 193, 176–196. [CrossRef]
- Adams, J.A.S. The Uranium Geochemistry of Latten Volcanic National Park, California. Geochim. Cosmochim. Acta 1955, Volume 8, Pages 74-85. [CrossRef]
- Hurley, P.M. DIRECT RADIOMETRIC MEASUREMENT BY GAMMA-RAY SCINTILLATION SPECTROMETER: PART I: URANIUM AND THORIUM SERIES IN EQUILIBRIUM. Bull. Geol. Soc. Am. 1956, 67, 395–404. [CrossRef]
- Hurley, P.M. DIRECT RADIOMETRIC MEASUREMENT BY GAMMA-RAY SCINTILLATION SPECTROMETER: PART II: URANIUM, THORIUM, AND POTASSIUM IN COMMON ROCKS. Bull. Geol. Soc. Am. 1956, 67, 405–412. [CrossRef]
- Adams, J.A.S.; Richardson, J.E.; Templeton, C.C. Determinations of Thorium and Uranium in Sedimentary Rocks by Two Independent Methods. Geochim. Cosmochim. 1958, Vol. 13, 270 to 279. [CrossRef]
- Mero, J.L. USES OF THE GAMMA-RAY SPECTROMETER IN MINERAL EXPLORATION. GEOPHYSICS 1960, 25, 1054–1076. [CrossRef]
- CNSNS Comision Nacional de Seguridad Nuclear y Salvaguardias: 1965. p. P 67.
- Colmenero S., L.; Montero C., M.E.; Villalba, L. Natural Radioactivity in Soils of the Main Cities of the State of Chihuahua; Radiactividad Natural En Suelos de Las Principales Ciudades Del Estado de Chihuahua.; Guadalajara, México, July 2003; p. 8 pages.
- Rodríguez- Guerra, Y. Transporte de Isótopos Radiactivos de La Serie Del Uranio Desde Peña Blanca Hasta Laguna Del Cuervo a Través Del Arroyo El Tigre, Chihuahua. Master´s Thesis, Centro de investigación en Materiales Avanzados: Chihuahua, Chihuahua, 2023.
- Hernández-Hernández, D. Transporte y Equilibrio Radioactivo Del Uranio Desde El Yacimiento de Peña Blanca Hasta Laguna Del Cuervo, Chihuahua. Master´s Thesis, Centro de investigación en Materiales Avanzados: Chihuahua, Chihuahua, 2019.
- Pérez-Reyes, V.; Cabral-Lares, R.M.; Méndez-García, C.G.; Caraveo-Castro, C.D.R.; Reyes-Cortés, I.A.; Carrillo-Flores, J.; Montero-Cabrera, M.E. Transport and Concentration of Uranium Isotopes in the Laguna Del Cuervo, Chihuahua, Mexico. Supl. Rev. Mex. Física 2022, 3. [CrossRef]
- Pérez-Reyes, V.; Cabral-Lares, R.M.; Canche-Tello, J.G.; Rentería-Villalobos, M.; González-Sánchez, G.; Carmona-Lara, B.P.; Hernández-Herrera, C.; Faudoa-Gómez, F.; Rodríguez-Guerra, Y.; Vázquez-Olvera, G.; et al. Uranium Mineral Transport in the Peña Blanca Desert: Dissolution or Fragmentation? Simulation in Sediment Column Systems. Appl. Sci. 2025, 15, 609. [CrossRef]
- Salbu, B.; Lind, O.C. Analytical Techniques for Charactering Radioactive Particles Deposited in the Environment. J. Environ. Radioact. 2020, 211, 106078. [CrossRef]
- Lind, O.C.; Salbu, B.; Janssens, K.; Proost, K.; García-León, M.; García-Tenorio, R. Characterization of U/Pu Particles Originating from the Nuclear Weapon Accidents at Palomares, Spain, 1966 and Thule, Greenland, 1968. Sci. Total Environ. 2007, 376, 294–305. [CrossRef]
- Pöllänen, R.; Ketterer, M.E.; Lehto, S.; Hokkanen, M.; Ikäheimonen, T.K.; Siiskonen, T.; Moring, M.; Rubio Montero, M.P.; Martín Sánchez, A. Multi-Technique Characterization of a Nuclearbomb Particle from the Palomares Accident. J. Environ. Radioact. 2006, 90, 15–28. [CrossRef]
- Jiménez-Ramos, M.C.; Hurtado, S.; Chamizo, E.; García-Tenorio, R.; León-Vintró, L.; Mitchell, P.I. 239 Pu,240 Pu, and241 Am Determination in Hot Particles by Low Level Gamma-Spectrometry. Environ. Sci. Technol. 2010, 44, 4247–4252. [CrossRef]
- Sancho, C.; García-Tenorio, R. Radiological Evaluation of the Transuranic Remaining Contamination in Palomares (Spain): A Historical Review. J. Environ. Radioact. 2019, 203, 55–70. [CrossRef]
- López, J.G.; Jiménez-Ramos, M.C.; García-León, M.; García-Tenorio, R. Characterisation of Hot Particles Remaining in Soils from Palomares (Spain) Using a Nuclear Microprobe. Nucl. Instrum. Methods Phys. Res. Sect. B Beam Interact. Mater. At. 2007, 260, 343–348. [CrossRef]
- Raiwa, M.; Büchner, S.; Kneip, N.; Weiß, M.; Hanemann, P.; Fraatz, P.; Heller, M.; Bosco, H.; Weber, F.; Wendt, K.; et al. Actinide Imaging in Environmental Hot Particles from Chernobyl by Rapid Spatially Resolved Resonant Laser Secondary Neutral Mass Spectrometry. Spectrochim. Acta Part B At. Spectrosc. 2022, 190, 106377. [CrossRef]
- Zhao, G.; Shao, Y.; Luo, M.; Xu, D.; Li, D.; Liu, Z.; Ma, L. Research Progress on the Analysis and Application of Radioactive Hot Particle. J. Environ. Radioact. 2023, 270, 107313. [CrossRef]
- Price, S.W.T.; Ignatyev, K.; Geraki, K.; Basham, M.; Filik, J.; Vo, N.T.; Witte, P.T.; Beale, A.M.; Mosselmans, J.F.W. Chemical Imaging of Single Catalyst Particles with Scanning μ-XANES-CT and μ-XRF-CT. Phys. Chem. Chem. Phys. 2015, 17, 521–529. [CrossRef]
- Diaz-Moreno, S. XAFS Data Collection: An Integrated Approach to Delivering Good Data. J. Synchrotron Radiat. 2012, 19, 863–868. [CrossRef]
- Nascimento-Dias, B.L.; Araujo, O.M.O.; Machado, A.S.; Oliveira, D.F.; Anjos, M.J.; Lopes, R.T.; Assis, J.T. Analysis of Two Meteorite Fragments (Lunar and Martian) Using X-Ray Microfluorescence and X-Ray Computed Microtomography Techniques. Appl. Radiat. Isot. 2019, 152, 156–161. [CrossRef]
- Cook, M.; Etschmann, B.; Ram, R.; Ignatyev, K.; Gervinskas, G.; Conradson, S.D.; Cumberland, S.; Wong, V.N.L.; Brugger, J. The Nature of Pu-Bearing Particles from the Maralinga Nuclear Testing Site, Australia. Sci. Rep. 2021, 11, 10698. [CrossRef]
- Martin, P.G.; Louvel, M.; Cipiccia, S.; Jones, C.P.; Batey, D.J.; Hallam, K.R.; Yang, I.A.X.; Satou, Y.; Rau, C.; Mosselmans, J.F.W.; et al. Provenance of Uranium Particulate Contained within Fukushima Daiichi Nuclear Power Plant Unit 1 Ejecta Material. Nat. Commun. 2019, 10, 2801. [CrossRef]
- ISO-18400-102 International Organization for Standardization. 2017, p. 71.
- Wentworth, C.K. A Scale of Grade and Class Terms for Clastic Sediments. J. Geol. 1922, 30, 377–392. [CrossRef]
- Folk, R.L. The Distinction between Grain Size and Mineral Composition in Sedimentary-Rock Nomenclature. J. Geol. 1954, 62, 344–359. [CrossRef]
- Switzer, A.D. 14.19 Measuring and Analyzing Particle Size in a Geomorphic Context. In Treatise on Geomorphology; Elsevier, 2013; pp. 224–242 ISBN 978-0-08-088522-3.
- Rodríguez-Carbajal, J. Recent Advances in Magnetic Structure Determination by Neutron Powder Diffraction. Phys. B Condens. Matter 1993, Volume 192, Issues 1–2, Pages 55-69.
- Gilmore, G. Practical Gamma-Ray Spectroscopy; Second Edition.; John Wiley & Sons., 2008;.
- Townsend, L.T.; Smith, K.F.; Winstanley, E.H.; Morris, K.; Stagg, O.; Mosselmans, J.F.W.; Livens, F.R.; Abrahamsen-Mills, L.; Blackham, R.; Shaw, S. Neptunium and Uranium Interactions with Environmentally and Industrially Relevant Iron Minerals. Minerals 2022, 12, 165. [CrossRef]
- Ravel, B.; Newville, M. ATHENA , ARTEMIS , HEPHAESTUS : Data Analysis for X-Ray Absorption Spectroscopy Using IFEFFIT. J. Synchrotron Radiat. 2005, 12, 537–541. [CrossRef]
- Solé, V.A.; Papillon, E.; Cotte, M.; Walter, Ph.; Susini, J. A Multiplatform Code for the Analysis of Energy-Dispersive X-Ray Fluorescence Spectra. Spectrochim. Acta Part B At. Spectrosc. 2007, 62, 63–68. [CrossRef]
- Gürsoy, D.; De Carlo, F.; Xiao, X.; Jacobsen, C. TomoPy: A Framework for the Analysis of Synchrotron Tomographic Data. J. Synchrotron Radiat. 2014, 21, 1188–1193. [CrossRef]
- Schindelin, J.; Arganda-Carreras, I.; Frise, E.; Kaynig, V.; Longair, M.; Pietzsch, T.; Preibisch, S.; Rueden, C.; Saalfeld, S.; Schmid, B.; et al. Fiji: An Open-Source Platform for Biological-Image Analysis. Nat. Methods 2012, 9, 676–682. [CrossRef]
- Basham, M.; Filik, J.; Wharmby, M.T.; Chang, P.C.Y.; El Kassaby, B.; Gerring, M.; Aishima, J.; Levik, K.; Pulford, B.C.A.; Sikharulidze, I.; et al. Data Analysis WorkbeNch ( DAWN ). J. Synchrotron Radiat. 2015, 22, 853–858. [CrossRef]
- Group F. AVIZO 3D Analysis Software.
- Bès, R.; Rivenet, M.; Solari, P.-L.; Kvashnina, K.O.; Scheinost, A.C.; Martin, P.M. Use of HERFD–XANES at the U L3 - and M4 -Edges To Determine the Uranium Valence State on [Ni(H2 O)4 ]3 [U(OH,H2 O)(UO2 )8 O12 (OH)3 ]. Inorg. Chem. 2016, 55, 4260–4270. [CrossRef]
- Catalano, J.G.; Brown Jr., G.E. Analysis of Uranyl-Bearing Phases by EXAFS Spectroscopy: Interferences, Multiple Scattering, Accuracy of Structural Parameters, and Spectral Differences. Am. Mineral. 2004, Volume 89, pages 1004-1021, doi:DOI: 10.2138/am-2004-0711.
- Lloyd, N.S.; Mosselmans, J.F.W.; Parrish, R.R.; Chenery, S.R.N.; Hainsworth, S.V.; Kemp, S.J. The Morphologies and Compositions of Depleted Uranium Particles from an Environmental Case-Study. Mineral. Mag. 2009, 73, 495–510. [CrossRef]
- Ginderow, D. Structure de l’uranophane alpha, Ca(UO2)2(SiO3OH)2.5H2O. Acta Crystallogr. C 1988, 44, 421–424. [CrossRef]
- Kelly, S.D. Uranium Chemistry in Soils and Sediments. In Developments in Soil Science; Elsevier, 2010; Vol. 34, pp. 411–466 ISBN 978-0-444-53261-9.
- Brown, C.F.; Serne, R.J.; Catalano, J.G.; Krupka, K.M.; Icenhower, J.P. Mineralization of Contaminant Uranium and Leach Rates in Sediments from Hanford, Washington. Appl. Geochem. 2010, 25, 97–104. [CrossRef]
- Thompson, T.G.; Chow, T.J. The Strontium-Calcium Atom Ratio in Carbonate-Secreting Marine Organisms. Pap. Mar. Biol. Oceanogr. 1955, Suppl. vol. 3 of Deep-Sea Research, 20-39.
- Turekus, K.K.; Kulp, J.L. The Geochemistry of Strontium. Geochim. Cosmochim. Acta 1956, 245-296.
- Montero, M.E.; Aspiazu, J.; Pajón, J.; Miranda, S.; Moreno, E. PIXE Study of Cuban Quaternary Paleoclimate Geological Samples and Speleothems. Appl. Radiat. Isot. 2000, 52, 289–297. [CrossRef]
- Chen, F.; Hu, J.; Takahashi, Y.; Yamada, M.; Rahman, M.S.; Yang, G. Application of Synchrotron Radiation and Other Techniques in Analysis of Radioactive Microparticles Emitted from the Fukushima Daiichi Nuclear Power Plant Accident-A Review. J. Environ. Radioact. 2019, 196, 29–39. [CrossRef]
- Poliakova, T.; Weiss, M.; Trigub, A.; Yapaskurt, V.; Zheltonozhskaya, M.; Vlasova, I.; Walther, C.; Kalmykov, S. Chernobyl Fuel Microparticles: Uranium Oxidation State and Isotope Ratio by HERFD-XANES and SIMS. J. Radioanal. Nucl. Chem. 2024. [CrossRef]
- Johansen, M.P.; Child, D.P.; Collins, R.; Cook, M.; Davis, J.; Hotchkis, M.A.C.; Howard, D.L.; Howell, N.; Ikeda-Ohno, A.; Young, E. Radioactive Particles from a Range of Past Nuclear Events: Challenges Posed by Highly Varied Structure and Composition. Sci. Total Environ. 2022, 842, 156755. [CrossRef]
- Byrnes, I.; Lind, O.C.; Hansen, E.L.; Janssens, K.; Salbu, B. Characterization of Radioactive Particles from the Dounreay Nuclear Reprocessing Facility. Sci. Total Environ. 2020, 727, 138488. [CrossRef]
Figure 1.
Left: Location of Sierra Peña Blanca and Laguna del Cuervo north of Chihuahua City. Right: Main streams in the study area.
Figure 1.
Left: Location of Sierra Peña Blanca and Laguna del Cuervo north of Chihuahua City. Right: Main streams in the study area.
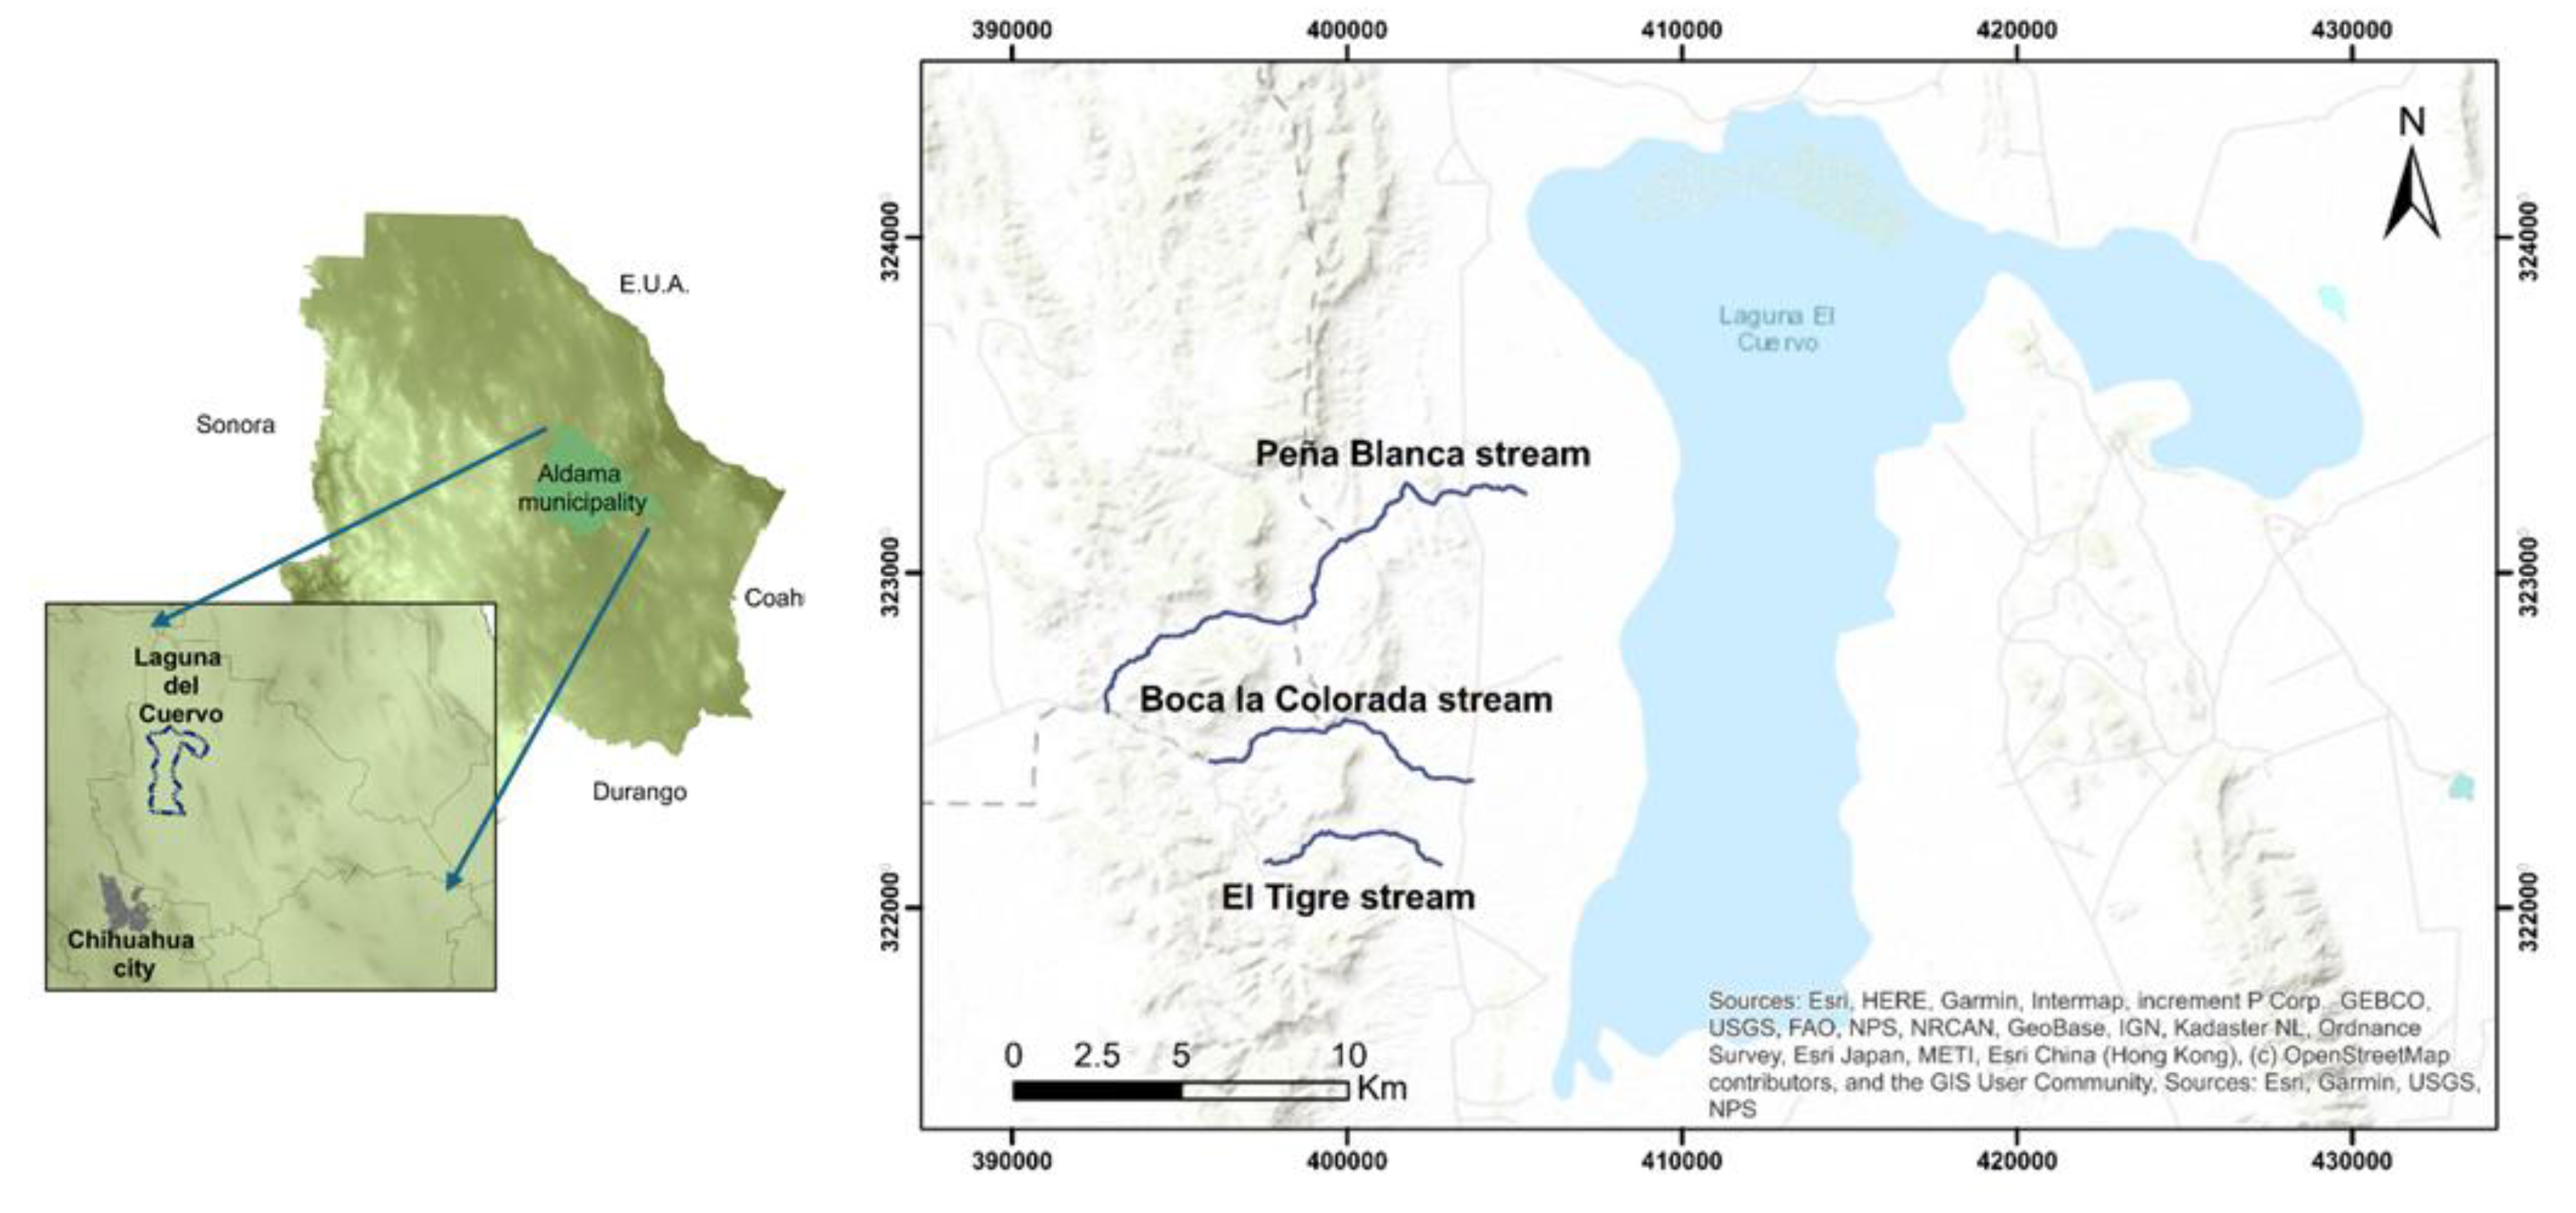
Figure 2.
Left: Location of sampling points along the Peña Blanca (APB), El Tigre (Tigre), and Boca la Colorada (BC) streams. The Puerto 3 sampling point is also shown.
Figure 2.
Left: Location of sampling points along the Peña Blanca (APB), El Tigre (Tigre), and Boca la Colorada (BC) streams. The Puerto 3 sampling point is also shown.
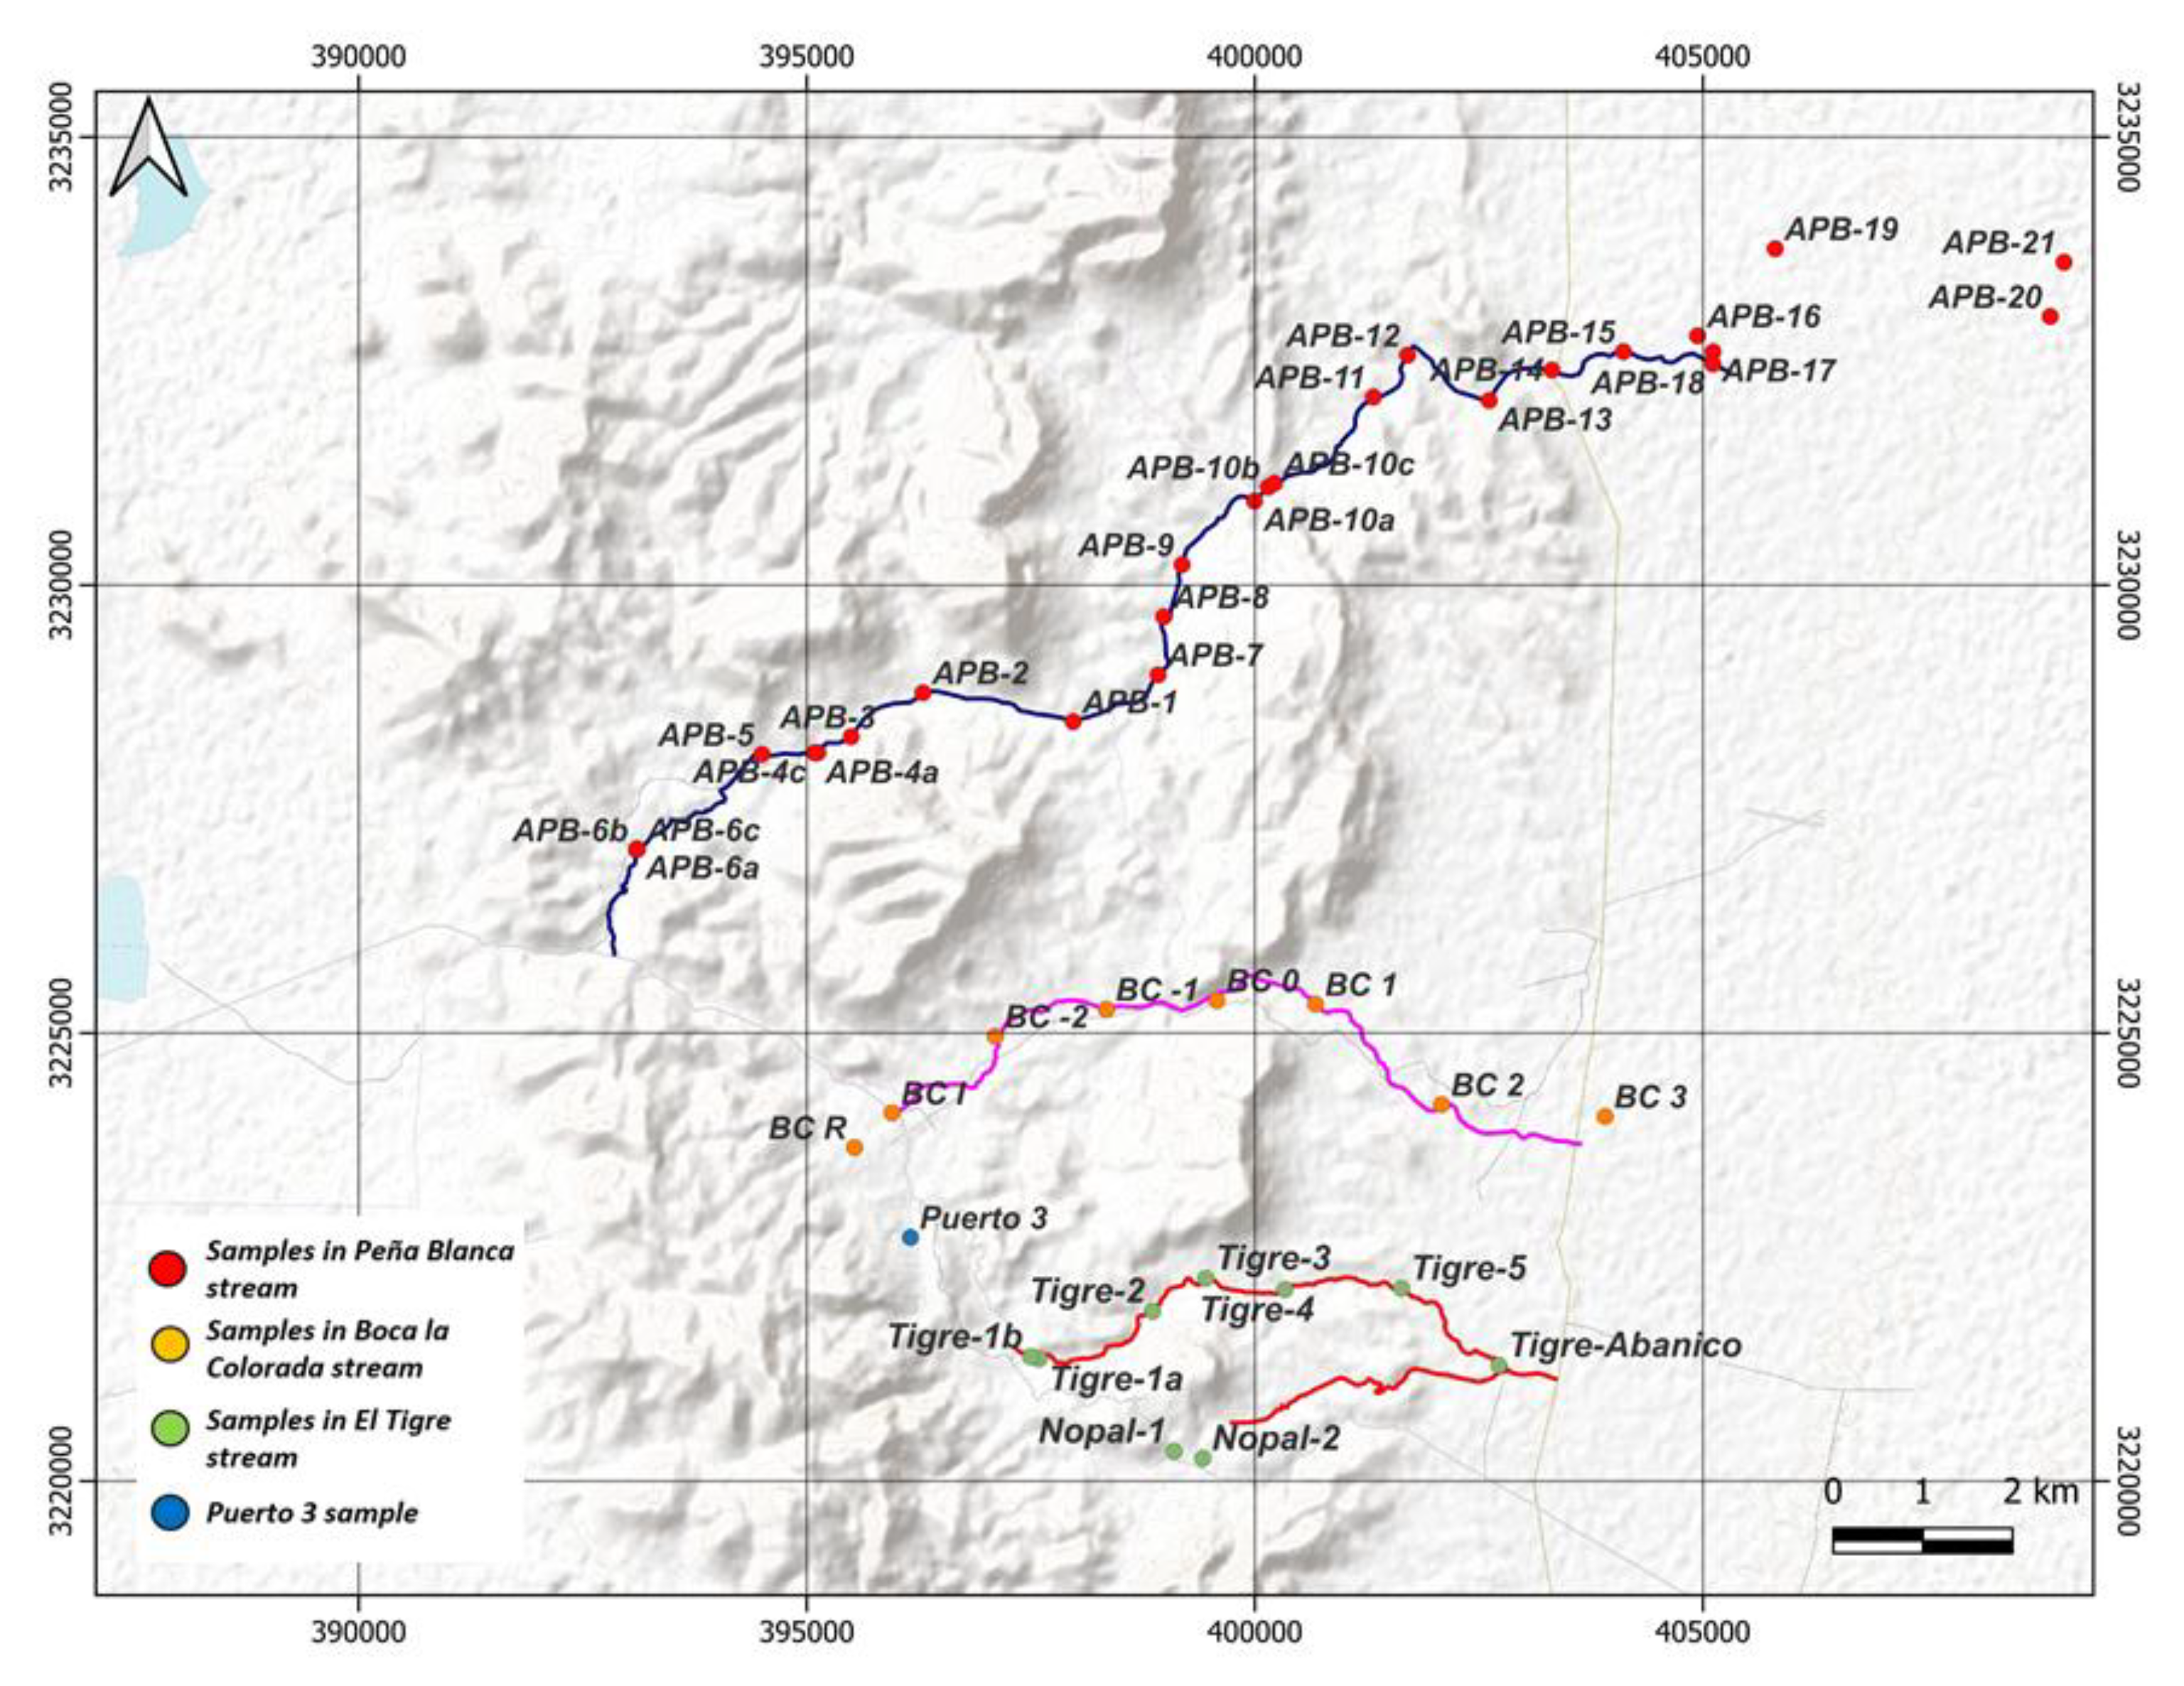
Figure 3.
Left: Characteristic spectrum of sample APB-11, fine sand. The isotope identification corresponding to each gamma-ray energy is shown on the spectrum line. The purple bars below the peaks represent the regions of interest (ROI) for each fitting. The red lines represent the fitting by Gaussian least squares. The measurement time was 288000 s with the HPGe detector Canberra GC2020.
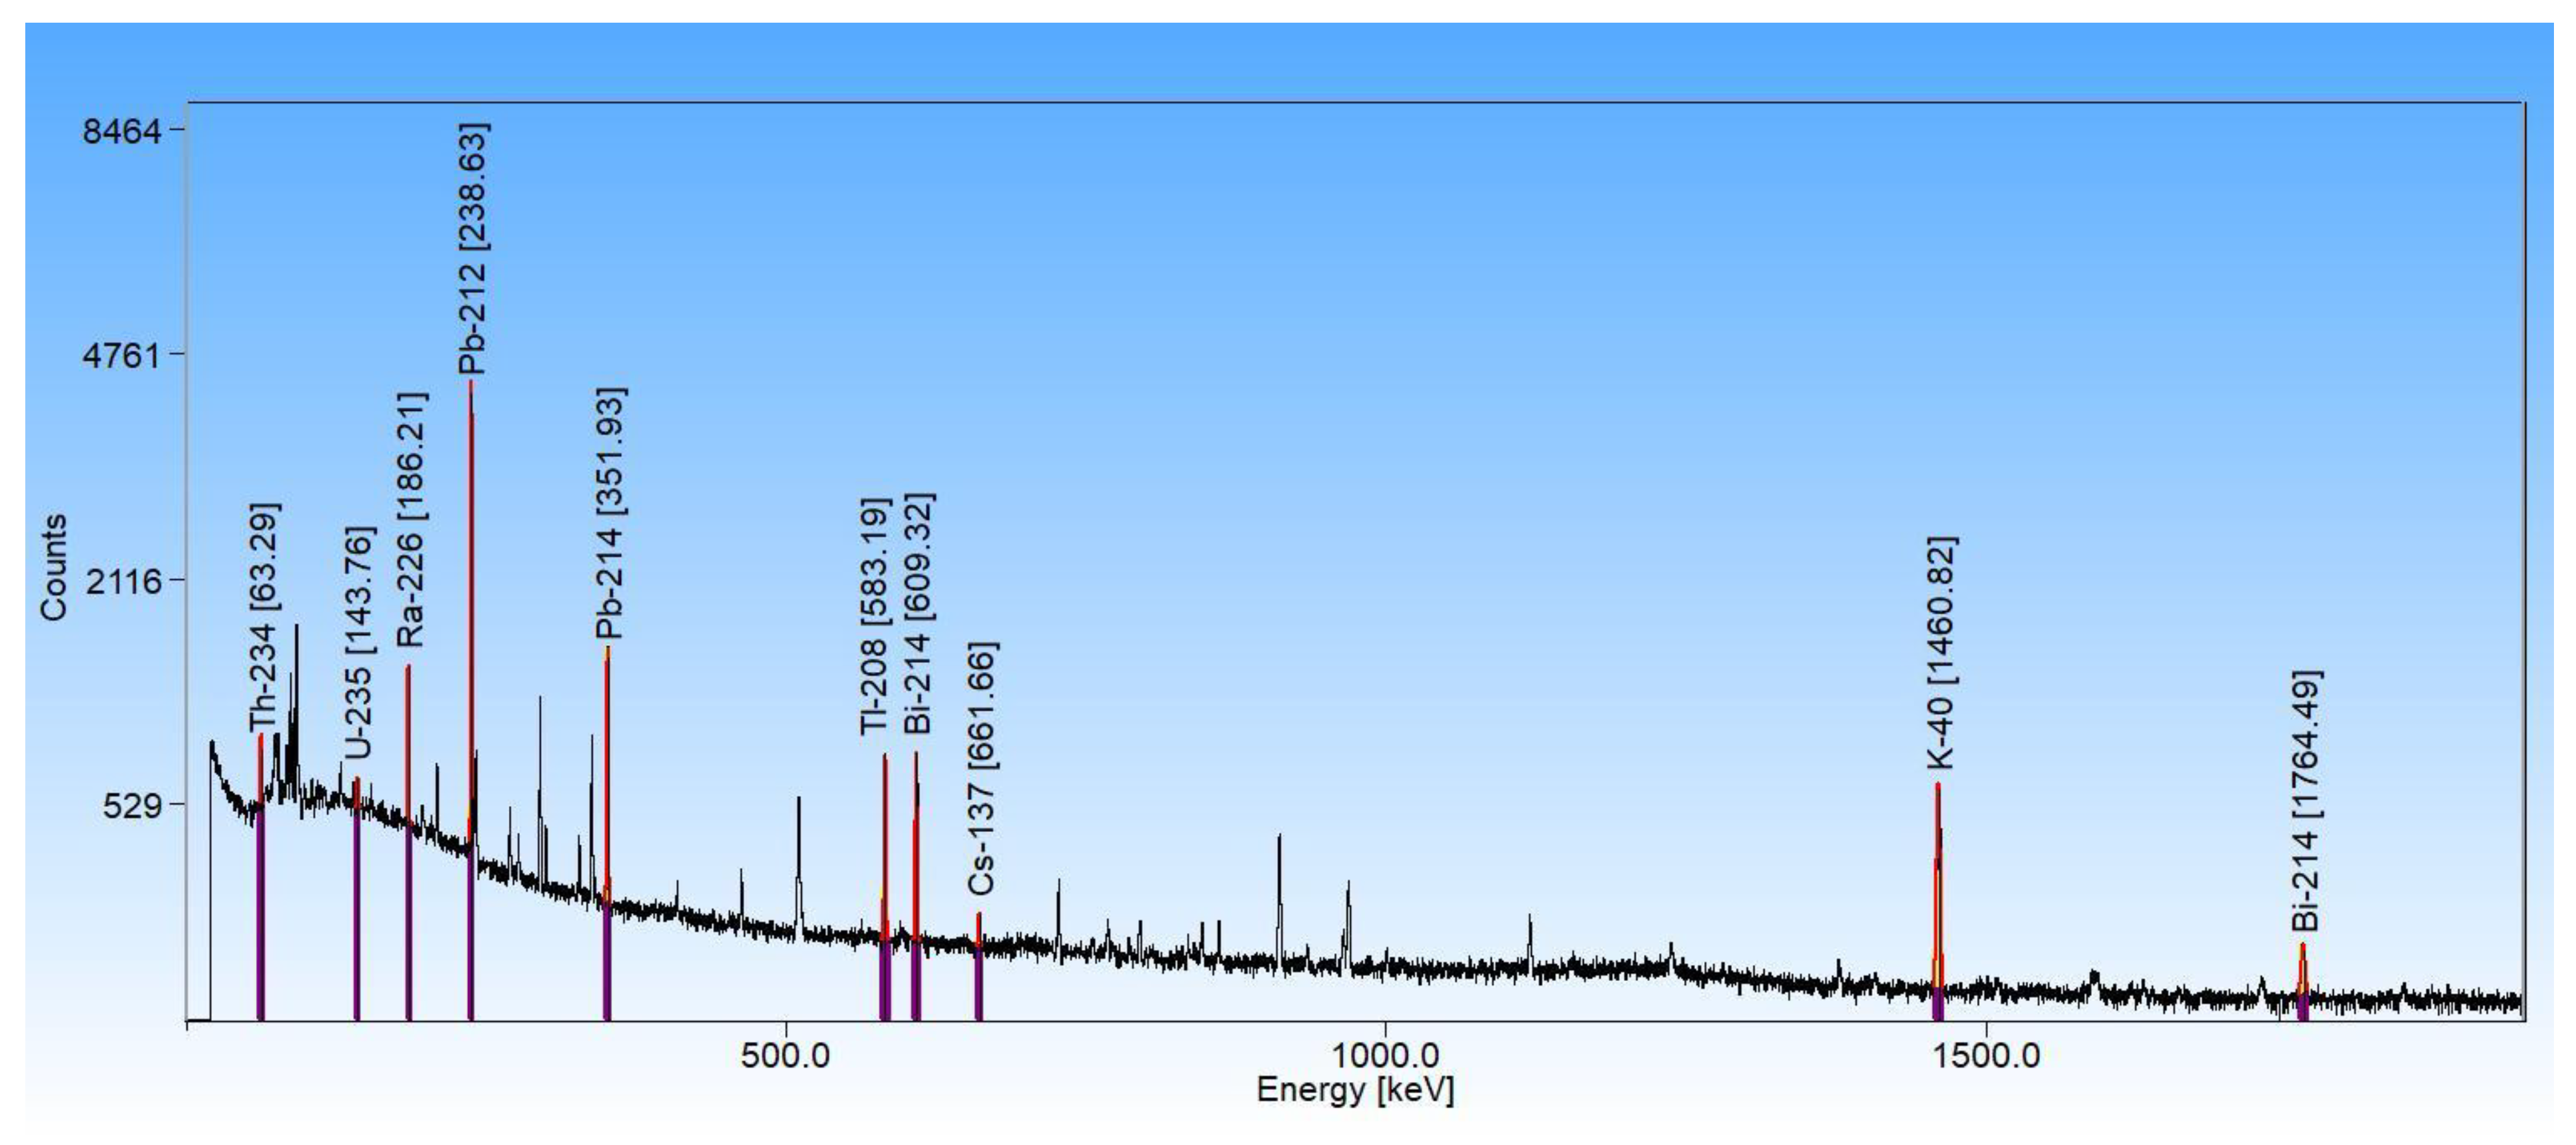
Figure 4.
Particles extracted from the sand fraction of the sample APB-11.
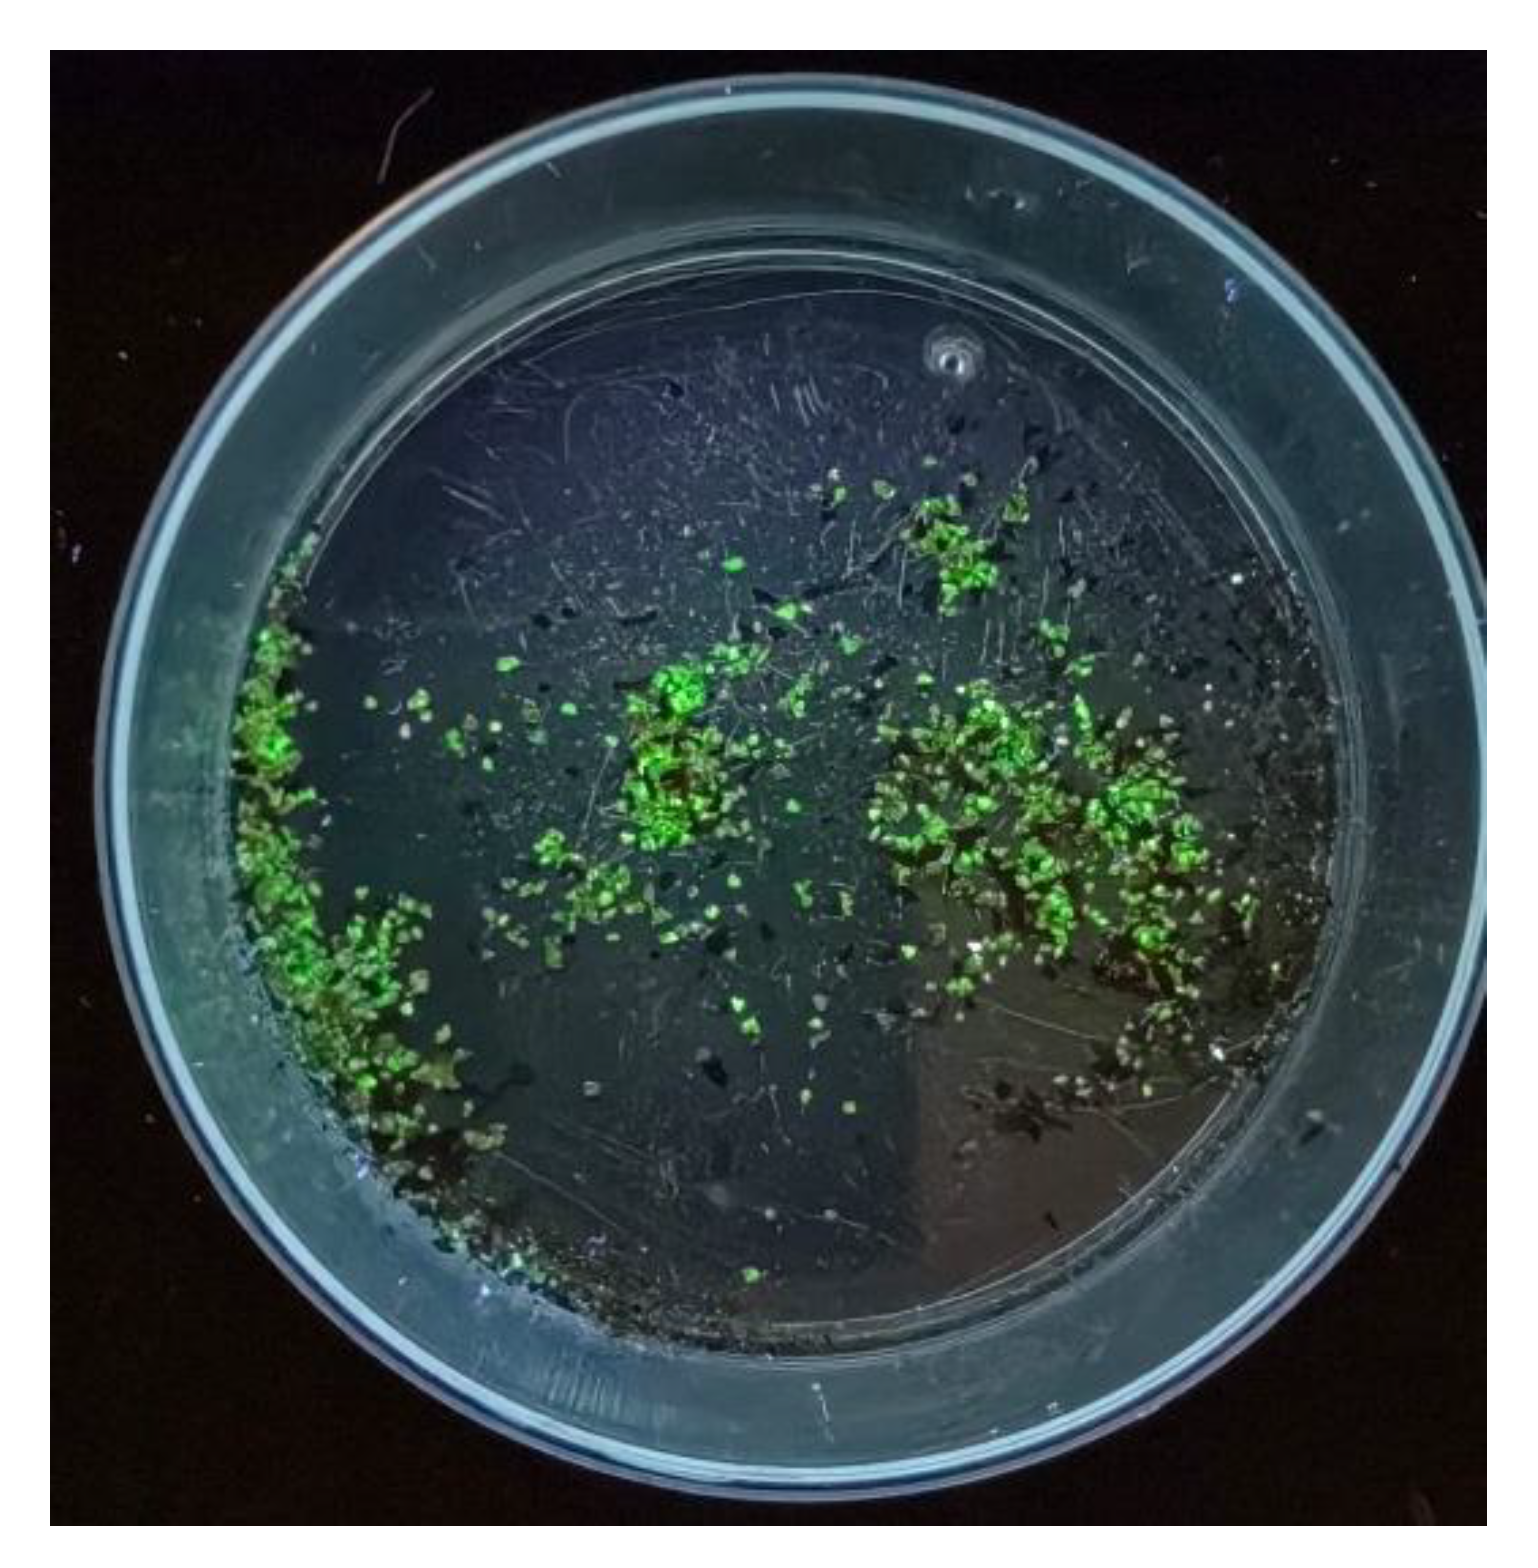
Figure 5.
Spectrum of the URP reference sample for determining particle concentration. The isotope identification corresponding to each gamma-ray energy is shown on the spectrum line. The purple bars below the peaks represent the regions of interest (ROI) for each fitting. The red lines represent the fitting by Gaussian least squares. The measurement time was 40000 s.
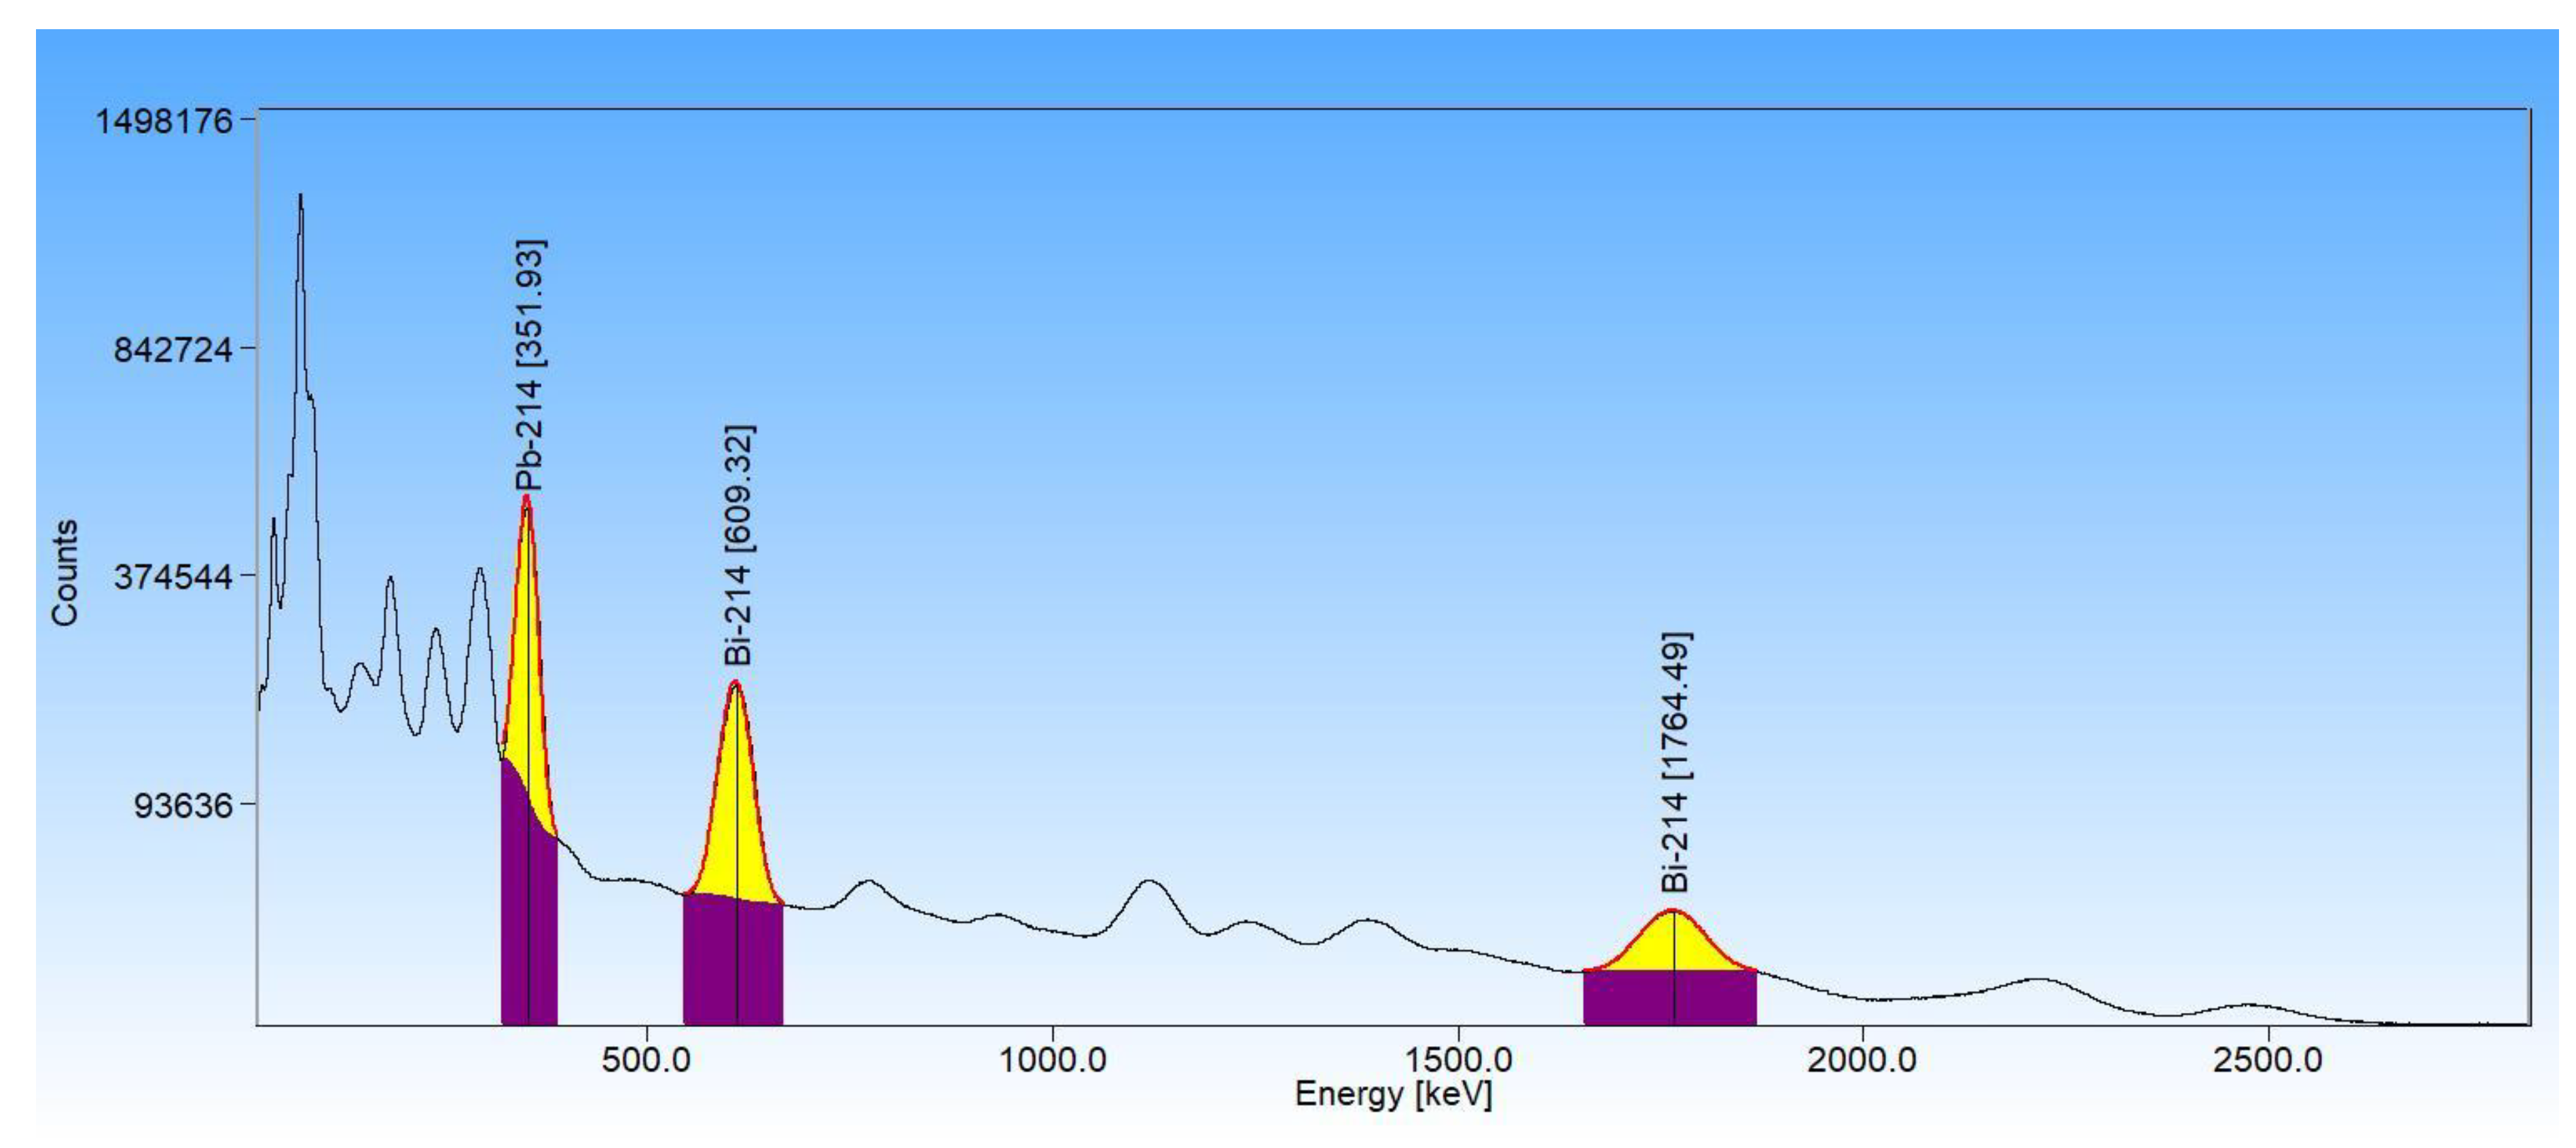
Figure 6.
Fragment of the uranium mineral from APB-11 at the tip of the sample holder for analysis at beamline I18 at the Diamond Light Source.
Figure 6.
Fragment of the uranium mineral from APB-11 at the tip of the sample holder for analysis at beamline I18 at the Diamond Light Source.
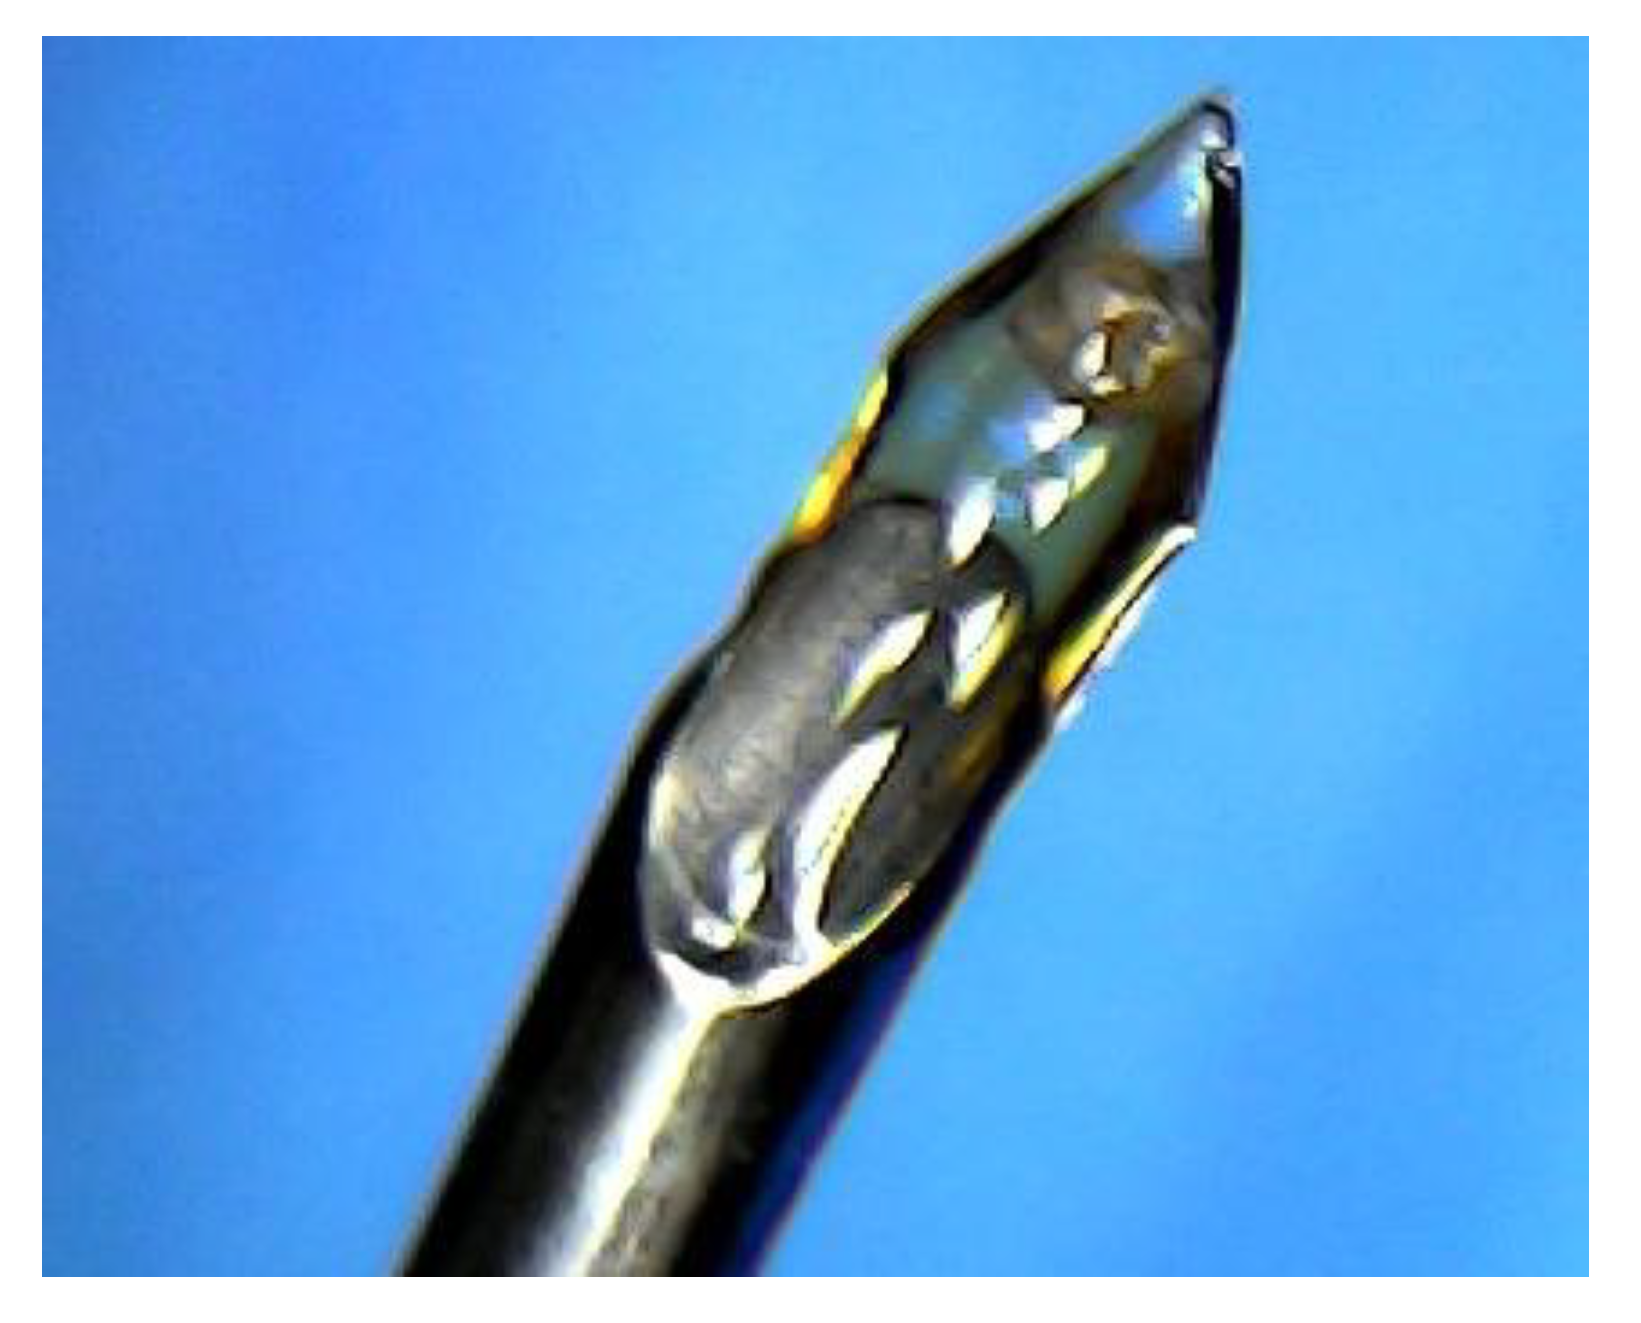
Figure 7.
XRD normalized to 100 patterns of the fine silt + clay fraction of the M2, APB-11, Tigre 3, and Nopal 1 samples. The most intense peaks of the detected phases are identified.
Figure 7.
XRD normalized to 100 patterns of the fine silt + clay fraction of the M2, APB-11, Tigre 3, and Nopal 1 samples. The most intense peaks of the detected phases are identified.
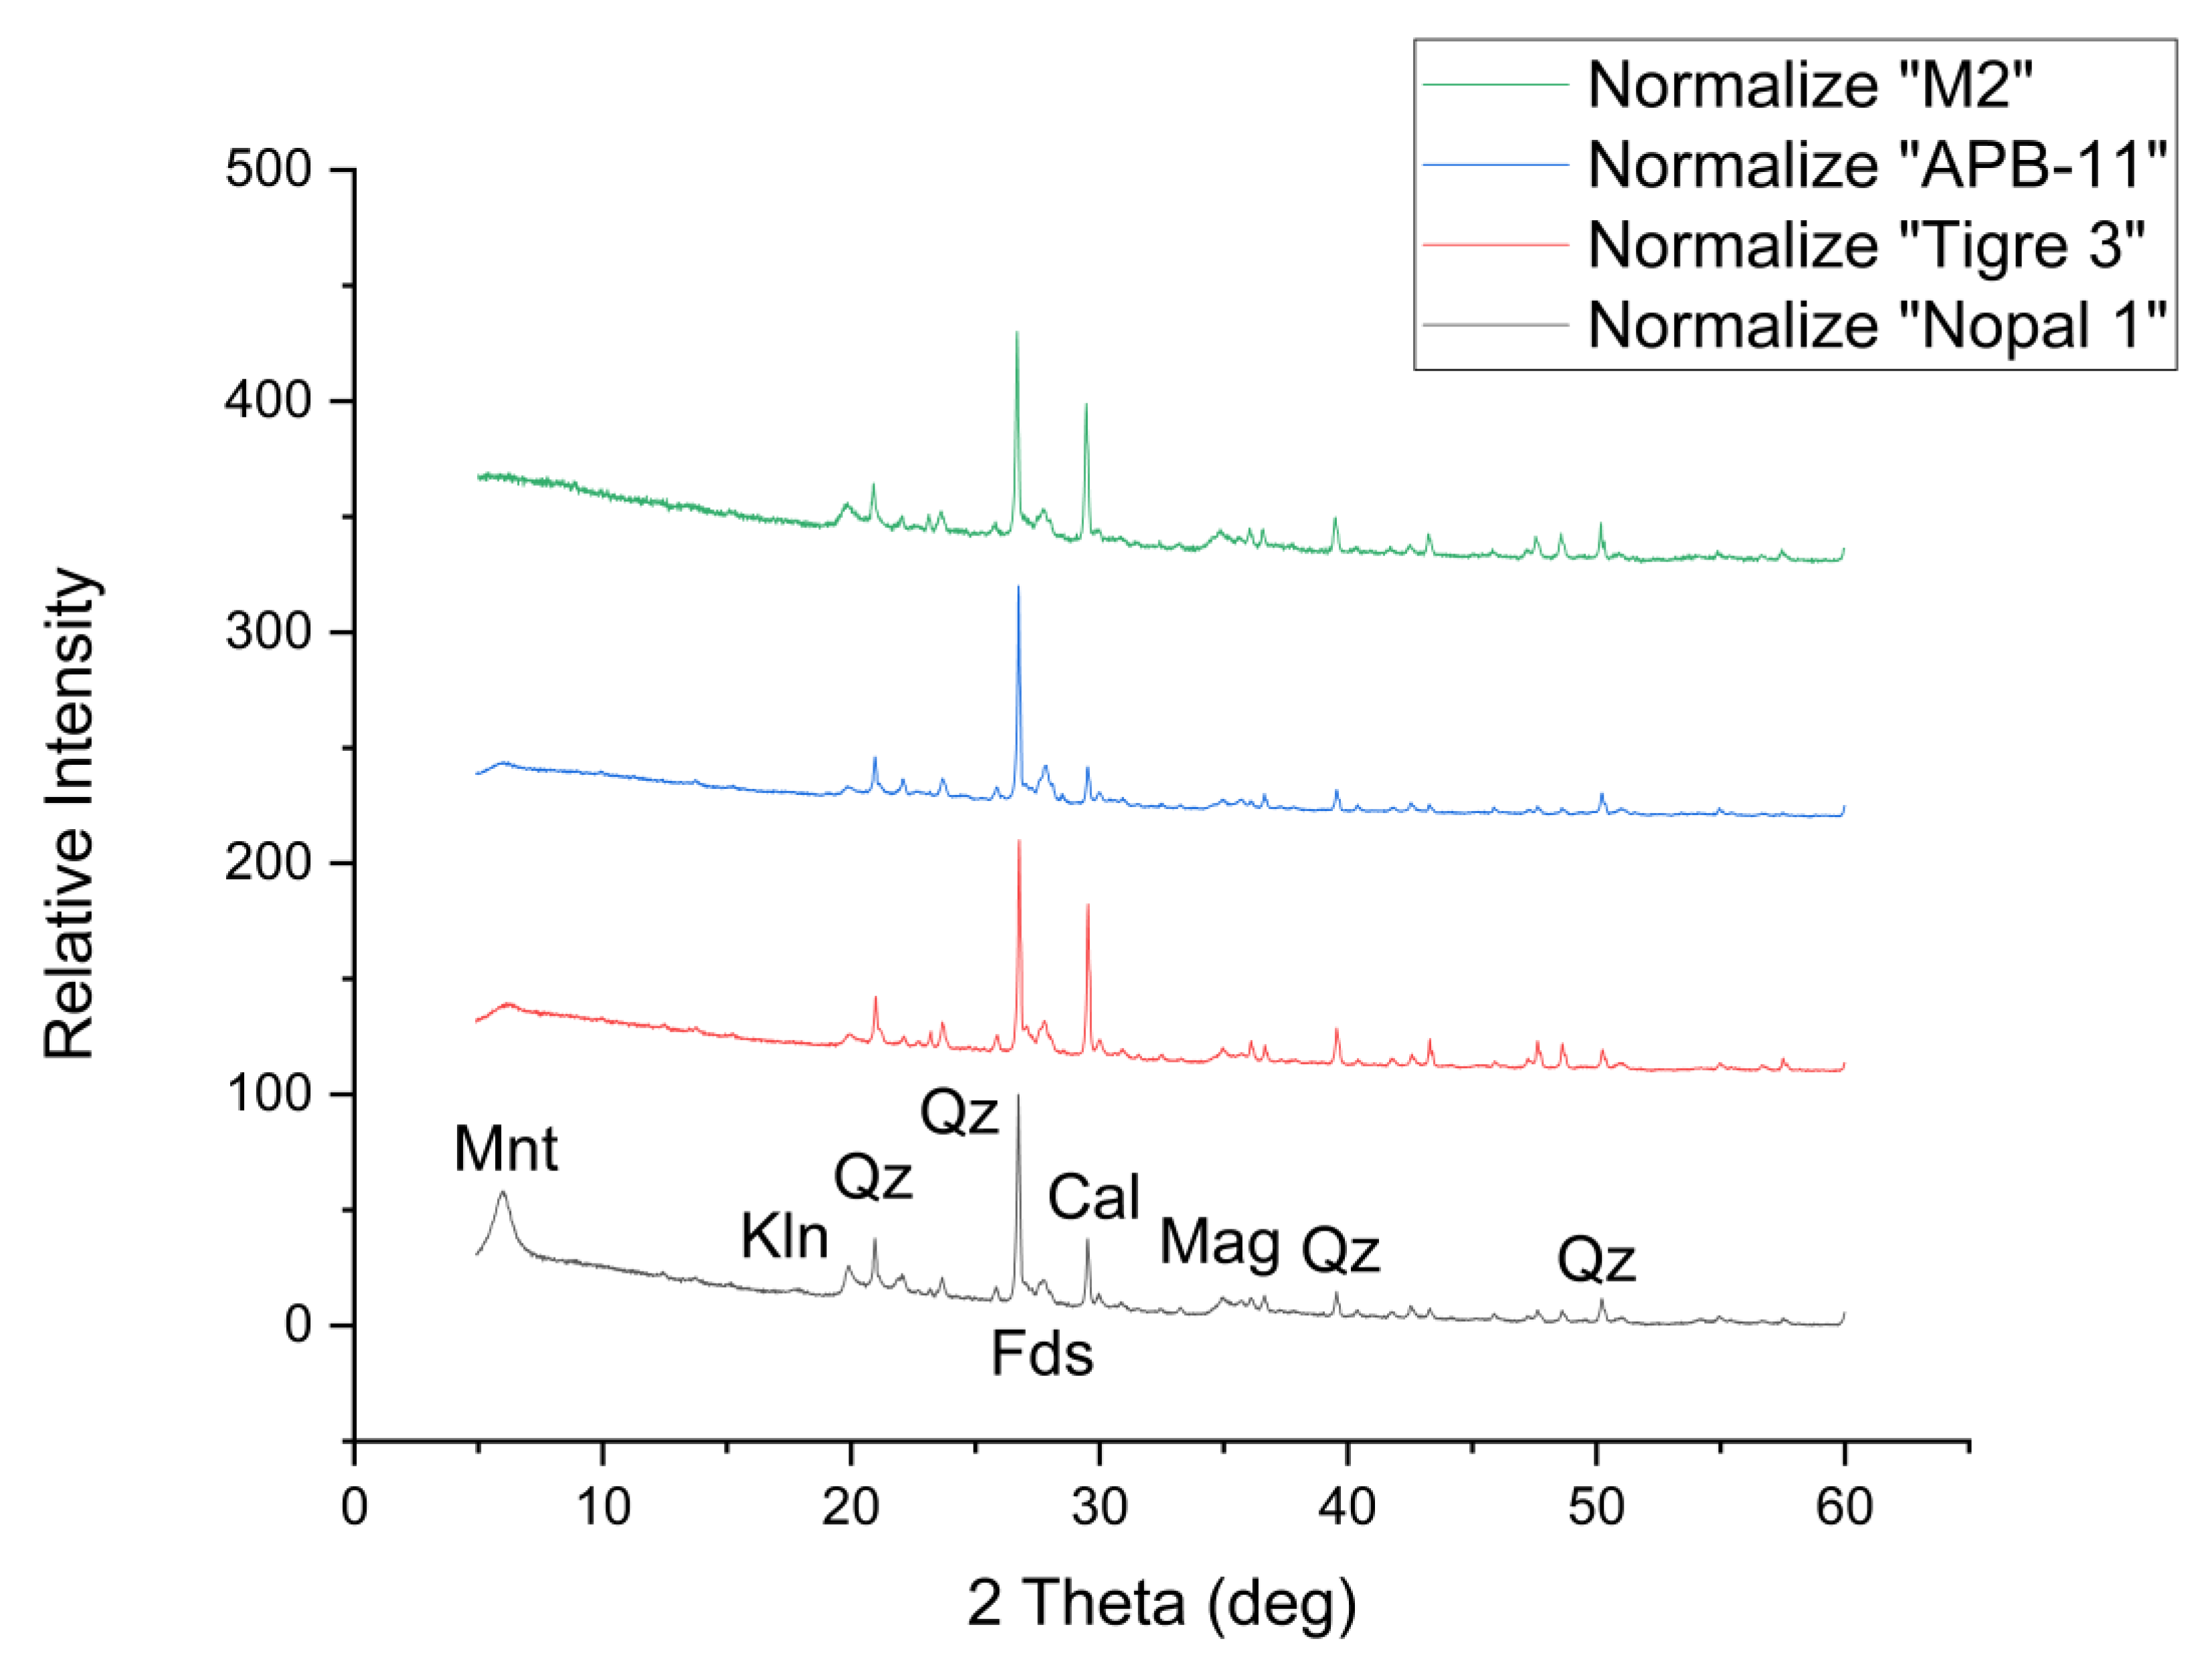
Figure 8.
Detailed location of samples for determining mineral particle density, relative to main streams and mining prospects in the study area.
Figure 8.
Detailed location of samples for determining mineral particle density, relative to main streams and mining prospects in the study area.
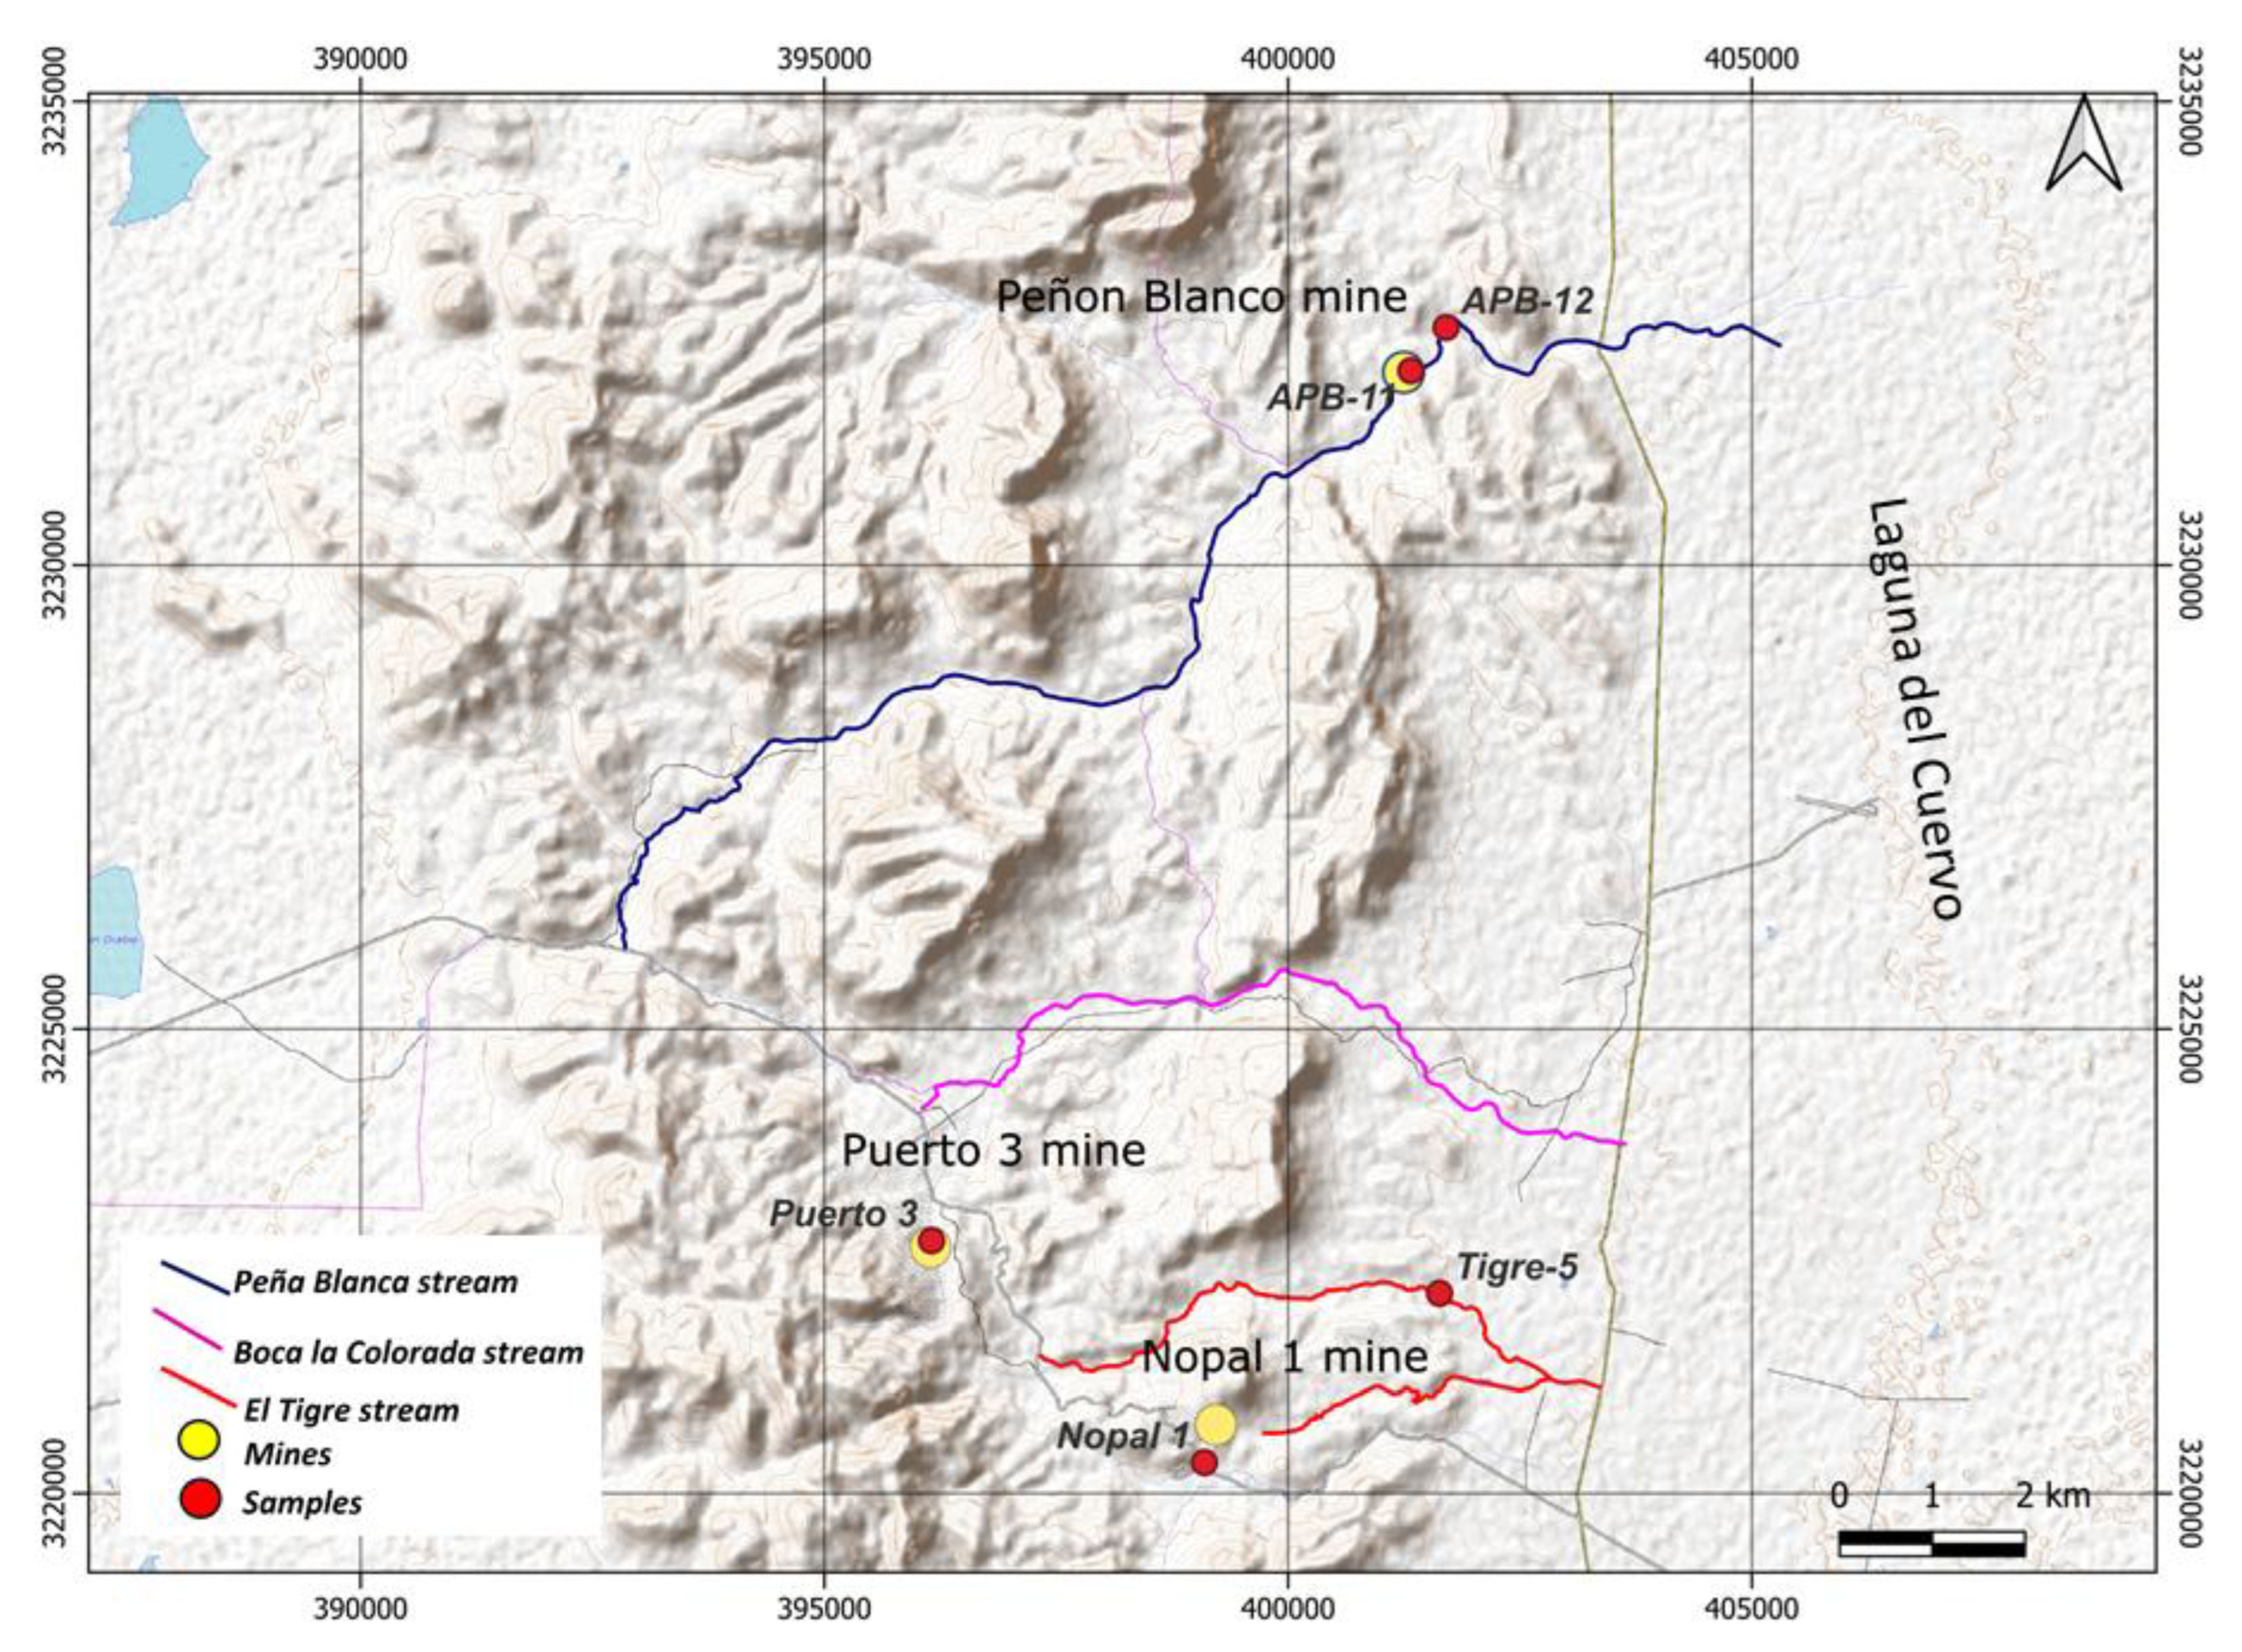
Figure 9.
STEM analyses. a) Micrograph and b) elemental map of the observed elements in the matrix of a particle selected from the sand fraction of the APB-11 sample.
Figure 9.
STEM analyses. a) Micrograph and b) elemental map of the observed elements in the matrix of a particle selected from the sand fraction of the APB-11 sample.
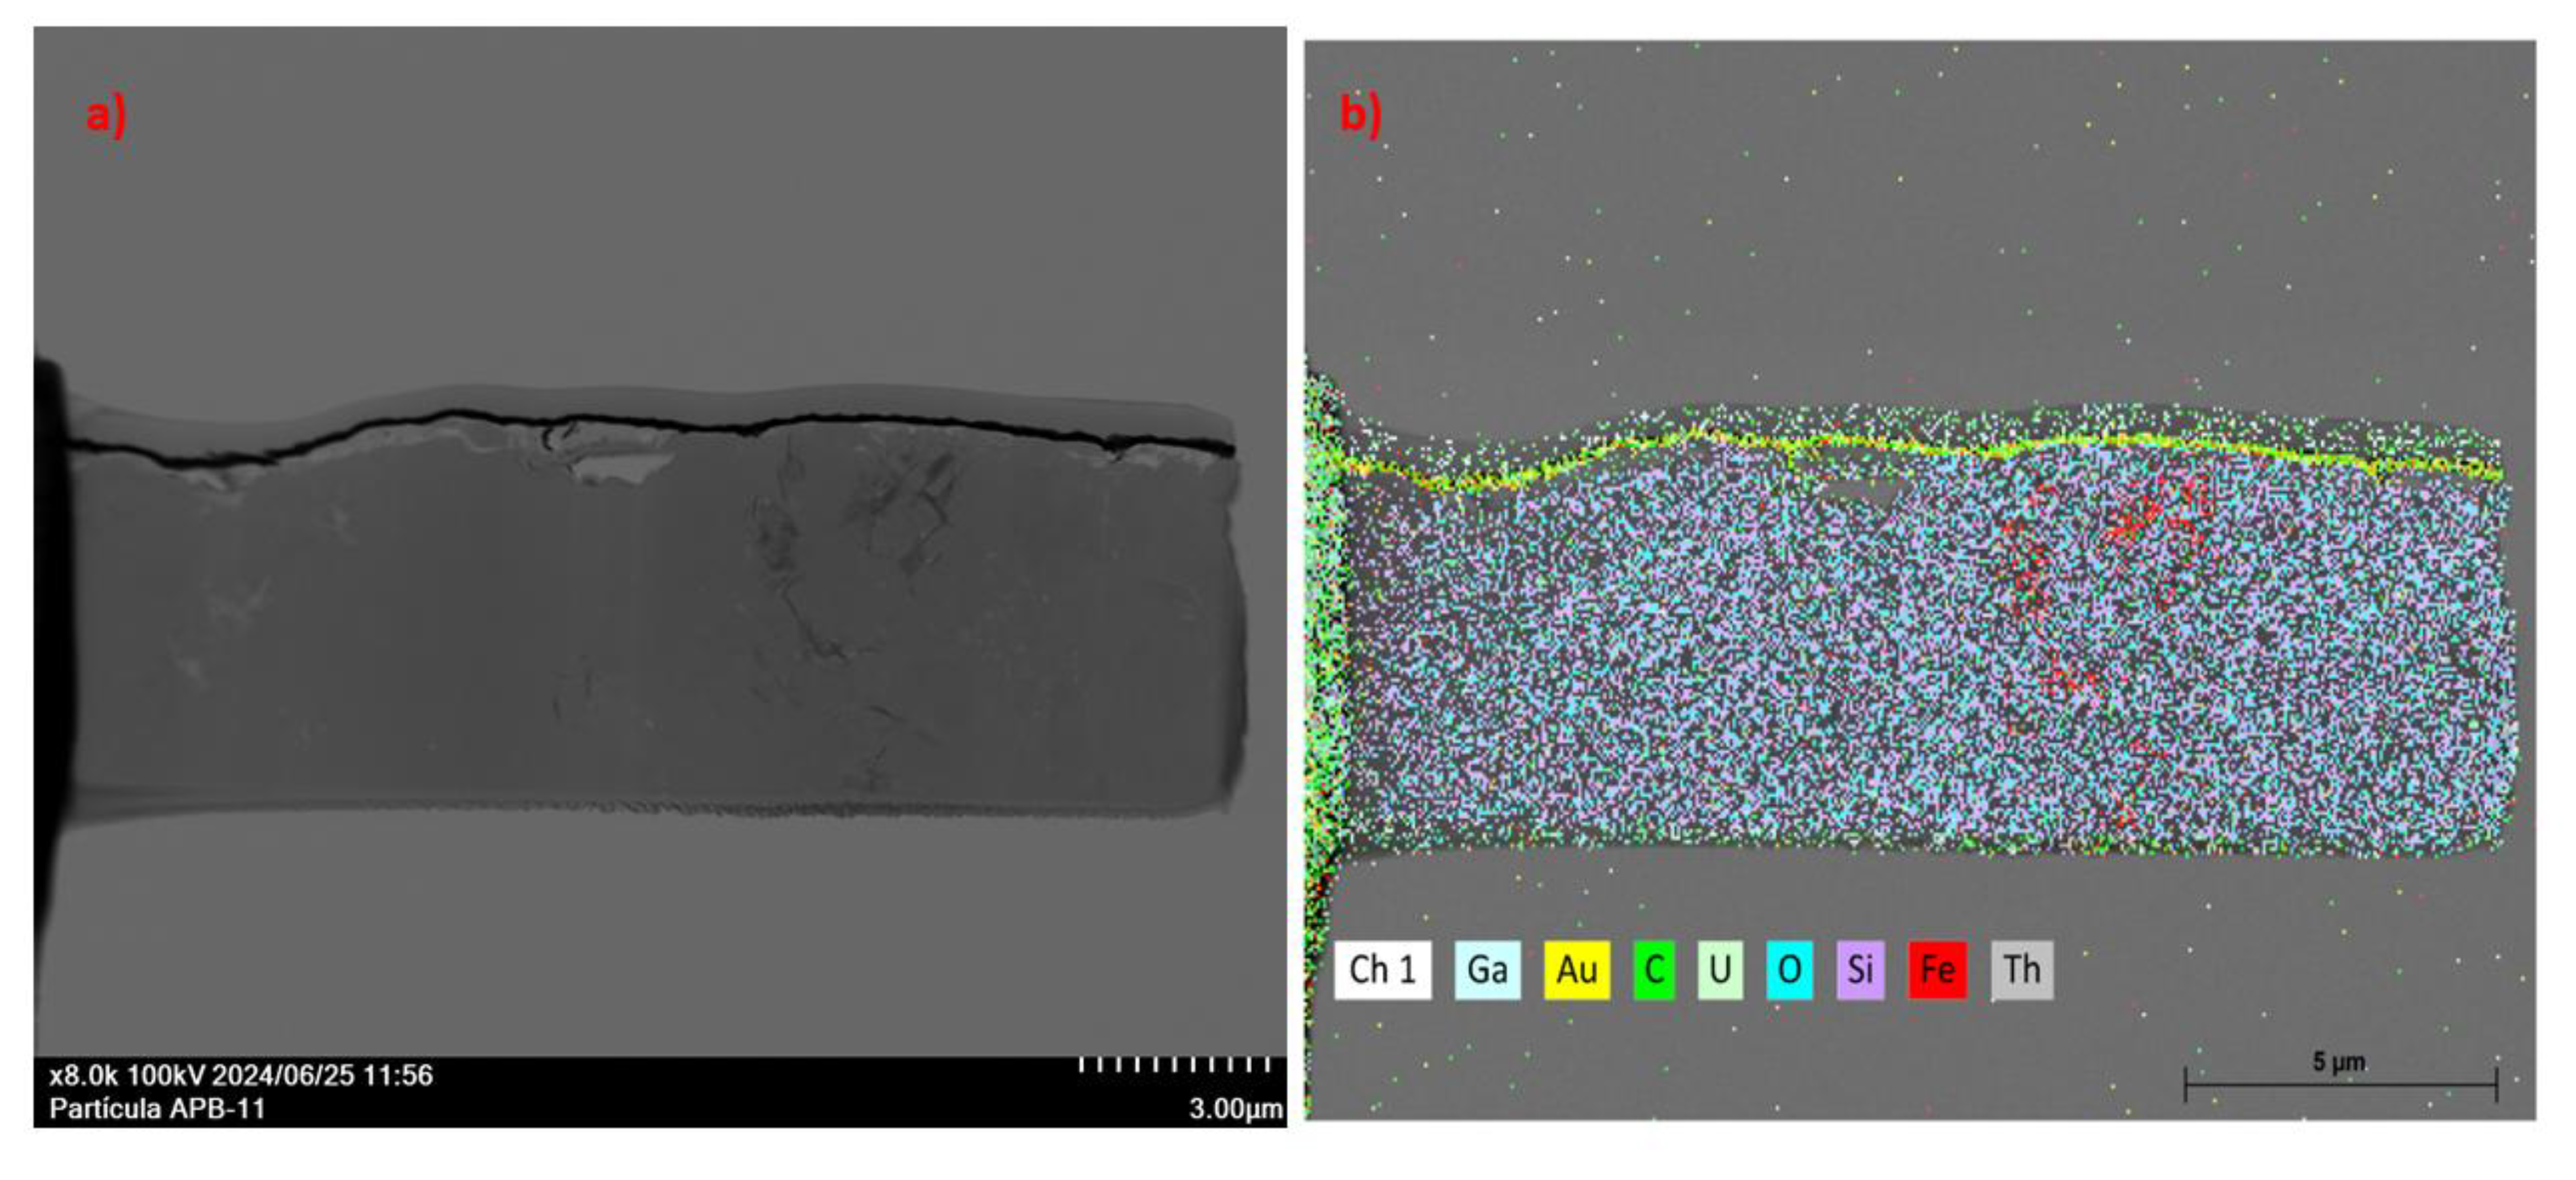
Figure 10.
Semi-quantitative elemental analysis of the same sample from Figure 9.
Figure 10.
Semi-quantitative elemental analysis of the same sample from Figure 9.
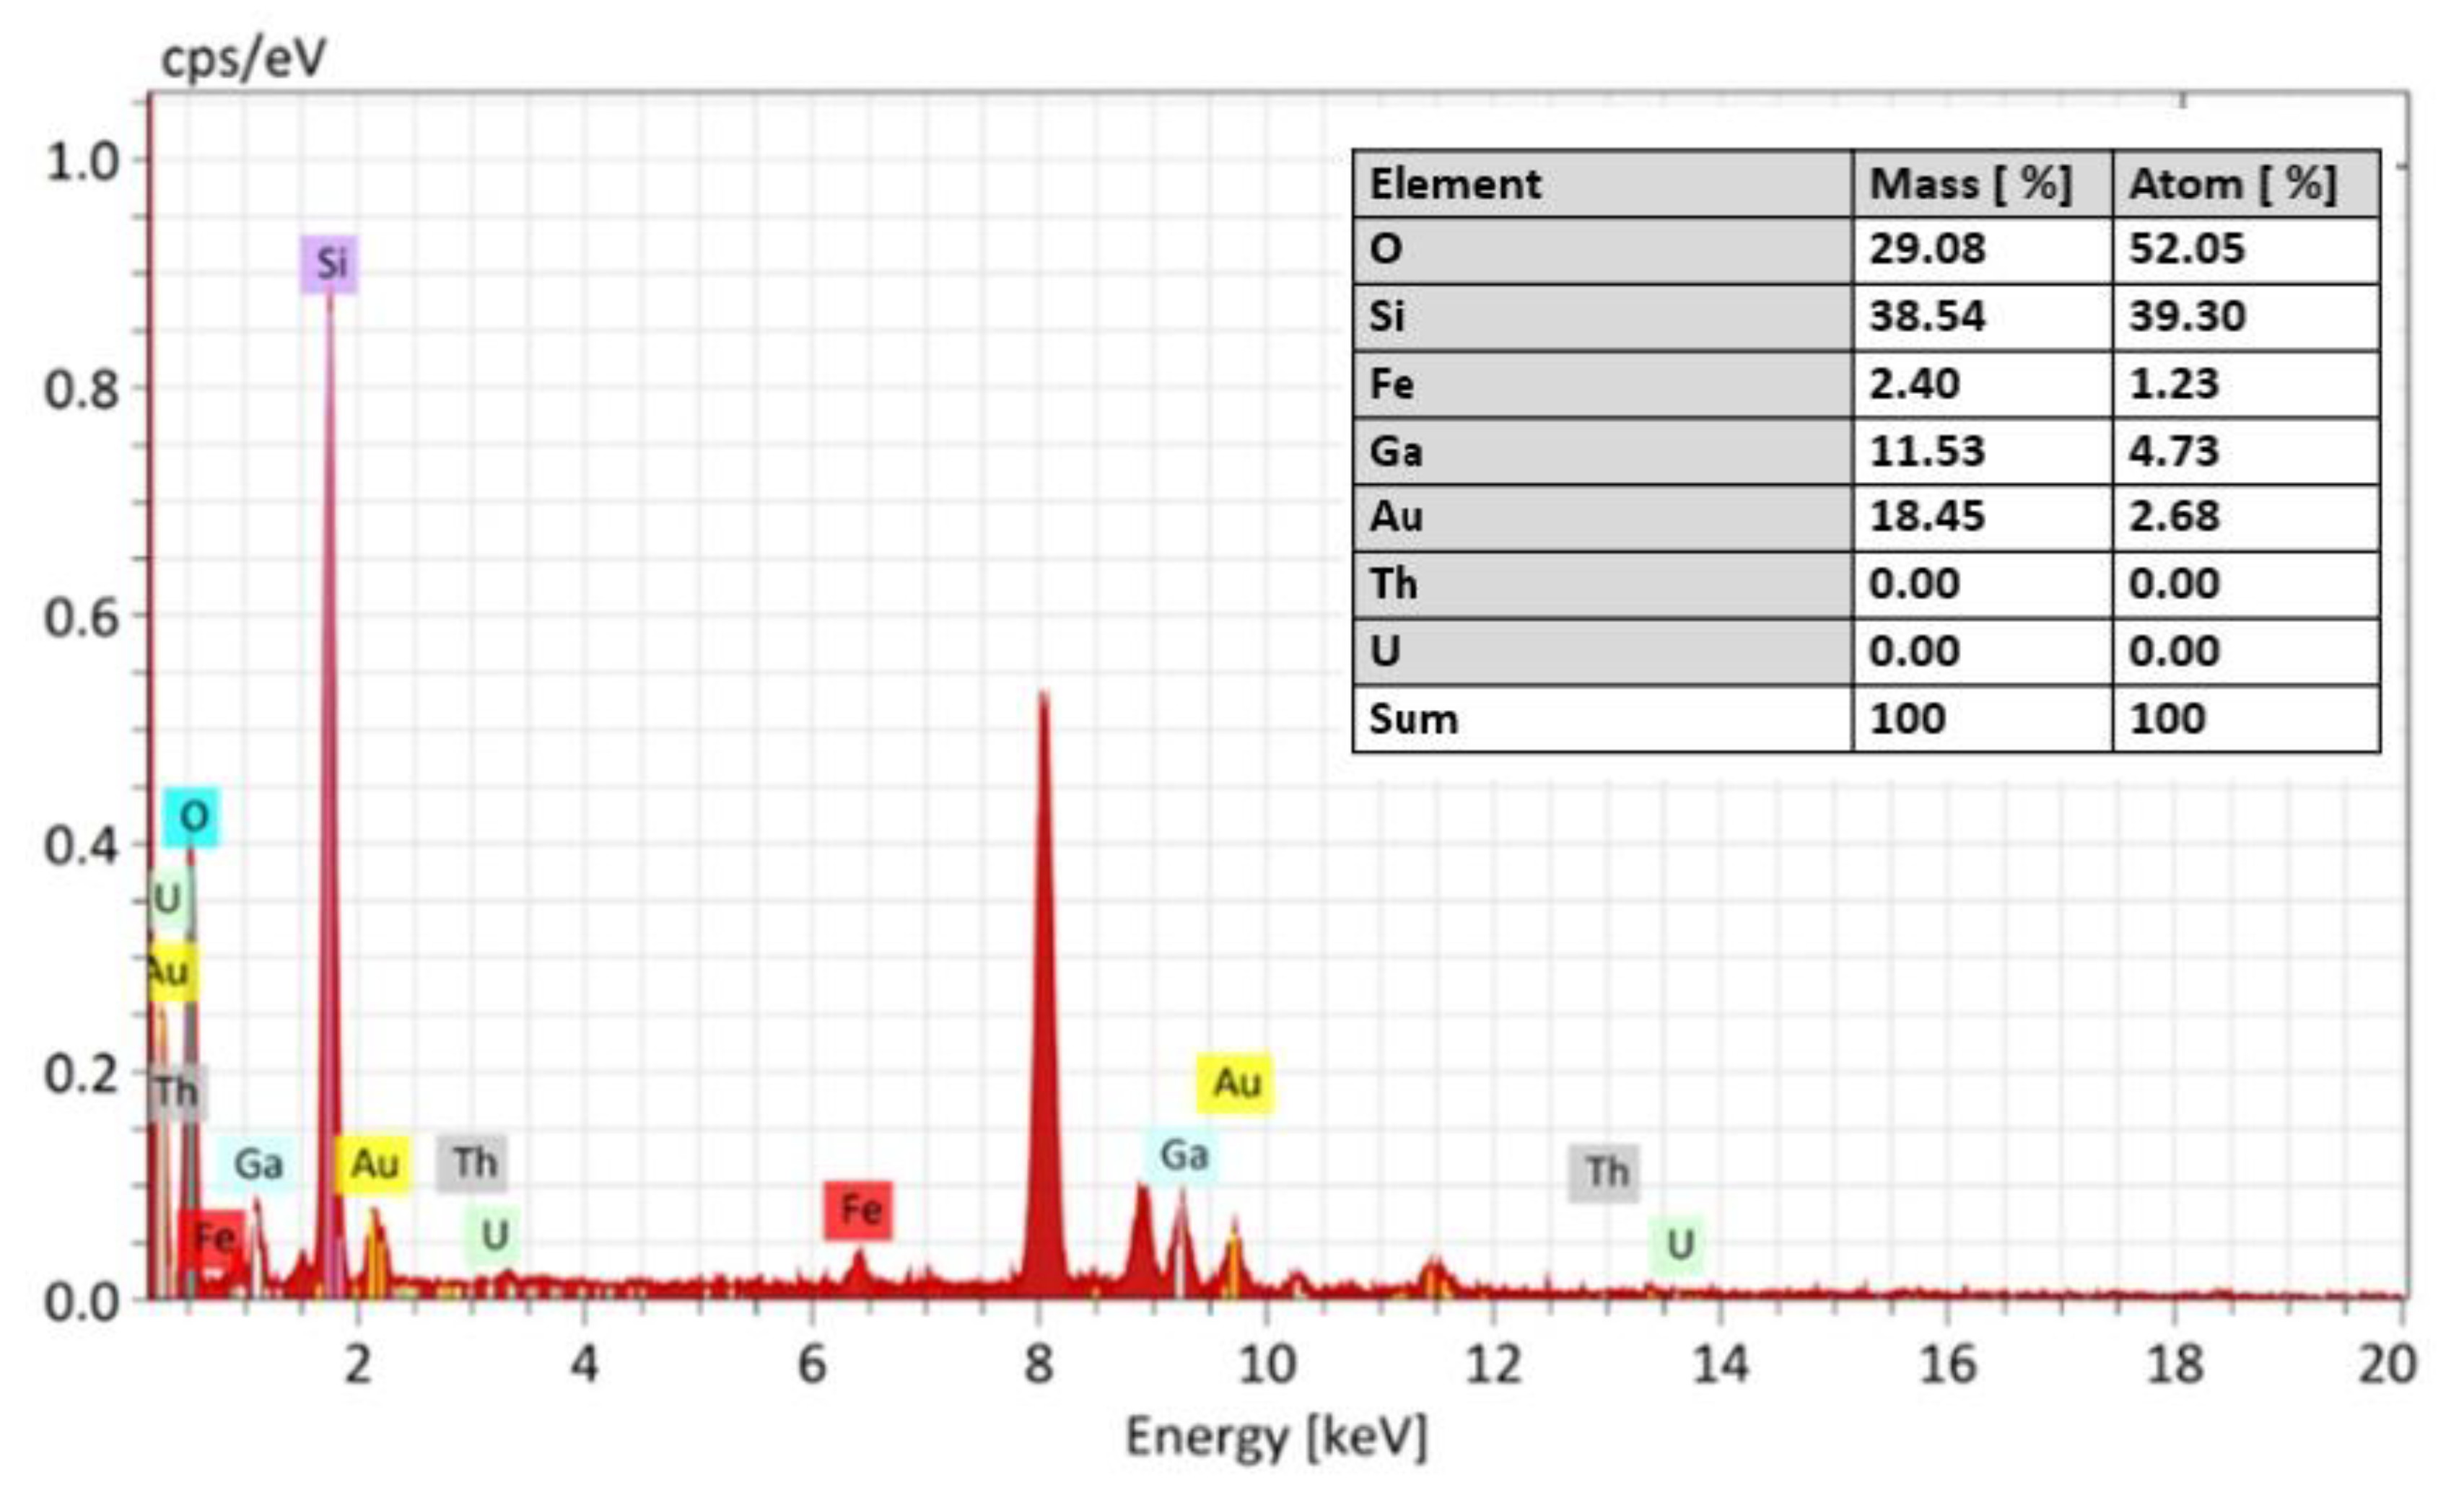
Figure 11.
XAFS of Nopal 1 particles: a) Normalized XANES spectrum; b) fluorescent particles and cellulose pellet with crushed particles on it; c) Fourier transforms in radial distribution function; and d) k3-weighted experimental (black solid line) and fitted (blue solid line with crossed) spectra for U LIII EXAFS.
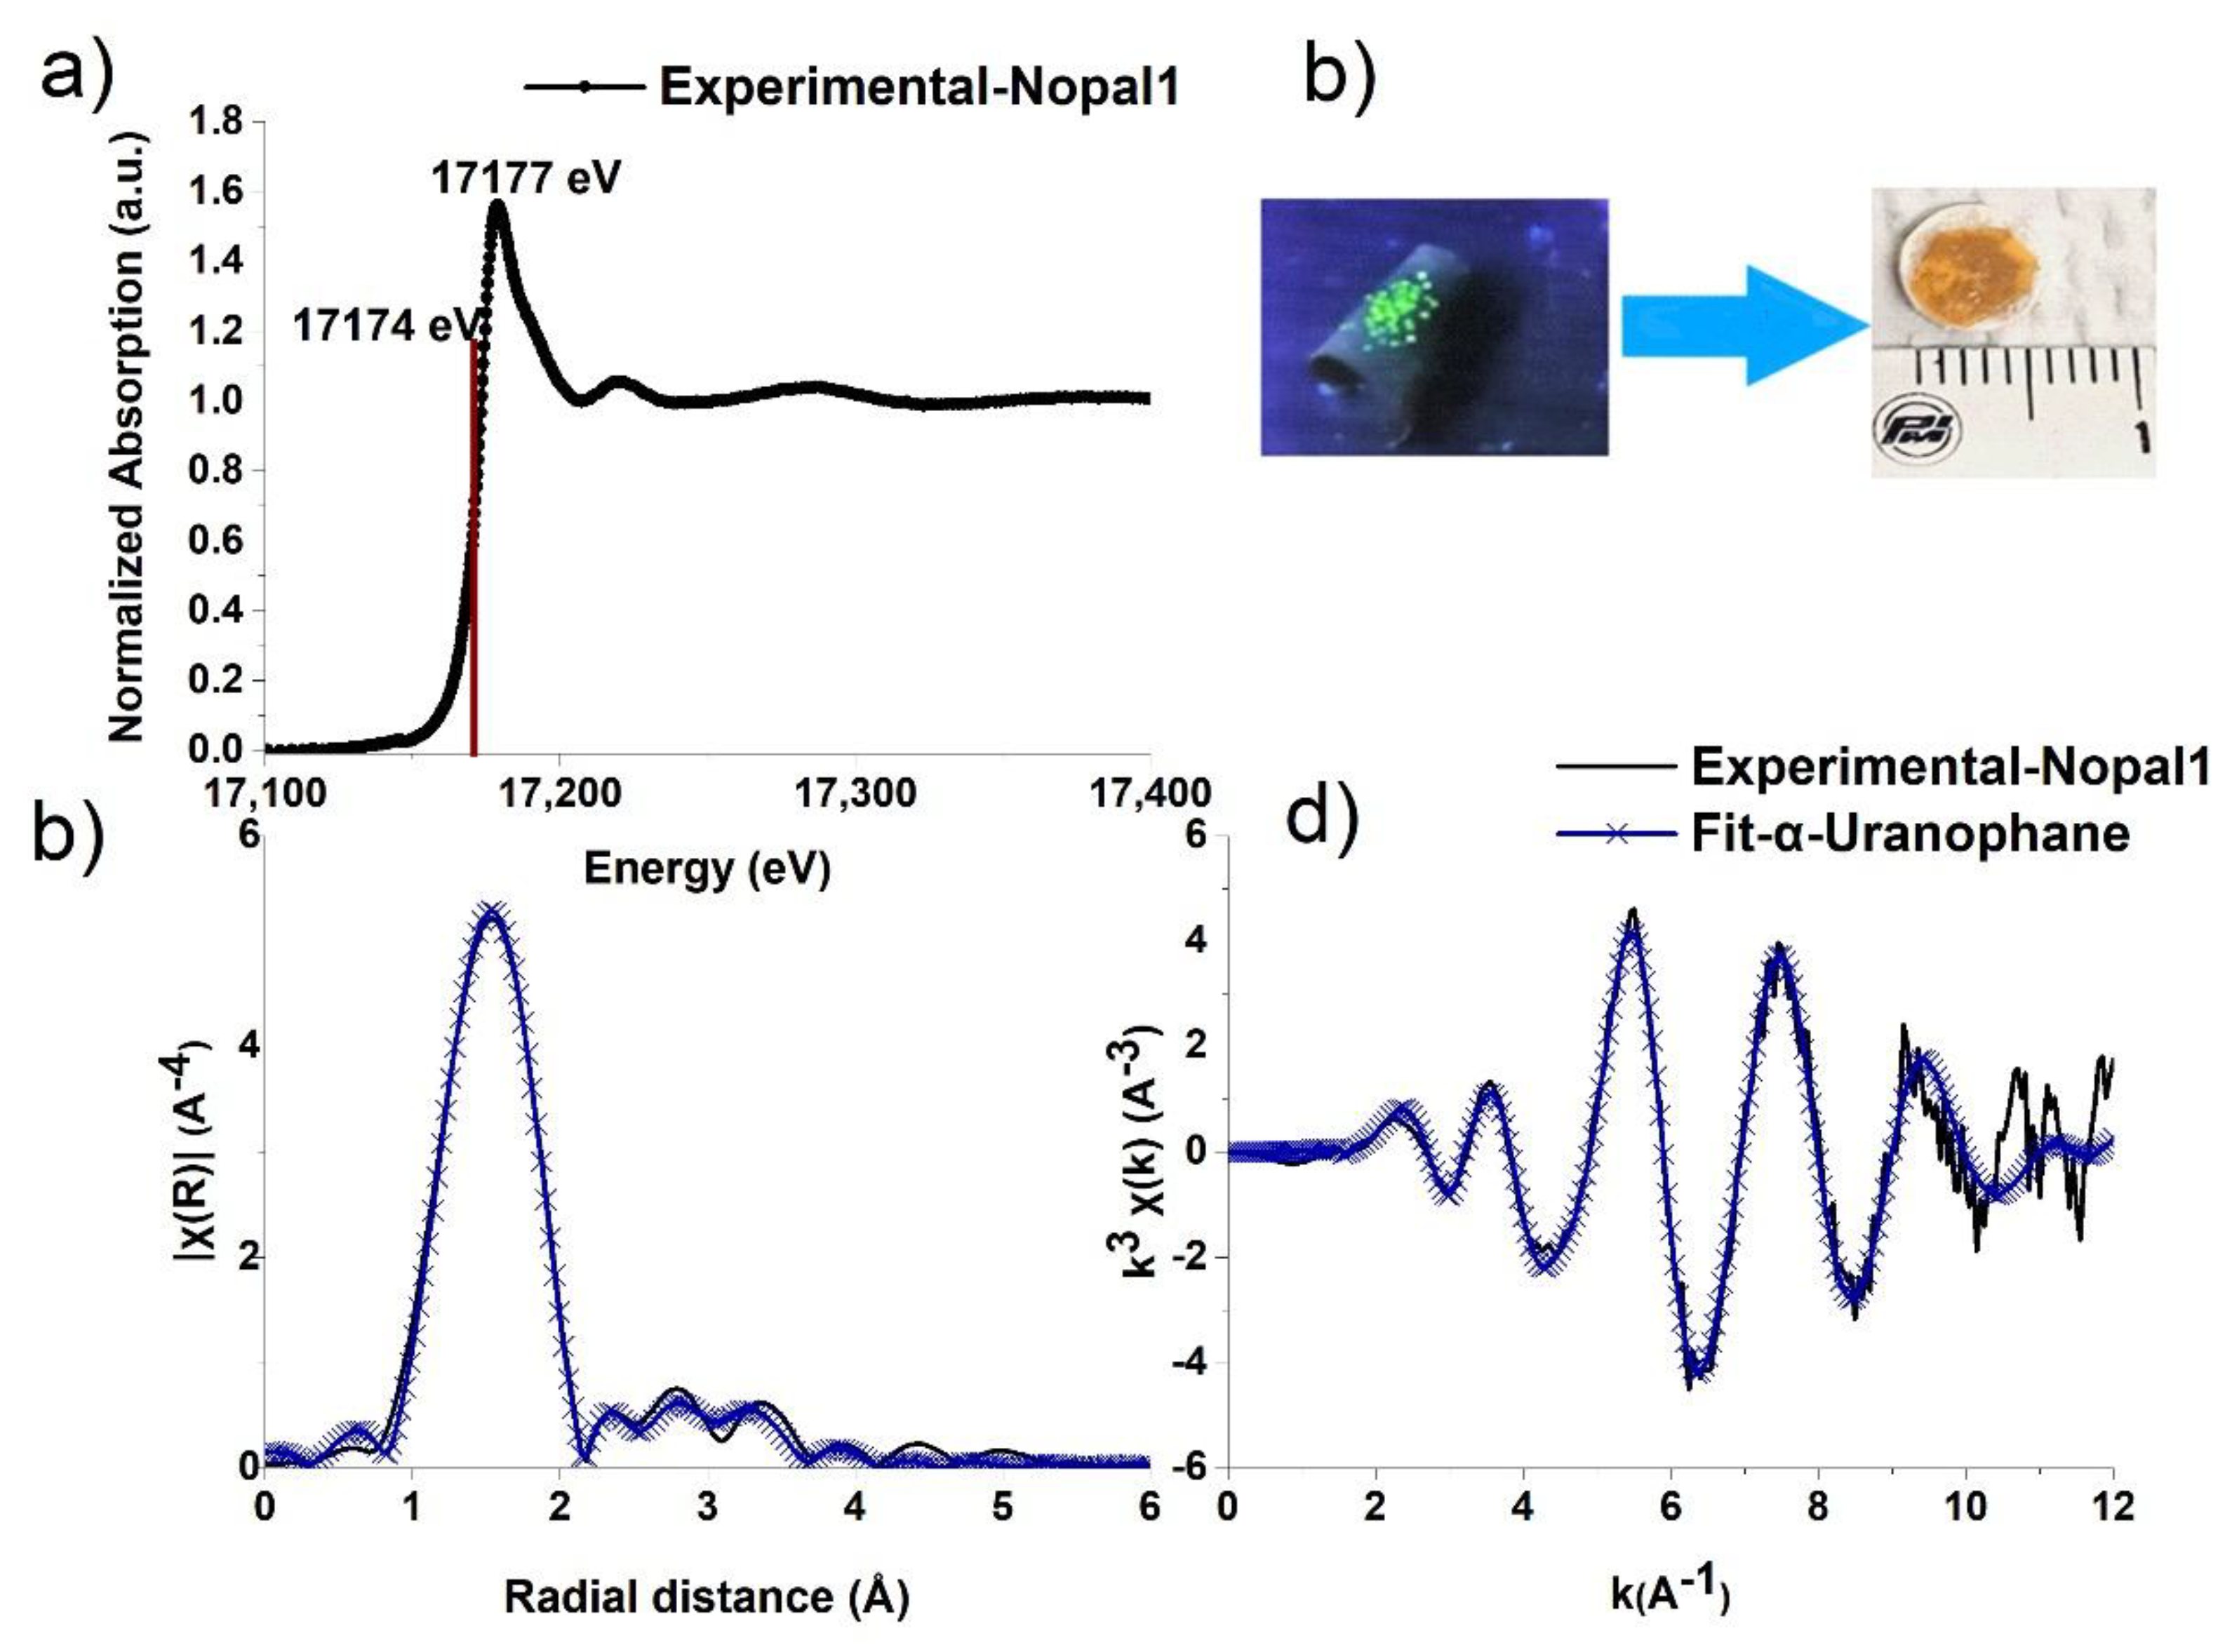
Figure 12.
Representative X-ray fluorescence spectrum of a part of the particle containing uranium, Excitation energy: 17.5 keV fitted in the PyMCA software [52].
Figure 12.
Representative X-ray fluorescence spectrum of a part of the particle containing uranium, Excitation energy: 17.5 keV fitted in the PyMCA software [52].
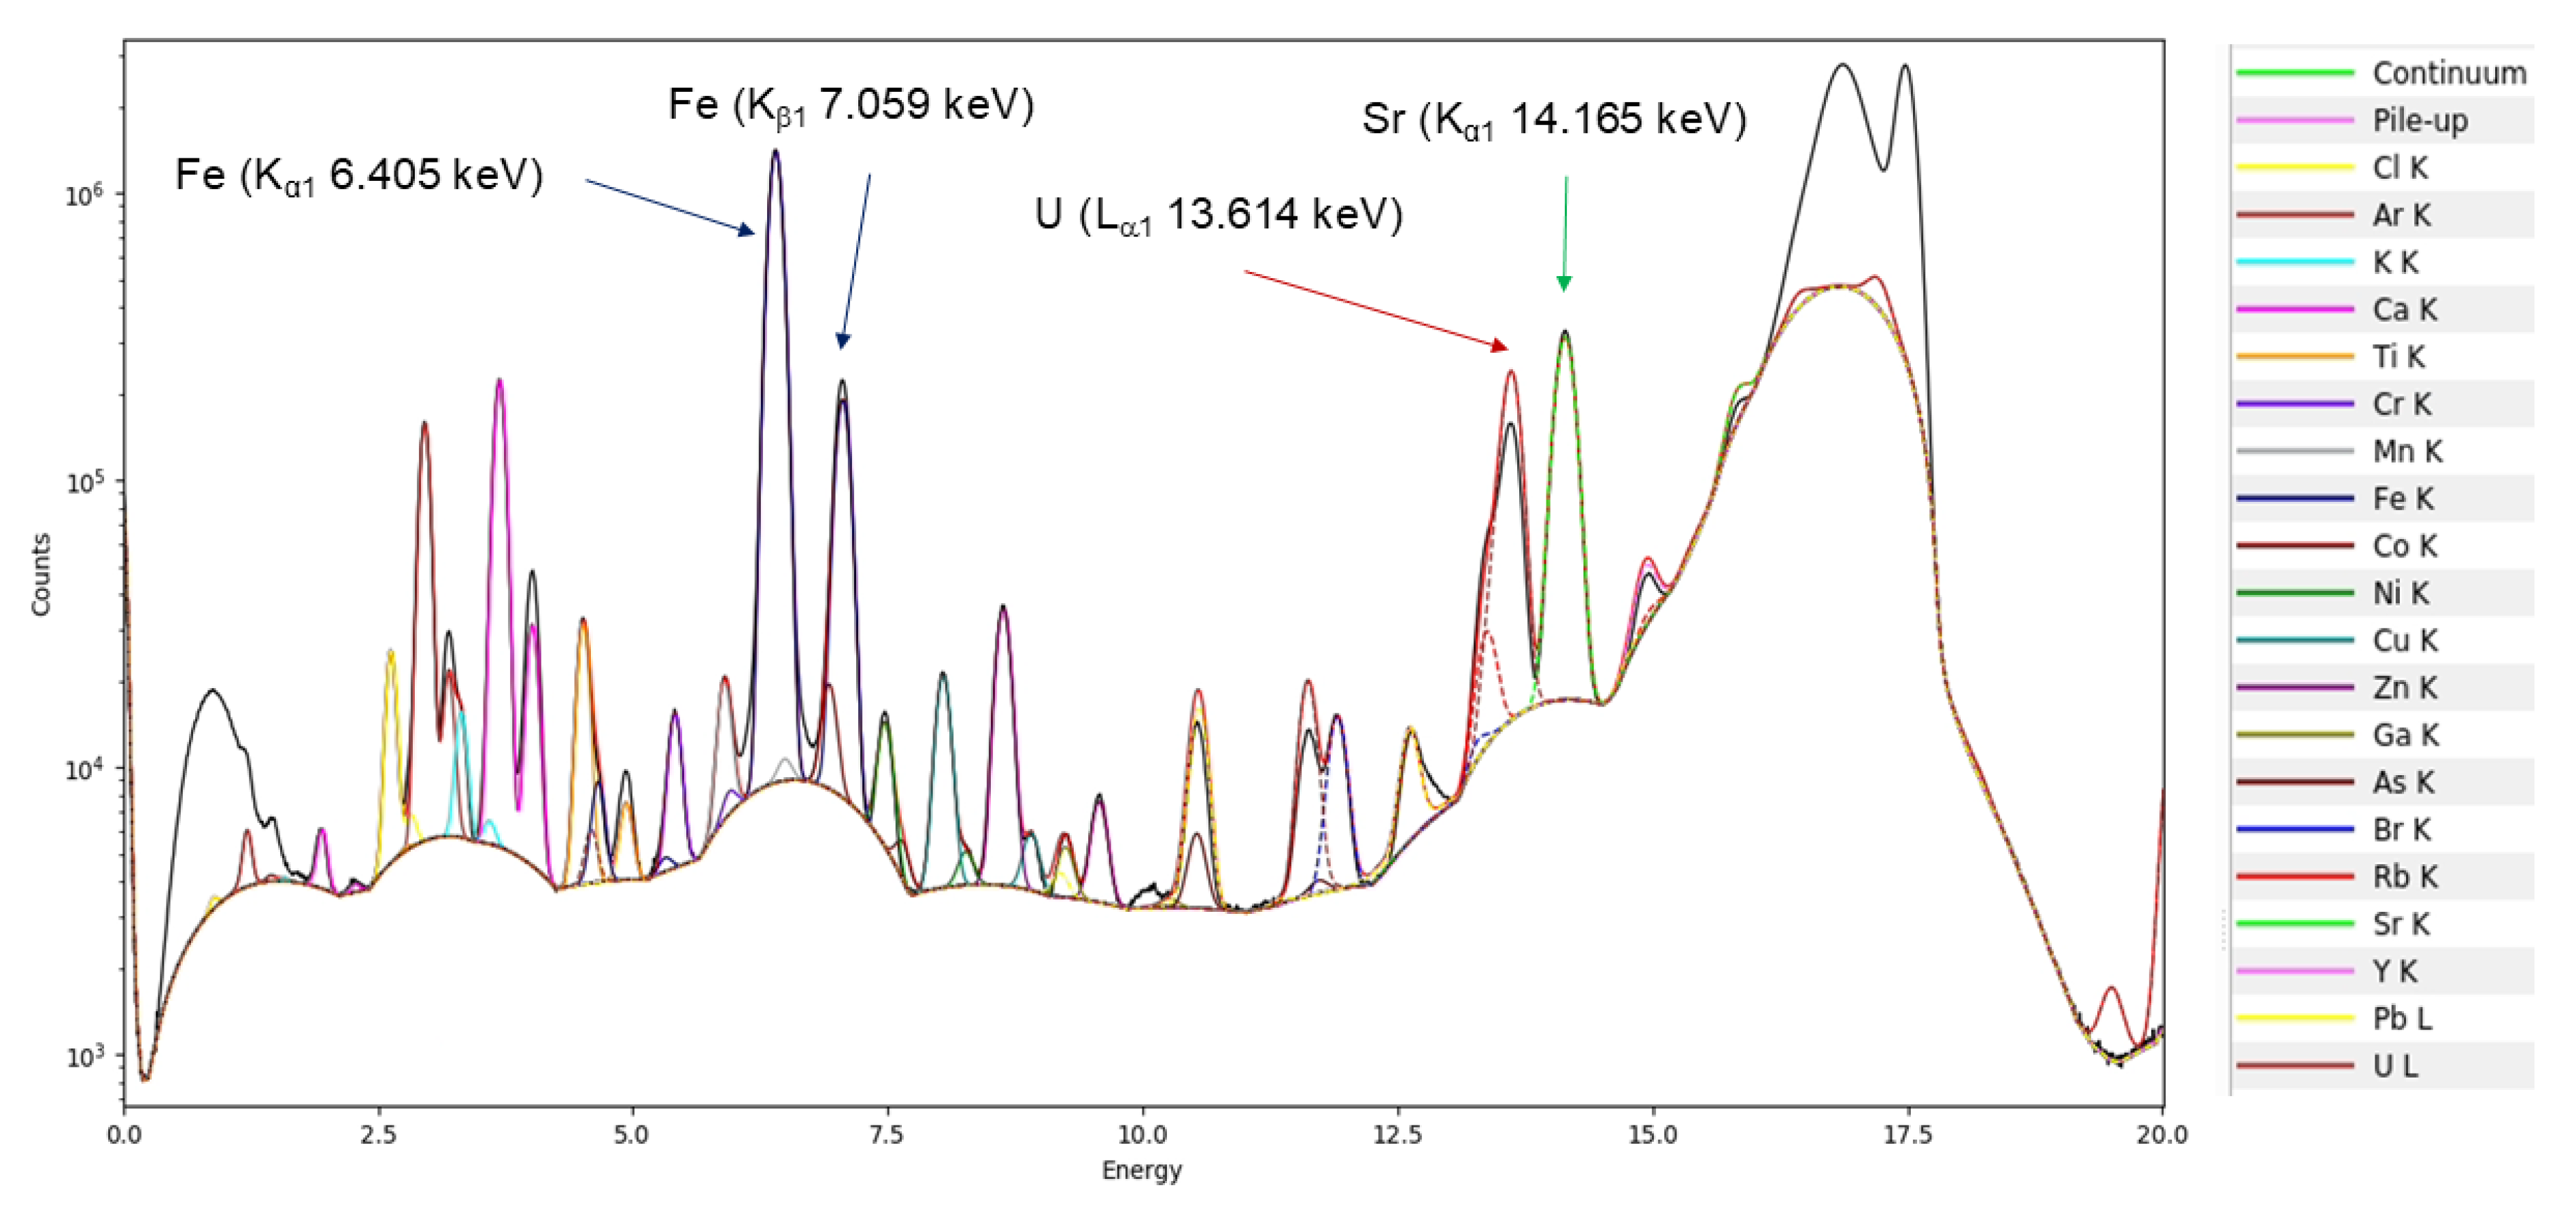
Figure 13.
µ-XRF fluorescence of slices 50, 70, and 95 of the particle CT scan, showing the distribution of Fe, U, and Sr. The tricolor map presents all three elements simultaneously for each slice.
Figure 13.
µ-XRF fluorescence of slices 50, 70, and 95 of the particle CT scan, showing the distribution of Fe, U, and Sr. The tricolor map presents all three elements simultaneously for each slice.
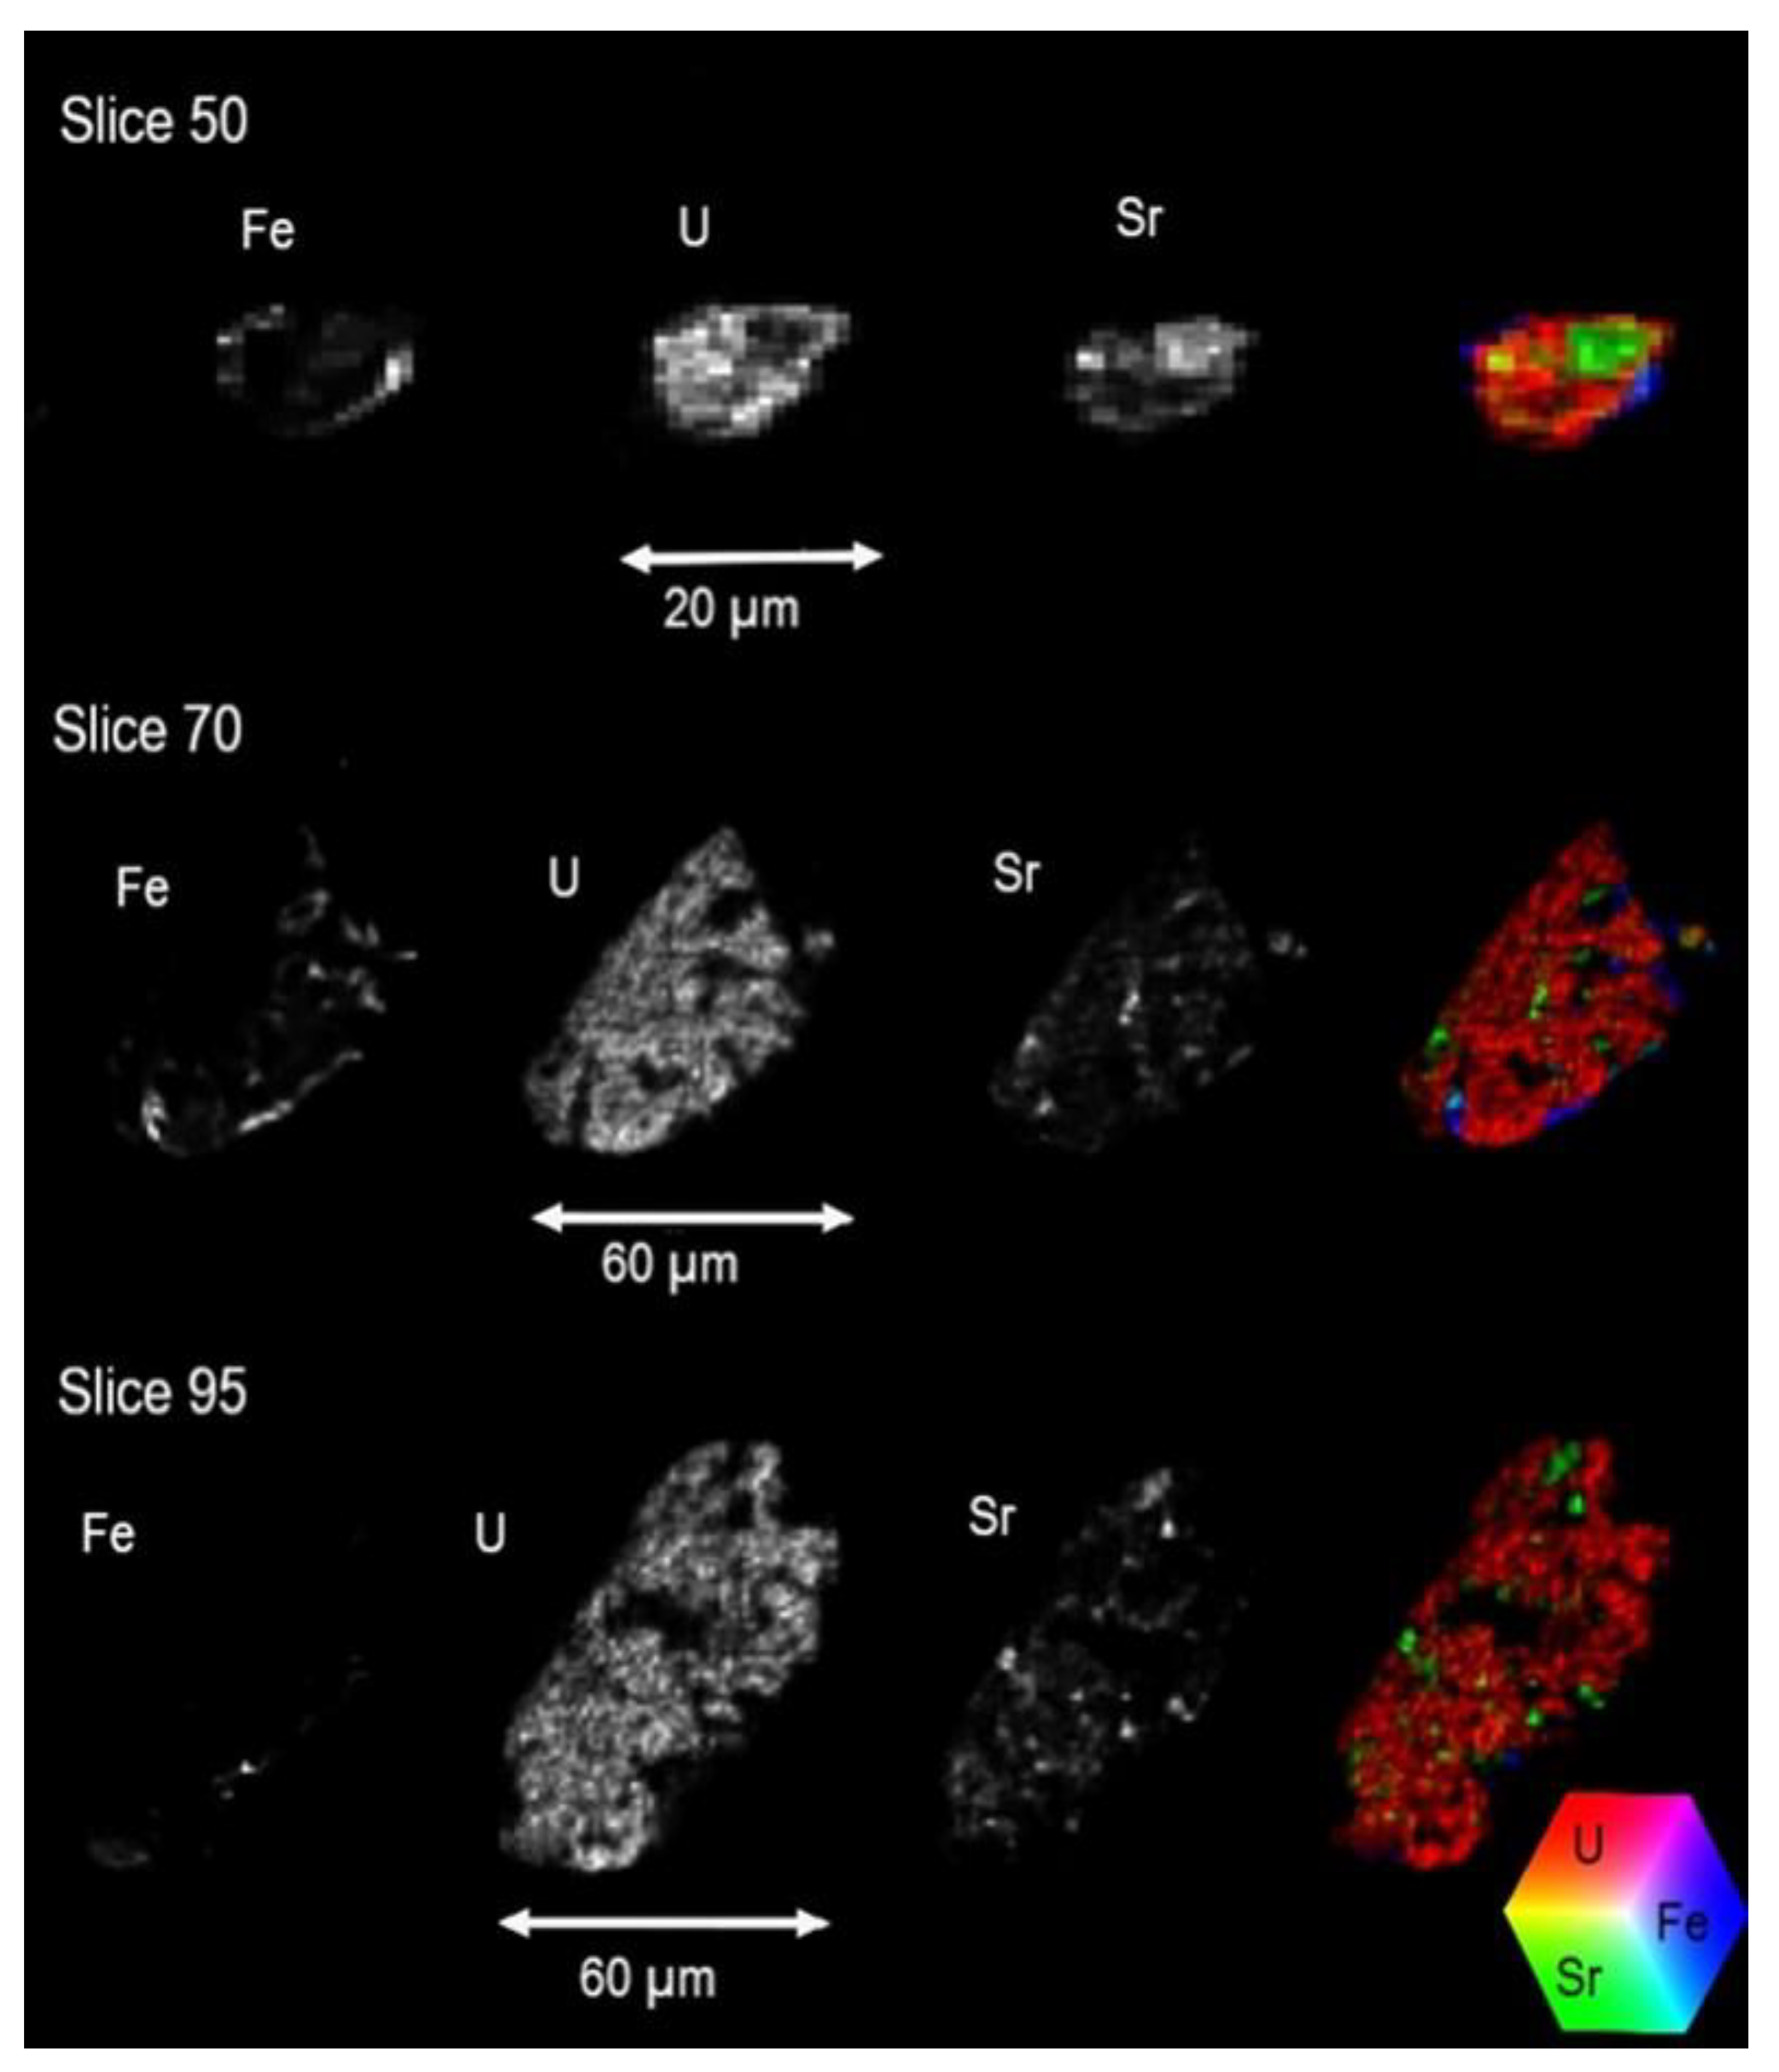
Figure 14.
Virtual cross sections of U (blue) and Sr (orange). The areas of high Sr intensity (in white) suggest that calcite in the matrix is embedded in the particle.
Figure 14.
Virtual cross sections of U (blue) and Sr (orange). The areas of high Sr intensity (in white) suggest that calcite in the matrix is embedded in the particle.
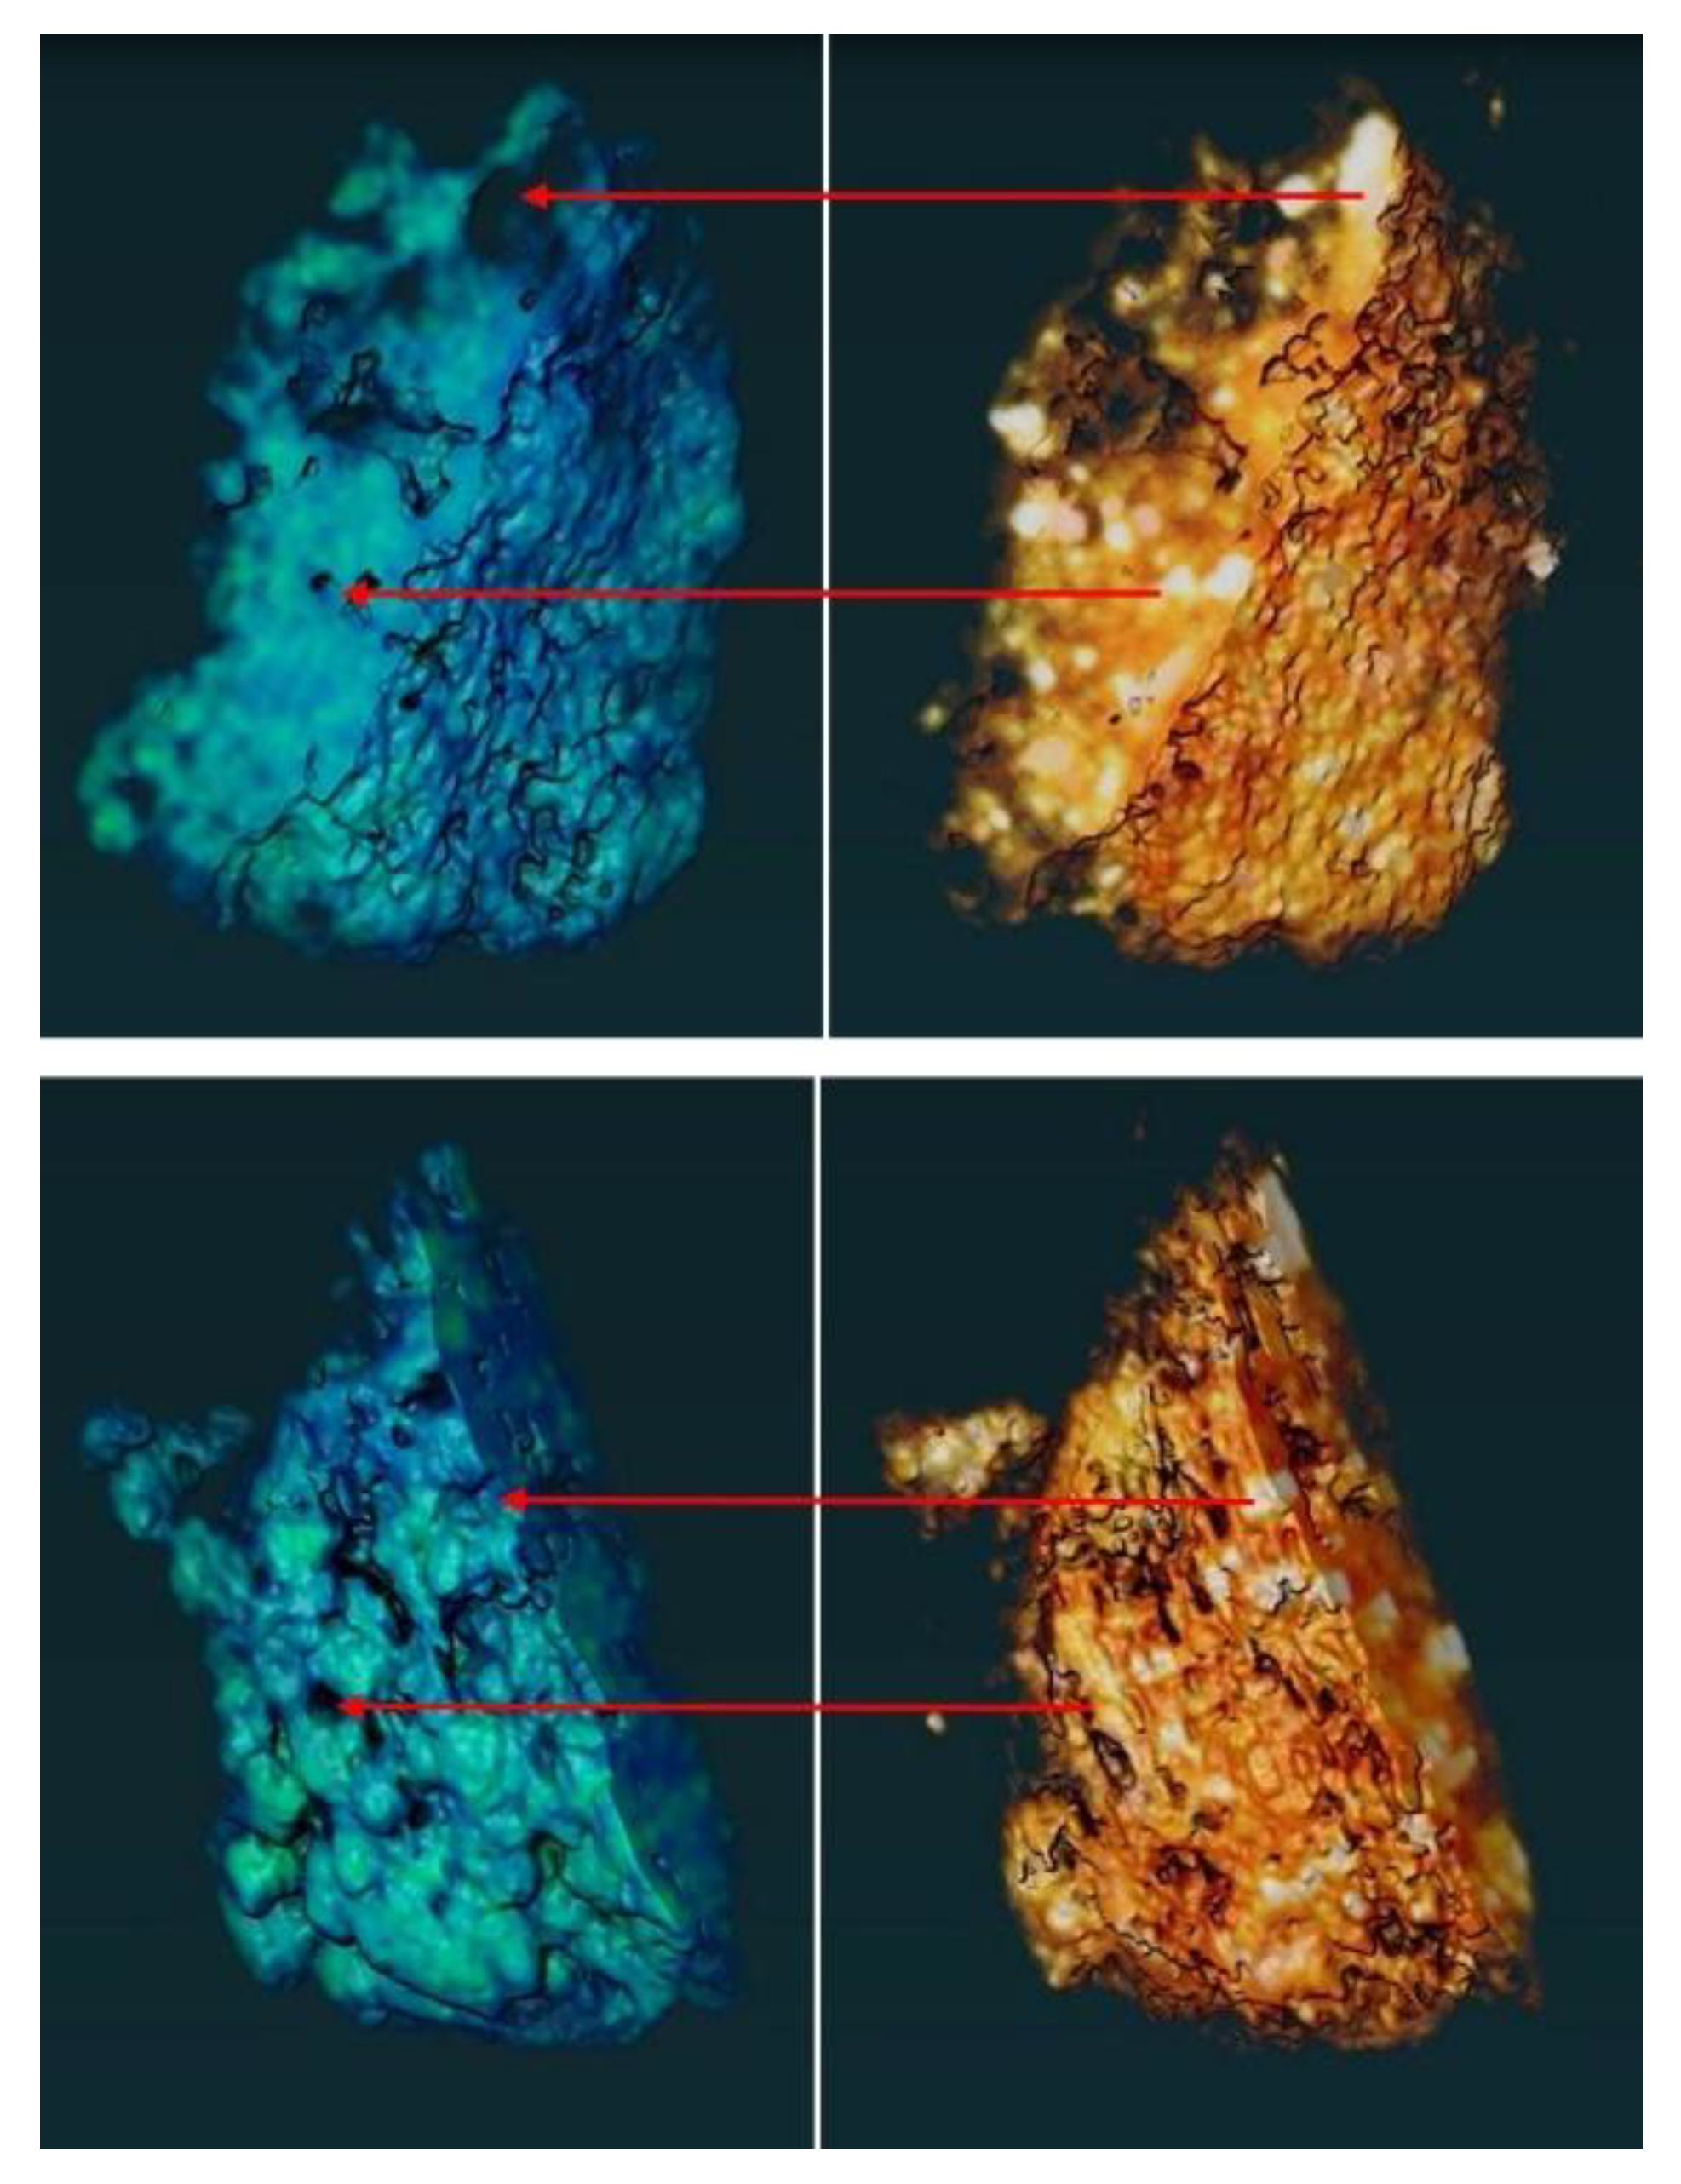
Table 1.
Mineral phase concentrations in the fine silt + clay fractions of sediments (APB-11, Tigre 3 and Nopal 1 samples) and bulk (M2 mud sample) obtained using the Rietveld method. Generic identification of each stream in the area: Peña Blanca stream (APB), El Tigre stream (AET), and Boca la Colorada stream (ABLC).
| Author | Sample | Stream | Mineral Phase (%) | |||||||
|---|---|---|---|---|---|---|---|---|---|---|
| Qz | Cal | Mnt | Mag | Ab | Sa | Kln | An | |||
| This work | APB-11 | APB | 26.7 (0.2) | 8.4(0.2) | 4.1(0.2) | 2.6(0.2) | 32.6(0.7) | 15.8(0.7) | 3.9(0.9) | 5.3(0.9) |
| Rodríguez- Guerra [27] | Tigre 3 | AET | 19.8(0.4) | 16.(0.9) | 1.0(0.2) | 1.0(0.5) | 10.4(0.1) | 11.2(0.4) | 1.8(0.5) | - |
| Rodríguez- Guerra [27] | Nopal 1 | AET | 26.7(0.3) | 9.0(0.7) | 11.0(0.9) | 2.3(0.7) | 12.3(0.1) | 9.6(0.1) | 4.3(0.9) | - |
| Pérez- Reyes [29] | M2 | ABLC | 23.5(0.7) | 22.8(0.4) | - | - | - | 22.7(0.9) | 14.7(0.2) | 16(1) |
Table 2.
The activity concentration (AConc) of the 214Pb isotope in Bq/kg. Generic identification of each stream in the area: Peña Blanca stream (APB), El Tigre stream (AET), and Boca la Colorada stream (ABLC). Generic identification of each granulometry of sediments: Fine sand (FSD), Coarse silt + clay (CSC), and Fine silt + clay (FSC).
| Author | Stream | Granulometry | Activity concentration of 214Pb | |
|---|---|---|---|---|
| Highest AConc | Lowest AConc | |||
| This work | APB | FSC | 100±2 | 50±1 |
| CSC | 77±2 | 51±1 | ||
| FSD | 51* | 51* | ||
| Rodríguez- Guerra [27] | AET | FSC | 133±2 | 76±2 |
| FSD | 217±1 | 71±1 | ||
| Hernández- Hernández [28] | ABLC | FSC | 79±1 | 33±1 |
| CSC | 71±1 | 31±1 | ||
* The average AConc in fine sand.
Table 3.
Assessed particle density of fine sand samples (Particles per gram).
| Sample | Particle density (g-1) |
|---|---|
| Puerto 3 | 2500±250 |
| Nopal 1-d | 828±82 |
| APB-11 | 386±39 |
| APB-12 | 187±18 |
| Tigre-5 | 124±12 |
Table 4.
EXAFS parameter for the fitting of uranophane structure [60] for particles of sample Nopal 1.
Table 4.
EXAFS parameter for the fitting of uranophane structure [60] for particles of sample Nopal 1.
| Name | N | S02 | σ2(Å2) | E0 | ΔR | Reff(Å) | Reff+ΔR(Å) | Uncertainty (Å) |
|---|---|---|---|---|---|---|---|---|
| U_Oax | 2 | 1.05 | 0.0053(6) | 9 | 0.009 | 1.8045 | 1.814 | 0.004 |
| U_Oeq1 | 1 | 1.05 | 0.004(1) | 9 | -0.04 | 2.2411 | 2.201 | 0.01 |
| U_Oeq2 | 2 | 1.05 | 0.004(1) | 9 | -0.04 | 2.2952 | 2.255 | 0.01 |
| U_Oeq3 | 2 | 1.05 | 0.009(5) | 9 | -0.056 | 2.4498 | 2.394 | 0.019 |
| U_Si | 1 | 1.05 | 0.012(3) | 9 | 0.03 | 3.1444 | 3.174 | 0.02 |
Symbols: N—coordination number; S02—amplitude reduction factor; σ2—mean square displacement in R; E0—energy shift of the photo electron; ∆R—change in path length of the photo electron; Reff—effective radius.
Disclaimer/Publisher’s Note: The statements, opinions and data contained in all publications are solely those of the individual author(s) and contributor(s) and not of MDPI and/or the editor(s). MDPI and/or the editor(s) disclaim responsibility for any injury to people or property resulting from any ideas, methods, instructions or products referred to in the content. |
© 2025 by the authors. Licensee MDPI, Basel, Switzerland. This article is an open access article distributed under the terms and conditions of the Creative Commons Attribution (CC BY) license (http://creativecommons.org/licenses/by/4.0/).
Copyright: This open access article is published under a Creative Commons CC BY 4.0 license, which permit the free download, distribution, and reuse, provided that the author and preprint are cited in any reuse.


