
Submitted:
20 February 2025
Posted:
24 February 2025
You are already at the latest version
Abstract
Machine learning (ML) is becoming more common in the insurance industry to predict costs and help set prices. Accurate predictions help insurance companies set fair prices while keeping insurance affordable for customers. However, many ML models are difficult to understand, making it unclear how they make decisions. This study focuses on improving prediction accuracy and making models easier to interpret by using hyperparameter tuning with Optuna and feature importance analysis with SHAP (SHapley Additive Explanations). Three models—Ridge Regression, Random Forest, and XGBoost—were optimized and tested. The results show that XGBoost performed the best, with a median Rsquared of \textbf{0.8655} and RMSE of \textbf{4136.59}. SHAP analysis found that \textbf{smoking status, BMI, and age} were the most important factors affecting insurance costs. These findings show that using both model tuning and explainability tools helps improve ML models for insurance pricing.
Keywords:
machine learning
; insurance costs
; model optimization
; explainability
1. Introduction
Machine learning (ML) is commonly used in the insurance industry to predict costs and set prices. Accurate predictions help insurance companies charge fair prices while making sure that policyholders are not paying too much. By analyzing customer information such as age, health conditions, and lifestyle choices, ML models can estimate insurance charges more effectively than traditional methods. However, while ML models can provide accurate predictions, they are often difficult to understand. Many models function like "black boxes," meaning that even experts struggle to explain how they make decisions. This has led to an increased focus on explainability in ML, especially for sensitive applications like healthcare and insurance pricing [1,2,3].
This lack of transparency creates challenges in the insurance industry. Without clear explanations, policyholders may find it difficult to understand why they are being charged a certain amount, and insurers may struggle to justify pricing decisions. This study aims to address this issue by improving both accuracy and interpretability. To do this, we use Optuna [4], a powerful tool that helps adjust model settings through hyperparameter tuning, and SHAP (SHapley Additive Explanations) [5], which helps analyze important features and explain how they affect predictions.
By applying these methods, we can identify the most important factors influencing insurance costs while improving the accuracy of predictions. This approach ensures that both insurance companies and customers can see which factors have the biggest impact on pricing. Ultimately, this study demonstrates how ML models can be optimized to improve transparency, fairness, and decision-making in the insurance industry.
2. Methodology
2.1. Dataset and Pre-Processing
The dataset which is used for this analysis is sourced from Kaggle. It includes different factors such as age, BMI, smoking status, and region. The target variable is "Insurance charges". To prepare the data for analysis the following steps were taken:
- First, categorical variables like sex, smoker, and region were converted into numerical form using one-hot encoding.
- Next, numerical features such as age, BMI and the number of children were standardized to ensure consistency.
- Finally, the data set was divided into training, validation, and test sets using five different random seeds to make the model results more reliable.
2.2. Machine Learning Models
In this study, three different machine learning models were tested to determine which one works best for predicting insurance costs. Each model has its own way of learning patterns in the data and making predictions:
- Ridge Regression: This is a simple model that tries to find patterns using a straight-line approach, also known as a linear regression. However, unlike basic regression models, Ridge Regression includes a penalty term to prevent overfitting [3]. Overfitting happens when a model memorizes the training data instead of learning general patterns, which can lead to poor performance on new data. Ridge Regression helps control this by making sure that the model does not rely too heavily on any single feature.
- Random Forest: This model is made up of multiple decision trees, which are like flowcharts that split the data into smaller groups to make predictions. Instead of using just one tree, Random Forest combines many trees and takes an average of their predictions [6]. This method reduces errors and makes the model more stable, meaning it performs better on new data. Because Random Forest uses multiple trees, it is less likely to overfit compared to a single decision tree.
- XGBoost: This is an advanced model that builds on the idea of decision trees but takes it a step further. It works by making a series of trees, where each tree learns from the mistakes of the previous one. This process, called "boosting," allows the model to continuously improve its predictions by correcting errors along the way. XGBoost is known for being fast and highly accurate, making it one of the best models for complex datasets like insurance cost prediction.
These models were tested to compare their accuracy and reliability in predicting insurance costs. By evaluating their performance, we can determine which model provides the most accurate and useful predictions for real-world applications.
2.3. Hyperparameter Optimization with Optuna
To make these models work better, Optuna [4] was used to fine-tune their settings, also known as hyperparameters. Hyperparameters are adjustable settings that control how a model learns from data. Choosing the right hyperparameters is important because it can significantly improve model performance.
For Ridge Regression, the alpha value was adjusted to control regularization. Regularization helps prevent overfitting by reducing the impact of less important features, ensuring the model generalizes well to new data.
For Random Forest, two key parameters were optimized: the number of trees (n_estimators) and tree depth (max_depth). The number of trees determines how many decision trees are used in the model, while tree depth controls how many times each tree can split the data. More trees and deeper splits can lead to better accuracy, but they can also increase complexity and computation time, so finding the right balance is essential.
For XGBoost, three important parameters were fine-tuned: learning rate, number of trees, and tree depth. The learning rate controls how much the model adjusts with each update, with smaller values leading to slower but more stable learning. The number of trees and tree depth work similarly to Random Forest, helping the model capture complex relationships in the data.
The best settings for each model were selected based on the lowest Root Mean Squared Error (RMSE) score in the validation set. By using Optuna, the tuning process was automated, allowing the model to test different hyperparameter combinations efficiently and find the best configuration for accurate predictions.[7]
2.4. Model Evaluation Metrics
The performance of the models was measured using three key metrics:
- Rsquared Score: Shows how well the model explains the variation in insurance charges. A higher value means better predictions.
- Root Mean Squared Error (RMSE): Measures how far the predictions are from the actual values. A lower RMSE means more accurate predictions.
- Mean Absolute Error (MAE): Tells us the average difference between predicted and actual values. Lower values mean better accuracy.
2.5. SHAP Explainability and Feature Selection
SHAP was used to explain model predictions and understand feature importance [5,8]. Features that had least impact on predictions were considered for removal to simplify the model without significantly reducing accuracy.Feature importance analysis is a critical component in machine learning applications in healthcare, as it helps in making fair and interpretable decisions [9].
3. Results
Explainability methods, such as SHAP, help in making machine learning models more interpretable for stakeholders in the insurance sector [10].
Table 1 provides a detailed breakdown of model performance across different random seeds. Evaluating results across multiple seeds ensures the models’ consistency and reliability. XGBoost, Random Forest, and Ridge Regression were tested, and the performance metrics varied slightly due to different data splits. The results show that XGBoost consistently achieves the highest R² score and the lowest RMSE and MAE across multiple seeds, indicating its robustness in predicting insurance costs.
Table 2 summarizes the median performance of each model across different seeds. The XGBoost model outperforms Ridge Regression and Random Forest, achieving a median R² of 0.8655 and the lowest RMSE of 4136.59, demonstrating its superior predictive ability. These findings suggest that tree-based ensemble methods, particularly boosting algorithms, perform best in modeling non-linear relationships in insurance cost predictions.
Figure 1 presents a boxplot visualization comparing the performance of Ridge Regression, Random Forest, and XGBoost across R², RMSE, and MAE. The plot confirms that XGBoost consistently produces better results across different test seeds, reinforcing its effectiveness.
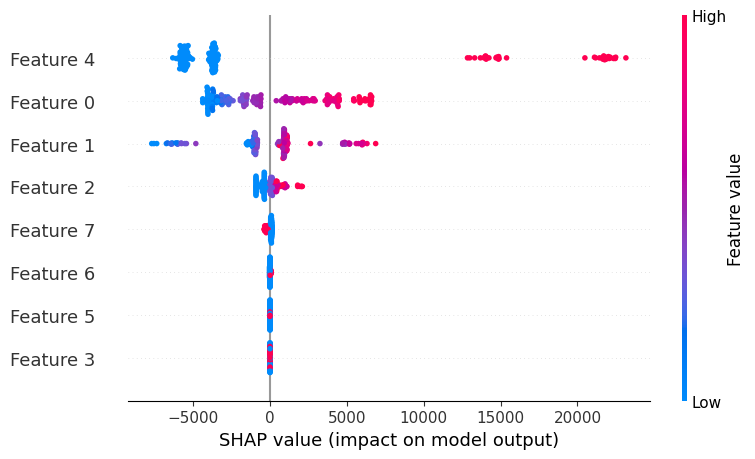
SHAP analysis was conducted to understand which features had the most impact on predicting insurance costs. Figure 2a shows the SHAP summary plot, which visualizes how different input features contributed to the model’s predictions. The color gradient indicates whether a feature’s impact increased or decreased the predicted cost. The analysis confirms that smoking status, BMI, and age were the most influential factors, with smoking having the largest effect on insurance charges.
Figure 2b further quantifies these findings by ranking the average SHAP values for each feature. Smoking status contributed the most to higher costs, followed by BMI and age. Other variables, such as the number of children and region, had a much smaller effect. This analysis provides deeper insights into the model’s decision-making process, ensuring greater transparency in how insurance prices are predicted.
4. Discussion
The study demonstrated that XGBoost, with optimized hyperparameter’s, is the best model for predicting insurance costs [1,2]. The results suggest that tree-based models can capture complex relationships in insurance data better than linear models. The use of SHAP also provided valuable insights into feature importance, showing that smoking status, BMI, and age are key drivers of insurance charges. Future work can explore more advanced ensemble techniques or include additional variables, such as medical history, to improve prediction accuracy [3]. Additionally, integrating deep learning approaches could further enhance model performance in large-scale insurance datasets [9].
5. Conclusion
This study shows that improving machine learning models can help make better predictions for insurance costs. By adjusting model settings with Optuna and using SHAP to understand important factors, XGBoost was found to be the best model. It had the highest accuracy with a median R² of 0.8655 and an RMSE of 4136.59. The SHAP analysis showed that smoking status, BMI, and age had the biggest impact on insurance costs.
These results are useful for the insurance industry. More accurate predictions can help companies set fair prices while making sure customers are not overcharged. Also, SHAP makes the model more understandable, helping both insurers and policyholders see why certain factors affect pricing.
For future improvements, deep learning methods like neural networks could be tested to find more complex patterns in the data [9]. Adding more details like medical history, lifestyle, or income level could also improve predictions. Another idea is to combine different models to make predictions even stronger and more reliable [6].
Overall, this study highlights the importance of using both model tuning and explainability tools to improve predictions. Future work can continue improving these methods to make insurance pricing more accurate, fair, and easy to understand.
6. Code and Data Availability
The code used for this study is available in the following GitHub repository: GitHub Repository Link.
The dataset used for this study is publicly available on Kaggle: [11] Kaggle Insurance Dataset. For reproducibility, all scripts and preprocessing steps are documented in the GitHub repository.
References
- Mehrabi, N.; Gowda, S.N.; Morstatter, F. Predicting Medical Costs Using Machine Learning Approaches: A Case Study on Healthcare Claims Data. Health Informatics Journal 2021, 27, 14604582211058018. [Google Scholar]
- Patel, J.; Doshi, R. Medical Insurance Cost Prediction Using Machine Learning. International Journal for Research in Applied Science & Engineering Technology (IJRASET) 2020.
- Sharma, R.; Singh, A. A comparative study of machine learning algorithms for health insurance cost prediction. International Journal of Computer Science and Information Security 2021. [Google Scholar]
- Akiba, T.; Sano, S.; Yanase, T.; Ohta, T.; Koyama, M. Optuna: A Next-generation Hyperparameter Optimization Framework. In Proceedings of the Proceedings of the 25th ACM SIGKDD International Conference on Knowledge Discovery & Data Mining, 2019.
- Lundberg, S.M.; Lee, S.I. A Unified Approach to Interpreting Model Predictions. In Proceedings of the Advances in Neural Information Processing Systems (NIPS), 2017.
- Zhang, H.; Wang, Y. Insurance Claim Cost Prediction Using Ensemble Machine Learning Models. IEEE Transactions on Computational Intelligence and AI in Healthcare 2022. [Google Scholar]
- McCoy, T.H.; Perlis, R.H.; Ghosh, S. Deep Learning for Prediction of Population Health Costs. Nature Medicine 2020. [Google Scholar]
- Ribeiro, M.T.; Singh, S.; Guestrin, C. "Why Should I Trust You?" Explaining the Predictions of Any Classifier. In Proceedings of the Proceedings of the 22nd ACM SIGKDD International Conference on Knowledge Discovery and Data Mining, 2016.
- Kaur, H.; Kumari, V. Health Insurance Cost Prediction Using Deep Neural Network. Journal of Big Data 2020. [Google Scholar]
- Orji, U.; Ukwandu, E. Machine Learning For An Explainable Cost Prediction of Medical Insurance. arXiv preprint 2023, arXiv:cs.LG/2311.14139. [Google Scholar] [CrossRef]
- Choi, M. Medical Cost Personal Datasets, 2018. Kaggle Dataset.
Figure 1.
Model Performance Comparison Across R², RMSE, and MAE
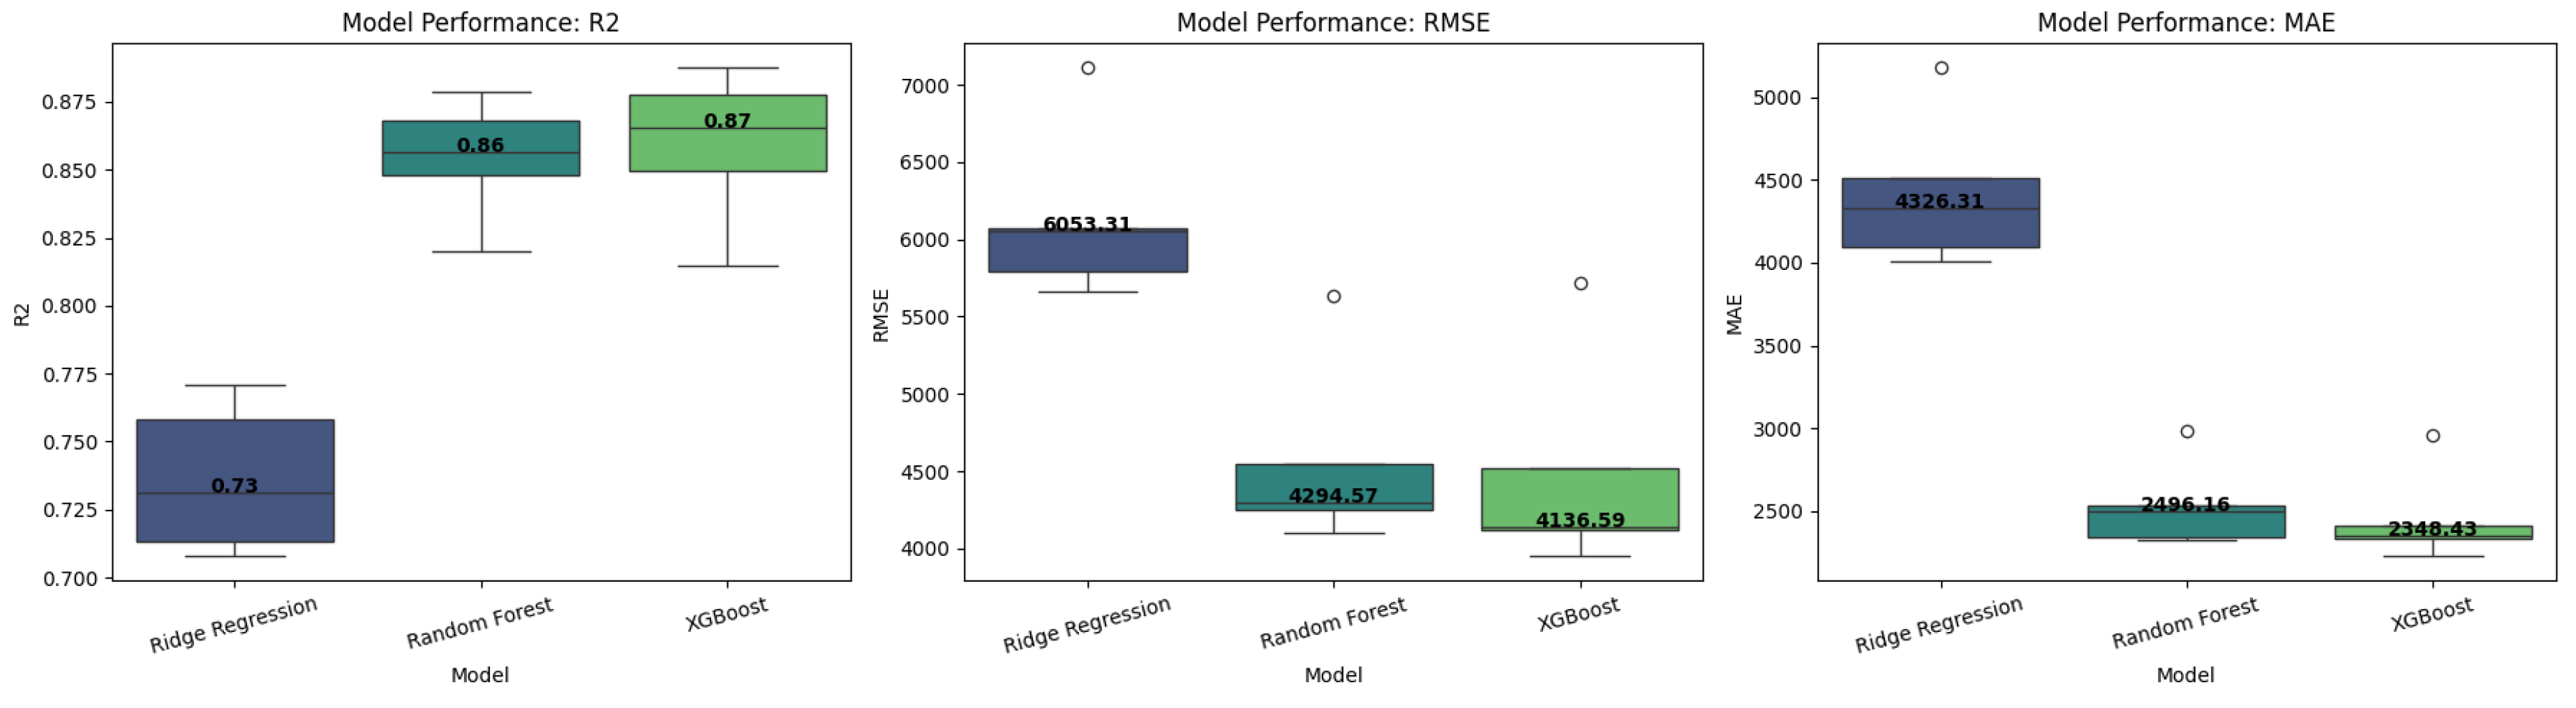
Figure 2.
SHAP analysis showing feature contributions to model predictions.
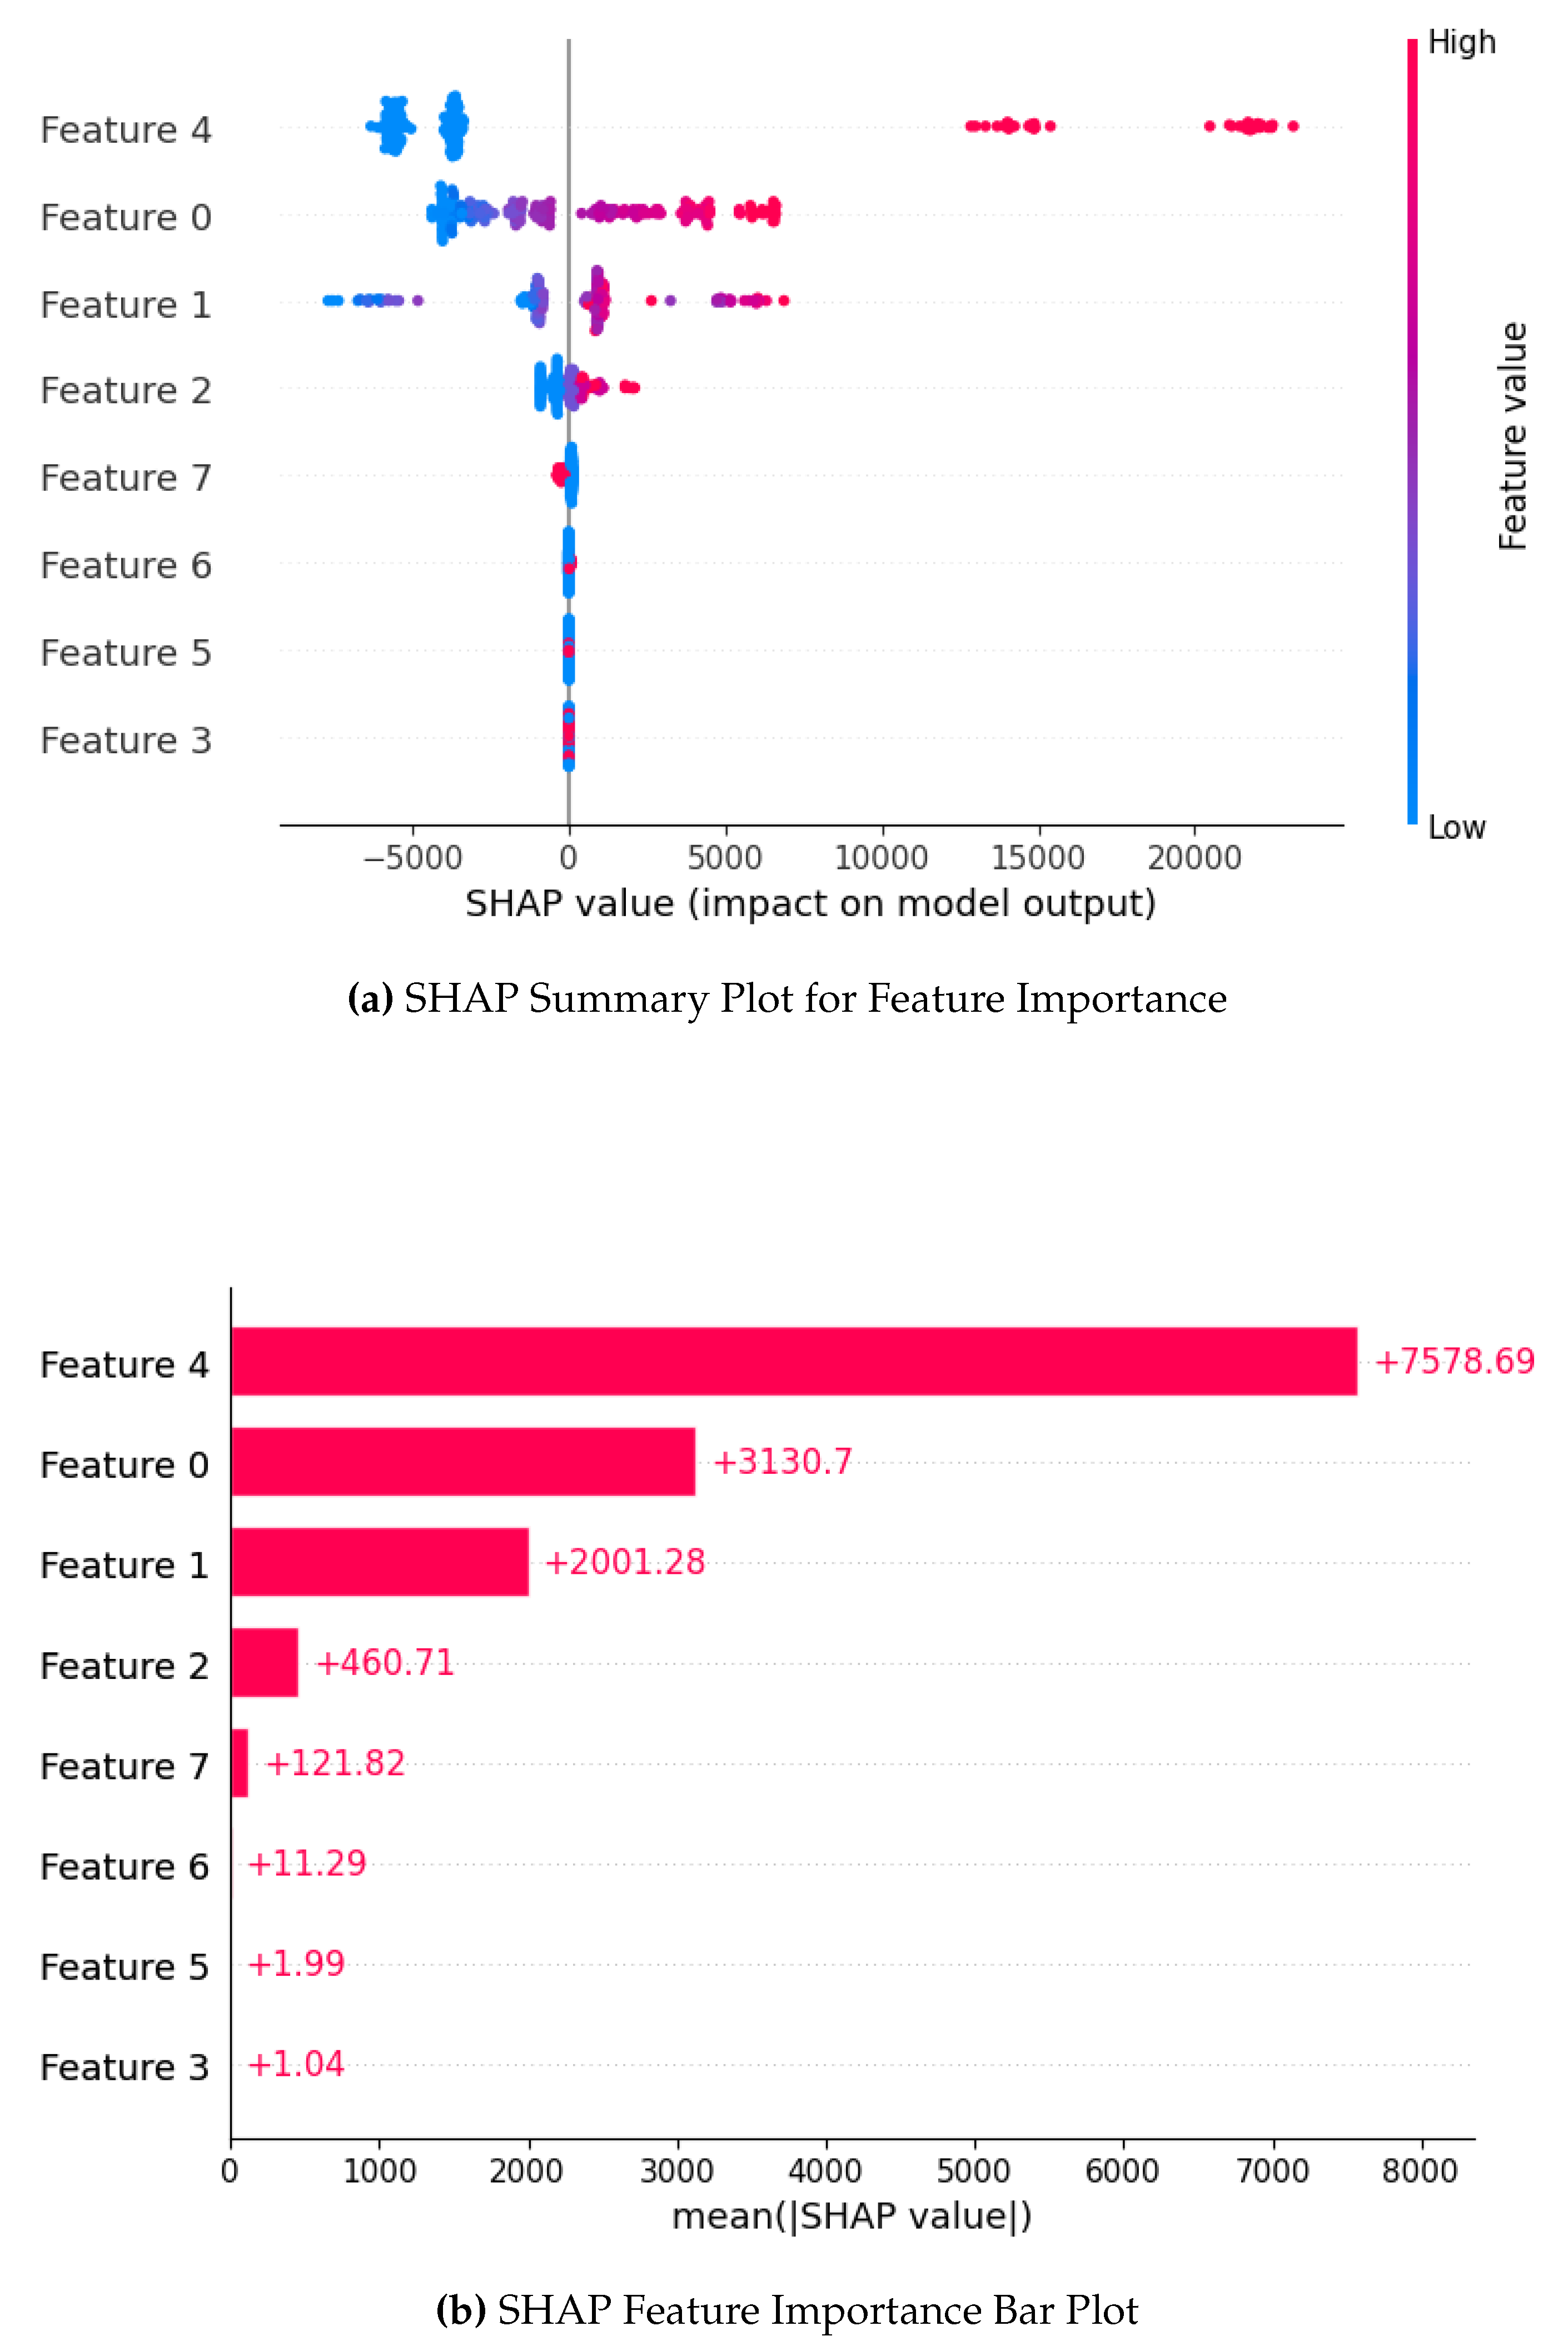

Table 1.
Model Performance Across Different Seeds
| Model | Seed | R² Score | RMSE | MAE |
| Ridge Regression | 313718 | 0.7132 | 7108.67 | 5177.36 |
| Random Forest | 313718 | 0.8198 | 5635.96 | 2984.42 |
| XGBoost | 313718 | 0.8147 | 5714.82 | 2960.39 |
| Ridge Regression | 456789 | 0.7581 | 5791.69 | 4098.25 |
| Random Forest | 456789 | 0.8786 | 4102.73 | 2325.73 |
| XGBoost | 456789 | 0.8875 | 3950.28 | 2228.08 |
| Ridge Regression | 567890 | 0.7079 | 6067.57 | 4326.31 |
| Random Forest | 567890 | 0.8567 | 4249.98 | 2496.16 |
| XGBoost | 567890 | 0.8655 | 4117.20 | 2348.43 |
| Ridge Regression | 678901 | 0.7310 | 6053.31 | 4508.03 |
| Random Forest | 678901 | 0.8483 | 4546.45 | 2534.06 |
| XGBoost | 678901 | 0.8498 | 4523.46 | 2410.98 |
| Ridge Regression | 789012 | 0.7708 | 5665.55 | 4009.71 |
| Random Forest | 789012 | 0.8683 | 4294.57 | 2346.07 |
| XGBoost | 789012 | 0.8778 | 4136.59 | 2333.88 |
Table 2.
Model Performance Results
| Model | R² Score | RMSE | MAE |
| Ridge Regression | 0.7310 | 6053.31 | 4326.31 |
| Random Forest | 0.8567 | 4294.57 | 2496.16 |
| XGBoost | 0.8655 | 4136.59 | 2348.43 |
Disclaimer/Publisher’s Note: The statements, opinions and data contained in all publications are solely those of the individual author(s) and contributor(s) and not of MDPI and/or the editor(s). MDPI and/or the editor(s) disclaim responsibility for any injury to people or property resulting from any ideas, methods, instructions or products referred to in the content. |
© 2025 by the authors. Licensee MDPI, Basel, Switzerland. This article is an open access article distributed under the terms and conditions of the Creative Commons Attribution (CC BY) license (http://creativecommons.org/licenses/by/4.0/).
Copyright: This open access article is published under a Creative Commons CC BY 4.0 license, which permit the free download, distribution, and reuse, provided that the author and preprint are cited in any reuse.


