Submitted:
20 February 2025
Posted:
21 February 2025
You are already at the latest version
Abstract
The Okavango Delta in Botswana is one of the world’s most valuable wetland resources because of its unique characteristics and biological diversity. The seasonal, annual, and decadal inundated extent of the Okavango Delta in north-west Botswana is highly variable. Therefore, amphibian habitat is under threat from a variety of factors, including habitat loss caused by the loss of wetlands and upland terrestrial habitat, habitat fragmentation, habitat degradation caused by urban pollutants and movement behaviors in the presence of light and/or sound pollution. Previous study showed that there are approximately 33 amphibian species in the Okavango Delta and 24 of them were reported in places surrounding the Delta. Limited research has been done on the diversity of amphibian species in these areas, especially using citizen science and audio recordings. To address this gap the study aimed to determine the amphibian species diversity in the Daunara, Mochaba and Chanoga and compare the amphibian diversity in the different study sites. A total of 24 questionnaires were administered for our research: with eight distributed at each of the three sites to the local people in that area targeting fisherman and canoe (mokoro) operators. The relative frequency of citation (RFC) and Anova were calculated to determine significance difference in species diversity. Audio recordings were collected at each site and analyzed with RavenPro 1.6.5 software to make spectrograms, and Shannon wiener diversity index was used to calculate the species diversity. The results from the questionnaires showed that there was a total of 18 amphibian species identified in Daunara, 13 in Mochaba and 11 in Chanoga. The RFC value showed that the most common species were the Pyxicephalus adspersus (Giant African bullfrog) and Xenopus muelleri (Mullers Platana) with RFC values of 0.875. The p-value from the ANOVA test was 0.962 which is greater than α-value 0.05 which means there was no significant difference between the means of the three groups from the respondent data. The Shannon-wiener diversity index showed that Mochaba had a high amphibian diversity of 1.08892 as compared to Chanoga with 0.63379 and Daunara with 0.67302. Further research is needed to analyze the spatiotemporal variation in species diversity under changing environmental conditions.
Keywords:
Amphibian diversity
; Okavango Delta components
; Environmental indicators
; Audio spectrograms
; Citizen Science
1. Introduction
The Okavango Delta is the largest inland delta in the world. It is located in north western part of Botswana and covers about 28 000km2 and a vast number of species have been identified which include 1 300 species of plants, 71 species of fish, 33 species of amphibians, 64 species of reptiles, 444 species of birds and 122 species of mammals (Ramberg et al., 2006). The Okavango Delta is unique due to its freshwater alluvial fan which means the rivers do not reach the sea and this keeps the water fresh and not salty. There are three basic islands that are found in the Okavango Delta which include the long ribbon-like islands, round islands and the chief’s island which is the largest of the three. Previous study by le Roux (2010) reported that approximately 33 amphibian species are found in the Okavango Delta and 24 of those species were reported in rivers and lagoon that were found outside the delta. Some of the reported species in the area include Pyxicephalus adspersus (Giant African frog), Xenopus muelleri (Mulleris Platana) and Hemisus marmoratus (Shovel-nosed frog).
Amphibians are one of the most unique species to exist on earth as they live on both water and land, they require moist environment to survive. “First appearing about 340 million years ago during the Middle Mississippian Epoch, they were one of the earliest groups to diverge from ancestral fish-tetrapod stock during the evolution of animals from strictly aquatic forms to terrestrial types” (Duellman & Zug, 2023). One of the most looked down upon species in the world are the amphibians, even though they are of great importance in the diversity of the world. These animals are cold-blooded, have a layer of thin skin which is covered in slim layer to preserve the moist and prevent dehydration. There are different kinds of amphibians which include, frogs, toads, salamanders, and others which are found in different habitats around the world. Amphibians are categorized into three orders, frogs and toad (order Anura), newts and salamanders (order Caudata) and caecilians (order Gymnophiona). “AmphibiaWeb database currently contains 8,652 amphibian species (Jun 10, 2023), of which 7,626 are frogs and toads, 805 are newts and salamanders, and 221 are caecilians” (AmphibiaWeb, 2023). These species are of great importance to the environment as they are great environmental indicators and their decline in the environment could lead to major crisis. The amphibian species are one of the vulnerable species on earth and are more prone to being extinct than other big mammals.
Amphibians are vulnerable to threats and imbalances in the aquatic and terrestrial environment due to a biphasic lifestyle, making them excellent indicators of local environmental health (Lee et al., 2021). Not much attention is given to these small vertebrates especially in areas where the large vertebrates are of top priority. In 2008 the International Union on Conservation of Nature (IUCN) realized that there was a severe decline in the amphibian population around the world and began to gather data through an initiative called The world Conservation Union Global Amphibian Assessment (Stuart et al., 2004). This assessment showed that amphibians are declining more than birds and mammals and this decline is mainly due to habitat loss for the amphibian species.
The Okavango Delta is one of the most famous wetland in southern Africa found in the northern part of Botswana. It is rich in species diversity and contributes a lot in biodiversity of the area. According to a study by le Roux (2010) there were approximately 29 species of amphibians that were recorded in the Okavango Delta and this was compare to a study previously done by du Preez & Carruthers (2009) who discovered a total of 33 species. These numbers show to be changing as the years progress and no data has since been compiled pertaining to the amphibian species diversity since the study conducted by le Roux in 2010. Some of the spotted amphibian species found in the delta that were published in the Inaturailist Botswana Check List (n.d) include 20 frog species some including Pyxicephalus adspersus (Giant African frog), Xenopus muelleri (Mulleris Platana), Hemisus marmoratus (Shovel-nosed frog) and Hyperolius parallelus (Angolan Reed frog). There were four toad species that were recorded including Sclerophrys lemairii (Lemaire’s toad), Sclerophrys poweri (Powers toad) and Sclerophrys gutturalis (Guttural toad).
Several factors have led to a decline in the quality of the habitat of the frogs that comprise of climate change which leads to increase in temperature and high rates of evapotranspiration which is not ideal for an animal that requires both water and land to survive. These conditions reduce the water quantity in the delta due to low rainfall hence influencing the diversity of the amphibian species in the affected areas. Areas where there is a lot of human disturbance also has an impact in the diversity of the amphibian population as human activities such as farming and fishing could lead to a decreased diversity of the species. Landscape alteration can impact amphibian communities through habitat loss, fragmentation and isolation, and degradation of habitat quality (Hamer and Parris 2011). Data regarding amphibians has been overlooked and this disregards their importance to the biodiversity of the world. Lacking information on the species that depend on these wetlands and the wetland attributes important for maintaining their populations, conservation management is infeasible (da Silva et al., 2011).
There has not been enough data collected in the world to cover the diversity and abundance of the amphibians. With this lack of data it becomes difficult to come up with proper conservation methods to protect and preserve the species from facing extinction. “Amphibians have survived past mass extinction events but are faring very poorly in the Anthropocene” (Catenazzi, 2015). The habitat of amphibians is threatened by a number of factors, among the difficulties are habitat loss brought on by the removal of wetlands and upland terrestrial habitat, habitat fragmentation and dispersal routes caused by road networks and built environments, habitat degradation brought on by urban pollutants and introduced predatory fish species, and altered breeding, feeding, and movement behaviors in the presence of light and/or sound pollution (Lee et al., 2021). The Okavango Delta is one of the most prestigious wetlands and it is rich in biodiversity.
Limited research has been done on the diversity of amphibians using citizen data, particularly in the Okavango Delta. Citizen science (CS) currently refers to the participation of non-scientist volunteers in any discipline of conventional scientific research (Feldman et al., 2021). These included introducing more rigorous sample approaches into unstructured data gathering operations, enhancing data quality, extending the data-user community, and improving communication between data users and data collectors (Sullivan et al., 2014). It reflects citizen’s contribution to societal growth, education, or innovation, and it provides an overview of the field of actors, as well as tools and guidelines. The local citizen knows more about the amphibians that are found in their locality and using them as a source of data collection will be helpful for in case the species is not found in the time of sampling. It is helpful especially in studies involving the monitoring of species’ presence in a particular area. The species might be there in the area but not discovered during the time of data collection. With proper monitoring, the diversity of amphibians in the Okavango Delta will be known for use in future studies and the implementation of conservation strategies and also citizens to appreciate the amphibian species that are found in their locality. This study aims to determine the amphibian species diversity in the Daunara, Mochaba and Chanoga and compare amphibian diversity in the different study sites. Our specific objectives are:
- To explore local ecological knowledge on amphibians in Daunara, Mochaba and Chanoga.
- To determine amphibian presence across different habitats in Daunara, Mochaba and Chanoga.
- To determine amphibian diversity in selected study sites in Daunara, Mochaba and Chanoga.
2. Literature Review
Amphibian monitoring has been conducted in different habitats around the world to know the species abundance and distribution in an area. The factors that affect the abundance and diversity of amphibian species have been studied to know what might be causing the reported rapid declination of the amphibian species on earth. The factors that were mostly reported for the Okavango Delta and its branching water bodies like the Boteti river and other rivers through past studies included climate change and anthropocene. There are a few studies that were done in the past with regards to the amphibian diversity of the Okavango Delta which include a study by Poynton (1964) on the Amphibia of Southern Africa: a faunal study stated that the Okavango Delta falls within the transitional complex called the central tropical transitional fauna and it comprises of the following list of amphibian species Xenopus petersii, Amietophrynus gutturalis, Breviceps poweri, Phrynomantis affinis, Tomopterna tuberculosa, Hylarana darlingi, Ptychadena uzungwensis, Ptychadena subpunctata, Leptopelis bocagii, Hyperolius rhodesianus, and Hyperolius parallelus.
The number of amphibian species in the Okavango Delta as documented by Ramberg et al (2006) was 33 species but le Roux (2010) stated that this was not a reliable benchmark for actual, recorded observations and collection. A more reliable source pertaining to the amphibian species of the Okavango Delta was done by Auerbach (1987) where he endeavored to gather all available knowledge and museum specimens at the time and documented locales in each species distribution and description, as well as stating real collection spots. He established that there were 28 amphibian species in the Okavango Delta between the latitudes of 18.50° to 20.00° and the longitudes of 22.00° to 24.00°.
The number of amphibian species that are found in the study which were recorded by present studies which include 33 species identified by a study by Ramberg et al. (2006) & le Roux (2010), 24 species by Inaturalist (2023). This most recent data estimating that there are about 30 amphibian species in the Okavango Delta and this data is not reliable as these figure are based on a visual review of distribution maps provided by the sources nor do they document record point locales. Furthermore, this statistic does not refer solely to the Okavango Delta, but also includes records of species discovered in nearby locations. The study conducted serve as an establishing point on the amphibian diversity in areas found surrounding the Okavango Delta.
3. Theories
3.1. Intermediate Disturbance Hypothesis
Wilkinson (1999) wrote that local species diversity is maximized when ecological disturbance is neither too rare nor too frequent. It shows that at low disturbance the diversity of that area is reduced due to competition among the species, the more dominant species will have a higher chance of surviving than the other species. At high disturbance the chances that all the species in that area will become extinct is high mostly due to external influence from anthropogenic effects. This theory was mostly devised for marine organisms as a way of monitoring the species richness of the organisms in their natural habitats.
3.2. Local Knowledge Theory
This was described by Charnley et al (2007) as the knowledge, practices, and beliefs of local communities regarding ecological relationships. It was thought that the local community is important in maintaining the local ecology as they have more knowledge on what goes on in their surrounding and should also practice ways that do not hinder the ecosystems found in that area.
4. Methodology
4.1. Study Site
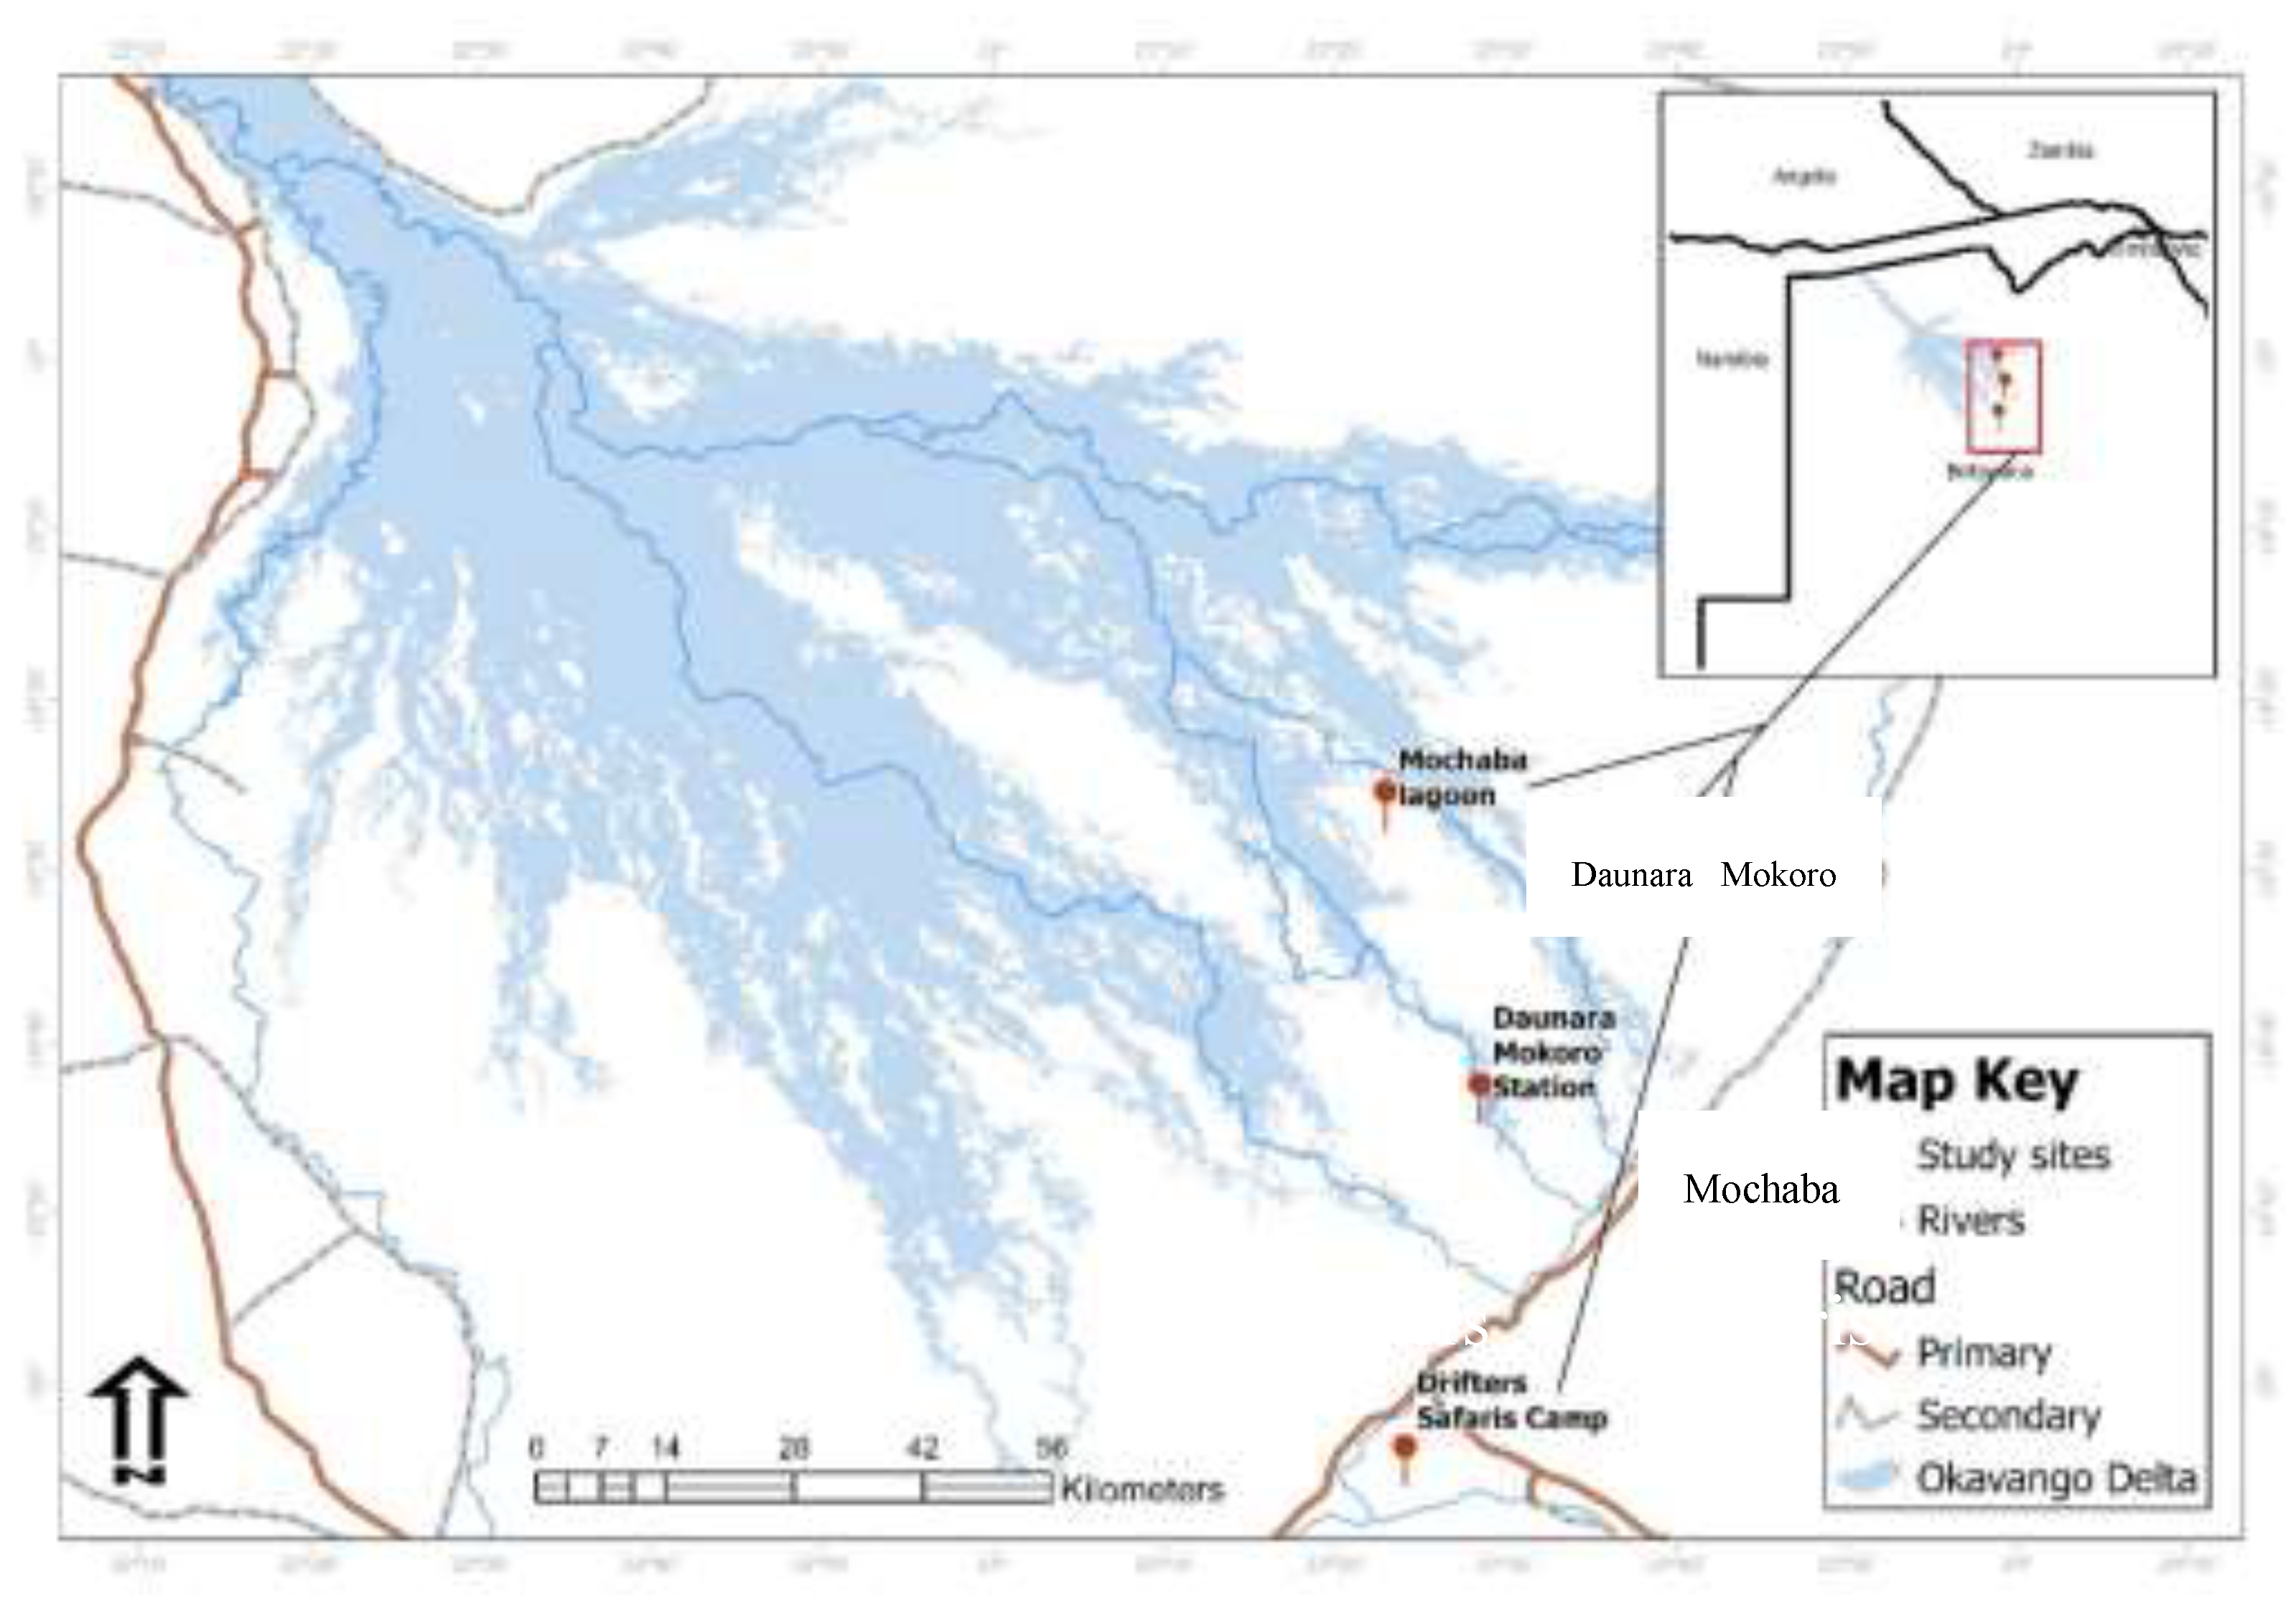
The study was carried out in Chanoga, Mochaba and Daunara areas in the Ngamiland District, Northwestern part of Botswana (Figure 1). The study sites were selected based on the availability of a water source because most amphibians are found where water is available.
4.2. Data Collection and Procedure
Direct Sampling through visual and auditory surveys
For the direct sampling, visual and auditory survey was used to collect data. The audio survey was done at night for the nocturnal species, a recording device (e.g. smartphone) was used to record the sounds produced by the amphibians as each produces its own unique calling. The audio recordings collected at the site were later analyzed to identify which species made the sound and then recorded into a data sheet. The number of individuals calling and their vocal activity patterns, were also analyzed to make a species count. Species that were spotted at the study sites were also recorded in the data sheet. Species unique to a locality were further analyzed in terms of habitat preferences to expose any possible reasons for their presence in one locality alone, and their simultaneous absence in the others.
Citizen Science Data Collection
Citizen science data collection was used as the qualitative method. This method involved local citizens participating it the identification of the amphibian species that were found in their locality. A sheet containing the pictures of different amphibian, time of the year they saw the species, where they saw the species and also time of the day they saw the species was made and distributed and the local people at the area of study were asked to identify the species that they had seen around. A total of 24 questionnaires were made and eight of them were distributed at each sites. The questionnaires were given to people who frequent the waters such as fishermen, hunters, canoe (mokoro) operators, farmers and local community members. The data from the questionnaires was analyzed to make an identification of which species of amphibians are found in that area.
4.3. Data Processing and Analysis
QUALITATIVE ANALYSIS
After collecting the data from the questionnaires a demographic table was made to provide a census data on the respondents to the questionnaire.
RELATIVE FREQUENCY OF CITATION INDEX
The Relative Frequency of citation index was also calculated. It shows the commonness of a species in an area. The RFC value was calculated using the formula RFC = FC/N; where FC is the number of informants mentioning about the use of the species and N is the number of informants participating in the survey (Borah & Prasad, 2017). This index ranges from 0 to 1. When the RFC value is closer to zero it means the species is less common and when it is closer to one it means the species is very common.
ONE-WAY ANOVA TEST
The one-way ANOVA compares the means between the groups you are interested in and determines whether any of those means are statistically significantly different from each other. The one-way ANOVA was used to calculate if there was any statistical significant difference on the different amphibian species that were reported by the respondents in the different study sites. The data was entered into excel and then the ANOVA function will be used to calculate.
QUANTITATIVE ANALYSIS
SPECTROGRAM ANALYSIS
The sound recording from the different study site were turned into spectrograms. A spectrogram can visually reveal broadband, electrical, or intermittent noise in audio, and can allow you to easily isolate those audio problems by sight (iZotope, 2023). Each animal’s call makes a specific pattern on the spectrogram, and scientists can identify animals by studying the pattern of these sounds (Marques et al, 2017). A RavenPro 1.6.5 software was used to convert the sound recordings to make a spectrogram. The time interval between calls of one frog to make a count from the spectrogram were measured. Sound pressure color intensity was used to determine which site had a loud chorus of frog calls of a particular species.
SHANNON-WEINER DIVERSITY INDEX
The Shannon-wiener diversity index is used to measure the species richness and species evenness in a particular area.
Shannon Diversity Index Formula:
H’ = -Σ Pi InPi
H’ – Shannon Diversity Index
Σ – Sum of
Pi- The proportion of the entire community made up of species i
In- Natural log
Shannon Equitability Index Formula:
J = H’ / Ins
J- Shannon Equitability index
H’- Shannon Diversity Index
s- The total number of unique species
This value ranges from 0 to 1 where 1 indicates complete evenness.
5. Results and Analysis
5.1. Demographic Analysis

Table 1.
DEMORGRAPHIC TABLE OF RESPONDENTS FROM CHANOGA, MORUTSHA AND DAUNARA (N= 24).
| CATEGORY | SUB-CATEGORY | Daunara | Morutsha | Chanoga | PERCENTAGE |
| SEX | Male | 5 | 8 | 7 | 83.30% |
| Female | 3 | 0 | 1 | 16.70% | |
| AGE | 20-30 | 1 | 1 | 4 | 25% |
| 31-40 | 1 | 4 | 2 | 29.20% | |
| 41-50 | 2 | 3 | 0 | 20.80% | |
| More than 50 | 4 | 0 | 2 | 25% | |
| RESIDENT OF NGAMILAND | Yes | 8 | 8 | 8 | 100% |
| No | 0 | 0 | 0 | 0% | |
| AREA OF RESIDENCE | Daunara | 2 | 0 | 0 | 8.30% |
| Chanoga | 0 | 0 | 5 | 20.80% | |
| Morutsha | 0 | 6 | 0 | 25% | |
| Maun | 2 | 1 | 3 | 25% | |
| Boro | 1 | 1 | 0 | 8.30% | |
| Boronyane | 1 | 0 | 0 | 4.20% | |
| Xharaxao | 1 | 0 | 0 | 4.20% | |
| Disaneng | 1 | 0 | 0 | 4.20% | |
| TIME LIVED IN THE AREA | Less than a year | 1 | 2 | 0 | 12.50% |
| 2-5 years | 1 | 0 | 3 | 16.70% | |
| More than 5 years | 6 | 6 | 5 | 70.80% | |
| OCCUPATION | Fisherman | 1 | 3 | 4 | 33.30% |
| Farmer | 0 | 0 | 1 | 4.20% | |
| Local community member | 0 | 1 | 2 | 12.50% | |
| Mokoro Operator | 6 | 4 | 0 | 41.70% | |
| Tour Guide | 1 | 0 | 1 | 8.30% |
The table above shows that there were more males respondents 83.3% than female respondents 16.7%. It shows that majority of the respondents were between the ages of 31-40 with a percentage of 29.2% than other age groups. All of the respondents were from the ngamiland district. Most of the respondents 70.8% had lived for more than five years at their areas. Majority of the respondents were mokoro operators 41.7% followed by fisherman at 33.30% and the remaining respondents were local community members, tour guides and farmers, 12.5%, 8.3% and 4.2% respectively.
5.2. Relative Frequency of Citation Index
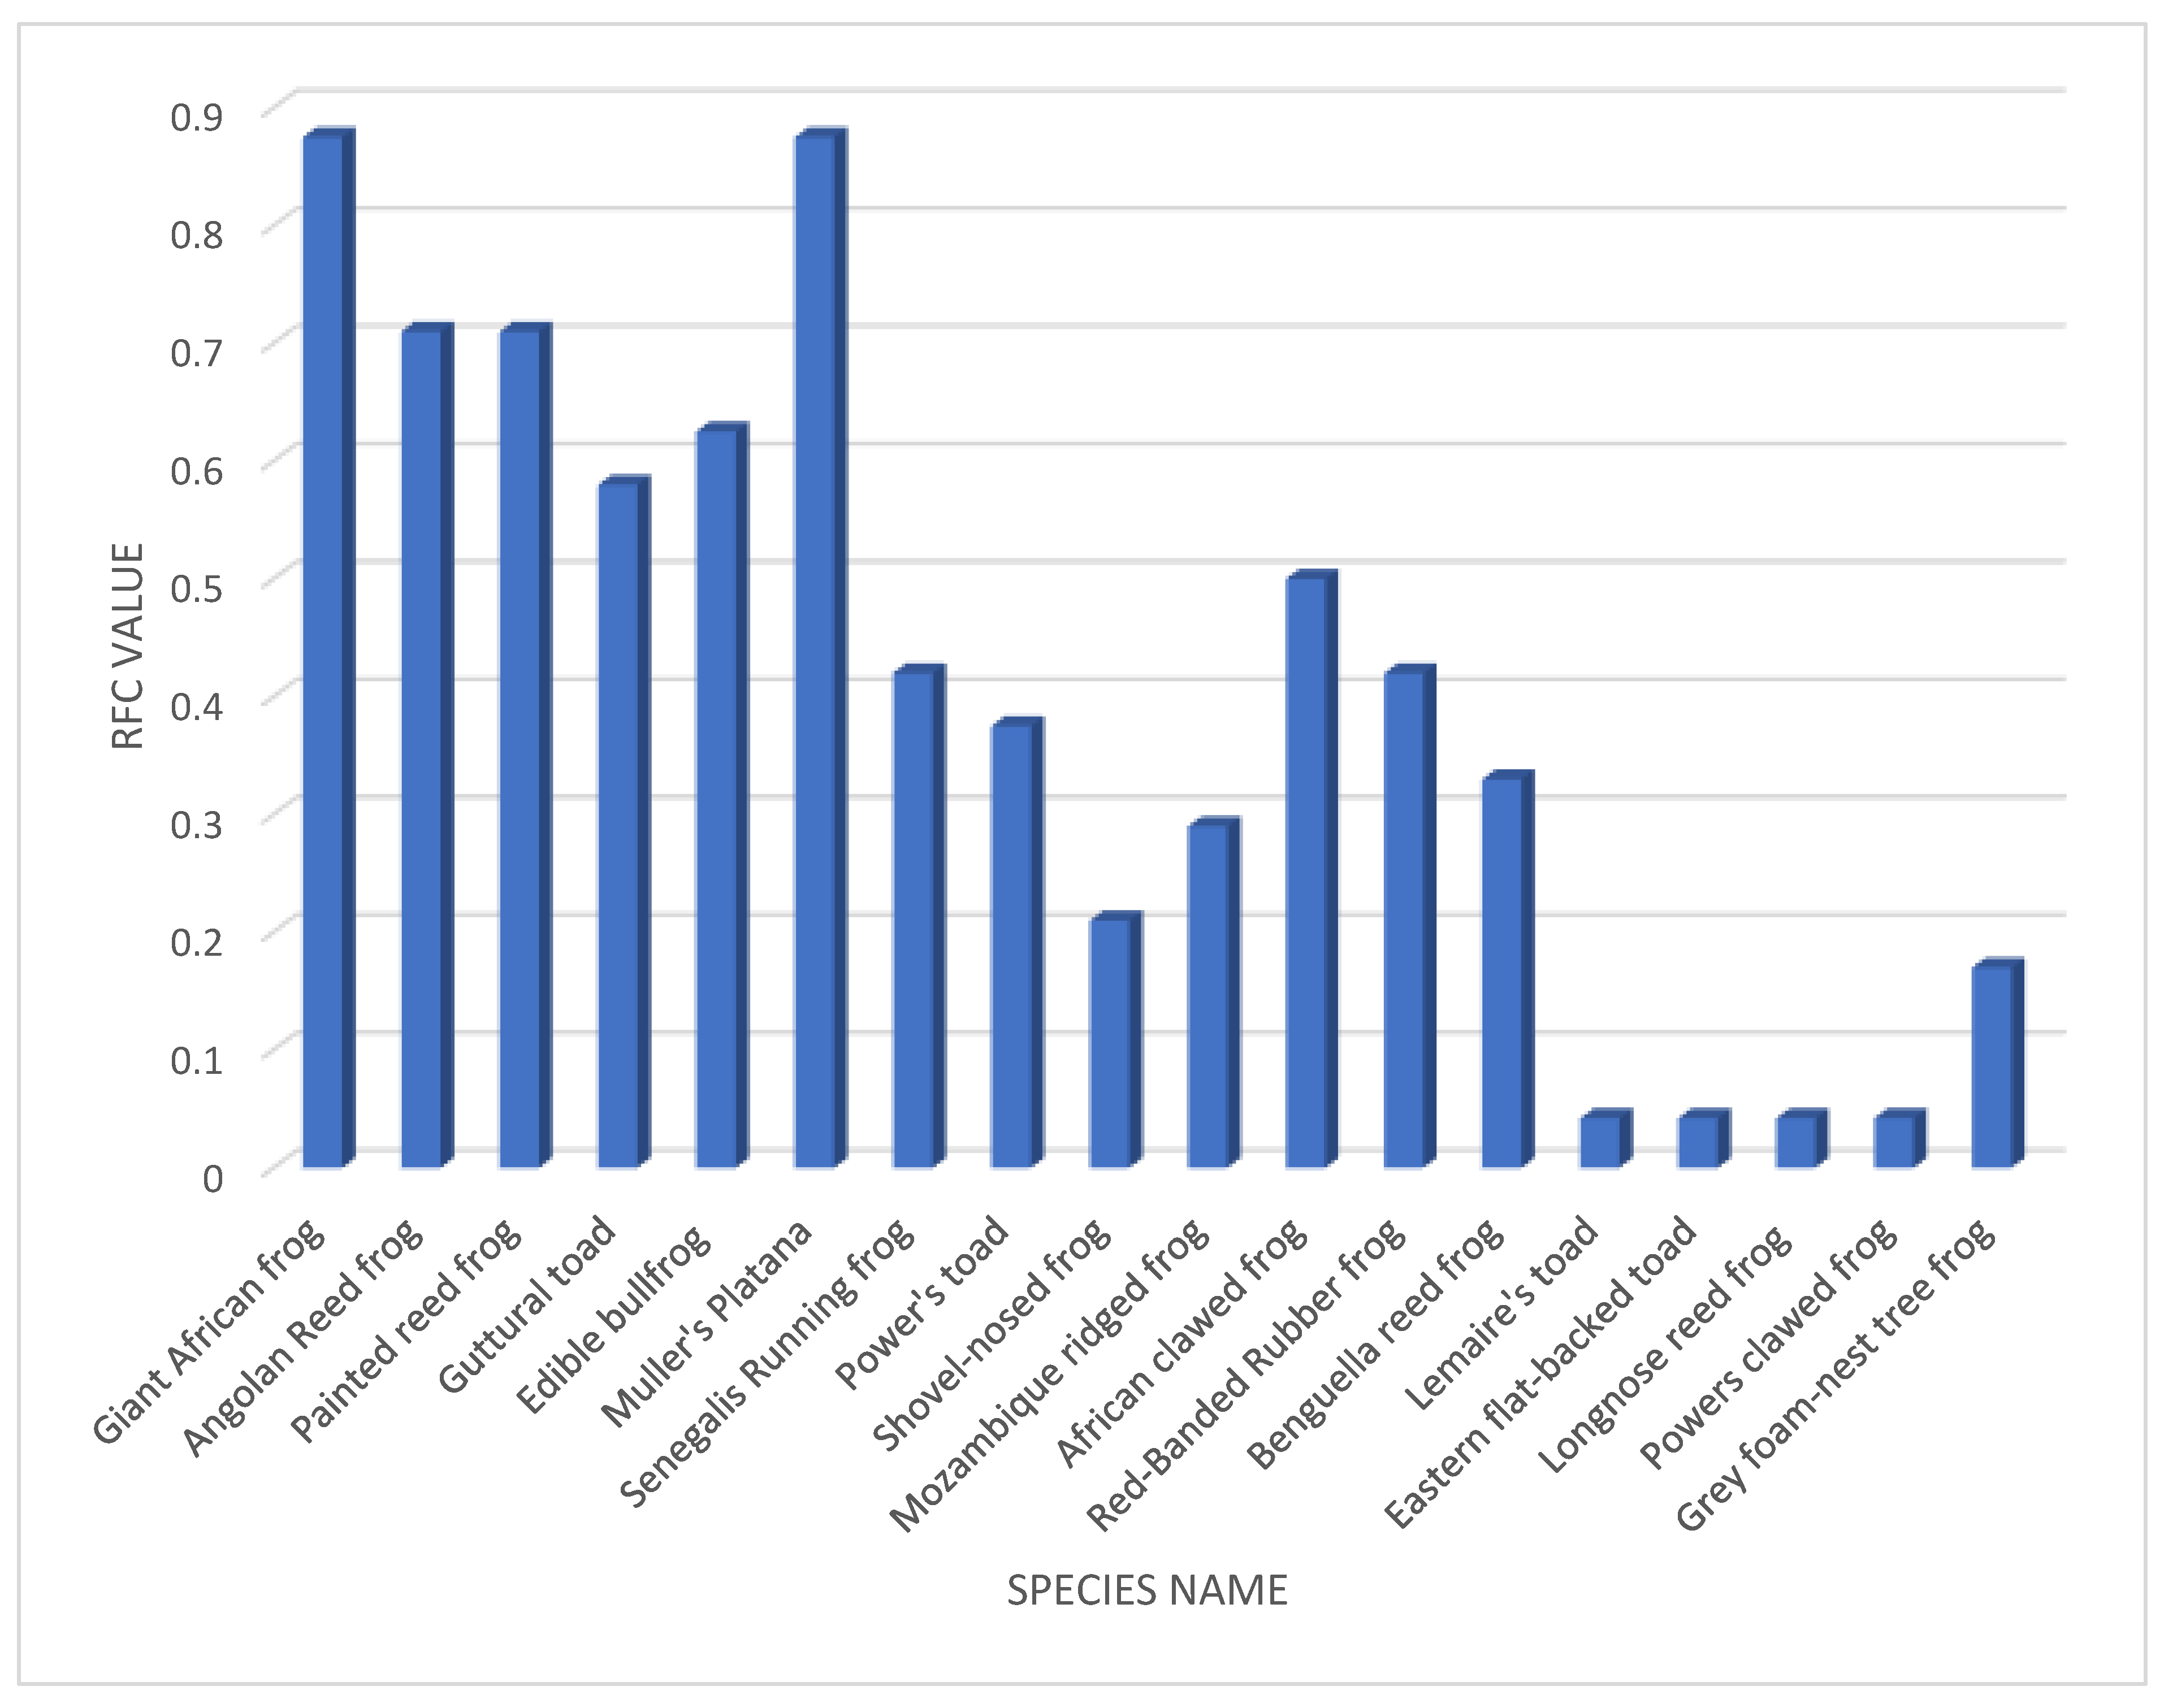
The RFC value calculated for the different amphibian species commonness from the data collected from the respondents shows that the Giant African bullfrog and the Muller’s Platana are more common across the three study sites with RFC values of 0.875. They are followed by Angolan reed frog and the Painted reed frog with RFC values of 0.71, the Edible bullfrog 0.625, Guttural toad 0.58, African clawed frog 0.5, Senegalis running frog and Red-banded rubber frog 0.42, Power’s toad 0.375, Benguella reed frog 0.33, Mozambique ridged frog 0.29, shovel-nosed frog 0.21, Grey foam-nest tree frog 0.17. The least common amphibians being Lemaire’s toad, Eastern flat-backed toad, Longnose reed frog, Powers clawed frog 0.042.
Figure 2.
GRAPH SHOWING THE RELATIVE FREQUENCY OF CITATION INDEX OF THE DIFFERENT AMPHIBIAN SPECIES AS IDENTIFIED BY RESPONDENTS FROM THE THREE STUDY SITES.
Figure 2.
GRAPH SHOWING THE RELATIVE FREQUENCY OF CITATION INDEX OF THE DIFFERENT AMPHIBIAN SPECIES AS IDENTIFIED BY RESPONDENTS FROM THE THREE STUDY SITES.
5.3. One- Way Analysis of Variance (Anova) Test
The p-value 0.962 is greater than α 0.05 which means there is no significant difference between the means of the three groups. The F calculated 0.03871 < F critical 3.219942 hence indicating that the sample averages are not significantly different from each other hence we fail to reject the null hypothesis.
Table 2.
THE ONE-WAY ANOVA TABLE OF THE DIFFERENT AMPHIBIAN SPECIES IN CHANOGA, MORUTSHA AND DAUNARA BY RESPONDENTS.
Table 2.
THE ONE-WAY ANOVA TABLE OF THE DIFFERENT AMPHIBIAN SPECIES IN CHANOGA, MORUTSHA AND DAUNARA BY RESPONDENTS.
| ANOVA | ||||||
| Source of Variation | SS | df | MS | F | P-value | F crit |
| Between Groups | 0.23301 | 2 | 0.116505 | 0.03871 | 0.962064 | 3.219942 |
| Within Groups | 126.4073 | 42 | 3.009697 | |||
| Total | 126.6403 | 44 |
5.4. Spectrograms
The yellow and red color on the spectrogram which show at a frequency of 2.5 kHz correlate with that of an Angolan reed frog. The spectrogram show an approximation of six Angolan reed frogs that were recorded at the Mochaba site. It also shows that takes one frog 1.5s to make the next call sound.
Figure 3.
SPECTROGRAM OF MOCHABA SITE AUDIO RECORDING DISPLAYING ANGOLAN REED FROG CALLS.
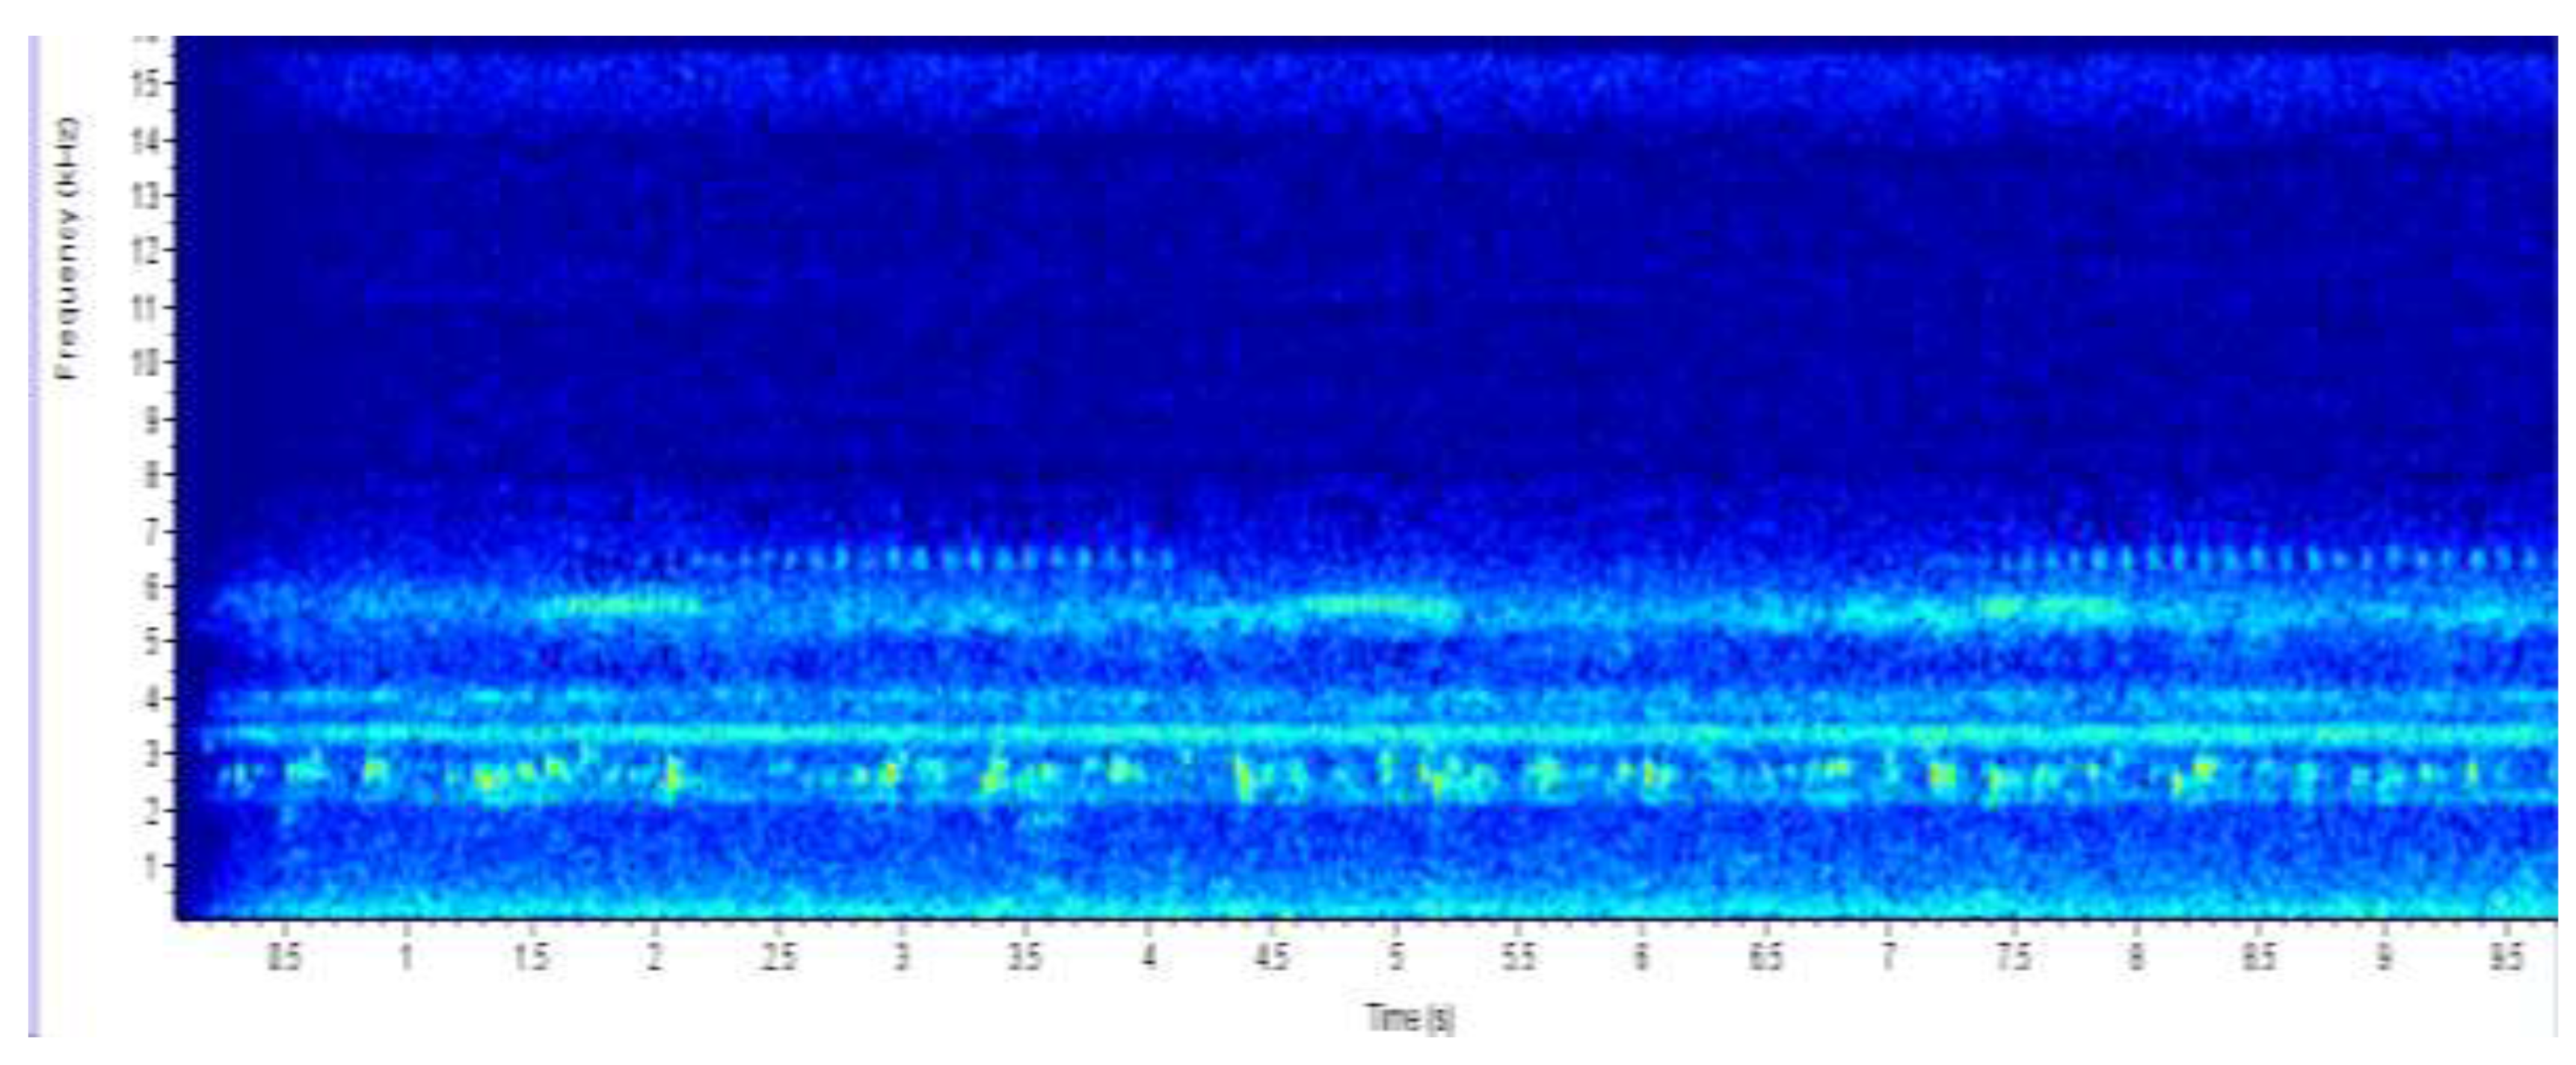
Figure 4.
SPECTROGRAM OF MOCHABA SITE AUDIO RECORDING DISPLAYING A CHORUS OF GIANT AFRICAN BULLFROG CALLS AND REED FROG CALLS.
Figure 4.
SPECTROGRAM OF MOCHABA SITE AUDIO RECORDING DISPLAYING A CHORUS OF GIANT AFRICAN BULLFROG CALLS AND REED FROG CALLS.
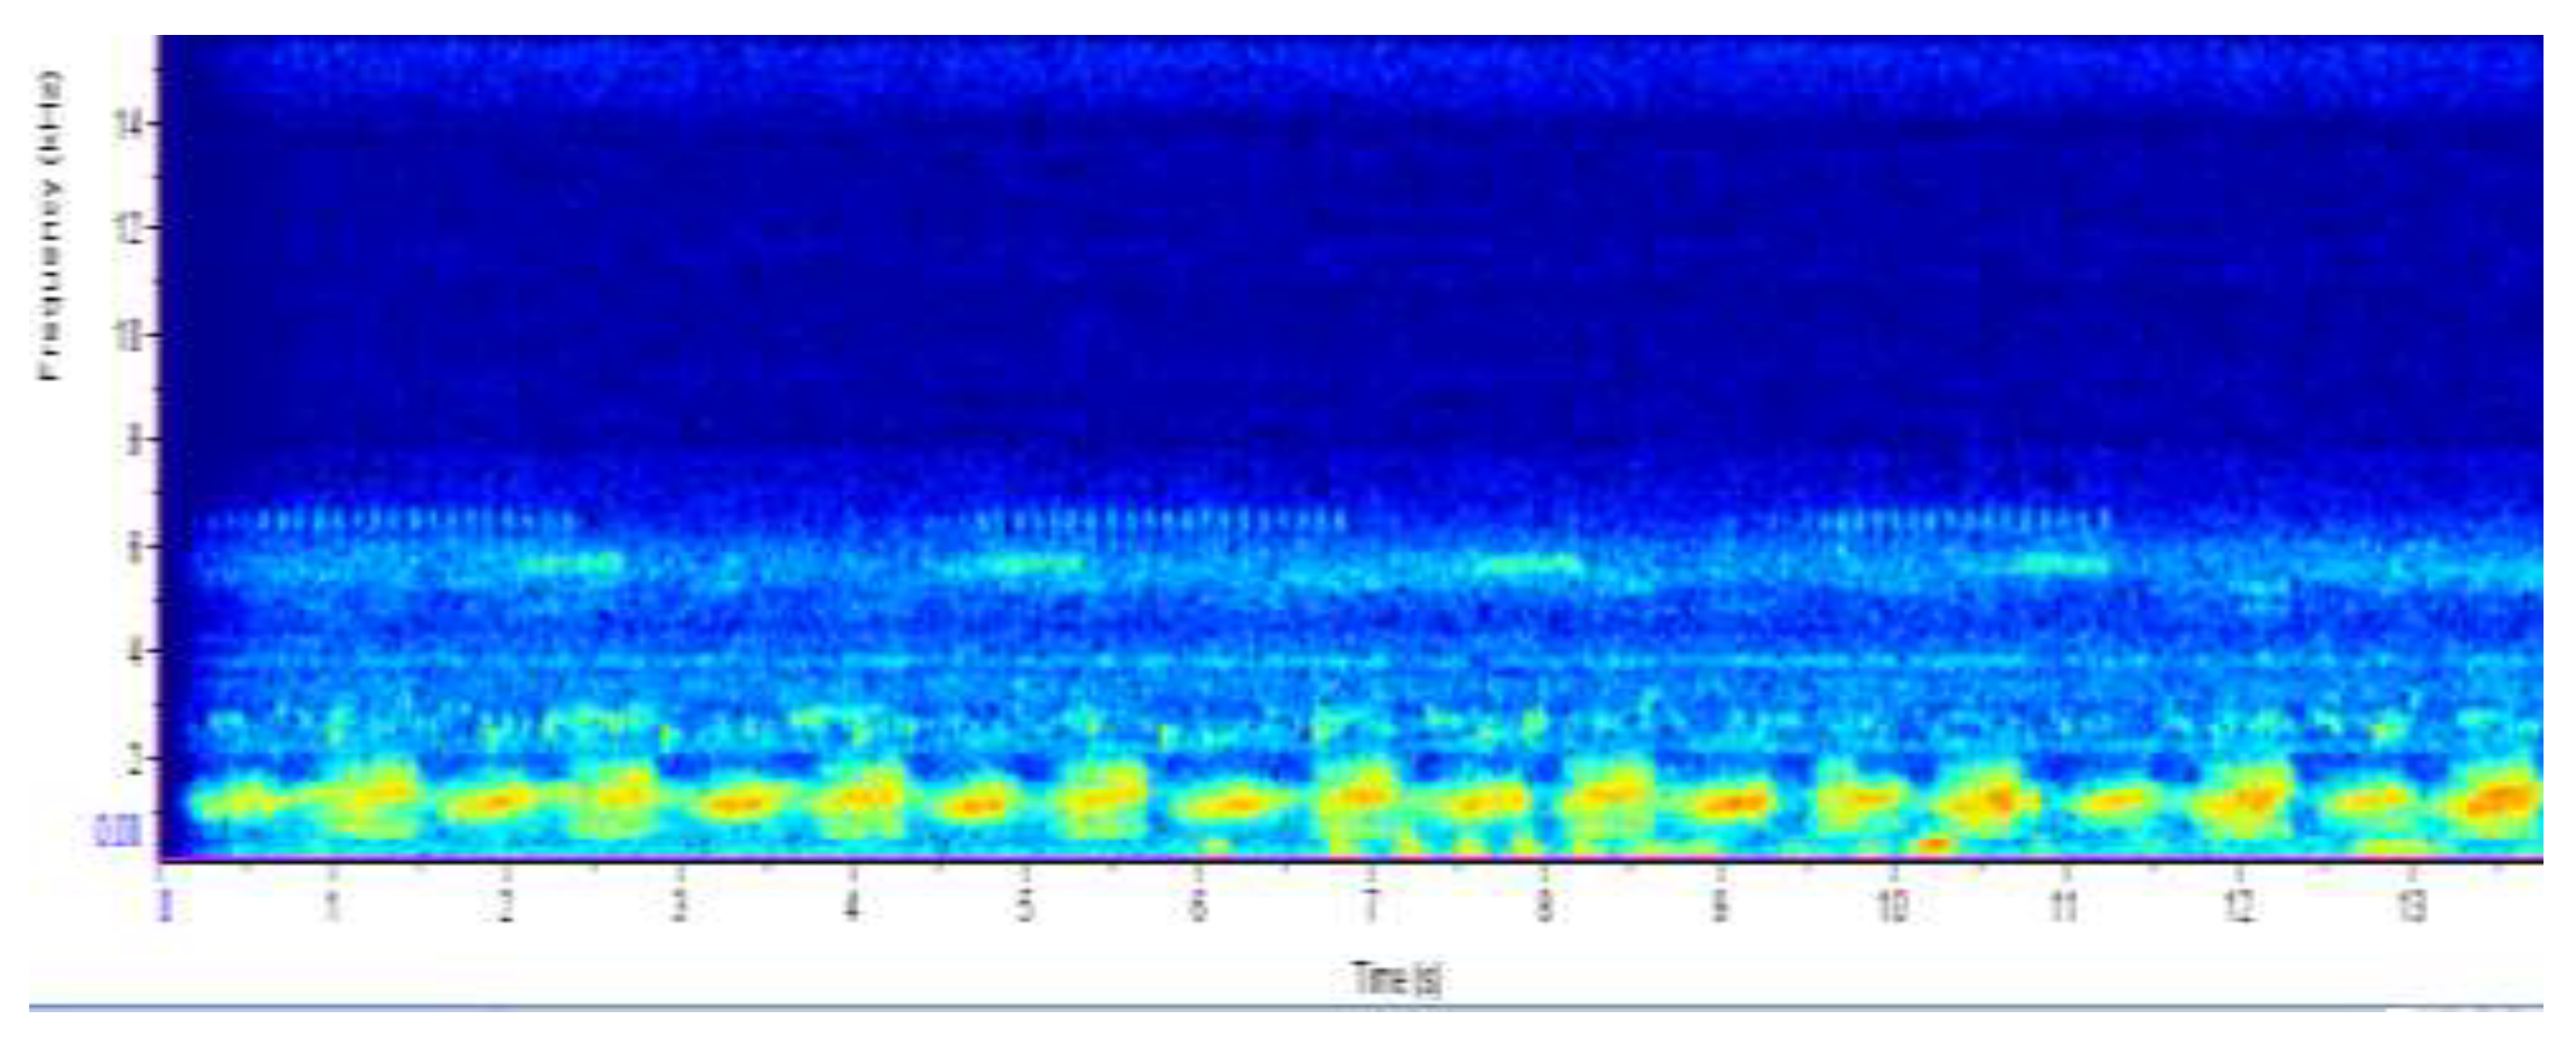
The yellow and red color shows the sound intensity of the calls made by giant African bullfrogs. The chorus of bullfrogs produced a sound frequency of approximately 2 kHz. Reed frogs were also detected at a frequency of 2.5 kHz.
Figure 5.
SPECTROGRAM OF DAUNARA SITE AUDIO RECORDING DISPLAYING ANGOLAN REED FROG CALLS.
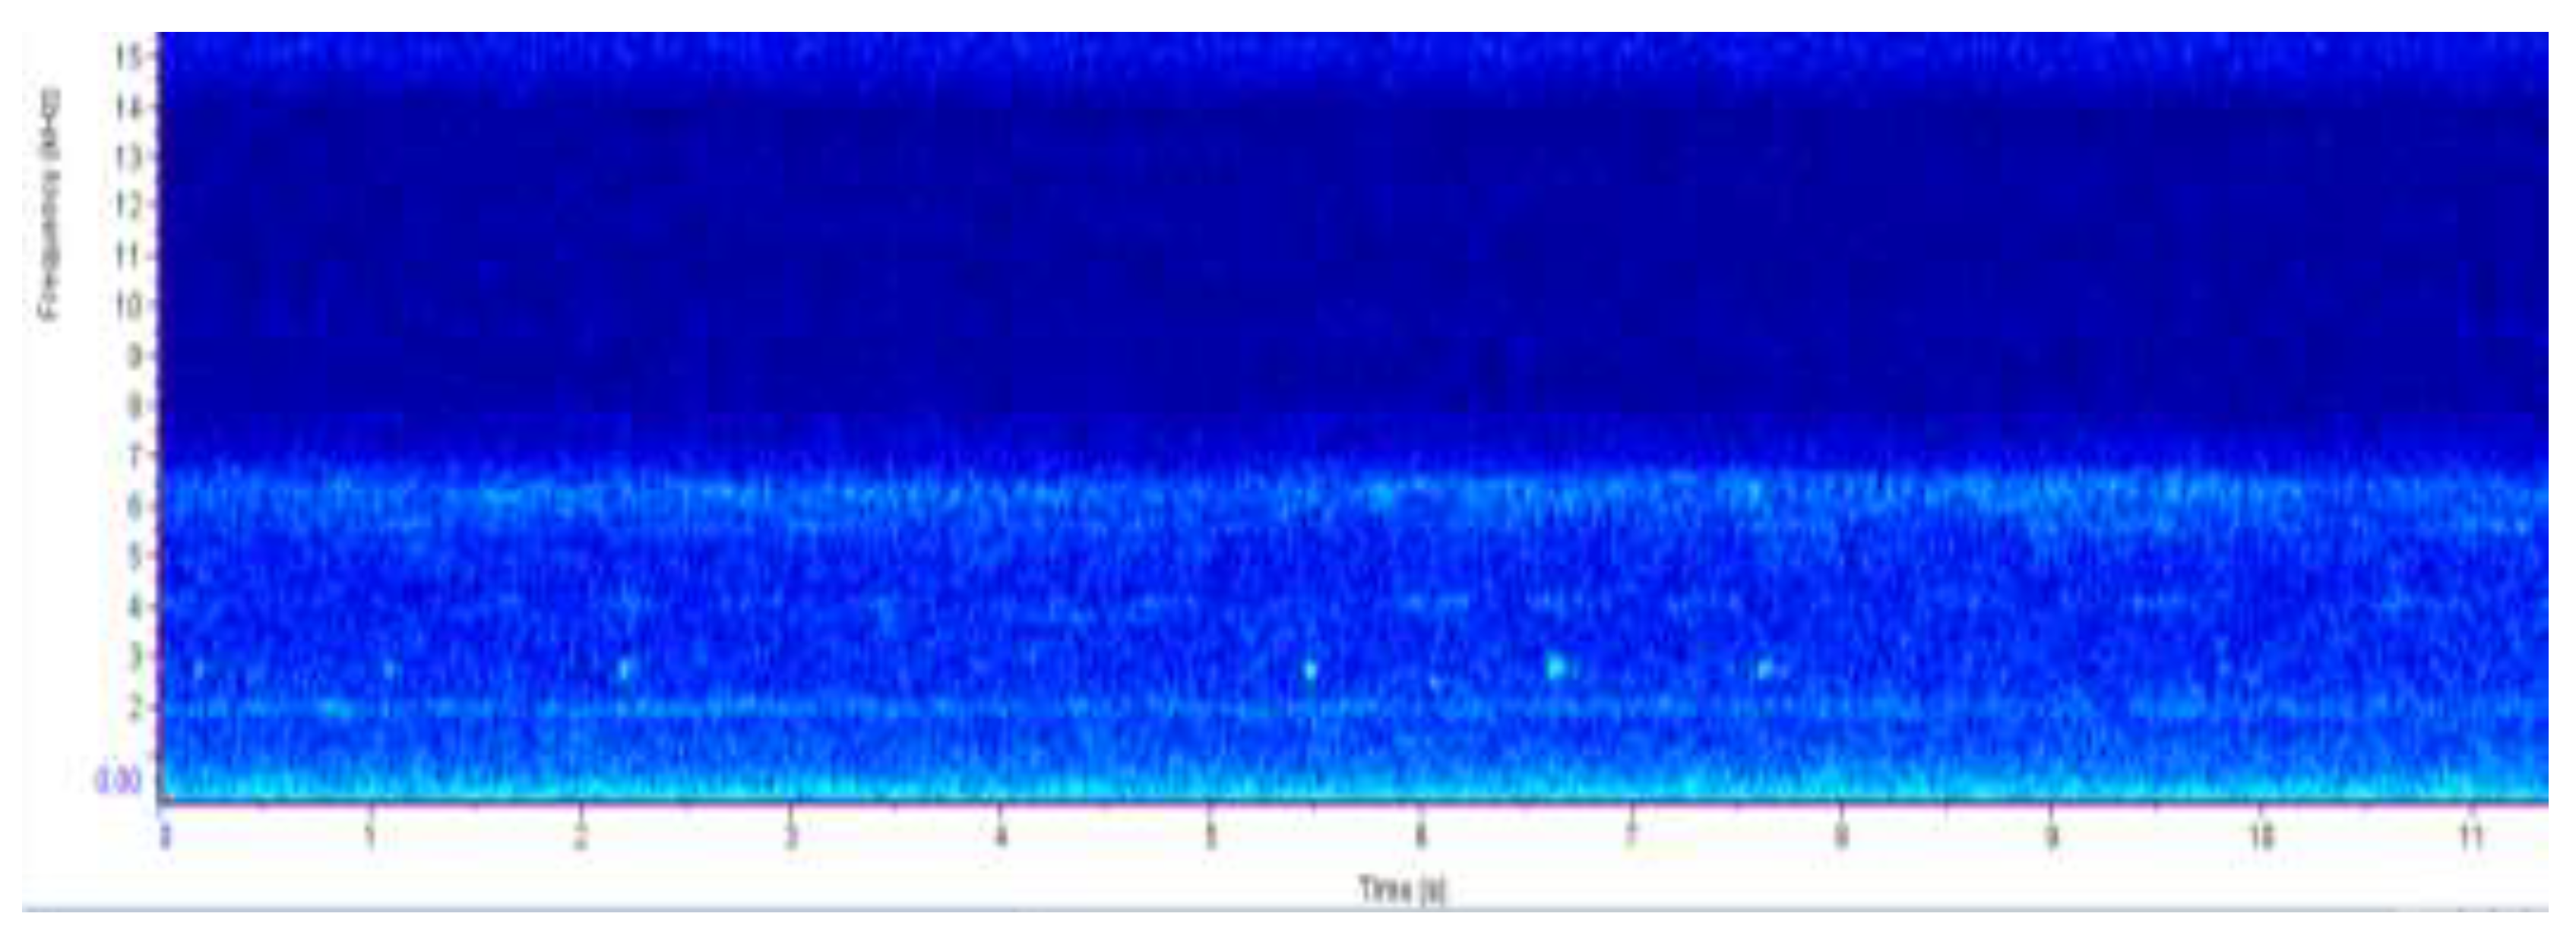
The yellow dots on the spectrogram at a frequency of 2.5 kHz indicate the presence of Angolan reed frog at the Daunara site. It shows that the call recorded is from one Angolan reed frog hence approximating that at the site only one Angolan reed frog was recorded.
Figure 6.
SPECTOGRAM OF CHANOGA SITE AUDIO RECORDING DISPLAYING A CHORUS OF GIANT AFRICAN BULLFROG CALLS AND REED FROG CALLS.
Figure 6.
SPECTOGRAM OF CHANOGA SITE AUDIO RECORDING DISPLAYING A CHORUS OF GIANT AFRICAN BULLFROG CALLS AND REED FROG CALLS.
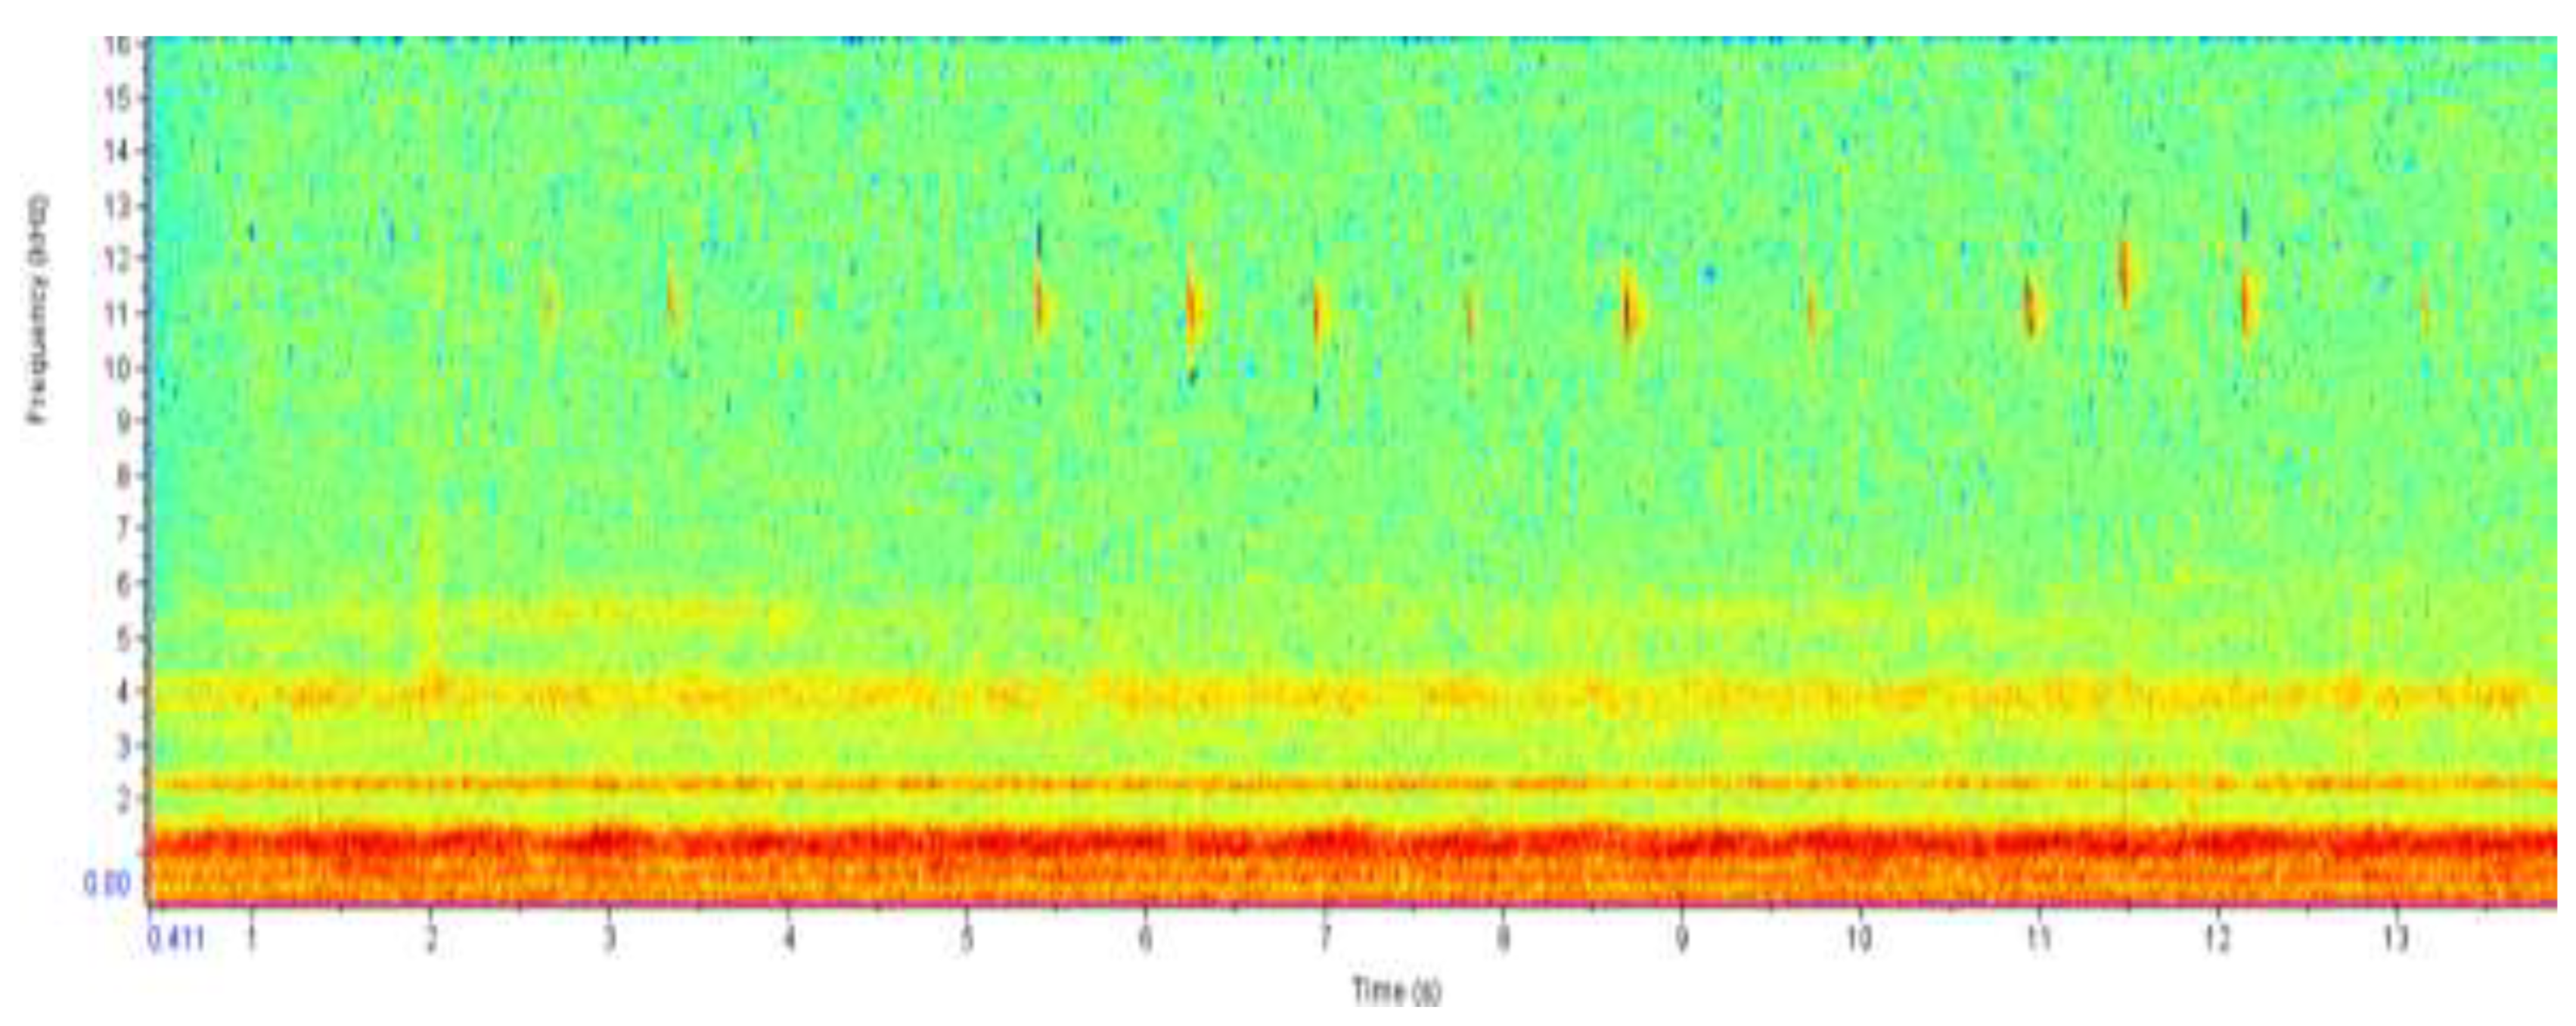
The red color at the bottom of the spectrogram shows the sound intensity of the giant African bullfrog chorus, it measures at a maximum frequency of 1.5 kHz. The red line colors at the top of the spectrogram show the calls of a painted reed frog, it measures at maximum frequency of 11 kHz with an interval between calls of 0.5s.
5.5. Shannon-Weiner Diversity Index
Table 3.
SHANNON- WEINER DIVERSITY OF THE AMPHIBIAN SPECIES AT THE CHANOGA STUDY SITE.
| SPECIES | FREQUENCY | Pi | InPi | Pi InPi |
| Giant African Bullfrog | 15 | 0.8333 | -0.1824 | -0.15199 |
| Angolan reed frog | 1 | 0.05556 | -2.8903 | -0.1606 |
| Painted reed frog | 1 | 0.05556 | -2.8903 | -0.1606 |
| Guttural toad | 1 | 0.05556 | -2.8903 | -0.1606 |
| Total | 18 | -0.63379 |
Shannon-weiner Diversity Index
H’ = 0.63379
Shannon Evenness
J = 0.4572
Table 4.
SHANNON- WEINER DIVERSITY OF THE AMPHIBIAN SPECIES AT THE MOCHABA STUDY SITE.
| SPECIES | FREQUENCY | Pi | InPi | Pi InPi |
| Giant African Bullfrog | 6 | 0.3 | -1.2040 | -0.3612 |
| Angolan reed frog | 8 | 0.4 | -0.9163 | -0.36652 |
| Painted reed frog | 6 | 0.3 | -1.2040 | -0.3612 |
| Total | 20 | -1.08892 |
Shannon-weiner Diversity Index
H’ = 1.08892
Shannon Evenness
J = 0.991
Table 5.
SHANNON- WEINER DIVERSITY OF THE AMPHIBIAN SPECIES AT THE DAUNARA STUDY SITE.
| SPECIES | FREQUENCY | Pi | InPi | Pi InPi |
| Angolan reed frog | 2 | 0.4 | -0.9163 | -0.36652 |
| Painted reed frog | 3 | 0.6 | -0.51083 | -0.30650 |
| Total | 5 | -0.67302 |
Shannon-weiner Diversity Index
H’ = 0.67302
Shannon Evenness
J = 0.971
Figure 7.
THE SHANNON WEINER DIVERISY INDEX OF THE THREE STUDY SITE.
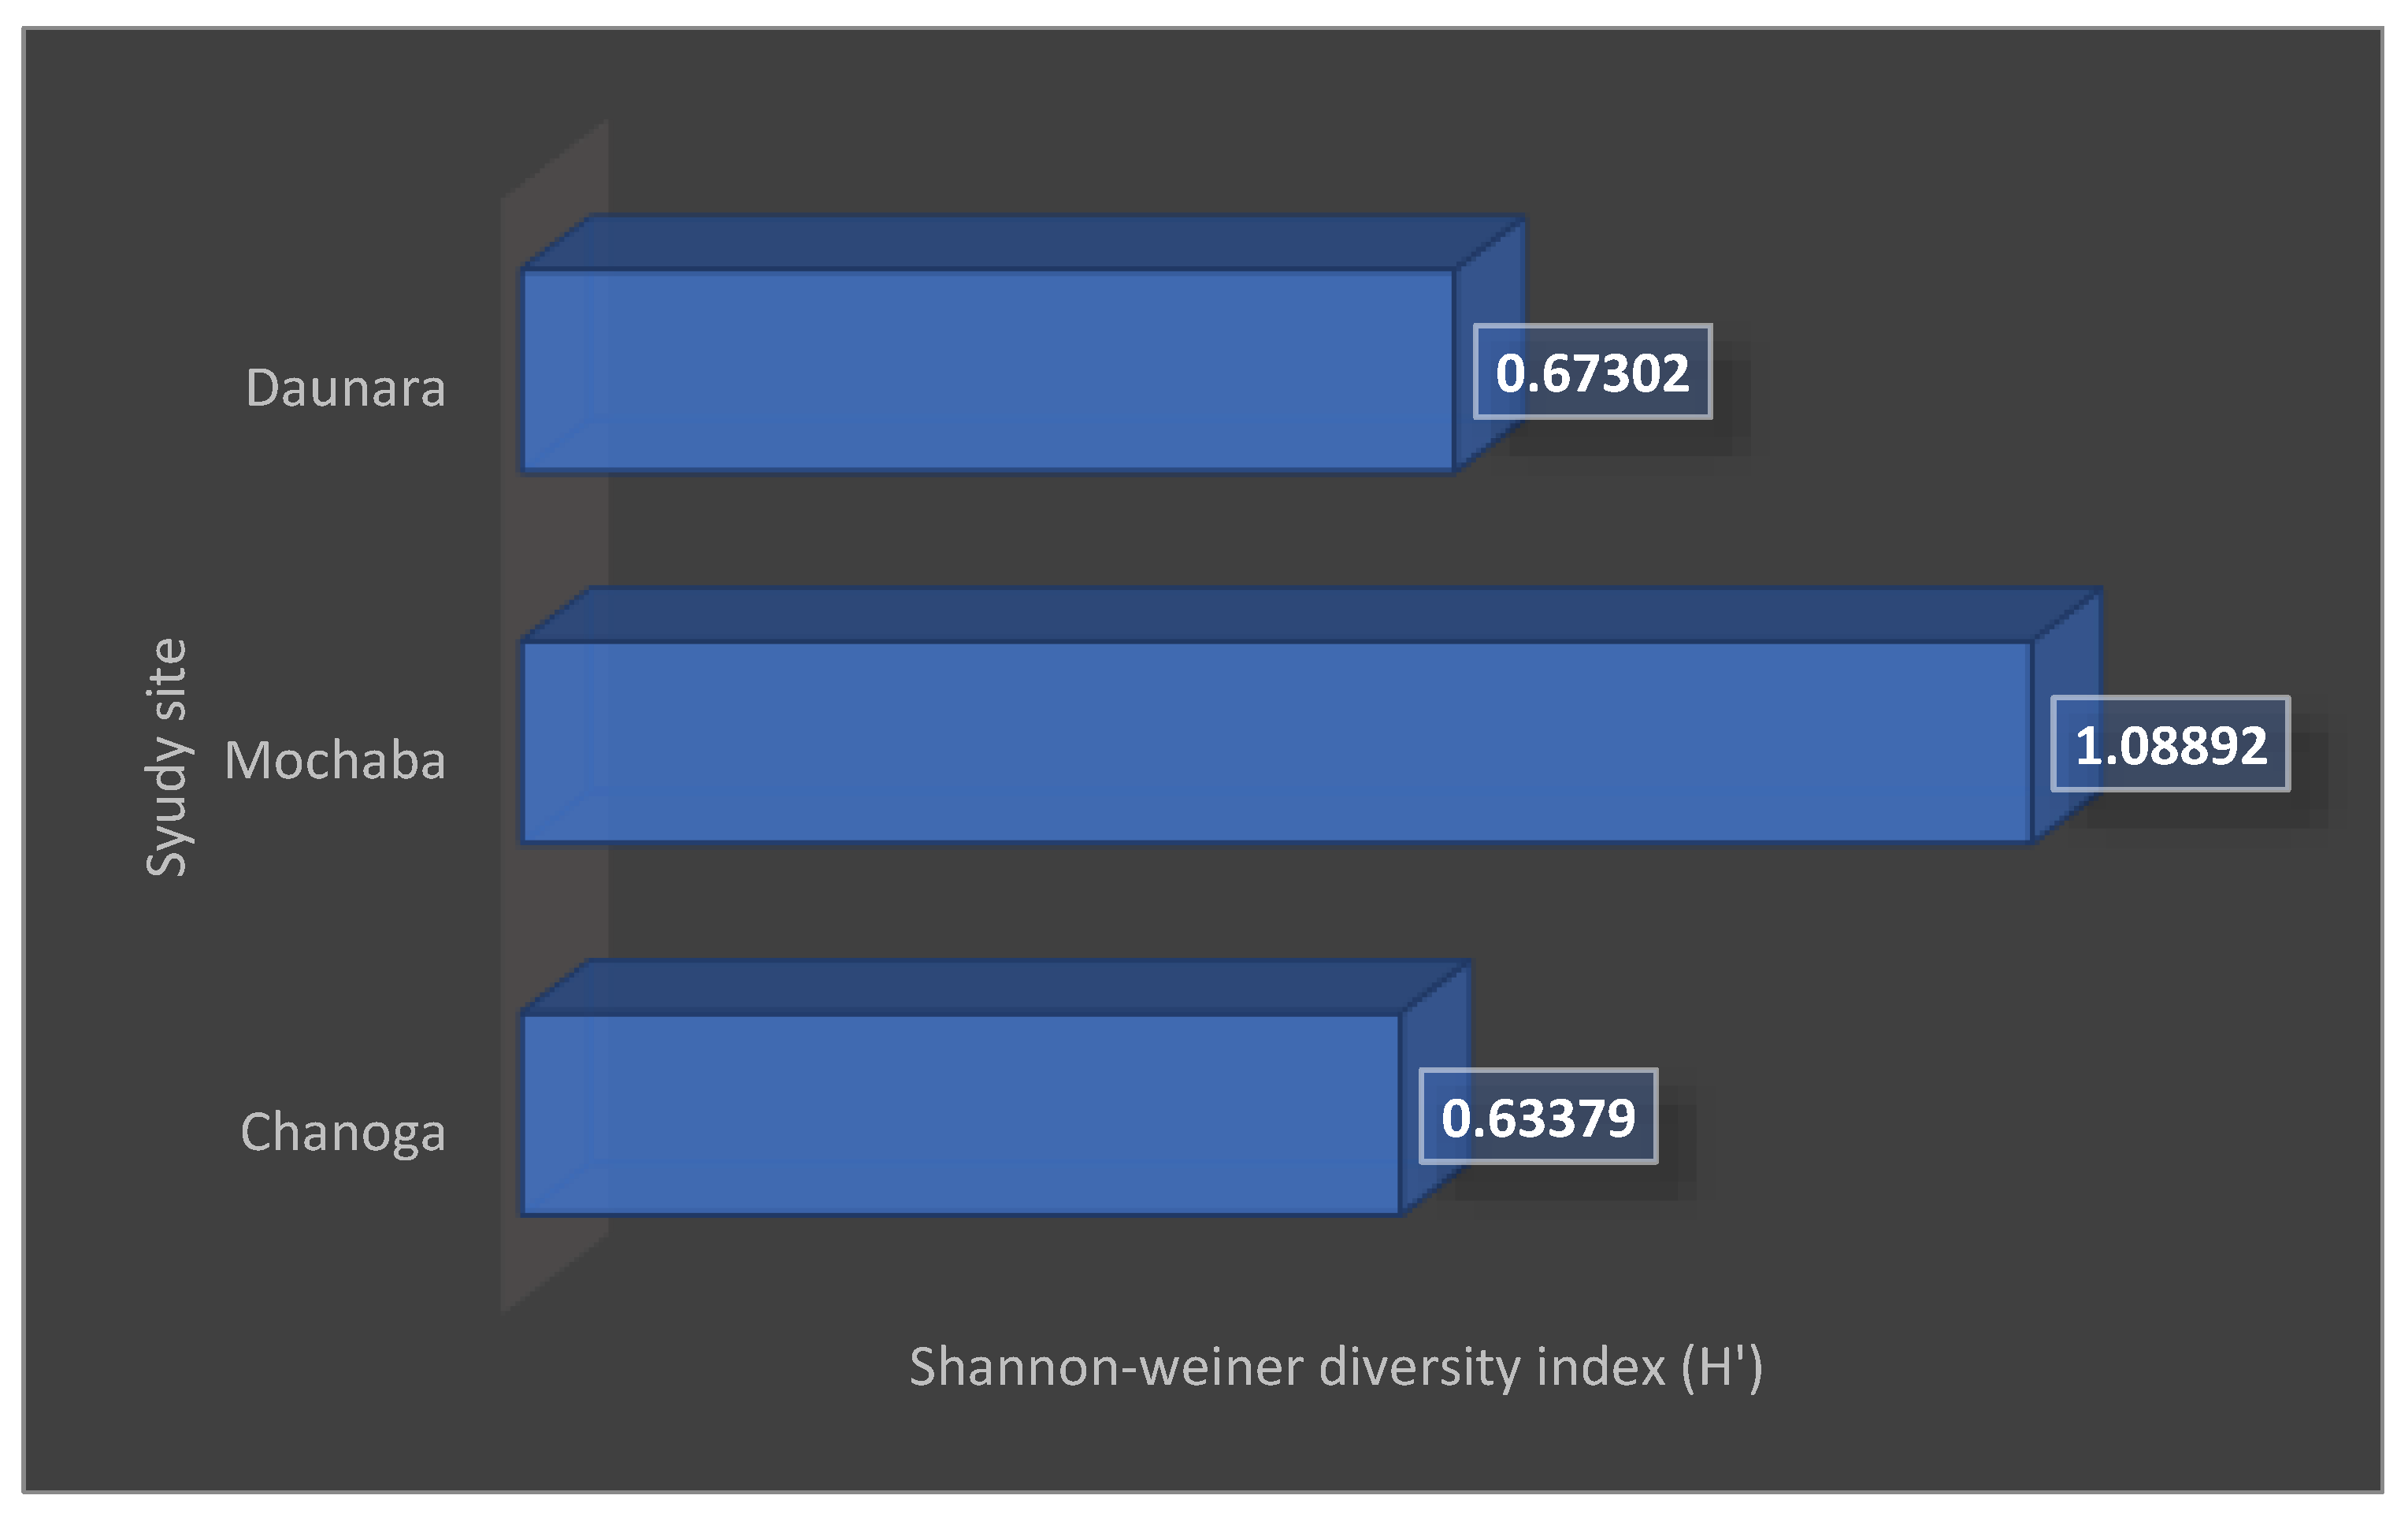
The graph shows that Mochaba has a high amphibian diversity of 1.08892 as compared to Chanoga with 0.63379 and Daunara with 0.67302.
Figure 8.
THE SHANNON EVENNESS VALUES OF THE AMPHIBIAN SPECIES ACROSS THE THREE STUDY SITES.
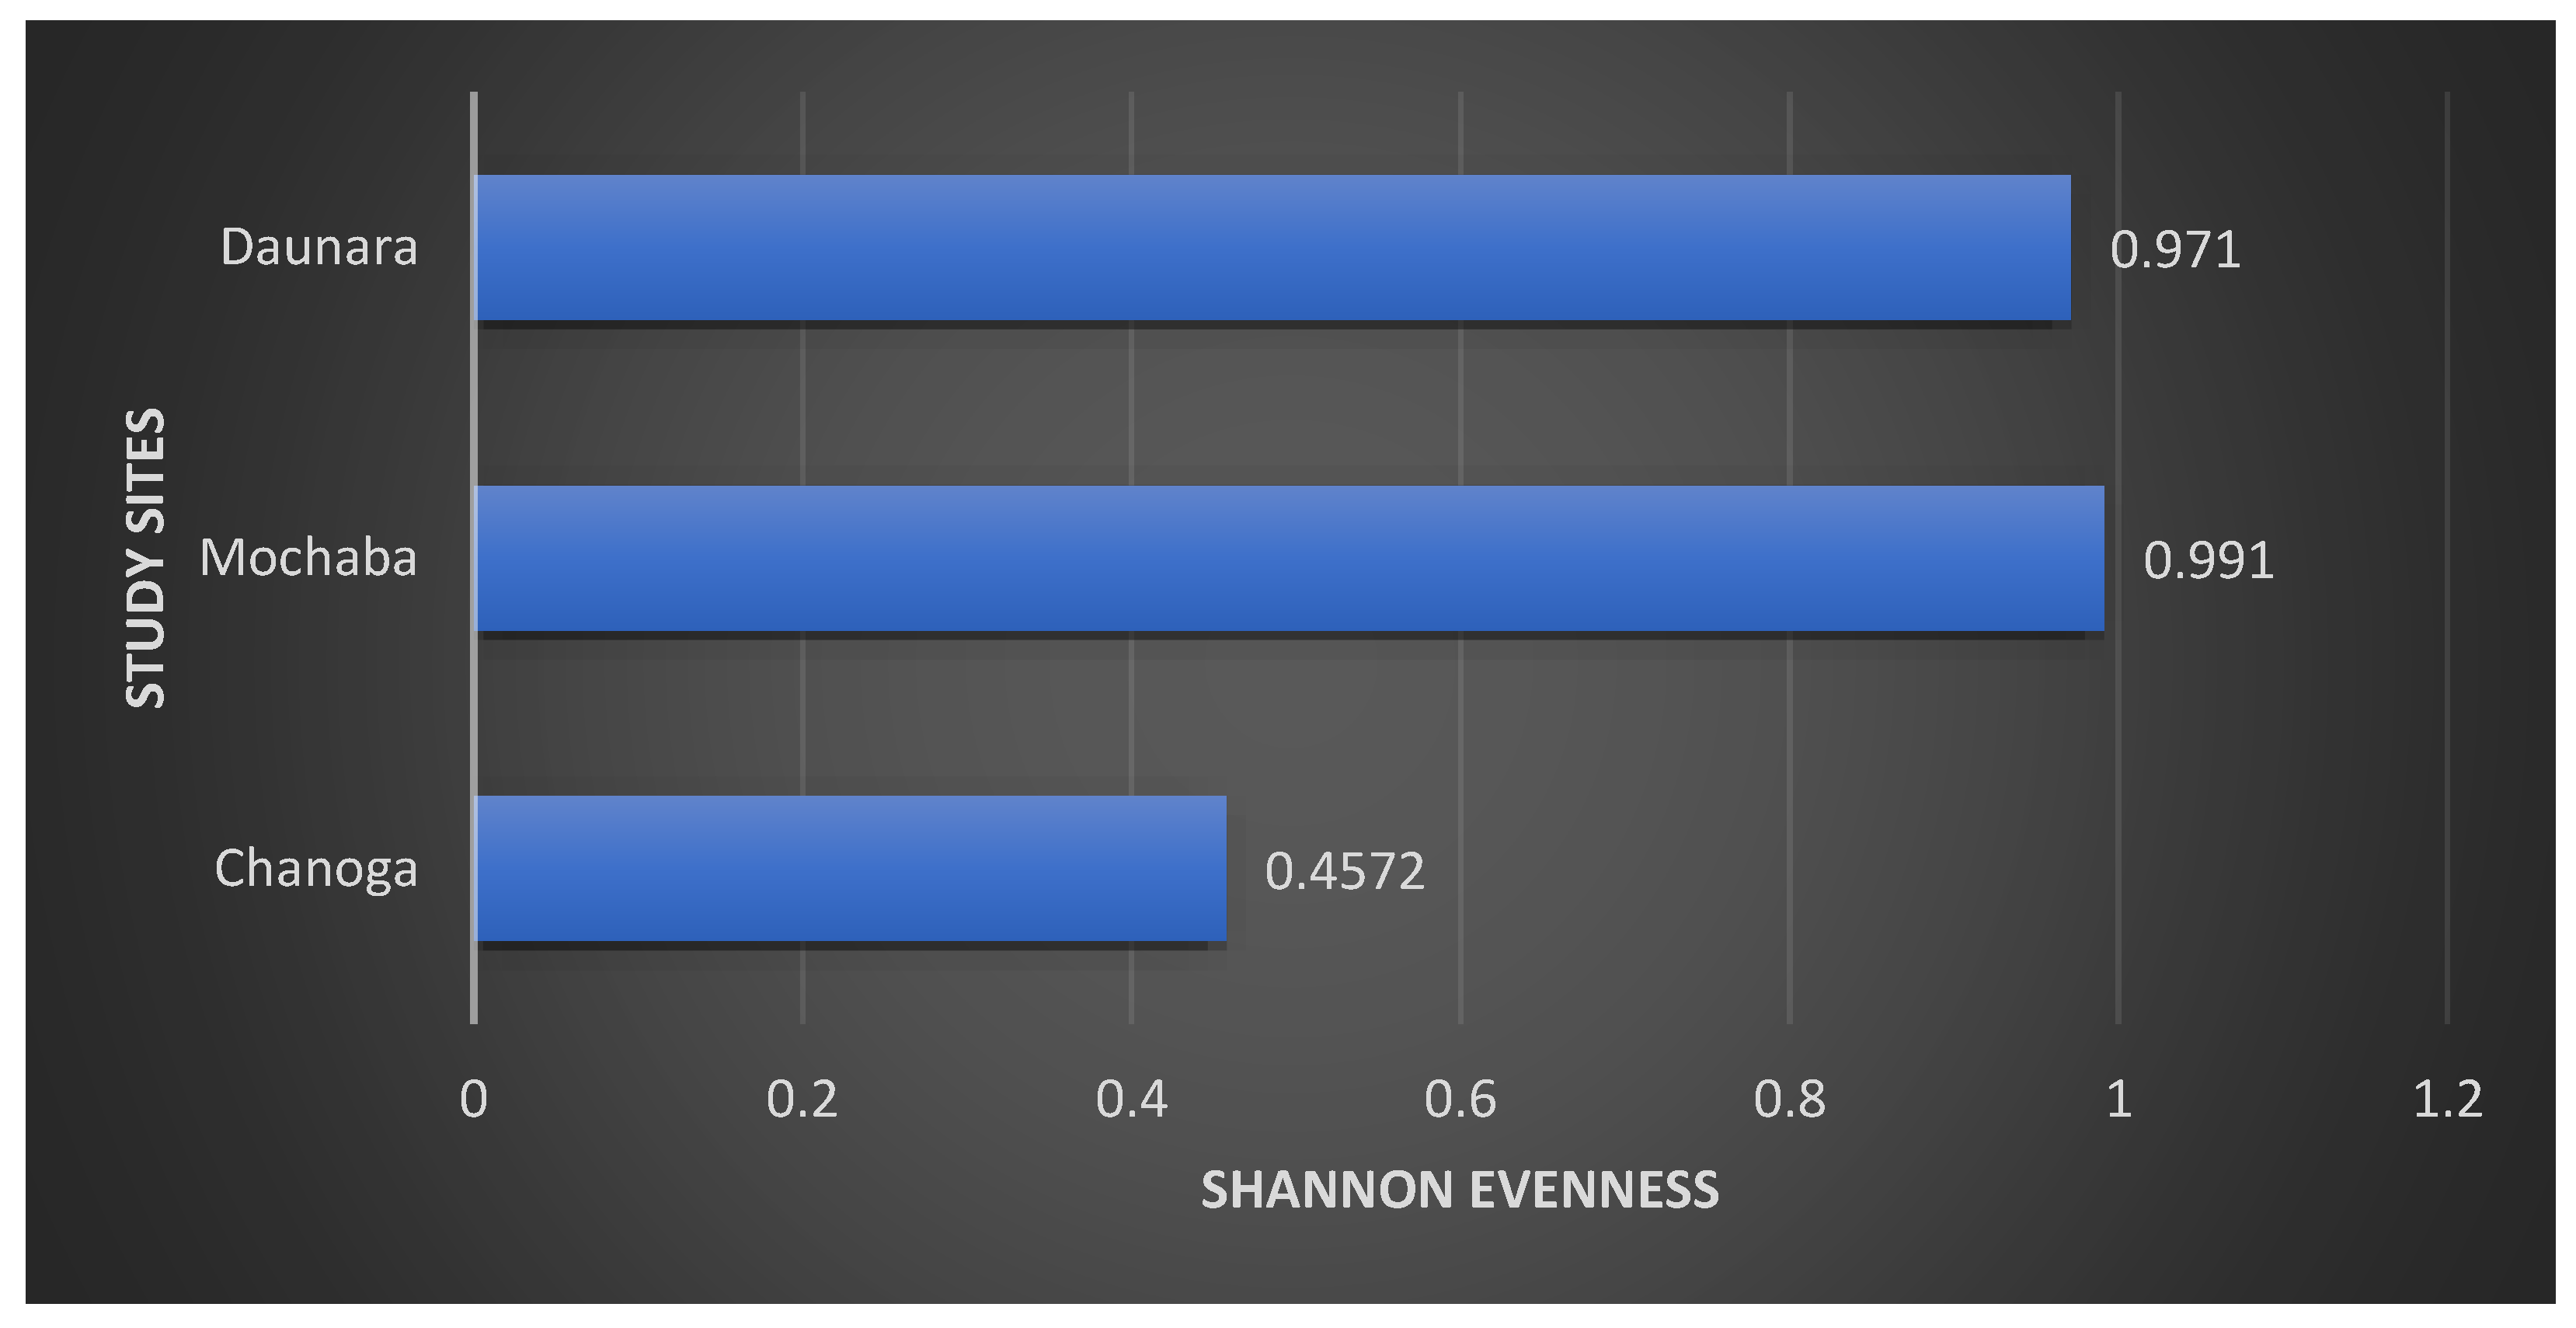
Daunara and Mochaba study sites had values of 0.971 and 0.991 respectively which is an indicator that the species distribution in that area is equal while Chanoga had a Shannon evenness value of 0.4572 which is much closer to zero hence there unequal distribution of species in that area.
6. Discussion
The demographic table in table 1 showed that most of the respondents were people who operated mokoro and also fisherman as they are the ones that are mostly in the water at have a high chance of encountering frogs and toads. The RFC value calculated was to show which of the species in the three localities is most common and the respondents seem to encounter the most. An RFC value of close to 1 shows that the species is more common and that closer to 0 shows that the species is less common. The results showed that the Pyxicephalus adspersus (Giant African frog) and Xenopus muelleri (Mulleris Platana) were the frogs the ones that had more citing by the respondents across the study areas with an RFC value of 0.875. The least common amphibians being Lemaire’s toad, Eastern flat-backed toad, Longnose reed frog, Powers clawed frog 0.042, their citing were only reported in Daunara indicating that the species is more likely to be seen in that area compared to the other areas. A total of 18 amphibian species were reported in Daunara, 13 in Morutsha and 11 in Chanoga. These values showed that as one moves closer to the delta the diversity of the amphibians increase. The Okavango Delta spanning nearly 2 million acres of largely undisturbed wetlands and periodically flooded meadows, tourism to the inner Delta is limited to small, temporary tented sites with air access, and facilities are rigorously monitored for environmental compliance and minimal ecological damage (UNESCO, 2023). After calculating with the ANOVA to see if there was any statistical difference in the means of these results, it showed that there was no significance difference in the means of the three sites, hence indicating the difference in the number of amphibian species is not large enough to consider a statistical difference.
The results from the spectrogram were used to identify the amphibian species at each site from their unique calls. From the Chanoga study site Drifters Safaris Camp, the spectrogram had a high colour intensity at frequency below 2 kHz. According to du Preez & Cook (2023) a call from Pyxicephalus adspersus is 1–2 s in duration and with an emphasized frequency of 200–250 Hz. The frequency is reported to always range below 2 kHz hence from the spectrogram reading the frequency below 2 kHz was from the Pyxicephalus adspersus. The colour intensity in Chanoga was more read indicating that there were a lot of Pyxicephalus adspersus in that area. From listening to the recording an estimate of 15 Pyxicephalus adspersus were identified in the study site. Still at the Chanoga study site there were a really small number of reed frogs that were heard, one from the Hyperolius parallelus (Angolan reed frog) and one from Hyperolius marmoratus (Painted reed frog). These were identified in the spectrogram to range between 2.5 kHz and 3 kHz. “The call is a short whistle, only about 0.1 seconds long and has a frequency ranging from 2.8 to 3.1 kHz” (High, 2003). This was because the study site was located in an area where there were a small number of reeds because a lodge was built there and there was a lot of disturbance in that area. The reed frogs are known to cling to these reeds during the day. An Amietophrynus gutturalis (guttural toad) was spotted at the site. “Guttural toads are large toads that are very adaptable and can live in a variety of environments, which means they do not suffer much from habitat loss” (Invasives, 2021).
The spectrograms from the recording in Daunara did not show a variety of a lot of species. The site was full of reeds and the only amphibian species that were able to identify were the reed frogs. An estimate of two Hyperolius parallelus and three Hyperolius marmoratus were heard at the study site which was Daunara mokoro station. From the recording no call from Pyxicephalus adspersus was heard. According to du Preez & Cook (2023) these frogs typically breeds in seasonal, shallow, grassy pans in flat, open areas but also utilizes non-permanent vleis and shallow water on the margins of waterholes and dams. The area in Daunara had deep water which was not ideal for the P. adspersus.
The last study site which was at Mochaba lagoon exhibited a variety of frog calls. The spectrogram reading showed that there were P. adspersus in the area, the color intensity was not as profound as that from the Chanoga study site. The estimated number of P. adspersus was six. The spectrogram also showed that there was quite a number of reed frogs, the site was covered with a lot of reeds which was ideal for the reeds frogs. An estimate of eight H. parallelus and six H. marmoratus were recorded at the site.
The Shannon-weiner diversity which was used to calculate the species richness and evenness of each area showed that the Mochaba study site was high in species diversity recording H’ being 1.08 and also there was evenness of the species in the site J being 0.991. This was the case because the site had less disturbance compared to the other study sites. Chanoga study site which recorded the least diversity H’ being 0.63 and less evenness J being 0.45 was due to a lot of disturbance in that area. There were lodges that were built in the area which destroyed the habitats of the frogs and also reducing the diversity of the amphibians. Some of these activities included cruise boat riding, fishing, speed boats and water pumping happening in the area which disturbs the habitat of the amphibians. The diversity in Daunara was only for the reed frogs as they were the ones found in that area. The H’ was 0.67 and J was 0.97 because the red frog numbers never show any significant difference.
These results are in correspondence to the Intermediate disturbance theory that low disturbance reduces diversity due to competition and high disturbance reduces all the species due to external influence from anthropogenic influence.
7. Conclusions
This study aims to determine the amphibian species diversity in the Daunara, Mochaba and Chanoga, and compare the amphibian diversity in the different study sites. Sound recordings were collected at each study site and analyzed to identify the species. The species that were recorded at the site were the P. adspersus, H. marmoratus, H. parallelus and A. gutturalis. The species richness and species evenness at the different study sites calculated showed that Mochaba had the highest diversity of amphibian species followed by Daunara and lastly Chanoga. The results correspond to the theory of Intermediate disturbance which prove that high disturbance will result in all the species facing a threat and reduction in diversity as was the case in Chanoga which had more disturbance than the other sites. The study also tested the local people’s knowledge on the different amphibian species that were in their area and it showed that the local people were able to identify the species that were found in their locality. Most of them did not know the ecological importance of protecting the amphibians from extinctions as they are used to indicate a healthy environment. Further research is needed to determine seasonal/temporal variation is species diversity of the sites. Furthermore research should be done on the amphibian species in different areas to provide information on the distribution, abundance and habitat requirements of species, and the environmental variables that control diversity under changing climatic conditions.
References
- Borah, M. P. , & Prasad, S. B. Ethnozoological study of animals based medicine used by traditional healers and indigenous inhabitants in the adjoining areas of Gibbon Wildlife Sanctuary, Assam, India. Journal of ethnobiology and ethnomedicine 2017, 13, 1–13. [Google Scholar]
- Catenazzi, A. State of the World’s Amphibians. The Annual Review of Environment and Resources. 2015. [Google Scholar] [CrossRef]
- Charnley, S. , Carothers, C., Satterfield, T., Levine, A., Poe, M. R., Norman, K.,... & Martin, K. S. Evaluating the best available social science for natural resource management decision-making. Environmental Science & Policy 2017, 73, 80–88. [Google Scholar]
- da Silva, F. R. , Gibbs, J. P., & Rossa-Ferres, D. de C. Breeding Habitat and Landscape Correlates of Frog Diversity and Abundance in a Tropical Agricultural Landscape. Society of Wetland Science 2011, 1079–1087. [Google Scholar] [CrossRef]
- Duellman, W. E. and Zug, G. R. (2023). amphibian. Encyclopedia Britannica, https://www.britannica.com/animal/amphibian.
- du Preez, L. Cook, C.L. (2023). Pyxicephalus adspersus Tschudi, 1838. Animal Demography Unit. Accessed from http://frogmap.adu.org.za/?sp=850; on 2023-07-17 12:07:17.
- du Preez, L. and Carruthers, V. (2009). A complete guide to the frogs of Southern Africa.Cape Town: Struik Nature. 488 p.
- Feldman, M. J. , Imbeau, L., Marchand, P., Mazerolle, M. J., Darveau, M., & Fenton, N. J. Trends and gaps in the use of citizen science devised data as input for species distribution models: A quantitative review. PLOS ONE 2021, 16, e0234587. [Google Scholar] [CrossRef]
- Hamer, A. J. , & Parris, K. M. Local and landscape determinants of amphibian communities in urban ponds. Ecological Applications 2011, 21, 378–390. [Google Scholar] [CrossRef] [PubMed]
- High, J. (2003). Hyperolius marmoratus, Animal Diversity Web. https://animaldiversity.org/accounts/Hyperolius_marmoratus/.
- Invasives. (2021). Guttural Toad. Invasives South Africa. https://invasives.org.za/fact-sheet-animals/guttural-toad/.
- iZotope. (2023). Understanding Spectrogram. Retrieved , 2023, from https://www.izotope.com/en/learn/understanding-spectrograms.html.
- le Roux, M. (2010). Amphibian diversity and breeding behavior in the Okavango delta. North-West University.
- Lee, T. S. , Kahal, N. L., Kinas, H. L., Randall, L. A., Baker, T. M., Carney, V. A.,... Duke, D. Advancing Amphibian Conservation through Citizen Science in Urban Municipalities. Diversity 2021, 13, 211. [Google Scholar] [CrossRef]
- Marque, T.A. , Dornellas, L.F., Guerra, A., Marque, C.S., Tempero, B., Zacarias, M. & Hart, C. Counting Animals By Recording Their Voices. Front. Young Minds. 2022, 10, 704420. [Google Scholar] [CrossRef]
- Okavango Delta Checklist. (n.d) Okavango Delta. Retrieved , from https://www.inaturalist.org/check_lists/911729-Okavango-Delta-Check-List.
- Poynton, J.C. The Amphibia of Southern Africa: a faunal study. Annals of the Natal Museum 1964, 17, 1–334. [Google Scholar]
- Stuart, S. N. , Chanson, J. S., Cox, N. A., Young, B. E., Rodrigues, A. S. L., Fischman, D. L., & Waller, R. W. Status and Trends of Amphibian Declines and Extinctions Worldwide. Science 2004, 306, 1783–1786. [Google Scholar] [CrossRef] [PubMed]
- Sullivan, B. L. , Aycrigg, J. L., Barry, J. H., Bonney, R. E., Bruns, N., Cooper, C. B.,... & Kelling, S. The eBird enterprise: An integrated approach to development and application of citizen science. Biological conservation 2014, 169, 31–40. [Google Scholar]
- UNESCO. (2023) Okavango Delta, UNESCO World Heritage Convention. https://whc.unesco.org/en/list/1432/.
- Wilkinson, D. M. The disturbing history of intermediate disturbance. Oikos 1999, 84, 145–147. [Google Scholar] [CrossRef]
Figure 1.
GEOGRAPHIC MAP OF THE THREE STUDY SITES.
Disclaimer/Publisher’s Note: The statements, opinions and data contained in all publications are solely those of the individual author(s) and contributor(s) and not of MDPI and/or the editor(s). MDPI and/or the editor(s) disclaim responsibility for any injury to people or property resulting from any ideas, methods, instructions or products referred to in the content. |
© 2025 by the authors. Licensee MDPI, Basel, Switzerland. This article is an open access article distributed under the terms and conditions of the Creative Commons Attribution (CC BY) license (http://creativecommons.org/licenses/by/4.0/).
Copyright: This open access article is published under a Creative Commons CC BY 4.0 license, which permit the free download, distribution, and reuse, provided that the author and preprint are cited in any reuse.


