
Submitted:
22 May 2025
Posted:
23 May 2025
You are already at the latest version
Abstract
A lightning climatology covering 16 years based on ground measurements is presented and discussed. Instead of the lightning density, the focus lies on the analysis and interpretation of mean normalised amperage. This enables to identify regions with a particularly high risk of severe thunderstorms. Our results indicate that in autumn the North-Sea and the Po Valley is characterised by few but very strong thunderstorms. During the convective season the number density of thunderstorms increases significantly over land. The Alpine region is by far most affected by thunderstorms, whereby the severity of the thunderstorms is likely on average much higher in the southern (Po Valley) than in the northern foothills. Also some regions along the western and eastern border of Germany are on average much affected by thunderstorms. The patterns of the amperages form some sort of a U-shape, which probably results from the lifting of incoming moist air from the west or east by the orography. The analysis reveals that the mean normalised amperage could be a good candidate for the measure of the severity of thunderstorms and the estimation of risks induced by strong hail events.
Keywords:
lightning
; thunderstorms
; hail
; climatology
1. Introduction
Thunderstorms endanger life and infrastructure. They occur very frequently during summertime in Central Europe. Information about frequency and severity of thunderstorms is important in order to estimate possible risks and the costs for insurances and to support protections measures, either personally or for structures (e.g. [1]). Therefore, lightning data are used in many applications ranging from thunderstorm nowcasting to the generation of climatologies, which are in turn useful for climate monitoring and analysis, for training and evaluation of neural networks and finally for economic applications, e.g. for calculating the required coverage amounts for insurances. Some applications are outlined below.
The NowCastSat-Aviation (NCS-A) method [2] uses the GLD360 lightning data [3,4,5,6,7] from VAISALA for the nowcasting of severe convection. The use of lightning data for this method was a customer requirement e.g. from "Lufthansa System". Using only satellite or NWP information would lead to a much higher False Alarm Ratio (FAR) in combination with a lower probability of detection. The product is used by several key customers and the lightning data are an important building block of this success Also the Convective Diagnosis Oceanic (CDO) products [8] are based on lightning data. Here, data from EarthNetworks ground based global network [9] are used, in addition to Cloud Top Height (CTH) and Overshooting Tops (OT) information from geostationary satellites [10]. The respective algorithm is used to detect the area of thunderstorms that are most hazardous for aviation. Climatologies of lightning data are of high value for different types of risk assessments. They can also be used to improve thunderstorm forecasting using bias correction based on artificial intelligence [11] or training and evaluation of neural networks for nowcasting, e.g. [12]. Climatologies are also of high relevance for the monitoring and analysis of climate change. However, for this purpose at least several decades of a homogeneous data set would be necessary. Finally, the analysis of lightning is essential for our understanding about the key factors for the development of severe thunderstorms and the particularly endangered regions.
In this paper a lightning climatology for a region in central Europe is presented and discussed based on LINET [13,14] data. Comparison studies of LINET which discusses also the detection efficiency can be found in e.g. [15,16]. The region selected for this study is well covered by the LINET stations and is therefore well suited for the generation of a climatology with high spatial resolution and detection efficiency. LINET data have been already used to analyse thunderstorms in Central Europa by [17]. She found that the highest number of lightning strokes occur in the pre-alpine region of Germany, but that also some local maxima in low mountain ranges are apparent. In contrast, the lowest number of lightning strokes was found in areas of the North and Baltic Sea. As expected, the maximum lightning density occurred in the summer season (June to August) and the diurnal cycle showed a maximum in the afternoon. Further, she found that the daily maximum occurs later in the afternoon in summer compared to spring and autumn. However, the analysed data set covered only 6 years. Therefore in our study a longer time series is generated and discussed, covering 16 years from 2007-2023. Also several other authors have analysed thunderstorms in Europe. In this context, a brief overview of key works dealing with lightning climatologies is given as a basis for the discussion of our results.
A regional lightning climatology of the UK and Ireland was presented and discussed in [18]. The analysed climatology covers a 12-year period from 2008 and 2019 and they compared the lightning fingerprints for different regions in order to gather additional insights for the temporal distributions of lightning. They found that different regions exhibit contrasting summer thunderstorm seasons and that diurnal lightning distributions have also a significant regional dependency with stronger afternoon peaks over land. Further regions more prone to winter thunderstorms were identified as having northwest facing coastlines [18].
Kahraman et al. [19] addressed the poor representation of thunderstorms in conventional climate models, which results in high uncertainty in predicted future changes up to conflicting results. Beside simulations they use ATDNet observations [20] in order to discuss this issue and to improve the modelling of thunderstorms and thus of lightning. A prolonged series of ATDNet observations were also analysed by [21]. They found that the annual lightning density was highest in northeast Italy. In line with other studies in Europe they observed the highest lightning frequency during the afternoon hours and the lowest frequency at night. However, a 10 year climatology is rather short for the analysis of thunderstorm patterns.
Morgenstern et al. [22] used EUCLID (European Cooperation for Lightning Detection) lightning data together with ERA5 reanalysis in order to analyse meteorological environments favourable for thunderstorms. They found two major thunderstorm environments: Wind-field thunderstorms, characterised by increased wind speeds but relative low CAPE values and mass-field thunderstorms, characterised by large CAPE values, high dew point temperatures, and elevated isotherm heights. They found that wind-field thunderstorms occur mainly in winter and more over the seas, while mass-field thunderstorms occur more frequently in summer and over the European mainland.
A Pan-Alpine climatology of lightning and Convective Initiation (CI) was generated and analysed by [23]. The Alpine region is a hot-spot for lightning activity in Europe. Again data from EUCLID (2005-2019) are used for the study. They found a maximum activity for Cloud to Ground (CG) flashes from mid-May to mid-September, with a peak at the end of July and overall a afternoon peak in the diurnal cycle occurring in the afternoon. They argued that since many thunderstorms follow the prevailing mid-latitude westerly flow, a peak of CG flashes extends from the mountains into the plains and coastal areas of northeastern Italy and Slovenia. Finally, they found that CG flashes over the sea/coast occur less frequently than in plains and mountains. Probably as a consequence of the lower diurnal cycle in the surface temperature, they observed a weaker diurnal cycle for ocean thunderstorms. Further, they found that the seasonal maximum of thunderstorms over the sea/coast is in autumn instead of summer.
Spatiotemporal variability of lightning activity in Europe and the relation to the North-Atlantic-Oscillation teleconnection pattern is discussed in [24], based on BLIDS lightning data from a SIEMENS network covering 15 years [24]. Their results emphasis the crucial role of large-scale flow in steering the spatial and temporal patterns of convective activity.
Probably one of the longest observations analysed so far is presented in the work of [25]. This study uses the PERUN lightning detection network managed by IMGW-PIB (Institute of Meteorology and Water Management – National Research Institute) during period 2002 to 2020. They found that the highest electrical activity occurs in central Poland (Mazovian Lowland) and the lowest in the Pomeranian Lake District. However, during 18 years the network have changed, e.g. by addition of stations ( Legnica, Chojnice and Kozienice) which affects the lightning tendency and thus the trends. Thus, more studies in order to investigate trends in thunderstorms and to analyse the reasons are needed.
Studies that covers longer time periods than of about 10-20 years are usually relying on additional data sources beside measurements, e.g. [26]. The analysed data set covers a period from 1979-2017, but in addition to measurements also NWP reanalysis data (ERA4) were used. They found annual peak thunderstorm activity in July and August over northern, eastern, and central Europe, contrasting with peaks in May and June over western and southeastern Europe. They argue that the thunderstorms in the Mediterranean are driven by the warm waters and thus have predominant activity in the fall (western part) and winter (eastern part) while the nearby Iberian Peninsula and eastern Turkey have peaks in April and May. They also investigated trends in thunderstorms. Their analysis of thunderstorm days indicates an increase over the Alps and central, southeastern, and eastern Europe with a decrease over the southwest. However, they used NWP data in there study which induces the risk of artificial trends. For more reliable trend analysis a longer time series of homogenised observations is needed.
In contrast to the studies above we focus for the analysis of the thunderstorms on averages of the amperage (current strength) normalised with the number of lightnings per hour. We believe that this quantity is less sensitive to changes in the network and thus better suited for the analysis of lightning climatologies (see Section 2). In addition, many small thunderstorms produce likely less damage than a few large storms. Within this context it has also to be considered that as a result of the high number of thunderstorms protective measures might be only possible and reasonable for the "most" severe storms. Thus, we believe that our approach enables a better analysis of regions with a high frequency of severe thunderstorms and thus the risks for damages. The focus on the mean normalised amperage is is a novel aspect and provides novel insights. As far as the authors know, in this study the benefit of using the mean normalised amperage are discussed within the scope of training and evaluation of neural networks for the first time. Finally, the total lightning density (cloud to cloud and cloud to ground flashes) depends largely on the lightning networks (see Section 2) and are thus only partly comparable amongst each other. Therefore further studies using different networks, such as those presented in this manuscript, are expected to provide additional insights, especially as this manuscript contains an analysis of the the longest LINET climatology discussed so far, as far as the authors are aware.
2. Materials and Methods
The climatological data discussed in this study is based on the LINET lightning data [13] from the Nowcasting AG. The LINET network consists of several lightning sensors in Europe equipped with a field antenna, a GPS receiver and a field processor to analyse the information of the signal in the VLF/LF wavelength region, thus, in radio bands. The Very Low Frequency range (VLF; 500 Hz– 50 kHz), allows a larger distance between the stations, but on cost of a lower detection efficiency. Networks operating in this spectral range have usually a lower detection efficiency concerning cloud to cloud (CC) lightning and measure primarily cloud to ground lightning flashes. This leads to a lower number of total lightnings per thunderstorm, in particular in the low amperage range. This is illustrated in Figure 1 and is one motivation to focus on the analysis of mean normalised amperages (current) in this study. The VLF frequency corresponds to wavelength from 10-100 km.
The low frequency is defined in the range of 30–300 kHz and has a wavelength range from 1-10 km. Hence for this range a denser network of receiving stations are needed to cover a larger region. Thus, this range is usually used for regional data and is not well suite for a global lightning network. LINET exploits the LF spectral range that allows a better identification of weaker lightnings and cloud to cloud (CC) discharges. Hence, overall a larger number of lightnings are detected. They use baselines of ca. 200 km for an adequate coverage in central Europe. In many areas at the border of region covered by LINET including the Mediterranean Sea, the distances between the stations are on average larger than in central Europe; consequently, the detection efficiency is lower in these regions. During the last 17 years the LINET measurement network was modified, e.g. by adding stations and updates of the retrieval software. Although, this improved the detection of lightnings in particular at the borders of the network, it probably also led to inhomogeneities in the time series. In order to reduce this risk, this study focuses on a core region in central Europe where the density of stations were high from the beginning (see [13]) and hence a more homogeneous data set can be assumed. Further, for the analysis we focus on spatial patterns of normalised Amperage, mainly absolute values. Please note, that in the original data the Amperage can be positive or negative. Figure 2 illustrates a typical distribution of the amperages using two example month of the convective season (June/September 2017).
The programming language Julia [27] in combination with the climate data operators (CDO) [28] have been used to calculate the mean normalised Amperage (kA) and the lightning density on a regular grid. In a first step the lightning information (number and Amperage) is transferred to a regular grid with a resolution of 0.05 degrees for the complete time series. This is done by a near neighbour approach. Each lightning event is assigned to the nearest neighbour of the 0.05 degree grid. The lightning density results from summing up each lightning pro raster point for a given unit of time (hours and months) using the cdo command enssum. The long term monthly mean is then calculated with the cdo command ensmean. The mean normalised Amperage are calculated as follows: In a first step the amperages and the lightnings are summed up for each hour. The sum of the amperages is then divided by the sum of the lightnings per hour (or in other words by the number of lightnings per hour). The hourly values are then aggregated to monthly values and long term monthly means with cdo [28] using the command ensmean. The resulting monthly long term values of the number of lightnings and the respective mean normalised Amperage are presented in Figure 4 and Figure 7. The thunderstorm patterns that occur are analysed and discussed in Section 3 in terms of main physical drivers. Thus, for a better understanding of this discussion basic drivers for thunderstorms are briefly discussed in the next paragraph.
2.1. Basic Drivers for Thunderstorms
Moisture, instability of the atmosphere and an forced updraft (lifting mechanism) are the main drivers for thunderstorms. Strong wind shear is one indicator for severe thunderstorms. For surface dewpoints less than 13 degrees Celsius the conditions are not favourable for the occurrence of thunderstorms because they are often associated with stable atmospheres, which depresses vertical movement. However, lower dewpoints could also lead to thunderstorms in the case of forced updraft of air induced by a strong lifting mechanism. High solar surface irradiance is a driver for warming of the soil and thus for vertical updraft over land. Further it is a reason for strong evaporation [29] in particular in case of wet soil which feeds the air with moisture. Thus it is a driver for thunderstorms and explains the daily cycle of thunderstorm reported by many colleagues, which peaks in the afternoon, as the warming of the soil occurs with a time delayed. This effect is particularly pronounced in the Intertropical convergence zone, but to a much lesser extent also in central Europe.
Stable atmospheres depresses the updraft of air parcels and hence deep convection and with that the development of thunderstorms. Therefore, instability of the atmosphere is an important pre-requisite for the development of thunderstorms. CAPE is often used to indicate the instability in terms of thunderstorm likelihood. Very often, instability occurs in the middle and upper levels of the troposphere but not in the lower troposphere. Low level stability is often referred to as convective inhibition. In case of convective inhibition a forced updraft (forced lift of air) is needed to overcome the thermal barrier in the lower troposphere. Therefore, a forced updraft of air is also a key trigger mechanism for thunderstorms.
There are many different updraft mechanisms. In the following the main mechanisms for central Europe are discussed. Fronts bring cold air which lifts the warm air. Because of this thunderstorms induced by fronts are a very common in central Europe, e.g. [30]. Another reason are mesoscale convergence boundaries such as sea land breezes, mountain valley winds and forced lift of horizontal winds by orography. Finally, updrafts induced by solar surface irradiance and resulting heating of the soil. An overview of the orography is given in Figure 3. It will be used for the discussion of the results,
We assume that the mean normalised amperage is a measure for the severity of thunderstorms. This is a reasonable assumption, because as a result of the law of energy conversation the electricity results from potential energy (e.g. CAPE) and kinetic energy provided by winds. CAPE and strong winds (updrafts, shear) are in turn well established indicators for the severity of storms. Further, the higher the amperage the more dangerous the lightning. However, it is important to note that the same thunderstorm would lead to different Amperage values for different measurement networks as a consequence of different measurement techniques, see Figure 1. The normalisation of the amperages by the number of lightnings might improve the comparability between different networks.
3. Results
For the sake of clarity the discussion of the results is separated in cold season covering October to March and the convective season, covering April to September.
3.1. Cold Season
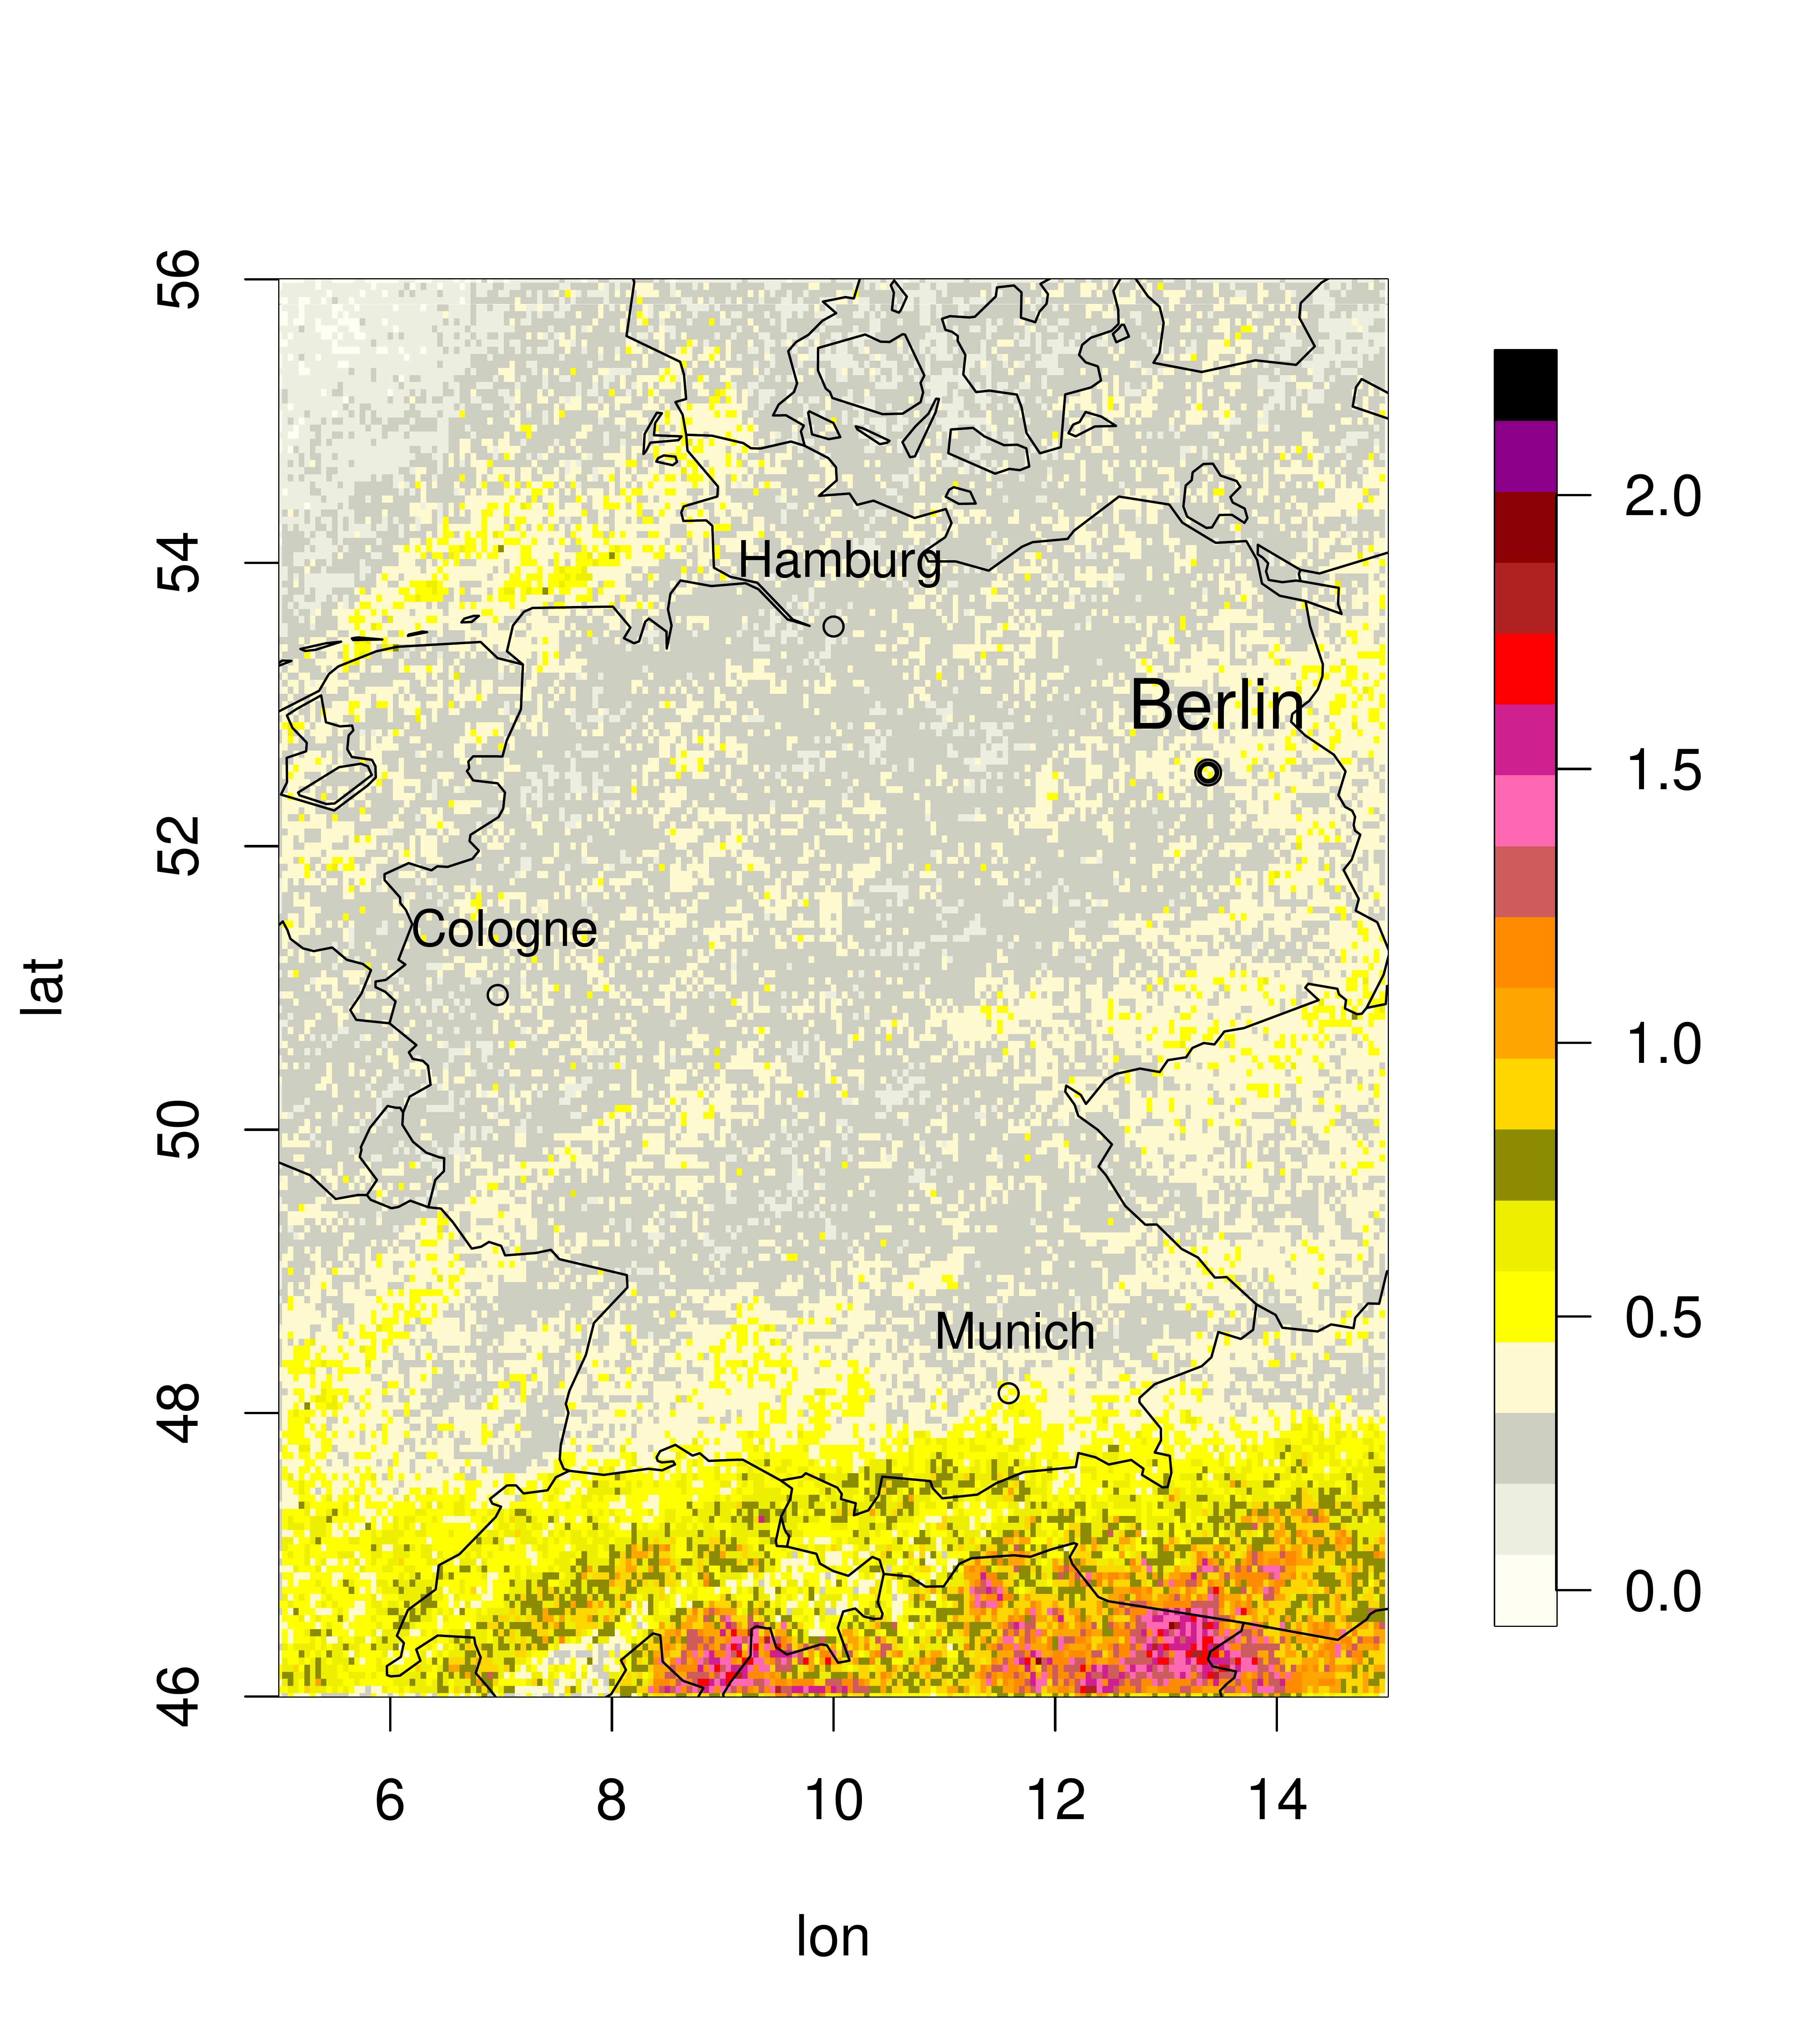
Figure 4 shows the results for the cold season, which is on average characterised by stable atmospheric conditions. Overall the thunderstorm activity is much lower in the cold season than in the convective season. The atmosphere is on average characterised by stable atmospheric conditions which suppresses the development of thunderstorms. Further cold air can absorb less water vapour and is thus less moist. In contrast to the convective season, however, the autumn months of September, October and November show particularly increased values of the mean normalised Amperage over the North Sea relative to the other areas. This is to a much lesser extend also true for December. How can this pattern by explained ?
The North Sea is still relative warm during these months and the evaporation is therefore still relatively high. Thus, the North Sea acts as a source for relative warm and moist air. Cold fronts induced by autumn storms can lead to a crash of cold air with this warm and moist air. In addition the associated fronts form a vertical wedge that leads to lifting and thus are favouring the development of thunderstorms. Therefore, the patterns are probably induced by frontal autumn storms.
With regard to the classification of Morgenstern [22] these storms are wind-field thunderstorms, characterised by increased wind speeds but relative low CAPE values. A comparison with the lightning densities (Figures in Appendix, Figure A1 and Figure A2) reveals that these hot spots are a result of relative few, but very strong thunderstorms. The overall stable atmospheric conditions and less moisture during the cold seasons, which are on average a result of the low solar surface irradiance, hinders the development of thunderstorms resulting in a very low frequency of thunderstorms, but the few thunderstorms that occur have on average very high mean normalised Amperage over the North Sea and are known to be quite severe. As the Baltic sea has in average lower wind velocities and fewer heavy storms, no corresponding patterns are discernible over the Baltic Sea.
High mean normalised amperages are also apparent south of the Alps with peaks in September and October. Here, still relatively warm and moist air from the Po valley and updrafts induced by the Alps are the main drivers for the relative high mean normalised amperages. The updrafts are in turn a result of strong mountain valley winds and in case of southern winds forced uplift by the orography. During this period strong southern winds are very frequent according to the Memsglobal model of Meteoblue, e.g. [31]. Beside the above mentioned regions the mean normalised amperage is low over the Alps and the northern foothills of the Alps. In this region usually cold air from the Alps meets relative cold air from the low lands and the atmosphere is on average stable. When the synoptic weather situation leads to inflow of warm air in the lower lands, there is no significant lifting by the mountains, as the wind comes very seldom from the North and the solar surface irradiance is too low to generate "heat uplift". Finally, storms are on average much weaker there than over Northern Germany. Hence, their are on average no significant lifting mechanisms of the air. The winter months January and February, but also March show overall a very low thunderstorm activity.
The pronounced patterns over the North-Sea and the southern side of the Alps are not (North Sea) or much less pronounced in the lightning density images, see for example the direct comparison for October in Figure 5. The findings in the cold seasons demonstrate the strength of using normalised amperages and the weakness of using lightning densities.
Convective or warm season
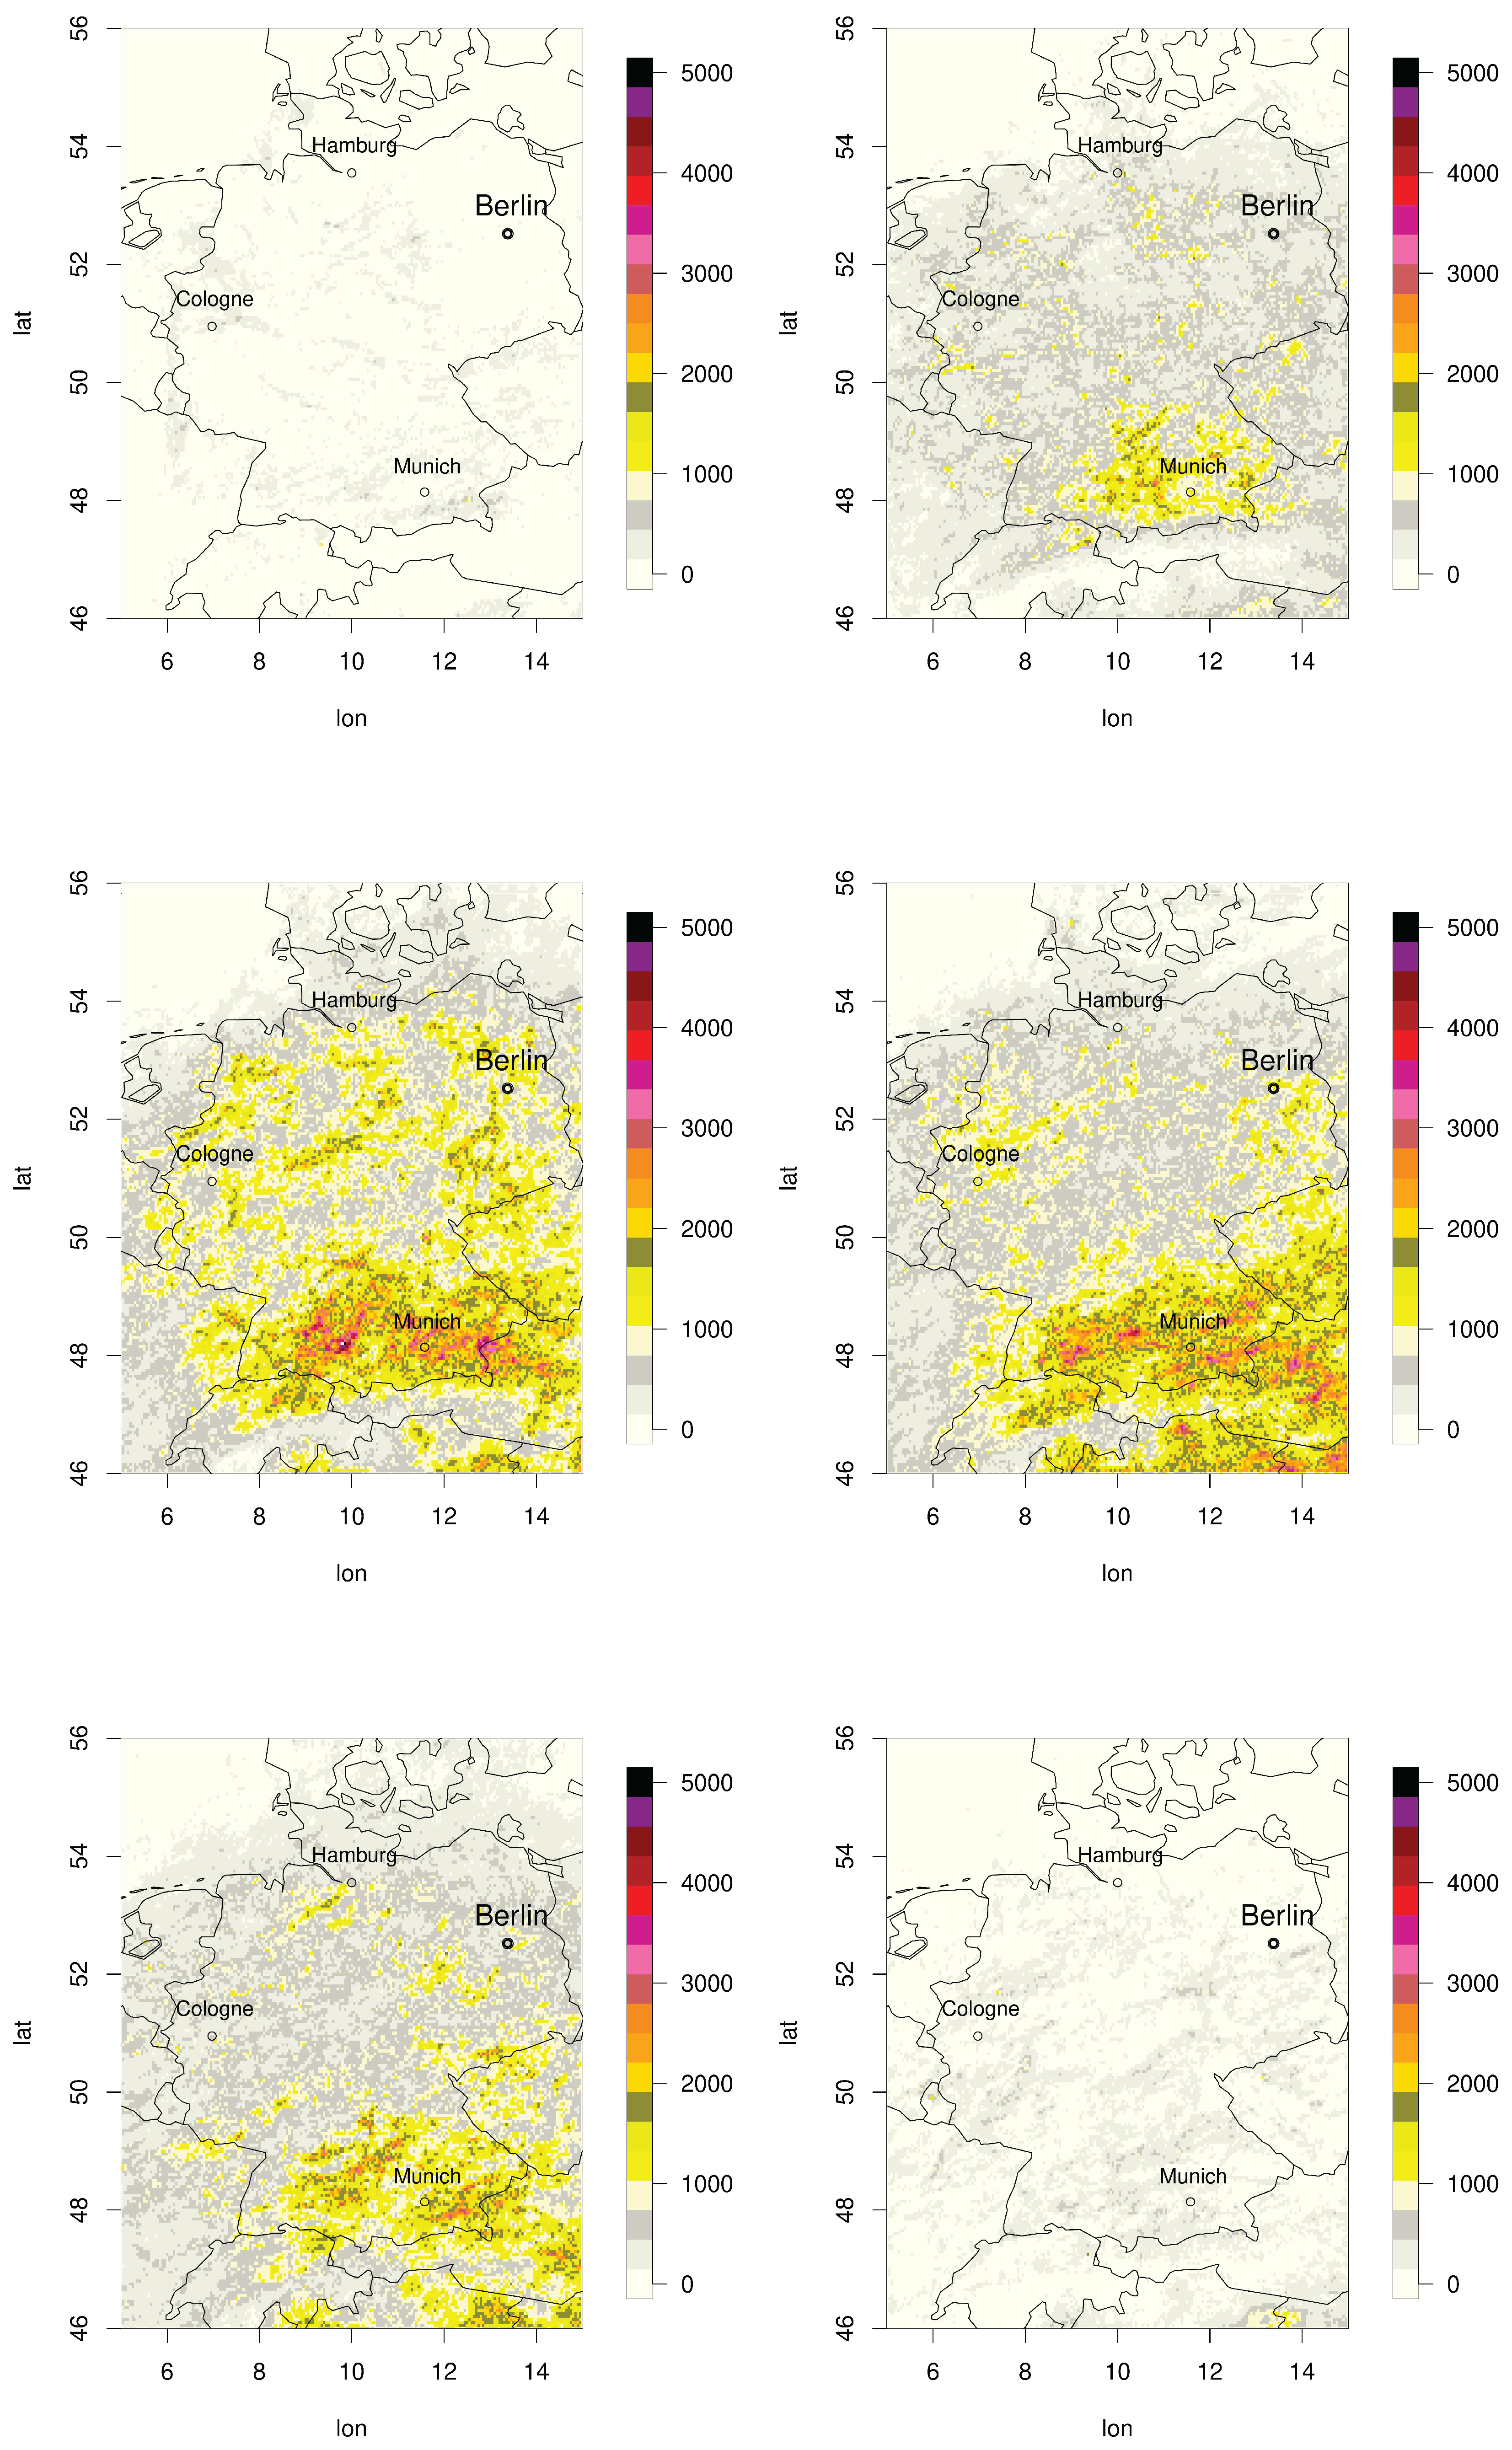
Overall the thunderstorm activity is much higher in the convective season, so that the scale for the mean normalised amperages [kA] has to be adjusted to higher values from May onward, see Figure 7. From May onward the mean normalised amperages and the number of lightning increase and the highest thunderstorm activity can be observed in June and July. The difference in height and thus temperature between the foothills and the Alpine massive lead to strong mountain valley winds and hence form an additional trigger for severe thunderstorms in case of warm and moist air. Central Europe is driven by south-westerly winds. The mountains act as natural barrier and horizontal winds are forced upwards and can add updraft to the mountain valley winds. It should be therefore expected, that the highest frequency of severe thunderstorms should occur close along the Alpine ridge as a result of the strong updrafts induced by the Alps. However, the lightning density shows very high values in the northern foothills far away from the Alpine massive. The mean normalised Amperage instead show the expected pattern, see figure see Figure 6 and Figure 7 in comparison to Figure A2. This is another clear indicator that the normalised amperages are a better indicator for the frequency of severe storms than the lightning density. Within this scope the comparison of the flash density with the mean Amperage per thunderstorm reveals another interesting feature. The lightning density is higher on the northern side of the Alps in our example months June and July, but the mean normalised amperage is higher on the southern side, see Figure 6.
What can be the reason for this difference ? On both sides the Alps act as lifting force, but there is a greater difference in the height between the foothills and the Alps on the southern side and the air on the southern side is on average warmer and contains on average more moisture (again finally, as a result of difference in solar surface irradiance). Thus the mountain valley winds are much stronger and on average the difference in moisture is much greater between the Alpine ridge and the foothills. Favourable synaptic winds from the southern direction could add an additional lifting force and thus the conditions for deep convective storms are well given. Thus, on average more severe thunderstorms could be expected south of the Alpine ridge, because the main drivers for thunderstorms provide much more force. Hence it is not surprising that according to EUMETSAT the Po valley suffers the greatest losses induced by hail events. They also argue that the night-time hailstorm of Sunday, 4 August 2002, is a good example for a synoptic disturbance combined with the polar jet stream triggering the formation of deep convective storms in northern Italy.
Also in the western Alpine region the normalised amperages depict the expected effect of the orography as the respective patterns correlate well with the orography (see Figure 3,32]) in comparison to Figure 7). The effect of the orography is expressed as patterns of high mean amperages along the slightly curved Alpine ridge. Figure 8 provides a zoom to this region. Also in this region the comparison of the mean amperage with the lightning number density reveals interesting features. In June and July high amperage west of the Rhine valley (eastern side of Lake Constance, Bodensee) are apparent whereas the lightning number density is much higher father east along the Alps. If our hypothesis is correct that would mean that this regions is characterised by a high frequency of severe thunderstorms which is not reflected in the lightning density.
The comparison of the lightning density and the mean normalised amperage reveals another important feature. As mentioned the dominant wind direction are western winds at the surface, but there is also a relative high share of eastern winds. There is almost no hills or mountain in Northern Germany, hence no additional forcing by orography. Further, moist air transported from either the western or the eastern direction is already lifted by the orography on the western and eastern borders of Germany, see Figure 3. It seems that in this way middle Germany is somehow protected by the surrounding low mountain ranges, leading to an U-ring shape in the mean normalised amperage. Exception is the North-West region close to the sea, but this is characterised by a relative high frequency of strong frontal storms and hence the role of the orographic lifting is partially replaced by lifting forced by strong winds. This U-shape form is not apparent in the images of the lightning density. This is another example that the analysis of the mean normalised amperage reveals other structures and is an important element in the analysis of thunderstorms. The thunderstorm activity decreases significantly in September, but there are still large hotspots of the mean normalised amperage in the southern Alpine region in contrast to the images of the lightning density. However, it is well known that this region experiences severe thunderstorm also in September. Hence, this difference between is another hint of the advantages in analysing the mean normalised amperage.
In summary, our results show that the mean normalised amperage is an important quantity for the monitoring and analysis of thunderstorms. Within this scope this quantity should be at least considered equivalent or even better than the lightning density for the analysis of thunderstorms and their severity. Looking only to the lightning density falls to short and might hinder the analysis of deep convection. The analysis reveals that the mean normalised amperage could be a good candidate for the measure of the severity of thunderstorms and the estimation of risks induced by strong hail events.
4. Discussion
In the previous section the the analysis focused on the mean normalised amperage derived from absolute ampere values. Therefore it is worth to discuss the question if an analysis of positive and negative charges would provide further insights. This question is discussed on hand of two example month, see Figure 9. For both months the negative and the positive charges the patterns looks overall very similar (as for the others as well, not shown here). E.g. the pronounced patterns over the the North-Sea and the Po Valley in winter are occurring for both. Also for the summer month the main patterns are overall very similar. However, some regions seems to be more pronounced for negative charges, but this is mainly due to the fact that overall the negative charges are higher than the positive charges. Yet, we have to consider that part of these differences might be also due to assumptions in the retrieval process of negative and positive charges, because their distinction is not directly measured but assumed based on their location within the cloud. From a physical point of view, the same amount of positive and negative charges should be expected on average. However. It is clear that a separated analysis of positive and negative charges are of advantage for the analysis of specific thunderstorm events, but for the analysis of long term means (climatology) the main results gained from the analysis of absolute charges are significantly altered by the separation of the charges compared to using absolute values.
Wapler [17] found in accordance with other authors that the highest number of lightnings occurs in the pre-alpine region of southern Germany but that also some local maxima in low mountain ranges are noticeable. This finding is confirmed in this paper based on a longer time series. However, the mean normalised amperage shows not only some further hotspots but also modifies the picture of particularly vulnerable regions. The results emphasise the dominant role of lifting by orography (mountains, hills) induced by large-scale flows and mountain valley winds in steering the spatial patterns of thunderstorm current. We assume that mean normalised amperages does likely provide a better information about the probability of extreme thunderstorms and hail events than the lightning density. First visual comparisons with hail climatologies e.g. [33] as well as our analysis support this hypothesis. Our assumption is supported by physics, because on average a higher severity of a thunderstorm means higher updraft forces and hence a higher trigger for the formation of hail.
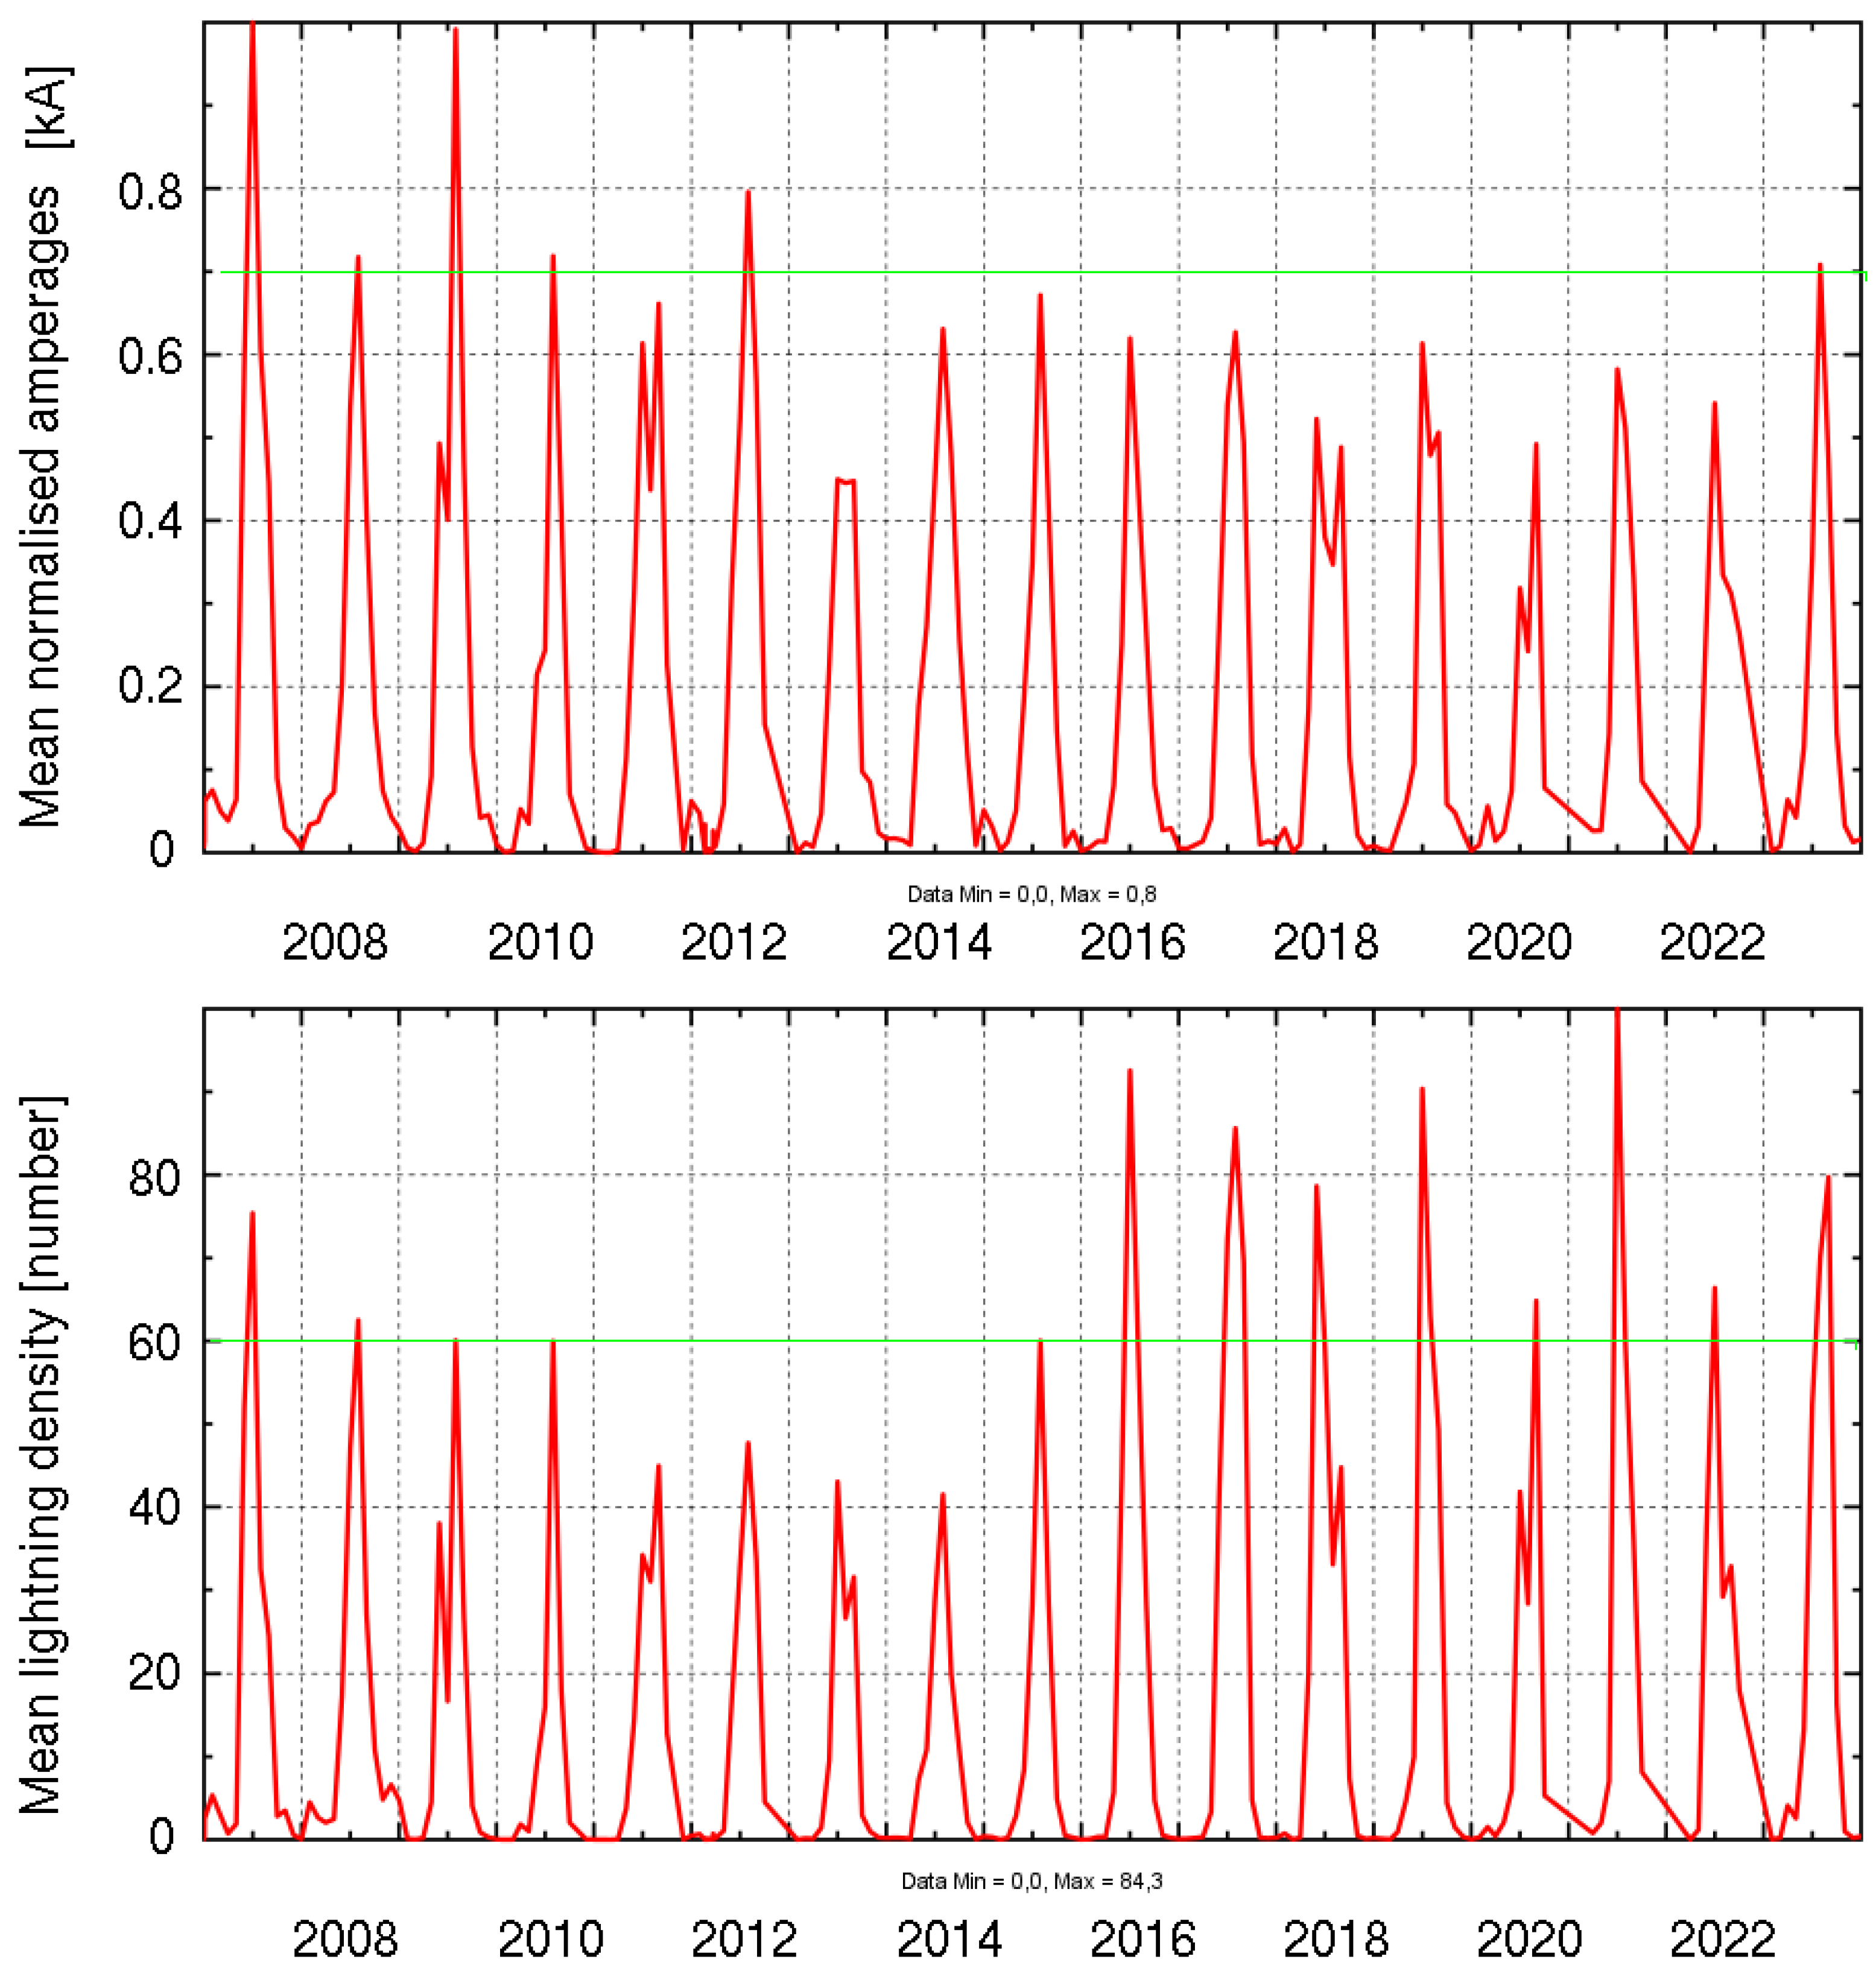
In our introduction we assumed that also the time series of the mean normalised amperage is more robust against changes in the measurement technique or network, e.g change of retrieval or number of stations. We assume therefore that this quantity is more appropriate for trend analysis than the lightning density. Figure 10 provides the time series of the mean normalised amperages and the lightning densities averaged over the complete region. In the second part of the time series there seems to be much more lightning events during the summers. This could be misinterpreted as trend in thunderstorms caused by climate change. However, the true reason for this "quantum leap" is a serious change in the measurement technique in the beginning of 2006 (see [34]), which results in a higher detection efficiency of weak lightnings and hence an increase of the lightning density. The mean normalised amperages seems to be more robust with respect to this change.
It has to be expected that the discussed limitation of the lightning density affects not only the time series but as a consequence also the spatial patterns. In a region where pre-dominantly weak thunderstorms occur the lightning density is increased much more than in regions with predominantly severe thunderstorms (at least in relative terms).
In our opinion our results demonstrate the importance of the mean normalised amperages and the danger of misleading results when only or mainly lightning density is used for the analysis of thunderstorm. Depending on the training process the mean normalised amperage might be also better suited for the development of thunderstorm nowcasting methods that are based on AI.
Author Contributions
Sophie Döpp performed the analysis of different lightning networks (Fig 1 and Fig 2) and supported the writing of the manuscript. Richard Mueller performed the generation and analysis of the lightning climatology and is the principal author of the manuscript.
Funding
This research received no external funding.
Data Availability Statement
The data used for the figures of the climatology as available under DWD open data policy at https://go.dwd-nextcloud.de/index.php/s/9GJnJwfsJGPcMXT and https://go.dwd-nextcloud.de/index.php/s/m8LG3K3mZDZED2X.
Acknowledgments
We acknowledge the Nowcasting AG for providind DWD with high quality lightning data.
Conflicts of Interest
The authors declare no conflicts of interest.
Abbreviations
The following abbreviations are used in this manuscript:
| CAPE | Convective Available Potential Energy |
| DWD | Deutscher Wetterdienst |
| DOAJ | Directory of open access journals |
| LINET | Lightning Network |
| kA | Kilo Ampere |
| MDPI | Multidisciplinary Digital Publishing Institute |
| OT | Overshooting Top |
| TS | Thunderstorms |
| VLF | Very Low Frequency |
| LF | Low Frequency |
Appendix A
Appendix A.1
Appendix B
Below the figures for the ligthning density.
Figure A1.
Mean lightning densities for 2007-2023 and the months October to March starting upper left
Figure A1.
Mean lightning densities for 2007-2023 and the months October to March starting upper left
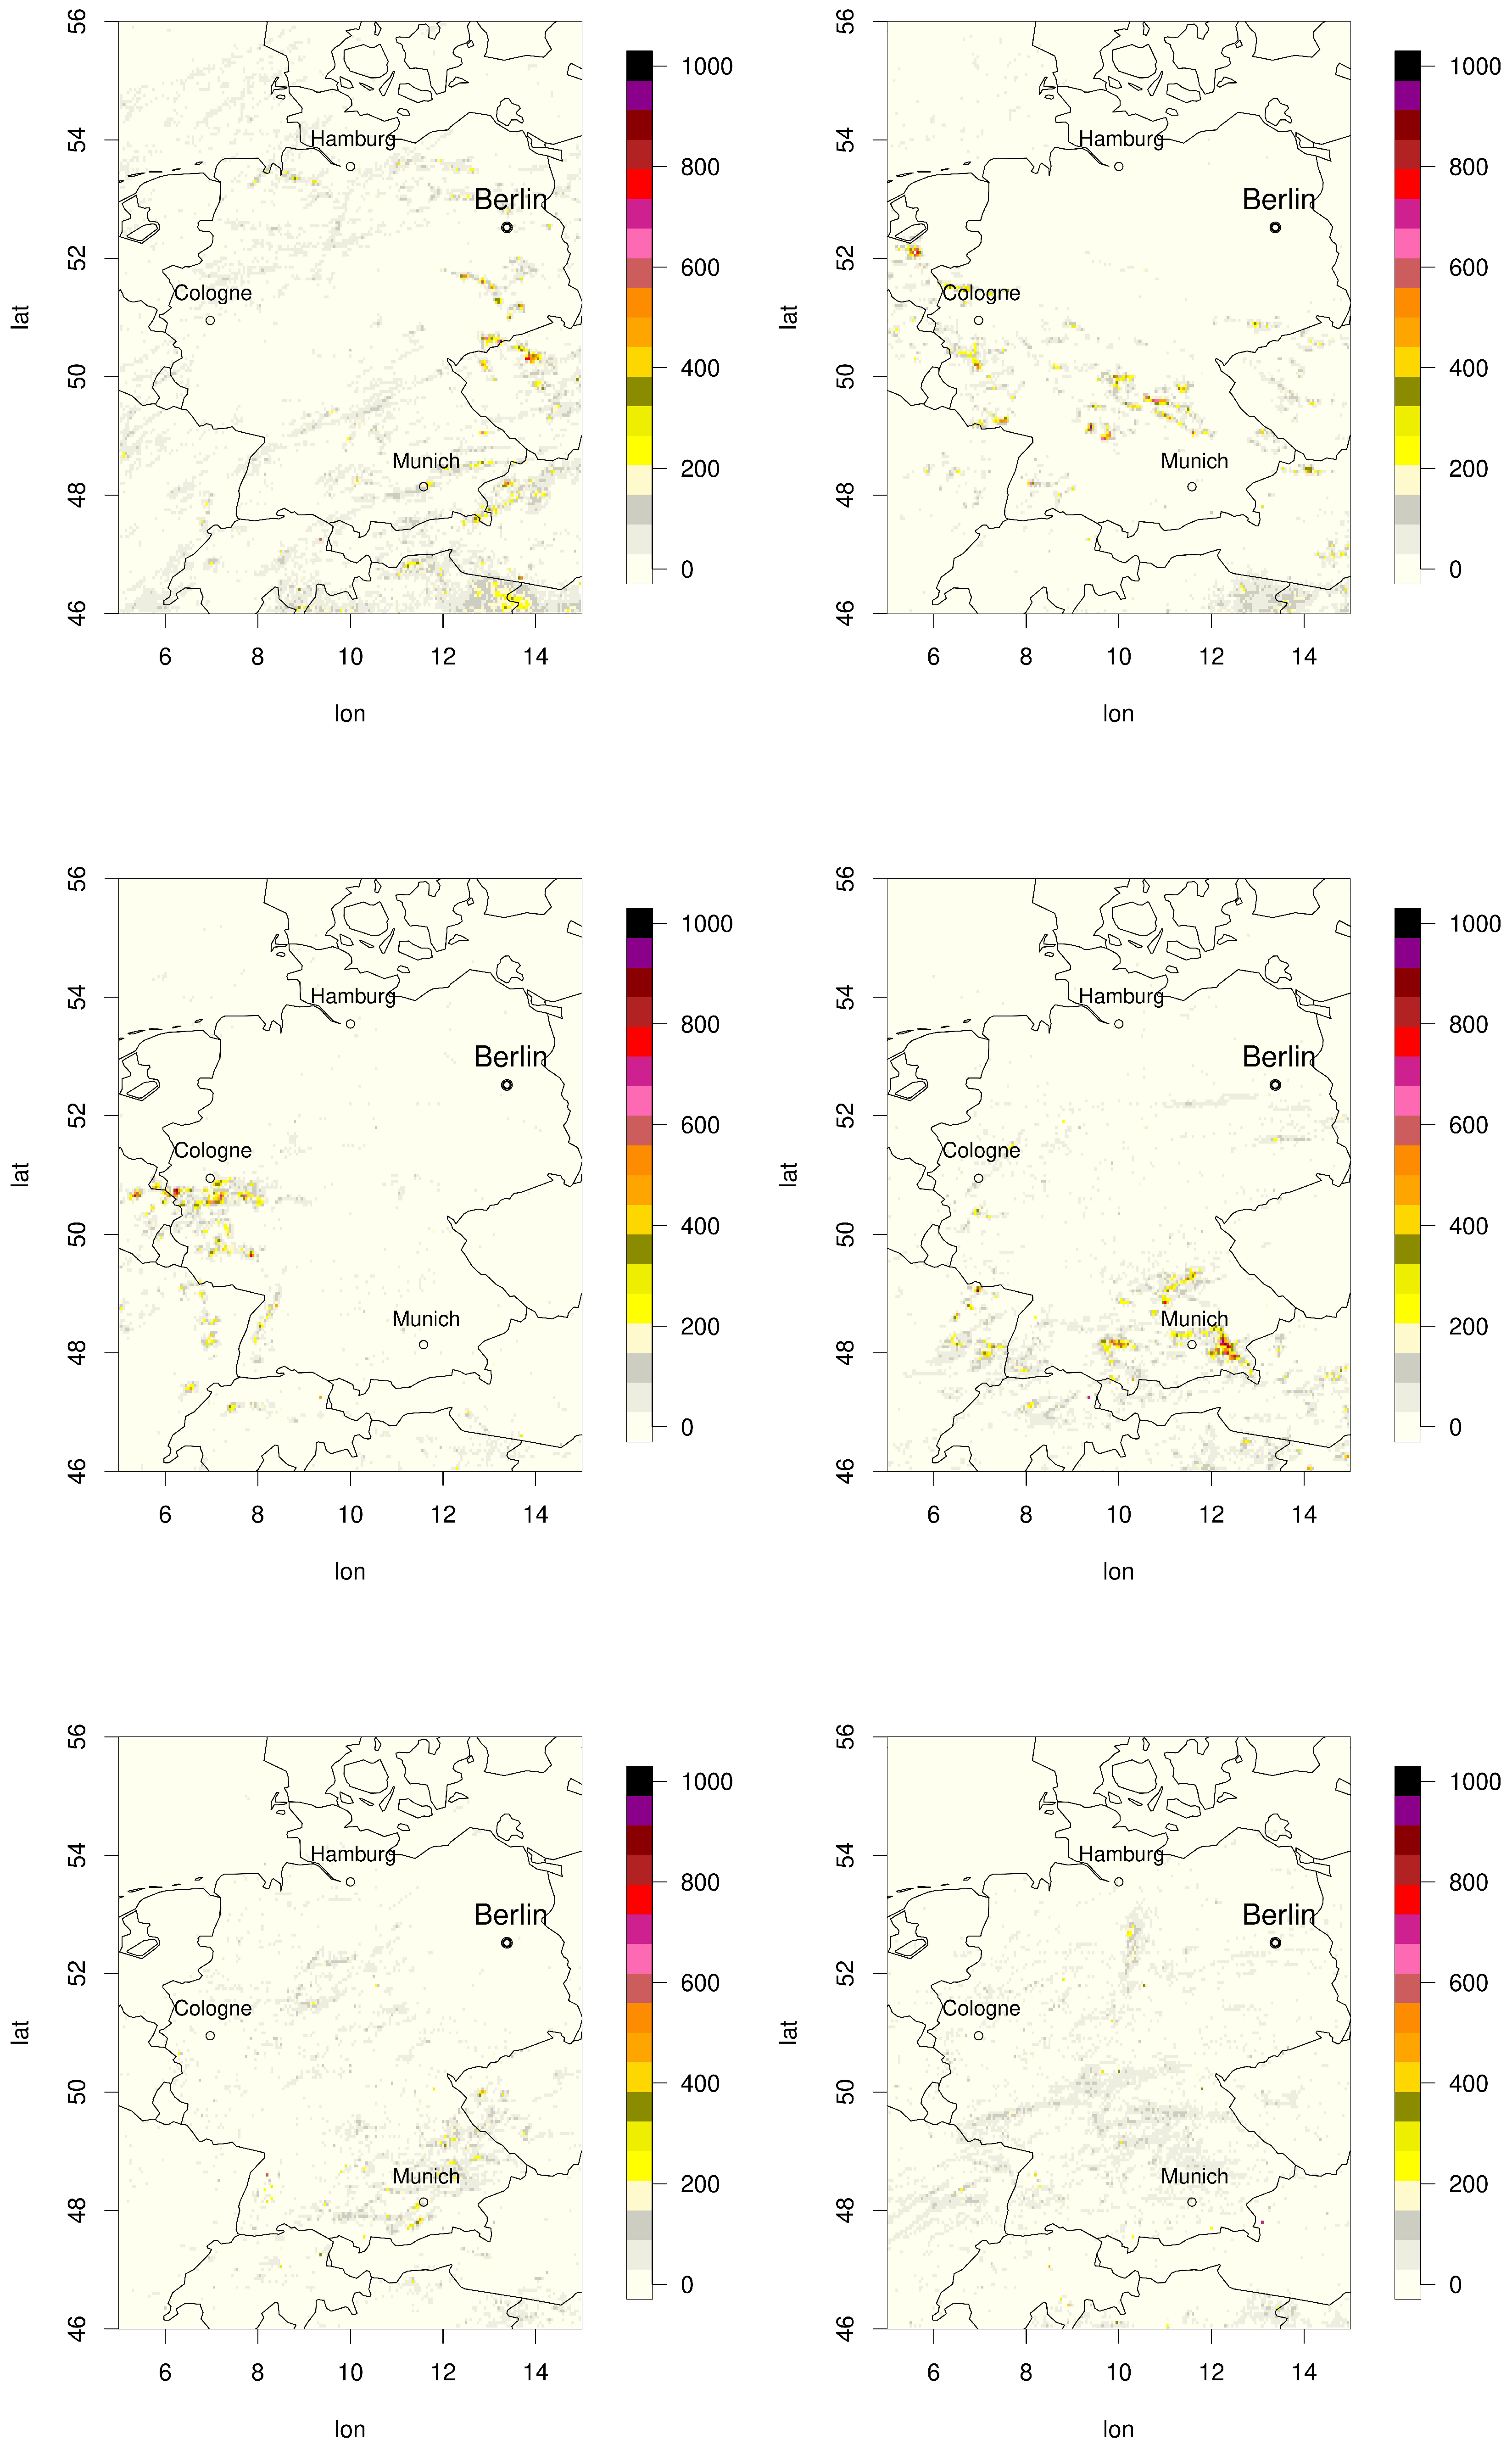
Figure A2.
Mean lightning densities for 2007-2023 and the months April to Spetember starting upper left
Figure A2.
Mean lightning densities for 2007-2023 and the months April to Spetember starting upper left
References
- Lightning Protection of Structures; Number ISBN:978-1-4020-9078-3, Springer, 2009; chapter 27.
- Müller, R.; Barleben, A.; Haussler, S.; Jerg, M. A Novel Approach for the Global Detection and Nowcasting of Deep Convection and Thunderstorms. Remote Sensing 2022, 14. [Google Scholar] [CrossRef]
- Pohjola, H.; Mäkelä, A. The comparison of GLD360 and EUCLID lightning location systems in Europe. Atmospheric Research 2013, 123, 117–128. [Google Scholar] [CrossRef]
- VAISALA. VAISALA GLD360 Global Dataset - Understanding the GLD360 Dataset. Vaisala Corporation, Head Office: Vanha Nurmijärventie 21, 01670 Vantaa, P.O. Box 26, FI-00421 Helsinki, Finland.
- Said, R.K.; Cohen, M.B.; Inan, U.S. Highly intense lightning over the oceans: Estimated peak currents from global GLD360 observations. J. Geophys. Res. Atmos. 2013, 118, 6905–6915. [Google Scholar] [CrossRef]
- Said, R.; Murphy, M. GLD360 Upgrade: Performance Analysis and Applications. 2016, 24th International Lightning Detection Conference and 6th International Lightning Meteorology Conference.
- Pessi, A.T.; Businger, S.; Cummins, K.L.; Demetriades, N.W.S.; Murphy, M.; Pifer, B. Development of a Long-Range Lightning Detection Network for the Pacific: Construction, Calibration, and Performance. Journal of Atmospheric and Oceanic Technology 2009, 26, 145–166. [Google Scholar] [CrossRef]
- Mosher, F. Detection of deep convection around the globe. American Meteorological Society, 2002, Preprints, 10th Conference on Aviation, Range and Aerospace Meteorology, Portland, OR, pp. 289–292.
- EarthNetworks. Lightning Data. https://www.earthnetworks.com/product/lightning-data/.
- Bedka, K.; Brunner, J.; Dworak, R.; Feltz, W.; Otkin, J.; Greenwald, T. Objective satellite-based detection of overshooting tops using infrared window channel brightness temperature gradients. Applied Meteorology and Climatology 2010, 49, 181–202. [Google Scholar] [CrossRef]
- Challenges in training neural networks for global lightning probability forecasts, number EMS2024-475 in EMS Annual Meeting 2024, Barcelona, Spain, 2024. [CrossRef]
- Brodehl, S.; Müller, R.; Schömer, E.; Spichtinger, P.; Wand, M. End-to-End Prediction of Lightning Events from Geostationary Satellite Images. Preprints 2022 2022. [Google Scholar] [CrossRef]
- Betz, H.; Schmidt, K.; Oettinger, W.; Montag, B. Cell-tracking with lightning data from LINET. Advances in Geoscience 2008, 17, 55–61. [Google Scholar] [CrossRef]
- Betz, H.D.; Schmidt, K.; Laroche, P.; Blanchet, P.; Oettinger, W.P.; Defer, E.; Dziewit, Z.; Konarski, J. LINET — An international lightning detection network in Europe. Atmospheric Research 2009, 91, 564–573. [Google Scholar] [CrossRef]
- Lagouvardos, K.; Kotroni, V.; Betz, H.D.; Schmidt, K. A comparison of lightning data provided by ZEUS and LINET networks over Western Europe. Nat. Hazards Earth Syst. Sci. 2009, 9, 1713–1717. [Google Scholar] [CrossRef]
- Onah, M.W.; Adechinan, J.A.; Guedje, F.K.; Kougbeagbede, H.; Houngninou, E.B. Evaluation of the performance of the World Wide Lightning Location Network (WWLLN) using the lightning detection network (LINET) as a truth. Bull. of Atmos. Sci. and Technol. 2023, 4. [Google Scholar] [CrossRef]
- Wapler, K. High-resolution climatology of lightning characteristics within Central Europe. Meteorol Atmos Phys 2013, 122, 175–184. [Google Scholar] [CrossRef]
- Hayward, L.; Whitworth, M.; Pepin, N.; Dorling, S. A regional lightning climatology of the UK and Ireland and sensitivity to alternative detection networks. International Journal of Climatology 2022, 42, 7839–7862, [https://rmets.onlinelibrary.wiley.com/doi/pdf/10.1002/joc.7680]. [Google Scholar] [CrossRef]
- Kahraman, A.; Kendon, E.J.; Fowler, H.J.; Wilkinson, J.M. Contrasting future lightning stories across Europe. Environmental Research Letters 2022, 17, 114023. [Google Scholar] [CrossRef]
- Anderson, G.; Klugmann, D. A European lightning density analysis using 5 years of ATDnet data. Natural Hazards and Earth System Sciences 2014, 14, 815–829. [Google Scholar] [CrossRef]
- Enno, S.E.; Sugier, J.; Alber, R. Lightning flash density in Europe on the basis of 10 years of ATDnet data, Ft. Lauderdale, Florida, USA, 2018; 25th International Lightning Detection Conference and 7th International Lightning Meteorology Conference. March 12-15.
- Morgenstern, D.; Stucke, I.; Mayr, G.J.; Zeileis, A.; Simon, T. Thunderstorm environments in Europe. Weather and Climate Dynamics 2023, 4, 489–509. [Google Scholar] [CrossRef]
- Manzato, A.; Serafin, S.; Miglietta, M.M.; Kirshbaum, D.; Schulz, W. A Pan-Alpine Climatology of Lightning and Convective Initiation. Monthly Weather Review 2022, 150, 2213–2230. [Google Scholar] [CrossRef]
- Piper, D.; Kunz, M. Spatiotemporal variability of lightning activity in Europe and the relation to the North Atlantic Oscillation teleconnection pattern. Natural Hazards and Earth System Sciences 2017, 17, 1319–1336. [Google Scholar] [CrossRef]
- Sulik, S. A cloud-to-ground lightning density due to progressing climate change in Poland. Environmental Challenges 2022, 9, 100597. [Google Scholar] [CrossRef]
- Taszarek, M.; Allen, J.; Púčik, T.; Groenemeijer, P.; Czernecki, B.; Kolendowicz, L.; Lagouvardos, K.; Kotroni, V.; Schulz, W. A Climatology of Thunderstorms across Europe from a Synthesis of Multiple Data Sources. Journal of Climate 2019, 32, 1813–1837. [Google Scholar] [CrossRef]
- Bezanson, J.; Edelman, A.; Karpinski, S.; Shah, V.B. Julia: A Fresh Approach to Numerical Computing. SIAM Review 2017, 59, 65–98. [Google Scholar] [CrossRef]
- Schulzweida, U. CDO User Guide. Technical report, Max-Planck-Institution for Meteorology, https://code.mpimet.mpg.de/projects/cdo, 2023. available at: https://code.mpimet.mpg.de/projects/cdo/ embedded/cdo.pdf.
- Dobler, A.; Richard, M.; Ahrens, B. Development and evaluation of a simple method to estimate evaporation from satellite data. Meteorologische Zeitschrift 2011, 20, 615–623, Cited by: 5. [Google Scholar] [CrossRef] [PubMed]
- Lohmann, R. Nowcasting of fronts in the context of the prediction of thunderstorms. Master’s thesis, Johann-Wolfgang-von-Goethe Universität, Frankfurt am Main, 2021.
- MeteoBlue. Wetterarchiv Italien.
- https://commons.wikimedia.org/wiki/File:Europe_topography_map_en.png. Last accessed on 3rd of February 2025.
- Fluck, E.; Kunz, M.; Geissbuehler, P.; Ritz, S. Radar-based assessment of hail frequency in Europe. Nat. Hazards Earth Syst. Sci. 2021, 21, 683–701. [Google Scholar] [CrossRef]
- nowcast GmbH. Vol.5 - Nutzerdokumentation LINET. Nutzerdokumentation für den dwd - version 7, nowcast GmbH, 2022.
Figure 1.
Illustration of differences in the frequency of detected lightning flashes. The frequency was calculated by normalisation with the number of lightnings over all amperages. LINET detects much more lightnings for weak thunderstorms with low absolute Amperage than GLD360 (VAISALA). With increasing Amperage the differences balances out. Example for June/September 2017.
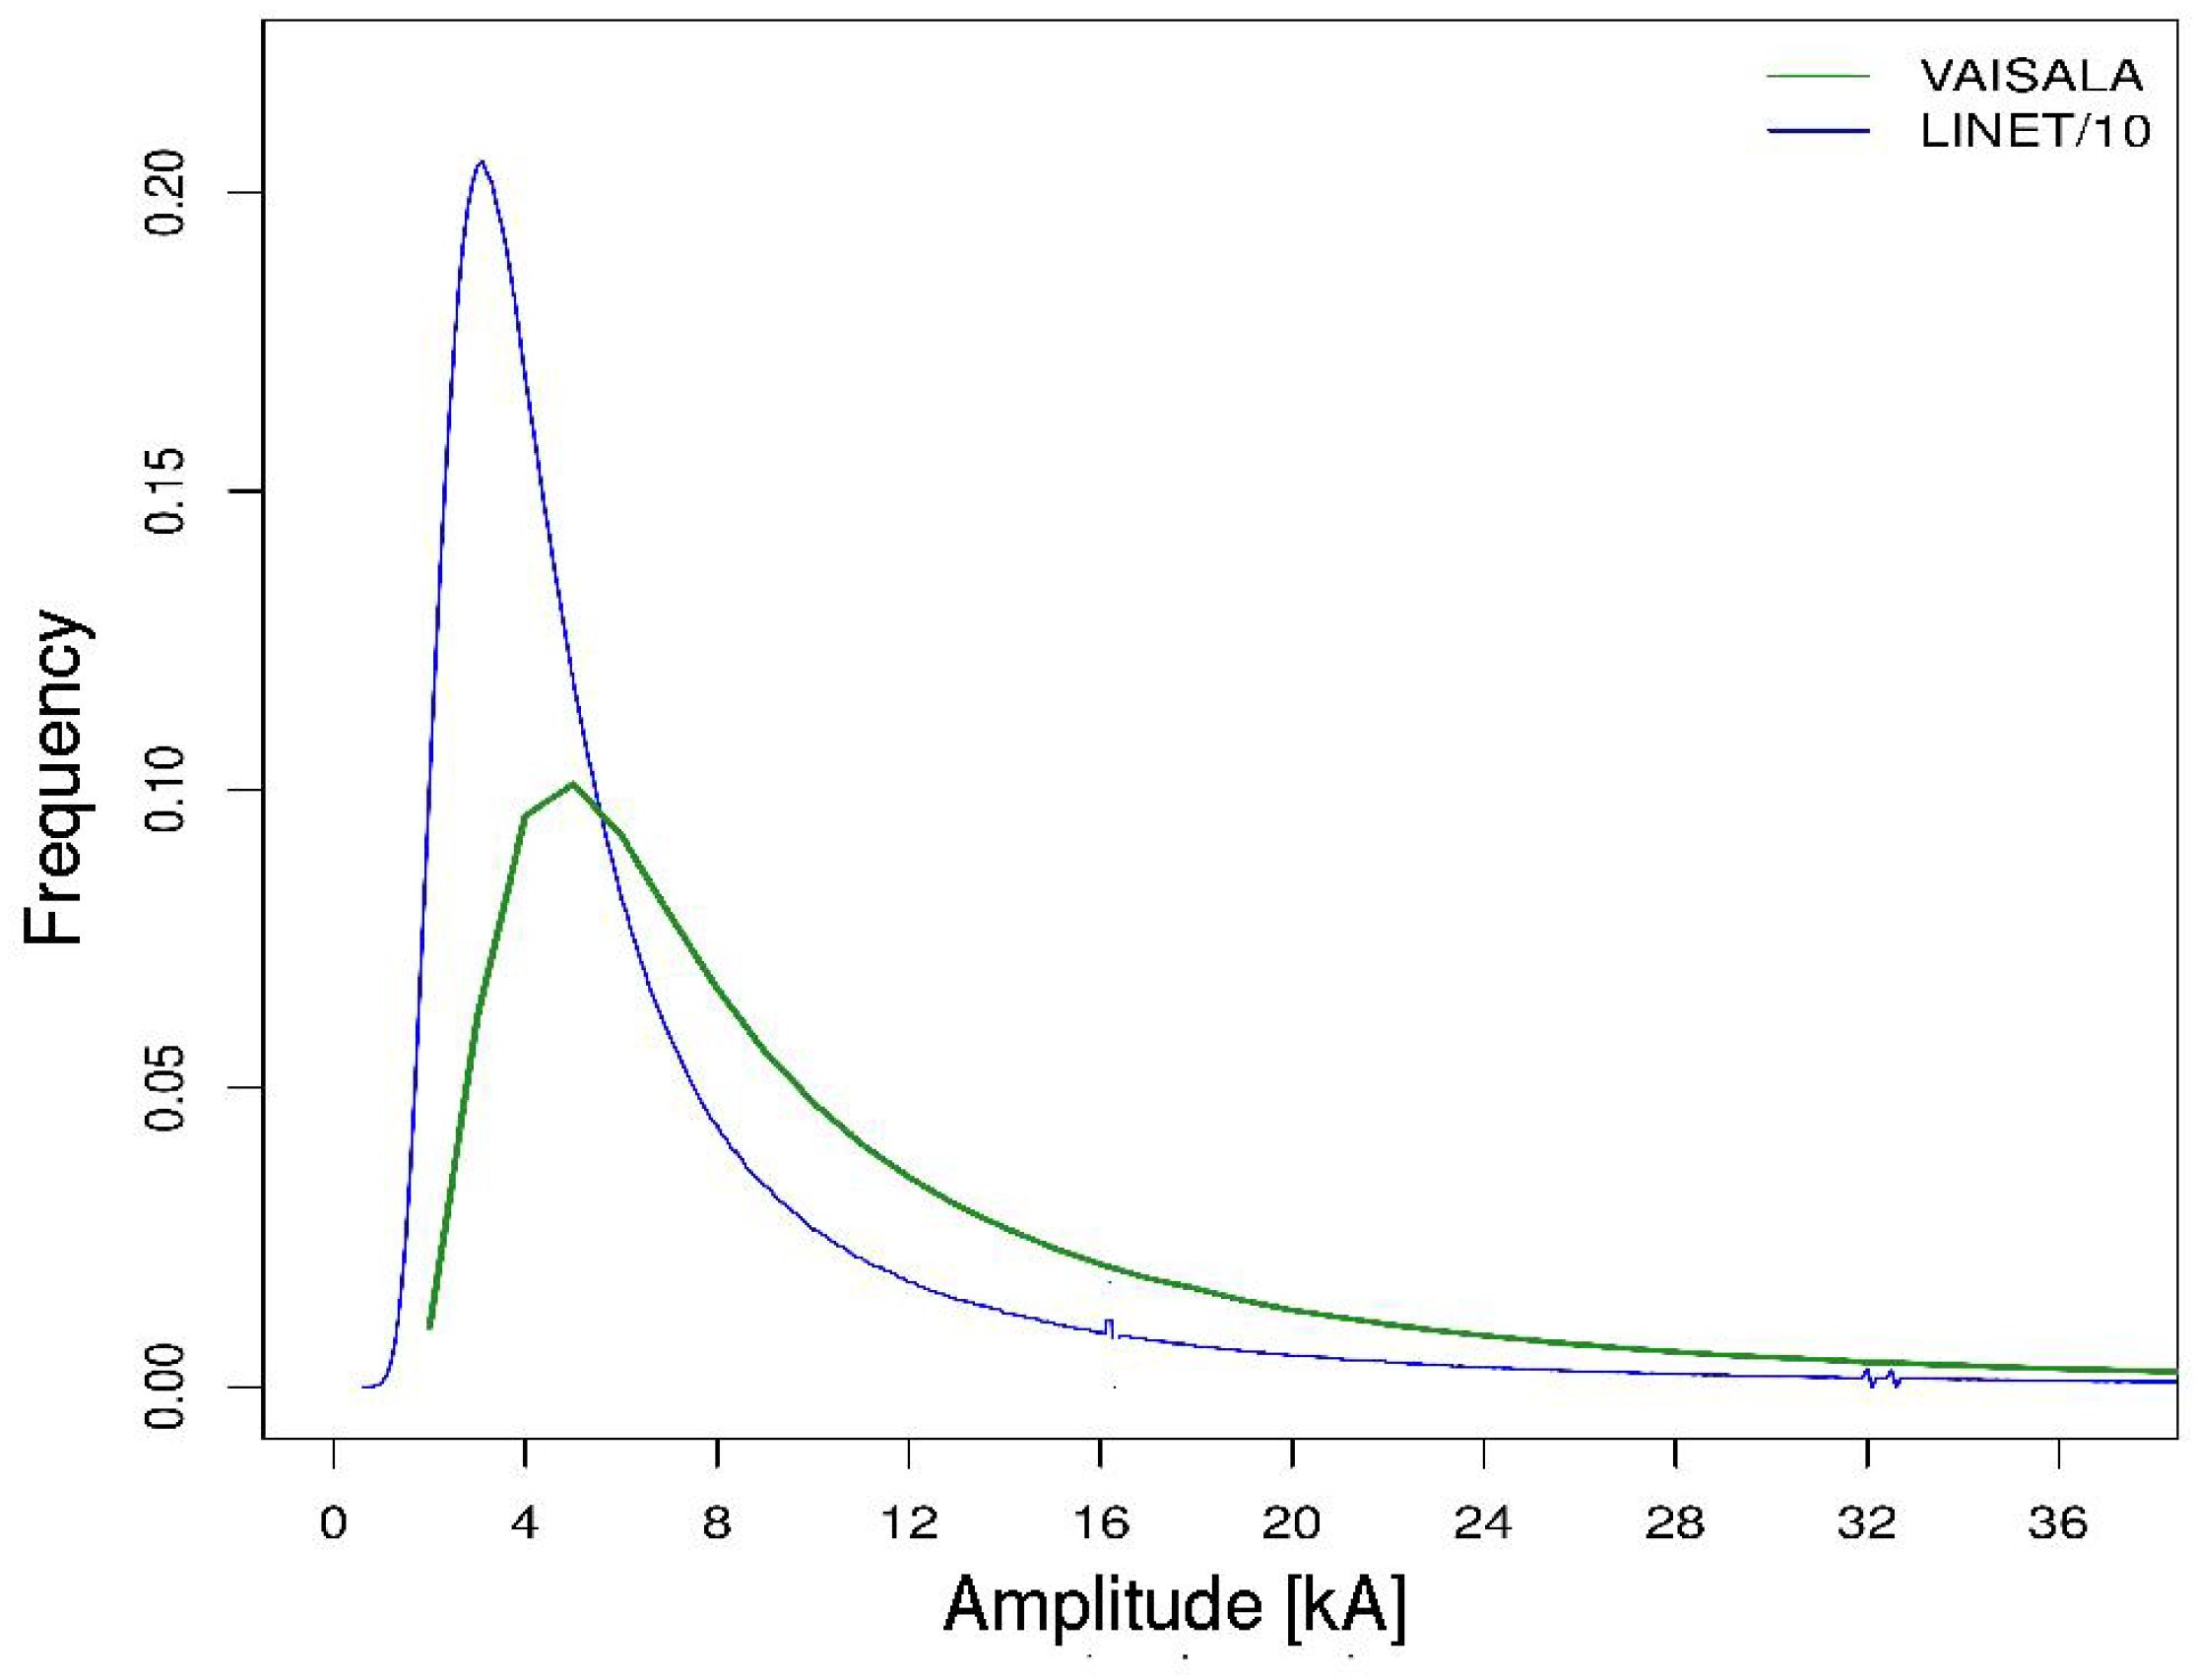
Figure 2.
Illustration of differences in the frequency of lightning flashes with negative and positive charges. The frequency was calculated by normalisation with the number of lightnings over all amperages. Example for June/September 2017 .
Figure 2.
Illustration of differences in the frequency of lightning flashes with negative and positive charges. The frequency was calculated by normalisation with the number of lightnings over all amperages. Example for June/September 2017 .
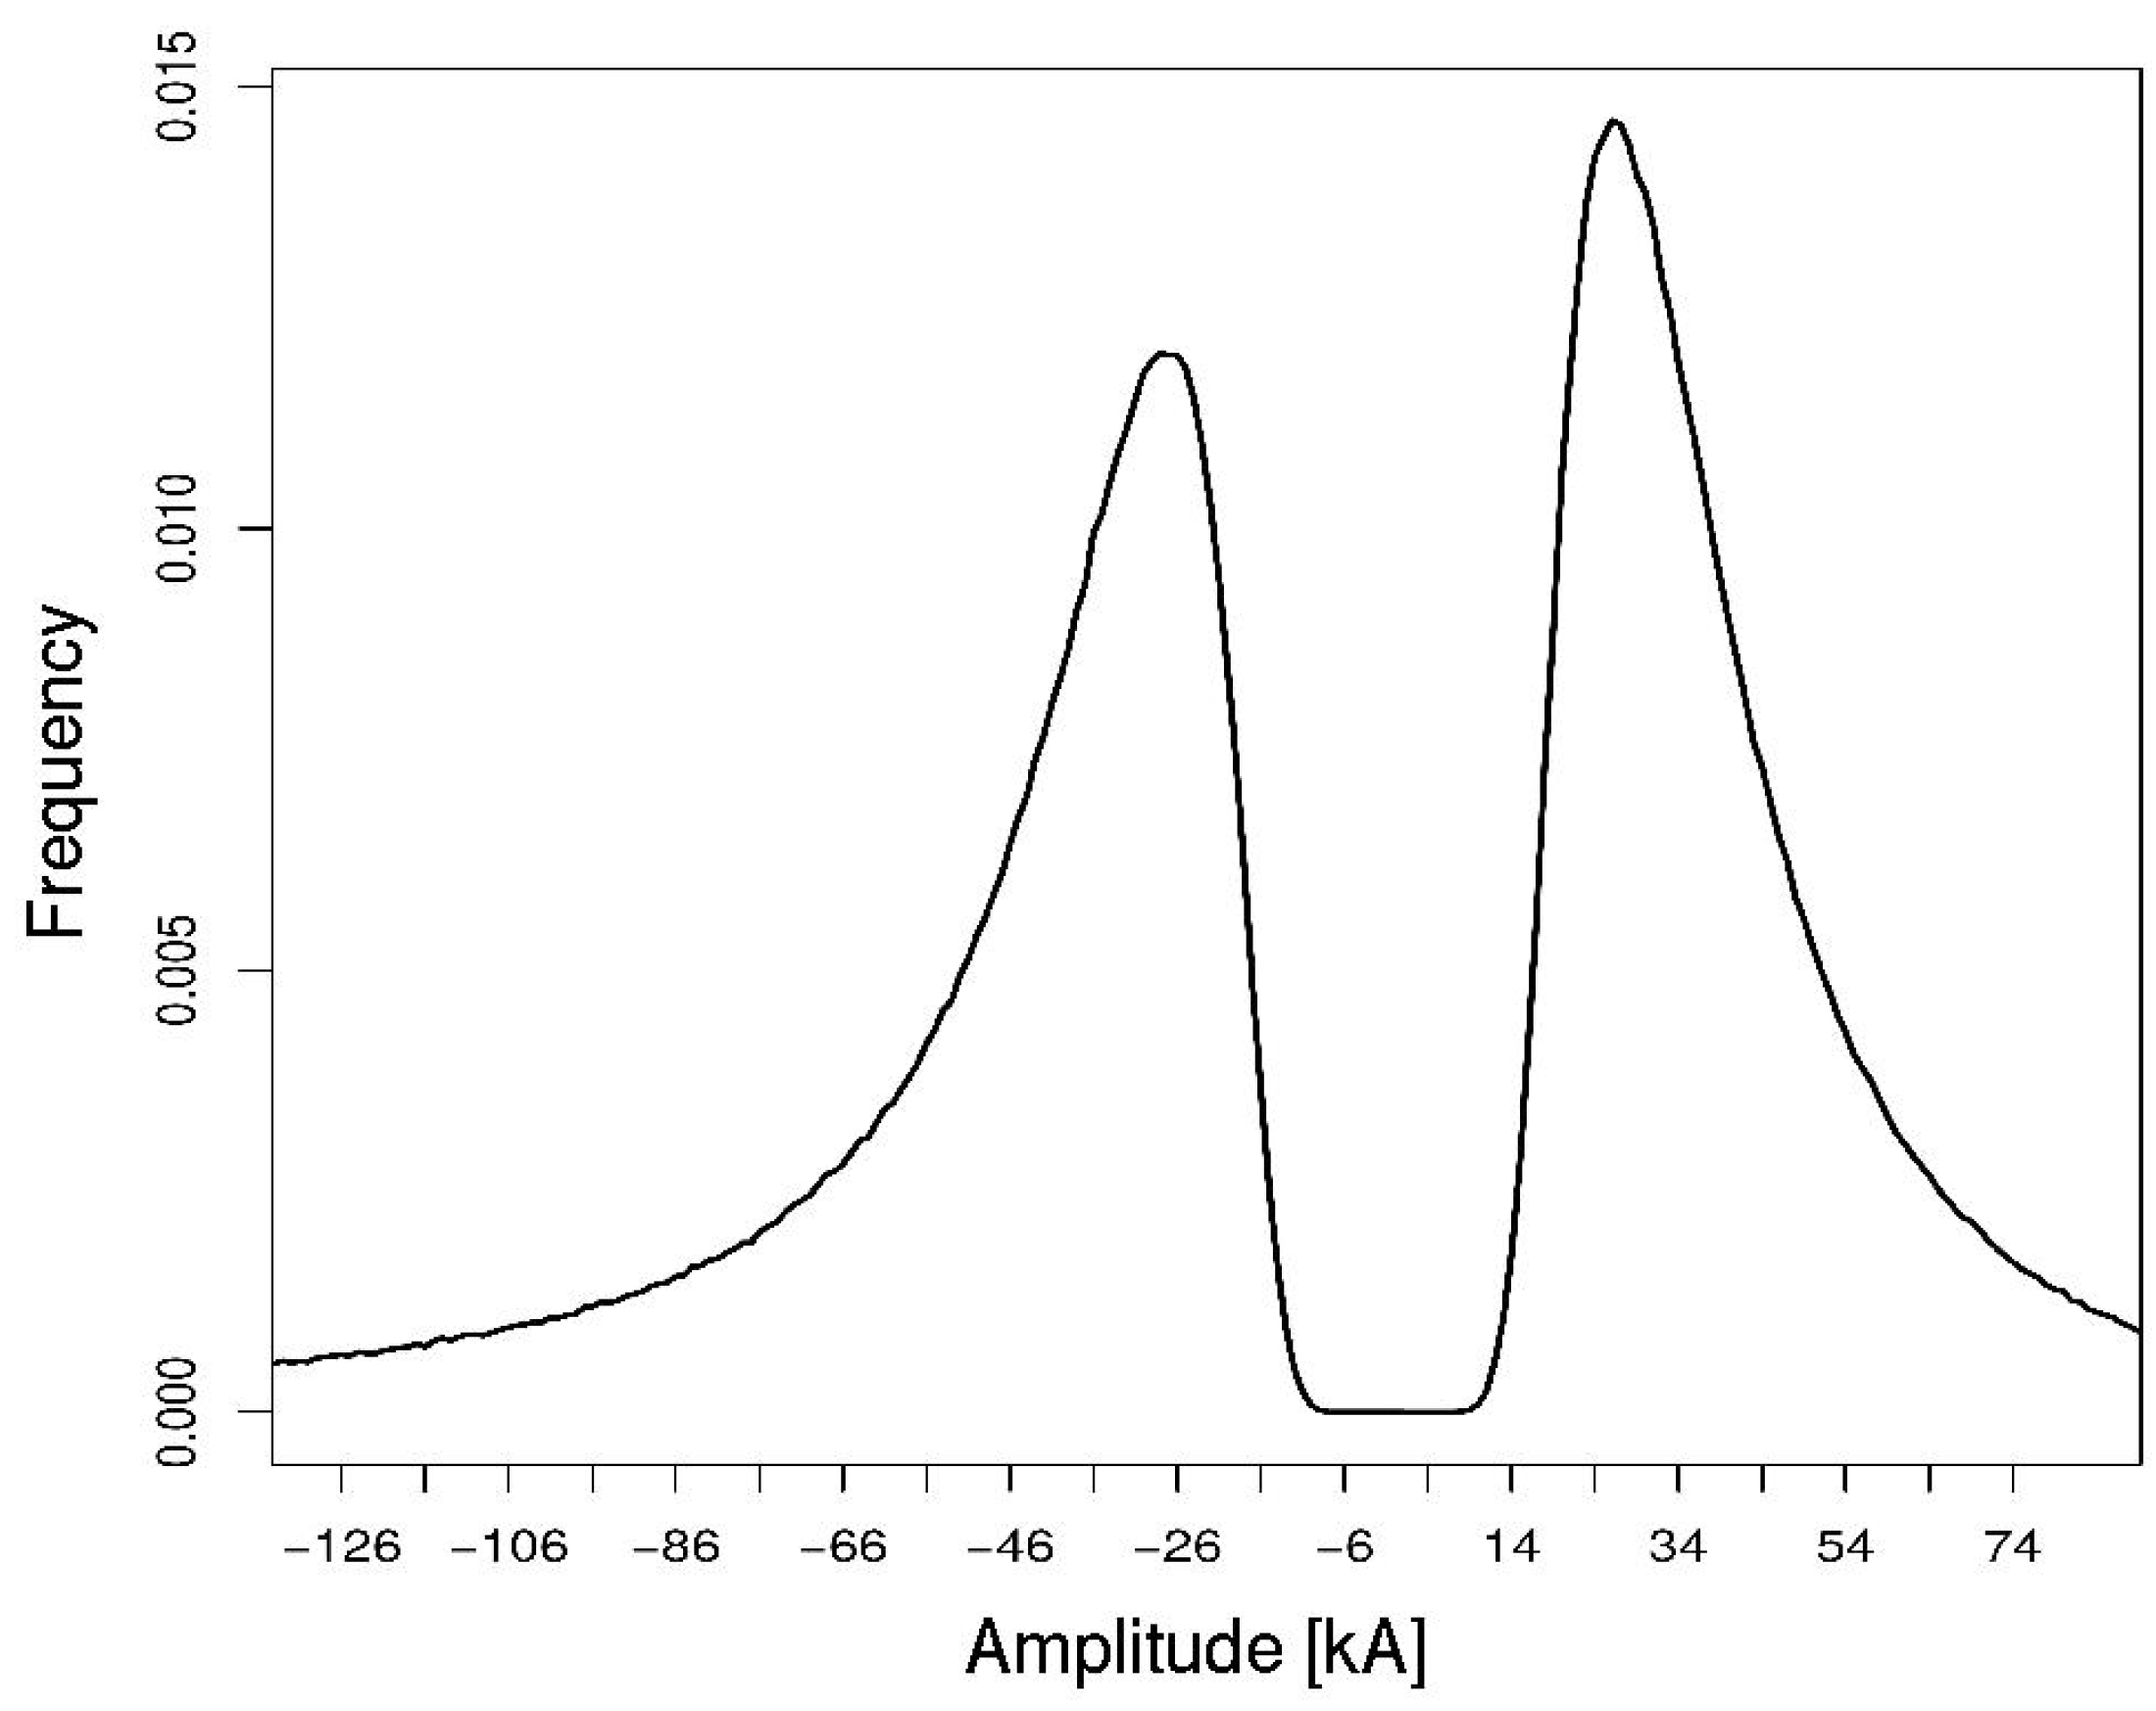
Figure 3.
Orography map for Europe . Copyright San Jose, CC BY-SA 3.0, via Wikimedia Commons
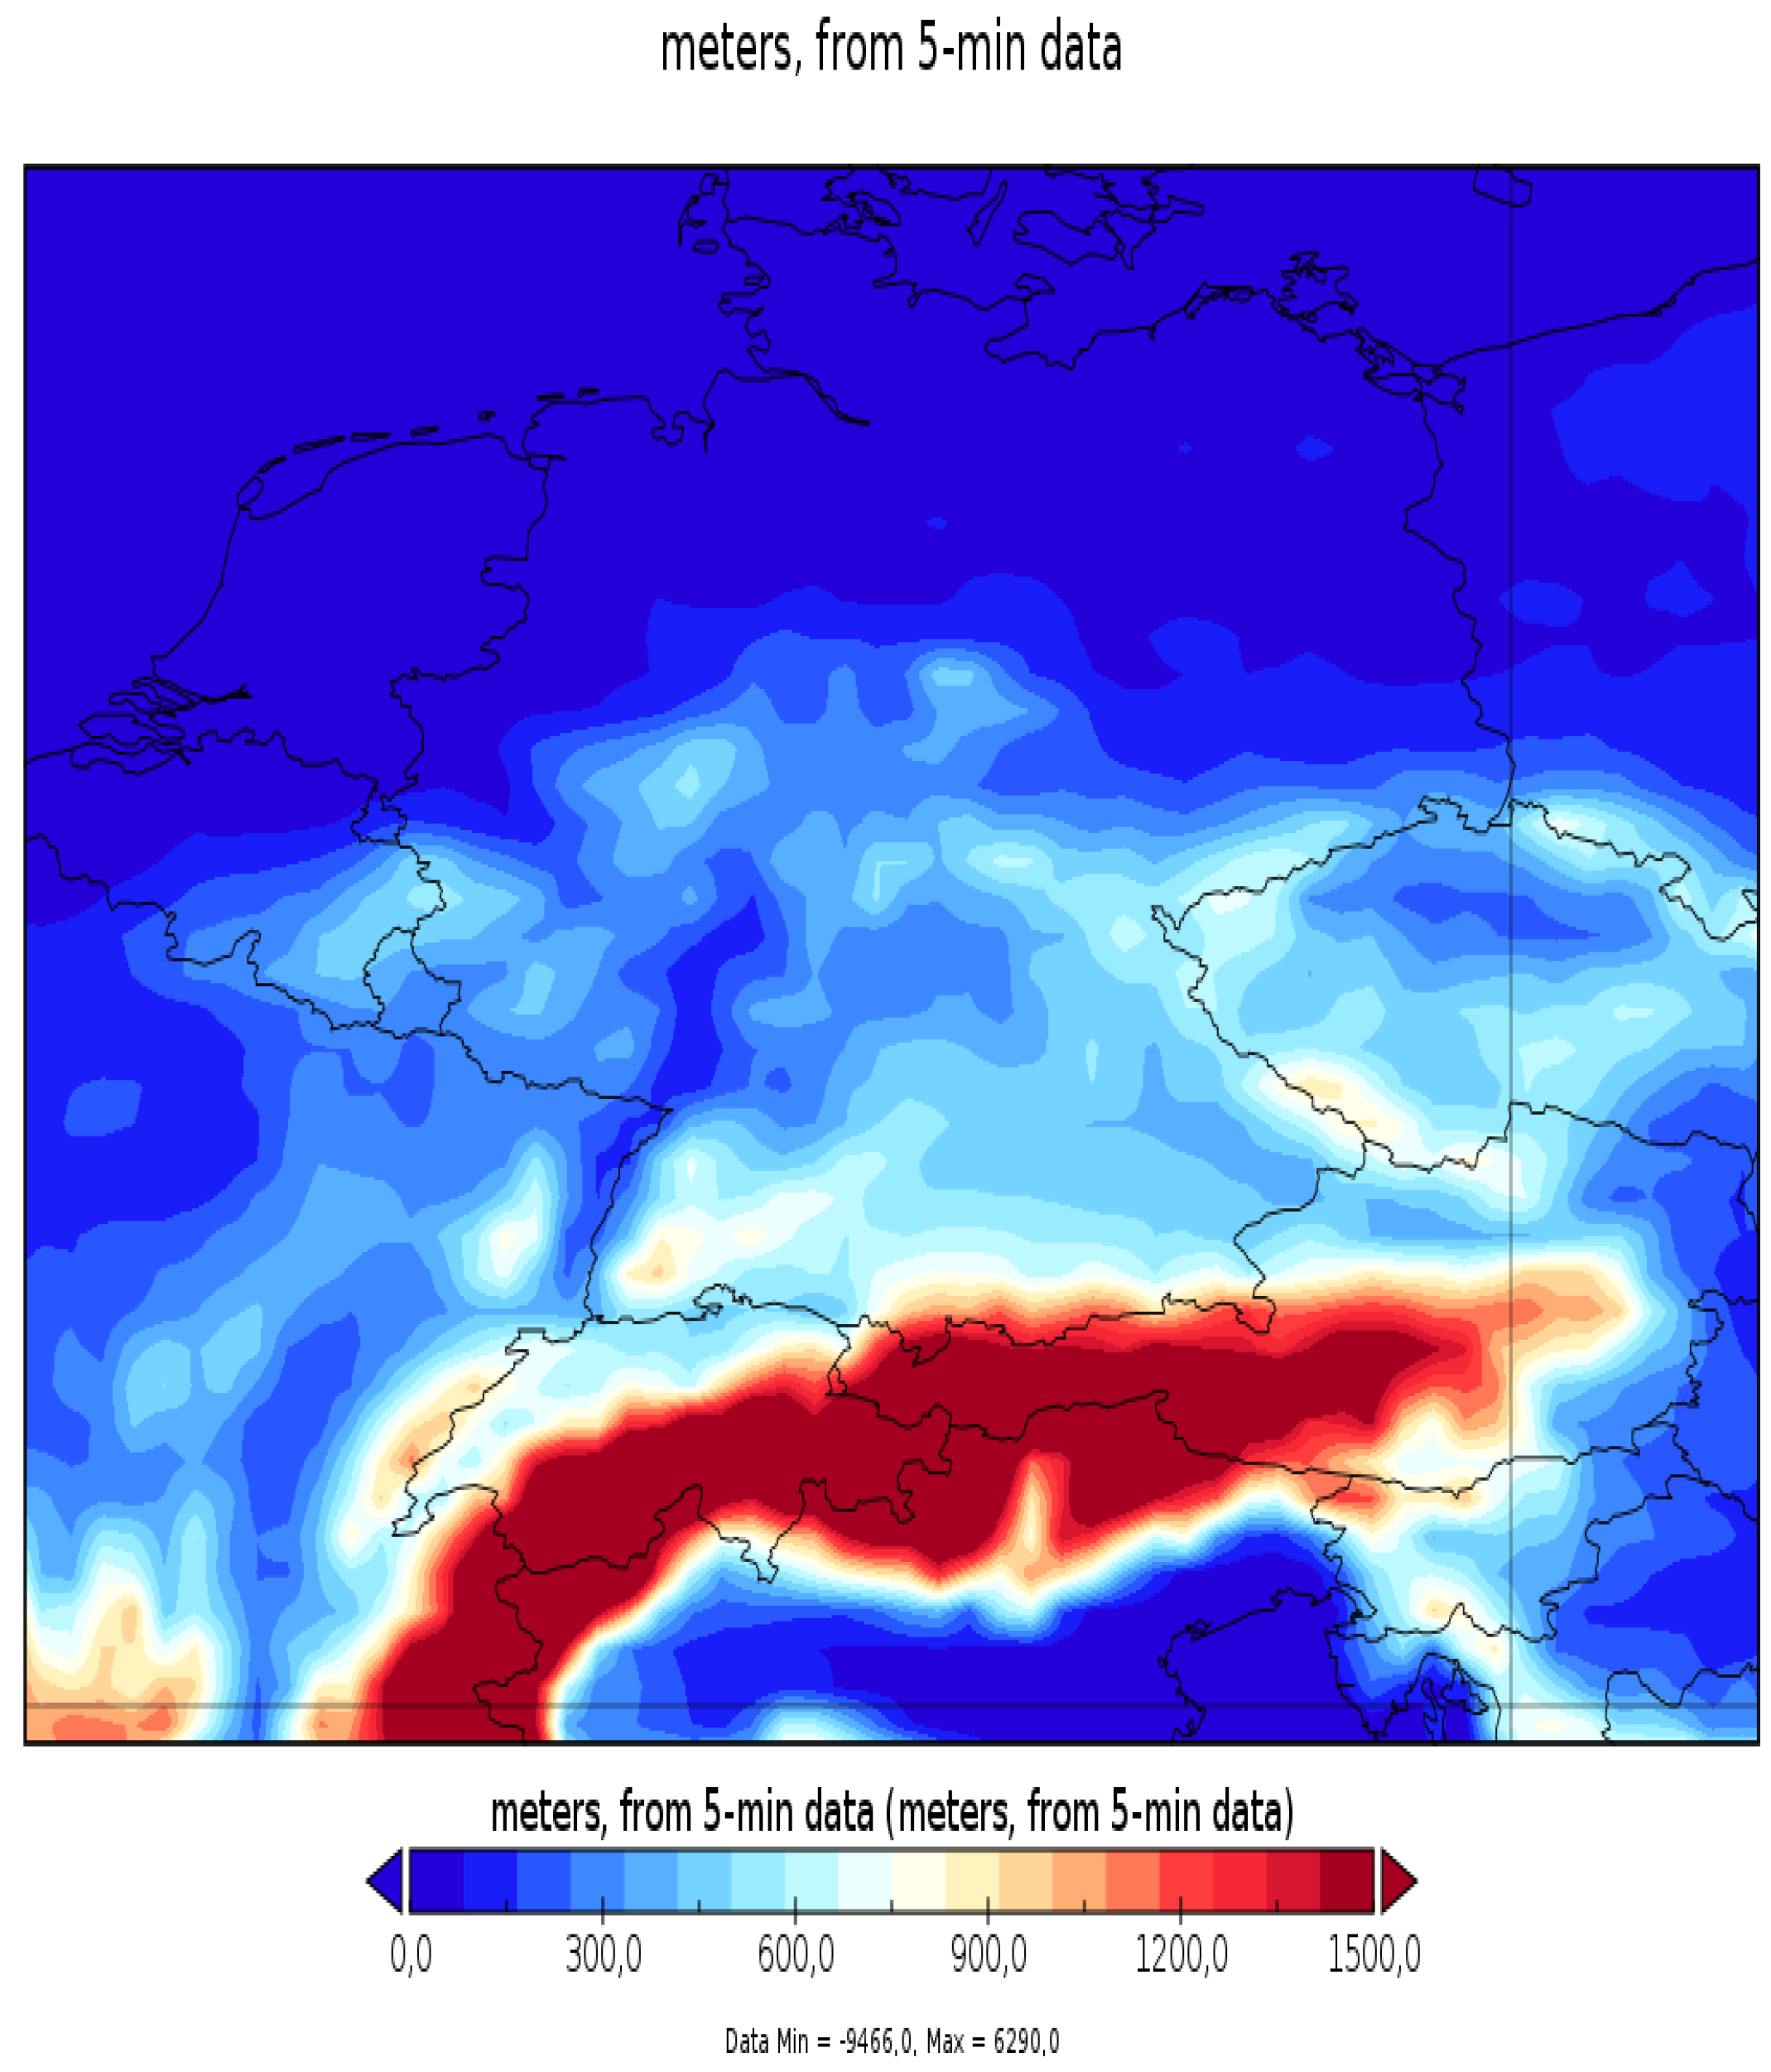
Figure 4.
Mean normalised amperages [kA] for 2007 to 2023 and the months October to March, starting in the upper left
Figure 4.
Mean normalised amperages [kA] for 2007 to 2023 and the months October to March, starting in the upper left
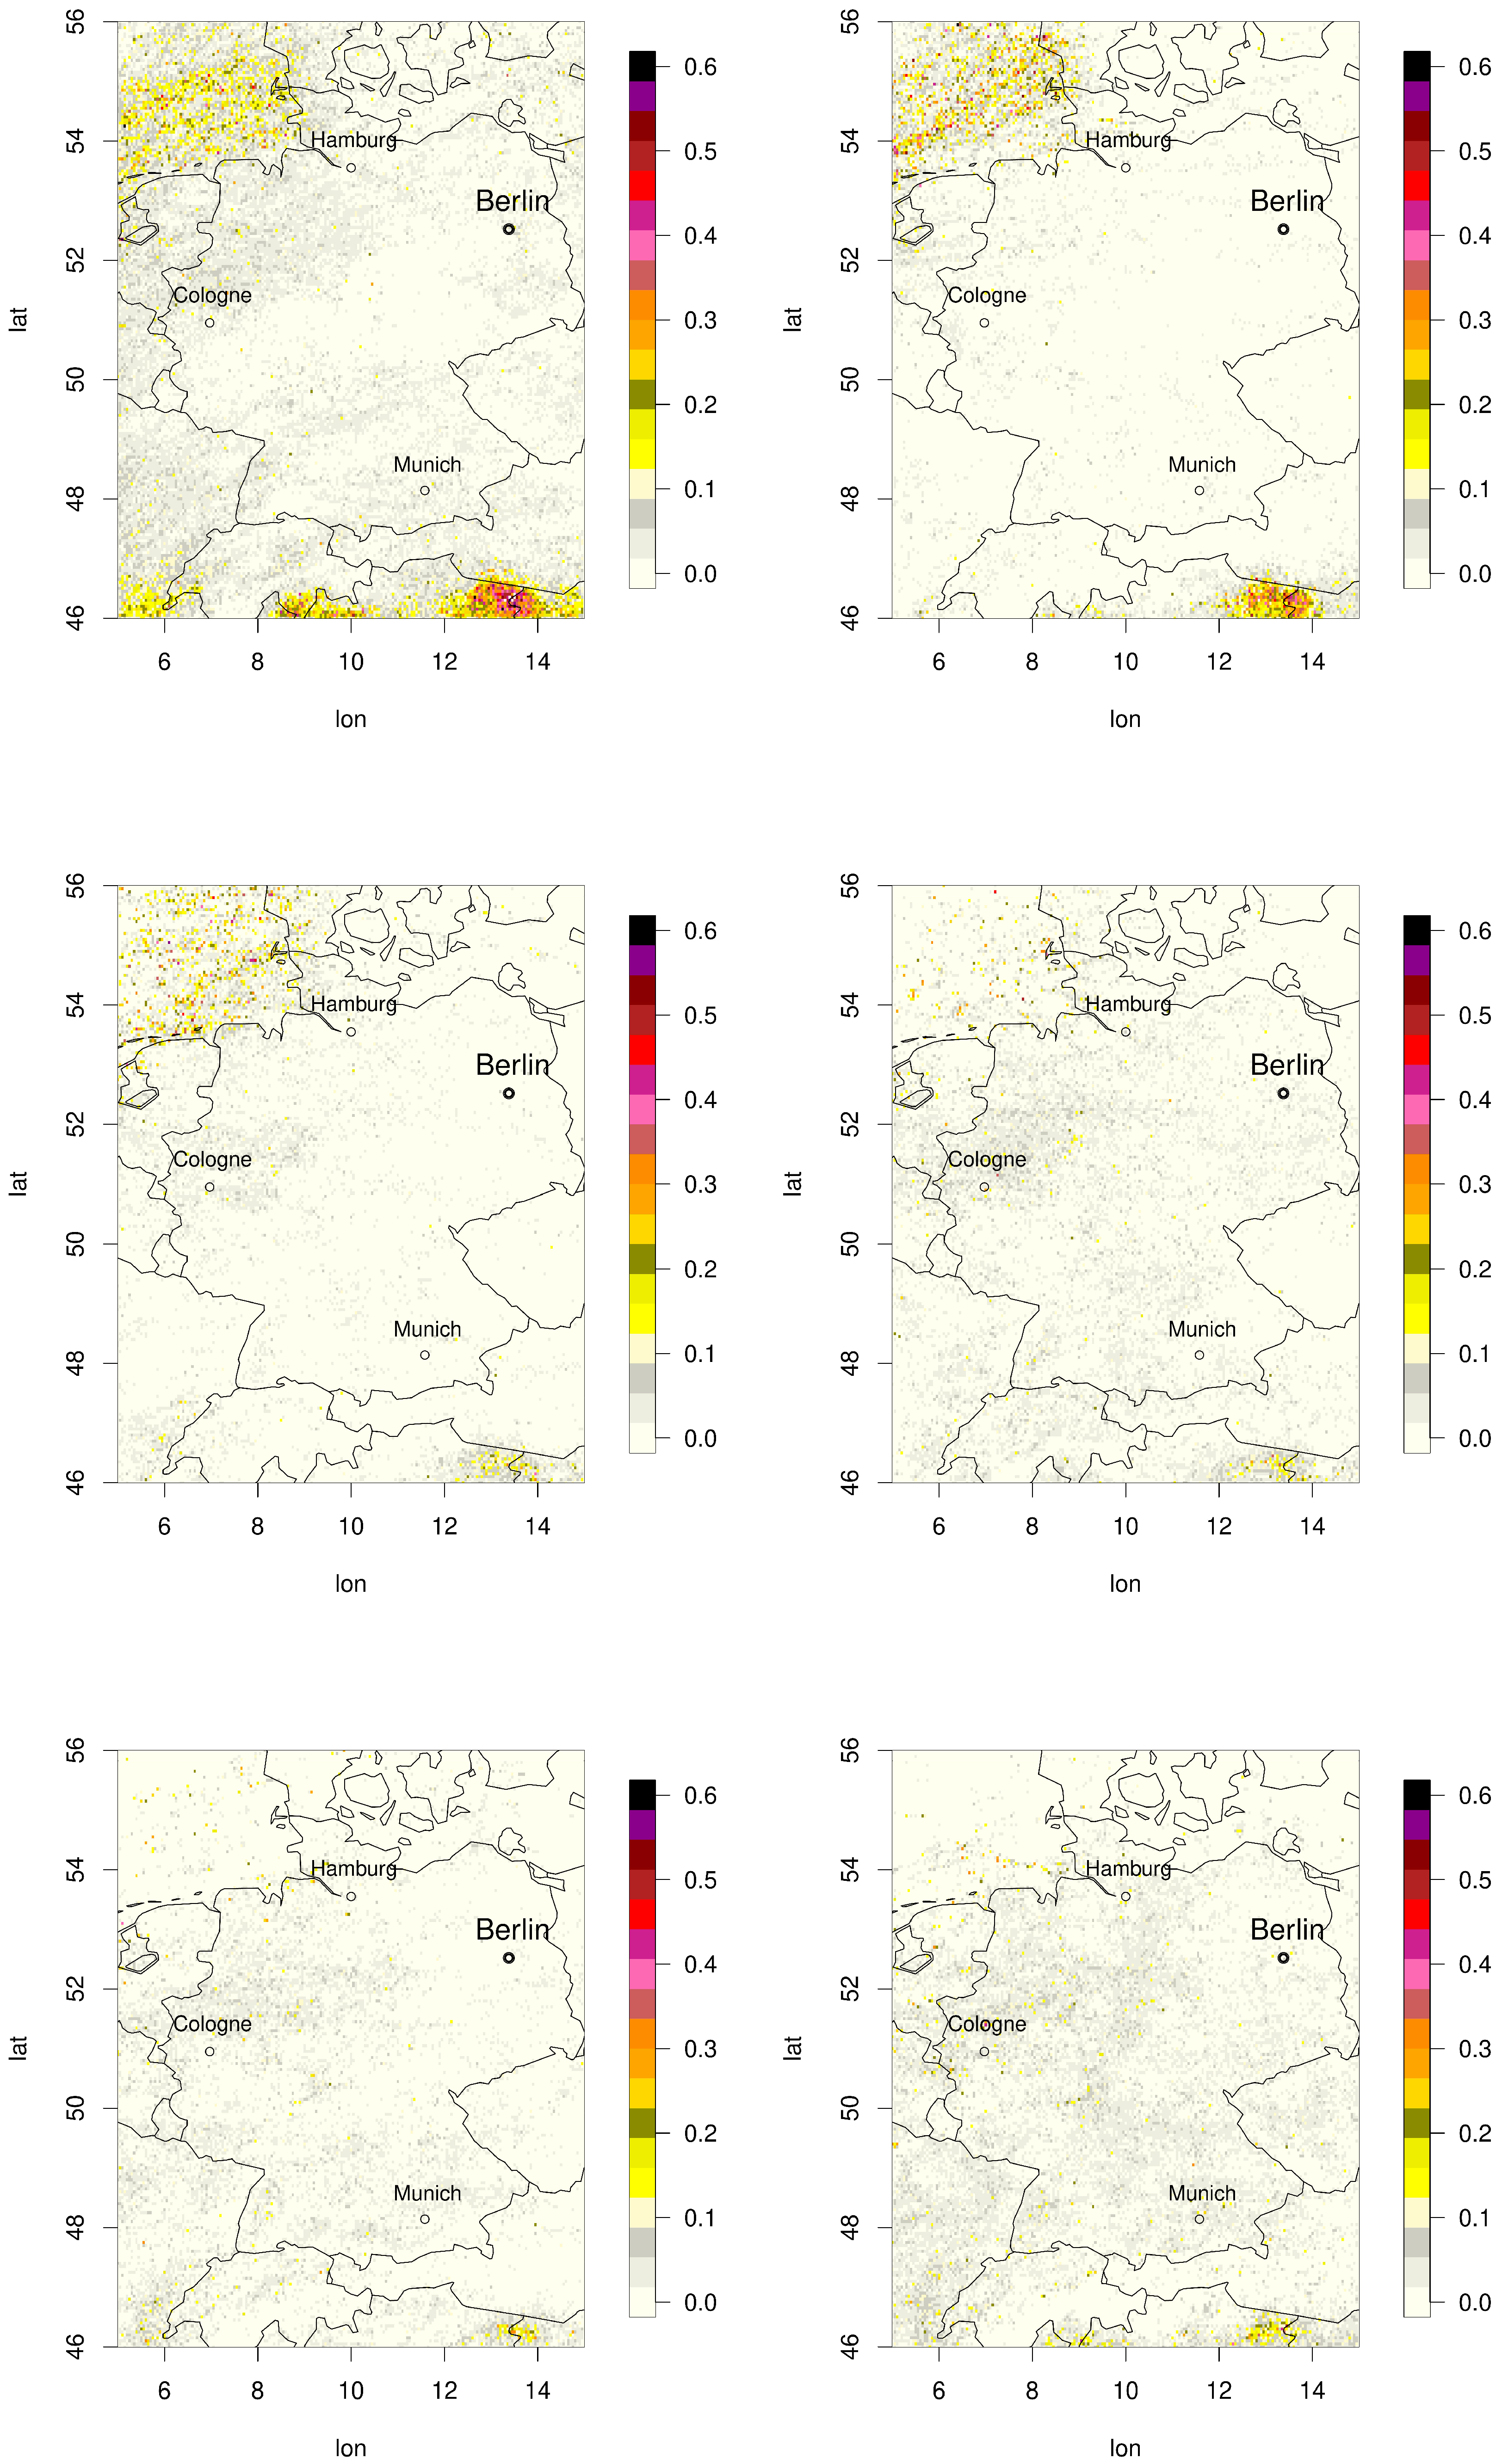
Figure 5.
Mean normalised amperages [kA] (left hand) versus lighting density (right hand) for 2007-2023 and October
Figure 5.
Mean normalised amperages [kA] (left hand) versus lighting density (right hand) for 2007-2023 and October
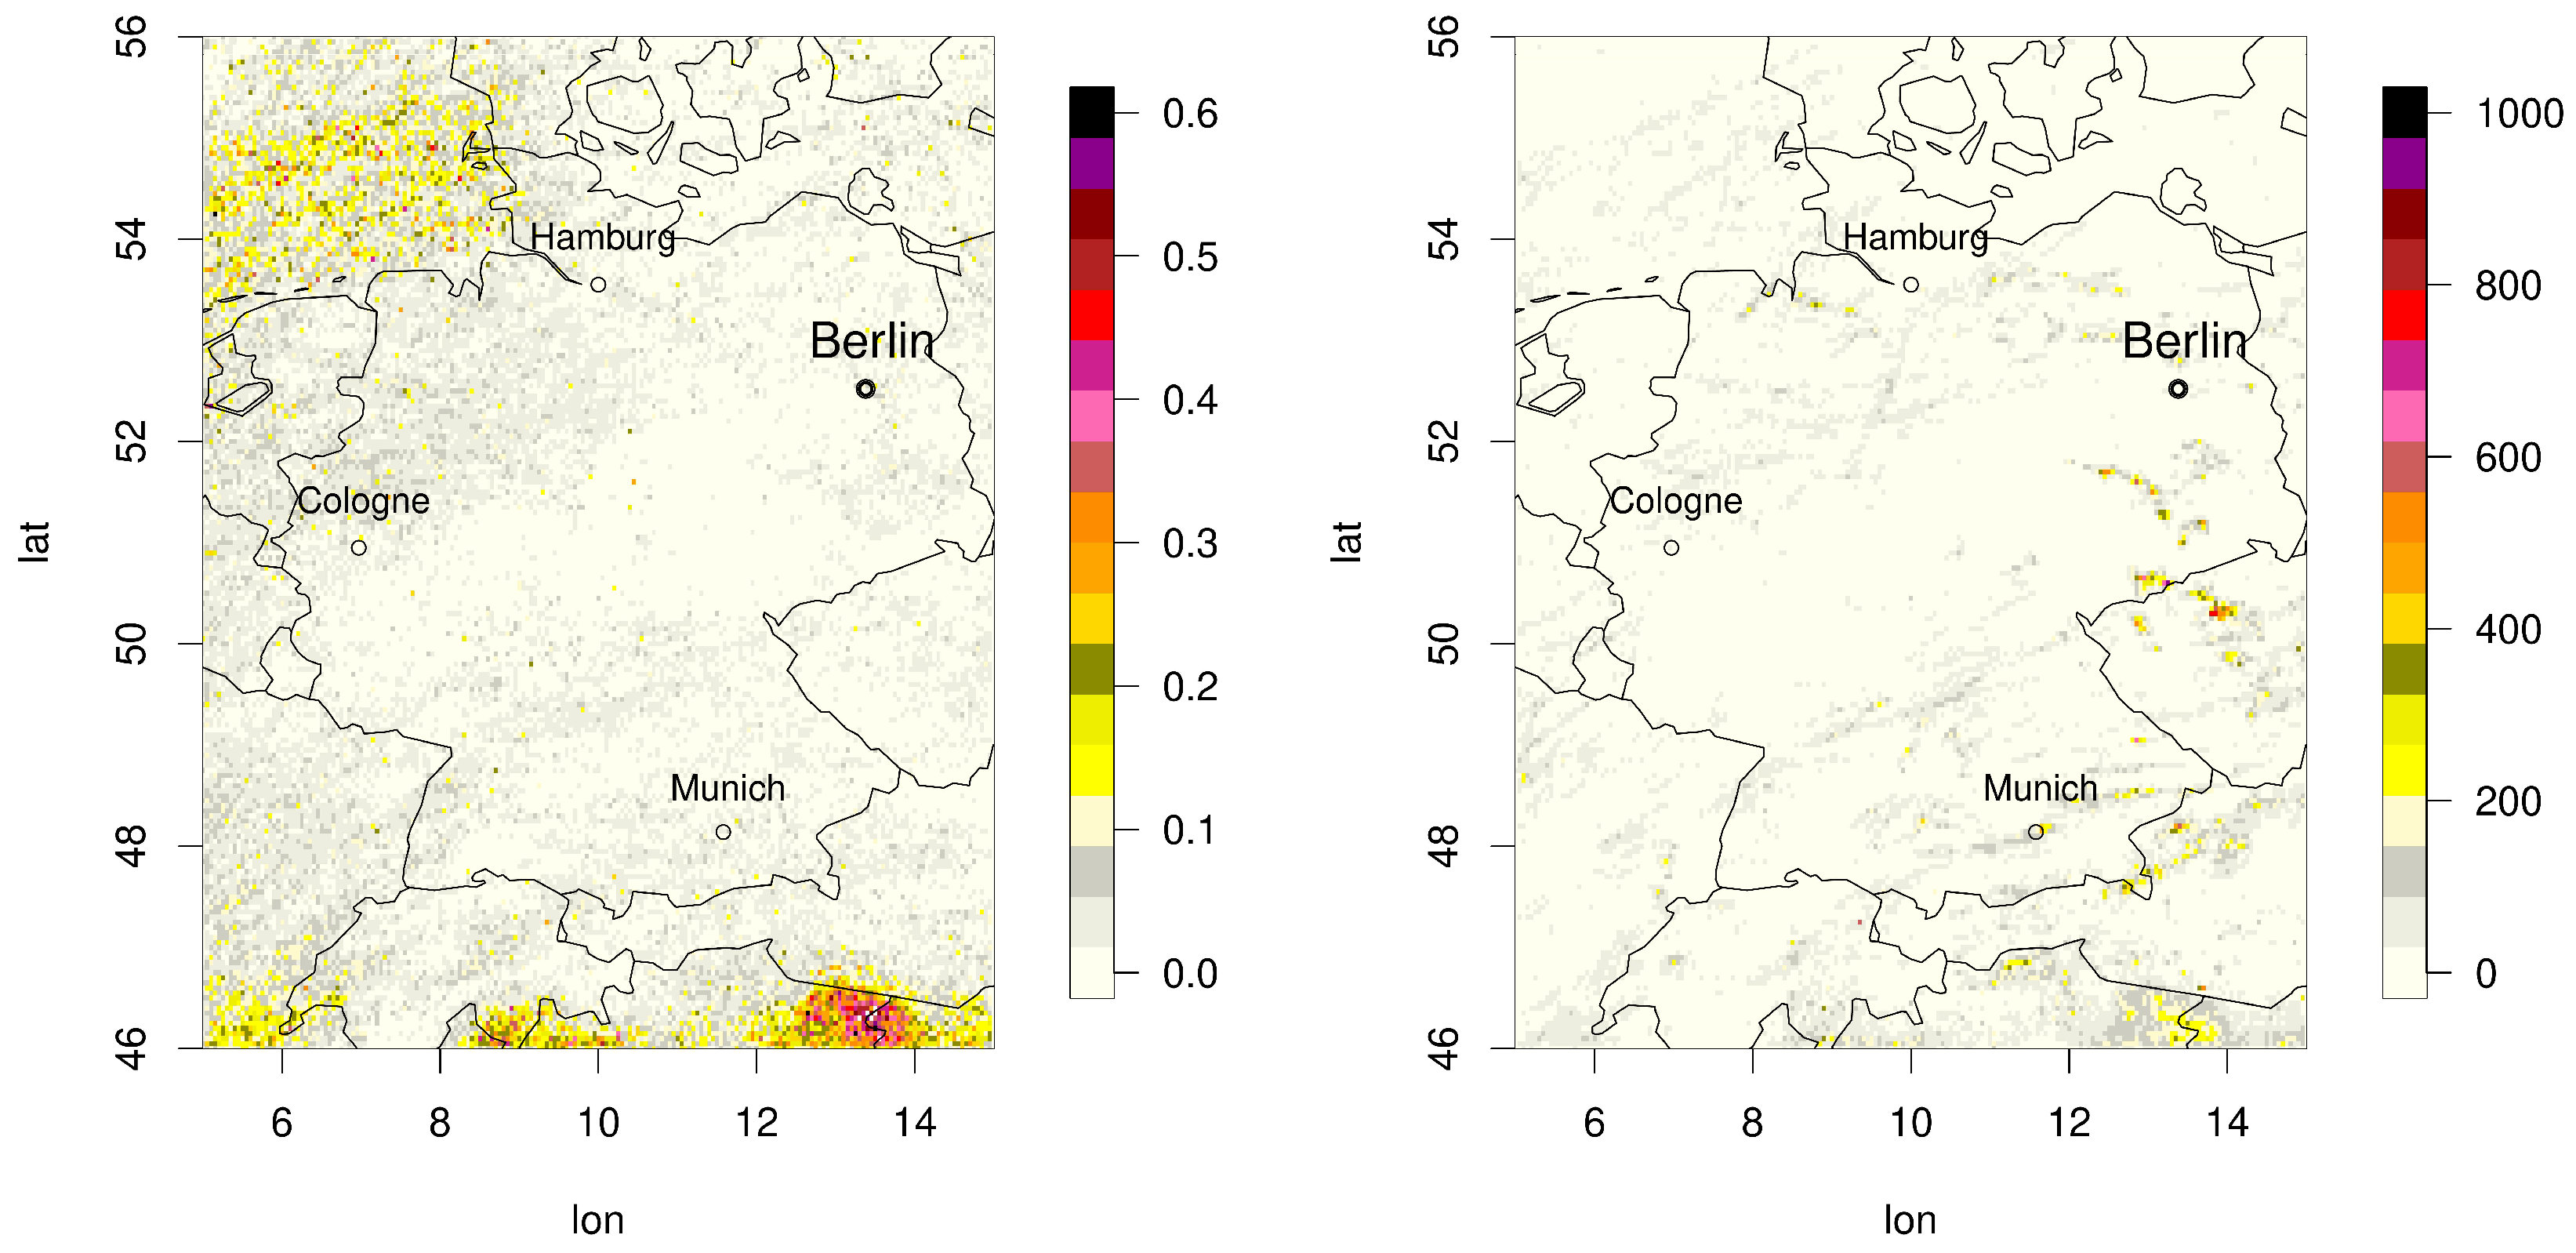
Figure 6.
Mean normalised amperages (kA) (left hand) versus lighting density (right hand) for June (top) and July (bottom)
Figure 6.
Mean normalised amperages (kA) (left hand) versus lighting density (right hand) for June (top) and July (bottom)
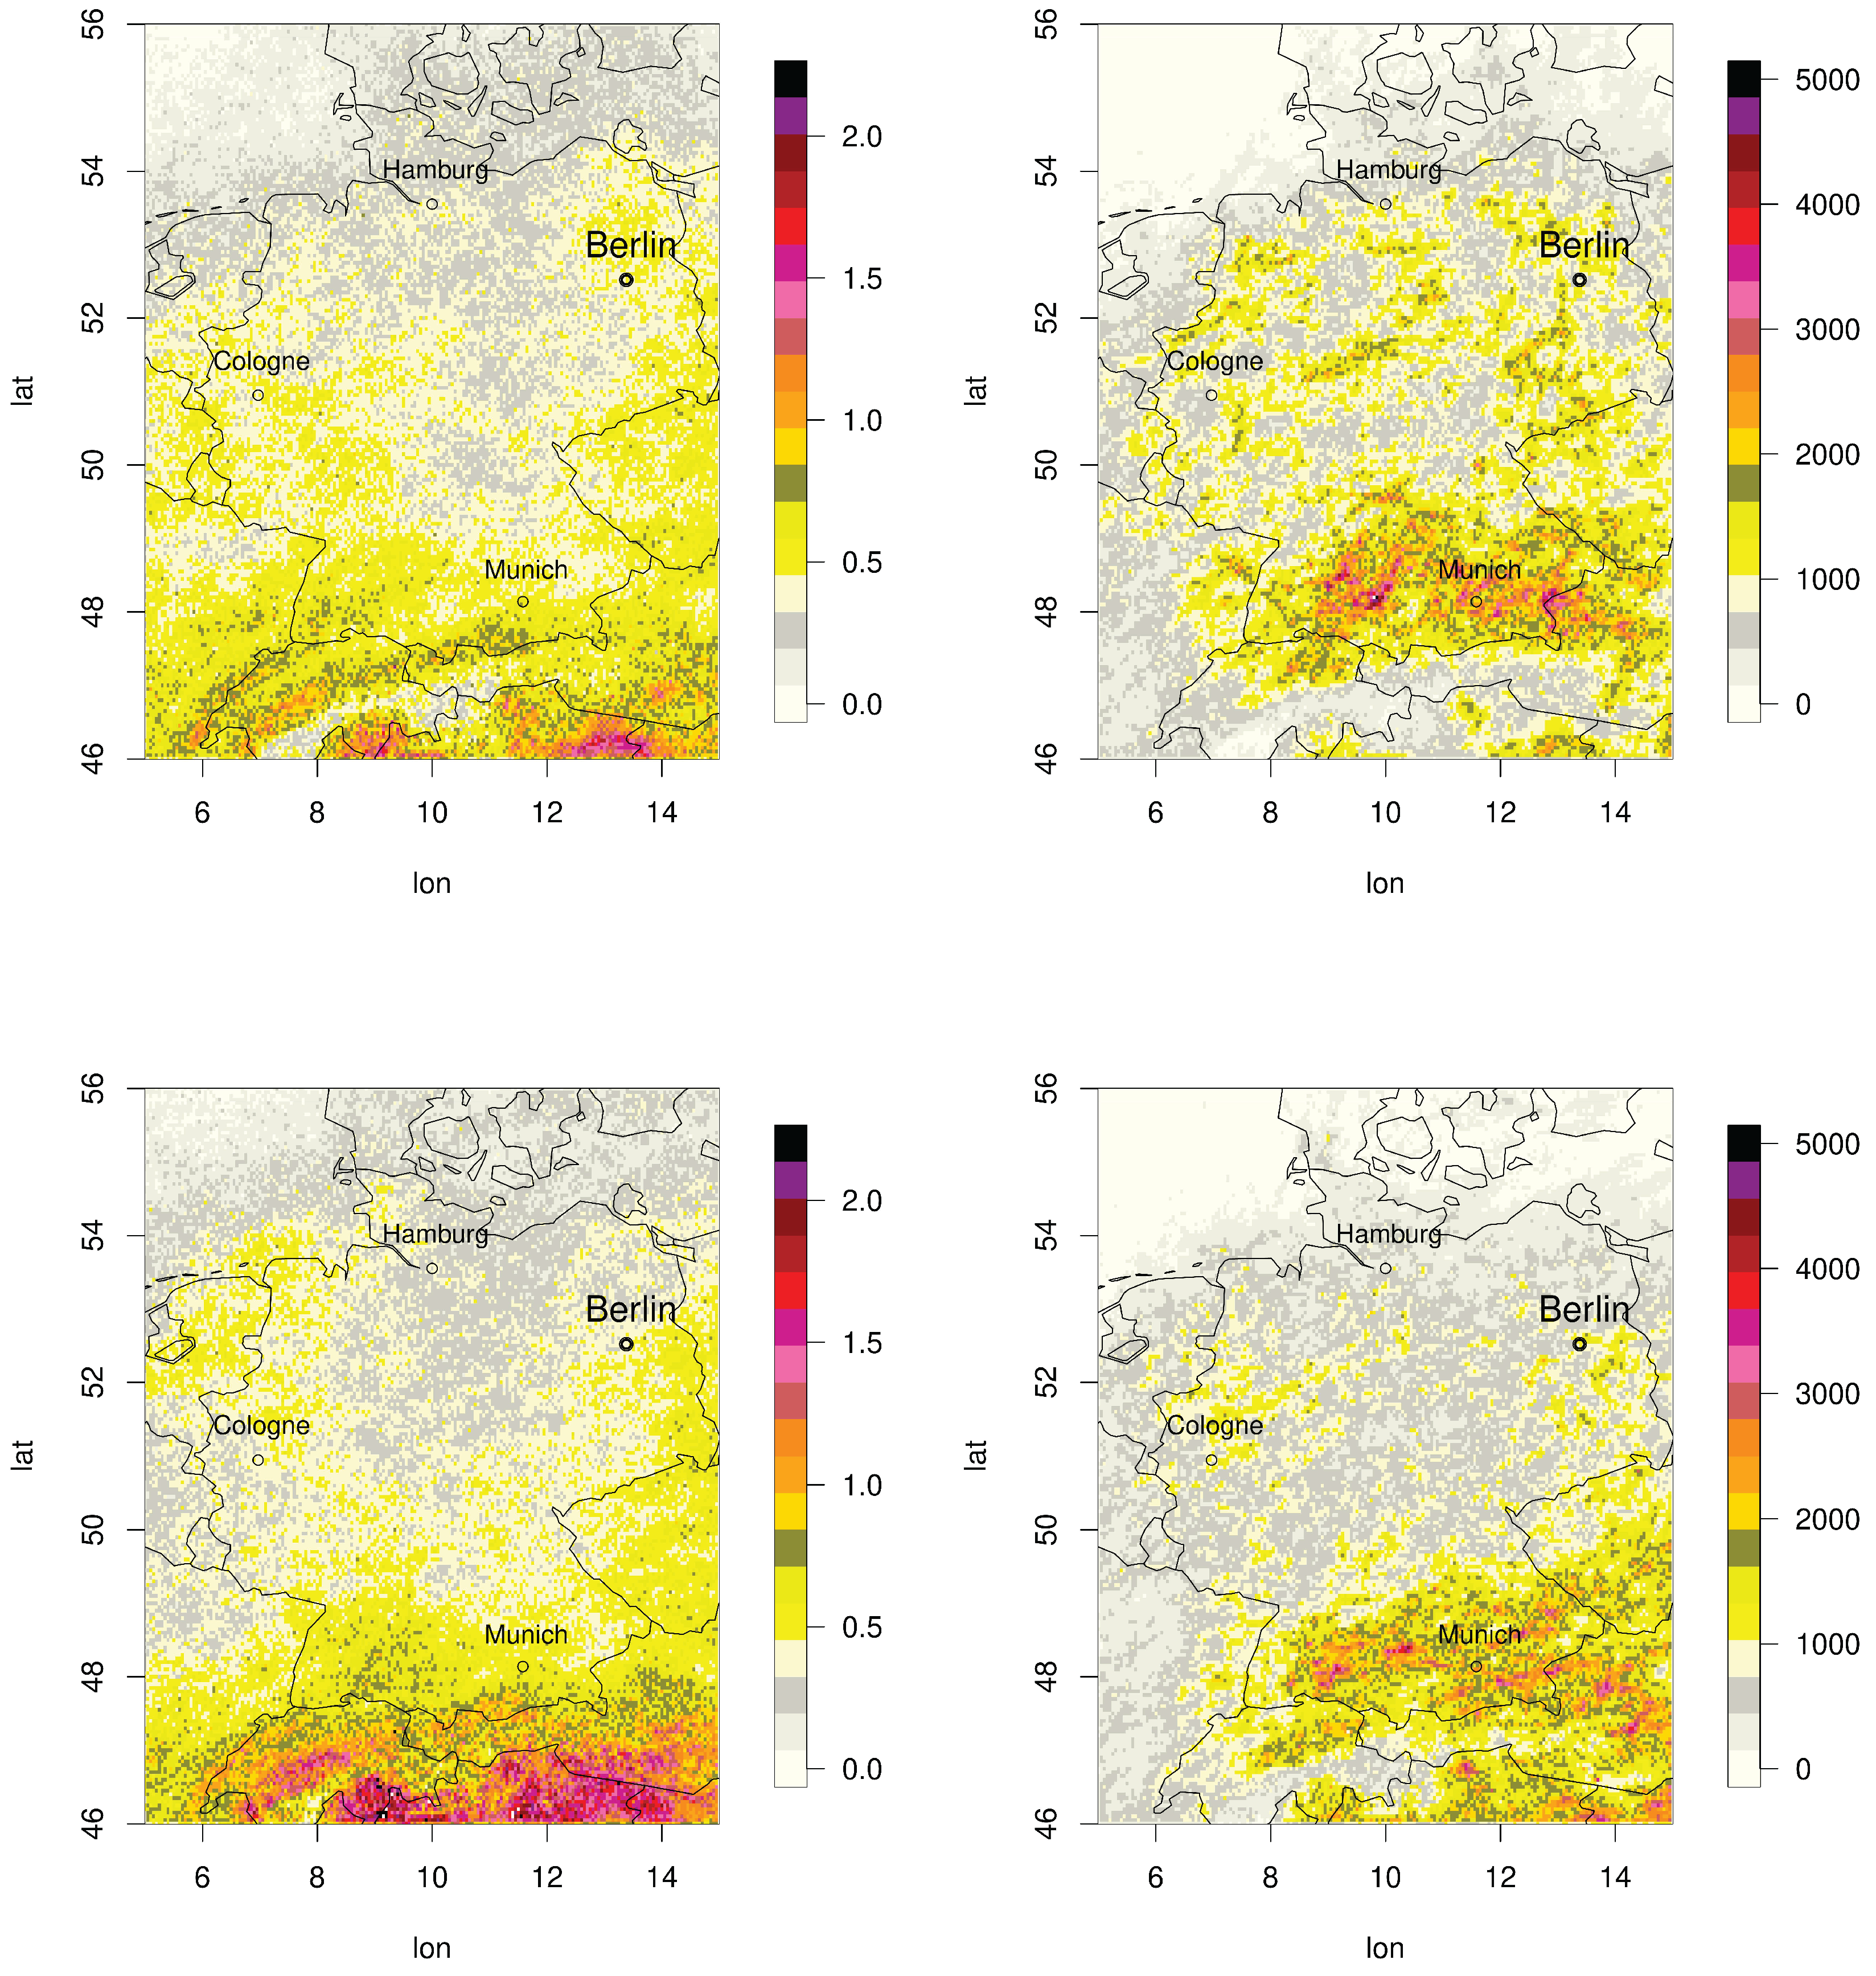
Figure 7.
Mean normalised amperages [kA] for 2007 to 2023 and months April to September starting upper left
Figure 7.
Mean normalised amperages [kA] for 2007 to 2023 and months April to September starting upper left
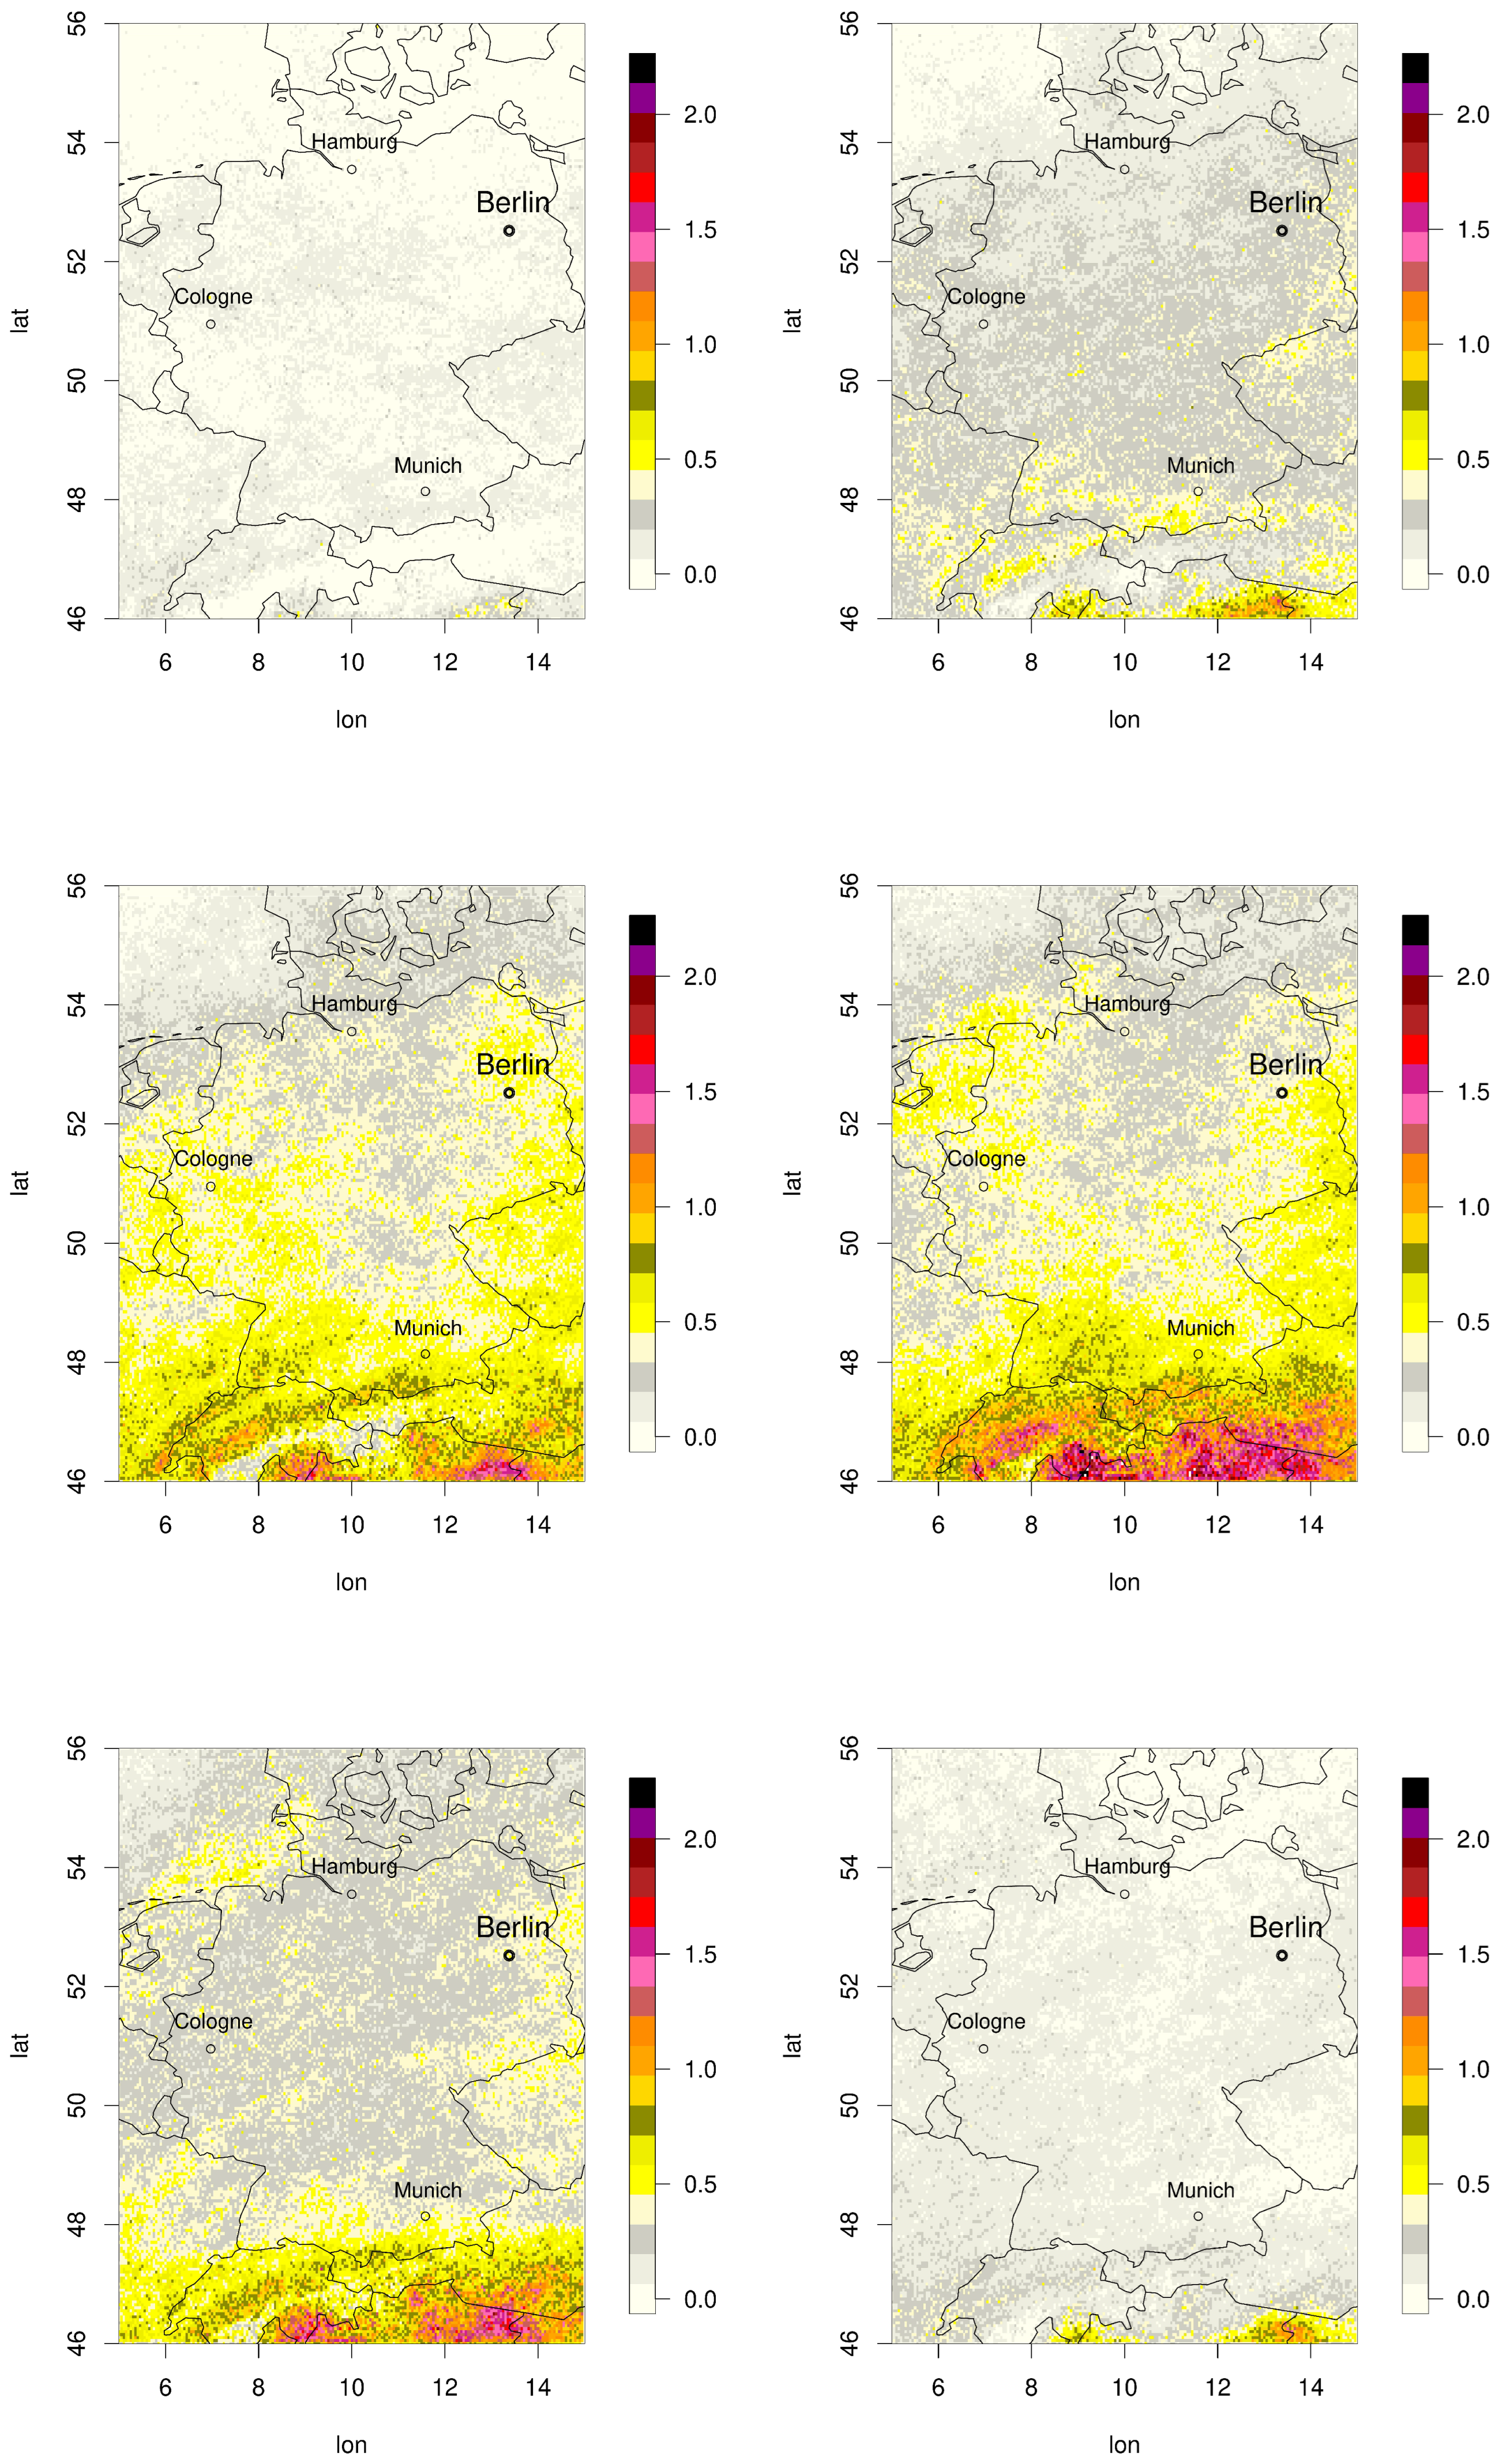
Figure 8.
Mean normalised amperages [kA] for months June and July, zoom into the westerly Alpine region
Figure 8.
Mean normalised amperages [kA] for months June and July, zoom into the westerly Alpine region
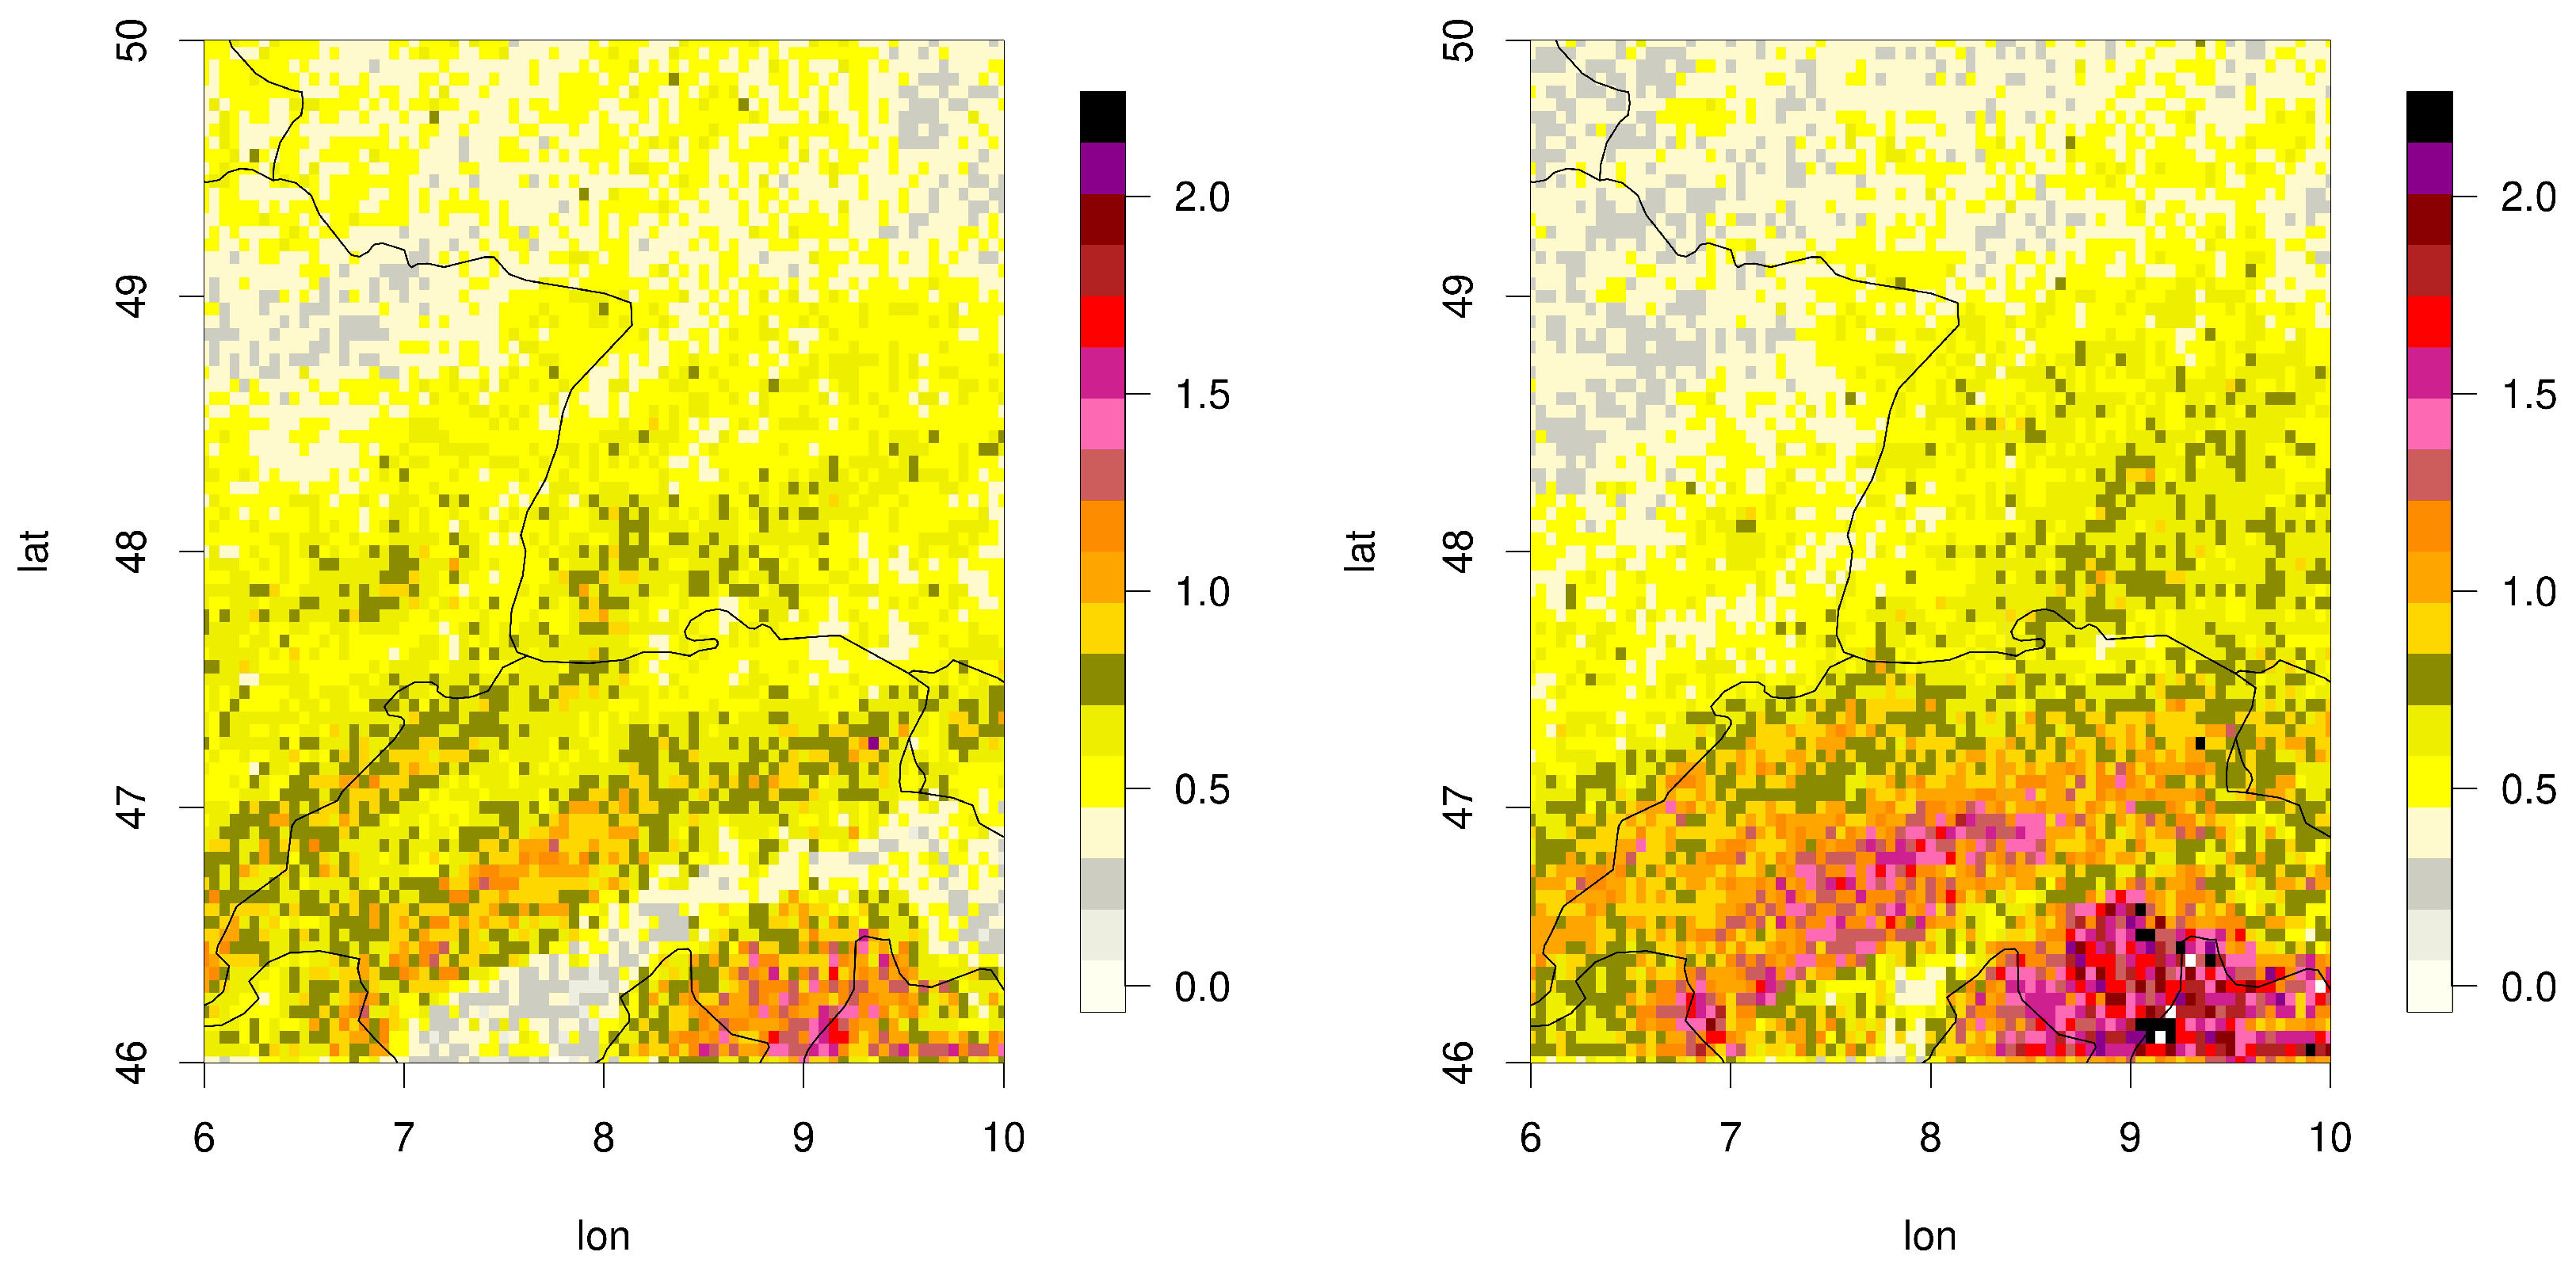
Figure 9.
Mean of normalised amperages [kA] of positive (left hand) and negative charges (right hand) for 2007-2023 and for October (top) and July (bottom)
Figure 9.
Mean of normalised amperages [kA] of positive (left hand) and negative charges (right hand) for 2007-2023 and for October (top) and July (bottom)
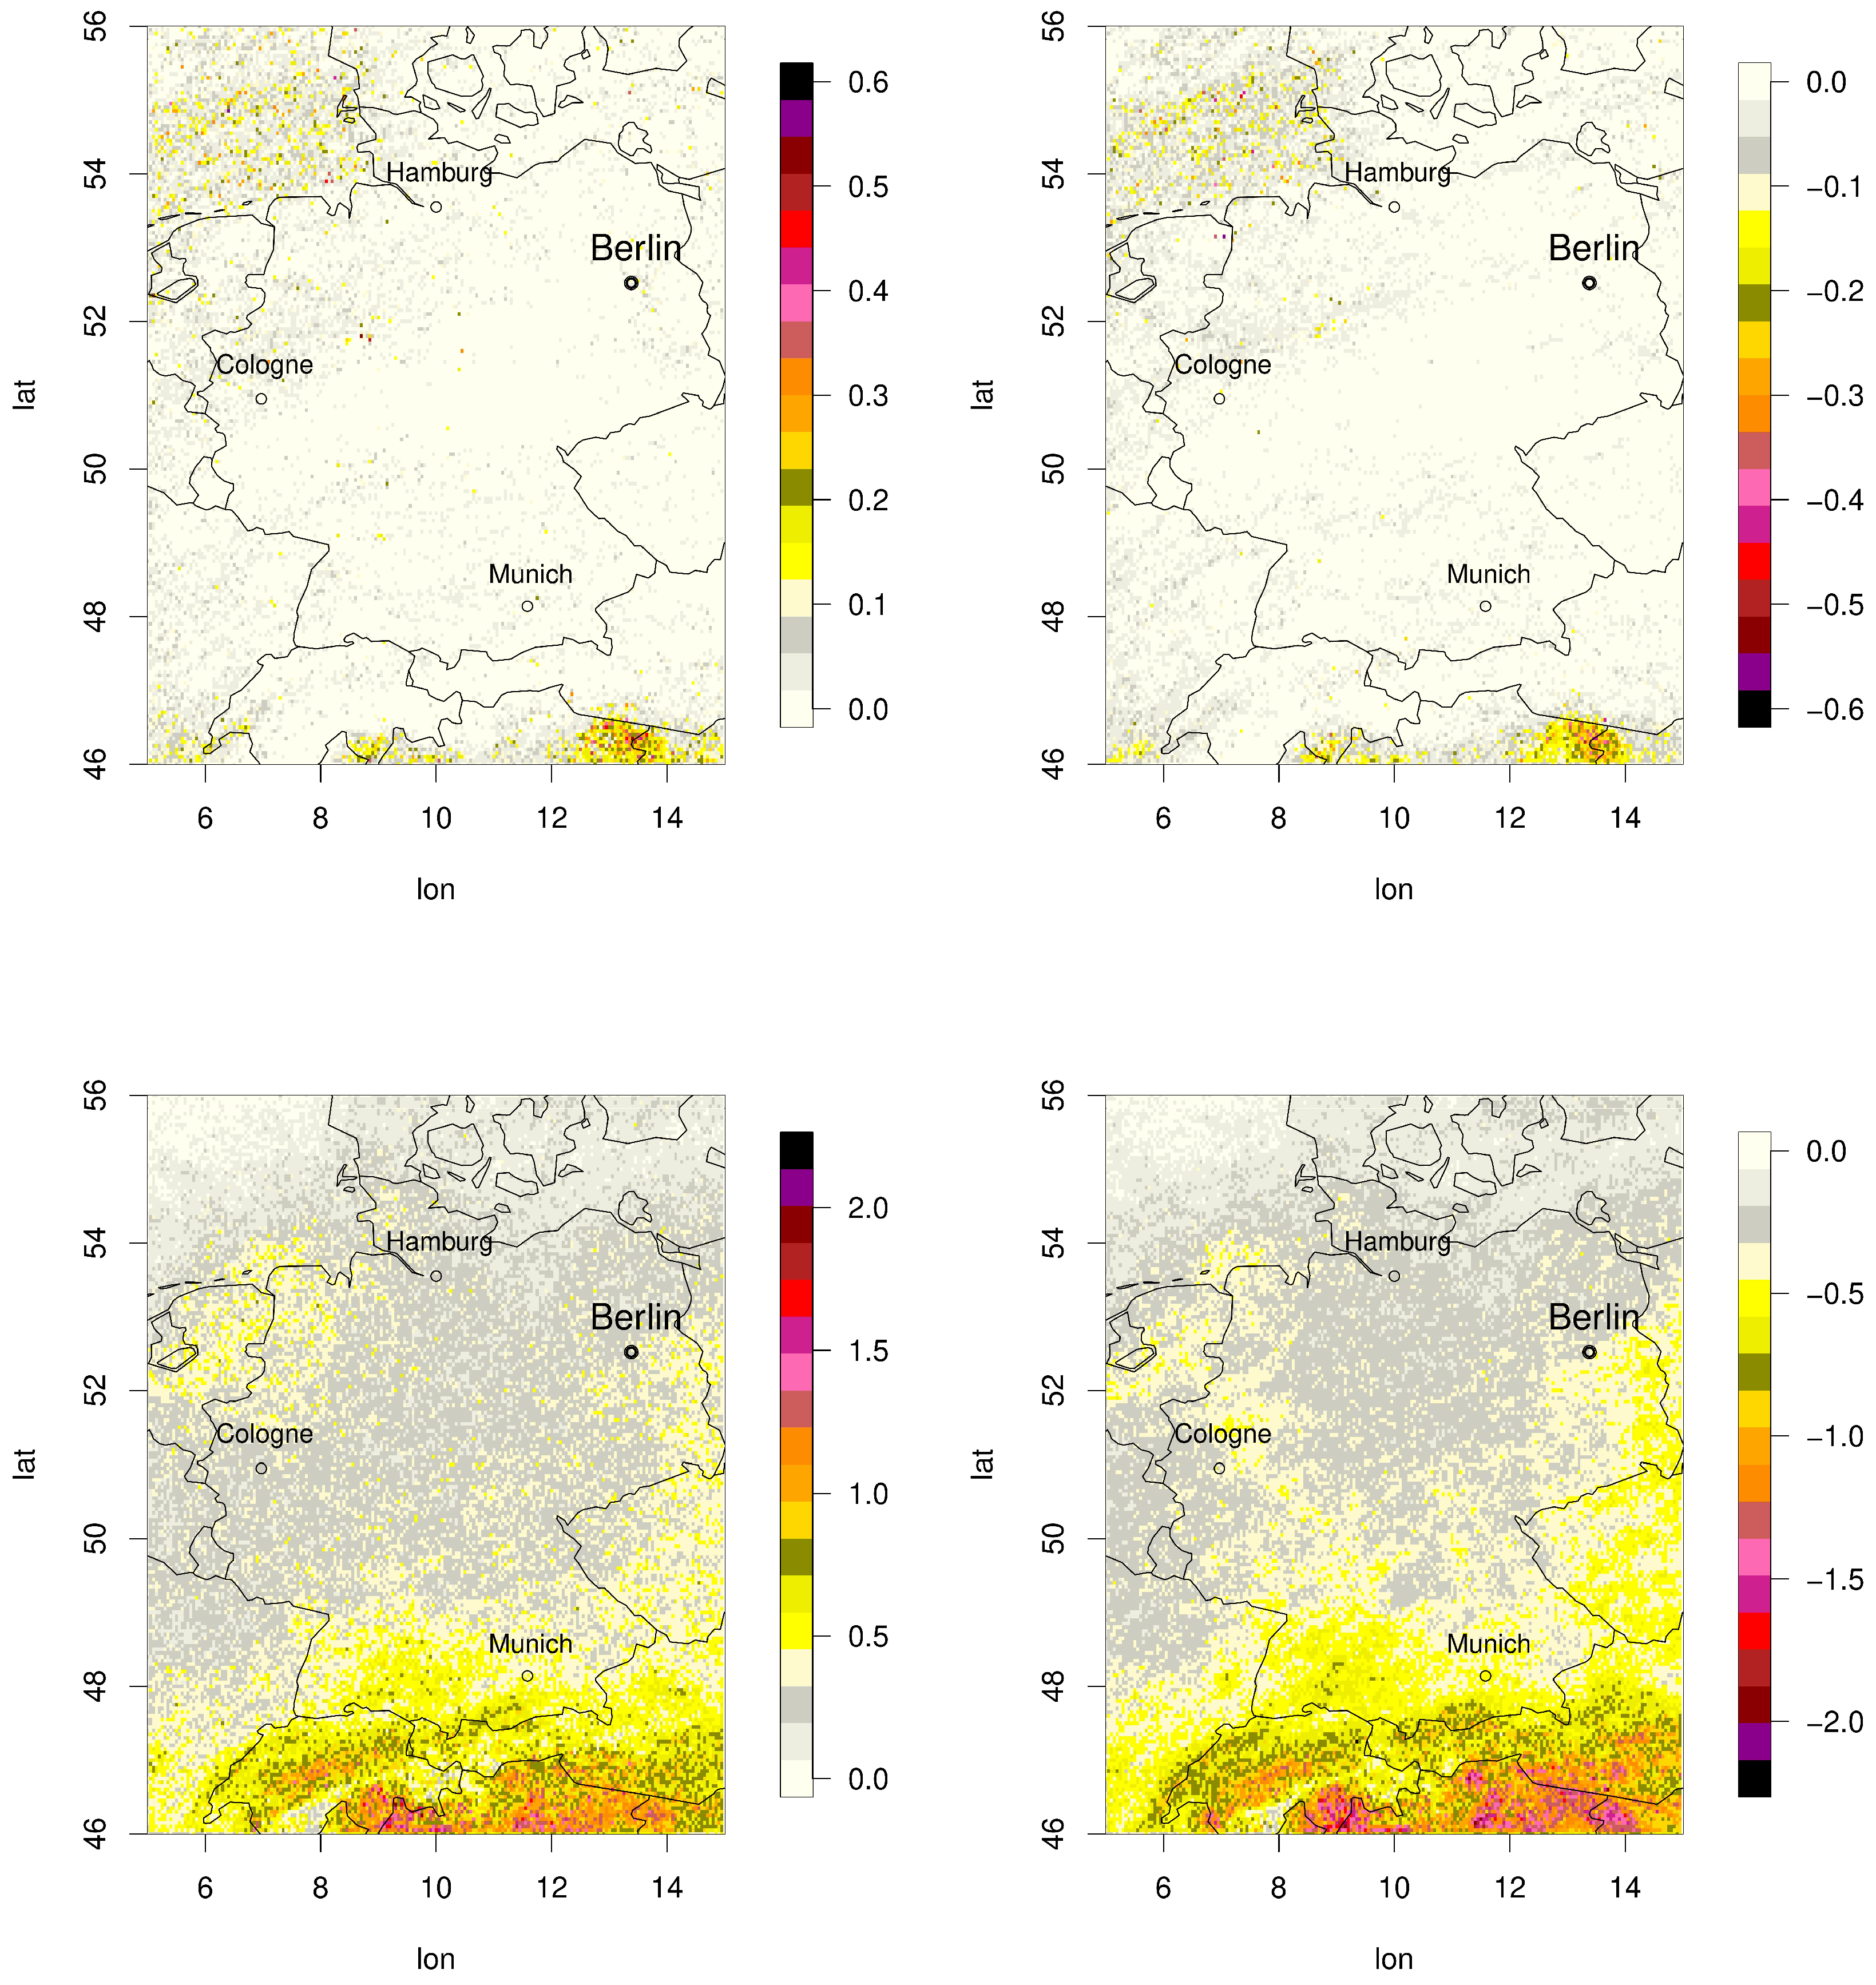
Figure 10.
Time series of lightning density (bottom) and mean normalised amperages (top) averaged over the complete region
Figure 10.
Time series of lightning density (bottom) and mean normalised amperages (top) averaged over the complete region
Disclaimer/Publisher’s Note: The statements, opinions and data contained in all publications are solely those of the individual author(s) and contributor(s) and not of MDPI and/or the editor(s). MDPI and/or the editor(s) disclaim responsibility for any injury to people or property resulting from any ideas, methods, instructions or products referred to in the content. |
© 2025 by the authors. Licensee MDPI, Basel, Switzerland. This article is an open access article distributed under the terms and conditions of the Creative Commons Attribution (CC BY) license (http://creativecommons.org/licenses/by/4.0/).
Copyright: This open access article is published under a Creative Commons CC BY 4.0 license, which permit the free download, distribution, and reuse, provided that the author and preprint are cited in any reuse.


